Exhibit 99.1

[NOT] FOR IMMEDIATE RELEASE NYSE American – REI
RING ENERGY ANNOUNCES RECORD FOURTH QUARTER AND FULL YEAR 2022 RESULTS, NEARLY 80% INCREASE IN YEAR-END 2022 PROVED RESERVES AND PROVIDES 2023 GUIDANCE
~ Transformational Acquisition Helped Drive Record Production, Reserves, Revenue, Net Income and Adjusted EBITDA for Full Year 2022 ~
~ Expects 2023 Annual Sales Volumes to Increase More Than 40% Over 2022 ~
The Woodlands, TX – March 9, 2023 – Ring Energy, Inc. (NYSE American: REI) (“Ring” or the “Company”) today reported operational and financial results for the fourth quarter and full year 2022, including Ring’s year-end 2022 proved reserves. In addition, the Company provided first quarter and full year 2023 operational and capital spending guidance.
2022 Highlights and Recent Key Items
•Significantly benefited from the Company’s acquisition of the Stronghold Energy assets that closed on August 31, 2022 (the “Stronghold Transaction”);
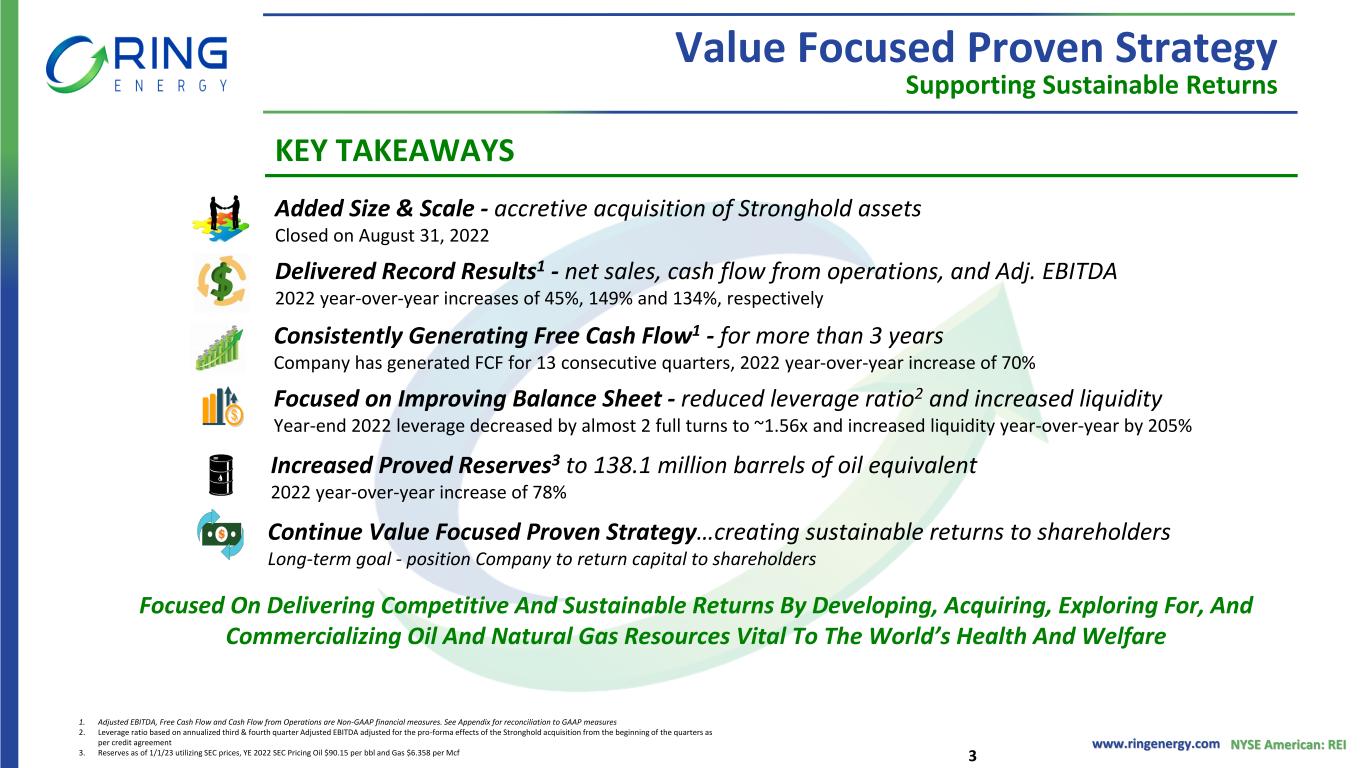
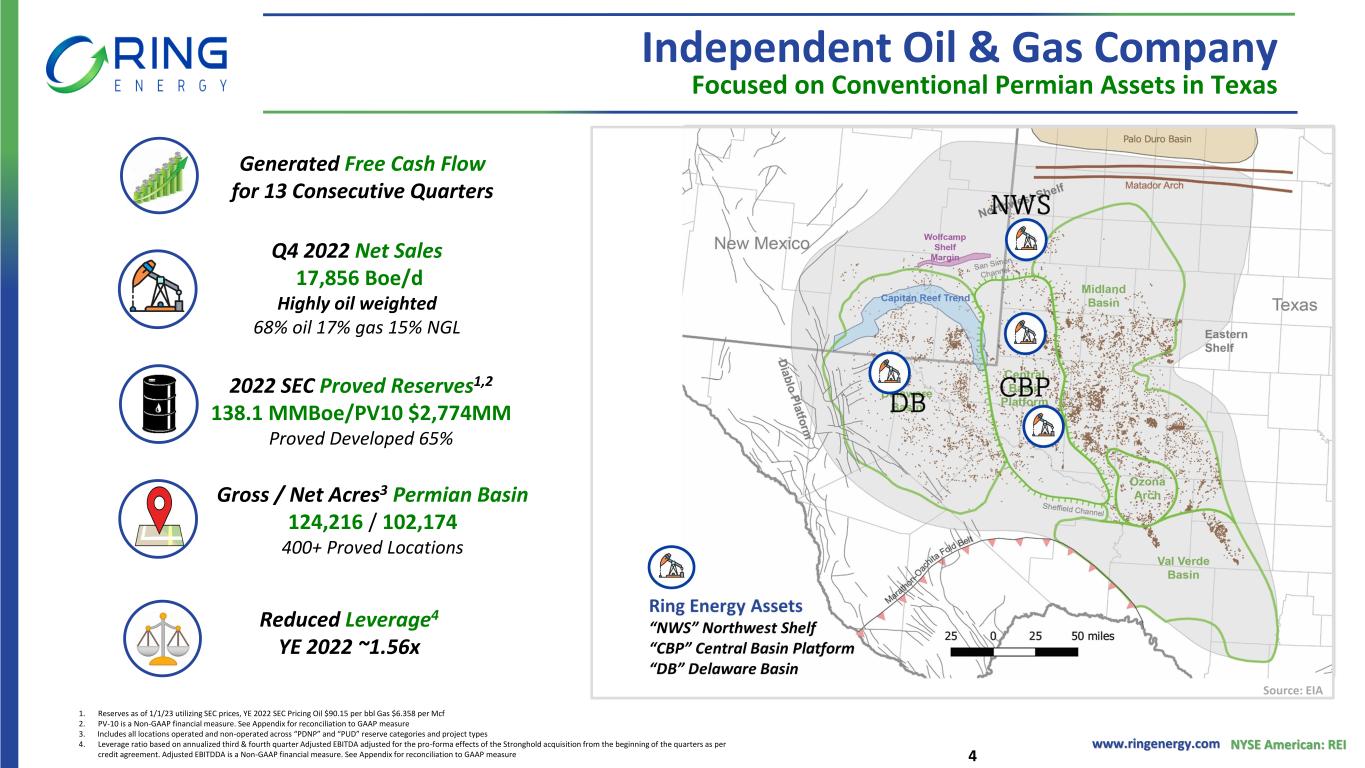
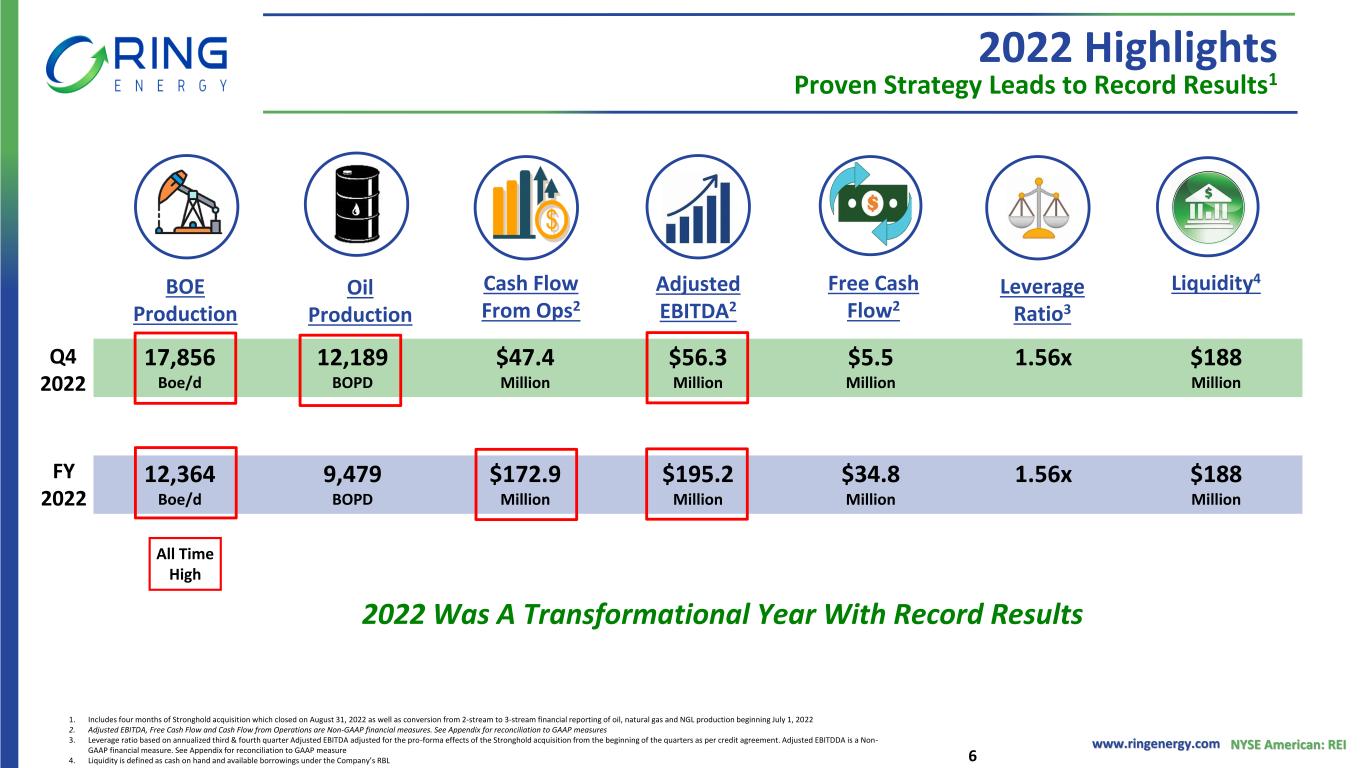
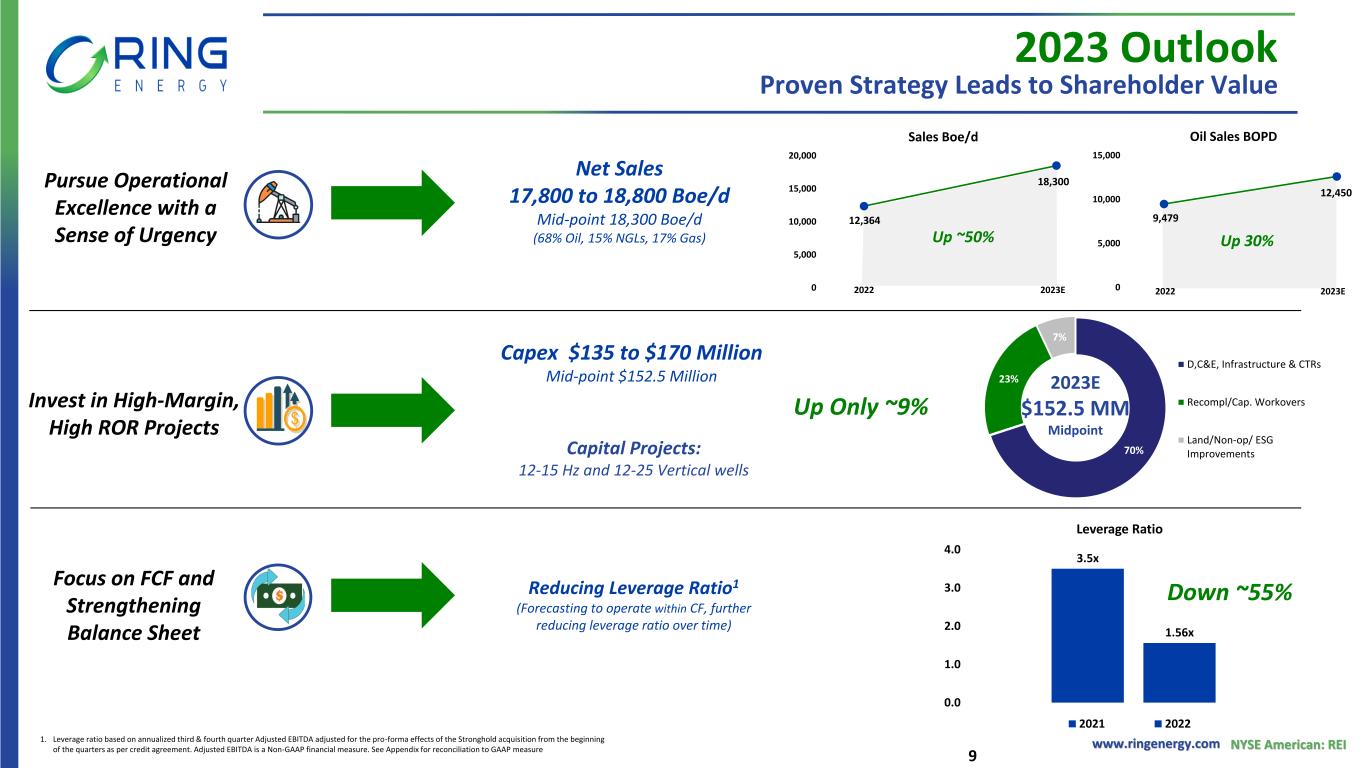
•Grew fourth quarter 2022 sales volumes 34% to a record 17,856 barrels of oil equivalent per day (“Boe/d”) (68% oil) from 13,278 Boe/d (76% oil) for the third quarter of 2022;
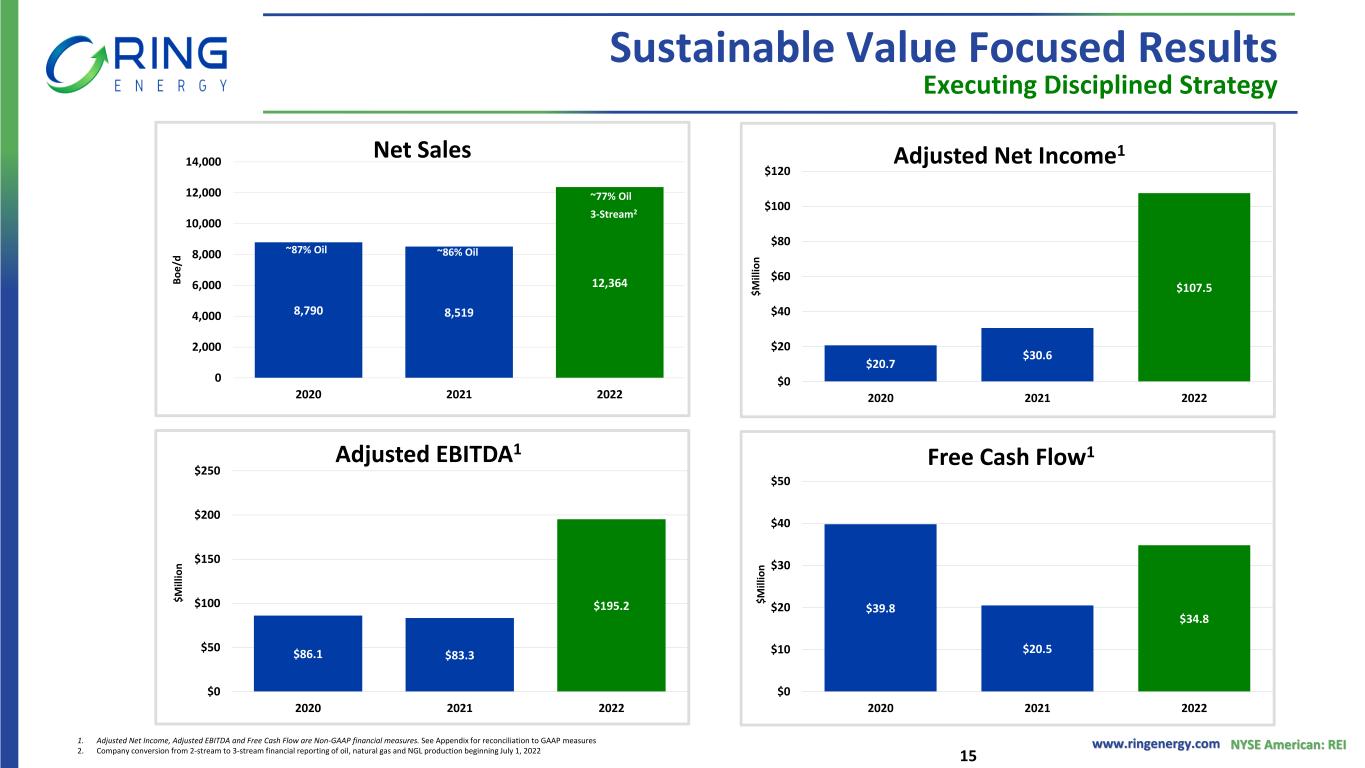
◦Increased full year 2022 sales volumes by 45% to a record 12,364 Boe/d (77% oil) from 8,519 Boe/d (86% oil) for full year 2021;
•Reported net income of $14.5 million, or $0.08 per diluted share, in the fourth quarter of 2022, versus net income of $75.1 million, or $0.49 per share in the third quarter of 2022;
◦Fourth quarter 2022 included a loss on derivative contracts of $19.3 million while third quarter 2022 included a gain on derivative contracts of $32.9 million;
◦Grew net income for full year 2022 to a record $138.6 million, or $0.98 per diluted share, compared to a net income of $3.3 million or $0.03 per diluted share, for full year 2021;
1
•Posted Adjusted Net Income1 of $21.8 million, or $0.13 per share, for the fourth quarter of 2022, compared to $32.5 million, or $0.28 per share, in the third quarter of 2022;
◦Reported record Adjusted Net Income for the full year 2022 of $107.5 million, or $0.89 per share, a 251% increase from $30.6 million, or $0.31 per share, for full year 2021;
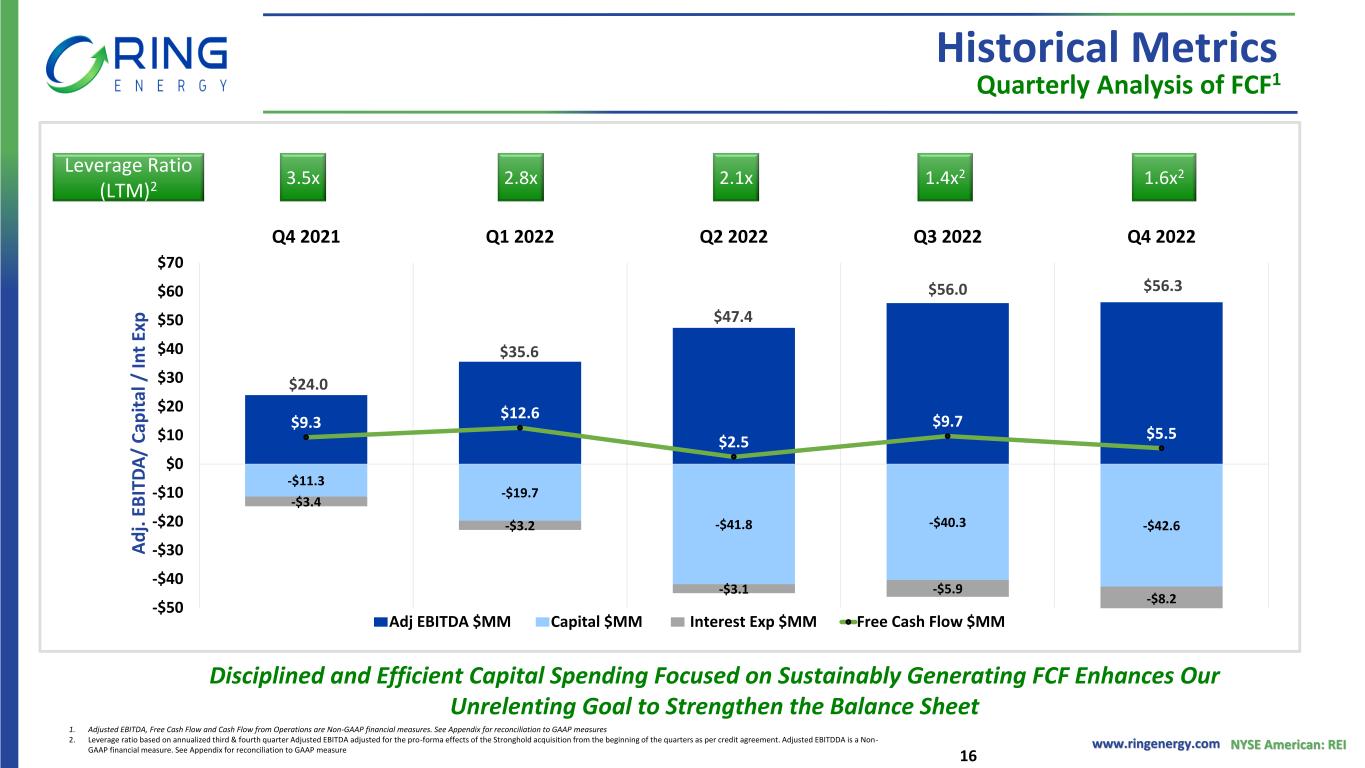
•Generated record Adjusted EBITDA1 of $56.3 million for the fourth quarter of 2022, slightly exceeding the record set in the third quarter of $56.0 million;
◦Grew full year 2022 Adjusted EBITDA by 134% to a record $195.2 million from $83.3 million for 2021;
•Delivered Free Cash Flow1 of $5.5 million and Cash Flow from Operations of $47.4 million in the fourth quarter of 2022;
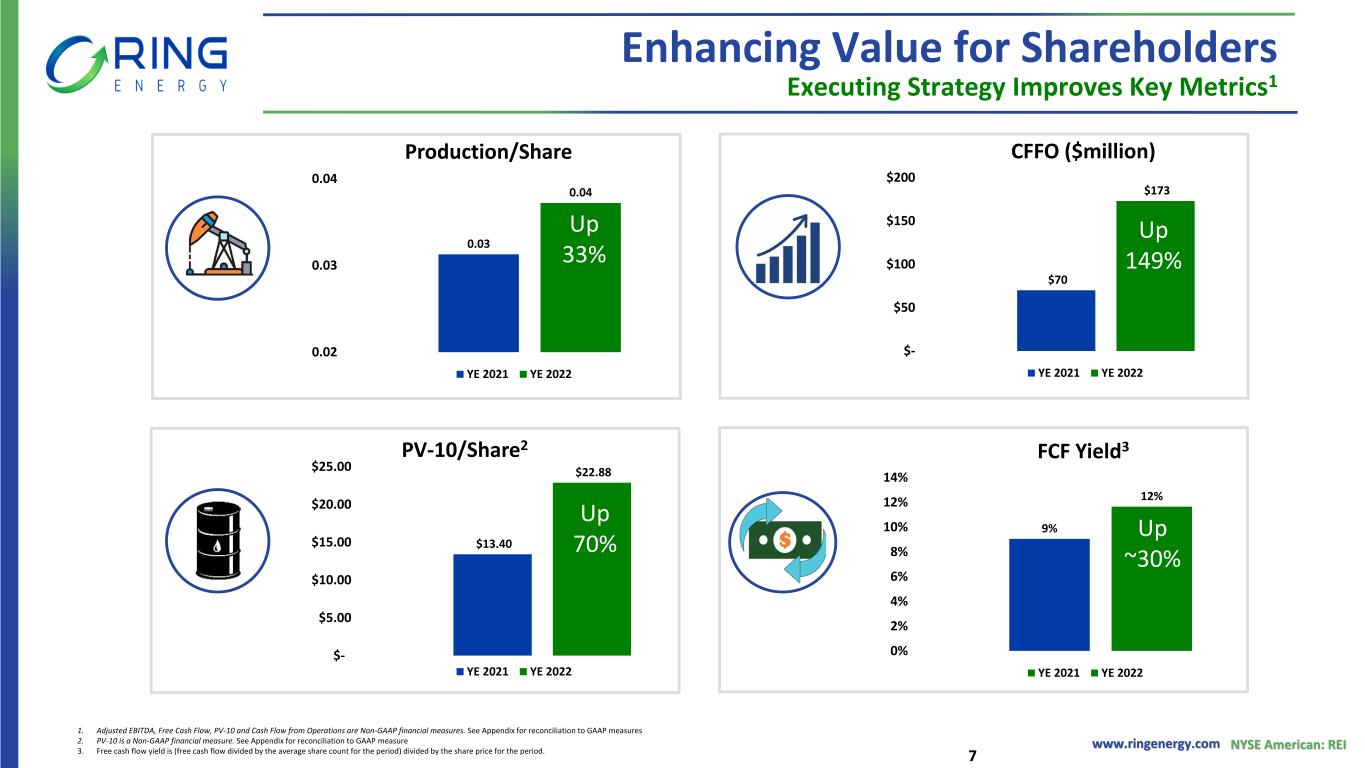
◦Increased full year 2022 Free Cash Flow to $34.8 million and generated Cash Flow from Operations of $172.9 million, a year-over-year increase of 70% and 149%, respectively;
◦Remained cash flow positive for the 13th consecutive quarter;
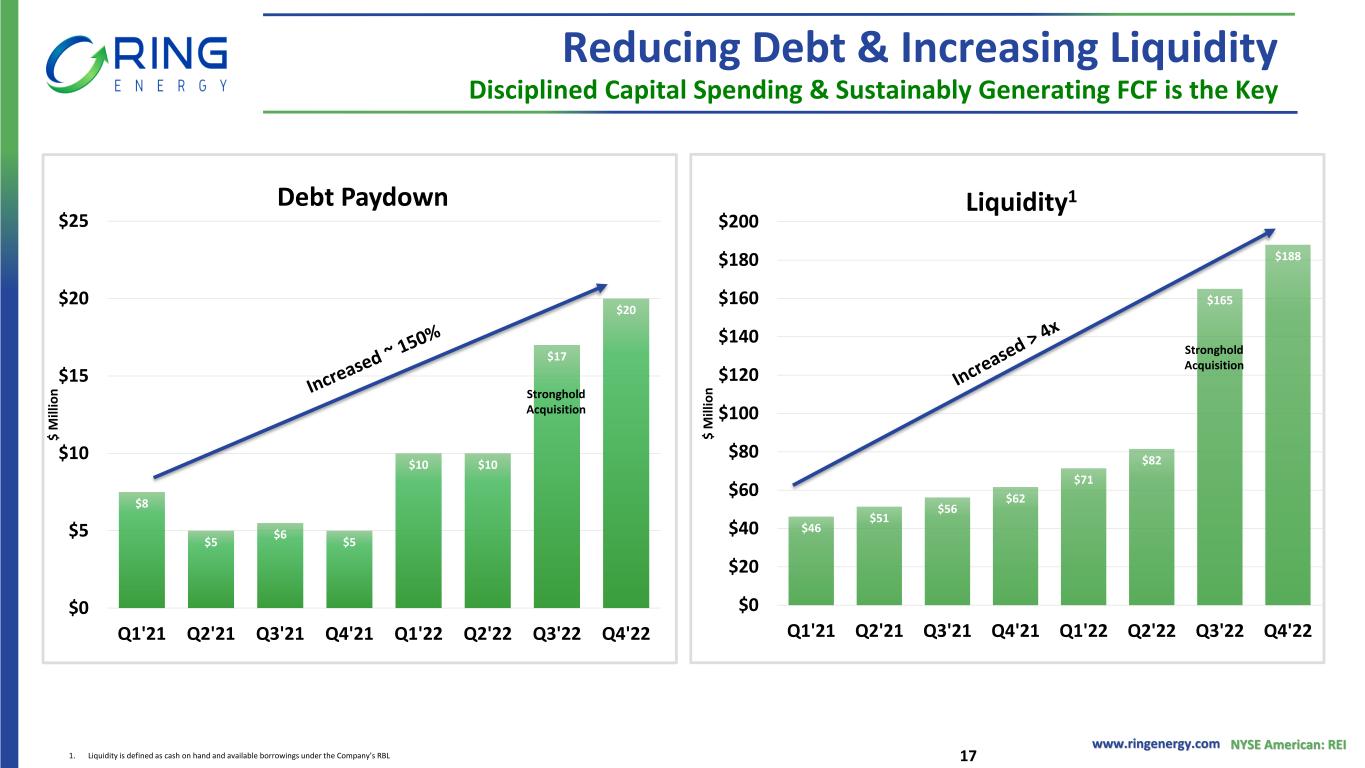
•Paid down $20.0 million of debt on the Company’s revolving credit facility during the fourth quarter of 2022 and $37.0 million since closing of the Stronghold Transaction on August 31, 2022;
◦Reduced Leverage Ratio2 by more than 50% to 1.6x from 3.5x at year end 2021;
◦Increased liquidity at year-end 2022 to approximately $188.0 million — a two-fold increase compared to December 31, 2021;
◦Successfully reaffirmed the Company’s borrowing base of $600.0 million under its revolving credit facility in December 2022;
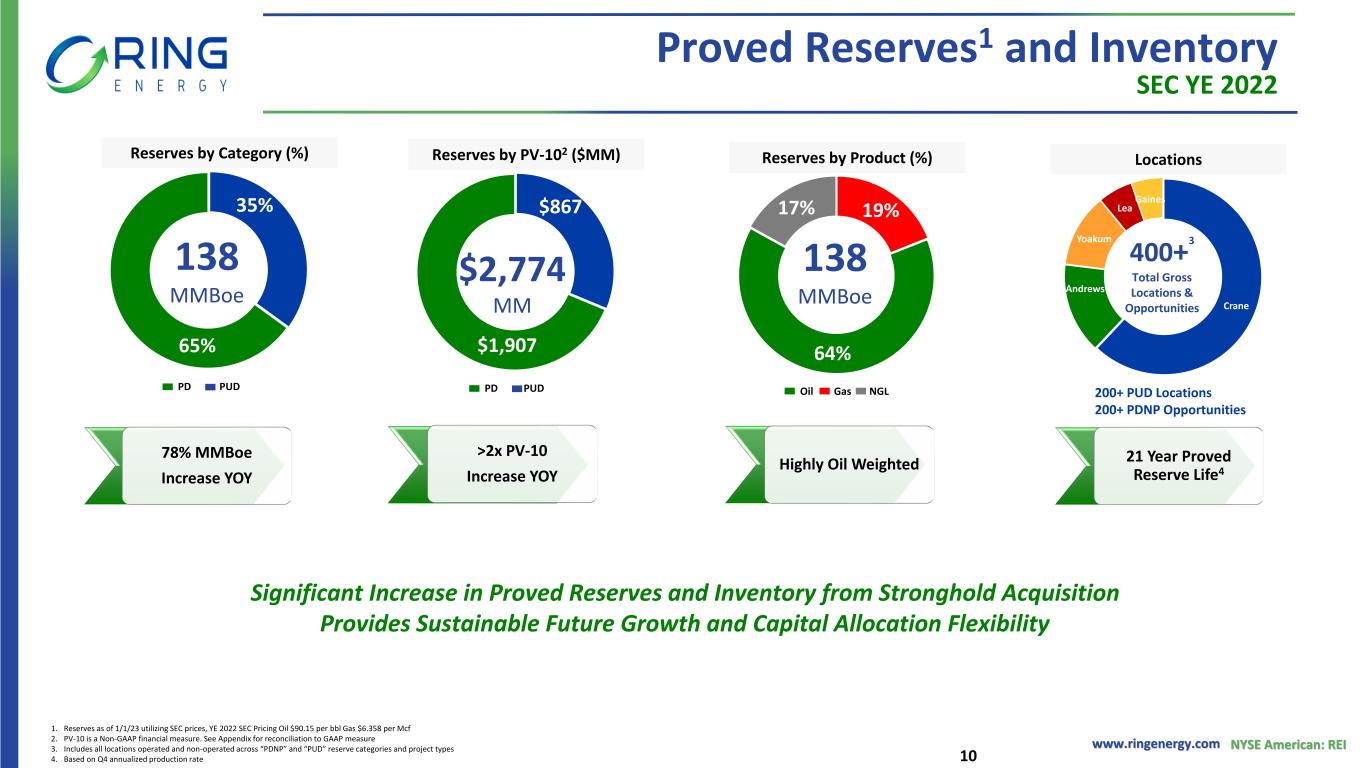
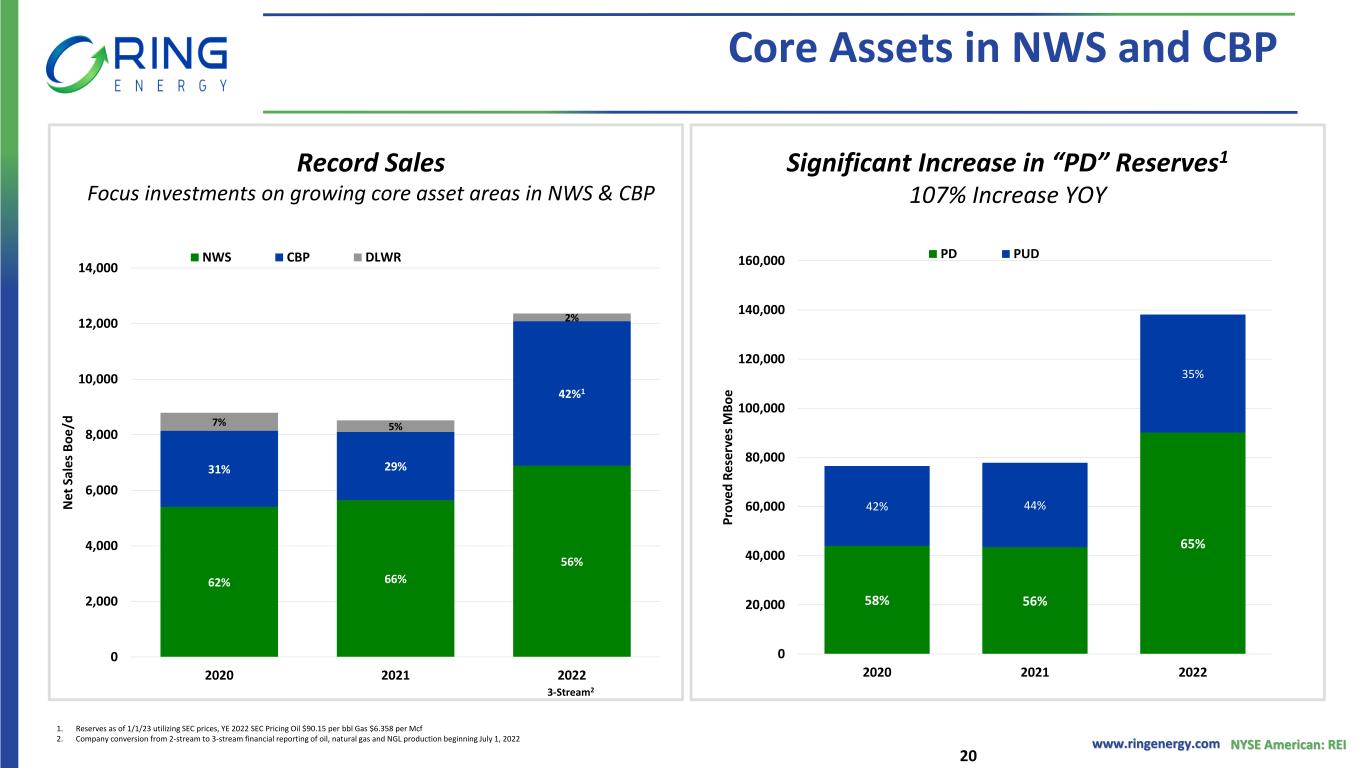
•Grew year-end 2022 proved reserves at Securities and Exchange Commission (“SEC”) pricing by 78% to 138.1 million barrels of oil equivalent (“MMBoe”), and increased the
1A non-GAAP financial measure; see “Non-GAAP Information” section in this release for more information including reconciliations to the most comparable GAAP measures.
2 Based on annualized third and fourth quarter EBITDA adjusted for the pro-forma effects of the Stronghold Transaction, as per the Credit Agreement.
2
present value of SEC proved reserves discounted at 10% (“PV-10”)1 by 108% to $2.8 billion from $1.3 billion at year-end 2021;
◦Benefited from positive revisions of previous quantity estimates of 1.2 MMBoe due to positive well performance, extensions and discoveries of 0.8 MMBoe, and acquisitions of reserves related to the Stronghold Transaction of 62.9 MMBoe. Partially offsetting the additions to reserves was 4.5 MMBoe of production, resulting in replacement of 13.4 times 2022 production with new reserves;
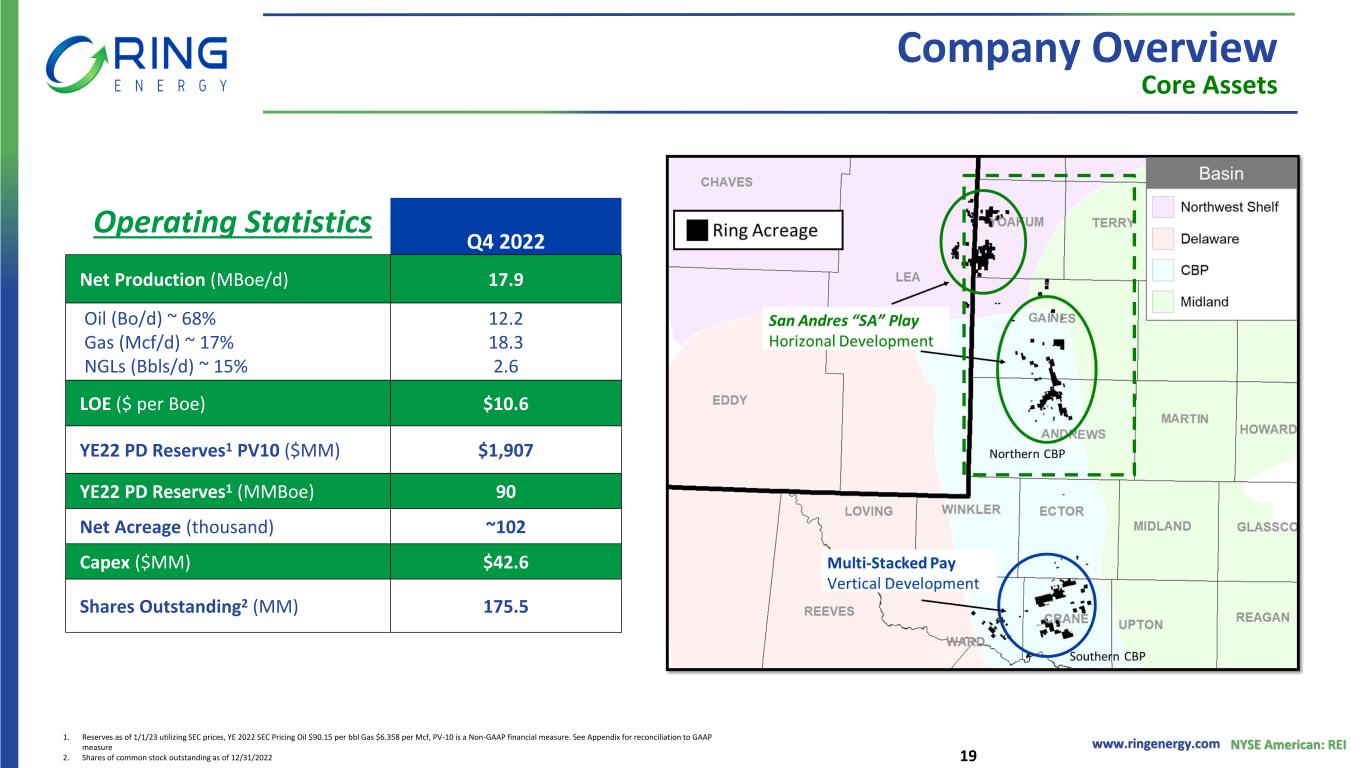
◦Proved developed reserves increased 107% to 90.1 MMBoe at year end 2022 from 43.4 MMBoe at December 31, 2021;
•Successfully completed the Company’s 2022 capital spending program focused on developing Ring’s high rate-of-return projects on its legacy and newly acquired assets:
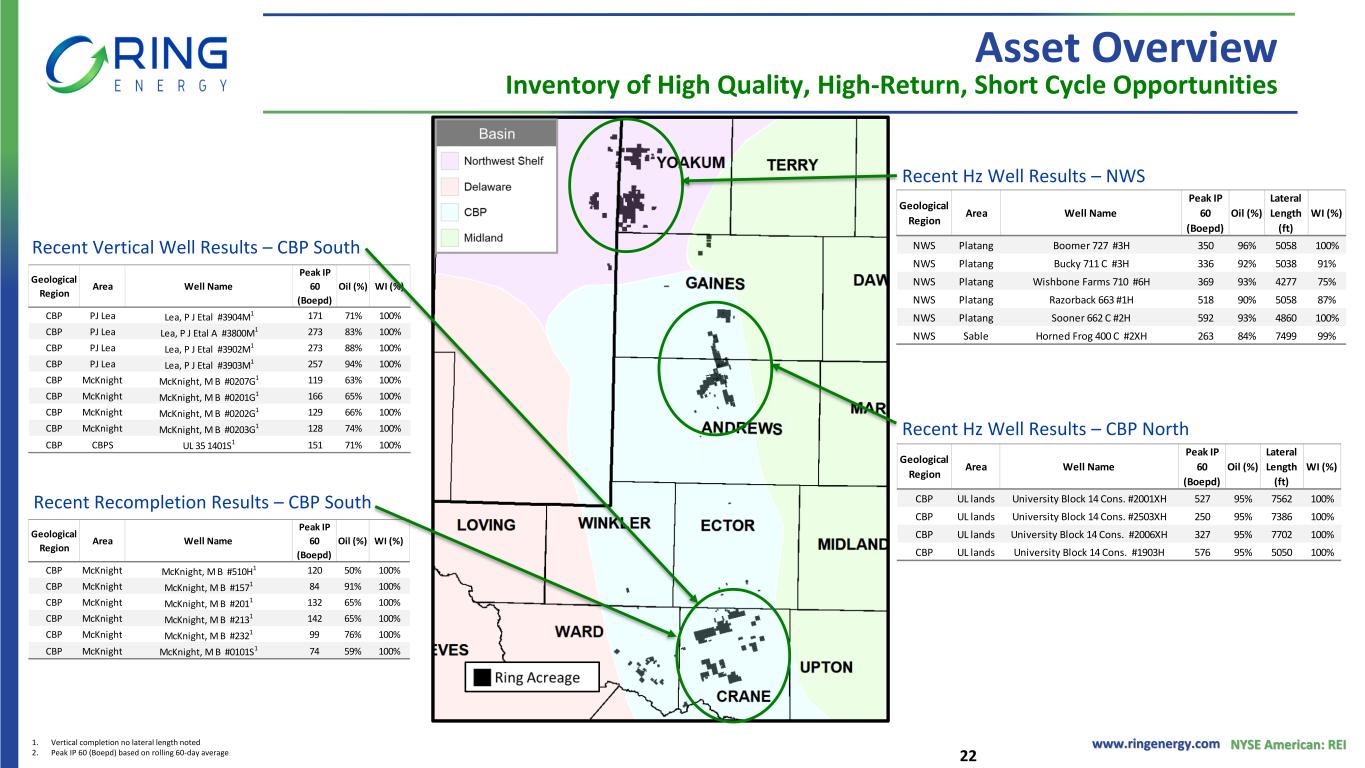
◦Drilled, completed and placed on production four horizontal (“Hz”) wells (two in the Northwest Shelf (“NWS”) and two in the Central Basin Platform (“CBP”)) and five vertical wells in the CBP during the fourth quarter, as well as completed and placed on production three Hz wells in the NWS that were drilled in the third quarter. In addition, the Company performed nine recompletions in the CBP during the fourth quarter;
▪12 of the 21 wells placed on production during the fourth quarter did not contribute meaningfully until late December, which will benefit 2023 production;
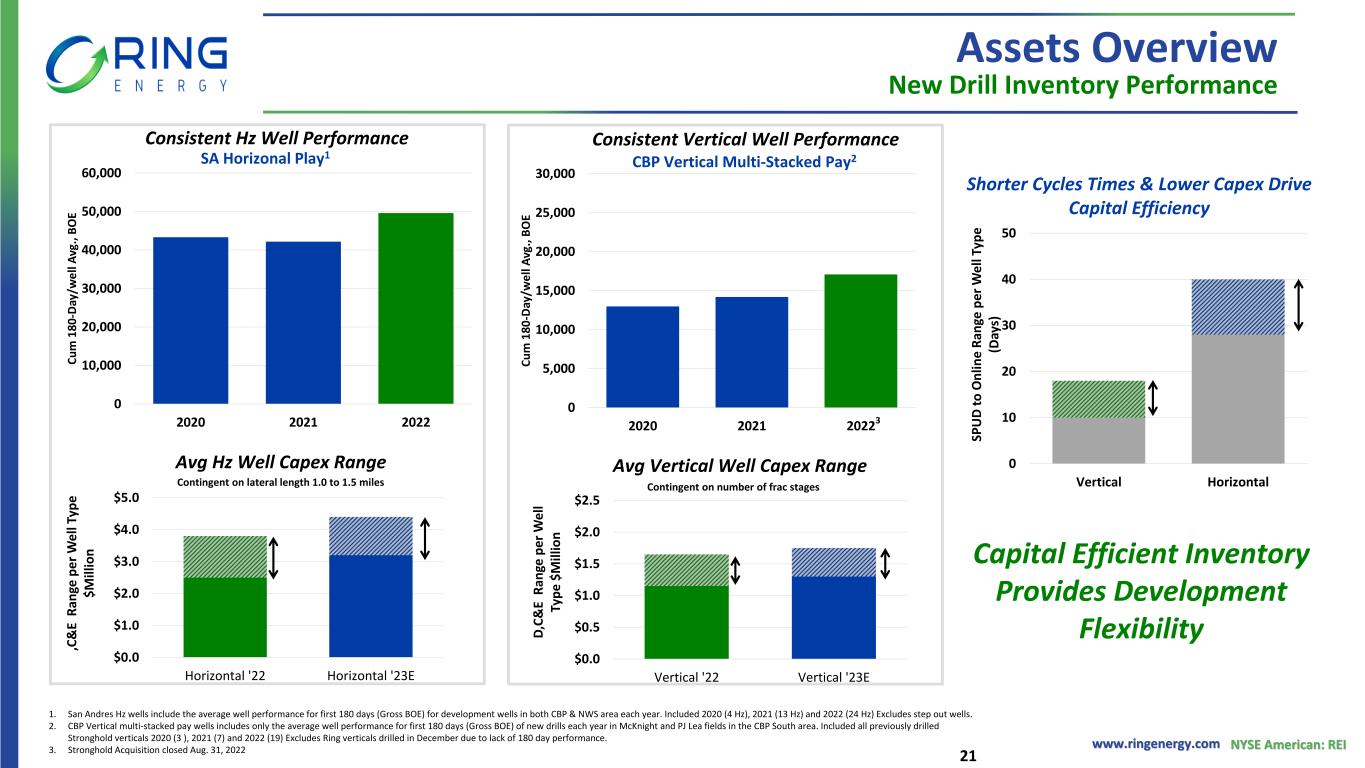
◦During full year 2022, the Company drilled and completed 27 Hz wells (18 in the NWS and nine in the CBP) and five vertical wells in the CBP, as well as performed 12 recompletions in the CBP;
•Commenced its 2023 drilling program in January with four NWS Hz wells drilled and three wells completed and placed on production;
•Provided guidance for first quarter and full year 2023 sales volumes, operating expenses and capital spending; and
◦Expects first quarter 2023 sales volumes of 17,800 to 18,300 Boe/d and full year 2023 sales volumes of 17,800 to 18,800 Boe/d.
3
Mr. Paul D. McKinney, Chairman of the Board and Chief Executive Officer, commented, “We are pleased with our fourth quarter performance. The Company benefited from three full months of production from our Stronghold acquisition, the results of our successful 2022 capital spending program, and our continuing focus on cost reduction initiatives. The result was record quarterly sales volumes and Adjusted EBITDA. We also paid down debt by an additional $20 million.”
Mr. McKinney continued, “The fourth quarter marked the successful conclusion to a transformational year for the Company and places us in a strong position for continued success. Our immediately accretive acquisition of Stronghold’s complementary assets has substantially increased our size and scale, lowered our overall cost structure, and materially increased the inventory and capital efficiency of our low cost, high rate-of-return investment opportunities, allowing for increased free cash flow generation. A significant benefit of the enhanced free cash flow is we can pay down debt at a faster rate than we could have done on a standalone basis. The Stronghold Transaction also significantly improved our financial position. We ended 2022 with approximately $188 million of liquidity — more than $125 million higher than year-end 2021 and reduced our leverage ratio substantially from 3.5 times at year-end 2021 to 1.6 times as of December 31, 2022. Our enhanced financial flexibility and improved capital efficiency are critical as we continue to execute our proven value driven strategy.”
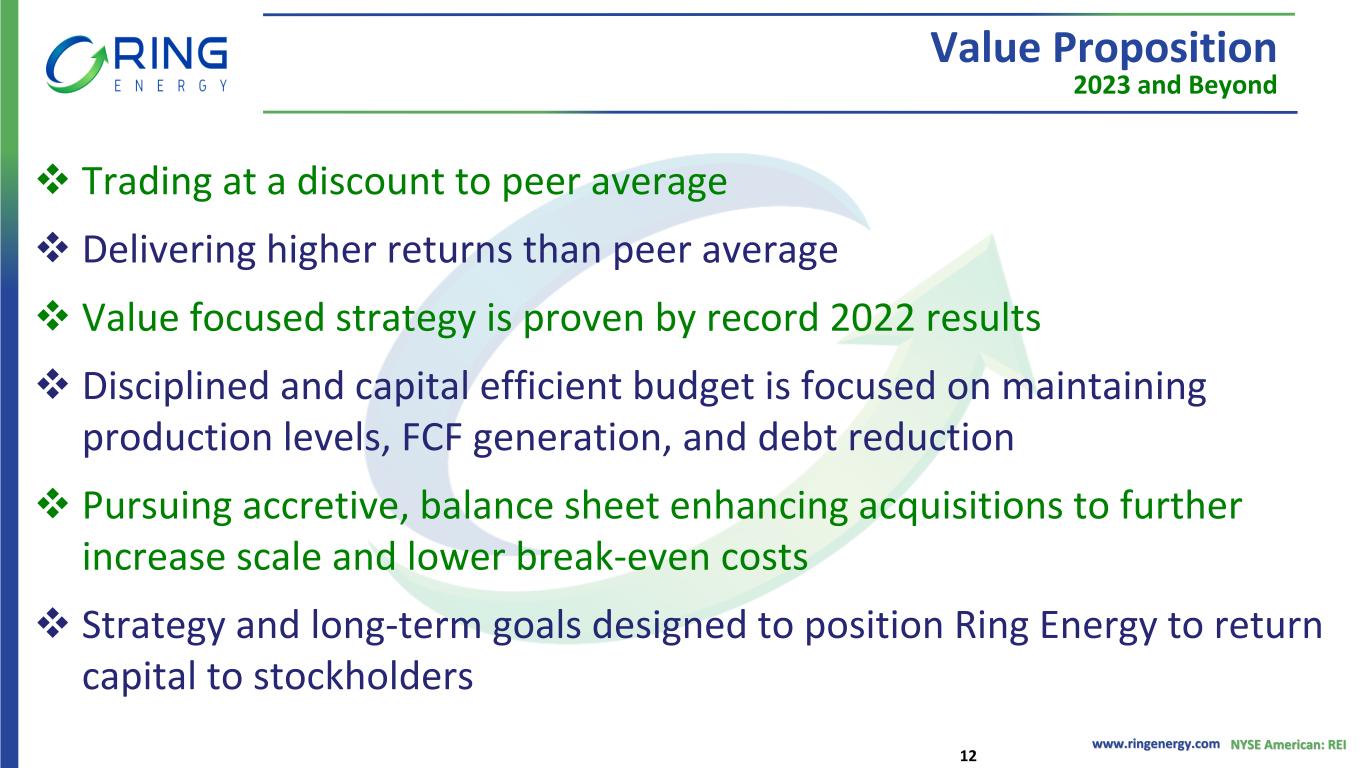
Mr. McKinney concluded, “Turning our attention to the future, we believe energy price volatility will continue and an effective way to reduce risks associated with continuing to deliver competitive returns is to build a strong balance sheet. In keeping with our beliefs, we have developed a disciplined and flexible 2023 capital budget that takes advantage of our improved capital efficiency, designed to maintain or slightly grow production, and allocate excess cash from operations to paying down debt. We believe this focus will drive long-term value for our stockholders and improve our ability to manage the risks associated with ongoing price volatility. It will also allow us to remain steadfast in our pursuit of accretive and balance-sheet-enhancing acquisitions, and should position the Company to return capital to our stockholders in the future.”
Financial Overview: For the fourth quarter of 2022, the Company reported net income of $14.5 million, or $0.08 per diluted share, which included a $5.4 million before tax non-cash unrealized commodity derivative loss, $2.2 million in before tax share-based compensation and $1.0 million in before tax transaction related costs for the Stronghold acquisition (“Transaction Costs”). Excluding the estimated after-tax impact of the adjustments, the Company’s Adjusted Net Income was $21.8 million, or $0.13 per share. In the third quarter of 2022, the Company
4
reported net income of $75.1 million, or $0.49 per diluted share, which included a $47.7 million before tax non-cash unrealized commodity derivative gain, $1.5 million for before tax share-based compensation, and $1.1 million in before tax Transaction Costs. Excluding the estimated after-tax impact of these adjustments, the Company’s Adjusted Net Income was $32.5 million, or $0.28 per share. In the fourth quarter of 2021, Ring reported net income of $24.1 million, or $0.20 per diluted share, which included a $15.2 million before tax non-cash unrealized commodity derivative gain, and $0.9 million in before tax share-based compensation. Excluding the estimated after-tax impact of these adjustments, Adjusted Net Income in the fourth quarter of 2021 was $9.9 million, or $0.10 per share.
Adjusted EBITDA was $56.3 million for the fourth quarter of 2022, essentially flat with $56.0 million for the third quarter of 2022. Lower realized pricing for the fourth quarter significantly reduced the benefit of the 34% increase in sales volumes. Fourth quarter of 2021 Adjusted EBITDA was $24.0 million.
Free Cash Flow for the fourth quarter of 2022 was $5.5 million compared to $9.7 million in the third quarter of 2022 with the decrease primarily due to lower realized pricing and higher interest expense and capital spending in the fourth quarter, partially offset by higher sales volumes. Fourth quarter 2022 Free Cash Flow decreased 41% from $9.3 million for the fourth quarter of 2021 primarily due to higher capital spending, partially offset by increased sales volumes and realized oil pricing.
Cash Flow from Operations was $47.4 million for the fourth quarter of 2022 compared to $48.9 million for the third quarter of 2022 and $20.6 million for the fourth quarter of 2021.
Adjusted Net Income, Adjusted EBITDA, Free Cash Flow, Cash Flow from Operations and PV-10 are non-GAAP financial measures, which are described in more detail and reconciled to the most comparable GAAP measures, in the tables shown later in this release under “Non-GAAP Information.”
Sales Volumes, Prices and Revenues: As a result of the Stronghold Transaction, beginning July 1, 2022, the Company began reporting revenues on a three-stream basis, separately reporting oil, natural gas, and natural gas liquids (“NGLs”) sales. For periods prior to July 1, 2022, sales and reserve volumes, prices, and revenues for NGLs were included in natural gas.
Sales volumes for the fourth quarter of 2022 were 17,856 Boe/d (68% oil, 17% natural gas and 15% NGLs), or 1,642,715 Boe, compared to 13,278 Boe/d (76% oil, 13% natural gas and 11%
5
NGLs), or 1,221,616 Boe, for the third quarter of 2022, and 9,153 Boe/d (85% oil and 15% natural gas), or 842,110 Boe, in the fourth quarter of 2021. Fourth quarter 2022 sales volumes were slightly below guidance due to downtime associated with the impact of winter storm conditions, gas purchaser system constraints limiting gas sales in the CBP and NWS, and adjustments for reversionary interests and after-payout conditions. Fourth quarter 2022 sales volumes were comprised of 1,121,371 barrels (“Bbls”) of oil, 1,680,401 thousand cubic feet (“Mcf”) of natural gas and 241,277 Bbls of NGLs.
For the fourth quarter of 2022, the Company realized an average sales price of $81.62 per barrel of crude oil, $2.39 per Mcf for natural gas and $17.21 per barrel of NGLs. The combined average realized sales price for the period was $60.69 per Boe, down 22% versus $77.28 per Boe for the third quarter of 2022, and down 14% from $70.85 per Boe in the fourth quarter of 2021. The average oil price differential the Company experienced from WTI NYMEX futures pricing in the fourth quarter of 2022 was a negative $1.07 per barrel of crude oil, while the average natural gas price differential from NYMEX futures pricing was a negative $3.79 per Mcf.
Revenues were $99.7 million for the fourth quarter of 2022 compared to $94.4 million for the third quarter of 2022 and $59.7 million for the fourth quarter of 2021. The 6% increase in fourth quarter 2022 revenues from the third quarter was driven by higher sales volumes largely offset by lower realized pricing.
Lease Operating Expense (“LOE”): LOE, which includes expensed workovers and facilities maintenance, was $17.4 million, or $10.60 per Boe, in the fourth quarter of 2022 versus $13.0 million, or $10.67 per Boe, in the third quarter of 2022 and $7.7 million, or $9.12 per Boe, for the fourth quarter of 2021.
Gathering, Transportation and Processing (“GTP”) Costs: As previously disclosed, due to a contractual change effective May 1, 2022, the Company no longer maintains ownership and control of natural gas through processing. As a result, GTP costs are now reflected as a reduction to the natural gas sales price and not as an expense item.
Ad Valorem Taxes: Ad valorem taxes were $0.96 per Boe for the fourth quarter of 2022 compared to $0.98 per Boe in the third quarter of 2022 and $0.16 per Boe for the fourth quarter of 2021. Ad valorem taxes for the fourth quarter of 2021 reflect lower assessed property values compared to estimates.
6
Production Taxes: Production taxes were $3.16 per Boe in the fourth quarter of 2022 compared to $3.74 per Boe in the third quarter of 2022 and $3.36 per Boe in fourth quarter of 2021. Production taxes ranged between 4.7% to 5.2% of revenue for all three periods.
Depreciation, Depletion and Amortization (“DD&A”) and Asset Retirement Obligation Accretion: DD&A was $12.71 per Boe in the fourth quarter of 2022 versus $11.73 per Boe for the third quarter of 2022 and $12.44 per Boe in the fourth quarter of 2021. Asset retirement obligation accretion was $0.22 per Boe in the fourth quarter of 2022 compared to $0.20 per Boe for the third quarter of 2022 and $0.22 per Boe in the fourth quarter of 2021.
Operating Lease Expense: Operating lease expense was $113,138 for the fourth quarter of 2022 versus $83,590 for the third quarter of 2022 and $83,591 in the fourth quarter of 2021. These expenses are primarily associated with the Company’s office leases.
General and Administrative Expenses (“G&A”): G&A, excluding non-cash share-based compensation, was $6.1 million for the fourth quarter of 2022 ($3.74 per Boe) versus $5.9 million for the third quarter of 2022 ($4.79 per Boe) and $4.0 million in the fourth quarter of 2021 ($4.79 per Boe). The fourth quarter and third quarter of 2022 included Transaction Costs of $1.0 million and $1.1 million, respectively. Adjusting for Transaction Costs, fourth quarter 2022 G&A, excluding non-cash share-based compensation, was $3.14 per Boe compared to $3.85 per Boe for the third quarter of 2022 — an 18% decrease and direct reflection of the synergies afforded by the Stronghold Transaction.
Interest Expense: Interest expense was $9.5 million in the fourth quarter of 2022 versus $7.0 million for the third quarter of 2022 and $3.5 million for the fourth quarter of 2021. Interest expense increased for both comparative periods primarily due to a higher average daily borrowing balance of long-term debt associated with additional borrowings on the Company’s revolving credit facility associated with the closing of the Stronghold Transaction on August 31, 2022.
Derivative (Loss) Gain: In the fourth quarter of 2022, Ring recorded a net loss of $19.3 million on its commodity derivative contracts, including a realized $13.9 million cash commodity derivative loss and an unrealized $5.4 million non-cash commodity derivative loss. This compared to a net gain of $32.9 million in the third quarter of 2022, including a realized $14.8 million cash commodity derivative loss and an unrealized $47.7 million non-cash commodity derivative gain, and a net loss of $4.3 million in the fourth quarter of 2021, including a realized
7
$19.5 million cash commodity derivative loss and an unrealized $15.2 million non-cash commodity derivative gain.
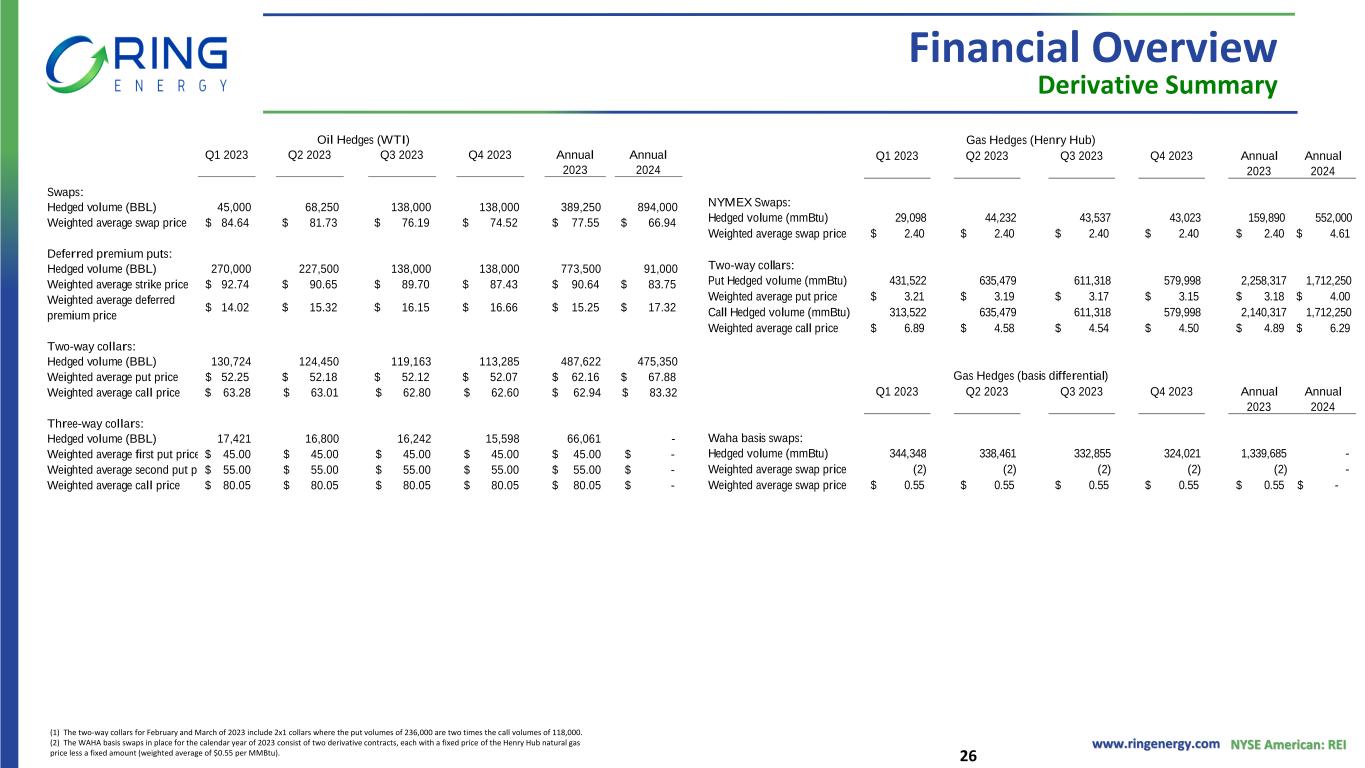
A summary listing of the Company’s outstanding derivative positions at December 31, 2022 is included in the tables shown later in this release. A quarterly breakout is provided in the Company’s investor presentation.
For full year 2023, the Company currently has approximately 1.7 million barrels of oil (38% of oil sales guidance midpoint) hedged and 2.4 billion cubic feet of natural gas (35% of natural gas sales guidance midpoint) hedged.
Income Tax: The Company recorded a non-cash income tax provision of $2.5 million in the fourth quarter of 2022 versus a non-cash income tax provision of $4.3 million in the third quarter of 2022 and a non-cash income tax benefit of $51,601 for the fourth quarter of 2021.
Balance Sheet and Liquidity: Total liquidity at the end of the fourth quarter of 2022 was $188.0 million, a 14% increase from September 30, 2022 and a 205% increase from December 31, 2021. Liquidity at December 31, 2022 consisted of cash and cash equivalents of $3.7 million and $184.2 million of availability under Ring’s revolving credit facility, which includes a reduction of $0.8 million for letters of credit. On December 31, 2022, the Company had $415.0 million in borrowings outstanding on its revolving credit facility that has a current borrowing base of $600.0 million. Ring paid down $20 million of debt during the fourth quarter of 2022 and $37.0 million since the closing of the Stronghold Transaction. The Company is targeting further debt reduction during 2023 dependent on market conditions, the timing of capital spending and other considerations. Since September 30, 2022, 5,317,427 outstanding common stock warrants have been exercised, of which 4,517,427 common stock warrants have been exercised to date in 2023. Currently, 14,590,366 common stock warrants remain outstanding.
During the fourth quarter of 2022, Ring successfully reaffirmed the Company’s borrowing base of $600.0 million under its revolving credit facility. The next regularly scheduled bank redetermination is scheduled to occur during May 2023. Ring is currently in compliance with all applicable covenants under its revolving credit facility.
Capital Expenditures: During the fourth quarter of 2022, capital expenditures on an accrual basis were $42.6 million as compared to Ring’s previous guidance of $42 million to $46 million. The Company drilled four Hz wells (two in the CBP and two in NWS) and five vertical wells (all in the CBP); completed 12 wells (seven in the CBP and five in the NWS); and, recompleted nine
8
wells (all in the CBP). Also included in fourth quarter 2022 capital spending were costs for capital workovers, infrastructure upgrades, and leasing costs.
For the twelve months ended December 31, 2022, capital expenditures were $140.1 million, which included costs to drill, complete and place on production 27 Hz wells (18 in the NWS and nine in the CBP) and five vertical wells in the CBP. Similar to the fourth quarter, also included in capital spending were costs for recompletions, capital workovers, infrastructure upgrades, and leasing costs. Ring also participated in the drilling and completion of three non-operated wells in the NWS.
The table below sets forth Ring’s drilling and completions activities by quarter for 2022:
| Quarter | Area | Wells Drilled | Wells Completed | Recompletions | ||||||||||||||||||||||
| 1Q 2022 | Central Basin Platform (Horizontal) | 4 | 4 | — | ||||||||||||||||||||||
| Central Basin Platform (Vertical) | — | — | — | |||||||||||||||||||||||
| Northwest Shelf | 2 | — | — | |||||||||||||||||||||||
| 2Q 2022 | Central Basin Platform (Horizontal) | — | — | — | ||||||||||||||||||||||
| Central Basin Platform (Vertical) | — | — | — | |||||||||||||||||||||||
| Northwest Shelf | 9 | 7 | — | |||||||||||||||||||||||
| 3Q 2022 | Central Basin Platform (Horizontal) | 3 | 3 | — | ||||||||||||||||||||||
| Central Basin Platform (Vertical) | — | — | 3 | |||||||||||||||||||||||
| Northwest Shelf | 5 | 6 | — | |||||||||||||||||||||||
| 4Q 2022 | Central Basin Platform (Horizontal) | 2 | 2 | — | ||||||||||||||||||||||
| Central Basin Platform (Vertical) | 5 | 5 | 9 | |||||||||||||||||||||||
| Northwest Shelf | 2 | 5 | — | |||||||||||||||||||||||
Full Year 2022 Financial Review
The Company reported record net income for full year 2022 of $138.6 million, or $0.98 per diluted share, and record Adjusted Net Income of $107.5 million, or $0.89 per share. For full year 2021, Ring reported net income of $3.3 million, or $0.03 per diluted share, and Adjusted Net Income of $30.6 million, or $0.31 per share.
In full year 2022, the Company grew Adjusted EBITDA by 134% to a record $195.2 million, or $1.61 per share and $43.27 per Boe, from $83.3 million, or $0.84 per share and $26.80 per Boe, in 2021. Ring generated Free Cash Flow for full year 2022 of $34.8 million versus $20.5 million
9
in 2021 — a 70% increase. For full year 2022, the Company grew Cash Flow from Operations by 149% to a record $172.9 million from $69.5 million in 2021.
Revenues totaled a record $347.2 million for 2022 compared to $196.3 million in 2021, with the 77% increase driven by higher sales volumes and increased realized commodity prices.
Net sales for full year 2022 were 12,364 Boe/d, or 4,512,610 Boe, comprised of 3,459,840 Bbls of oil, 4,088,642 Mcf of natural gas, and 371,329 Bbls of NGLs. Full year 2021 net sales averaged 8,519 Boe/d, or 3,109,470 Boe, which included 2,686,939 Bbls of oil and 2,535,188 Mcf of natural gas. The increase in sales volumes was a direct result of the Stronghold Transaction, as well as organic growth from the Company’s capital spending program.
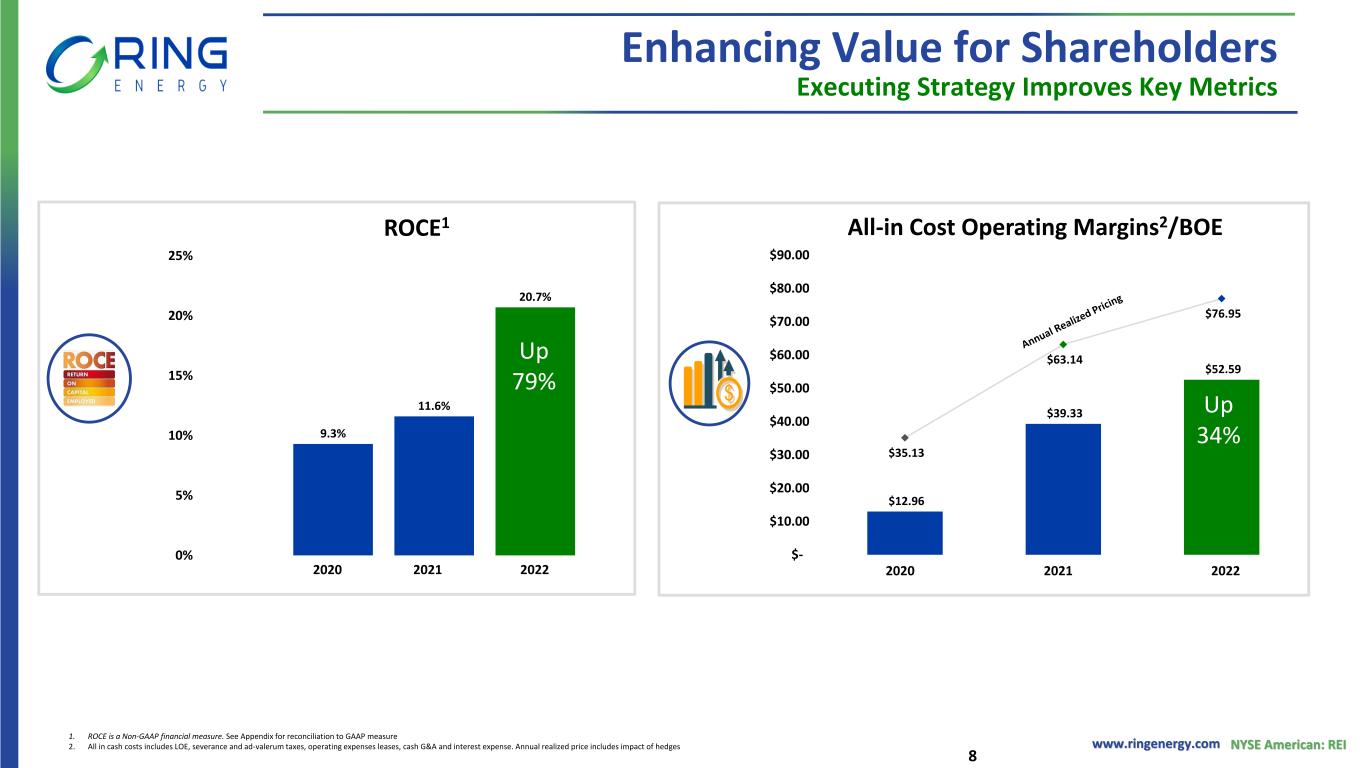
For the full year 2022, the Company’s realized crude oil sales price was $92.80 per barrel, the natural gas sales price was $4.57 per Mcf, and the NGLs sales price was $20.18 per barrel. The combined average sales price for full year 2022 was $76.95 per Boe compared to $63.13 per Boe for full year 2021.
For the full year 2022, LOE was $47.7 million, or $10.57 per Boe, versus $30.3 million, or $9.75 per Boe, for full year 2021. The increase in LOE on an absolute basis was primarily associated with a 45% increase in production, as well as increased costs for goods and services due to higher activity levels and inflation.
GTP costs were $1.8 million, or $0.41 per Boe, for full year 2022 compared to $4.3 million, or $1.39 per Boe in 2021, with the decrease year-over-year due to the aforementioned contractual change effective May 1, 2022. Ad valorem taxes increased to $4.7 million, or $1.04 per Boe, in 2022 from $2.3 million, or $0.73 per Boe, for full year 2021. Driving the increase was a higher pricing basis for tax valuations as well as $0.8 million for the assets acquired in the Stronghold Transaction. Production taxes for 2022 were $17.1 million, or $3.80 per Boe, versus $9.1 million, or $2.93 per Boe, in 2021. As a percentage of oil and natural gas sales, 2022 production taxes increased slightly to 4.93% from 4.65% for 2021 due to higher Texas natural gas revenue in 2022, which is taxed at 7.5%.
For the full year 2022, G&A, excluding non-cash share-based compensation, was $19.9 million, or $4.42 per Boe, compared to $13.6 million, or $4.39 per Boe for full year 2021. Excluding Transaction Costs of $2.1 million, full year 2022 G&A, net of non-cash share-based compensation, was $3.94 per Boe — a 10% decrease from full year 2021.
10
For the full year 2022, the Company recorded a non-cash income tax provision of $8.4 million compared to a non-cash income tax provision of $0.1 million in full year 2021.
2023 Capital Investment, Sales Volumes, and Operating Expense Guidance
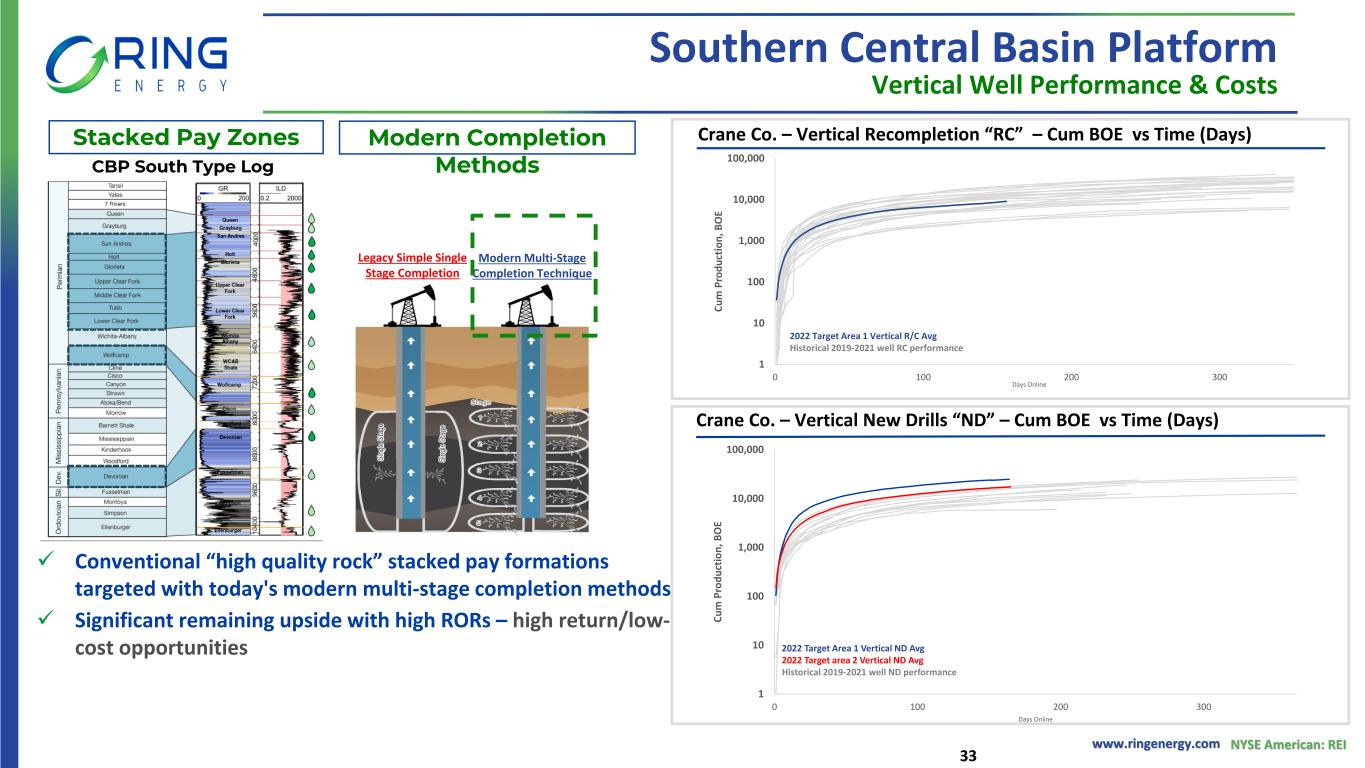
In January, the Company commenced its 2023 drilling and recompletion program, including drilling and completing three Hz wells in the NWS, all of which have been placed on production. A fourth Hz well in the NWS has been drilled and is expected to be completed and placed on production by the end of March. Additionally, the Company picked up a rig in the CBP to drill three vertical wells and anticipates having all three wells online by the end of March.
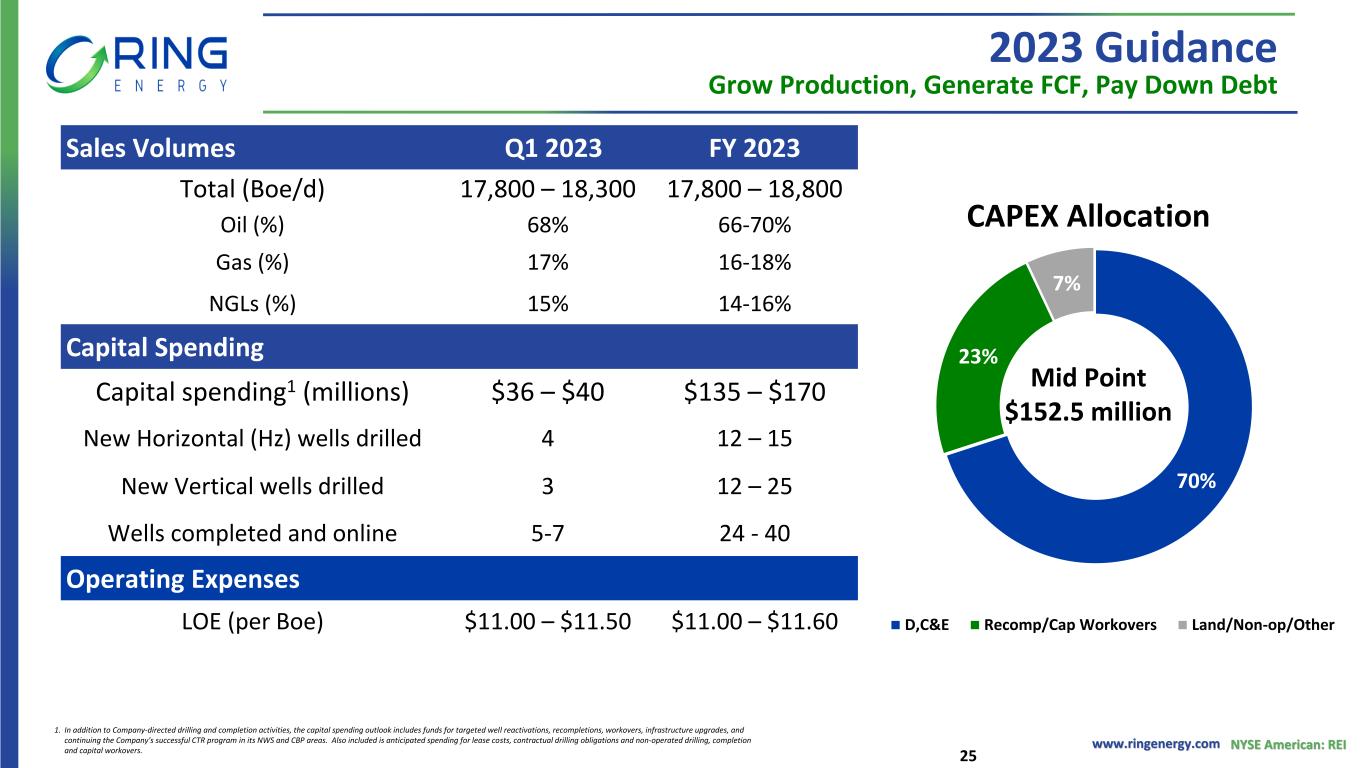
For full year 2023, Ring expects total capital spending of $135 million to $170 million that includes a balanced and capital efficient combination of drilling Hz wells on legacy acreage and vertical wells on the recently acquired CBP assets, as well as performing recompletions. Additionally, the full year capital spending program includes funds for targeted capital workovers, infrastructure upgrades, leasing costs, and non-operated drilling, completion, and capital workovers.
All projects and estimates are based on assumed WTI oil prices of $70 to $90 per barrel and Henry Hub prices of $2 to $3 per Mcf. As in the past, Ring has designed its spending program with flexibility to respond to changes in commodity prices and other market conditions as appropriate.
Based on the $152.5 million mid-point of spending guidance, the Company expects the following estimated allocation of capital investment, including:
•70% for drilling, completion, and related infrastructure;
•22% for recompletions and capital workovers; and
•8% for land, environmental, social and governance (“ESG”) and non-operated capital.
The Company remains squarely focused on continuing to generate free cash flow in 2023. All 2023 planned capital expenditures will be fully funded by cash on hand and cash from operations, and excess free cash flow is currently targeted for further debt reduction.
Supported by a full year of production from the Stronghold Transaction, its targeted development program and continued focus on operational excellence, the Company currently forecasts full year 2023 sales volumes of 17,800 to 18,800 Boe/d (68% oil, 17% natural gas, 15% NGLs), compared with full year 2022 average sales volumes of 12,364 Boe/d (77% oil,
11
23% natural gas & NGLs). Assuming the mid-point of its full year 2023 sales volumes guidance, Ring expects a 48% increase from full year 2022 and a 2.5% increase from the fourth quarter of 2022.
The guidance in the table below represents the Company's current good faith estimate of the range of likely future results for the full year and first quarter of 2023. Guidance could be affected by the factors discussed below in the "Safe Harbor Statement" section.
| Q1 | FY | |||||||||||||
| 2023 | 2023 | |||||||||||||
| Sales Volumes: | ||||||||||||||
| Total (Boe/d) | 17,800-18,300 | 17,800-18,800 | ||||||||||||
| Oil (%) | 68% | 66-70% | ||||||||||||
| NGLs (%) | 15% | 14-16% | ||||||||||||
| Gas (%) | 17% | 16-18% | ||||||||||||
| Capital Program: | ||||||||||||||
Capital spending(1) (millions) | $36-$40 | $135-$170 | ||||||||||||
| Hz wells drilled | 4 | 12-15 | ||||||||||||
| Vertical wells drilled | 3 | 12-25 | ||||||||||||
| Wells completed and online | 5-7 | 24-40 | ||||||||||||
| Operating Expenses: | ||||||||||||||
| LOE (per Boe) | $11.10-11.50 | $11.00-11.60 | ||||||||||||
(1) In addition to Company-directed drilling and completion activities, the capital spending outlook includes funds for targeted well reactivations, capital workovers, and infrastructure upgrades. Also included is anticipated spending for leasing costs, and non-operated drilling, completion, and capital workovers.
Year-End 2022 Proved Reserves
The Company's year-end 2022 SEC proved reserves were 138.1 MMBoe compared to 77.8 MMBoe at year-end 2021 — a 78% increase year-over-year. During 2022, Ring recorded reserve additions of 62.9 MMBoe for acquisitions, 1.2 MMBoe for revisions of previous quantity estimates, and 0.8 MMBoe for extensions, discoveries and improved recovery. Partially offsetting the overall increase was 4.5 MMBoe of production. The result was an all-in replacement ratio of 13.4 times based on the Company’s year-end 2022 proved reserves.
12
The SEC twelve-month first day of the month average prices used for year-end 2022 were $90.15 per barrel of crude oil (WTI) (Plains Posted) and $6.36 per MMBtu of natural gas (Henry Hub), both before adjustment for quality, transportation, fees, energy content, and regional price differentials, while for year-end 2021 they were $63.04 per barrel of crude oil and $3.598 per MMBtu of natural gas.
Year-end 2022 SEC proved reserves were comprised of approximately 64% crude oil, 19% natural gas, and 17% natural gas liquids. At year end, approximately 65% of 2022 proved reserves were classified as proved developed and 35% as proved undeveloped. This is compared to year-end 2021 when approximately 56% of proved reserves were classified as proved developed and 44% were classified as proved undeveloped.
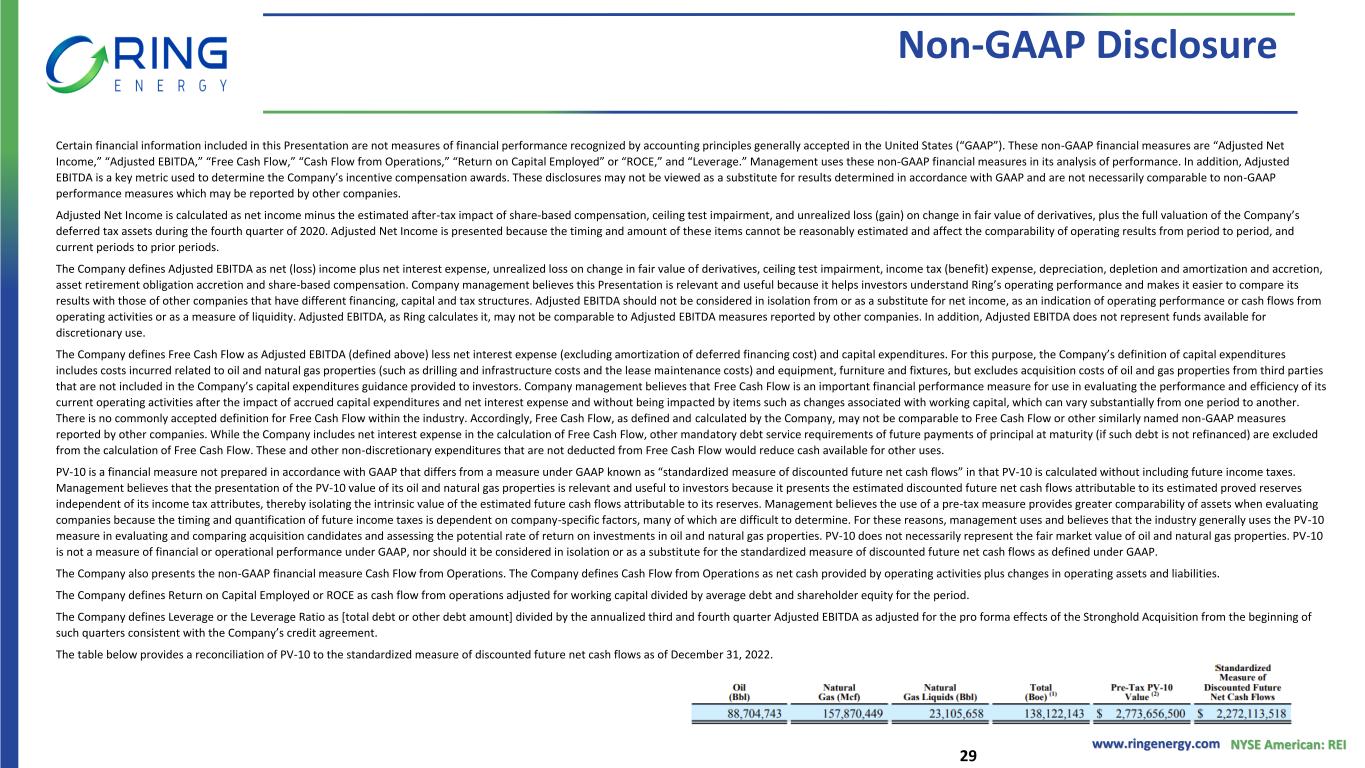
The present value of the Company’s reported SEC proved reserves, discounted at 10% ("PV-10"), at year-end 2022 was $2,773.7 million, up 108% from $1,332.1 million at the end of 2021.
| Oil (Bbl) | Gas (Mcf) | Natural Gas Liquids (Bbl) | Net (Boe) | PV-10(1) | ||||||||||||||||||||||||||||
| Balance, December 31, 2021 | 65,838,609 | 71,773,789 | — | 77,800,907 | $ | 1,332,097,625 | ||||||||||||||||||||||||||
| Purchases of minerals in place | 28,086,920 | 108,456,107 | 16,715,626 | 62,878,564 | ||||||||||||||||||||||||||||
| Extensions, discoveries and improved recovery | 628,978 | 522,178 | 52,810 | 768,818 | ||||||||||||||||||||||||||||
| Production | (3,459,477) | (4,088,642) | (371,337) | (4,512,254) | ||||||||||||||||||||||||||||
| Revisions of previous quantity estimates | (2,390,287) | (18,792,983) | 6,708,559 | 1,186,108 | ||||||||||||||||||||||||||||
| Balance, December 31, 2022 | 88,704,743 | 157,870,449 | 23,105,658 | 138,122,143 | $ | 2,773,656,500 | ||||||||||||||||||||||||||
(1) PV-10 for this presentation excludes any provision for asset retirement obligations or income taxes and is a non-GAAP financial measure as defined by the SEC, and is derived from the standardized measure of Discounted Futures Net Cash Flows, which is the most directly comparable generally accepted accounting principles (“GAAP”) measure.
In accordance with guidelines established by the SEC, estimated proved reserves as of December 31, 2022 were determined to be economically producible under existing economic conditions, which requires the use of the 12-month average commodity price for each product, calculated as the unweighted arithmetic average of the first-day-of-the-month price for the year end December 31, 2022. The SEC average prices used for year-end 2022 were $90.15 per barrel of crude oil (WTI) and $6.358 per MMBtu of natural gas (Henry Hub), both before adjustment for quality, transportation, fees, energy content, and regional price differentials. Such prices were held constant throughout the estimated lives of the reserves. Future production and development costs are based on year-end costs with no escalations.
Standardized Measure of Discounted Future Net Cash Flows
13
Ring’s standardized measure of discounted future net cash flows relating to proved oil and natural gas reserves and changes in the standardized measure as described below were prepared in accordance with GAAP.
| As of December 31, | 2022 | 2021 | ||||||||||||
| Future cash inflows | $ | 9,871,961,000 | $ | 4,853,709,000 | ||||||||||
| Future production costs | (2,751,896,250) | (1,395,437,250) | ||||||||||||
| Future development costs | (647,196,750) | (347,757,000) | ||||||||||||
| Future income taxes | (1,142,147,641) | (501,586,949) | ||||||||||||
| Future net cash flows | 5,330,720,359 | 2,608,927,801 | ||||||||||||
| 10% annual discount for estimated timing of cash flows | (3,058,606,841) | (1,471,562,953) | ||||||||||||
| Standardized Measure of Discounted Future Net Cash Flows | $ | 2,272,113,518 | $ | 1,137,364,848 | ||||||||||
Reconciliation of PV-10 to Standardized Measure
PV-10 is derived from the Standardized Measure of Discounted Future Net Cash Flows (“Standardized Measure”), which is the most directly comparable GAAP financial measure for proved reserves calculated using SEC pricing. PV-10 is a computation of the Standardized Measure on a pre-tax basis. PV-10 is equal to the Standardized Measure at the applicable date, before deducting future income taxes, discounted at 10 percent. We believe that the presentation of PV-10 is relevant and useful to investors because it presents the discounted future net cash flows attributable to our estimated net proved reserves prior to taking into account future corporate income taxes, and it is a useful measure for evaluating the relative monetary significance of our oil and natural gas properties. Further, investors may utilize the measure as a basis for comparison of the relative size and value of our reserves to other companies. Moreover, GAAP does not provide a measure of estimated future net cash flows for reserves other than proved reserves or for reserves calculated using prices other than SEC prices. We use this measure when assessing the potential return on investment related to our oil and natural gas properties. PV-10, however, is not a substitute for the Standardized Measure. Our PV-10 measure and the Standardized Measure do not purport to represent the fair value of our oil and natural gas reserves.
The following table reconciles the pre-tax PV-10 value of our SEC pricing proved reserves as of December 31, 2022 to the Standardized Measure.
14
SEC Pricing Proved Reserves | |||||||||||
Standardized Measure Reconciliation | |||||||||||
Pre-Tax Present Value of Estimated Future Net Revenues (PV-10) | $ | 2,773,656,500 | |||||||||
Future Income Taxes, Discounted at 10% | 501,542,982 | ||||||||||
Standardized Measure of Discounted Future Net Cash Flows | $ | 2,272,113,518 | |||||||||
Conference Call Information
Ring will hold a conference call on Friday, March 10, 2023 at 11:00 a.m. ET to discuss its fourth quarter and full year 2022 operational and financial results. An updated investor presentation will be posted to the Company’s website prior to the conference call.
To participate in the conference call, interested parties should dial 833-953-2433 at least five minutes before the call is to begin. Please reference the “Ring Energy Fourth Quarter and Full Year 2022 Earnings Conference Call”. International callers may participate by dialing 412-317-5762. The call will also be webcast and available on Ring’s website at www.ringenergy.com under “Investors” on the “News & Events” page. An audio replay will also be available on the Company’s website following the call.
About Ring Energy, Inc.
Ring Energy, Inc. is an oil and gas exploration, development, and production company with current operations focused on the conventional development of its Permian Basin assets in West Texas and New Mexico. For additional information, please visit www.ringenergy.com.
Safe Harbor Statement
This release contains forward-looking statements within the meaning of Section 27A of the Securities Act of 1933 and Section 21E of the Securities Exchange Act of 1934. Forward-looking statements involve a wide variety of risks and uncertainties, and include, without limitations, statements with respect to the Company’s strategy and prospects. Such statements are subject to certain risks and uncertainties which are disclosed in the Company’s reports filed with the SEC, including its Form 10-K for the fiscal year ended December 31, 2022, and its other filings with the SEC. Readers and investors are cautioned that the Company’s actual results may differ materially from those described in the forward-looking statements due to a number of factors, including, but not limited to, the Company’s ability to acquire productive oil and/or gas properties or to successfully drill and complete oil and/or gas wells on such properties, general economic
15
conditions both domestically and abroad, and the conduct of business by the Company, and other factors that may be more fully described in additional documents set forth by the Company.
Contact Information
Al Petrie Advisors
Al Petrie, Senior Partner
Phone: 281-975-2146
Email: [email protected]
16
RING ENERGY, INC.
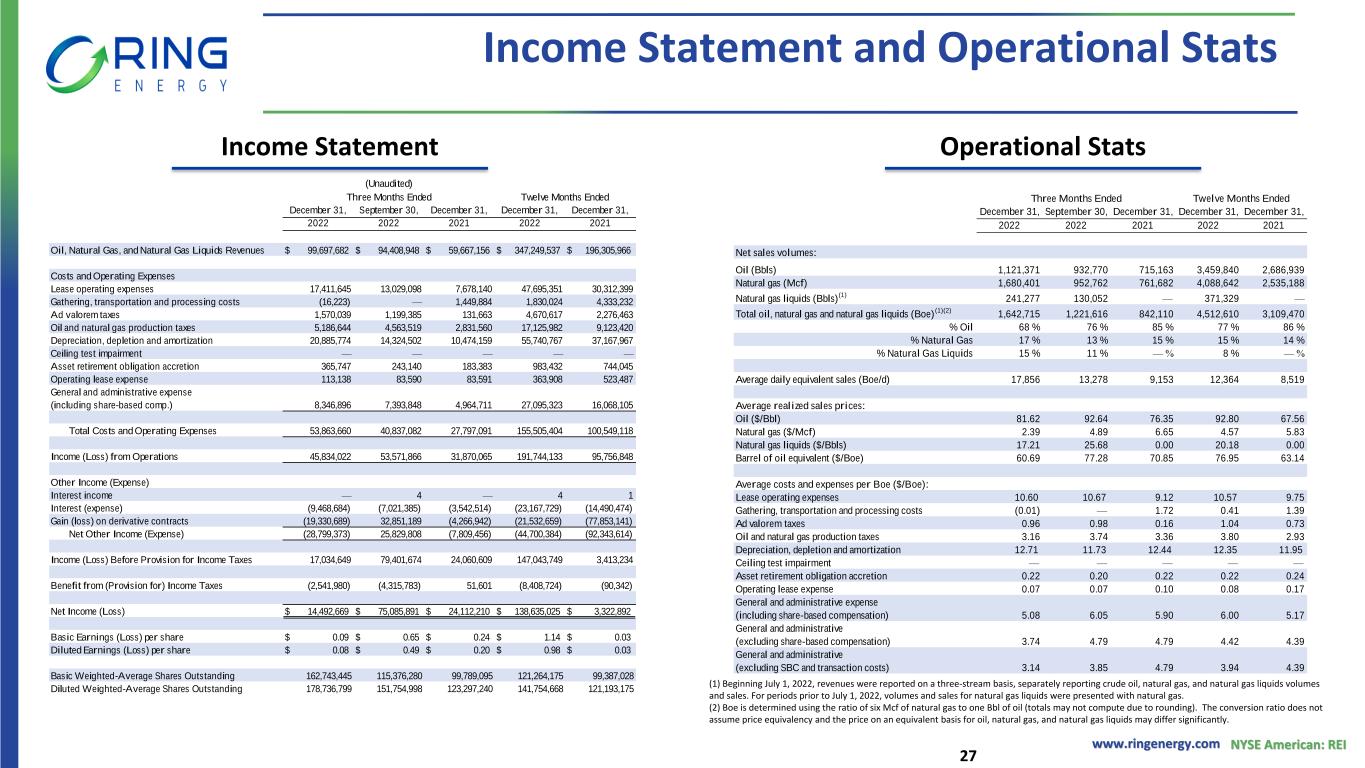
Condensed Statements of Operations
| (Unaudited) | |||||||||||||||||||||||||||||
| Three Months Ended | Twelve Months Ended | ||||||||||||||||||||||||||||
| December 31, | September 30, | December 31, | December 31, | December 31, | |||||||||||||||||||||||||
| 2022 | 2022 | 2021 | 2022 | 2021 | |||||||||||||||||||||||||
| Oil, Natural Gas, and Natural Gas Liquids Revenues | $ | 99,697,682 | $ | 94,408,948 | $ | 59,667,156 | $ | 347,249,537 | $ | 196,305,966 | |||||||||||||||||||
| Costs and Operating Expenses | |||||||||||||||||||||||||||||
| Lease operating expenses | 17,411,645 | 13,029,098 | 7,678,140 | 47,695,351 | 30,312,399 | ||||||||||||||||||||||||
| Gathering, transportation and processing costs | (16,223) | — | 1,449,884 | 1,830,024 | 4,333,232 | ||||||||||||||||||||||||
| Ad valorem taxes | 1,570,039 | 1,199,385 | 131,663 | 4,670,617 | 2,276,463 | ||||||||||||||||||||||||
| Oil and natural gas production taxes | 5,186,644 | 4,563,519 | 2,831,560 | 17,125,982 | 9,123,420 | ||||||||||||||||||||||||
| Depreciation, depletion and amortization | 20,885,774 | 14,324,502 | 10,474,159 | 55,740,767 | 37,167,967 | ||||||||||||||||||||||||
| Ceiling test impairment | — | — | — | — | — | ||||||||||||||||||||||||
| Asset retirement obligation accretion | 365,747 | 243,140 | 183,383 | 983,432 | 744,045 | ||||||||||||||||||||||||
| Operating lease expense | 113,138 | 83,590 | 83,591 | 363,908 | 523,487 | ||||||||||||||||||||||||
| General and administrative expense (including share-based compensation) | 8,346,896 | 7,393,848 | 4,964,711 | 27,095,323 | 16,068,105 | ||||||||||||||||||||||||
| Total Costs and Operating Expenses | 53,863,660 | 40,837,082 | 27,797,091 | 155,505,404 | 100,549,118 | ||||||||||||||||||||||||
| Income (Loss) from Operations | 45,834,022 | 53,571,866 | 31,870,065 | 191,744,133 | 95,756,848 | ||||||||||||||||||||||||
| Other Income (Expense) | |||||||||||||||||||||||||||||
| Interest income | — | 4 | — | 4 | 1 | ||||||||||||||||||||||||
| Interest (expense) | (9,468,684) | (7,021,385) | (3,542,514) | (23,167,729) | (14,490,474) | ||||||||||||||||||||||||
| Gain (loss) on derivative contracts | (19,330,689) | 32,851,189 | (4,266,942) | (21,532,659) | (77,853,141) | ||||||||||||||||||||||||
| Net Other Income (Expense) | (28,799,373) | 25,829,808 | (7,809,456) | (44,700,384) | (92,343,614) | ||||||||||||||||||||||||
| Income (Loss) Before Provision for Income Taxes | 17,034,649 | 79,401,674 | 24,060,609 | 147,043,749 | 3,413,234 | ||||||||||||||||||||||||
| Benefit from (Provision for) Income Taxes | (2,541,980) | (4,315,783) | 51,601 | (8,408,724) | (90,342) | ||||||||||||||||||||||||
| Net Income (Loss) | $ | 14,492,669 | $ | 75,085,891 | $ | 24,112,210 | $ | 138,635,025 | $ | 3,322,892 | |||||||||||||||||||
| Basic Earnings (Loss) per share | $ | 0.09 | $ | 0.65 | $ | 0.24 | $ | 1.14 | $ | 0.03 | |||||||||||||||||||
| Diluted Earnings (Loss) per share | $ | 0.08 | $ | 0.49 | $ | 0.20 | $ | 0.98 | $ | 0.03 | |||||||||||||||||||
| Basic Weighted-Average Shares Outstanding | 162,743,445 | 115,376,280 | 99,789,095 | 121,264,175 | 99,387,028 | ||||||||||||||||||||||||
| Diluted Weighted-Average Shares Outstanding | 178,736,799 | 151,754,998 | 123,297,240 | 141,754,668 | 121,193,175 | ||||||||||||||||||||||||
17
RING ENERGY, INC.
Condensed Operating Data
(Unaudited)
| Three Months Ended | Twelve Months Ended | ||||||||||||||||||||||||||||
| December 31, | September 30, | December 31, | December 31, | December 31, | |||||||||||||||||||||||||
| 2022 | 2022 | 2021 | 2022 | 2021 | |||||||||||||||||||||||||
| Net sales volumes: | |||||||||||||||||||||||||||||
| Oil (Bbls) | 1,121,371 | 932,770 | 715,163 | 3,459,840 | 2,686,939 | ||||||||||||||||||||||||
| Natural gas (Mcf) | 1,680,401 | 952,762 | 761,682 | 4,088,642 | 2,535,188 | ||||||||||||||||||||||||
Natural gas liquids (Bbls)(1) | 241,277 | 130,052 | — | 371,329 | — | ||||||||||||||||||||||||
Total oil, natural gas and natural gas liquids (Boe)(1)(2) | 1,642,715 | 1,221,616 | 842,110 | 4,512,610 | 3,109,470 | ||||||||||||||||||||||||
| % Oil | 68 | % | 76 | % | 85 | % | 77 | % | 86 | % | |||||||||||||||||||
| Average daily equivalent sales (Boe/d) | 17,856 | 13,278 | 9,153 | 12,364 | 8,519 | ||||||||||||||||||||||||
| Average realized sales prices: | |||||||||||||||||||||||||||||
| Oil ($/Bbl) | 81.62 | 92.64 | 76.35 | 92.80 | 67.56 | ||||||||||||||||||||||||
| Natural gas ($/Mcf) | 2.39 | 4.89 | 6.65 | 4.57 | 5.83 | ||||||||||||||||||||||||
| Natural gas liquids ($/Bbls) | 17.21 | 25.68 | 0.00 | 20.18 | 0.00 | ||||||||||||||||||||||||
| Barrel of oil equivalent ($/Boe) | 60.69 | 77.28 | 70.85 | 76.95 | 63.13 | ||||||||||||||||||||||||
| Average costs and expenses per Boe ($/Boe): | |||||||||||||||||||||||||||||
| Lease operating expenses | 10.60 | 10.67 | 9.12 | 10.57 | 9.75 | ||||||||||||||||||||||||
| Gathering, transportation and processing costs | -0.01 | 0.00 | 1.72 | 0.41 | 1.39 | ||||||||||||||||||||||||
| Ad valorem taxes | 0.96 | 0.98 | 0.16 | 1.04 | 0.73 | ||||||||||||||||||||||||
| Oil and natural gas production taxes | 3.16 | 3.74 | 3.36 | 3.80 | 2.93 | ||||||||||||||||||||||||
| Depreciation, depletion and amortization | 12.71 | 11.73 | 12.44 | 12.35 | 11.95 | ||||||||||||||||||||||||
| Ceiling test impairment | 0.00 | 0.00 | 0.00 | 0.00 | 0.00 | ||||||||||||||||||||||||
| Asset retirement obligation accretion | 0.22 | 0.20 | 0.22 | 0.22 | 0.24 | ||||||||||||||||||||||||
| Operating lease expense | 0.07 | 0.07 | 0.10 | 0.08 | 0.17 | ||||||||||||||||||||||||
| General and administrative (including share-based compensation) | 5.08 | 6.05 | 5.90 | 6.00 | 5.17 | ||||||||||||||||||||||||
| General and administrative (excluding share-based compensation) | 3.74 | 4.79 | 4.79 | 4.42 | 4.39 | ||||||||||||||||||||||||
(1) Beginning July 1, 2022, revenues were reported on a three-stream basis, separately reporting crude oil, natural gas, and natural gas liquids volumes and sales. For periods prior to July 1, 2022, volumes and sales for natural gas liquids were presented with natural gas.
(2) Boe is determined using the ratio of six Mcf of natural gas to one Bbl of oil (totals may not compute due to rounding.) The conversion ratio does not assume price equivalency and the price on an equivalent basis for oil, natural gas, and natural gas liquids may differ significantly.
18
RING ENERGY, INC.
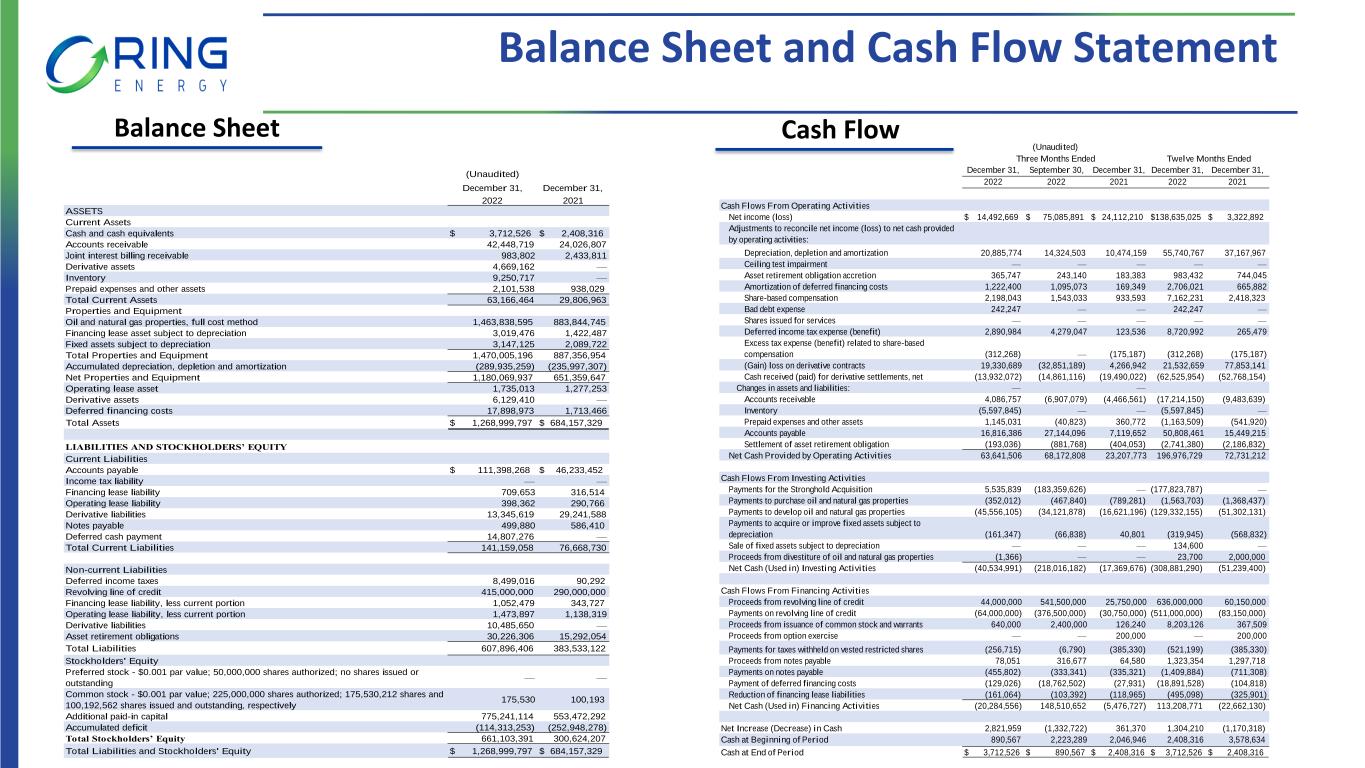
Condensed Balance Sheets
| As of December 31, | 2022 | 2021 | ||||||||||||
| ASSETS | ||||||||||||||
| Current Assets | ||||||||||||||
| Cash and cash equivalents | $ | 3,712,526 | $ | 2,408,316 | ||||||||||
| Accounts receivable | 42,448,719 | 24,026,807 | ||||||||||||
| Joint interest billing receivable | 983,802 | 2,433,811 | ||||||||||||
| Derivative assets | 4,669,162 | — | ||||||||||||
| Inventory | 9,250,717 | — | ||||||||||||
| Prepaid expenses and other assets | 2,101,538 | 938,029 | ||||||||||||
| Total Current Assets | 63,166,464 | 29,806,963 | ||||||||||||
| Properties and Equipment | ||||||||||||||
| Oil and natural gas properties, full cost method | 1,463,838,595 | 883,844,745 | ||||||||||||
| Financing lease asset subject to depreciation | 3,019,476 | 1,422,487 | ||||||||||||
| Fixed assets subject to depreciation | 3,147,125 | 2,089,722 | ||||||||||||
| Total Properties and Equipment | 1,470,005,196 | 887,356,954 | ||||||||||||
| Accumulated depreciation, depletion and amortization | (289,935,259) | (235,997,307) | ||||||||||||
| Net Properties and Equipment | 1,180,069,937 | 651,359,647 | ||||||||||||
| Operating lease asset | 1,735,013 | 1,277,253 | ||||||||||||
| Derivative assets | 6,129,410 | — | ||||||||||||
| Deferred financing costs | 17,898,973 | 1,713,466 | ||||||||||||
| Total Assets | $ | 1,268,999,797 | $ | 684,157,329 | ||||||||||
| LIABILITIES AND STOCKHOLDERS’ EQUITY | ||||||||||||||
| Current Liabilities | ||||||||||||||
| Accounts payable | $ | 111,398,268 | $ | 46,233,452 | ||||||||||
| Financing lease liability | 709,653 | 316,514 | ||||||||||||
| Operating lease liability | 398,362 | 290,766 | ||||||||||||
| Derivative liabilities | 13,345,619 | 29,241,588 | ||||||||||||
| Notes payable | 499,880 | 586,410 | ||||||||||||
| Deferred cash payment | 14,807,276 | — | ||||||||||||
| Total Current Liabilities | 141,159,058 | 76,668,730 | ||||||||||||
| Non-current Liabilities | ||||||||||||||
| Deferred income taxes | 8,499,016 | 90,292 | ||||||||||||
| Revolving line of credit | 415,000,000 | 290,000,000 | ||||||||||||
| Financing lease liability, less current portion | 1,052,479 | 343,727 | ||||||||||||
| Operating lease liability, less current portion | 1,473,897 | 1,138,319 | ||||||||||||
| Derivative liabilities | 10,485,650 | — | ||||||||||||
| Asset retirement obligations | 30,226,306 | 15,292,054 | ||||||||||||
| Total Liabilities | 607,896,406 | 383,533,122 | ||||||||||||
| Commitments and contingencies | ||||||||||||||
| Stockholders' Equity | ||||||||||||||
| Preferred stock - $0.001 par value; 50,000,000 shares authorized; no shares issued or outstanding | — | — | ||||||||||||
| Common stock - $0.001 par value; 225,000,000 shares authorized; 175,530,212 shares and 100,192,562 shares issued and outstanding, respectively | 175,530 | 100,193 | ||||||||||||
| Additional paid-in capital | 775,241,114 | 553,472,292 | ||||||||||||
| Accumulated deficit | (114,313,253) | (252,948,278) | ||||||||||||
| Total Stockholders’ Equity | 661,103,391 | 300,624,207 | ||||||||||||
| Total Liabilities and Stockholders' Equity | $ | 1,268,999,797 | $ | 684,157,329 | ||||||||||
19
RING ENERGY, INC.
Condensed Statements of Cash Flows
| (Unaudited) | ||||||||||||||||||||||||||||||||
| Three Months Ended | Twelve Months Ended | |||||||||||||||||||||||||||||||
| December 31, | September 30, | December 31, | December 31, | December 31, | ||||||||||||||||||||||||||||
| 2022 | 2022 | 2021 | 2022 | 2021 | ||||||||||||||||||||||||||||
| Cash Flows From Operating Activities | ||||||||||||||||||||||||||||||||
| Net income (loss) | $ | 14,492,669 | $ | 75,085,891 | $ | 24,112,210 | $ | 138,635,025 | $ | 3,322,892 | ||||||||||||||||||||||
| Adjustments to reconcile net income (loss) to net cash provided by operating activities: | ||||||||||||||||||||||||||||||||
| Depreciation, depletion and amortization | 20,885,774 | 14,324,503 | 10,474,159 | 55,740,767 | 37,167,967 | |||||||||||||||||||||||||||
| Asset retirement obligation accretion | 365,747 | 243,140 | 183,383 | 983,432 | 744,045 | |||||||||||||||||||||||||||
| Amortization of deferred financing costs | 1,222,400 | 1,095,073 | 169,349 | 2,706,021 | 665,882 | |||||||||||||||||||||||||||
| Share-based compensation | 2,198,043 | 1,543,033 | 933,593 | 7,162,231 | 2,418,323 | |||||||||||||||||||||||||||
| Bad debt expense | 242,247 | — | — | 242,247 | — | |||||||||||||||||||||||||||
| Deferred income tax expense (benefit) | 2,890,984 | 4,279,047 | 123,536 | 8,720,992 | 265,479 | |||||||||||||||||||||||||||
| Excess tax expense (benefit) related to share-based compensation | (312,268) | — | (175,187) | (312,268) | (175,187) | |||||||||||||||||||||||||||
| (Gain) loss on derivative contracts | 19,330,689 | (32,851,189) | 4,266,942 | 21,532,659 | 77,853,141 | |||||||||||||||||||||||||||
| Cash received (paid) for derivative settlements, net | (13,932,072) | (14,861,116) | (19,490,022) | (62,525,954) | (52,768,154) | |||||||||||||||||||||||||||
| Changes in assets and liabilities: | ||||||||||||||||||||||||||||||||
| Accounts receivable | 4,086,757 | (6,907,079) | (4,466,561) | (17,214,150) | (9,483,639) | |||||||||||||||||||||||||||
| Inventory | (5,597,845) | — | — | (5,597,845) | — | |||||||||||||||||||||||||||
| Prepaid expenses and other assets | 1,145,031 | (40,823) | 360,772 | (1,163,509) | (541,920) | |||||||||||||||||||||||||||
| Accounts payable | 16,816,386 | 27,144,096 | 7,119,652 | 50,808,461 | 15,449,215 | |||||||||||||||||||||||||||
| Settlement of asset retirement obligation | (193,036) | (881,768) | (404,053) | (2,741,380) | (2,186,832) | |||||||||||||||||||||||||||
| Net Cash Provided by Operating Activities | 63,641,506 | 68,172,808 | 23,207,773 | 196,976,729 | 72,731,212 | |||||||||||||||||||||||||||
| Cash Flows From Investing Activities | ||||||||||||||||||||||||||||||||
| Payments for the Stronghold Acquisition | 5,535,839 | (183,359,626) | — | (177,823,787) | — | |||||||||||||||||||||||||||
| Payments to purchase oil and natural gas properties | (352,012) | (467,840) | (789,281) | (1,563,703) | (1,368,437) | |||||||||||||||||||||||||||
| Payments to develop oil and natural gas properties | (45,556,105) | (34,121,878) | (16,621,196) | (129,332,155) | (51,302,131) | |||||||||||||||||||||||||||
| Payments to acquire or improve fixed assets subject to depreciation | (161,347) | (66,838) | 40,801 | (319,945) | (568,832) | |||||||||||||||||||||||||||
| Sale of fixed assets subject to depreciation | — | — | — | 134,600 | — | |||||||||||||||||||||||||||
| Proceeds from divestiture of oil and natural gas properties | (1,366) | — | — | 23,700 | 2,000,000 | |||||||||||||||||||||||||||
| Net Cash (Used in) Investing Activities | (40,534,991) | (218,016,182) | (17,369,676) | (308,881,290) | (51,239,400) | |||||||||||||||||||||||||||
| Cash Flows From Financing Activities | ||||||||||||||||||||||||||||||||
| Proceeds from revolving line of credit | 44,000,000 | 541,500,000 | 25,750,000 | 636,000,000 | 60,150,000 | |||||||||||||||||||||||||||
| Payments on revolving line of credit | (64,000,000) | (376,500,000) | (30,750,000) | (511,000,000) | (83,150,000) | |||||||||||||||||||||||||||
| Proceeds from issuance of common stock and warrants | 640,000 | 2,400,000 | 126,240 | 8,203,126 | 367,509 | |||||||||||||||||||||||||||
| Proceeds from option exercise | — | — | 200,000 | — | 200,000 | |||||||||||||||||||||||||||
| Payments for taxes withheld on vested restricted shares | (256,715) | (6,790) | (385,330) | (521,199) | (385,330) | |||||||||||||||||||||||||||
| Proceeds from notes payable | 78,051 | 316,677 | 64,580 | 1,323,354 | 1,297,718 | |||||||||||||||||||||||||||
| Payments on notes payable | (455,802) | (333,341) | (335,321) | (1,409,884) | (711,308) | |||||||||||||||||||||||||||
| Payment of deferred financing costs | (129,026) | (18,762,502) | (27,931) | (18,891,528) | (104,818) | |||||||||||||||||||||||||||
| Reduction of financing lease liabilities | (161,064) | (103,392) | (118,965) | (495,098) | (325,901) | |||||||||||||||||||||||||||
| Net Cash (Used in) Financing Activities | (20,284,556) | 148,510,652 | (5,476,727) | 113,208,771 | (22,662,130) | |||||||||||||||||||||||||||
| Net Increase (Decrease) in Cash | 2,821,959 | (1,332,722) | 361,370 | 1,304,210 | (1,170,318) | |||||||||||||||||||||||||||
| Cash at Beginning of Period | 890,567 | 2,223,289 | 2,046,946 | 2,408,316 | 3,578,634 | |||||||||||||||||||||||||||
| Cash at End of Period | $ | 3,712,526 | $ | 890,567 | $ | 2,408,316 | $ | 3,712,526 | $ | 2,408,316 | ||||||||||||||||||||||
20
RING ENERGY, INC.
Financial Commodity Derivative Positions
As of December 31, 2022
The following table reflects the prices of contracts outstanding as of December 31, 2022 (Quantities are in barrels of the oil derivative contracts and in million British thermal units (MMBtu) for the natural gas derivative contracts.):
| Oil Hedges (WTI) | |||||||||||
| 2023 | 2024 | ||||||||||
| Swaps: | |||||||||||
| Hedged volume (Bbl) | 389,250 | 894,000 | |||||||||
| Weighted average swap price | $ | 77.55 | $ | 66.94 | |||||||
| Deferred premium puts: | |||||||||||
| Hedged volume (Bbl) | 773,500 | 91,000 | |||||||||
| Weighted average strike price | $ | 90.64 | $ | 83.75 | |||||||
| Weighted average deferred premium price | $ | 15.25 | $ | 17.32 | |||||||
| Two-way collars: | |||||||||||
| Hedged volume (Bbl) | 487,622 | 475,350 | |||||||||
| Weighted average put price | $ | 52.16 | $ | 67.88 | |||||||
| Weighted average call price | $ | 62.94 | $ | 83.32 | |||||||
| Three-way collars: | |||||||||||
| Hedged volume (Bbl) | 66,061 | — | |||||||||
| Weighted average first put price | $ | 45.00 | $ | — | |||||||
| Weighted average second put price | $ | 55.00 | $ | — | |||||||
| Weighted average call price | $ | 80.05 | $ | — | |||||||
| Gas Hedges (Henry Hub) | |||||||||||
| 2023 | 2024 | ||||||||||
| NYMEX Swaps: | |||||||||||
| Hedged volume (MMBtu) | 159,890 | 552,000 | |||||||||
| Weighted average swap price | $ | 2.40 | $ | 4.61 | |||||||
Two-way collars:(1) | |||||||||||
| Hedged volume (MMBtu) | 2,258,317 | 1,712,250 | |||||||||
| Weighted average put price | $ | 3.18 | $ | 4.00 | |||||||
| Call hedged volume (MMBtu) | 2,140,317 | 1,712,250 | |||||||||
| Weighted average call price | $ | 4.89 | $ | 6.29 | |||||||
21
RING ENERGY, INC.
Financial Commodity Derivative Positions
As of December 31, 2022
| Gas Hedges (basis differential) | |||||||||||
| 2023 | 2024 | ||||||||||
| Waha basis swaps: | |||||||||||
| Hedged volume (MMBtu) | 1,339,685 | — | |||||||||
| Weighted average swap price | X(2) | $ | — | ||||||||
(1)The two-way collars for the first quarter of 2023 include 2x1 collars where the put volumes of 236,000 are two times the call volumes of 118,000.
(2)The WAHA basis swaps in place for the calendar year of 2023 consist of two derivative contracts, each with a fixed price of the Henry Hub natural gas price less a fixed amount (weighted average of $0.55 per MMBtu).
RING ENERGY, INC.
Non-GAAP Information
Certain financial information included in Ring’s financial results are not measures of financial performance recognized by accounting principles generally accepted in the United States, or GAAP. These non-GAAP financial measures are “Adjusted Net Income”, “Adjusted EBITDA”, “Free Cash Flow” and “Cash Flow from Operations”. Management uses these non-GAAP financial measures in its analysis of performance. In addition, Adjusted EBITDA is a key metric used to determine the Company’s incentive compensation awards. These disclosures may not be viewed as a substitute for results determined in accordance with GAAP and are not necessarily comparable to non-GAAP performance measures which may be reported by other companies.
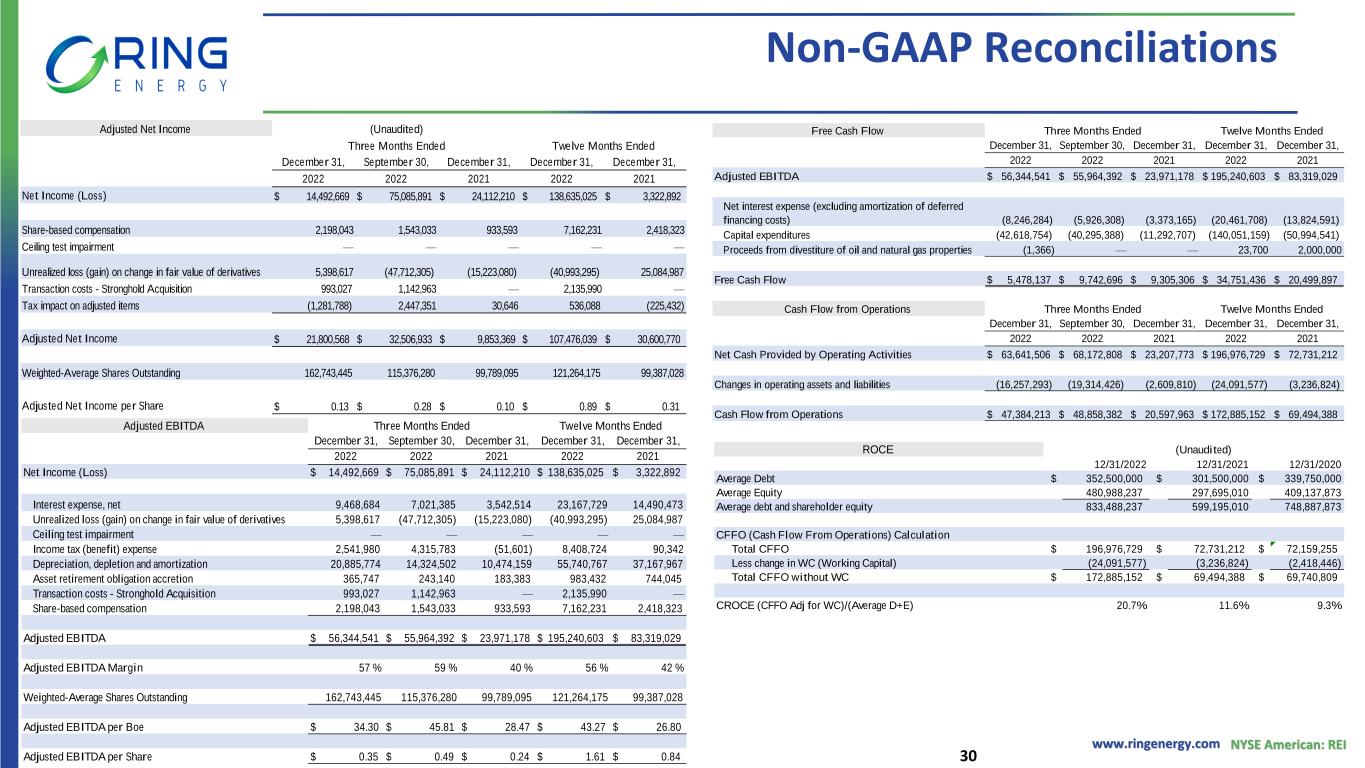
Reconciliation of Net Income (Loss) to Adjusted Net Income
Adjusted Net Income does not include the estimated after-tax impact of share-based compensation, ceiling test impairment, and unrealized loss (gain) on change in fair value of derivatives. Adjusted Net Income is presented because the timing and amount of these items cannot be reasonably estimated and affect the comparability of operating results from period to period, and current periods to prior periods.
22
| (Unaudited) | |||||||||||||||||||||||||||||
| Three Months Ended | Twelve Months Ended | ||||||||||||||||||||||||||||
| December 31, | September 30, | December 31, | December 31, | December 31, | |||||||||||||||||||||||||
| 2022 | 2022 | 2021 | 2022 | 2021 | |||||||||||||||||||||||||
| Net Income | $ | 14,492,669 | $ | 75,085,891 | $ | 24,112,210 | $ | 138,635,025 | $ | 3,322,892 | |||||||||||||||||||
| Share-based compensation | 2,198,043 | 1,543,033 | 933,593 | 7,162,231 | 2,418,323 | ||||||||||||||||||||||||
| Ceiling test impairment | — | — | — | — | — | ||||||||||||||||||||||||
| Unrealized loss (gain) on change in fair value of derivatives | 5,398,617 | (47,712,305) | (15,223,080) | (40,993,295) | 25,084,987 | ||||||||||||||||||||||||
| Transaction costs - Stronghold Acquisition | 993,027 | 1,142,963 | — | 2,135,990 | — | ||||||||||||||||||||||||
| Tax impact on adjusted items | (1,281,788) | 2,447,351 | 30,646 | 536,088 | (225,432) | ||||||||||||||||||||||||
| Adjusted Net Income | $ | 21,800,568 | $ | 32,506,933 | $ | 9,853,369 | $ | 107,476,039 | $ | 30,600,770 | |||||||||||||||||||
| Weighted-Average Shares Outstanding | 162,743,445 | 115,376,280 | 99,789,095 | 121,264,175 | 99,387,028 | ||||||||||||||||||||||||
| Adjusted Net Income per Share | $ | 0.13 | $ | 0.29 | $ | 0.10 | $ | 0.89 | $ | 0.31 | |||||||||||||||||||
Reconciliations of Adjusted EBITDA, Free Cash Flow and Cash Flow from Operations
The Company also presents the non-GAAP financial measures Adjusted EBITDA and Free Cash Flow. The Company defines Adjusted EBITDA as net income (loss) plus net interest expense, unrealized loss (gain) on change in fair value of derivatives, ceiling test impairment, income tax (benefit) expense, depreciation, depletion and amortization, asset retirement obligation accretion and share-based compensation. Company management believes this presentation is relevant and useful because it helps investors understand Ring’s operating performance and makes it easier to compare its results with those of other companies that have different financing, capital and tax structures. Adjusted EBITDA should not be considered in isolation from or as a substitute for net income, as an indication of operating performance or cash flows from operating activities or as a measure of liquidity. Adjusted EBITDA, as Ring calculates it, may not be comparable to Adjusted EBITDA measures reported by other companies. In addition, Adjusted EBITDA does not represent funds available for discretionary use.
The Company defines Free Cash Flow as Adjusted EBITDA (defined above) less net interest expense (excluding amortization of deferred financing cost), capital expenditures and proceeds from divestiture of oil and natural gas properties. For this purpose, the Company’s definition of capital expenditures includes costs incurred related to oil and natural gas properties (such as drilling and infrastructure costs and the lease maintenance costs) and equipment, furniture and fixtures, but excludes acquisition costs of oil and gas properties from third parties that are not included in the Company’s capital expenditures guidance provided to investors. Company management believes that Free Cash Flow is an important financial performance measure for use in evaluating the performance and efficiency of its current operating activities after the impact of accrued capital expenditures and net interest expense and without being impacted by items such as changes associated with working capital, which can vary substantially from one period to another. There is no commonly accepted definition Free Cash Flow within the industry. Accordingly, Free Cash Flow, as defined and calculated by the Company, may not be comparable to Free Cash Flow or other similarly named non-GAAP measures reported by other companies. While the Company includes net interest expense in the calculation of Free Cash Flow, other mandatory debt service requirements of future payments of principal at maturity (if such debt is not refinanced) are
23
excluded from the calculation of Free Cash Flow. These and other non-discretionary expenditures that are not deducted from Free Cash Flow would reduce cash available for other uses.
The following tables present (i) a reconciliation of the Company’s net income (loss), a GAAP measure, to Adjusted EBITDA and (ii) a reconciliation of Adjusted EBITDA, a non-GAAP measure, to Free Cash Flow, as both Adjusted EBITDA and Free Cash Flow are defined by the Company. In addition, a reconciliation of cash flow from operations is presented.
| (Unaudited for All Periods) | |||||||||||||||||||||||||||||
| Three Months Ended | Twelve Months Ended | ||||||||||||||||||||||||||||
| December 31, | September 30, | December 31, | December 31, | December 31, | |||||||||||||||||||||||||
| 2022 | 2022 | 2021 | 2022 | 2021 | |||||||||||||||||||||||||
| Net Income (Loss) | $ | 14,492,669 | $ | 75,085,891 | $ | 24,112,210 | $ | 138,635,025 | $ | 3,322,892 | |||||||||||||||||||
| Interest expense, net | 9,468,684 | 7,021,385 | 3,542,514 | 23,167,729 | 14,490,473 | ||||||||||||||||||||||||
| Unrealized loss (gain) on change in fair value of derivatives | 5,398,617 | (47,712,305) | (15,223,080) | (40,993,295) | 25,084,987 | ||||||||||||||||||||||||
| Ceiling test impairment | — | — | — | — | — | ||||||||||||||||||||||||
| Income tax (benefit) expense | 2,541,980 | 4,315,783 | (51,601) | 8,408,724 | 90,342 | ||||||||||||||||||||||||
| Depreciation, depletion and amortization | 20,885,774 | 14,324,502 | 10,474,159 | 55,740,767 | 37,167,967 | ||||||||||||||||||||||||
| Asset retirement obligation accretion | 365,747 | 243,140 | 183,383 | 983,432 | 744,045 | ||||||||||||||||||||||||
| Transaction costs - Stronghold Acquisition | 993,027 | 1,142,963 | — | 2,135,990 | — | ||||||||||||||||||||||||
| Share-based compensation | 2,198,043 | 1,543,033 | 933,593 | 7,162,231 | 2,418,323 | ||||||||||||||||||||||||
| Adjusted EBITDA | $ | 56,344,541 | $ | 55,964,392 | $ | 23,971,178 | $ | 195,240,603 | $ | 83,319,029 | |||||||||||||||||||
| Adjusted EBITDA Margin | 57 | % | 59 | % | 40 | % | 56 | % | 42 | % | |||||||||||||||||||
| Weighted-Average Shares Outstanding | 162,743,445 | 115,376,280 | 99,789,095 | 121,264,175 | 99,387,028 | ||||||||||||||||||||||||
| Adjusted EBITDA per Share | $ | 0.35 | $ | 0.49 | $ | 0.24 | $ | 1.61 | $ | 0.84 | |||||||||||||||||||
24
| (Unaudited for All Periods) | |||||||||||||||||||||||||||||
| Three Months Ended | Twelve Months Ended | ||||||||||||||||||||||||||||
| December 31, | September 30, | December 31, | December 31, | December 31, | |||||||||||||||||||||||||
| 2022 | 2022 | 2021 | 2022 | 2021 | |||||||||||||||||||||||||
| Adjusted EBITDA | $ | 56,344,541 | $ | 55,964,392 | $ | 23,971,178 | $ | 195,240,603 | $ | 83,319,029 | |||||||||||||||||||
| Net interest expense (excluding amortization of deferred financing costs) | (8,246,284) | (5,926,308) | (3,373,165) | (20,461,708) | (13,824,591) | ||||||||||||||||||||||||
| Capital expenditures | (42,618,754) | (40,295,388) | (11,292,707) | (140,051,159) | (50,994,541) | ||||||||||||||||||||||||
| Proceeds from divestiture of oil and natural gas properties | (1,366) | — | — | 23,700 | 2,000,000 | ||||||||||||||||||||||||
| Free Cash Flow | $ | 5,478,137 | $ | 9,742,696 | $ | 9,305,306 | $ | 34,751,436 | $ | 20,499,897 | |||||||||||||||||||
| (Unaudited for All Periods) | |||||||||||||||||||||||||||||
| Three Months Ended | Twelve Months Ended | ||||||||||||||||||||||||||||
| December 31, | September 30, | December 31, | December 31, | December 31, | |||||||||||||||||||||||||
| 2022 | 2022 | 2021 | 2022 | 2021 | |||||||||||||||||||||||||
| Net Cash Provided by Operating Activities | $ | 63,641,506 | $ | 68,172,808 | $ | 23,207,773 | $ | 196,976,729 | $ | 72,731,212 | |||||||||||||||||||
| Changes in operating assets and liabilities | (16,257,293) | (19,314,426) | (2,609,810) | (24,091,577) | (3,236,824) | ||||||||||||||||||||||||
| Cash Flow from Operations | $ | 47,384,213 | $ | 48,858,382 | $ | 20,597,963 | $ | 172,885,152 | $ | 69,494,388 | |||||||||||||||||||
25