rei-20230503
FALSE000138419500013841952023-05-032023-05-03

UNITED STATES
SECURITIES AND EXCHANGE COMMISSION
Washington, D.C. 20549
_____________________________________________________________________________________________________________________________________________________________________________

FORM 8-K
_____________________________________________________________________________________________________________________________________________________________________________

CURRENT REPORT

Pursuant to Section 13 or 15(d)
of the Securities Exchange Act of 1934

Date of Report: May 3, 2023
(Date of earliest event reported)
______________________________________________________________________________________
RING ENERGY, INC.
(Exact name of registrant as specified in its charter)
_______________________________________________________________________________________________________

Nevada
001-36057
90-0406406
(State or other jurisdiction of incorporation)
(Commission File Number)
(IRS Employer Identification No.)
1725 Hughes Landing Blvd., Suite 900
The Woodlands, TX 77380
(Address of principal executive offices) (Zip Code)

(281) 397-3699
(Registrant’s telephone number, including area code)

Not Applicable.
(Former name or former address, if changed since last report)

Check the appropriate box below if the Form 8-K filing is intended to simultaneously satisfy the filing obligation of the registrant under any of the following provisions:
Written communications pursuant to Rule 425 under the Securities Act (17 CFR 230.425)
Soliciting material pursuant to Rule 14a-12 under the Exchange Act (17 CFR 240.14a-12)
Pre-commencement communications pursuant to Rule 14d-2(b) under the Exchange Act (17 CFR 240.14d-2(b))
Pre-commencement communications pursuant to Rule 13e-4(c) under the Exchange Act (17 CFR 240.13e-4(c))
Securities registered pursuant to Section 12(b) of the Act:
Title of each class
Trading Symbol(s)
Name of each exchange on which registered
Common Stock, $0.001 par value
REI
NYSE American

Indicate by check mark whether the registrant is an emerging growth company as defined in Rule 405 of the Securities Act of 1933 (§230.405 of this chapter) or Rule 12b-2 of the Securities Exchange Act of 1934 (§240.12b-2 of this chapter).

Emerging growth company
If an emerging growth company, indicate by check mark if the registrant has elected not to use the extended transition period for complying with any new or revised financial accounting standards provided pursuant to Section 13(a) of the Exchange Act. ☐


Item 2.02 Results of Operations and Financial Condition.

On May 3, 2023, Ring Energy, Inc. (the “Company”) issued a press release announcing its financial and operating results for the first quarter ended March 31, 2023. A copy of the press release is furnished herewith as Exhibit 99.1.

The information in this Current Report on Form 8-K furnished pursuant to Item 2.02, including Exhibit 99.1, shall not be deemed to be “filed” for the purposes of Section 18 of the Securities Exchange Act of 1934, as amended (the “Exchange Act”), or otherwise subject to liability under that section, and they shall not be deemed incorporated by reference in any filing under the Securities Act of 1933, as amended (the “Securities Act”), or the Exchange Act, except as shall be expressly set forth by specific reference in such filing.

Item 7.01 Regulation FD Disclosure.

On May 4, 2023, the Company posted to its website a company presentation (the “Presentation Materials”) that management intends to use from time to time. The Company may use the Presentation Materials, possibly with modifications, in presentations to current and potential investors, lenders, creditors, vendors, customers and others with an interest in the Company and its business.

The information contained in the Presentation Materials is summary information that should be considered in the context of the Company’s filings with the Securities and Exchange Commission and other public announcements that the Company may make by press release or otherwise from time to time. The Presentation Materials speak as of the date of this Current Report on Form 8-K. While the Company may elect to update the Presentation Materials in the future or reflect events and circumstances occurring or existing after the date of this Current Report on Form 8-K, the Company specifically disclaims any obligation to do so. The Presentation Materials are furnished herewith as Exhibit 99.2 to this Current Report on Form 8-K and are incorporated herein by reference.

The information in this Current Report on Form 8-K furnished pursuant to Item 7.01, including Exhibit 99.2, shall not be deemed to be “filed” for the purposes of Section 18 of the Exchange Act, or otherwise subject to liability under that section, and they shall not be deemed incorporated by reference in any filing under the Securities Act or the Exchange Act, except as shall be expressly set forth by specific reference in such filing. By filing this Current Report on Form 8-K and furnishing this information pursuant to Item 7.01, the Company makes no admission as to the materiality of any information in this Current Report on Form 8-K, including Exhibit 99.2, that is required to be disclosed solely by Regulation FD.

Item 9.01 Financial Statements and Exhibits.

(d) Exhibits.

The following exhibits are included with this Current Report on Form 8-K:

Exhibit No.
Description
99.1
99.2
104Cover Page Interactive Data File (embedded within the Inline XBRL document).


SIGNATURE

Pursuant to the requirements of the Securities Exchange Act of 1934, the registrant has duly caused this report to be signed on its behalf by the undersigned hereunto duly authorized.

RING ENERGY, INC.

Date:
May 4, 2023
By:
/s/ Travis T. Thomas
Travis T. Thomas
Chief Financial Officer


Exhibit 99.1
reisymbol.jpg

[NOT] FOR IMMEDIATE RELEASE NYSE American – REI

RING ENERGY ANNOUNCES FIRST QUARTER 2023 RESULTS AND REITERATES FULL YEAR 2023 GUIDANCE

~ Produced Record Sales Volumes at High End of Guidance Range ~

The Woodlands, TX – May 3, 2023 – Ring Energy, Inc. (NYSE American: REI) (“Ring” or the “Company”) today reported operational and financial results for the first quarter of 2023. In addition, the Company provided second quarter guidance and reiterated its full year 2023 outlook.
First Quarter 2023 Highlights and Recent Key Items
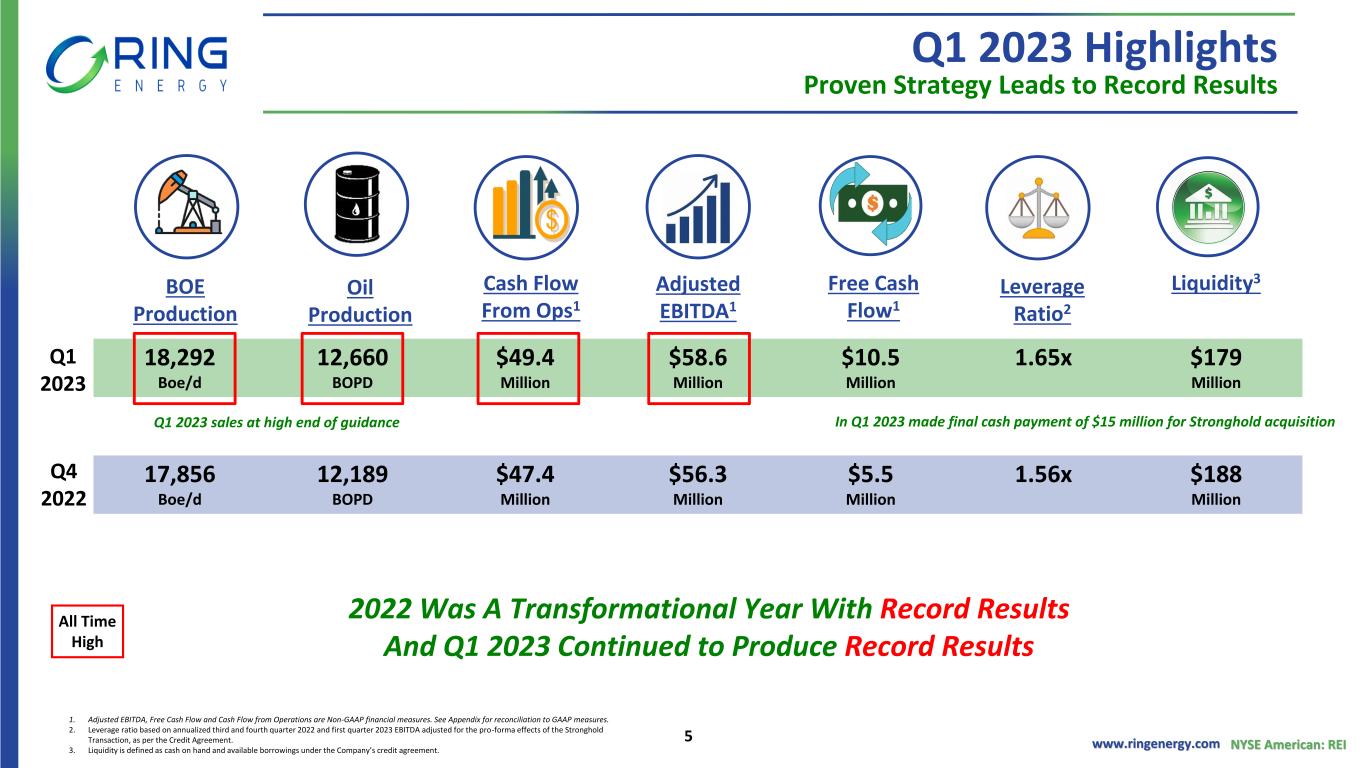
Grew first quarter 2023 sales volumes 2% to a record 18,292 barrels of oil equivalent per day (“Boe/d”) (69% oil) from 17,856 Boe/d (68% oil) for the fourth quarter of 2022;
First quarter 2023 sales volumes were at the high-end of the Company’s guidance range of 17,800 to 18,300 Boe/d;
Reported net income of $32.7 million, or $0.17 per diluted share, in the first quarter of 2023, versus net income of $14.5 million, or $0.08 per diluted share’ in the fourth quarter of 2022;
First quarter 2023 included a gain on derivative contracts of $9.5 million while fourth quarter 2022 included a loss on derivative contracts of $19.3 million;
Increased Adjusted Net Income1 by 15% to $25.0 million, or $0.14 per share, for the first quarter of 2023 from $21.8 million, or $0.13 per share, in the fourth quarter of 2022;
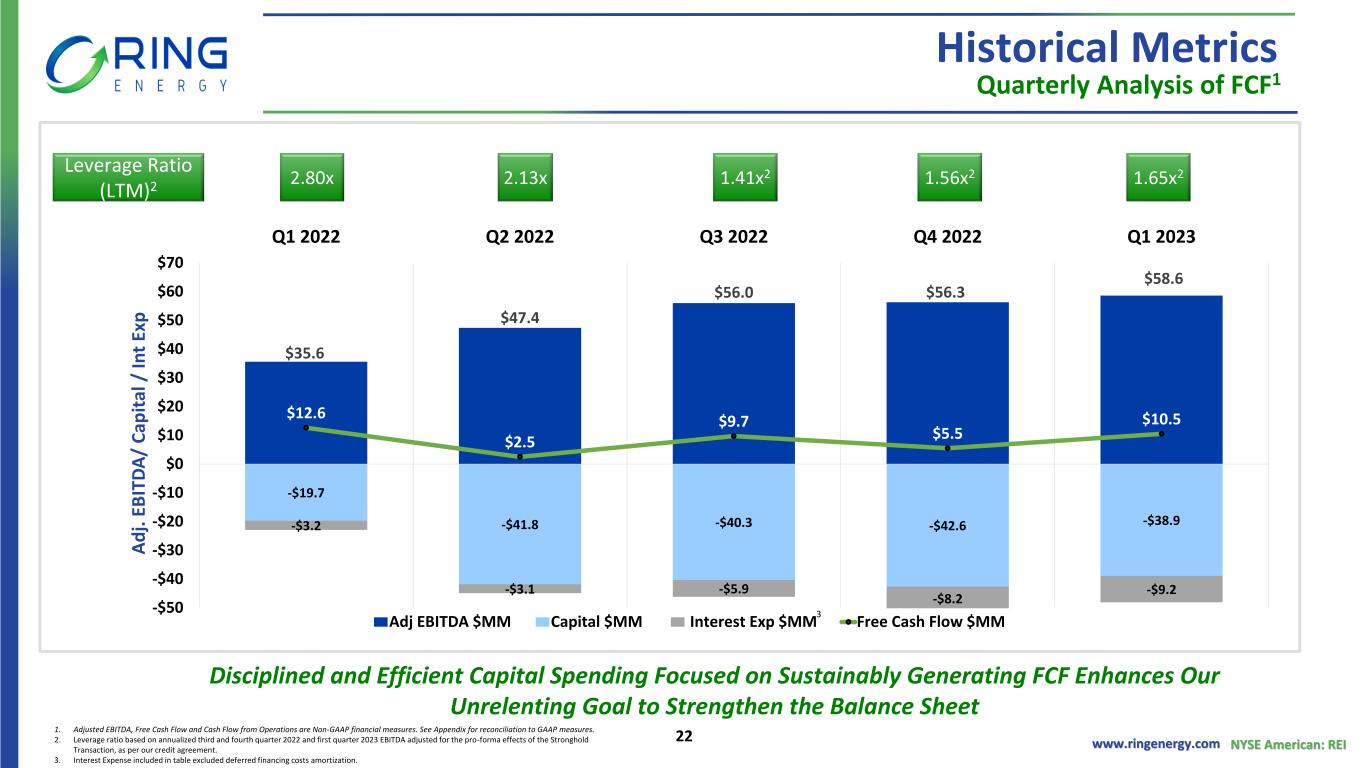
Generated record Adjusted EBITDA1 of $58.6 million for the first quarter of 2023, which was 4% higher than the previous record set in the fourth quarter of 2022 of $56.3 million;
Delivered Free Cash Flow1 of $10.5 million and record Cash Flow from Operations1 of $49.4 million in the first quarter of 2023;
1A non-GAAP financial measure; see “Non-GAAP Information” section in this release for more information including reconciliations to the most comparable GAAP measures.
1


Remained cash flow positive for the 14th consecutive quarter;
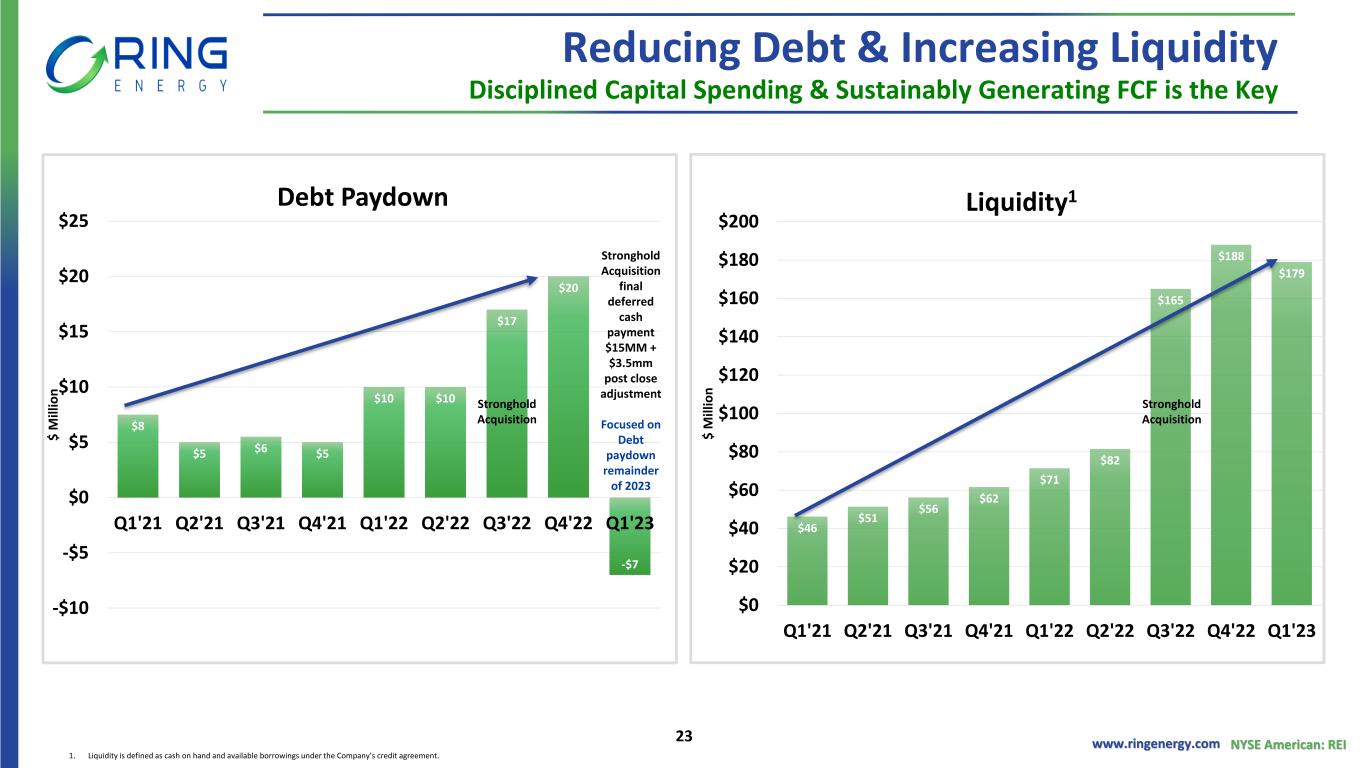
Ended first quarter 2023 with liquidity of $179.0 million and a Leverage Ratio2 of 1.65x;
Under the terms of the Stronghold property acquisition (the “Stronghold Transaction”) that closed on August 31, 2022, Ring made the final deferred purchase price payment of $15.0 million during the first quarter of 2023 and a payment of $3.5 million for post-closing adjustments;
Commenced its 2023 development program in January, including drilling and completing four horizontal (“Hz”) wells in the Northwest Shelf (“NWS”) and three vertical wells in the Central Basin Platform (“CBP”), as well as performed six recompletions in the CBP;
Provided guidance for the second quarter and reiterated its full year 2023 outlook for sales volumes, operating expenses and capital spending;
Expects second quarter 2023 sales volumes of 17,900 to 18,400 Boe/d and full year 2023 sales volumes of 17,800 to 18,800 Boe/d; and
Entered into agreements in April 2023 with certain holders of the Company’s outstanding warrants for the early exercise of an aggregate of 14.5 million warrants to purchase a like amount of common shares at a reduced exercise price of $0.62 per share (original exercise price of $0.80 per share) that resulted in gross cash proceeds of approximately $9.0 million. Following the full exercise, approximately 78,200 warrants to purchase shares of Ring Common Stock remained outstanding.
Mr. Paul D. McKinney, Chairman of the Board and Chief Executive Officer, commented, “Our first quarter operational and financial results mark a positive start to 2023. Supported by the benefits of the Stronghold Transaction executed in the second half of 2022 and the continued performance of our legacy assets, we delivered record sales volumes during the first quarter and generated record Adjusted EBITDA and Cash Flow from Operations, despite a decrease in realized oil and natural gas pricing.”
Mr. McKinney continued, “Our immediate focus is on the efficient execution of our 2023 capital spending program and maximizing our Free Cash Flow to pay down debt. During the first quarter, we drilled and completed seven wells and recompleted six wells and the collective results were at the high end of our production guidance for the period. We intend to remain
2 Based on annualized third and fourth quarter 2022 and first quarter 2023 EBITDA adjusted for the pro-forma effects of the Stronghold Transaction, as per our Credit Agreement.
2


focused and disciplined in this regard for the rest of the year, prioritizing capital to high rate-of-return drilling and recompletion projects, which should allow us to maintain or slightly grow our production over fourth quarter 2022 levels. We believe targeting excess Free Cash Flow to pay down debt will drive long-term value for our stockholders.”
Mr. McKinney concluded, “Looking forward, we are committed to positioning the Company to return capital to stockholders and our efforts, both short-term and long, are planned with this in mind. We have in the past shared our belief that our stock will be more appealing to a wider cross-section of the investment community with greater size and scale. We have also said that our absolute debt level justifies our continued focus on improving the balance sheet. These two beliefs drive our strategic focus on pursuing accretive, balance sheet enhancing acquisitions and maximizing Free Cash Flow through our organic capital spending plans and current budget. The Stronghold acquisition is an example of the transformational impact a strategic transaction can have on improving per-share metrics and the balance sheet. Our recent announcement concerning the accelerated exercise of outstanding warrants is another transaction supporting this strategy. By simplifying and enhancing our capital structure through those transactions, we increased the Company’s public float, accelerated debt pay-down, and we believe trading liquidity in our stock should improve. So the bottom line is this, we believe staying the course with our sense of urgency, our resolve, and our commitment to our value focused, proven strategy better prepares the Company to manage the risks and uncertainties associated with the price volatility our industry experiences and will generate sustainable and competitive returns for our stockholders.”
Financial Overview: For the first quarter of 2023, the Company reported net income of $32.7 million, or $0.17 per diluted share, which included a $10.1 million before tax non-cash unrealized commodity derivative gain and $1.9 million in before tax share-based compensation. Excluding the estimated after-tax impact of the adjustments, the Company’s Adjusted Net Income was $25.0 million, or $0.14 per share. In the fourth quarter of 2022, the Company reported net income of $14.5 million, or $0.08 per diluted share, which included a $5.4 million before tax non-cash unrealized commodity derivative loss, $2.2 million for before tax share-based compensation, and $1.0 million in before tax transaction related costs for the Stronghold Transaction (“Transaction Costs”) that closed on August 31, 2022. Excluding the estimated after-tax impact of these adjustments, the Company’s Adjusted Net Income for the fourth quarter of 2022 was $21.8 million, or $0.13 per share. For the first quarter of 2022, Ring reported net
3


income of $7.1 million, or $0.06 per diluted share, which included a $13.5 million before tax non-cash unrealized commodity derivative loss, and $1.5 million in before tax share-based compensation. Excluding the estimated after-tax impact of these adjustments, Adjusted Net Income in the first quarter of 2022 was $22.3 million, or $0.22 per share.
Adjusted EBITDA was $58.6 million for the first quarter of 2023, up 4% from $56.3 million for the fourth quarter of 2022, and 65% higher than $35.6 million for the first quarter of 2022.
Free Cash Flow for the first quarter of 2023 was $10.5 million, which was 92% higher than $5.5 million for the fourth quarter of 2022. First quarter 2023 Free Cash Flow decreased 16% from $12.6 million for the first quarter of 2022 primarily due to higher capital spending, lower realized pricing, and higher interest expense, which was partially offset by increased sales volumes.
Cash Flow from Operations was $49.4 million for the first quarter of 2023 compared to $47.4 million for the fourth quarter of 2022 and $32.3 million for the first quarter of 2022.
Adjusted Net Income, Adjusted EBITDA, Free Cash Flow, and Cash Flow from Operations are non-GAAP financial measures, which are described in more detail and reconciled to the most comparable GAAP measures, in the tables shown later in this release under “Non-GAAP Information.
Sales Volumes, Prices and Revenues: As a result of the Stronghold Transaction, beginning July 1, 2022, the Company began reporting revenues on a three-stream basis, separately reporting oil, natural gas, and natural gas liquids (“NGLs”) sales. For periods prior to July 1, 2022, sales and reserve volumes, prices, and revenues for NGLs were included in natural gas.
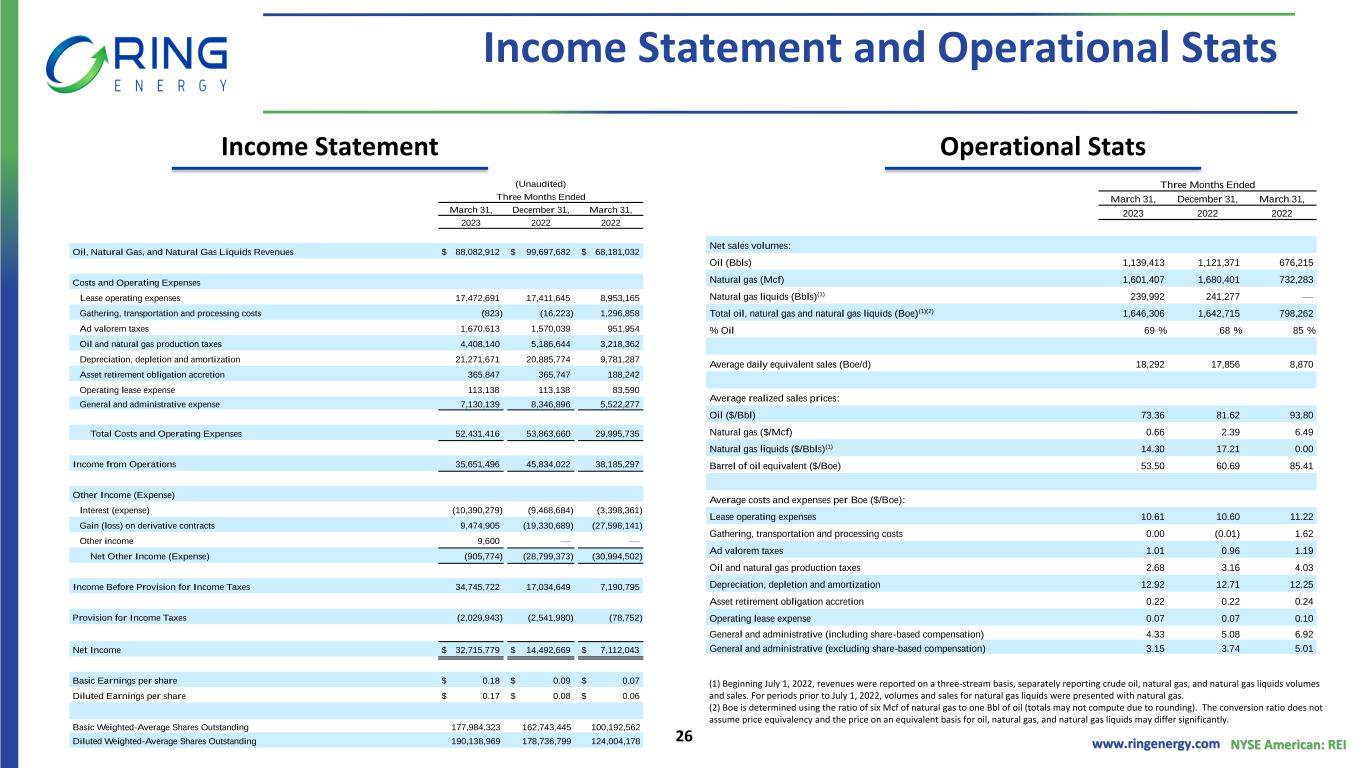
Sales volumes for the first quarter of 2023 were 18,292 Boe/d (69% oil, 16% natural gas and 15% NGLs), or 1,646,306 Boe, compared to 17,856 Boe/d (68% oil, 17% natural gas and 15% NGLs), or 1,642,715 Boe, for the fourth quarter of 2022, and 8,870 Boe/d (85% oil and 15% natural gas), or 798,262 Boe, in the first quarter of 2022. First quarter 2023 sales volumes were comprised of 1,139,413 barrels (“Bbls”) of oil, 1,601,407 thousand cubic feet (“Mcf”) of natural gas and 239,992 Bbls of NGLs.
For the first quarter of 2023, the Company realized an average sales price of $73.36 per barrel of crude oil, $0.66 per Mcf for natural gas and $14.30 per barrel of NGLs. The combined average realized sales price for the period was $53.50 per Boe, down 12% versus $60.69 per Boe for the fourth quarter of 2022, and down 37% from $85.41 per Boe in the first quarter of 2022. The average oil price differential the Company experienced from NYMEX WTI futures
4


pricing in the first quarter of 2023 was a negative $2.67 per barrel of crude oil, while the average natural gas price differential from NYMEX futures pricing was a negative $2.08 per Mcf.
Revenues were $88.1 million for the first quarter of 2023 compared to $99.7 million for the fourth quarter of 2022 and $68.2 million for the first quarter of 2022. The 12% decrease in first quarter 2023 revenues from the fourth quarter of 2022 was driven by lower realized pricing, partially offset by higher sales volumes.
Lease Operating Expense (“LOE”): LOE, which includes expensed workovers and facilities maintenance, was $17.5 million, or $10.61 per Boe, in the first quarter of 2023 versus $17.4 million, or $10.60 per Boe, in the fourth quarter of 2022 and $9.0 million, or $11.22 per Boe, for the first quarter of 2022.
Gathering, Transportation and Processing (“GTP”) Costs: As previously disclosed, due to a contractual change effective May 1, 2022, the Company no longer maintains ownership and control of natural gas through processing. As a result, GTP costs are now reflected as a reduction to the natural gas sales price and not as an expense item.
Ad Valorem Taxes: Ad valorem taxes were $1.01 per Boe for the first quarter of 2023 compared to $0.96 per Boe in the fourth quarter of 2022 and $1.19 per Boe for the first quarter of 2022.
Production Taxes: Production taxes were $2.68 per Boe in the first quarter of 2023 compared to $3.16 per Boe in the fourth quarter of 2022 and $4.03 per Boe in first quarter of 2022. Production taxes ranged between 4.7% to 5.2% of revenue for all three periods.
Depreciation, Depletion and Amortization (“DD&A”) and Asset Retirement Obligation Accretion: DD&A was $12.92 per Boe in the first quarter of 2023 versus $12.71 per Boe for the fourth quarter of 2022 and $12.25 per Boe in the first quarter of 2022. Asset retirement obligation accretion was $0.22 per Boe in the first quarter of 2023 compared to $0.22 per Boe for the fourth quarter of 2022 and $0.24 per Boe in the first quarter of 2022.
Operating Lease Expense: Operating lease expense was $113,138 for both the first quarter of 2023 and fourth quarter of 2022 and $83,590 in the first quarter of 2022. These expenses are primarily associated with the Company’s office leases.
General and Administrative Expenses (“G&A”): G&A, excluding non-cash share-based compensation, was $5.2 million ($3.15 per Boe), for the first quarter of 2023 versus $6.1 million
5


($3.74 per Boe) for the fourth quarter of 2022 and $4.0 million ($5.01 per Boe) for the first quarter of 2022. The fourth quarter of 2022 included Transaction Costs of $1.0 million. Adjusting for Transaction Costs, fourth quarter 2022 G&A, excluding non-cash share-based compensation, was $3.14 per Boe.
Interest Expense: Interest expense was $10.4 million in the first quarter of 2023 versus $9.5 million for the fourth quarter of 2022 and $3.4 million for the first quarter of 2022. Interest expense increased from the fourth quarter of 2022 primarily due to a higher interest rate on the Company’s revolving credit facility.
Derivative (Loss) Gain: In the first quarter of 2023, Ring recorded a net gain of $9.5 million on its commodity derivative contracts, including a realized $0.6 million cash commodity derivative loss and an unrealized $10.1 million non-cash commodity derivative gain. This compared to a net loss of $19.3 million in the fourth quarter of 2022, including a realized $13.9 million cash commodity derivative loss and an unrealized $5.4 million non-cash commodity derivative loss, and a net loss on commodity derivative contracts of $27.6 million in the first quarter of 2022, including a realized $14.1 million cash commodity derivative loss and an unrealized $13.5 million non-cash commodity derivative loss.
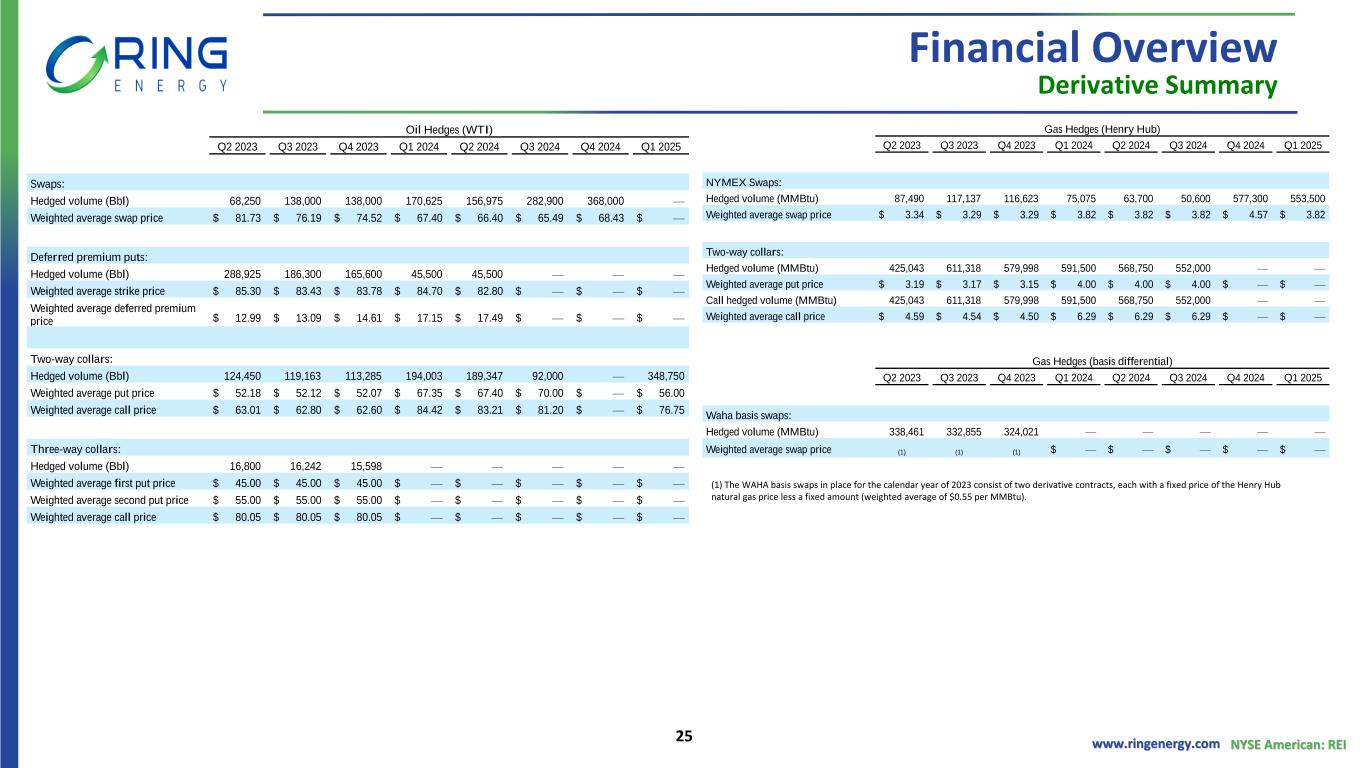
A summary listing of the Company’s outstanding derivative positions at March 31, 2023 is included in the tables shown later in this release.
For the remainder (April through December) of 2023, the Company has approximately 1.4 million barrels of oil (approximately 41% of oil sales guidance midpoint) hedged and approximately 1.9 billion cubic feet of natural gas (approximately 38% of natural gas sales guidance midpoint) hedged.
Income Tax: The Company recorded a non-cash income tax provision of $2.0 million in the first quarter of 2023 versus a non-cash income tax provision of $2.5 million in the fourth quarter of 2022 and a non-cash income tax provision of $0.1 million for the first quarter of 2022.
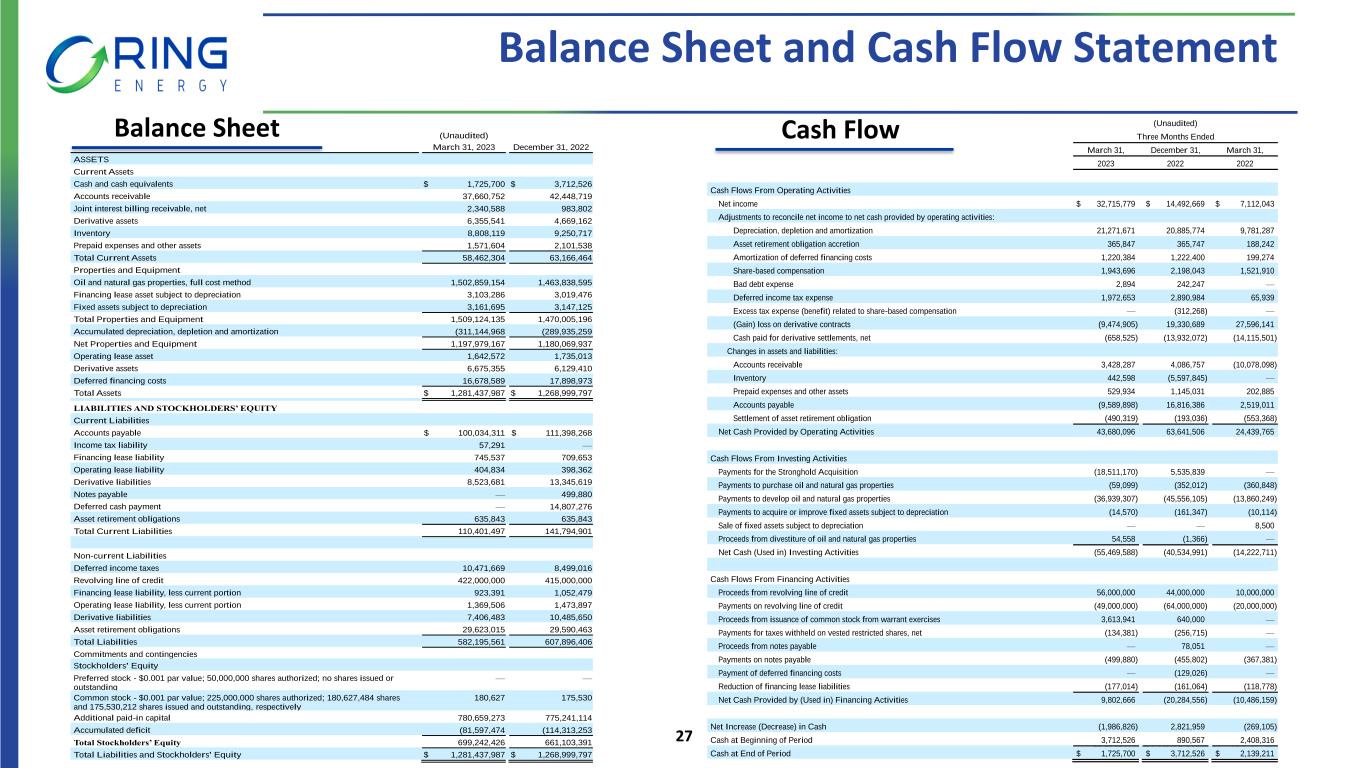
Balance Sheet and Liquidity: Total liquidity at the end of the first quarter of 2023 was $179.0 million, a 5% decrease from December 31, 2022 and a 151% increase from March 31, 2022. Liquidity at March 31, 2023 consisted of cash and cash equivalents of $1.7 million and $177.2 million of availability under Ring’s revolving credit facility, which includes a reduction of $0.8 million for letters of credit. On March 31, 2023, the Company had $422.0 million in borrowings outstanding on its revolving credit facility that has a current borrowing base of $600.0 million.
6


During the first quarter of 2023, Ring made a final deferred payment of $15.0 million under the terms of the Stronghold Transaction, along with a payment of $3.5 million for post closing adjustments. The Company is targeting further debt reduction during 2023 dependent on market conditions, the timing of capital spending and other considerations.
In April 2023, Ring entered into agreements with certain holders of the Company’s outstanding warrants for the early exercise of an aggregate of 14.5 million warrants for a like amount of common shares at a reduced exercise price of $0.62 per share (original exercise price of $0.80 per share) that resulted in gross cash proceeds of $9.0 million. Following the full exercise, approximately 78,200 warrants to purchase shares of Ring Common Stock remained outstanding.
Capital Expenditures: During the first quarter of 2023, capital expenditures on an accrual basis were $38.9 million as compared to Ring’s guidance of $36 million to $40 million. The Company drilled and completed two 1-mile Hz wells in the NWS, each with a 100% working interest (“WI”), and drilled and completed two 1.5-mile wells in the NWS, one with a WI of 99.8% and the other with a WI of 75.4%. Ring also drilled and completed three vertical wells in the CBP, each with a WI of 100%. Finally, the Company performed six vertical well recompletions in the CBP, each with a WI of 100%. Also included in first quarter 2023 capital spending were costs for capital workovers, infrastructure upgrades, and leasing costs.
QuarterAreaWells DrilledWells CompletedRecompletions
1Q 2023Central Basin Platform (Horizontal)
Central Basin Platform (Vertical)336
Northwest Shelf44
2023 Capital Investment, Sales Volumes, and Operating Expense Guidance
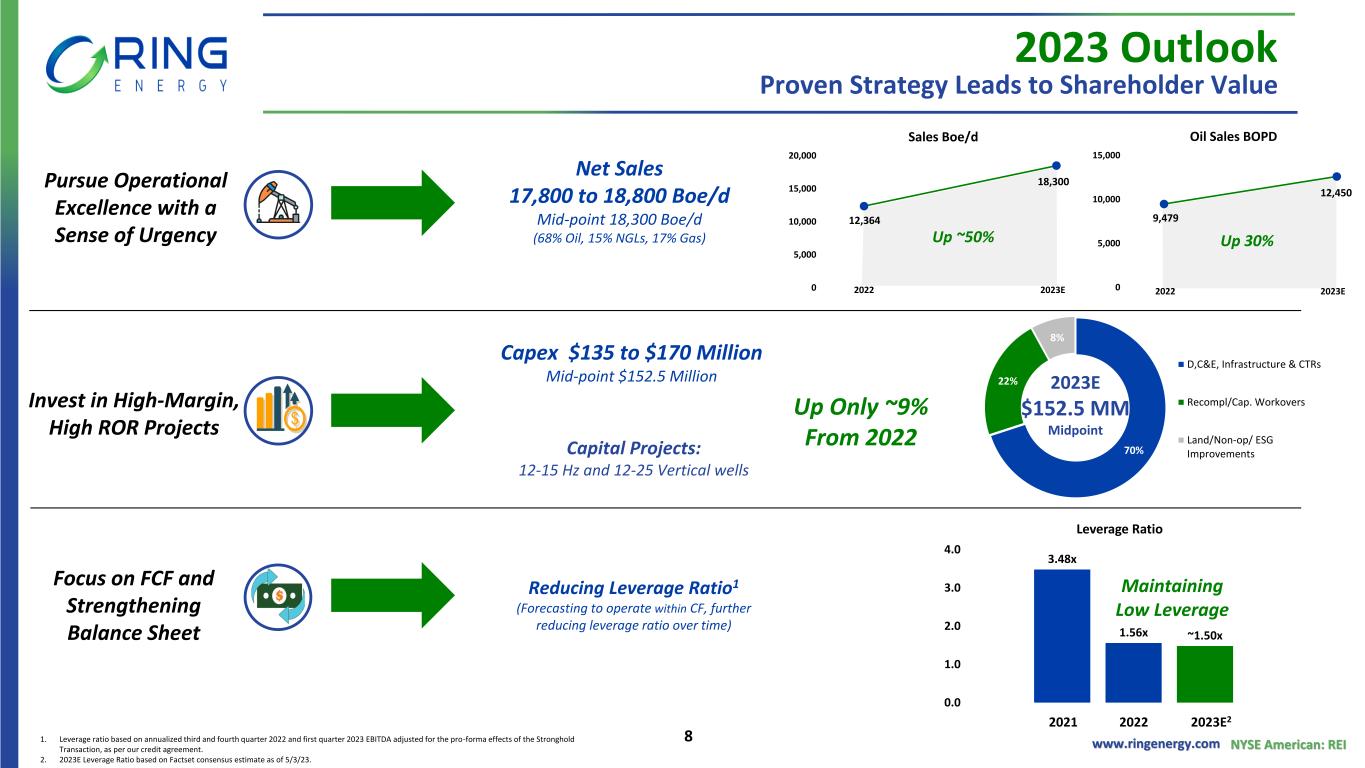
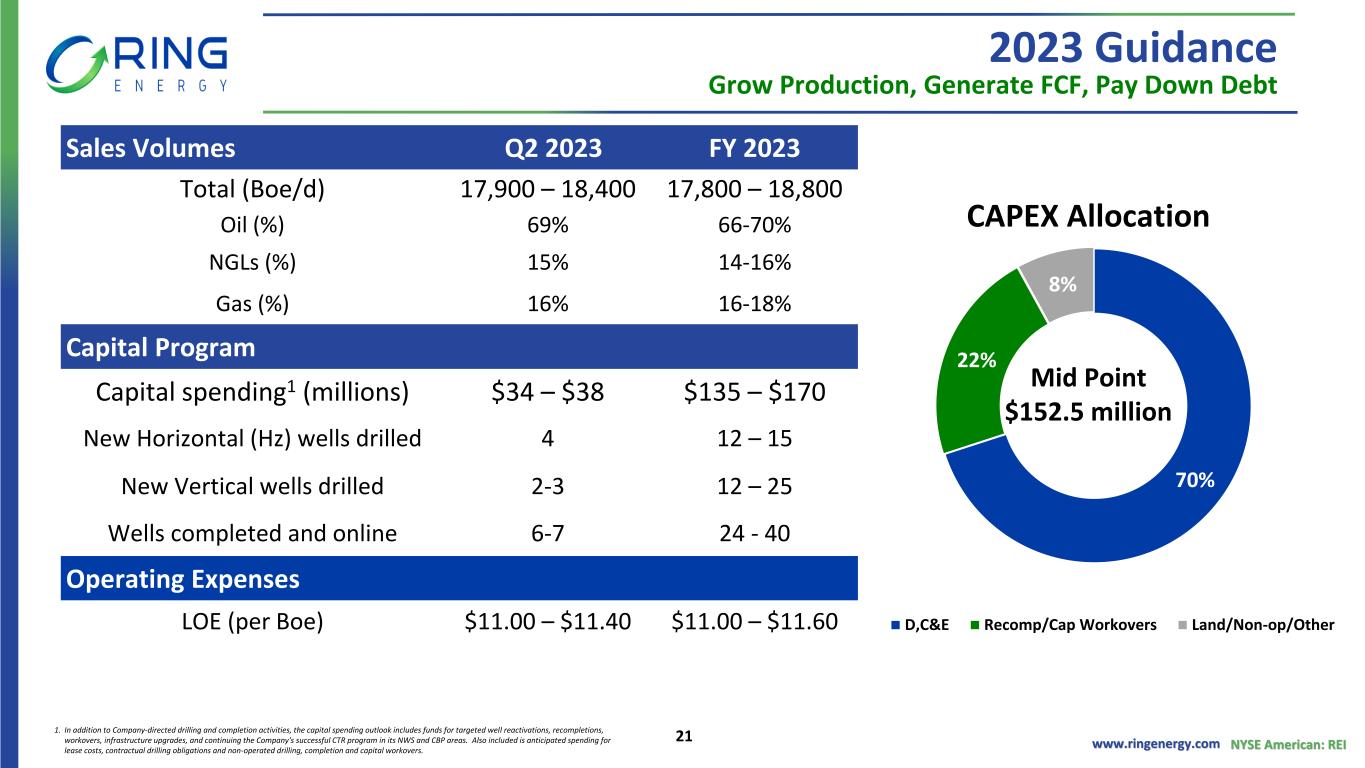
For full year 2023, Ring expects total capital spending of $135 million to $170 million that includes a balanced and capital efficient combination of drilling Hz wells on legacy acreage and vertical wells on the recently acquired CBP assets, as well as performing recompletions. Additionally, the full year capital spending program includes funds for targeted capital workovers, infrastructure upgrades, leasing costs, and non-operated drilling, completion, and capital workovers.
All projects and estimates are based on assumed WTI oil prices of $70 to $90 per barrel and Henry Hub prices of $2 to $3 per Mcf. As in the past, Ring has designed its spending program
7


with flexibility to respond to changes in commodity prices and other market conditions as appropriate.
Based on the $152.5 million mid-point of spending guidance, the Company expects the following estimated allocation of capital investment, including:
70% for drilling, completion, and related infrastructure;
22% for recompletions and capital workovers; and
8% for land, environmental, social and governance (“ESG”) and non-operated capital.
The Company remains squarely focused on continuing to generate Free Cash Flow in 2023. All 2023 planned capital expenditures will be fully funded by cash on hand and cash from operations, and excess Free Cash Flow is currently targeted for further debt reduction.
Supported by a full year of production from the Stronghold Transaction, its targeted development program and continued focus on operational excellence, the Company currently forecasts full year 2023 sales volumes of 17,800 to 18,800 Boe/d (68% oil, 17% natural gas, 15% NGLs), compared with full year 2022 average sales volumes of 18,292 Boe/d (69% oil, 31% natural gas & NGLs). Assuming the mid-point of its full year 2023 sales volumes guidance, Ring expects a 48% increase from full year 2022 and a 2.5% increase from the fourth quarter of 2022.
The guidance in the table below represents the Company's current good faith estimate of the range of likely future results for the full year and second quarter of 2023. Guidance could be affected by the factors discussed below in the "Safe Harbor Statement" section.
8


Q2FY
20232023
Sales Volumes:
Total (Boe/d)17,900-18,40017,800-18,800
Oil (%)69%66-70%
NGLs (%)15%14-16%
Gas (%)16%16-18%
Capital Program:
Capital spending(1) (millions)
$34-$38$135-$170
Hz wells drilled412-15
Vertical wells drilled2-312-25
Wells completed and online6-724-40
Operating Expenses:
LOE (per Boe)$11.00-11.40$11.00-11.60
(1) In addition to Company-directed drilling and completion activities, the capital spending outlook includes funds for targeted well reactivations, capital workovers, and infrastructure upgrades. Also included is anticipated spending for leasing costs, and non-operated drilling, completion, and capital workovers.
Conference Call Information
Ring will hold a conference call on Thursday, May 4, 2023 at 11:00 a.m. ET to discuss its first quarter 2023 operational and financial results. An updated investor presentation will be posted to the Company’s website prior to the conference call.
To participate in the conference call, interested parties should dial 833-953-2433 at least five minutes before the call is to begin. Please reference the “Ring Energy First Quarter 2023 Earnings Conference Call”. International callers may participate by dialing 412-317-5762. The call will also be webcast and available on Ring’s website at www.ringenergy.com under “Investors” on the “News & Events” page. An audio replay will also be available on the Company’s website following the call.
About Ring Energy, Inc.
Ring Energy, Inc. is an oil and gas exploration, development, and production company with current operations focused on the conventional development of its Permian Basin assets. For additional information, please visit www.ringenergy.com.
Safe Harbor Statement
9


This release contains forward-looking statements within the meaning of Section 27A of the Securities Act of 1933 and Section 21E of the Securities Exchange Act of 1934. Forward-looking statements involve a wide variety of risks and uncertainties, and include, without limitations, statements with respect to the Company’s strategy and prospects. Such statements are subject to certain risks and uncertainties which are disclosed in the Company’s reports filed with the SEC, including its Form 10-K for the fiscal year ended December 31, 2022, and its other filings with the SEC. Readers and investors are cautioned that the Company’s actual results may differ materially from those described in the forward-looking statements due to a number of factors, including, but not limited to, the Company’s ability to acquire productive oil and/or gas properties or to successfully drill and complete oil and/or gas wells on such properties, general economic conditions both domestically and abroad, and the conduct of business by the Company, and other factors that may be more fully described in SEC filings of the Company.
Contact Information
Al Petrie Advisors
Al Petrie, Senior Partner
Phone: 281-975-2146
Email: [email protected]

10


RING ENERGY, INC.
Condensed Statements of Operations

(Unaudited)
Three Months Ended
March 31,December 31,March 31,
202320222022
Oil, Natural Gas, and Natural Gas Liquids Revenues$88,082,912 $99,697,682 $68,181,032 
Costs and Operating Expenses
Lease operating expenses17,472,691 17,411,645 8,953,165 
Gathering, transportation and processing costs(823)(16,223)1,296,858 
Ad valorem taxes1,670,613 1,570,039 951,954 
Oil and natural gas production taxes4,408,140 5,186,644 3,218,362 
Depreciation, depletion and amortization21,271,671 20,885,774 9,781,287 
Asset retirement obligation accretion365,847 365,747 188,242 
Operating lease expense113,138 113,138 83,590 
General and administrative expense7,130,139 8,346,896 5,522,277 
Total Costs and Operating Expenses52,431,416 53,863,660 29,995,735 
Income from Operations35,651,496 45,834,022 38,185,297 
Other Income (Expense)
Interest (expense)(10,390,279)(9,468,684)(3,398,361)
Gain (loss) on derivative contracts9,474,905 (19,330,689)(27,596,141)
Other income9,600 — — 
Net Other Income (Expense)(905,774)(28,799,373)(30,994,502)
Income Before Provision for Income Taxes34,745,722 17,034,649 7,190,795 
Provision for Income Taxes(2,029,943)(2,541,980)(78,752)
Net Income$32,715,779 $14,492,669 $7,112,043 
Basic Earnings per share$0.18 $0.09 $0.07 
Diluted Earnings per share$0.17 $0.08 $0.06 
Basic Weighted-Average Shares Outstanding177,984,323162,743,445100,192,562
Diluted Weighted-Average Shares Outstanding190,138,969178,736,799124,004,178
11


RING ENERGY, INC.
Condensed Operating Data
(Unaudited)


Three Months Ended
March 31,December 31,March 31,
202320222022
Net sales volumes:
Oil (Bbls)1,139,4131,121,371676,215
Natural gas (Mcf)1,601,4071,680,401732,283
Natural gas liquids (Bbls)(1)
239,992241,277
Total oil, natural gas and natural gas liquids (Boe)(1)(2)
1,646,3061,642,715798,262
% Oil69 %68 %85 %
Average daily equivalent sales (Boe/d)18,29217,8568,870
Average realized sales prices:
Oil ($/Bbl)73.3681.6293.80
Natural gas ($/Mcf)0.662.396.49
Natural gas liquids ($/Bbls)(1)
14.3017.210.00
Barrel of oil equivalent ($/Boe)53.5060.6985.41
Average costs and expenses per Boe ($/Boe):
Lease operating expenses10.6110.6011.22
Gathering, transportation and processing costs0.00(0.01)1.62
Ad valorem taxes1.010.961.19
Oil and natural gas production taxes2.683.164.03
Depreciation, depletion and amortization12.9212.7112.25
Asset retirement obligation accretion0.220.220.24
Operating lease expense0.070.070.10
General and administrative (including share-based compensation)4.335.086.92
General and administrative (excluding share-based compensation)3.153.745.01

(1) Beginning July 1, 2022, revenues were reported on a three-stream basis, separately reporting crude oil, natural gas, and natural gas liquids volumes and sales. For periods prior to July 1, 2022, volumes and sales for natural gas liquids were presented with natural gas.
(2) Boe is determined using the ratio of six Mcf of natural gas to one Bbl of oil (totals may not compute due to rounding.) The conversion ratio does not assume price equivalency and the price on an equivalent basis for oil, natural gas, and natural gas liquids may differ significantly.
12


RING ENERGY, INC.
Condensed Balance Sheets
(Unaudited)
March 31, 2023December 31, 2022
ASSETS
Current Assets
Cash and cash equivalents$1,725,700 $3,712,526 
Accounts receivable37,660,752 42,448,719 
Joint interest billing receivable, net2,340,588 983,802 
Derivative assets6,355,541 4,669,162 
Inventory8,808,119 9,250,717 
Prepaid expenses and other assets1,571,604 2,101,538 
Total Current Assets58,462,304 63,166,464 
Properties and Equipment
Oil and natural gas properties, full cost method1,502,859,154 1,463,838,595 
Financing lease asset subject to depreciation3,103,286 3,019,476 
Fixed assets subject to depreciation3,161,695 3,147,125 
Total Properties and Equipment1,509,124,135 1,470,005,196 
Accumulated depreciation, depletion and amortization(311,144,968)(289,935,259)
Net Properties and Equipment1,197,979,167 1,180,069,937 
Operating lease asset1,642,572 1,735,013 
Derivative assets6,675,355 6,129,410 
Deferred financing costs16,678,589 17,898,973 
Total Assets$1,281,437,987 $1,268,999,797 
LIABILITIES AND STOCKHOLDERS’ EQUITY
Current Liabilities
Accounts payable$100,034,311 $111,398,268 
Income tax liability57,291 — 
Financing lease liability745,537 709,653 
Operating lease liability404,834 398,362 
Derivative liabilities8,523,681 13,345,619 
Notes payable— 499,880 
Deferred cash payment— 14,807,276 
Asset retirement obligations635,843 635,843 
Total Current Liabilities110,401,497 141,794,901 
Non-current Liabilities
Deferred income taxes10,471,669 8,499,016 
Revolving line of credit422,000,000 415,000,000 
Financing lease liability, less current portion923,391 1,052,479 
Operating lease liability, less current portion1,369,506 1,473,897 
Derivative liabilities7,406,483 10,485,650 
Asset retirement obligations29,623,015 29,590,463 
Total Liabilities582,195,561 607,896,406 
Commitments and contingencies
Stockholders' Equity
Preferred stock - $0.001 par value; 50,000,000 shares authorized; no shares issued or outstanding— — 
Common stock - $0.001 par value; 225,000,000 shares authorized; 180,627,484 shares and 175,530,212 shares issued and outstanding, respectively180,627 175,530 
Additional paid-in capital780,659,273 775,241,114 
Accumulated deficit(81,597,474)(114,313,253)
13


RING ENERGY, INC.
Condensed Balance Sheets
Total Stockholders’ Equity699,242,426 661,103,391 
Total Liabilities and Stockholders' Equity$1,281,437,987 $1,268,999,797 
14


RING ENERGY, INC.
Condensed Statements of Cash Flows
(Unaudited)

(Unaudited)
Three Months Ended
March 31,December 31,March 31,
202320222022
Cash Flows From Operating Activities
Net income$32,715,779 $14,492,669 $7,112,043 
Adjustments to reconcile net income to net cash provided by operating activities:
Depreciation, depletion and amortization21,271,671 20,885,774 9,781,287 
Asset retirement obligation accretion365,847 365,747 188,242 
Amortization of deferred financing costs1,220,384 1,222,400 199,274 
Share-based compensation1,943,696 2,198,043 1,521,910 
Bad debt expense2,894 242,247 — 
Deferred income tax expense1,972,653 2,890,984 65,939 
Excess tax expense (benefit) related to share-based compensation— (312,268)— 
(Gain) loss on derivative contracts(9,474,905)19,330,689 27,596,141 
Cash paid for derivative settlements, net(658,525)(13,932,072)(14,115,501)
Changes in assets and liabilities:
Accounts receivable3,428,287 4,086,757 (10,078,098)
Inventory442,598 (5,597,845)— 
Prepaid expenses and other assets529,934 1,145,031 202,885 
Accounts payable(9,589,898)16,816,386 2,519,011 
Settlement of asset retirement obligation(490,319)(193,036)(553,368)
Net Cash Provided by Operating Activities43,680,096 63,641,506 24,439,765 
Cash Flows From Investing Activities
Payments for the Stronghold Acquisition(18,511,170)5,535,839 — 
Payments to purchase oil and natural gas properties(59,099)(352,012)(360,848)
Payments to develop oil and natural gas properties(36,939,307)(45,556,105)(13,860,249)
Payments to acquire or improve fixed assets subject to depreciation(14,570)(161,347)(10,114)
Sale of fixed assets subject to depreciation— — 8,500 
Proceeds from divestiture of oil and natural gas properties54,558 (1,366)— 
Net Cash (Used in) Investing Activities(55,469,588)(40,534,991)(14,222,711)
Cash Flows From Financing Activities
Proceeds from revolving line of credit56,000,000 44,000,000 10,000,000 
Payments on revolving line of credit(49,000,000)(64,000,000)(20,000,000)
Proceeds from issuance of common stock from warrant exercises3,613,941 640,000 — 
Payments for taxes withheld on vested restricted shares, net(134,381)(256,715)— 
Proceeds from notes payable— 78,051 — 
Payments on notes payable(499,880)(455,802)(367,381)
Payment of deferred financing costs— (129,026)— 
Reduction of financing lease liabilities(177,014)(161,064)(118,778)
Net Cash Provided by (Used in) Financing Activities9,802,666 (20,284,556)(10,486,159)
Net Increase (Decrease) in Cash(1,986,826)2,821,959 (269,105)
Cash at Beginning of Period3,712,526 890,567 2,408,316 
Cash at End of Period$1,725,700 $3,712,526 $2,139,211 

15


RING ENERGY, INC.
Financial Commodity Derivative Positions
As of March 31, 2023

The following tables reflect the details of current derivative contracts as of March 31, 2023 (Quantities are in barrels (Bbl) for the oil derivative contracts and in million British thermal units (MMBtu) for the natural gas derivative contracts.):
Oil Hedges (WTI)
Q2 2023Q3 2023Q4 2023Q1 2024Q2 2024Q3 2024Q4 2024Q1 2025
Swaps:
Hedged volume (Bbl)68,250 138,000 138,000 170,625 156,975 282,900 368,000 — 
Weighted average swap price$81.73 $76.19 $74.52 $67.40 $66.40 $65.49 $68.43 $— 
Deferred premium puts:
Hedged volume (Bbl)288,925 186,300 165,600 45,500 45,500 — — — 
Weighted average strike price$85.30 $83.43 $83.78 $84.70 $82.80 $— $— $— 
Weighted average deferred premium price$12.99 $13.09 $14.61 $17.15 $17.49 $— $— $— 
Two-way collars:
Hedged volume (Bbl)124,450 119,163 113,285 194,003 189,347 92,000 — 348,750 
Weighted average put price$52.18 $52.12 $52.07 $67.35 $67.40 $70.00 $— $56.00 
Weighted average call price$63.01 $62.80 $62.60 $84.42 $83.21 $81.20 $— $76.75 
Three-way collars:
Hedged volume (Bbl)16,800 16,242 15,598 — — — — — 
Weighted average first put price$45.00 $45.00 $45.00 $— $— $— $— $— 
Weighted average second put price$55.00 $55.00 $55.00 $— $— $— $— $— 
Weighted average call price$80.05 $80.05 $80.05 $— $— $— $— $— 
Gas Hedges (Henry Hub)
Q2 2023Q3 2023Q4 2023Q1 2024Q2 2024Q3 2024Q4 2024Q1 2025
NYMEX Swaps:
Hedged volume (MMBtu)87,490 117,137 116,623 75,075 63,700 50,600 577,300 553,500 
Weighted average swap price$3.34 $3.29 $3.29 $3.82 $3.82 $3.82 $4.57 $3.82 
Two-way collars:
Hedged volume (MMBtu)425,043 611,318 579,998 591,500 568,750 552,000 — — 
Weighted average put price$3.19 $3.17 $3.15 $4.00 $4.00 $4.00 $— $— 
Call hedged volume (MMBtu)425,043 611,318 579,998 591,500 568,750 552,000 — — 
Weighted average call price$4.59 $4.54 $4.50 $6.29 $6.29 $6.29 $— $— 
Gas Hedges (basis differential)
Q2 2023Q3 2023Q4 2023Q1 2024Q2 2024Q3 2024Q4 2024Q1 2025
Waha basis swaps:
Hedged volume (MMBtu)338,461 332,855 324,021 — — — — — 
Weighted average swap price
(1)
(1)
(1)
$— $— $— $— $— 

16


RING ENERGY, INC.
Financial Commodity Derivative Positions
As of March 31, 2023
(1) The WAHA basis swaps in place for the calendar year of 2023 consist of two derivative contracts, each with a fixed price of the Henry Hub natural gas price less a fixed amount (weighted average of $0.55 per MMBtu).

RING ENERGY, INC.
Non-GAAP Information

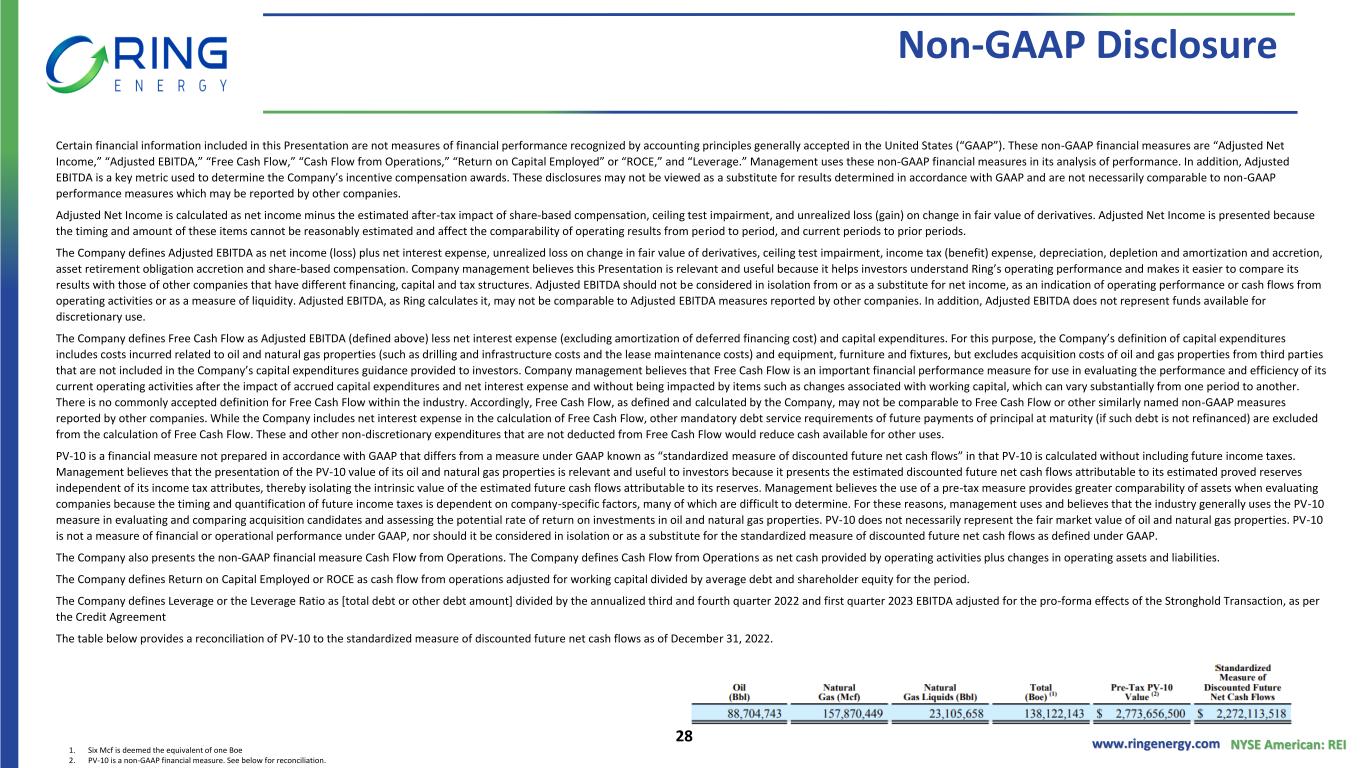
Certain financial information included in Ring’s financial results are not measures of financial performance recognized by accounting principles generally accepted in the United States, or GAAP. These non-GAAP financial measures are “Adjusted Net Income”, “Adjusted EBITDA”, “Free Cash Flow” and “Cash Flow from Operations”. Management uses these non-GAAP financial measures in its analysis of performance. In addition, Adjusted EBITDA is a key metric used to determine the Company’s incentive compensation awards. These disclosures may not be viewed as a substitute for results determined in accordance with GAAP and are not necessarily comparable to non-GAAP performance measures which may be reported by other companies.

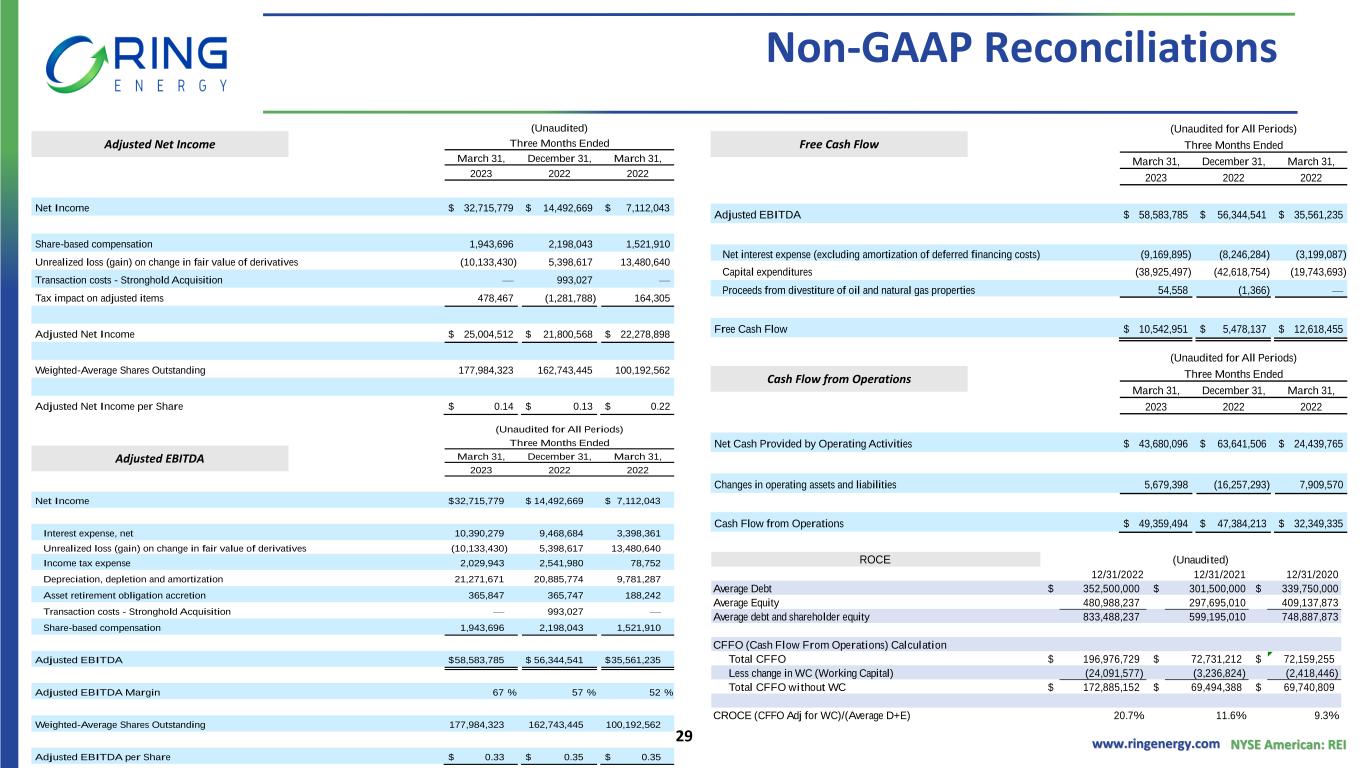
Reconciliation of Net Income (Loss) to Adjusted Net Income

Adjusted Net Income does not include the estimated after-tax impact of share-based compensation, ceiling test impairment, and unrealized loss (gain) on change in fair value of derivatives. Adjusted Net Income is presented because the timing and amount of these items cannot be reasonably estimated and affect the comparability of operating results from period to period, and current periods to prior periods.

(Unaudited)
Three Months Ended
March 31,December 31,March 31,
202320222022
Net Income$32,715,779 $14,492,669 $7,112,043 
Share-based compensation1,943,696 2,198,043 1,521,910 
Unrealized loss (gain) on change in fair value of derivatives(10,133,430)5,398,617 13,480,640 
Transaction costs - Stronghold Acquisition— 993,027 — 
Tax impact on adjusted items478,467 (1,281,788)164,305 
Adjusted Net Income$25,004,512 $21,800,568 $22,278,898 
Weighted-Average Shares Outstanding177,984,323 162,743,445 100,192,562 
Adjusted Net Income per Share$0.14 $0.13 $0.22 

Reconciliations of Adjusted EBITDA, Free Cash Flow and Cash Flow from Operations
17


The Company also presents the non-GAAP financial measures Adjusted EBITDA and Free Cash Flow. The Company defines Adjusted EBITDA as net income (loss) plus net interest expense, unrealized loss (gain) on change in fair value of derivatives, ceiling test impairment, income tax (benefit) expense, depreciation, depletion and amortization, asset retirement obligation accretion and share-based compensation. Company management believes this presentation is relevant and useful because it helps investors understand Ring’s operating performance and makes it easier to compare its results with those of other companies that have different financing, capital and tax structures. Adjusted EBITDA should not be considered in isolation from or as a substitute for net income, as an indication of operating performance or cash flows from operating activities or as a measure of liquidity. Adjusted EBITDA, as Ring calculates it, may not be comparable to Adjusted EBITDA measures reported by other companies. In addition, Adjusted EBITDA does not represent funds available for discretionary use.

The Company defines Free Cash Flow as Adjusted EBITDA (defined above) less net interest expense (excluding amortization of deferred financing cost), capital expenditures and proceeds from divestiture of oil and natural gas properties. For this purpose, the Company’s definition of capital expenditures includes costs incurred related to oil and natural gas properties (such as drilling and infrastructure costs and the lease maintenance costs) and equipment, furniture and fixtures, but excludes acquisition costs of oil and gas properties from third parties that are not included in the Company’s capital expenditures guidance provided to investors. Company management believes that Free Cash Flow is an important financial performance measure for use in evaluating the performance and efficiency of its current operating activities after the impact of accrued capital expenditures and net interest expense and without being impacted by items such as changes associated with working capital, which can vary substantially from one period to another. There is no commonly accepted definition of Free Cash Flow within the industry. Accordingly, Free Cash Flow, as defined and calculated by the Company, may not be comparable to Free Cash Flow or other similarly named non-GAAP measures reported by other companies. While the Company includes net interest expense in the calculation of Free Cash Flow, other mandatory debt service requirements of future payments of principal at maturity (if such debt is not refinanced) are excluded from the calculation of Free Cash Flow. These and other non-discretionary expenditures that are not deducted from Free Cash Flow would reduce cash available for other uses.

The following tables present (i) a reconciliation of the Company’s net income (loss), a GAAP measure, to Adjusted EBITDA and (ii) a reconciliation of Adjusted EBITDA, a non-GAAP measure, to Free Cash Flow, as both Adjusted EBITDA and Free Cash Flow are defined by the Company. In addition, a reconciliation of cash flow from operations is presented.
18


(Unaudited for All Periods)
Three Months Ended
March 31,December 31,March 31,
202320222022
Net Income$32,715,779 $14,492,669 $7,112,043 
Interest expense, net10,390,279 9,468,684 3,398,361 
Unrealized loss (gain) on change in fair value of derivatives(10,133,430)5,398,617 13,480,640 
Income tax expense2,029,943 2,541,980 78,752 
Depreciation, depletion and amortization21,271,671 20,885,774 9,781,287 
Asset retirement obligation accretion365,847 365,747 188,242 
Transaction costs - Stronghold Acquisition— 993,027 — 
Share-based compensation1,943,696 2,198,043 1,521,910 
Adjusted EBITDA$58,583,785 $56,344,541 $35,561,235 
Adjusted EBITDA Margin67 %57 %52 %
Weighted-Average Shares Outstanding177,984,323 162,743,445 100,192,562 
Adjusted EBITDA per Share$0.33 $0.35 $0.35 

(Unaudited for All Periods)
Three Months Ended
March 31,December 31,March 31,
202320222022
Adjusted EBITDA$58,583,785 $56,344,541 $35,561,235 
Net interest expense (excluding amortization of deferred financing costs)(9,169,895)(8,246,284)(3,199,087)
Capital expenditures(38,925,497)(42,618,754)(19,743,693)
Proceeds from divestiture of oil and natural gas properties54,558 (1,366)— 
Free Cash Flow$10,542,951 $5,478,137 $12,618,455 

19


(Unaudited for All Periods)
Three Months Ended
March 31,December 31,March 31,
202320222022
Net Cash Provided by Operating Activities$43,680,096 $63,641,506 $24,439,765 
Changes in operating assets and liabilities5,679,398 (16,257,293)7,909,570 
Cash Flow from Operations$49,359,494 $47,384,213 $32,349,335 
20
www.ringenergy.com NYSE American: REI VALUE FOCUSED PROVEN STRATEGY


www.ringenergy.com NYSE American: REI Forward-Looking Statements and Cautionary Note Regarding Hydrocarbon Disclosures Forward –Looking Statements This Presentation includes "forward-looking statements" within the meaning of the Private Securities Litigation Reform Act of 1995, Section 27A of the Securities Act of 1933, as amended, and Section 21E of the Securities Exchange Act of 1934, as amended. All statements, other than statements of strictly historical facts included in this Presentation constitute forward-looking statements and may often, but not always, be identified by the use of such words as “may,” “will,” “should,” “could,” “intends,” “estimates,” “expects,” “anticipates,” “plans,” “project,” “guidance,” “target,” “potential,” “possible,” “probably,” and “believes” or the negative variations thereof or comparable terminology. These forward-looking statements include statements regarding the expected benefits to the Company and its stockholders from the acquisition of oil and gas properties (the “Stronghold Acquisition”) from Stronghold Energy II Operating, LLC and its affiliates; and the Company's financial position, future revenues, net income, potential evaluations, business strategy and plans and objectives for future operations. Forward-looking statements are subject to numerous assumptions, risks and uncertainties that may cause actual results to be materially different than any future results expressed or implied in those statements. However, whether actual results and developments will conform to expectations is subject to a number of material risks and uncertainties, including but not limited to: the Company’s ability to successfully integrate the oil and gas properties acquired in the Stronghold Acquisition; declines in oil, natural gas liquids or natural gas prices; the level of success in exploration, development and production activities; the timing of exploration and development expenditures; inaccuracies of reserve estimates or assumptions underlying them; revisions to reserve estimates as a result of changes in commodity prices or production history; impacts to financial statements as a result of impairment write-downs; risks related to the level of indebtedness and periodic redeterminations of the borrowing base under the Company’s credit facility; the impacts of hedging on results of operations; the Company’s ability to replace oil and natural gas reserves; any loss of senior management or technical personnel; and the direct and indirect impact on most or all of the foregoing due to the COVID-19 pandemic or future variants. Some of the factors that could cause actual results to differ materially from expected results are described under “Risk Factors” in our 2022 annual report on Form 10-K filed with the U.S. Securities and Exchange Commission (“SEC”) on March 9, 2023 and the Company’s other SEC filings. Although the Company believes that the assumptions upon which such forward-looking statements are based are reasonable, it can give no assurance that such assumptions will prove to be correct. All forward-looking statements in this Presentation are expressly qualified by the cautionary statements and by reference to the underlying assumptions that may prove to be incorrect. The Company undertakes no obligation to publicly revise these forward-looking statements to reflect events or circumstances that arise after the date hereof, except as required by applicable law. The financial and operating estimates contained in this Presentation represent our reasonable estimates as of the date of this Presentation. Neither our independent auditors nor any other third party has examined, reviewed or compiled the projections and, accordingly, none of the foregoing expresses an opinion or other form of assurance with respect thereto. The assumptions upon which the projections are based are described in more detail herein. Some of these assumptions inevitably will not materialize, and unanticipated events may occur that could affect our results. Therefore, our actual results achieved during the periods covered by the estimates will vary from the projected results. Prospective investors are cautioned not to place undue reliance on the estimates included herein. Supplemental Non-GAAP Financial Measures This Presentation includes financial measures that are not in accordance with accounting principles generally accepted in the United States (“GAAP”), such as “Adjusted Net Income,” “Adjusted EBITDA,” “PV-10,” “Free Cash Flow,” or “FCF,” “Cash Flow from Operations,” “Return on Capital Employed” or “ROCE”, “Liquidity” and “Leverage Ratio.” While management believes that such measures are useful for investors, they should not be used as a replacement for financial measures that are in accordance with GAAP. For definitions of such non-GAAP financial measures and their reconciliations to GAAP measures, please see the Appendix. 2


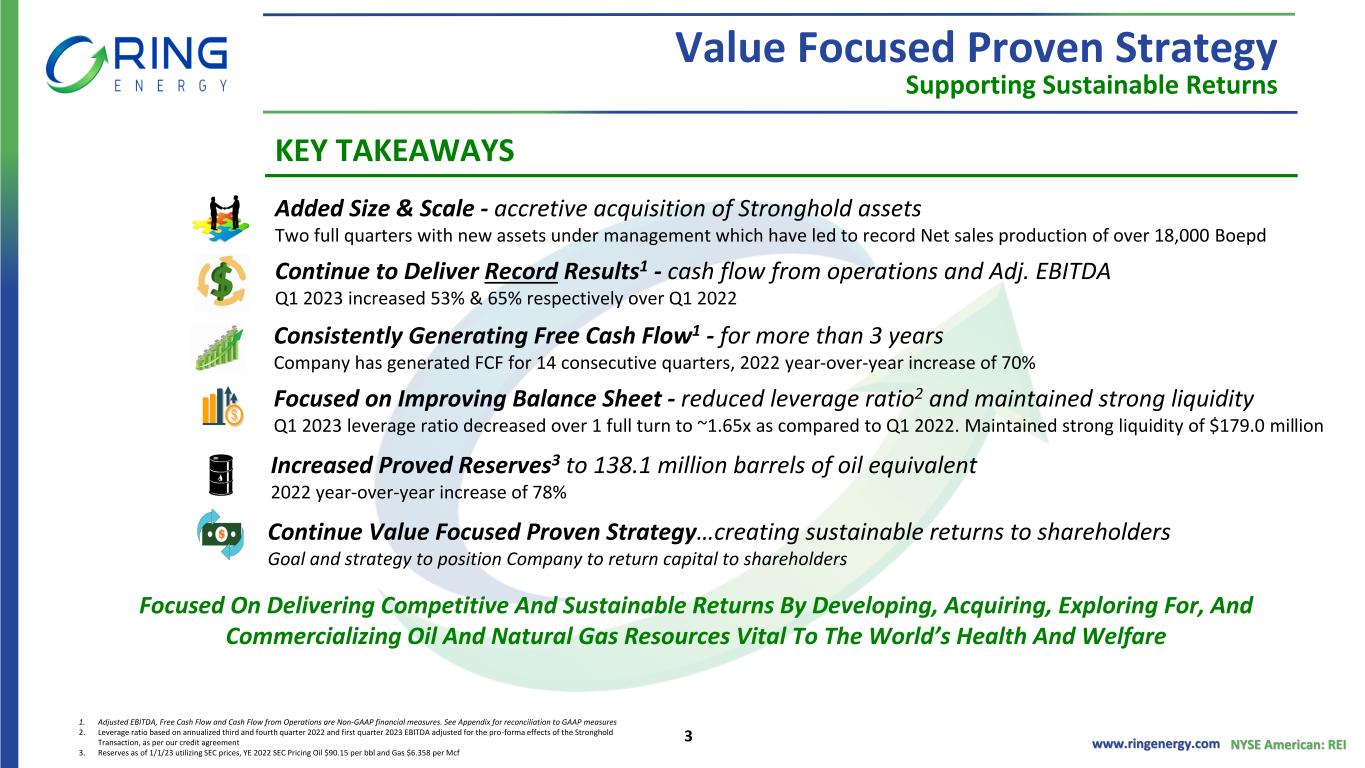
www.ringenergy.com NYSE American: REI Value Focused Proven Strategy Supporting Sustainable Returns KEY TAKEAWAYS Added Size & Scale - accretive acquisition of Stronghold assets Two full quarters with new assets under management which have led to record Net sales production of over 18,000 Boepd Continue to Deliver Record Results1 - cash flow from operations and Adj. EBITDA Q1 2023 increased 53% & 65% respectively over Q1 2022 Consistently Generating Free Cash Flow1 - for more than 3 years Company has generated FCF for 14 consecutive quarters, 2022 year-over-year increase of 70% Focused on Improving Balance Sheet - reduced leverage ratio2 and maintained strong liquidity Q1 2023 leverage ratio decreased over 1 full turn to ~1.65x as compared to Q1 2022. Maintained strong liquidity of $179.0 million Increased Proved Reserves3 to 138.1 million barrels of oil equivalent 2022 year-over-year increase of 78% Continue Value Focused Proven Strategy…creating sustainable returns to shareholders Goal and strategy to position Company to return capital to shareholders Focused On Delivering Competitive And Sustainable Returns By Developing, Acquiring, Exploring For, And Commercializing Oil And Natural Gas Resources Vital To The World’s Health And Welfare 1. Adjusted EBITDA, Free Cash Flow and Cash Flow from Operations are Non-GAAP financial measures. See Appendix for reconciliation to GAAP measures 2. Leverage ratio based on annualized third and fourth quarter 2022 and first quarter 2023 EBITDA adjusted for the pro-forma effects of the Stronghold Transaction, as per our credit agreement 3. Reserves as of 1/1/23 utilizing SEC prices, YE 2022 SEC Pricing Oil $90.15 per bbl and Gas $6.358 per Mcf 3


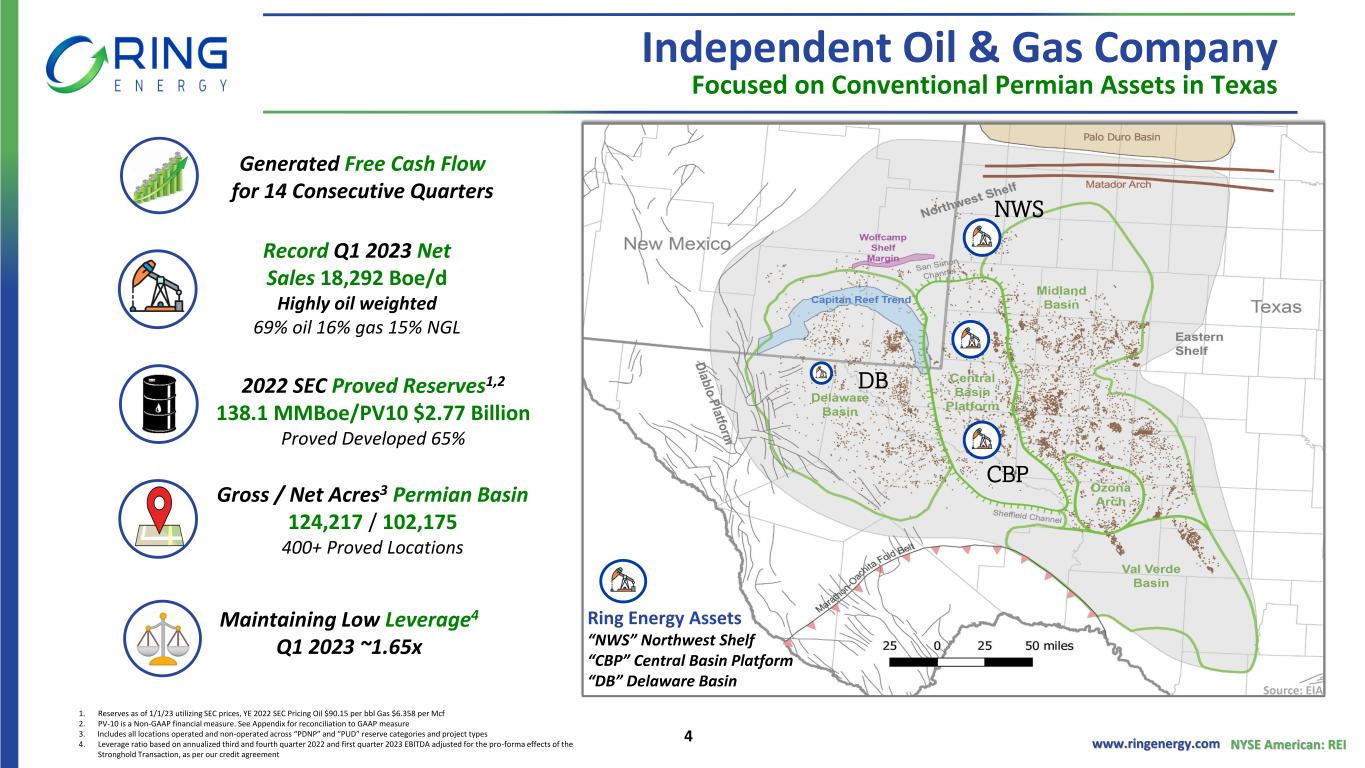
www.ringenergy.com NYSE American: REI Independent Oil & Gas Company Focused on Conventional Permian Assets in Texas 2022 SEC Proved Reserves1,2 138.1 MMBoe/PV10 $2.77 Billion Proved Developed 65% Gross / Net Acres3 Permian Basin 124,217 / 102,175 400+ Proved Locations Generated Free Cash Flow for 14 Consecutive Quarters Record Q1 2023 Net Sales 18,292 Boe/d Highly oil weighted 69% oil 16% gas 15% NGL Maintaining Low Leverage4 Q1 2023 ~1.65x 1. Reserves as of 1/1/23 utilizing SEC prices, YE 2022 SEC Pricing Oil $90.15 per bbl Gas $6.358 per Mcf 2. PV-10 is a Non-GAAP financial measure. See Appendix for reconciliation to GAAP measure 3. Includes all locations operated and non-operated across “PDNP” and “PUD” reserve categories and project types 4. Leverage ratio based on annualized third and fourth quarter 2022 and first quarter 2023 EBITDA adjusted for the pro-forma effects of the Stronghold Transaction, as per our credit agreement Source: EIA CBP NWS DB Ring Energy Assets “NWS” Northwest Shelf “CBP” Central Basin Platform “DB” Delaware Basin 4


www.ringenergy.com NYSE American: REI 1. Adjusted EBITDA, Free Cash Flow and Cash Flow from Operations are Non-GAAP financial measures. See Appendix for reconciliation to GAAP measures. 2. Leverage ratio based on annualized third and fourth quarter 2022 and first quarter 2023 EBITDA adjusted for the pro-forma effects of the Stronghold Transaction, as per the Credit Agreement. 3. Liquidity is defined as cash on hand and available borrowings under the Company’s credit agreement. Q1 2023 Highlights Proven Strategy Leads to Record Results 18,292 Boe/d 12,660 BOPD $49.4 Million $58.6 Million $10.5 Million 1.65x $179 Million 17,856 Boe/d 12,189 BOPD $47.4 Million $56.3 Million $5.5 Million 1.56x $188 Million Oil Production BOE Production Cash Flow From Ops1 Adjusted EBITDA1 Free Cash Flow1 Leverage Ratio2 Liquidity3 Q1 2023 Q4 2022 All Time High 2022 Was A Transformational Year With Record Results And Q1 2023 Continued to Produce Record Results In Q1 2023 made final cash payment of $15 million for Stronghold acquisitionQ1 2023 sales at high end of guidance 5


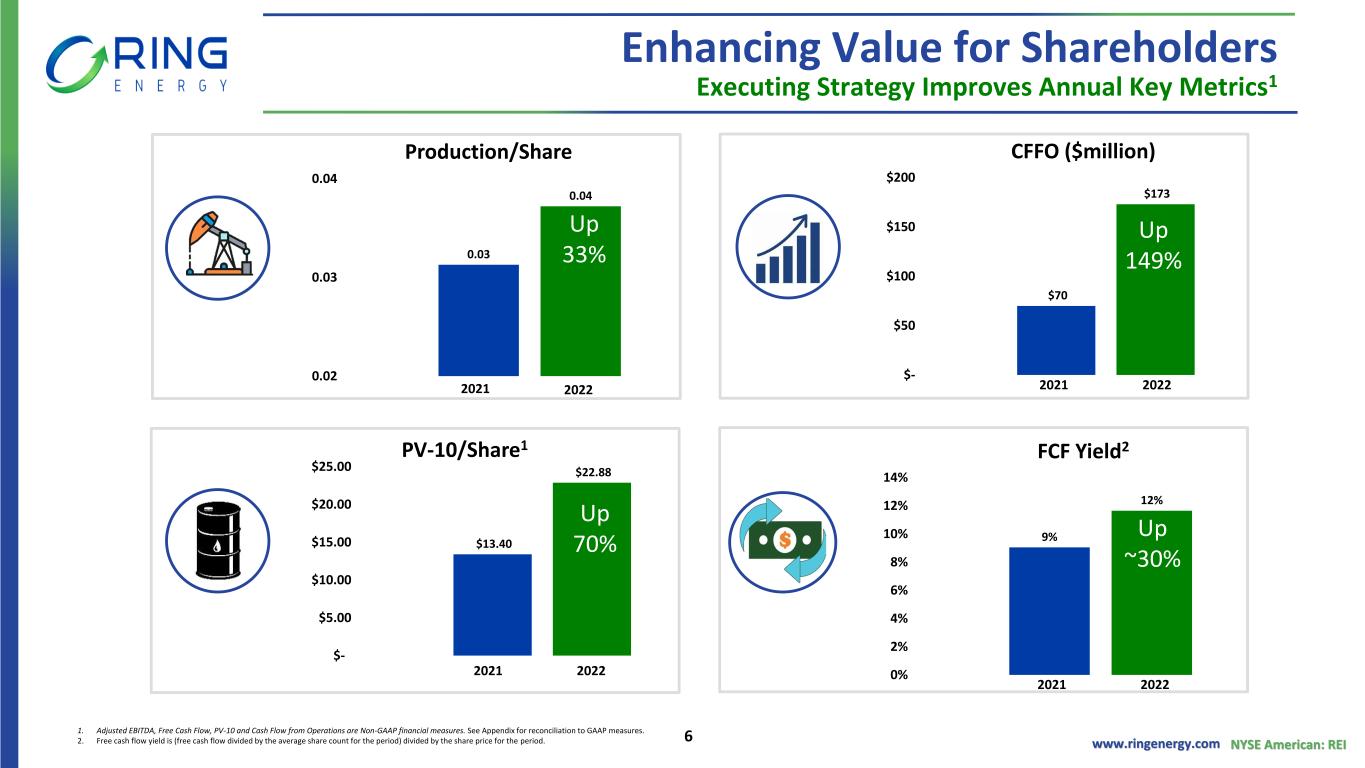
www.ringenergy.com NYSE American: REI Enhancing Value for Shareholders Executing Strategy Improves Annual Key Metrics1 1. Adjusted EBITDA, Free Cash Flow, PV-10 and Cash Flow from Operations are Non-GAAP financial measures. See Appendix for reconciliation to GAAP measures. 2. Free cash flow yield is (free cash flow divided by the average share count for the period) divided by the share price for the period. 9% 12% 0% 2% 4% 6% 8% 10% 12% 14% FCF Yield2 $13.40 $22.88 $- $5.00 $10.00 $15.00 $20.00 $25.00 PV-10/Share1 $70 $173 $- $50 $100 $150 $200 CFFO ($million) Up 33% Up 70% Up 149% Up ~30% 0.03 0.04 0.02 0.03 0.04 Production/Share Up 33% 2021 2022 2021 2022 2021 2022 2021 2022 6


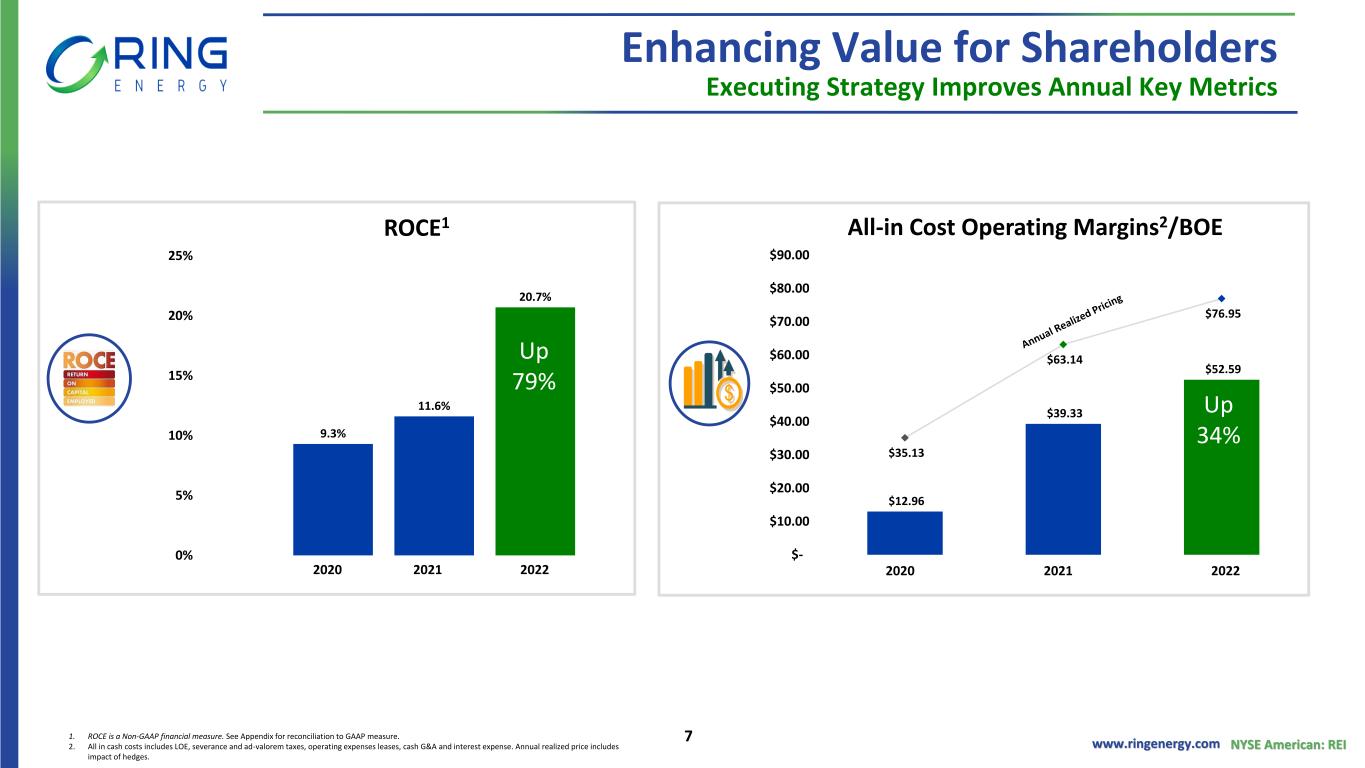
www.ringenergy.com NYSE American: REI Enhancing Value for Shareholders Executing Strategy Improves Annual Key Metrics 1. ROCE is a Non-GAAP financial measure. See Appendix for reconciliation to GAAP measure. 2. All in cash costs includes LOE, severance and ad-valorem taxes, operating expenses leases, cash G&A and interest expense. Annual realized price includes impact of hedges. 9.3% 11.6% 20.7% 0% 5% 10% 15% 20% 25% ROCE1 Up 79% $12.96 $39.33 $52.59 $35.13 $63.14 $76.95 $- $10.00 $20.00 $30.00 $40.00 $50.00 $60.00 $70.00 $80.00 $90.00 All-in Cost Operating Margins2/BOE Up 34% 2020 2021 2022 2020 2021 2022 7


www.ringenergy.com NYSE American: REI 0 5,000 10,000 15,000 Oil Sales BOPD Focus on FCF and Strengthening Balance Sheet Pursue Operational Excellence with a Sense of Urgency Invest in High-Margin, High ROR Projects Capex $135 to $170 Million Mid-point $152.5 Million Net Sales 17,800 to 18,800 Boe/d Mid-point 18,300 Boe/d (68% Oil, 15% NGLs, 17% Gas) Reducing Leverage Ratio1 (Forecasting to operate within CF, further reducing leverage ratio over time) Capital Projects: 12-15 Hz and 12-25 Vertical wells 2023 Outlook Proven Strategy Leads to Shareholder Value 1. Leverage ratio based on annualized third and fourth quarter 2022 and first quarter 2023 EBITDA adjusted for the pro-forma effects of the Stronghold Transaction, as per our credit agreement. 2. 2023E Leverage Ratio based on Factset consensus estimate as of 5/3/23. 70% 22% 8% D,C&E, Infrastructure & CTRs Recompl/Cap. Workovers Land/Non-op/ ESG Improvements 3.48x 1.56x ~1.50x 0.0 1.0 2.0 3.0 4.0 Leverage Ratio 2023E $152.5 MM Midpoint 0 5,000 10,000 15,000 20,000 Sales Boe/d 2022 2023E 12,364 18,300 9,479 2023E 12,450 2022 Up Only ~9% From 2022 Up ~50% Up 30% Maintaining Low Leverage 2021 2022 2023E2 8


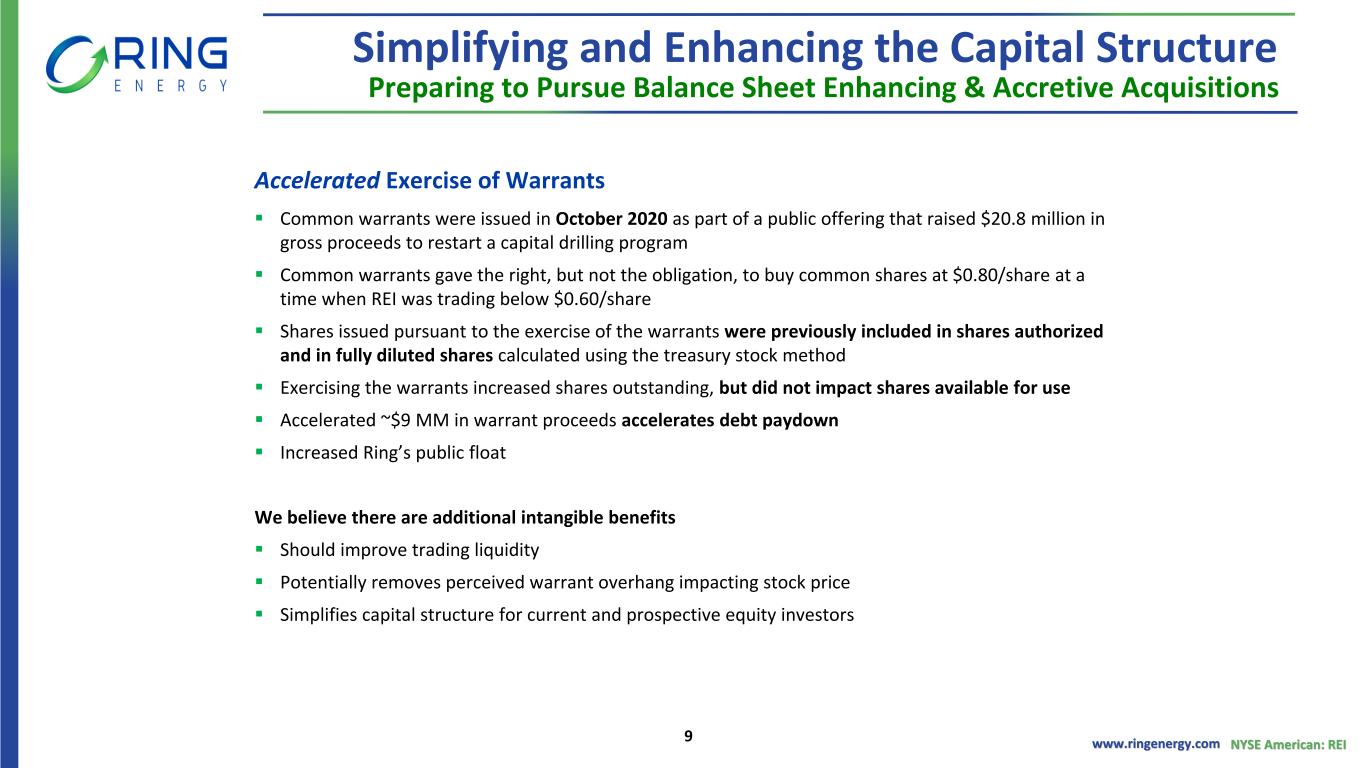
www.ringenergy.com NYSE American: REI Simplifying and Enhancing the Capital Structure Accelerated Exercise of Warrants ▪ Common warrants were issued in October 2020 as part of a public offering that raised $20.8 million in gross proceeds to restart a capital drilling program ▪ Common warrants gave the right, but not the obligation, to buy common shares at $0.80/share at a time when REI was trading below $0.60/share ▪ Shares issued pursuant to the exercise of the warrants were previously included in shares authorized and in fully diluted shares calculated using the treasury stock method ▪ Exercising the warrants increased shares outstanding, but did not impact shares available for use ▪ Accelerated ~$9 MM in warrant proceeds accelerates debt paydown ▪ Increased Ring’s public float We believe there are additional intangible benefits ▪ Should improve trading liquidity ▪ Potentially removes perceived warrant overhang impacting stock price ▪ Simplifies capital structure for current and prospective equity investors Preparing to Pursue Balance Sheet Enhancing & Accretive Acquisitions 9


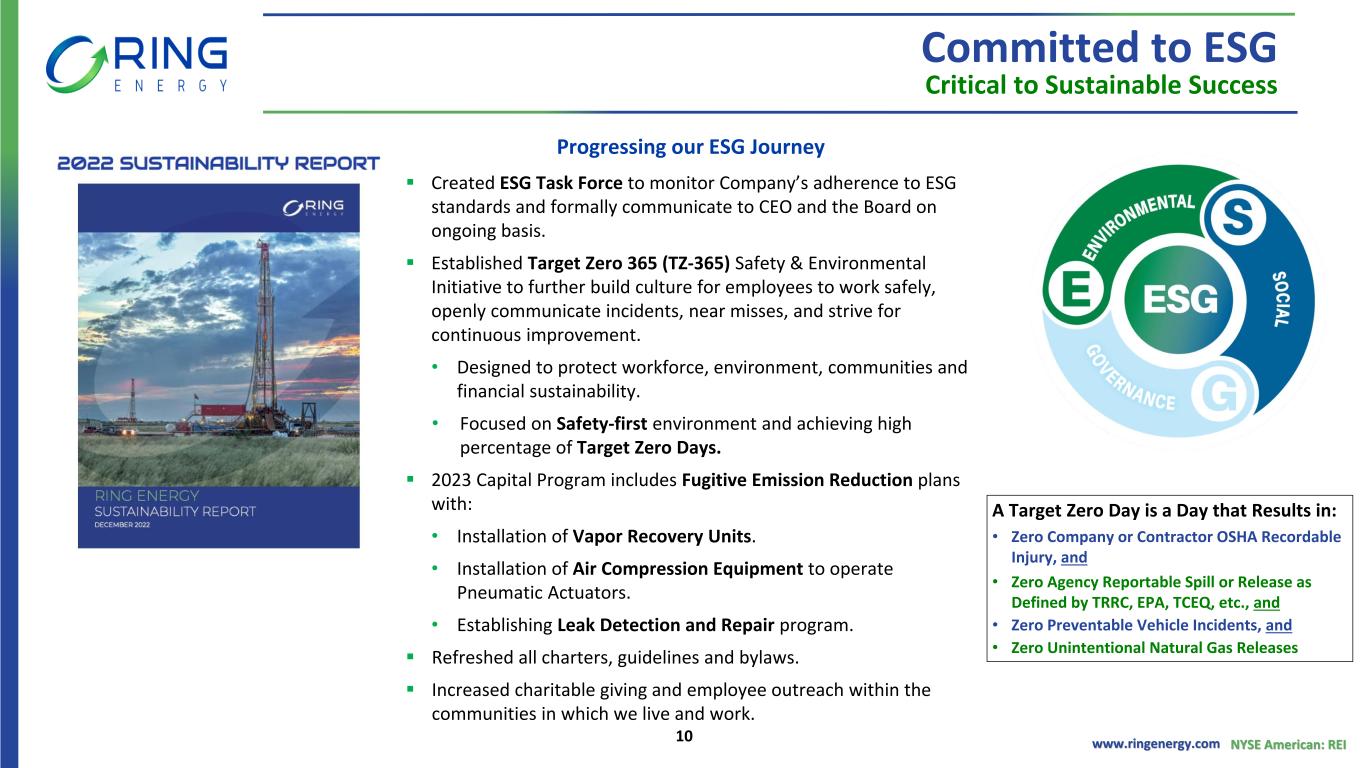
www.ringenergy.com NYSE American: REI Committed to ESG Critical to Sustainable Success Progressing our ESG Journey ▪ Created ESG Task Force to monitor Company’s adherence to ESG standards and formally communicate to CEO and the Board on ongoing basis. ▪ Established Target Zero 365 (TZ-365) Safety & Environmental Initiative to further build culture for employees to work safely, openly communicate incidents, near misses, and strive for continuous improvement. • Designed to protect workforce, environment, communities and financial sustainability. • Focused on Safety-first environment and achieving high percentage of Target Zero Days. ▪ 2023 Capital Program includes Fugitive Emission Reduction plans with: • Installation of Vapor Recovery Units. • Installation of Air Compression Equipment to operate Pneumatic Actuators. • Establishing Leak Detection and Repair program. ▪ Refreshed all charters, guidelines and bylaws. ▪ Increased charitable giving and employee outreach within the communities in which we live and work. A Target Zero Day is a Day that Results in: • Zero Company or Contractor OSHA Recordable Injury, and • Zero Agency Reportable Spill or Release as Defined by TRRC, EPA, TCEQ, etc., and • Zero Preventable Vehicle Incidents, and • Zero Unintentional Natural Gas Releases 10


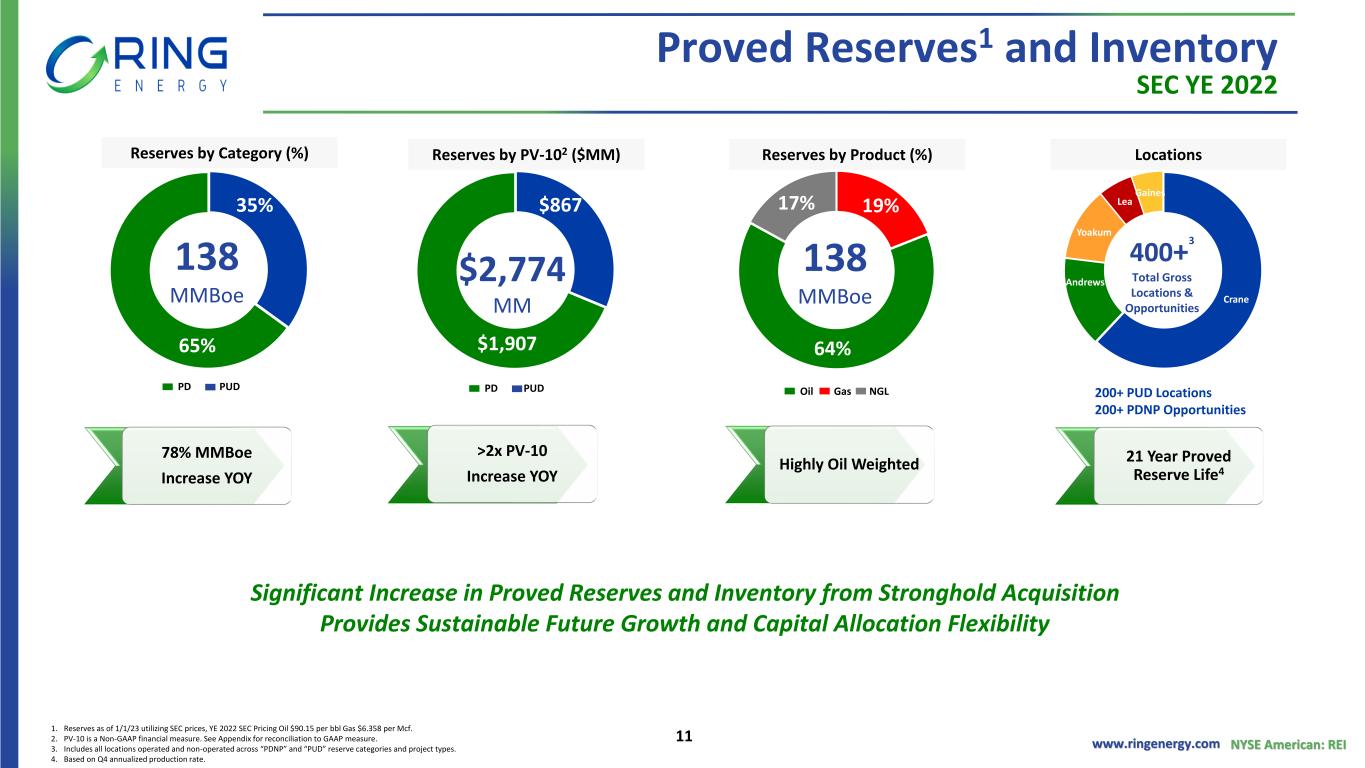
www.ringenergy.com NYSE American: REI Proved Reserves1 and Inventory SEC YE 2022 1. Reserves as of 1/1/23 utilizing SEC prices, YE 2022 SEC Pricing Oil $90.15 per bbl Gas $6.358 per Mcf. 2. PV-10 is a Non-GAAP financial measure. See Appendix for reconciliation to GAAP measure. 3. Includes all locations operated and non-operated across “PDNP” and “PUD” reserve categories and project types. 4. Based on Q4 annualized production rate. 35% 65% 138 MMBoe PD PUD Reserves by Category (%) $867 $1,907 $2,774 MM PD PUD Reserves by PV-102 ($MM) 19% 64% 17% Oil Gas NGL Reserves by Product (%) Crane Andrews Yoakum Lea Gaines Locations 138 MMBoe 400+ 3 Total Gross Locations & Opportunities 78% MMBoe Increase YOY >2x PV-10 Increase YOY Highly Oil Weighted 21 Year Proved Reserve Life4 200+ PUD Locations 200+ PDNP Opportunities Significant Increase in Proved Reserves and Inventory from Stronghold Acquisition Provides Sustainable Future Growth and Capital Allocation Flexibility 11


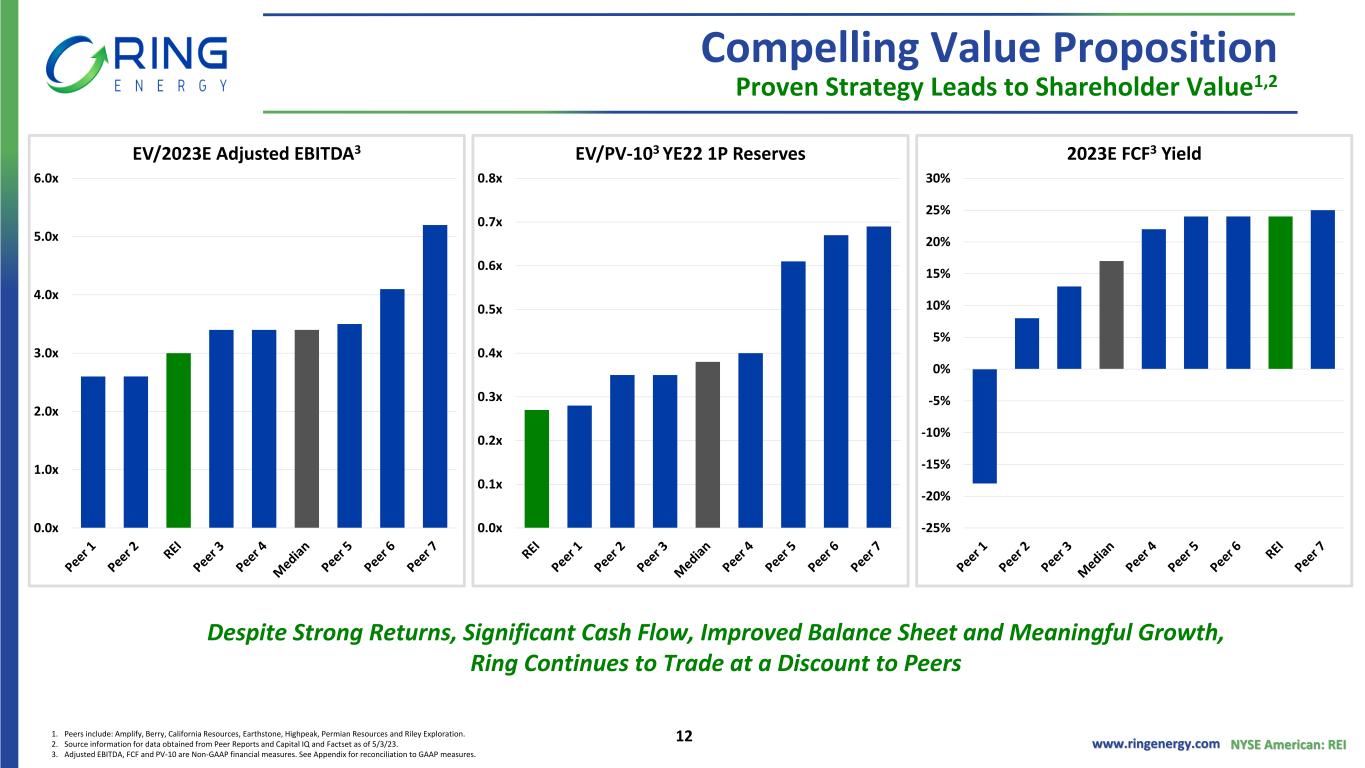
www.ringenergy.com NYSE American: REI Compelling Value Proposition Proven Strategy Leads to Shareholder Value1,2 1. Peers include: Amplify, Berry, California Resources, Earthstone, Highpeak, Permian Resources and Riley Exploration. 2. Source information for data obtained from Peer Reports and Capital IQ and Factset as of 5/3/23. 3. Adjusted EBITDA, FCF and PV-10 are Non-GAAP financial measures. See Appendix for reconciliation to GAAP measures. Despite Strong Returns, Significant Cash Flow, Improved Balance Sheet and Meaningful Growth, Ring Continues to Trade at a Discount to Peers -25% -20% -15% -10% -5% 0% 5% 10% 15% 20% 25% 30% 2023E FCF3 Yield 0.0x 1.0x 2.0x 3.0x 4.0x 5.0x 6.0x EV/2023E Adjusted EBITDA3 0.0x 0.1x 0.2x 0.3x 0.4x 0.5x 0.6x 0.7x 0.8x EV/PV-103 YE22 1P Reserves 12


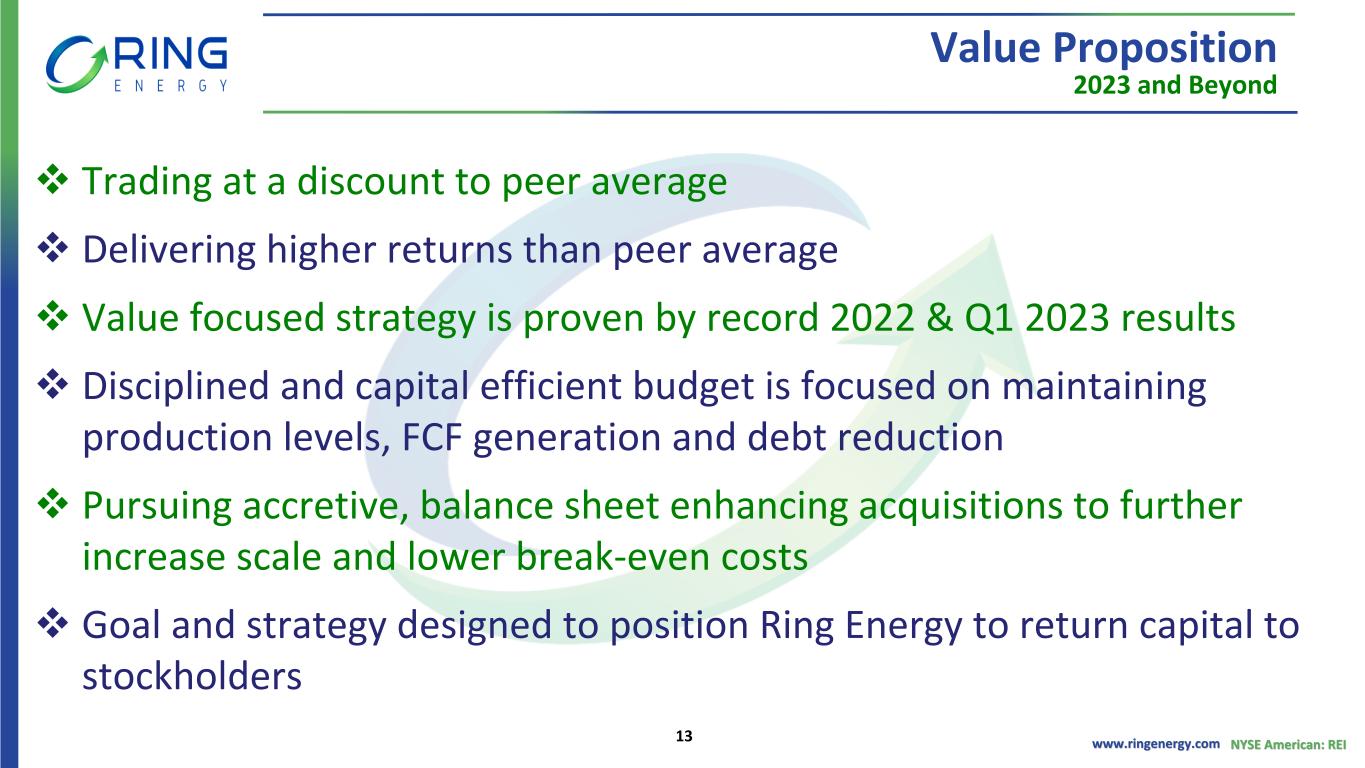
www.ringenergy.com NYSE American: REI Value Proposition 2023 and Beyond ❖ Trading at a discount to peer average ❖ Delivering higher returns than peer average ❖ Value focused strategy is proven by record 2022 & Q1 2023 results ❖ Disciplined and capital efficient budget is focused on maintaining production levels, FCF generation and debt reduction ❖ Pursuing accretive, balance sheet enhancing acquisitions to further increase scale and lower break-even costs ❖ Goal and strategy designed to position Ring Energy to return capital to stockholders 13


Asset Overview


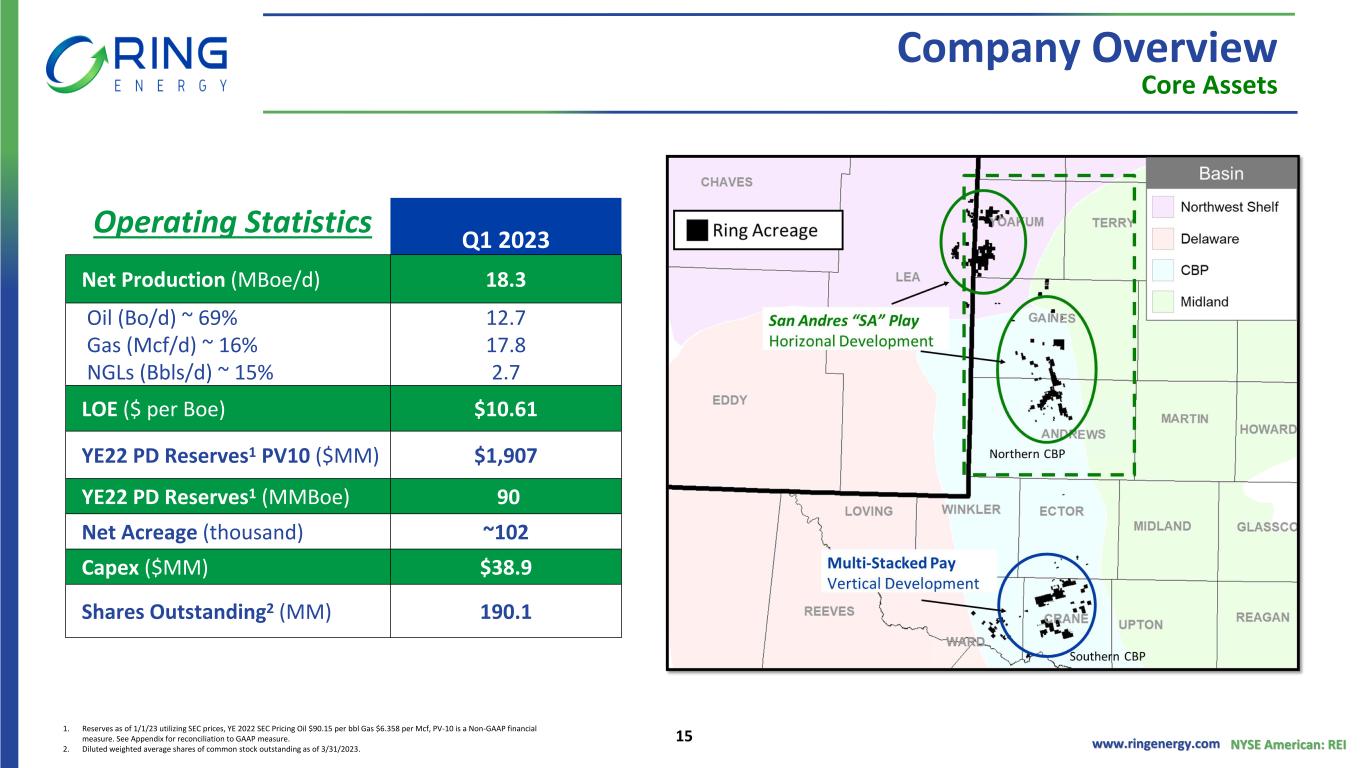
www.ringenergy.com NYSE American: REI Company Overview Operating Statistics Q1 2023 Net Production (MBoe/d) 18.3 Oil (Bo/d) ~ 69% Gas (Mcf/d) ~ 16% NGLs (Bbls/d) ~ 15% 12.7 17.8 2.7 LOE ($ per Boe) $10.61 YE22 PD Reserves1 PV10 ($MM) $1,907 YE22 PD Reserves1 (MMBoe) 90 Net Acreage (thousand) ~102 Capex ($MM) $38.9 Shares Outstanding2 (MM) 190.1 Core Assets 1. Reserves as of 1/1/23 utilizing SEC prices, YE 2022 SEC Pricing Oil $90.15 per bbl Gas $6.358 per Mcf, PV-10 is a Non-GAAP financial measure. See Appendix for reconciliation to GAAP measure. 2. Diluted weighted average shares of common stock outstanding as of 3/31/2023. 15


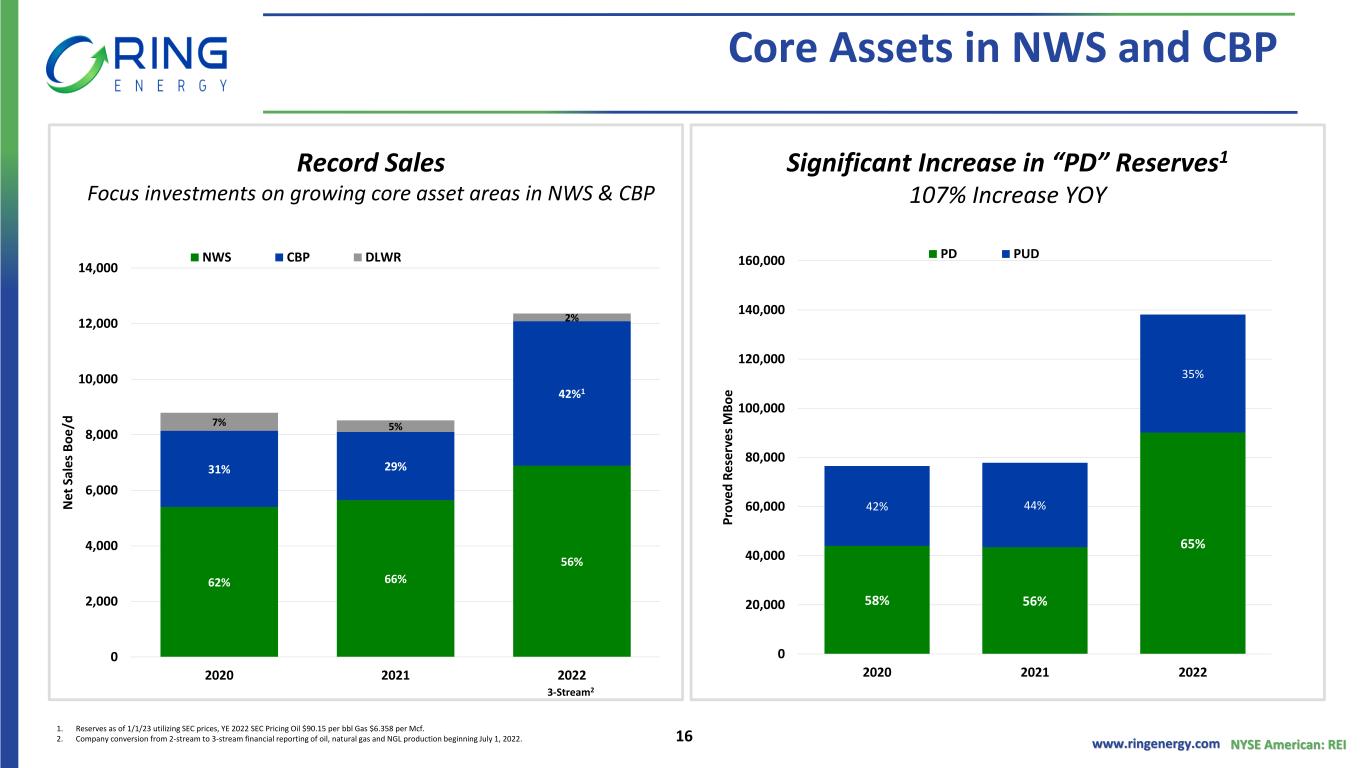
www.ringenergy.com NYSE American: REI Core Assets in NWS and CBP 62% 66% 56% 31% 29% 42%1 7% 5% 2% 0 2,000 4,000 6,000 8,000 10,000 12,000 14,000 2020 2021 2022 N et S al e s B o e /d NWS CBP DLWR Record Sales Focus investments on growing core asset areas in NWS & CBP 58% 56% 65% 42% 44% 35% 0 20,000 40,000 60,000 80,000 100,000 120,000 140,000 160,000 2020 2021 2022 P ro ve d R e se rv e s M B o e PD PUD Significant Increase in “PD” Reserves1 107% Increase YOY 1. Reserves as of 1/1/23 utilizing SEC prices, YE 2022 SEC Pricing Oil $90.15 per bbl Gas $6.358 per Mcf. 2. Company conversion from 2-stream to 3-stream financial reporting of oil, natural gas and NGL production beginning July 1, 2022. 3-Stream2 16


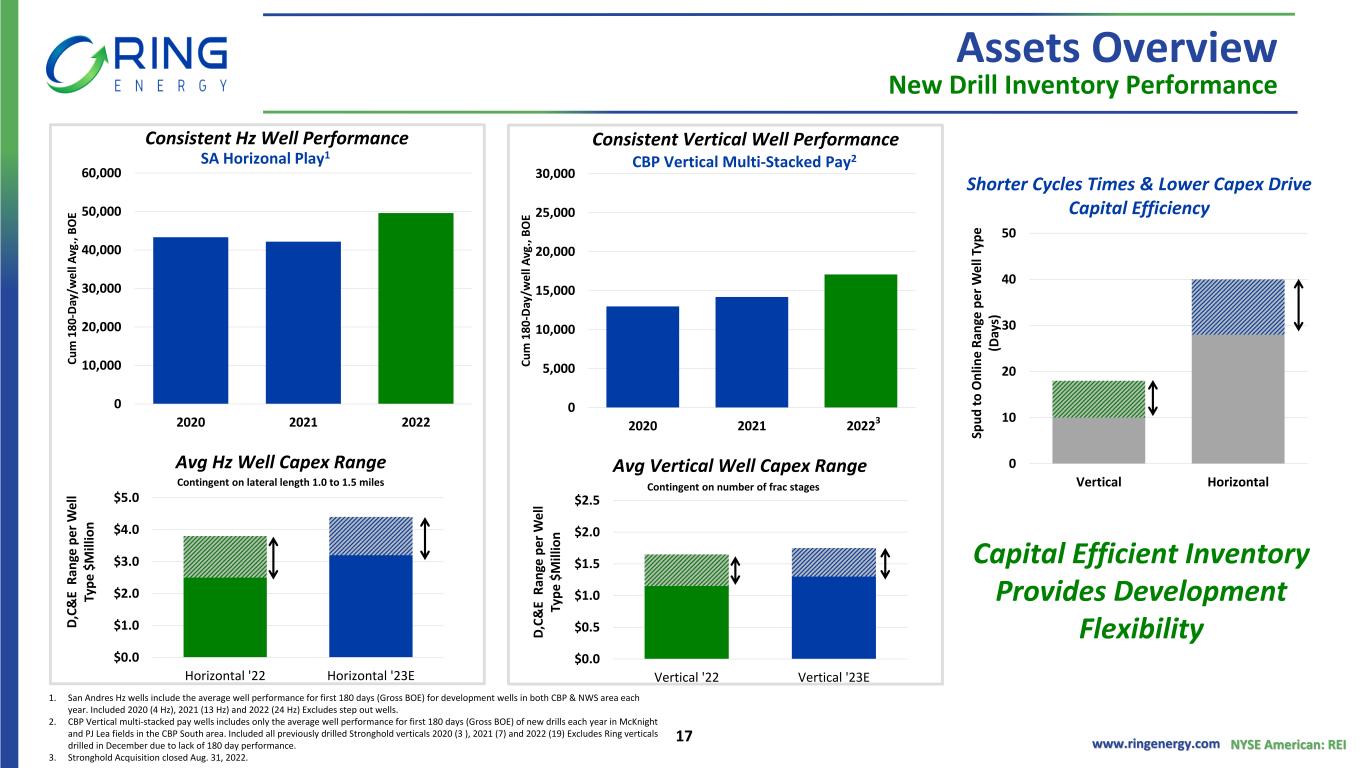
www.ringenergy.com NYSE American: REI 0 5,000 10,000 15,000 20,000 25,000 30,000 2020 2021 2022 C u m 1 8 0 -D ay /w e ll A vg ., B O E Assets Overview New Drill Inventory Performance 0 10 20 30 40 50 Vertical Horizontal Sp u d t o O n lin e R an ge p e r W e ll Ty p e (D ay s) Shorter Cycles Times & Lower Capex Drive Capital Efficiency Consistent Hz Well Performance SA Horizonal Play1 Oil 90% Oil 95% Oil 92% CBP Vertical Multi-Stacked Pay2 Avg Hz Well Capex Range Avg Vertical Well Capex Range Capital Efficient Inventory Provides Development Flexibility Consistent Vertical Well Performance 1. San Andres Hz wells include the average well performance for first 180 days (Gross BOE) for development wells in both CBP & NWS area each year. Included 2020 (4 Hz), 2021 (13 Hz) and 2022 (24 Hz) Excludes step out wells. 2. CBP Vertical multi-stacked pay wells includes only the average well performance for first 180 days (Gross BOE) of new drills each year in McKnight and PJ Lea fields in the CBP South area. Included all previously drilled Stronghold verticals 2020 (3 ), 2021 (7) and 2022 (19) Excludes Ring verticals drilled in December due to lack of 180 day performance. 3. Stronghold Acquisition closed Aug. 31, 2022. $0.0 $1.0 $2.0 $3.0 $4.0 $5.0 Horizontal '22 Horizontal '23E D ,C & E R an ge p e r W e ll Ty p e $ M ill io n $0.0 $0.5 $1.0 $1.5 $2.0 $2.5 Vertical '22 Vertical '23E D ,C & E R an ge p e r W e ll Ty p e $ M ill io n 0 10,000 20,000 30,000 40,000 50,000 60,000 2020 2021 2022 C u m 1 8 0 -D ay /w e ll A vg ., B O E Contingent on lateral length 1.0 to 1.5 miles 3 Contingent on number of frac stages 17


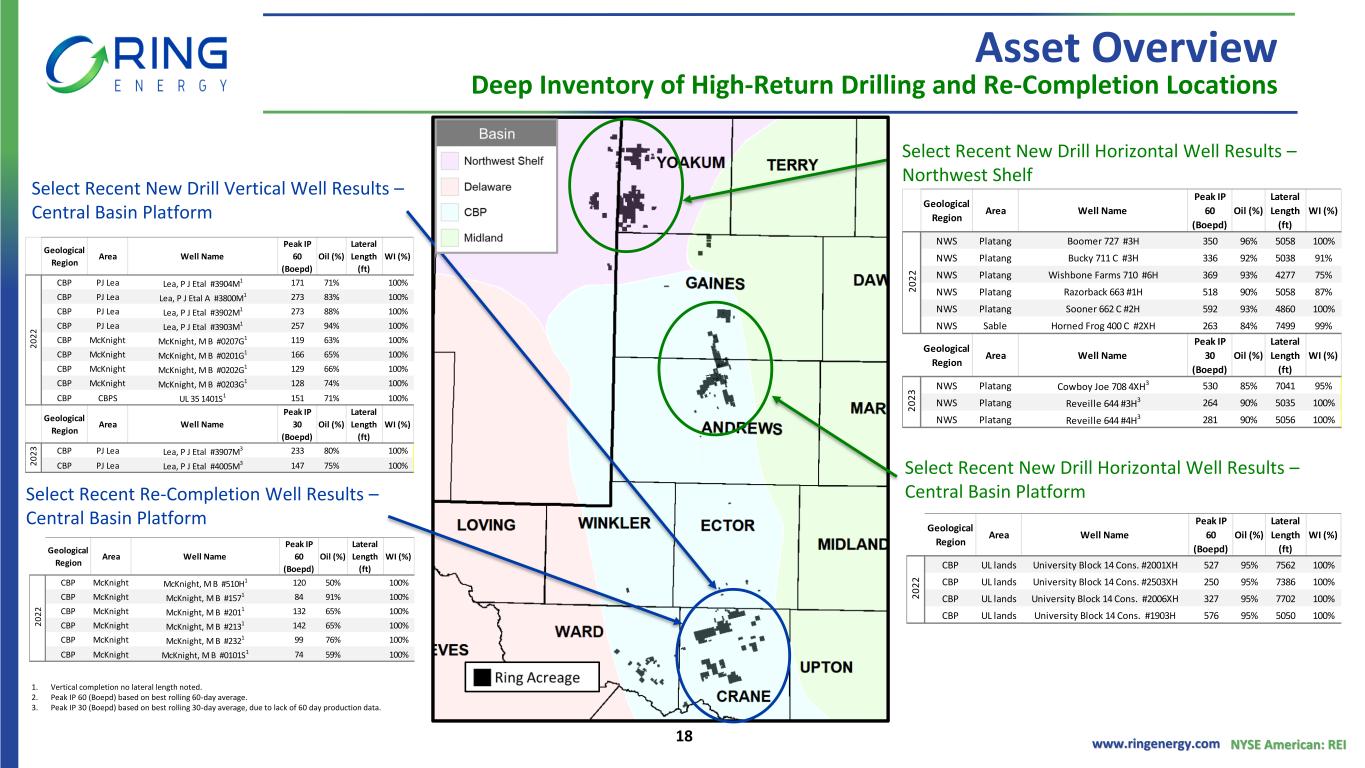
www.ringenergy.com NYSE American: REI Asset Overview Deep Inventory of High-Return Drilling and Re-Completion Locations Select Recent New Drill Horizontal Well Results – Northwest Shelf 1. Vertical completion no lateral length noted. 2. Peak IP 60 (Boepd) based on best rolling 60-day average. 3. Peak IP 30 (Boepd) based on best rolling 30-day average, due to lack of 60 day production data. Select Recent Re-Completion Well Results – Central Basin Platform Select Recent New Drill Horizontal Well Results – Central Basin Platform Select Recent New Drill Vertical Well Results – Central Basin Platform Geological Region Area Well Name Peak IP 60 (Boepd) Oil (%) Lateral Length (ft) WI (%) NWS Platang Boomer 727 #3H 350 96% 5058 100% NWS Platang Bucky 711 C #3H 336 92% 5038 91% NWS Platang Wishbone Farms 710 #6H 369 93% 4277 75% NWS Platang Razorback 663 #1H 518 90% 5058 87% NWS Platang Sooner 662 C #2H 592 93% 4860 100% NWS Sable Horned Frog 400 C #2XH 263 84% 7499 99% Geological Region Area Well Name Peak IP 30 (Boepd) Oil (%) Lateral Length (ft) WI (%) NWS Platang Cowboy Joe 708 4XH3 530 85% 7041 95% NWS Platang Reveille 644 #3H3 264 90% 5035 100% NWS Platang Reveille 644 #4H3 281 90% 5056 100% 2 0 2 2 2 0 2 3 Geological Region Area Well Name Peak IP 60 (Boepd) Oil (%) Lateral Length (ft) WI (%) CBP UL lands University Block 14 Cons. #2001XH 527 95% 7562 100% CBP UL lands University Block 14 Cons. #2503XH 250 95% 7386 100% CBP UL lands University Block 14 Cons. #2006XH 327 95% 7702 100% CBP UL lands University Block 14 Cons. #1903H 576 95% 5050 100% 2 0 2 2 Geological Region Area Well Name Peak IP 60 (Boepd) Oil (%) Lateral Length (ft) WI (%) CBP McKnight McKnight, M B #510H1 120 50% 100% CBP McKnight McKnight, M B #1571 84 91% 100% CBP McKnight McKnight, M B #2011 132 65% 100% CBP McKnight McKnight, M B #2131 142 65% 100% CBP McKnight McKnight, M B #2321 99 76% 100% CBP McKnight McKnight, M B #0101S1 74 59% 100% 2 0 2 2 Geological Region Area Well Name Peak IP 60 (Boepd) Oil (%) Lateral Length (ft) WI (%) CBP PJ Lea Lea, P J Etal #3904M1 171 71% 100% CBP PJ Lea Lea, P J Etal A #3800M1 273 83% 100% CBP PJ Lea Lea, P J Etal #3902M1 273 88% 100% CBP PJ Lea Lea, P J Etal #3903M1 257 94% 100% CBP McKnight McKnight, M B #0207G1 119 63% 100% CBP McKnight McKnight, M B #0201G1 166 65% 100% CBP McKnight McKnight, M B #0202G1 129 66% 100% CBP McKnight McKnight, M B #0203G1 128 74% 100% CBP CBPS UL 35 1401S1 151 71% 100% Geological Region Area Well Name Peak IP 30 (Boepd) Oil (%) Lateral Length (ft) WI (%) CBP PJ Lea Lea, P J Etal #3907M3 233 80% 100% CBP PJ Lea Lea, P J Etal #4005M3 147 75% 100% 2 0 2 2 2 0 2 3 18


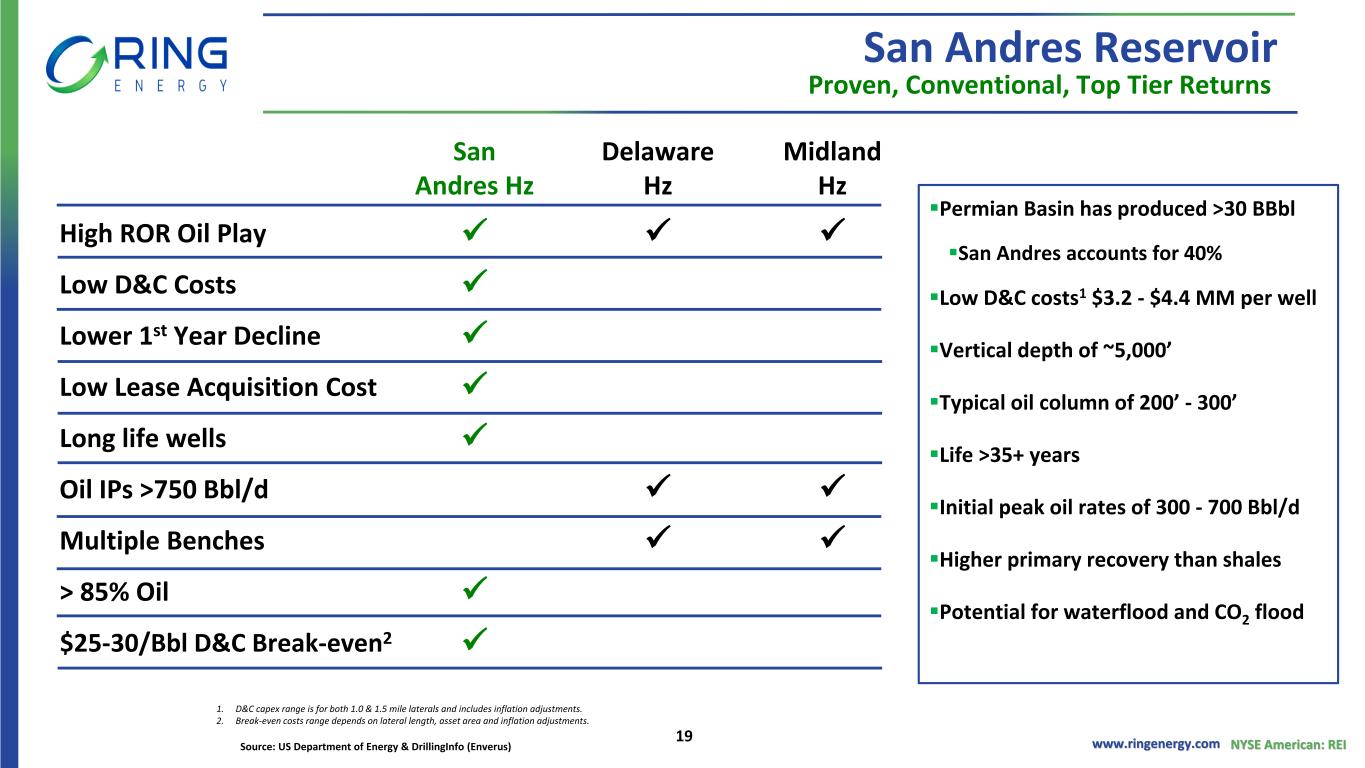
www.ringenergy.com NYSE American: REI San Andres Reservoir Proven, Conventional, Top Tier Returns San Andres Hz Delaware Hz Midland Hz High ROR Oil Play ✓ ✓ ✓ Low D&C Costs ✓ Lower 1st Year Decline ✓ Low Lease Acquisition Cost ✓ Long life wells ✓ Oil IPs >750 Bbl/d ✓ ✓ Multiple Benches ✓ ✓ > 85% Oil ✓ $25-30/Bbl D&C Break-even2 ✓ ▪Permian Basin has produced >30 BBbl ▪San Andres accounts for 40% ▪Low D&C costs1 $3.2 - $4.4 MM per well ▪Vertical depth of ~5,000’ ▪Typical oil column of 200’ - 300’ ▪Life >35+ years ▪Initial peak oil rates of 300 - 700 Bbl/d ▪Higher primary recovery than shales ▪Potential for waterflood and CO2 flood Source: US Department of Energy & DrillingInfo (Enverus) 1. D&C capex range is for both 1.0 & 1.5 mile laterals and includes inflation adjustments. 2. Break-even costs range depends on lateral length, asset area and inflation adjustments. 19


Financial Overview


www.ringenergy.com NYSE American: REI 70% 22% 8% D,C&E Recomp/Cap Workovers Land/Non-op/Other CAPEX Allocation Mid Point $152.5 million 2023 Guidance Grow Production, Generate FCF, Pay Down Debt Sales Volumes Q2 2023 FY 2023 Total (Boe/d) 17,900 – 18,400 17,800 – 18,800 Oil (%) 69% 66-70% NGLs (%) 15% 14-16% Gas (%) 16% 16-18% Capital Program Capital spending1 (millions) $34 – $38 $135 – $170 New Horizontal (Hz) wells drilled 4 12 – 15 New Vertical wells drilled 2-3 12 – 25 Wells completed and online 6-7 24 - 40 Operating Expenses LOE (per Boe) $11.00 – $11.40 $11.00 – $11.60 1. In addition to Company-directed drilling and completion activities, the capital spending outlook includes funds for targeted well reactivations, recompletions, workovers, infrastructure upgrades, and continuing the Company's successful CTR program in its NWS and CBP areas. Also included is anticipated spending for lease costs, contractual drilling obligations and non-operated drilling, completion and capital workovers. 21


www.ringenergy.com NYSE American: REI Historical Metrics Quarterly Analysis of FCF1 $35.6 $47.4 $56.0 $56.3 $58.6 -$19.7 -$41.8 -$40.3 -$42.6 -$38.9-$3.2 -$3.1 -$5.9 -$8.2 -$9.2 $12.6 $2.5 $9.7 $5.5 $10.5 -$50 -$40 -$30 -$20 -$10 $0 $10 $20 $30 $40 $50 $60 $70 Q1 2022 Q2 2022 Q3 2022 Q4 2022 Q1 2023 A d j. E B IT D A / C ap it al / In t Ex p Adj EBITDA $MM Capital $MM Interest Exp $MM Free Cash Flow $MM Leverage Ratio (LTM)2 2.13x2.80x 1.41x2 1.56x2 Disciplined and Efficient Capital Spending Focused on Sustainably Generating FCF Enhances Our Unrelenting Goal to Strengthen the Balance Sheet 1. Adjusted EBITDA, Free Cash Flow and Cash Flow from Operations are Non-GAAP financial measures. See Appendix for reconciliation to GAAP measures. 2. Leverage ratio based on annualized third and fourth quarter 2022 and first quarter 2023 EBITDA adjusted for the pro-forma effects of the Stronghold Transaction, as per our credit agreement. 3. Interest Expense included in table excluded deferred financing costs amortization. 1.65x2 3 22


www.ringenergy.com NYSE American: REI Reducing Debt & Increasing Liquidity Disciplined Capital Spending & Sustainably Generating FCF is the Key $8 $5 $6 $5 $10 $10 $17 $20 -$7 -$10 -$5 $0 $5 $10 $15 $20 $25 Q1'21 Q2'21 Q3'21 Q4'21 Q1'22 Q2'22 Q3'22 Q4'22 Q1'23 $ M ill io n Debt Paydown Stronghold Acquisition $313 MM outstanding debt with $36 MM in Surplus Cash $46 $51 $56 $62 $71 $82 $165 $188 $179 $0 $20 $40 $60 $80 $100 $120 $140 $160 $180 $200 Q1'21 Q2'21 Q3'21 Q4'21 Q1'22 Q2'22 Q3'22 Q4'22 Q1'23 $ M ill io n Liquidity1 Stronghold Acquisition 1. Liquidity is defined as cash on hand and available borrowings under the Company’s credit agreement. Stronghold Acquisition final deferred cash payment $15MM + $3.5mm post close adjustment Focused on Debt paydown remainder of 2023 23


Appendix


www.ringenergy.com NYSE American: REI Financial Overview Derivative Summary Oil Hedges (WTI) Q2 2023 Q3 2023 Q4 2023 Q1 2024 Q2 2024 Q3 2024 Q4 2024 Q1 2025 Swaps: Hedged volume (Bbl) 68,250 138,000 138,000 170,625 156,975 282,900 368,000 — Weighted average swap price $ 81.73 $ 76.19 $ 74.52 $ 67.40 $ 66.40 $ 65.49 $ 68.43 $ — Deferred premium puts: Hedged volume (Bbl) 288,925 186,300 165,600 45,500 45,500 — — — Weighted average strike price $ 85.30 $ 83.43 $ 83.78 $ 84.70 $ 82.80 $ — $ — $ — Weighted average deferred premium price $ 12.99 $ 13.09 $ 14.61 $ 17.15 $ 17.49 $ — $ — $ — Two-way collars: Hedged volume (Bbl) 124,450 119,163 113,285 194,003 189,347 92,000 — 348,750 Weighted average put price $ 52.18 $ 52.12 $ 52.07 $ 67.35 $ 67.40 $ 70.00 $ — $ 56.00 Weighted average call price $ 63.01 $ 62.80 $ 62.60 $ 84.42 $ 83.21 $ 81.20 $ — $ 76.75 Three-way collars: Hedged volume (Bbl) 16,800 16,242 15,598 — — — — — Weighted average first put price $ 45.00 $ 45.00 $ 45.00 $ — $ — $ — $ — $ — Weighted average second put price $ 55.00 $ 55.00 $ 55.00 $ — $ — $ — $ — $ — Weighted average call price $ 80.05 $ 80.05 $ 80.05 $ — $ — $ — $ — $ — Gas Hedges (Henry Hub) Q2 2023 Q3 2023 Q4 2023 Q1 2024 Q2 2024 Q3 2024 Q4 2024 Q1 2025 NYMEX Swaps: Hedged volume (MMBtu) 87,490 117,137 116,623 75,075 63,700 50,600 577,300 553,500 Weighted average swap price $ 3.34 $ 3.29 $ 3.29 $ 3.82 $ 3.82 $ 3.82 $ 4.57 $ 3.82 Two-way collars: Hedged volume (MMBtu) 425,043 611,318 579,998 591,500 568,750 552,000 — — Weighted average put price $ 3.19 $ 3.17 $ 3.15 $ 4.00 $ 4.00 $ 4.00 $ — $ — Call hedged volume (MMBtu) 425,043 611,318 579,998 591,500 568,750 552,000 — — Weighted average call price $ 4.59 $ 4.54 $ 4.50 $ 6.29 $ 6.29 $ 6.29 $ — $ — Gas Hedges (basis differential) Q2 2023 Q3 2023 Q4 2023 Q1 2024 Q2 2024 Q3 2024 Q4 2024 Q1 2025 Waha basis swaps: Hedged volume (MMBtu) 338,461 332,855 324,021 — — — — — Weighted average swap price (1) (1) (1) $ — $ — $ — $ — $ — (1) The WAHA basis swaps in place for the calendar year of 2023 consist of two derivative contracts, each with a fixed price of the Henry Hub natural gas price less a fixed amount (weighted average of $0.55 per MMBtu). 25


www.ringenergy.com NYSE American: REI Income Statement and Operational Stats Income Statement Operational Stats (1) Beginning July 1, 2022, revenues were reported on a three-stream basis, separately reporting crude oil, natural gas, and natural gas liquids volumes and sales. For periods prior to July 1, 2022, volumes and sales for natural gas liquids were presented with natural gas. (2) Boe is determined using the ratio of six Mcf of natural gas to one Bbl of oil (totals may not compute due to rounding). The conversion ratio does not assume price equivalency and the price on an equivalent basis for oil, natural gas, and natural gas liquids may differ significantly. Three Months Ended March 31, December 31, March 31, 2023 2022 2022 Net sales volumes: Oil (Bbls) 1,139,413 1,121,371 676,215 Natural gas (Mcf) 1,601,407 1,680,401 732,283 Natural gas liquids (Bbls)(1) 239,992 241,277 — Total oil, natural gas and natural gas liquids (Boe)(1)(2) 1,646,306 1,642,715 798,262 % Oil 69 % 68 % 85 % Average daily equivalent sales (Boe/d) 18,292 17,856 8,870 Average realized sales prices: Oil ($/Bbl) 73.36 81.62 93.80 Natural gas ($/Mcf) 0.66 2.39 6.49 Natural gas liquids ($/Bbls)(1) 14.30 17.21 0.00 Barrel of oil equivalent ($/Boe) 53.50 60.69 85.41 Average costs and expenses per Boe ($/Boe): Lease operating expenses 10.61 10.60 11.22 Gathering, transportation and processing costs 0.00 (0.01) 1.62 Ad valorem taxes 1.01 0.96 1.19 Oil and natural gas production taxes 2.68 3.16 4.03 Depreciation, depletion and amortization 12.92 12.71 12.25 Asset retirement obligation accretion 0.22 0.22 0.24 Operating lease expense 0.07 0.07 0.10 General and administrative (including share-based compensation) 4.33 5.08 6.92 General and administrative (excluding share-based compensation) 3.15 3.74 5.01 (Unaudited) Three Months Ended March 31, December 31, March 31, 2023 2022 2022 Oil, Natural Gas, and Natural Gas Liquids Revenues $ 88,082,912 $ 99,697,682 $ 68,181,032 Costs and Operating Expenses Lease operating expenses 17,472,691 17,411,645 8,953,165 Gathering, transportation and processing costs (823) (16,223) 1,296,858 Ad valorem taxes 1,670,613 1,570,039 951,954 Oil and natural gas production taxes 4,408,140 5,186,644 3,218,362 Depreciation, depletion and amortization 21,271,671 20,885,774 9,781,287 Asset retirement obligation accretion 365,847 365,747 188,242 Operating lease expense 113,138 113,138 83,590 General and administrative expense 7,130,139 8,346,896 5,522,277 Total Costs and Operating Expenses 52,431,416 53,863,660 29,995,735 Income from Operations 35,651,496 45,834,022 38,185,297 Other Income (Expense) Interest (expense) (10,390,279) (9,468,684) (3,398,361) Gain (loss) on derivative contracts 9,474,905 (19,330,689) (27,596,141) Other income 9,600 — — Net Other Income (Expense) (905,774) (28,799,373) (30,994,502) Income Before Provision for Income Taxes 34,745,722 17,034,649 7,190,795 Provision for Income Taxes (2,029,943) (2,541,980) (78,752) Net Income $ 32,715,779 $ 14,492,669 $ 7,112,043 Basic Earnings per share $ 0.18 $ 0.09 $ 0.07 Diluted Earnings per share $ 0.17 $ 0.08 $ 0.06 Basic Weighted-Average Shares Outstanding 177,984,323 162,743,445 100,192,562 Diluted Weighted-Average Shares Outstanding 190,138,969 178,736,799 124,004,178 26


www.ringenergy.com NYSE American: REI (Unaudited) March 31, 2023 December 31, 2022 ASSETS Current Assets Cash and cash equivalents $ 1,725,700 $ 3,712,526 Accounts receivable 37,660,752 42,448,719 Joint interest billing receivable, net 2,340,588 983,802 Derivative assets 6,355,541 4,669,162 Inventory 8,808,119 9,250,717 Prepaid expenses and other assets 1,571,604 2,101,538 Total Current Assets 58,462,304 63,166,464 Properties and Equipment Oil and natural gas properties, full cost method 1,502,859,154 1,463,838,595 Financing lease asset subject to depreciation 3,103,286 3,019,476 Fixed assets subject to depreciation 3,161,695 3,147,125 Total Properties and Equipment 1,509,124,135 1,470,005,196 Accumulated depreciation, depletion and amortization (311,144,968 ) (289,935,259 ) Net Properties and Equipment 1,197,979,167 1,180,069,937 Operating lease asset 1,642,572 1,735,013 Derivative assets 6,675,355 6,129,410 Deferred financing costs 16,678,589 17,898,973 Total Assets $ 1,281,437,987 $ 1,268,999,797 LIABILITIES AND STOCKHOLDERS’ EQUITY Current Liabilities Accounts payable $ 100,034,311 $ 111,398,268 Income tax liability 57,291 — Financing lease liability 745,537 709,653 Operating lease liability 404,834 398,362 Derivative liabilities 8,523,681 13,345,619 Notes payable — 499,880 Deferred cash payment — 14,807,276 Asset retirement obligations 635,843 635,843 Total Current Liabilities 110,401,497 141,794,901 Non-current Liabilities Deferred income taxes 10,471,669 8,499,016 Revolving line of credit 422,000,000 415,000,000 Financing lease liability, less current portion 923,391 1,052,479 Operating lease liability, less current portion 1,369,506 1,473,897 Derivative liabilities 7,406,483 10,485,650 Asset retirement obligations 29,623,015 29,590,463 Total Liabilities 582,195,561 607,896,406 Commitments and contingencies Stockholders' Equity Preferred stock - $0.001 par value; 50,000,000 shares authorized; no shares issued or outstanding — — Common stock - $0.001 par value; 225,000,000 shares authorized; 180,627,484 shares and 175,530,212 shares issued and outstanding, respectively 180,627 175,530 Additional paid-in capital 780,659,273 775,241,114 Accumulated deficit (81,597,474 ) (114,313,253 ) Total Stockholders’ Equity 699,242,426 661,103,391 Total Liabilities and Stockholders' Equity $ 1,281,437,987 $ 1,268,999,797 (Unaudited) Three Months Ended March 31, December 31, March 31, 2023 2022 2022 Cash Flows From Operating Activities Net income $ 32,715,779 $ 14,492,669 $ 7,112,043 Adjustments to reconcile net income to net cash provided by operating activities: Depreciation, depletion and amortization 21,271,671 20,885,774 9,781,287 Asset retirement obligation accretion 365,847 365,747 188,242 Amortization of deferred financing costs 1,220,384 1,222,400 199,274 Share-based compensation 1,943,696 2,198,043 1,521,910 Bad debt expense 2,894 242,247 — Deferred income tax expense 1,972,653 2,890,984 65,939 Excess tax expense (benefit) related to share-based compensation — (312,268) — (Gain) loss on derivative contracts (9,474,905) 19,330,689 27,596,141 Cash paid for derivative settlements, net (658,525) (13,932,072) (14,115,501) Changes in assets and liabilities: Accounts receivable 3,428,287 4,086,757 (10,078,098) Inventory 442,598 (5,597,845) — Prepaid expenses and other assets 529,934 1,145,031 202,885 Accounts payable (9,589,898) 16,816,386 2,519,011 Settlement of asset retirement obligation (490,319) (193,036) (553,368) Net Cash Provided by Operating Activities 43,680,096 63,641,506 24,439,765 Cash Flows From Investing Activities Payments for the Stronghold Acquisition (18,511,170) 5,535,839 — Payments to purchase oil and natural gas properties (59,099) (352,012) (360,848) Payments to develop oil and natural gas properties (36,939,307) (45,556,105) (13,860,249) Payments to acquire or improve fixed assets subject to depreciation (14,570) (161,347) (10,114) Sale of fixed assets subject to depreciation — — 8,500 Proceeds from divestiture of oil and natural gas properties 54,558 (1,366) — Net Cash (Used in) Investing Activities (55,469,588) (40,534,991) (14,222,711) Cash Flows From Financing Activities Proceeds from revolving line of credit 56,000,000 44,000,000 10,000,000 Payments on revolving line of credit (49,000,000) (64,000,000) (20,000,000) Proceeds from issuance of common stock from warrant exercises 3,613,941 640,000 — Payments for taxes withheld on vested restricted shares, net (134,381) (256,715) — Proceeds from notes payable — 78,051 — Payments on notes payable (499,880) (455,802) (367,381) Payment of deferred financing costs — (129,026) — Reduction of financing lease liabilities (177,014) (161,064) (118,778) Net Cash Provided by (Used in) Financing Activities 9,802,666 (20,284,556) (10,486,159) Net Increase (Decrease) in Cash (1,986,826) 2,821,959 (269,105) Cash at Beginning of Period 3,712,526 890,567 2,408,316 Cash at End of Period $ 1,725,700 $ 3,712,526 $ 2,139,211 Balance Sheet and Cash Flow Statement Balance Sheet Cash Flow 27


www.ringenergy.com NYSE American: REI Non-GAAP Disclosure Certain financial information included in this Presentation are not measures of financial performance recognized by accounting principles generally accepted in the United States (“GAAP”). These non-GAAP financial measures are “Adjusted Net Income,” “Adjusted EBITDA,” “Free Cash Flow,” “Cash Flow from Operations,” “Return on Capital Employed” or “ROCE,” and “Leverage.” Management uses these non-GAAP financial measures in its analysis of performance. In addition, Adjusted EBITDA is a key metric used to determine the Company’s incentive compensation awards. These disclosures may not be viewed as a substitute for results determined in accordance with GAAP and are not necessarily comparable to non-GAAP performance measures which may be reported by other companies. Adjusted Net Income is calculated as net income minus the estimated after-tax impact of share-based compensation, ceiling test impairment, and unrealized loss (gain) on change in fair value of derivatives. Adjusted Net Income is presented because the timing and amount of these items cannot be reasonably estimated and affect the comparability of operating results from period to period, and current periods to prior periods. The Company defines Adjusted EBITDA as net income (loss) plus net interest expense, unrealized loss on change in fair value of derivatives, ceiling test impairment, income tax (benefit) expense, depreciation, depletion and amortization and accretion, asset retirement obligation accretion and share-based compensation. Company management believes this Presentation is relevant and useful because it helps investors understand Ring’s operating performance and makes it easier to compare its results with those of other companies that have different financing, capital and tax structures. Adjusted EBITDA should not be considered in isolation from or as a substitute for net income, as an indication of operating performance or cash flows from operating activities or as a measure of liquidity. Adjusted EBITDA, as Ring calculates it, may not be comparable to Adjusted EBITDA measures reported by other companies. In addition, Adjusted EBITDA does not represent funds available for discretionary use. The Company defines Free Cash Flow as Adjusted EBITDA (defined above) less net interest expense (excluding amortization of deferred financing cost) and capital expenditures. For this purpose, the Company’s definition of capital expenditures includes costs incurred related to oil and natural gas properties (such as drilling and infrastructure costs and the lease maintenance costs) and equipment, furniture and fixtures, but excludes acquisition costs of oil and gas properties from third parties that are not included in the Company’s capital expenditures guidance provided to investors. Company management believes that Free Cash Flow is an important financial performance measure for use in evaluating the performance and efficiency of its current operating activities after the impact of accrued capital expenditures and net interest expense and without being impacted by items such as changes associated with working capital, which can vary substantially from one period to another. There is no commonly accepted definition for Free Cash Flow within the industry. Accordingly, Free Cash Flow, as defined and calculated by the Company, may not be comparable to Free Cash Flow or other similarly named non-GAAP measures reported by other companies. While the Company includes net interest expense in the calculation of Free Cash Flow, other mandatory debt service requirements of future payments of principal at maturity (if such debt is not refinanced) are excluded from the calculation of Free Cash Flow. These and other non-discretionary expenditures that are not deducted from Free Cash Flow would reduce cash available for other uses. PV-10 is a financial measure not prepared in accordance with GAAP that differs from a measure under GAAP known as “standardized measure of discounted future net cash flows” in that PV-10 is calculated without including future income taxes. Management believes that the presentation of the PV-10 value of its oil and natural gas properties is relevant and useful to investors because it presents the estimated discounted future net cash flows attributable to its estimated proved reserves independent of its income tax attributes, thereby isolating the intrinsic value of the estimated future cash flows attributable to its reserves. Management believes the use of a pre-tax measure provides greater comparability of assets when evaluating companies because the timing and quantification of future income taxes is dependent on company-specific factors, many of which are difficult to determine. For these reasons, management uses and believes that the industry generally uses the PV-10 measure in evaluating and comparing acquisition candidates and assessing the potential rate of return on investments in oil and natural gas properties. PV-10 does not necessarily represent the fair market value of oil and natural gas properties. PV-10 is not a measure of financial or operational performance under GAAP, nor should it be considered in isolation or as a substitute for the standardized measure of discounted future net cash flows as defined under GAAP. The Company also presents the non-GAAP financial measure Cash Flow from Operations. The Company defines Cash Flow from Operations as net cash provided by operating activities plus changes in operating assets and liabilities. The Company defines Return on Capital Employed or ROCE as cash flow from operations adjusted for working capital divided by average debt and shareholder equity for the period. The Company defines Leverage or the Leverage Ratio as [total debt or other debt amount] divided by the annualized third and fourth quarter 2022 and first quarter 2023 EBITDA adjusted for the pro-forma effects of the Stronghold Transaction, as per the Credit Agreement The table below provides a reconciliation of PV-10 to the standardized measure of discounted future net cash flows as of December 31, 2022. 1. Six Mcf is deemed the equivalent of one Boe 2. PV-10 is a non-GAAP financial measure. See below for reconciliation. 28


www.ringenergy.com NYSE American: REI (Unaudited for All Periods) Three Months Ended March 31, December 31, March 31, 2023 2022 2022 Net Cash Provided by Operating Activities $ 43,680,096 $ 63,641,506 $ 24,439,765 Changes in operating assets and liabilities 5,679,398 (16,257,293) 7,909,570 Cash Flow from Operations $ 49,359,494 $ 47,384,213 $ 32,349,335 (Unaudited) Three Months Ended March 31, December 31, March 31, 2023 2022 2022 Net Income $ 32,715,779 $ 14,492,669 $ 7,112,043 Share-based compensation 1,943,696 2,198,043 1,521,910 Unrealized loss (gain) on change in fair value of derivatives (10,133,430) 5,398,617 13,480,640 Transaction costs - Stronghold Acquisition — 993,027 — Tax impact on adjusted items 478,467 (1,281,788) 164,305 Adjusted Net Income $ 25,004,512 $ 21,800,568 $ 22,278,898 Weighted-Average Shares Outstanding 177,984,323 162,743,445 100,192,562 Adjusted Net Income per Share $ 0.14 $ 0.13 $ 0.22 Non-GAAP Reconciliations ROCE 12/31/2022 12/31/2021 12/31/2020 Average Debt $ 352,500,000 $ 301,500,000 $ 339,750,000 Average Equity 480,988,237 297,695,010 409,137,873 Average debt and shareholder equity 833,488,237 599,195,010 748,887,873 CFFO (Cash Flow From Operations) Calculation Total CFFO $ 196,976,729 $ 72,731,212 $ 72,159,255 Less change in WC (Working Capital) (24,091,577) (3,236,824) (2,418,446) Total CFFO without WC $ 172,885,152 $ 69,494,388 $ 69,740,809 CROCE (CFFO Adj for WC)/(Average D+E) 20.7% 11.6% 9.3% (Unaudited) Adjusted Net Income (Unaudited for All Periods) Three Months Ended March 31, December 31, March 31, 2023 2022 2022 Net Income $ 32,715,779 $ 14,492,669 $ 7,112,043 Interest expense, net 10,390,279 9,468,684 3,398,361 Unrealized loss (gain) on change in fair value of derivatives (10,133,430) 5,398,617 13,480,640 Income tax expense 2,029,943 2,541,980 78,752 Depreciation, depletion and amortization 21,271,671 20,885,774 9,781,287 Asset retirement obligation accretion 365,847 365,747 188,242 Transaction costs - Stronghold Acquisition — 993,027 — Share-based compensation 1,943,696 2,198,043 1,521,910 Adjusted EBITDA $ 58,583,785 $ 56,344,541 $ 35,561,235 Adjusted EBITDA Margin 67 % 57 % 52 % Weighted-Average Shares Outstanding 177,984,323 162,743,445 100,192,562 Adjusted EBITDA per Share $ 0.33 $ 0.35 $ 0.35 Adjusted EBITDA (Unaudited for All Periods) Three Months Ended March 31, December 31, March 31, 2023 2022 2022 Adjusted EBITDA $ 58,583,785 $ 56,344,541 $ 35,561,235 Net interest expense (excluding amortization of deferred financing costs) (9,169,895) (8,246,284) (3,199,087) Capital expenditures (38,925,497) (42,618,754) (19,743,693) Proceeds from divestiture of oil and natural gas properties 54,558 (1,366) — Free Cash Flow $ 10,542,951 $ 5,478,137 $ 12,618,455 Free Cash Flow Cash Flow from Operations 29


www.ringenergy.com NYSE American: REI Corporate Strategy Summary 2022 Value Focused for Sustainable Returns Attract and Retain Highly Qualified People Pursue Operational Excellence with a Sense of Urgency Invest in High-Margin, High RoR Projects Focus on FCF2 and Strengthen Balance Sheet Pursue Strategic A&D to Lower Breakeven Costs ✓Successfully attracting key personnel with <3% attrition rates while decreasing G&A per Boe ✓Safely set record production with increased efficiency and environmental stewardship ✓Increased ROCE1 to over 20% in 2022 ✓Multi-year generation of FCF while reducing leverage3 to ~1.56x and increasing liquidity4 205% ✓Closed transformational acquisition that led to improved metrics 1. We define ROCE as the return on capital employed. 2. ROCE and FCF are non-GAAP financial measures. See Appendix for reconciliation to GAAP measures. 3. Leverage ratio based on annualized third and fourth quarter 2022 and first quarter 2023 EBITDA adjusted for the pro-forma effects of the Stronghold Transaction, as per the Credit Agreement. 4. Liquidity is defined as cash on hand and available borrowings under the Company’s credit agreement. 30


www.ringenergy.com NYSE American: REI Add Photo Add Photo Add Photo Paul D. McKinney Chairman & Chief Executive Officer 39+ years of domestic & international oil & gas industry experience Executive & board roles include CEO, President, COO, Region VP and public & private board directorships Travis Thomas EVP & Chief Financial Officer 18+ years of oil & gas industry experience & accounting experience High level financial experience including CAO, VP Finance, Controller, Treasurer Alexander Dyes EVP of Engineering & Corporate Strategy 16+ years of oil & gas industry experience Multi-disciplined experience including VP A&D, VP Engineering, Director Strategy, multiple engineering & operational roles Marinos Baghdati EVP of Operations 19+ years of oil & gas industry experience Operational experience in drilling, completions and production including VP Operations, Operations manager, multiple engineering roles Stephen D. Brooks EVP of Land, Legal, HR & Marketing 45+ years of oil & gas industry experience Extensive career as landman including VP Land & Legal, VP HR VP Land and Land Manager Hollie Lamb VP of NonOP Reservoir Engineering / O&G Marketing 20+ years of oil & gas industry experience Previously Partner of HeLMS Oil & Gas, VP Engineering, Reservoir & Geologic Engineer Experienced Management Team Shared Vision with a Track Record of Success 31


www.ringenergy.com NYSE American: REI Paul D. McKinney Chairman & Chief Executive Officer 35+ years of domestic & international oil & gas industry experience Executive & board roles include CEO, President, COO, Region VP and public & private board directorships Anthony D. Petrelli Lead Independent Director 43+ years of banking, capital markets, governance & financial experience Executive and Board positions include CEO, President, multiple board chairs & directorships Refreshed Board of Directors Accomplished and Diversified Experience Roy I. Ben-Dor Director 14+ years of finance & capital markets experience Extensive financial and capital markets acumen and experience including Managing Director and numerous Board Director positions David S. Habachy Independent Director 24+ years of oil & gas industry, finance & capital markets experience Wide range of operations, engineering, financial and capital markets roles and experience including Managing Director and numerous Board Director positions John A. Crum Independent Director 45+ years of domestic & international oil & gas industry experience Extensive executive roles including CEO, President & COO, and multiple public & private board chairs & directorships Richard E. Harris Independent Director 40+ years of experience across multiple industries Executive positions in oil & gas, industrial equipment, and technology including CIO, Treasurer, Finance and Business Development Thomas L. Mitchell Independent Director 35+ years of domestic & international oil & gas industry experience Executive & board roles include CFO, VP Accounting, Controller and public & private board directorships Regina Roesener Independent Director 35+ years of banking, capital markets, governance & financial experience Executive and Board positions including COO, director and Board Director positions Clayton E. Woodrum Independent Director 50+ years of accounting, tax & finance experience Wide range of financial acumen including positions as CFO, Partner in Charge and Board Director positions 32


ANALYST COVERAGE Alliance Global Partners (A.G.P.) Jeff Grampp (713) 349-1067 [email protected] ROTH Capital Partners John M. White (949) 720-7115 [email protected] Truist Financial Neal Dingmann (713) 247-9000 [email protected] Tuohy Brothers Investment Noel Parks (215) 913-7320 [email protected] Water Tower Research Jeff Robertson (469) 343-9962 [email protected] COMPANY CONTACT Al Petrie (281) 975-2146 [email protected] Chris Delange (281) 975-2146 [email protected]