Exhibit 99.1

| FOR IMMEDIATE RELEASE | |
NYSE American – REI |
RING ENERGY ANNOUNCES RECORD RESULTS FOR THIRD
QUARTER OF 2022
~ Closed Transformational Acquisition and
Increased Production, Revenue, Net Income, Adjusted EBITDA and Free Cash Flow ~
The Woodlands, Texas – November 9, 2022
– Ring Energy, Inc. (NYSE American: REI) (“Ring” or the “Company”) today reported operational and financial
results for the third quarter of 2022. In addition, Ring reiterated its fourth quarter guidance and preliminary outlook for 2023. Third
quarter results include the impact from the acquisition (the “Stronghold Transaction”) of the assets of privately held Stronghold
Energy II Operating, LLC and Stronghold Energy II Royalties, LP (collectively, “Stronghold”) for only the month of September
2022 following the closing of the transaction. Ring further commented that it applied three-stream revenue reporting with the results
disclosed today.
Third Quarter 2022 Highlights
| · | Announced the Stronghold Transaction on July
5, 2022 and closed the acquisition on August 31, 2022. The combined results were: |
| o | A material improvement in Ring’s financial position, including substantially increasing liquidity
and significantly decreasing the Company’s leverage ratio; and |
| o | A significant increase in the Company’s inventory of high rate-of-return and capital efficient investment
opportunities, which substantially improves Ring’s cash flow generation and ability to more quickly pay down debt assuming current
oil and gas prices continue; |
| · | Recorded the highest quarterly sales revenue
in the Company’s history of $94.4 million, an 11% increase from the second quarter of 2022; |
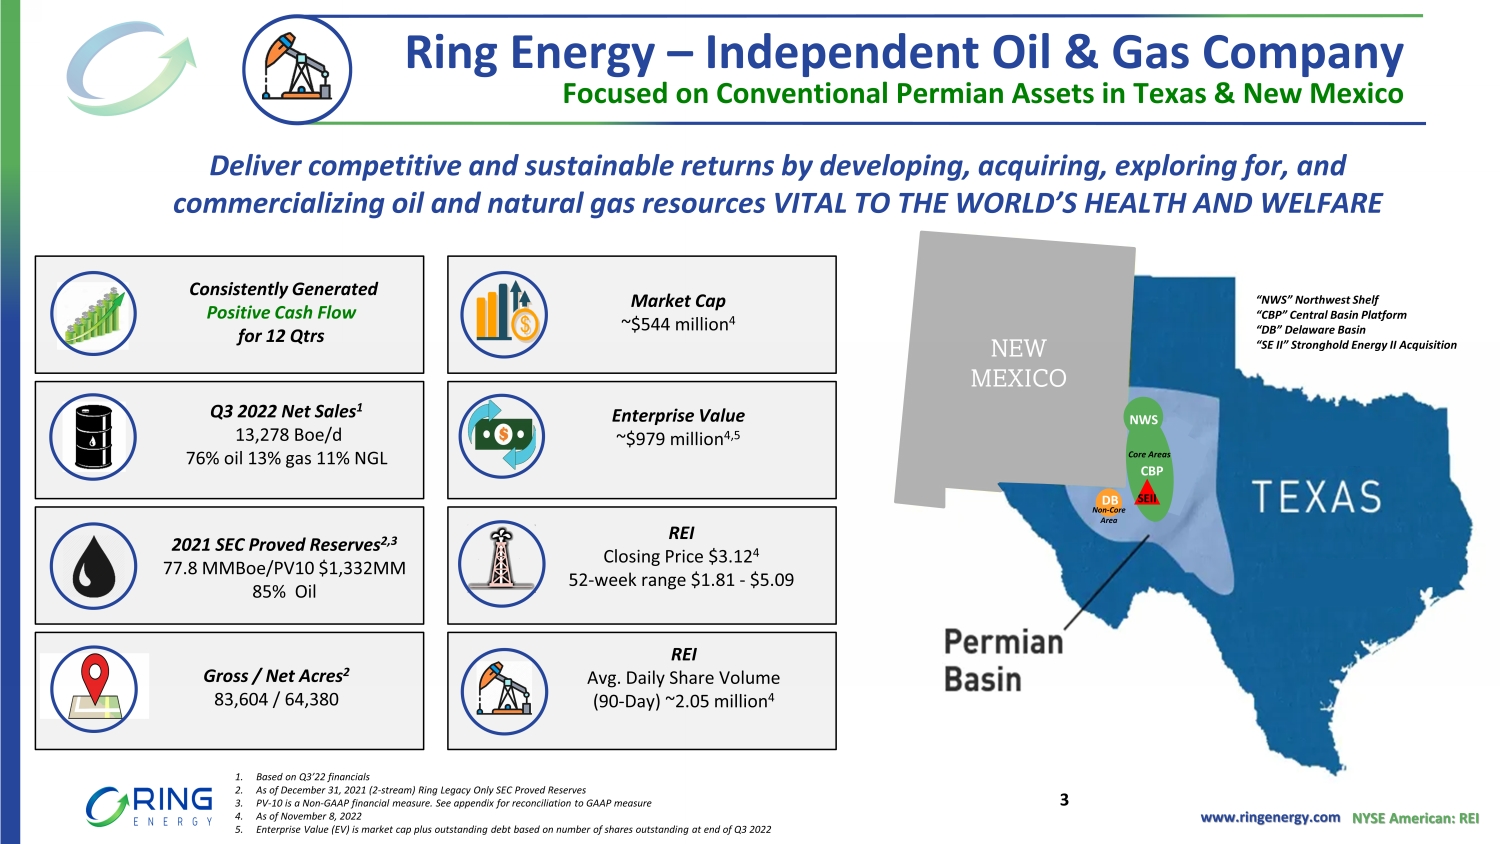
| · | Increased sales volumes to 13,278 barrels of
oil equivalent per day (“Boe/d”) (76% oil, 13% natural gas and 11% natural gas liquids (“NGLs”)) compared to 9,341
Boe/d for the second quarter of 2022; |
| · | Reported Net Income growth of 79% to $75.1 million,
or $0.49 per diluted share, from $41.9 million, or $0.32 per diluted share, for the second quarter of 2022; |
| · | Adjusted Net Income1 grew by 1% to
$32.5 million, or $0.28 per share from $31.3 million, or $0.29 per share, in the second quarter of 2022; |
| · | Increased Adjusted EBITDA1 by 18%
to $56.0 million, the highest level of quarterly Adjusted EBITDA in the Company’s history, from $47.4 million for the second quarter
of 2022; |
| · | Generated Cash Flow from Operations1
of $48.9 million and Free Cash Flow1 of $9.7 million, reflecting growth from the second quarter of 2022 of 10% and 290%, respectively;
|
| o | Represents 12th consecutive quarter of Free Cash Flow; |
| · | Paid down $17.0 million of debt on the Company’s
revolving credit facility during the third quarter since closing of the Stronghold Transaction; |
| o | Reduced Leverage Ratio2 to 1.4x compared to 3.5x at year end 2021; |
| o | Increased liquidity to approximately $165 million – an increase in excess of 165% and more than
$100 million higher than year-end 2021; |
| · | Continued the successful execution of its 2022
development program, including: |
| o | Drilled eight horizontal (“Hz”) wells during Q3 2022 with five in the Northwest Shelf (“NWS”)
and three in the Central Basin Platform (“CBP”) bringing the total number of horizontal wells drilled year to date to 23; |
| o | Completed and placed on production nine Hz wells of which four were drilled in Q2 2022 and five were drilled
in Q3 2022, bringing the total number of wells placed on production year to date to 20; |
| o | Performed three recompletions in Q3 2022 on the Stronghold acquisition acreage; |
| o | Converted six wells with electrical submersible pumps to rod pumps (“CTRs”) on horizontal
wells, including five in NWS and one on its CBP acreage in Q3 2022; and |
| · | Reiterated the Company’s fourth quarter
guidance and preliminary outlook for 2023. |
| 1. | Adjusted Net Income, Adjusted EBITDA, Free Cash Flow, and Cash Flow from Operations are non-GAAP financial
measures, which are described in more detail and reconciled to the most comparable GAAP measures, in the tables shown later in this release
under “Non-GAAP Information.” |
| 2. | Based on annualized third quarter EBITDA adjusted for the pro-forma effects of the Transaction from the
beginning of the quarter, as per the Credit Agreement. |
Management Commentary
Mr. Paul D. McKinney, Chairman of the Board
and Chief Executive Officer, commented, “The third quarter of 2022 initiated a transformational period for our Company and its
shareholders that better positions Ring for long term success. The immediately accretive acquisition of Stronghold’s
complementary CBP asset base substantially increases our size and scale, materially grows our inventory of low cost and high
rate-of-return inventory of projects, significantly enhances the opportunity for Free Cash Flow generation, and lowers our overall
cost structure. The combined result strengthens our balance sheet and provides the opportunity to accelerate the reduction of our
debt. Our improved financial position will prove invaluable as we evaluate opportunities to build on our success and execute on our
value driven strategy to improve the long-term interests of our shareholders.”
Mr. McKinney continued, “Contributing to
our outstanding results for the third quarter was one month of positive impact from the recently acquired Stronghold assets, the continued
strong performance of our legacy development program where we brought online nine horizontal wells, and a solid commodity price backdrop.
This combination led to financial outperformance, including record quarterly revenue and Adjusted EBITDA. We were also pleased to generate
Free Cash Flow for the 12th consecutive quarter that we used to pay down debt by $17 million since the closing of the Stronghold
Transaction. As a result of the Transaction and continued strength in our legacy business, the borrowing base on our credit facility was
increased more than 70% to $600 million. As a result, we ended the quarter with more than $165 million of liquidity, which was more than
$100 million higher than the end of 2021 and represents an increase of more than 165%.”
Mr. McKinney concluded, “The results of
our 2022 development program continues to meet or exceed our expectations. The increased capital efficiency provided by our materially
expanded inventory of high rate-of-return drilling and recompletion projects will allow us to optimize our future free cash flow, which
will provide the opportunity to pay down debt faster than we could have done on a standalone basis. As we look to our development plans
for 2023, as we have done in the past, we have designed our capital program with flexibility to respond to changes in commodity prices.
The initial goal will be to maintain or slightly grow our average sales volumes from the levels we anticipate for the fourth quarter and
allocate excess free cash flow to paying down debt in a $75 to $90 barrel of oil price environment. If prices sustainably remain above
that range, we will capitalize on additional opportunities that maximize shareholder value. This could include the acceleration of debt
reduction, expanding our development program to organically grow production, further pursue targeted acquisitions, or the return of capital
to shareholders. Regardless of what the future may bring, I am pleased with our improved financial position as well as the enhanced flexibility
that we enjoy. Of course, we would not be where we are today without the tireless efforts of our incredible workforce, and I want to thank
all of them for their continued hard work and dedication as we collectively focus on improving long-term shareholder value.”
Financial Overview: For the third
quarter of 2022, the Company reported net income of $75.1 million, or $0.49 per diluted share, which included a $47.7 million before
tax non-cash unrealized commodity derivative gain, $1.5 million in before tax share-based compensation and $1.1 million of
transaction related costs. Excluding the estimated after-tax impact of the adjustments, the Company’s Adjusted Net Income was
$32.5 million, or $0.28 per share. In the second quarter of 2022, the Company reported net income of $41.9 million, or $0.32 per
diluted share, which included a $12.2 million before tax non-cash unrealized commodity derivative gain, and $1.9 million in before
tax share-based compensation. Excluding the estimated after-tax impact of the adjustments, the Company’s Adjusted Net Income
was $31.3 million, or $0.29 per share. In the third quarter of 2021, Ring reported net income of $14.2 million, or $0.12 per diluted
share, which included a $8.2 million before tax non-cash unrealized commodity derivative gain, and $0.8 million in before tax
share-based compensation. Excluding the estimated after-tax impact of these adjustments, Adjusted Net Income in the third quarter of
2021 was $6.7 million, or $0.07 per share.
Adjusted EBITDA grew by 18% to $56.0 million for
the third quarter of 2022 from $47.3 million in the second quarter of 2022, with the increase primarily driven by higher sales volumes.
Third quarter of 2021 Adjusted EBITDA was $19.7 million.
Free Cash Flow was $9.7 million for the third
quarter of 2022 versus $2.5 million in the second quarter of 2022 – a 290% increase. Cash Flow from Operations grew by 10% to $48.9
million for the third quarter of 2022 from $44.3 million in the second quarter of 2022. Cash Flow from Operations for the third quarter
of 2021 was $16.4 million.
Adjusted Net Income, Adjusted EBITDA, Free
Cash Flow, and Cash Flow from Operations are non-GAAP financial measures, which are described in more detail and reconciled to the most
comparable GAAP measures, in the tables shown later in this release under “Non-GAAP Information.”
Sales Volumes, Prices and Revenues: As
a result of the Stronghold Transaction, beginning July 1, 2022, the Company began reporting revenues on a three-stream basis, separately
reporting crude oil, natural gas, and NGLs sales. For periods prior to July 1, 2022, sales and reserve volumes, prices, and revenues for
NGLs were included in natural gas.
Sales volumes for the third quarter of 2022 were
13,278 Boe/d (76% oil, 13% natural gas and 11% NGLs), or 1,221,616 Boe, compared to 9,341 Boe/d (86% oil and 14% natural gas), or 850,017
Boe, for the second quarter of 2022, and 8,243 Boe/d (87% oil and 13% natural gas), or 758,387 Boe, in the third quarter of 2021. Third
quarter 2022 sales volumes were comprised of 932,770 barrels (“Bbls”) of oil, 952,762 thousand cubic feet (“Mcf”)
of natural gas, and 130,052 Bbls of NGLs.
For the third quarter of 2022, the Company
realized an average sales price (before the impact of hedging) of $92.64 per barrel of crude oil, $4.89 per Mcf for natural gas and
$25.68 per barrel of NGLs. The combined average realized sales price for the period was $77.28 per Boe versus $99.95 per Boe for the
second quarter of 2022 and $65.11 per Boe in the third quarter of 2021. The average oil price differential the Company experienced
from WTI NYMEX futures pricing in the third quarter of 2022 was a positive $2.28 per barrel of crude oil, while the average natural
gas price differential from NYMEX futures pricing was a negative $3.15 per Mcf.
Revenues grew by 11% to $94.4 million for the
third quarter of 2022 from $85.0 million in the second quarter of 2022, with the increase associated with higher sales volumes partially
offset by lower realized pricing. Third quarter of 2022 revenues increased 91% from $49.4 million in the third quarter of 2021. The increase
was driven by higher sales volumes and increased realized oil pricing.
Lease Operating Expense (“LOE”):
LOE, which includes expensed workovers and facilities maintenance, was $13.0 million, or $10.67 per Boe, in the third quarter of 2022
versus $8.3 million, or $9.77 per Boe, in second quarter of 2022 and $7.0 million, or $9.21 per Boe, for the third quarter of 2021. Primarily
contributing to the sequential increase in third quarter 2022 LOE on an absolute and per Boe basis was higher labor costs and industry
wide inflationary pressures, as well as the Stronghold Transaction, with associated costs beginning on September 1, 2022.
Gathering, Transportation and Processing (“GTP”)
Costs: As previously disclosed, due to a contractual change effective May 1, 2022, the Company no longer maintains ownership and control
of natural gas through processing. As a result, GTP costs are now reflected as a reduction to the natural gas sales price and not as an
expense line item.
Ad Valorem Taxes: Ad valorem taxes were
$0.98 per Boe for the third quarter of 2022 compared to $1.12 per Boe in the second quarter of 2022 and $0.93 per Boe for the third quarter
of 2021.
Production Taxes: Production taxes were
$3.74 per Boe in the third quarter of 2022 compared to $4.89 per Boe in the second quarter of 2022 and $2.95 per Boe in third quarter
of 2021. Production taxes remained steady at 4.5% to 4.9% of revenue for all three periods.
Depreciation, Depletion and Amortization (“DD&A”)
and Asset Retirement Obligation Accretion: DD&A was $11.73 per Boe in the third quarter of 2022 versus $12.65 per Boe for the
second quarter of 2022 and $12.28 per Boe in the third quarter of 2021. Asset retirement obligation accretion was $0.20 per Boe in the
third quarter of 2022 compared to $0.22 per Boe in the second quarter of 2022 and $0.24 per Boe in the third quarter of 2021.
Operating Lease Expense: Operating lease
expense was $83,590 for the third and second quarters of 2022, and $83,589 in the third quarter of 2021. Operating lease expenses are
primarily associated with the Company’s office leases.
General and Administrative Expenses
(“G&A”): G&A, excluding non-cash share-based compensation, was $5.9 million, or $4.79 per Boe, in the third
quarter of 2022 versus $3.9 million, or $4.63 per Boe, in the second quarter of 2022 and $3.7 million, or $4.82 per Boe, in the
third quarter of 2021. The third quarter of 2022 included $1.1 million of transaction related costs for the Stronghold acquisition.
Adjusted for transaction related costs, G&A, excluding non share-based compensation, for the third quarter of 2022 was $4.7
million, or $3.85 per Boe.
Interest Expense: Interest expense was
$7.0 million in the third quarter of 2022 versus $3.3 million for the second quarter of 2022 and $3.6 million for the third quarter of
2021. Interest expense increased for both comparative periods substantially due to a higher average daily balance of long-term debt associated
with additional borrowings on the Company’s revolving credit facility associated with the closing of the Stronghold Transaction
on August 31, 2022.
Derivative (Loss) Gain: In the third quarter
of 2022, Ring recorded a net gain of $32.9 million on its commodity derivative contracts, including a realized $14.8 million cash commodity
derivative loss and an unrealized $47.7 million non-cash commodity derivative gain. This compared to a net loss of $7.4 million in the
second quarter of 2022, including a realized $19.6 million cash commodity derivative loss and an unrealized $12.2 million non-cash commodity
derivative gain, and a net loss of $6.7 million in the third quarter of 2021, including a realized $14.9 million cash commodity derivative
loss and an unrealized $8.2 million non-cash commodity derivative gain.
A full listing of the Company’s current
outstanding crude oil derivative positions is included in the tables shown later in this release.
Income Tax: The Company recorded a non-cash
income tax provision of $4.3 million in the third quarter of 2022, compared to a provision of $1.5 million in the second quarter of 2022
and a benefit of $48,701 for the third quarter of 2021.
Balance Sheet and Liquidity: Total liquidity
at the end of the third quarter of 2022 was $165.1 million, a 168% increase from December 31, 2021 and up 103% from June 30, 2022. Liquidity
at September 30, 2022 consisted of cash and cash equivalents of $0.9 million and $164.2 million of availability under Ring’s revolving
bank credit facility, which includes a reduction of $0.8 million for letters of credit. On September 30, 2022, the Company had $435.0
million in borrowings outstanding on its revolving credit facility that has a current borrowing base of $600.0 million. Ring paid down
$17.0 million of debt under its revolving credit facility since the closing of the Stronghold Transaction and is targeting further debt
reduction during the remainder of the year depending on market conditions, the timing of capital spending and other considerations. Ring
is currently in compliance with all applicable covenants under its revolving credit facility agreement.
Also in conjunction with the closing of the Stronghold
Transaction, Ring issued approximately 21.3 million shares of common stock and 153,176 shares of Convertible Preferred Stock to the owners
of the Stronghold assets. The Convertible Preferred Stock was converted into approximately 42.5 million shares of common stock following
approval of the conversion by a stockholder vote on October 27, 2022.
Capital Expenditures: During the third
quarter of 2022, capital expenditures on an accrual basis were $40.3 million as the Company drilled eight wells, completed nine wells,
performed three recompletions, and converted six CTRs.
Fourth Quarter 2022 Guidance and Preliminary
Full Year 2023 Outlook
The Company is reiterating its fourth quarter
2022 and preliminary full year 2023 outlook provided on October 13, 2022. More specifically:
Fourth Quarter of 2022
| · | Capital expenditures of $42 million to $46 million,
which is approximately 15% lower from the prior estimate of $50 million to $54 million. The Company’s current spending estimate
includes: |
| o | Completing and placing on production the remaining three wells drilled in the third quarter of 2022; |
| o | Drilling and completing eight to nine new wells, including four Hz wells with two in NWS and two in CBP,
and four to five vertical wells in CBP; and |
| o | Recompleting eight to 12 wells in CBP. |
| · | Ring continues to expect fourth quarter sales
volumes of 18,000 to 19,000 Boe/d (approximately 70% oil, 17% natural gas and 13% natural gas liquids (“NGLs”)), despite the
reduction in estimated fourth quarter capital expenditures. |
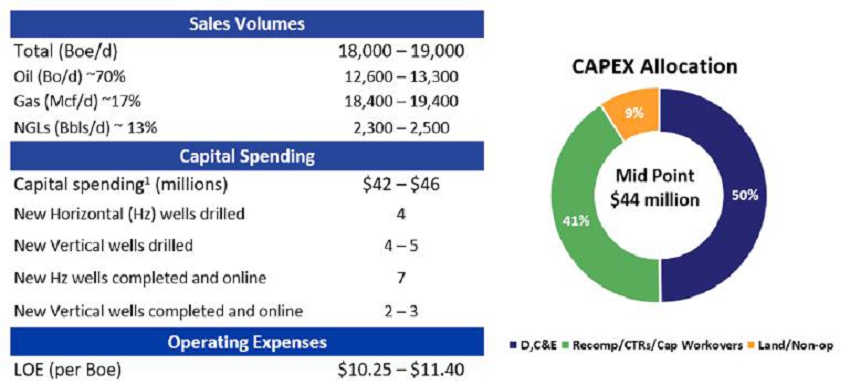
| 1. | In addition to Company-directed drilling and completion activities, the capital spending outlook includes
funds for targeted well reactivations, recompletions, workovers, infrastructure upgrades, and continuing the Company's successful CTR
program in its NWS and CBP areas. Also included is anticipated spending for lease costs, contractual drilling obligations and non-operated
drilling, completion and capital workovers. |
Preliminary Outlook for 2023
| · | Estimated capital expenditures of $150 million
to $175 million that include a balanced and capital efficient combination of drilling Hz wells on legacy assets and vertical wells on
the recently acquired CBP assets, as well as performing recompletions and CTRs, with all projects and estimates based on assumed WTI oil
prices of $75 to $90 per barrel and Henry Hub natural gas prices of $5 to $6 per Mcf; and |
| · | Plans to maintain or slightly grow 2023 full
year average sales volumes compared to anticipated Q4 2022 sales volumes. |
The Company remains squarely focused on continuing
to generate free cash flow in 2023, after all expenses, costs and capital expenditures. All 2023 planned capital expenditures will be
fully funded by cash on hand and cash from operations, and excess free cash flow is currently targeted for further debt reduction. The
combination of anticipated growth in Adjusted EBITDA primarily as a result of the Stronghold Transaction is expected to further reduce
Ring’s leverage ratio during 2023.
Conference Call Information
Ring will hold a conference call on Thursday,
November 10, 2022 at 11:00 a.m. Eastern Time to discuss its third quarter 2022 operational and financial results. An updated investor
presentation will be posted to the Company’s website prior to the conference call.
To participate in the conference call, interested
parties should dial 833-953-2433 at least five minutes before the call is to begin. Please reference the “Ring Energy Third Quarter
2022 Earnings Conference Call”. International callers may participate by dialing 412-317-5762. The call will also be webcast and
available on Ring’s website at www.ringenergy.com under “Investors” on the “News & Events” page. An
audio replay will also be available on the Company’s website following the call.
About Ring Energy, Inc.
Ring Energy, Inc. is an oil and gas exploration,
development, and production company with current operations focused on the conventional development of its Permian Basin assets in West
Texas and New Mexico. For additional information, please visit www.ringenergy.com.
Safe Harbor Statement
This release contains forward-looking
statements within the meaning of Section 27A of the Securities Act of 1933 and Section 21E of the Securities Exchange Act of 1934.
Forward-looking statements involve a wide variety of risks and uncertainties, and include, without limitations, statements with
respect to the Company’s strategy and prospects. Such statements are subject to certain risks and uncertainties which are
disclosed in the Company’s reports filed with the SEC, including its Form 10-K for the fiscal year ended December 31, 2021,
and its other filings with the SEC. Readers and investors are cautioned that the Company’s actual results may differ
materially from those described in the forward-looking statements due to a number of factors, including, but not limited to, the
Company’s ability to acquire productive oil and/or gas properties or to successfully drill and complete oil and/or gas wells
on such properties, general economic conditions both domestically and abroad, and the conduct of business by the Company, and other
factors that may be more fully described in additional documents set forth by the Company.
Contact Information
Al Petrie Advisors
Al Petrie, Senior Partner
Phone: 281-975-2146
Email: [email protected]
RING ENERGY, INC.
Condensed Statements of Operations
(Unaudited)
| | |
Three Months
Ended | | |
Nine Months
Ended | |
| | |
September
30, | | |
June
30, | | |
September
30, | | |
September
30, | |
| | |
2022 | | |
2022 | | |
2021 | | |
2022 | | |
2021 | |
| Oil, Natural
Gas, and Natural Gas Liquids Revenues | |
$ | 94,408,948 | | |
$ | 84,961,875 | | |
$ | 49,376,176 | | |
$ | 247,551,855 | | |
$ | 136,638,810 | |
| | |
| | | |
| | | |
| | | |
| | | |
| | |
| Costs and Operating Expenses | |
| | | |
| | | |
| | | |
| | | |
| | |
| Lease operating expenses | |
| 13,029,098 | | |
| 8,301,443 | | |
| 6,983,196 | | |
| 30,283,706 | | |
| 22,634,259 | |
| Gathering, transportation and
processing costs | |
| - | | |
| 549,389 | | |
| 1,051,163 | | |
| 1,846,247 | | |
| 2,883,348 | |
| Ad valorem taxes | |
| 1,199,385 | | |
| 949,239 | | |
| 703,774 | | |
| 3,100,578 | | |
| 2,144,800 | |
| Oil and natural gas production
taxes | |
| 4,563,519 | | |
| 4,157,457 | | |
| 2,240,759 | | |
| 11,939,338 | | |
| 6,291,860 | |
| Depreciation, depletion and
amortization | |
| 14,324,502 | | |
| 10,749,204 | | |
| 9,310,524 | | |
| 34,854,993 | | |
| 26,693,808 | |
| Asset retirement obligation
accretion | |
| 243,140 | | |
| 186,303 | | |
| 182,905 | | |
| 617,685 | | |
| 560,662 | |
| Operating lease expense | |
| 83,590 | | |
| 83,590 | | |
| 83,589 | | |
| 250,770 | | |
| 439,896 | |
| General
and administrative expense (including share-based compensation) | |
| 7,393,848 | | |
| 5,832,302 | | |
| 4,433,251 | | |
| 18,748,427 | | |
| 11,103,394 | |
| | |
| | | |
| | | |
| | | |
| | | |
| | |
| Total
Costs and Operating Expenses | |
| 40,837,082 | | |
| 30,808,927 | | |
| 24,989,161 | | |
| 101,641,744 | | |
| 72,752,027 | |
| | |
| | | |
| | | |
| | | |
| | | |
| | |
| Income from Operations | |
| 53,571,866 | | |
| 54,152,948 | | |
| 24,387,015 | | |
| 145,910,111 | | |
| 63,886,783 | |
| | |
| | | |
| | | |
| | | |
| | | |
| | |
| Other Income (Expense) | |
| | | |
| | | |
| | | |
| | | |
| | |
| Interest income | |
| 4 | | |
| - | | |
| - | | |
| 4 | | |
| 1 | |
| Interest expense | |
| (7,021,385 | ) | |
| (3,279,299 | ) | |
| (3,551,462 | ) | |
| (13,699,045 | ) | |
| (10,947,960 | ) |
| Loss on
derivative contracts | |
| 32,851,189 | | |
| (7,457,018 | ) | |
| (6,720,320 | ) | |
| (2,201,970 | ) | |
| (73,586,199 | ) |
| | |
| | | |
| | | |
| | | |
| | | |
| | |
| Net
Other Expense | |
| 25,829,808 | | |
| (10,736,317 | ) | |
| (10,271,782 | ) | |
| (15,901,011 | ) | |
| (84,534,158 | ) |
| | |
| | | |
| | | |
| | | |
| | | |
| | |
| Income
(Loss) Before Provision for Income Taxes | |
| 79,401,674 | | |
| 43,416,631 | | |
| 14,115,233 | | |
| 130,009,100 | | |
| (20,647,375 | ) |
| | |
| | | |
| | | |
| | | |
| | | |
| | |
| (Provision
For) Benefit From Income Taxes | |
| (4,315,783 | ) | |
| (1,472,209 | ) | |
| 48,701 | | |
| (5,866,744 | ) | |
| (141,943 | ) |
| | |
| | | |
| | | |
| | | |
| | | |
| | |
| Net
Income (Loss) | |
$ | 75,085,891 | | |
$ | 41,944,422 | | |
$ | 14,163,934 | | |
$ | 124,142,356 | | |
$ | (20,789,318 | ) |
| | |
| | | |
| | | |
| | | |
| | | |
| | |
| Basic Earnings (Loss) per Share | |
$ | 0.65 | | |
$ | 0.39 | | |
$ | 0.14 | | |
$ | 1.16 | | |
$ | (0.21 | ) |
| Diluted Earnings (Loss)
per Share | |
$ | 0.49 | | |
$ | 0.32 | | |
$ | 0.12 | | |
$ | 0.92 | | |
$ | (0.21 | ) |
| | |
| | | |
| | | |
| | | |
| | | |
| | |
| Basic Weighted-Average Shares
Outstanding | |
| 115,376,280 | | |
| 106,390,776 | | |
| 99,358,504 | | |
| 107,349,184 | | |
| 99,251,532 | |
| Diluted Weighted-Average Shares
Outstanding | |
| 151,754,998 | | |
| 130,597,589 | | |
| 121,220,748 | | |
| 134,826,276 | | |
| 99,251,532 | |
RING ENERGY, INC.
Condensed Operating Data
(Unaudited)
| | |
Three Months
Ended | | |
Nine Months
Ended | |
| | |
September
30, | | |
June
30, | | |
September
30, | | |
September
30, | |
| | |
2022 | | |
2022 | | |
2021 | | |
2022 | | |
2021 | |
| Net sales volumes: | |
| | | |
| | | |
| | | |
| | | |
| | |
| Oil (Bbls) | |
| 932,770 | | |
| 729,484 | | |
| 659,247 | | |
| 2,338,469 | | |
| 1,971,776 | |
| Natural gas (Mcf) | |
| 952,762 | | |
| 723,196 | | |
| 594,841 | | |
| 2,408,241 | | |
| 1,773,506 | |
| Natural
gas liquids (Bbls) (1) | |
| 130,052 | | |
| - | | |
| - | | |
| 130,052 | | |
| - | |
| Total
oil, natural gas and natural gas liquids (Boe) (1)(2) | |
| 1,221,616 | | |
| 850,017 | | |
| 758,387 | | |
| 2,869,895 | | |
| 2,267,360 | |
| % Oil | |
| 76 | % | |
| 86 | % | |
| 87 | % | |
| 81 | % | |
| 87 | % |
| | |
| | | |
| | | |
| | | |
| | | |
| | |
| Average daily equivalent sales
(Boe/d) | |
| 13,278 | | |
| 9,341 | | |
| 8,243 | | |
| 10,512 | | |
| 8,305 | |
| | |
| | | |
| | | |
| | | |
| | | |
| | |
| Average realized sales
prices: | |
| | | |
| | | |
| | | |
| | | |
| | |
| Oil ($/Bbl) | |
$ | 92.64 | | |
$ | 109.24 | | |
$ | 69.61 | | |
$ | 98.16 | | |
$ | 64.37 | |
| Natural gas ($/Mcf) | |
| 4.89 | | |
| 7.29 | | |
| 5.86 | | |
| 6.10 | | |
| 5.48 | |
| Natural gas liquids ($/Bbls) | |
| 25.68 | | |
| - | | |
| - | | |
| 25.68 | | |
| - | |
| Barrel of oil equivalent ($/Boe) | |
$ | 77.28 | | |
$ | 99.95 | | |
$ | 65.11 | | |
$ | 86.26 | | |
$ | 60.26 | |
| | |
| | | |
| | | |
| | | |
| | | |
| | |
| Average costs and expenses
per Boe ($/Boe): | |
| | | |
| | | |
| | | |
| | | |
| | |
| Lease operating expenses | |
$ | 10.67 | | |
$ | 9.77 | | |
$ | 9.21 | | |
$ | 10.55 | | |
$ | 9.98 | |
| Gathering, transportation and
processing costs | |
| - | | |
| 0.65 | | |
| 1.39 | | |
| 0.64 | | |
| 1.27 | |
| Ad valorem taxes | |
| 0.98 | | |
| 1.12 | | |
| 0.93 | | |
| 1.08 | | |
| 0.95 | |
| Oil and natural gas production
taxes | |
| 3.74 | | |
| 4.89 | | |
| 2.95 | | |
| 4.16 | | |
| 2.77 | |
| Depreciation, depletion and
amortization | |
| 11.73 | | |
| 12.65 | | |
| 12.28 | | |
| 12.15 | | |
| 11.77 | |
| Asset retirement obligation
accretion | |
| 0.20 | | |
| 0.22 | | |
| 0.24 | | |
| 0.22 | | |
| 0.25 | |
| Operating lease expense | |
| 0.07 | | |
| 0.10 | | |
| 0.11 | | |
| 0.09 | | |
| 0.19 | |
| General and administrative expense
(including share-based compensation) | |
| 6.05 | | |
| 6.86 | | |
| 5.85 | | |
| 6.53 | | |
| 4.90 | |
| General and administrative expense
(excluding share-based compensation) | |
| 4.79 | | |
| 4.63 | | |
| 4.82 | | |
| 4.80 | | |
| 4.24 | |
| (1) Beginning
July 1, 2022, revenues were reported on a three-stream basis, separately reporting crude oil, natural gas, and natural gas liquids
volumes and sales. For periods prior to July 1, 2022, volumes and sales for natural gas liquids were presented with natural gas. |
| (2) Boe is determined using
the ratio of six Mcf of natural gas to one Bbl of oil (totals may not compute due to rounding). The conversion ratio does not
assume price equivalency and the price on an equivalent basis for oil, natural gas, and natural gas liquids may differ significantly. |
RING ENERGY, INC.
Balance Sheets
| | |
| (Unaudited) | | |
| | |
| | |
| September
30, | | |
| December
31, | |
| | |
| 2022 | | |
| 2021 | |
| ASSETS | |
| | | |
| | |
| Current Assets | |
| | | |
| | |
| Cash and cash equivalents | |
$ | 890,567 | | |
$ | 2,408,316 | |
| Accounts receivable | |
| 45,864,400 | | |
| 24,026,807 | |
| Joint interest billing receivable | |
| 1,897,125 | | |
| 2,433,811 | |
| Derivative assets | |
| 13,322,013 | | |
| - | |
| Prepaid
expenses and other assets | |
| 3,246,569 | | |
| 938,029 | |
| Total Current Assets | |
| 65,220,674 | | |
| 29,806,963 | |
| | |
| | | |
| | |
| Properties and Equipment | |
| | | |
| | |
| Oil and natural gas properties
subject to amortization | |
| 1,418,931,111 | | |
| 883,844,745 | |
| Financing lease asset subject
to depreciation | |
| 2,067,375 | | |
| 1,422,487 | |
| Fixed assets
subject to depreciation | |
| 2,985,778 | | |
| 2,089,722 | |
| Total Properties and Equipment | |
| 1,423,984,264 | | |
| 887,356,954 | |
| Accumulated
depreciation, depletion and amortization | |
| (269,541,416 | ) | |
| (235,997,307 | ) |
| Net Properties and Equipment | |
| 1,154,442,848 | | |
| 651,359,647 | |
| | |
| | | |
| | |
| Operating lease asset | |
| 1,071,482 | | |
| 1,277,253 | |
| Derivative assets | |
| 11,545,982 | | |
| - | |
| Deferred
financing costs | |
| 19,029,907 | | |
| 1,713,466 | |
| | |
| | | |
| | |
| TOTAL
ASSETS | |
$ | 1,251,310,893 | | |
$ | 684,157,329 | |
| | |
| | | |
| | |
| LIABILITIES, MEZZANINE
EQUITY AND STOCKHOLDERS' EQUITY | |
| | | |
| | |
| Current Liabilities | |
| | | |
| | |
| Accounts payable | |
$ | 86,822,997 | | |
$ | 46,233,452 | |
| Income tax liability | |
| 36,736 | | |
| - | |
| Financing lease liability | |
| 406,890 | | |
| 316,514 | |
| Operating lease liability | |
| 306,715 | | |
| 290,766 | |
| Derivative liabilities | |
| 23,767,689 | | |
| 29,241,588 | |
| Notes payable | |
| 877,631 | | |
| 586,410 | |
| Deferred
cash payment | |
| 14,511,687 | | |
| - | |
| Total Current Liabilities | |
| 126,730,345 | | |
| 76,668,730 | |
| | |
| | | |
| | |
| Non-Current Liabilities | |
| | | |
| | |
| Deferred income taxes | |
| 5,920,300 | | |
| 90,292 | |
| Revolving line of credit | |
| 435,000,000 | | |
| 290,000,000 | |
| Financing lease liability, less
current portion | |
| 564,205 | | |
| 343,727 | |
| Operating lease liability, less
current portion | |
| 905,524 | | |
| 1,138,319 | |
| Derivative liabilities | |
| 8,734,388 | | |
| - | |
| Asset retirement
obligations | |
| 29,426,737 | | |
| 15,292,054 | |
| Total Non-Current Liabilities | |
| 480,551,154 | | |
| 306,864,392 | |
| | |
| | | |
| | |
| Total Liabilities | |
| 607,281,499 | | |
| 383,533,122 | |
| | |
| | | |
| | |
| Mezzanine Equity | |
| | | |
| | |
| Convertible preferred stock - $0.001 par value;
153,176 shares outstanding | |
| 137,858,446 | | |
| - | |
| Stockholders' Equity | |
| | | |
| | |
| Preferred stock - $0.001 par
value; 50,000,000 shares authorized; 153,176 shares issued or outstanding | |
| - | | |
| - | |
| Common stock - $0.001 par value;
225,000,000 shares authorized; 131,586,927 shares and 100,192,562 shares issued and outstanding, respectively | |
| 131,587 | | |
| 100,193 | |
| Additional paid-in capital | |
| 634,845,283 | | |
| 553,472,292 | |
| Accumulated
deficit | |
| (128,805,922 | ) | |
| (252,948,278 | ) |
| Total
Stockholders' Equity | |
| 506,170,948 | | |
| 300,624,207 | |
| | |
| | | |
| | |
| TOTAL
LIABILITIES, MEZZANINE EQUITY AND STOCKHOLDERS' EQUITY | |
$ | 1,251,310,893 | | |
$ | 684,157,329 | |
RING ENERGY, INC.
Statements of Cash Flows
(Unaudited)
| | |
Three Months Ended | | |
Nine Months Ended | |
| | |
September 30, | | |
June 30, | | |
September 30, | | |
September 30, | |
| | |
2022 | | |
2022 | | |
2021 | | |
2022 | | |
2021 | |
| Cash Flows From Operating Activities | |
| | | |
| | | |
| | | |
| | | |
| | |
| Net income (loss) | |
$ | 75,085,891 | | |
$ | 41,944,422 | | |
$ | 14,163,934 | | |
$ | 124,142,356 | | |
$ | (20,789,318 | ) |
| Adjustments to reconcile net income (loss) to net cash provided by operating activities: | |
| | | |
| | | |
| | | |
| | | |
| | |
| Depreciation, depletion and amortization | |
| 14,324,503 | | |
| 10,749,203 | | |
| 9,310,524 | | |
| 34,854,993 | | |
| 26,693,808 | |
| Asset retirement obligation accretion | |
| 243,140 | | |
| 186,303 | | |
| 182,905 | | |
| 617,685 | | |
| 560,662 | |
| Amortization of deferred financing costs | |
| 1,095,073 | | |
| 189,274 | | |
| 166,282 | | |
| 1,483,621 | | |
| 496,533 | |
| Share-based compensation | |
| 1,543,033 | | |
| 1,899,245 | | |
| 777,461 | | |
| 4,964,188 | | |
| 1,484,730 | |
| Deferred income tax (benefit) expense | |
| 4,279,047 | | |
| 1,485,022 | | |
| 1,886,118 | | |
| 5,830,008 | | |
| 141,943 | |
| Excess tax (benefit) expense related to share-based compensation | |
| - | | |
| - | | |
| (1,934,819 | ) | |
| - | | |
| - | |
| (Gain) Loss on derivative contracts | |
| (32,851,189 | ) | |
| 7,457,018 | | |
| 6,720,320 | | |
| 2,201,970 | | |
| 73,586,199 | |
| Cash (paid) for derivative settlements, net | |
| (14,861,116 | ) | |
| (19,617,265 | ) | |
| (14,921,008 | ) | |
| (48,593,882 | ) | |
| (33,278,132 | ) |
| Changes in assets and liabilities: | |
| | | |
| | | |
| | | |
| | | |
| | |
| Accounts receivable | |
| (6,907,079 | ) | |
| (4,315,730 | ) | |
| 1,656,229 | | |
| (21,300,907 | ) | |
| (5,017,078 | ) |
| Prepaid expenses and other assets | |
| (40,823 | ) | |
| (2,470,602 | ) | |
| 278,870 | | |
| (2,308,540 | ) | |
| (902,692 | ) |
| Accounts payable | |
| 27,144,096 | | |
| 4,328,968 | | |
| (329,555 | ) | |
| 33,992,075 | | |
| 8,329,563 | |
| Settlement of asset retirement obligation | |
| (881,768 | ) | |
| (1,113,208 | ) | |
| (444,502 | ) | |
| (2,548,344 | ) | |
| (1,782,779 | ) |
| | |
| | | |
| | | |
| | | |
| | | |
| | |
| Net Cash Provided by Operating Activities | |
| 68,172,808 | | |
| 40,722,650 | | |
| 17,512,759 | | |
| 133,335,223 | | |
| 49,523,439 | |
| | |
| | | |
| | | |
| | | |
| | | |
| | |
| Cash Flows From Investing Activities | |
| | | |
| | | |
| | | |
| | | |
| | |
| Payments for the Stronghold Acquisition | |
| (183,359,626 | ) | |
| - | | |
| - | | |
| (183,359,626 | ) | |
| - | |
| Payments to purchase oil and natural gas properties | |
| (467,840 | ) | |
| (383,003 | ) | |
| (141,468 | ) | |
| (1,211,691 | ) | |
| (579,156 | ) |
| Payments to develop oil and natural gas properties | |
| (34,121,878 | ) | |
| (35,793,923 | ) | |
| (11,957,917 | ) | |
| (83,776,050 | ) | |
| (34,680,935 | ) |
| Purchase of fixed assets subject to depreciation | |
| (66,838 | ) | |
| (81,646 | ) | |
| (548,730 | ) | |
| (158,598 | ) | |
| (609,633 | ) |
| Sale of fixed assets subject to depreciation | |
| - | | |
| 126,100 | | |
| - | | |
| 134,600 | | |
| - | |
| Proceeds from divestiture of oil and natural gas properties | |
| - | | |
| 25,066 | | |
| - | | |
| 25,066 | | |
| 2,000,000 | |
| | |
| | | |
| | | |
| | | |
| | | |
| | |
| Net Cash Used in Investing Activities | |
| (218,016,182 | ) | |
| (36,107,406 | ) | |
| (12,648,115 | ) | |
| (268,346,299 | ) | |
| (33,869,724 | ) |
| | |
| | | |
| | | |
| | | |
| | | |
| | |
| Cash Flows From Financing Activities | |
| | | |
| | | |
| | | |
| | | |
| | |
| Proceeds from revolving line of credit | |
| 541,500,000 | | |
| 40,500,000 | | |
| 14,500,000 | | |
| 592,000,000 | | |
| 34,400,000 | |
| Payments on revolving line of credit | |
| (376,500,000 | ) | |
| (50,500,000 | ) | |
| (20,000,000 | ) | |
| (447,000,000 | ) | |
| (52,400,000 | ) |
| Proceeds from issuance of common stock and warrants | |
| 2,400,000 | | |
| 5,163,126 | | |
| - | | |
| 7,563,126 | | |
| 241,269 | |
| Payments to cover tax withholdings | |
| (6,790 | ) | |
| (257,694 | ) | |
| - | | |
| (264,484 | ) | |
| - | |
| Proceeds from notes payable | |
| 316,677 | | |
| 928,626 | | |
| 323,671 | | |
| 1,245,303 | | |
| 1,233,138 | |
| Payments on notes payable | |
| (333,341 | ) | |
| (253,360 | ) | |
| (224,670 | ) | |
| (954,082 | ) | |
| (375,987 | ) |
| Payment of deferred financing costs | |
| (18,762,502 | ) | |
| - | | |
| - | | |
| (18,762,502 | ) | |
| (76,887 | ) |
| Reduction of financing lease liabilities | |
| (103,392 | ) | |
| (111,864 | ) | |
| (86,941 | ) | |
| (334,034 | ) | |
| (206,936 | ) |
| | |
| | | |
| | | |
| | | |
| | | |
| | |
| Net Cash Used in Financing Activities | |
| 148,510,652 | | |
| (4,531,166 | ) | |
| (5,487,940 | ) | |
| 133,493,327 | | |
| (17,185,403 | ) |
| | |
| | | |
| | | |
| | | |
| | | |
| | |
| Net (Decrease) Increase in Cash | |
| (1,332,722 | ) | |
| 84,078 | | |
| (623,296 | ) | |
| (1,517,749 | ) | |
| (1,531,688 | ) |
| Cash at Beginning of Period | |
| 2,223,289 | | |
| 2,139,211 | | |
| 2,670,242 | | |
| 2,408,316 | | |
| 3,578,634 | |
| | |
| | | |
| | | |
| | | |
| | | |
| | |
| Cash at End of Period | |
$ | 890,567 | | |
$ | 2,223,289 | | |
$ | 2,046,946 | | |
$ | 890,567 | | |
$ | 2,046,946 | |
RING ENERGY, INC.
Financial Commodity Derivative Positions
As of September 30, 2022
The following table reflects the prices of contracts outstanding as
of September 30, 2022 (Quantities are in barrels for the oil derivative contracts and in million British thermal units (MMBtu) for the
natural gas derivative contracts.):
| | |
Oil Hedges (WTI) | |
| | |
2022 | | |
2023 | | |
2024 | |
| Swaps: | |
| | |
| | |
| |
| Hedged volume (BBL) | |
| 379,250 | | |
| 389,250 | | |
| 526,000 | |
| Weighted average swap price | |
$ | 54.89 | | |
$ | 77.55 | | |
$ | 65.90 | |
| | |
| | | |
| | | |
| | |
| Deferred premium puts: | |
| | | |
| | | |
| | |
| Hedged volume (BBL) | |
| 138,000 | | |
| 773,500 | | |
| 91,000 | |
| Weighted average strike price | |
$ | 97.93 | | |
$ | 90.64 | | |
$ | 83.75 | |
| Weighted average deferred premium price | |
$ | 11.81 | | |
$ | 15.25 | | |
$ | 17.32 | |
| | |
| | | |
| | | |
| | |
| Two-way collars: | |
| | | |
| | | |
| | |
| Hedged volume (BBL) | |
| 97,201 | | |
| 487,622 | | |
| 475,350 | |
| Weighted average put price | |
$ | 53.93 | | |
$ | 52.16 | | |
$ | 67.88 | |
| Weighted average call price | |
$ | 67.68 | | |
$ | 62.94 | | |
$ | 83.32 | |
| | |
| | | |
| | | |
| | |
| Three-way collars: | |
| | | |
| | | |
| | |
| Hedged volume (BBL) | |
| 89,985 | | |
| 66,061 | | |
| - | |
| Weighted average first put price | |
$ | 40.00 | | |
$ | 45.00 | | |
$ | - | |
| Weighted average second put price | |
$ | 50.00 | | |
$ | 55.00 | | |
$ | - | |
| Weighted average call price | |
$ | 62.03 | | |
$ | 80.05 | | |
$ | - | |
| | |
Gas Hedges (Henry Hub) | |
| | |
2022 | | |
2023 | | |
2024 | |
| NYMEX Swaps: | |
| | |
| | |
| |
| Hedged volume (MMBtu) | |
| 46,313 | | |
| 175,421 | | |
| - | |
| Weighted average swap price | |
$ | 2.51 | | |
$ | 2.40 | | |
$ | - | |
| | |
| | | |
| | | |
| | |
| Two-way collars: (1) | |
| | | |
| | | |
| | |
| Hedged volume (MMBtu) | |
| 715,661 | | |
| 2,486,514 | | |
| 1,712,250 | |
| Weighted average put price | |
$ | 3.76 | | |
$ | 3.18 | | |
$ | 4.00 | |
| Call hedged volume (MMBtu) | |
| 435,061 | | |
| 2,306,514 | | |
| 1,712,250 | |
| Weighted average call price | |
$ | 10.22 | | |
$ | 5.03 | | |
$ | 6.29 | |
| | |
| | | |
| | | |
| | |
| Three-way collar: | |
| | | |
| | | |
| | |
| Hedged volume (MMBtu) | |
| 304,250 | | |
| - | | |
| - | |
| Weighted average first put price | |
$ | 2.20 | | |
$ | - | | |
$ | - | |
| Weighted average second put price | |
$ | 2.50 | | |
$ | - | | |
$ | - | |
| Weighted average call price | |
$ | 3.25 | | |
$ | - | | |
$ | - | |
| Weighted average deferred premium price | |
$ | 0.19 | | |
$ | - | | |
$ | - | |
| | |
Gas Hedges (basis differential) | |
| | |
2022 | | |
2023 | | |
2024 | |
| Waha basis swaps: | |
| | | |
| | | |
| | |
| Hedged volume (MMBtu) | |
| 505,024 | | |
| 1,339,685 | | |
| - | |
| Weighted average swap price | |
| | (2) | |
| | (3) | |
$ | - | |
| (1) | The two-way collars for the fourth quarter of 2022 and first quarter of 2023 include 2x1 collars where
the put volumes of 561,200 and 360,000 are two times the call volumes of 280,600 and 180,000, respectively. |
| (2) | The WAHA basis swaps in place for the remainder of 2022 consist of five derivative contracts, each with
a fixed price of the Henry Hub natural gas price less a fixed amount (weighted average of $0.57 per MMBtu). |
| (3) | The WAHA basis swaps in place for the calendar year of 2023 consist of two derivative contracts, each with a fixed price of the Henry
Hub natural gas price less a fixed amount (weighted average of $0.55 per MMBtu). |
RING ENERGY, INC.
Non-GAAP Information
Certain financial information included in Ring’s
financial results are not measures of financial performance recognized by accounting principles generally accepted in the United States,
or GAAP. These non-GAAP financial measures are “Adjusted Net Income”, “Adjusted EBITDA”, “Free Cash Flow”
and “Cash Flow from Operations”. Management uses these non-GAAP financial measures in its analysis of performance. In addition,
Adjusted EBITDA is a key metric used to determine the Company’s incentive compensation awards. These disclosures may not be viewed
as a substitute for results determined in accordance with GAAP and are not necessarily comparable to non-GAAP performance measures which
may be reported by other companies.
Reconciliation of Net Income (Loss) to Adjusted
Net Income
Adjusted Net Income does not include the estimated
after-tax impact of share-based compensation, ceiling test impairment, and unrealized loss (gain) on change in fair value of derivatives.
Adjusted Net Income is presented because the timing and amount of these items cannot be reasonably estimated and affect the comparability
of operating results from period to period, and current periods to prior periods.
| | |
Three Months Ended | | |
Nine Months Ended | |
| | |
September 30, | | |
June 30, | | |
September 30, | | |
September 30, | |
| | |
2022 | | |
2022 | | |
2021 | | |
2022 | | |
2021 | |
| | |
| | |
| | |
| | |
| | |
| |
| | |
| (Unaudited for All Periods) | |
| Net Income (Loss) | |
$ | 75,085,891 | | |
$ | 41,944,422 | | |
$ | 14,163,934 | | |
$ | 124,142,356 | | |
$ | (20,789,318 | ) |
| | |
| | | |
| | | |
| | | |
| | | |
| | |
| Share-based compensation | |
| 1,543,033 | | |
| 1,899,245 | | |
| 777,461 | | |
| 4,964,188 | | |
| 1,484,730 | |
| Unrealized loss (gain) on change in fair value of derivatives | |
| (47,712,305 | ) | |
| (12,160,247 | ) | |
| (8,200,688 | ) | |
| (46,391,912 | ) | |
| 40,308,067 | |
| Transaction costs - Stronghold Acquisition | |
| 1,142,963 | | |
| - | | |
| - | | |
| 1,142,963 | | |
| - | |
| Tax impact of adjusted items | |
| 2,447,351 | | |
| (347,939 | ) | |
| - | | |
| 1,817,876 | | |
| - | |
| | |
| | | |
| | | |
| | | |
| | | |
| | |
| Adjusted Net Income | |
$ | 32,506,933 | | |
$ | 31,335,481 | | |
$ | 6,740,707 | | |
$ | 85,675,471 | | |
$ | 21,003,479 | |
| | |
| | | |
| | | |
| | | |
| | | |
| | |
| Basic Weighted-Average Shares Outstanding | |
| 115,376,280 | | |
| 106,390,776 | | |
| 99,358,504 | | |
| 107,349,184 | | |
| 99,251,532 | |
| | |
| | | |
| | | |
| | | |
| | | |
| | |
| Adjusted Net Income per Share | |
$ | 0.28 | | |
$ | 0.29 | | |
$ | 0.07 | | |
$ | 0.80 | | |
$ | 0.21 | |
Reconciliations of Adjusted EBITDA, Free Cash
Flow and Cash Flow from Operations
The Company also presents the non-GAAP financial
measures Adjusted EBITDA and Free Cash Flow. The Company defines Adjusted EBITDA as net income (loss) plus net interest expense, unrealized
loss (gain) on change in fair value of derivatives, ceiling test impairment, income tax (benefit) expense, depreciation, depletion and
amortization, asset retirement obligation accretion and share-based compensation. Company management believes this presentation is relevant
and useful because it helps investors understand Ring’s operating performance and makes it easier to compare its results with those
of other companies that have different financing, capital and tax structures. Adjusted EBITDA should not be considered in isolation from
or as a substitute for net income, as an indication of operating performance or cash flows from operating activities or as a measure of
liquidity. Adjusted EBITDA, as Ring calculates it, may not be comparable to Adjusted EBITDA measures reported by other companies. In addition,
Adjusted EBITDA does not represent funds available for discretionary use.
The Company defines Free Cash Flow as Adjusted
EBITDA (defined above) less net interest expense (excluding amortization of deferred financing cost), capital expenditures and proceeds
from divestiture of oil and natural gas properties. For this purpose, the Company’s definition of capital expenditures includes
costs incurred related to oil and natural gas properties (such as drilling and infrastructure costs and the lease maintenance costs) and
equipment, furniture and fixtures, but excludes acquisition costs of oil and gas properties from third parties that are not included in
the Company’s capital expenditures guidance provided to investors. Company management believes that Free Cash Flow is an important
financial performance measure for use in evaluating the performance and efficiency of its current operating activities after the impact
of accrued capital expenditures and net interest expense and without being impacted by items such as changes associated with working capital,
which can vary substantially from one period to another. There is no commonly accepted definition Free Cash Flow within the industry.
Accordingly, Free Cash Flow, as defined and calculated by the Company, may not be comparable to Free Cash Flow or other similarly named
non-GAAP measures reported by other companies. While the Company includes net interest expense in the calculation of Free Cash Flow, other
mandatory debt service requirements of future payments of principal at maturity (if such debt is not refinanced) are excluded from the
calculation of Free Cash Flow. These and other non-discretionary expenditures that are not deducted from Free Cash Flow would reduce cash
available for other uses.
The following tables present (i) a reconciliation
of the Company’s net income (loss), a GAAP measure, to Adjusted EBITDA and (ii) a reconciliation of Adjusted EBITDA, a non-GAAP
measure, to Free Cash Flow, as both Adjusted EBITDA and Free Cash Flow are defined by the Company. In addition, a reconciliation of Cash
Flow from Operations is presented.
| | |
Three Months Ended | | |
Nine Months Ended | |
| | |
September 30, | | |
June 30, | | |
September 30, | | |
September 30, | |
| | |
2022 | | |
2022 | | |
2021 | | |
2022 | | |
2021 | |
| | |
| | |
| | |
| | |
| | |
| |
| | |
|
(Unaudited for All Periods)
| |
| Net Income (Loss) | |
$ | 75,085,891 | | |
$ | 41,944,422 | | |
$ | 14,163,934 | | |
$ | 124,142,356 | | |
$ | (20,789,318 | ) |
| | |
| | | |
| | | |
| | | |
| | | |
| | |
| Interest expense, net | |
| 7,021,381 | | |
| 3,279,299 | | |
| 3,551,462 | | |
| 13,699,041 | | |
| 10,947,959 | |
| Unrealized loss (gain) on change in fair value of derivatives | |
| (47,712,305 | ) | |
| (12,160,247 | ) | |
| (8,200,688 | ) | |
| (46,391,912 | ) | |
| 40,308,067 | |
| Income tax provision (benefit) | |
| 4,315,783 | | |
| 1,472,209 | | |
| (48,701 | ) | |
| 5,866,744 | | |
| 141,943 | |
| Depreciation, depletion and amortization | |
| 14,324,502 | | |
| 10,749,204 | | |
| 9,310,524 | | |
| 34,854,993 | | |
| 26,693,808 | |
| Asset retirement obligation accretion | |
| 243,140 | | |
| 186,303 | | |
| 182,905 | | |
| 617,685 | | |
| 560,662 | |
| Transaction costs - Stronghold Acquisition | |
| 1,142,963 | | |
| - | | |
| - | | |
| 1,142,963 | | |
| - | |
| Share-based compensation | |
| 1,543,033 | | |
| 1,899,245 | | |
| 777,461 | | |
| 4,964,188 | | |
| 1,484,730 | |
| | |
| | | |
| | | |
| | | |
| | | |
| | |
| Adjusted EBITDA | |
$ | 55,964,388 | | |
$ | 47,370,435 | | |
$ | 19,736,897 | | |
$ | 138,896,058 | | |
$ | 59,347,851 | |
| | |
| | | |
| | | |
| | | |
| | | |
| | |
| Adjusted EBITDA Margin | |
| 59 | % | |
| 56 | % | |
| 40 | % | |
| 56 | % | |
| 43 | % |
| | |
| | | |
| | | |
| | | |
| | | |
| | |
| Basic Weighted-Average Shares Outstanding | |
| 115,376,280 | | |
| 106,390,776 | | |
| 99,358,504 | | |
| 107,349,184 | | |
| 99,251,532 | |
| | |
| | | |
| | | |
| | | |
| | | |
| | |
| Adjusted EBITDA per Share | |
$ | 0.49 | | |
$ | 0.45 | | |
$ | 0.20 | | |
$ | 1.29 | | |
$ | 0.60 | |
| | |
Three Months Ended | | |
Nine Months Ended | |
| | |
September 30, | | |
June 30, | | |
September 30, | | |
September 30, | |
| | |
2022 | | |
2022 | | |
2021 | | |
2022 | | |
2021 | |
| | |
| | |
| | |
| | |
| | |
| |
| | |
|
(Unaudited for All Periods)
| |
| Adjusted EBITDA | |
$ | 55,964,388 | | |
$ | 47,370,435 | | |
$ | 19,736,897 | | |
$ | 138,896,058 | | |
$ | 59,347,851 | |
| | |
| | | |
| | | |
| | | |
| | | |
| | |
| Net interest expense (excluding amortization of deferred financing costs) | |
| (5,926,308 | ) | |
| (3,090,025 | ) | |
| (3,385,180 | ) | |
| (12,215,420 | ) | |
| (10,451,426 | ) |
| Capital expenditures (1) | |
| (40,295,388 | ) | |
| (41,810,442 | ) | |
| (13,720,336 | ) | |
| (110,245,399 | ) | |
| (39,701,834 | ) |
| Proceeds from divestiture of oil and natural gas properties | |
| - | | |
| 25,066 | | |
| - | | |
| 25,066 | | |
| 2,000,000 | |
| | |
| | | |
| | | |
| | | |
| | | |
| | |
| Free Cash Flow | |
$ | 9,742,692 | | |
$ | 2,495,034 | | |
$ | 2,631,381 | | |
$ | 16,460,305 | | |
$ | 11,194,591 | |
(1)
The three and nine months ended September 30, 2022 excludes the Stronghold acquisition.
| | |
Three Months Ended | | |
Nine Months Ended | |
| | |
September 30, | | |
June 30, | | |
September 30, | | |
September 30, | |
| | |
2022 | | |
2022 | | |
2021 | | |
2022 | | |
2021 | |
| | |
| | |
| | |
| | |
| | |
| |
| | |
| (Unaudited for All Periods) | |
| Net Cash Provided by Operating Activities | |
$ | 68,172,808 | | |
$ | 40,722,650 | | |
$ | 17,512,759 | | |
$ | 133,335,223 | | |
$ | 49,523,439 | |
| Changes in operating assets and liabilities | |
| (19,314,426 | ) | |
| 3,570,572 | | |
| (1,161,042 | ) | |
| (7,834,284 | ) | |
| (627,014 | ) |
| | |
| | | |
| | | |
| | | |
| | | |
| | |
| Cash Flow from Operations | |
$ | 48,858,382 | | |
$ | 44,293,222 | | |
$ | 16,351,717 | | |
$ | 125,500,939 | | |
$ | 48,896,425 | |
Exhibit 99.2
www. ringenergy.com NYSE American: REI VALUE FOCUSED PROVEN STRATEGY
www.ringenergy.com NYSE American: REI Forward - Looking Statements and Cautionary Note Regarding Hydrocarbon Disclosures Forward – Looking Statements This Presentation includes "forward - looking statements" within the meaning of the Private Securities Litigation Reform Act of 19 95, Section 27A of the Securities Act of 1933, as amended, and Section 21E of the Securities Exchange Act of 1934, as amended. All statements, other than statements of strictly historical facts included in this Presentation constitute forward - loo king statements and may often, but not always, be identified by the use of such words as “may,” “will,” “should,” “could,” “intends,” “estimates,” “expects,” “anticipates,” “plans,” “project,” “guidance,” “target,” “potential,” “possible,” “probabl y,” and “believes” or the negative variations thereof or comparable terminology. These forward - looking statements include statements regarding the Company's financial position, future revenues, net income, potential evaluations, business strategy and plans and objectives for future operations. The forward - looking statements include statements about the expected benefits to the Company and to its stockholders from the acquisition of certain assets (the “Stronghold Assets”) from Strongh old Energy II Operating, LLC (“Stronghold OpCo ”) and Stronghold Energy II Royalties, LP (“Stronghold RoyaltyCo ”, together with Stronghold OpCo , collectively, “Stronghold”); Forward - looking statements are subject to numerous assumptions, risks and uncertainties that may cause actual results to be mate rially different than any future results expressed or implied in those statements. However, whether actual results and developments will conform to expectations is subject to a number of material ris ks and uncertainties, including but not limited to: the Company’s ability to integrate the Stronghold Assets and achieve the anticipated benefits therefrom; risks relating to any unforeseen liability of the Company or the Stronghold Assets; declines in oil, natural gas liquids or natural gas prices; the level of success in exploration, development and production a ct ivities; the timing of exploration and development expenditures; inaccuracies of reserve estimates or assumptions underlying them; rev isi ons to reserve estimates as a result of changes in commodity prices or production history; impacts to financial statements as a result of impairment write - downs; risks related to level of indebtedness and periodic redeterminations of the bo rrowing base under the Company’s credit facility; the impacts of hedging on results of operations; the Company’s ability to replace oil and natural gas reserves; any loss of senior management or technical personnel; and the direct and indirect im pac t on most or all of the foregoing due to the COVID - 19 pandemic. Some of the factors that could cause actual results to differ materially from expected results are described under “Risk Factors” in our 2021 annual report on Form 10 - K filed with the U.S. Securities and Exchange Commission (“SEC”) on March 16, 2022, and in our subsequent quarterly reports on Form 10 - Q and current reports on Form 8 - K. Although the Company believes that the assumptions upon which such forward - looking stateme nts are based are reasonable, it can give no assurance that such assumptions will prove to be correct. All forward - looking statements in this Presentation are expressly qualified by the cautionary statements and by reference to the underlyi ng assumptions that may prove to be incorrect. The Company undertakes no obligation to publicly revise these forward - looking statements to reflect events or circumstances that arise after the date hereof, except as required by applicable law. The financial and operating estimates contained in this presentation represent our reasonable estimates as of the date of this Presentation. Neither our independent auditors no r a ny other third party has examined, reviewed or compiled the projections and, accordingly, none of the foregoing expresses an opinion or other form of assurance with respect thereto. The assumptions upon which the projections are based ar e d escribed in more detail herein. Some of these assumptions inevitably will not materialize, and unanticipated events may occur that could affect our results. Therefore, our actual results achieved during the periods covered by the estimates w ill vary from the projected results. Prospective investors are cautioned not to place undue reliance on the estimates included herein. Cautionary Note regarding Hydrocarbon Disclosures The SEC has generally permitted oil and natural gas companies, in their filings with the SEC, to disclose proved reserves, wh ich are reserve estimates that geological and engineering data demonstrate with reasonable certainty to be recoverable in future years from known reservoirs under existing economic and operating conditions, and certain probable and possible reserv es that meet the SEC’s definitions for such terms. We use the terms “estimated ultimate recovery,” or “EURs,” “probable,” “possible,” and “non - proven” reserves, reserve “potential” or “upside” or other descriptions of volumes of reserves potentially recoverable through additional drilling or recovery techniques that the SEC’s guidelines prohibit us from including in filings with the SEC. Reference to EURs of natural gas and oil includes amounts that are not yet classified as p rov ed reserves under SEC definitions, but that we believe should ultimately be produced and are based on previous operating experience in a given area and publicly available information relating to the operations of producers who are conducting oper ati ons in these areas. These estimates are by their nature more speculative than estimates of proved reserves and accordingly are subject to substantially greater risk of being actually realized by us. Factors affecting the ultimate recove ry of reserves that may be recovered include the scope of our drilling programs, which will be directly affected by capital availability, drilling and production costs, commodity prices, availability of services and equipment, permit expirations, tr ans portation constraints, regulatory approvals and other factors, and actual drilling results, including geological and mechanic al factors affecting recovery rates. Accordingly, actual quantities that may be recovered from our interests will differ from ou r e stimates and could be significantly less than our targeted recovery rate. In addition, our estimates may change significantly as we receive additional data. Supplemental Non - GAAP Financial Measures This Presentation includes financial measures that are not in accordance with accounting principles generally accepted in the Un ited States (“GAAP”), such as “Adjusted Net Income,” “Adjusted EBITDA,” “PV - 10,” “Free Cash Flow,” or “FCF,” and “Cash Flow from Operations.” While management believes that such measures are useful for investors, they should not be used as a re pla cement for financial measures that are in accordance with GAAP. For definitions of such non - GAAP financial measures and their reconciliations to GAAP measures, please see the Appendix. 2
www.ringenergy.com NYSE American: REI Ring Energy – Independent Oil & Gas Company Focused on Conventional Permian Assets in Texas & New Mexico 2021 SEC Proved Reserves 2,3 77.8 MMBoe/PV10 $1,332MM 85% Oil Gross / Net Acres 2 83,604 / 64,380 1. Based on Q3’22 financials 2. As of December 31, 2021 (2 - stream) Ring Legacy Only SEC Proved Reserves 3. PV - 10 is a Non - GAAP financial measure. See appendix for reconciliation to GAAP measure 4. As of November 8, 2022 5. Enterprise Value (EV) is market cap plus outstanding debt based on number of shares outstanding at end of Q3 2022 Market Cap ~$544 million 4 Consistently Generated Positive Cash Flow for 12 Qtrs NEW MEXICO “NWS” Northwest Shelf “CBP” Central Basin Platform “DB” Delaware Basin “SE II” Stronghold Energy II Acquisition Enterprise Value ~$979 million 4,5 REI Closing Price $3.12 4 52 - week range $1.81 - $5.09 REI Avg. Daily Share Volume (90 - Day) ~2.05 million 4 Non - Core Area DB CBP NWS Core Areas SEII Deliver competitive and sustainable returns by developing, acquiring, exploring for, and commercializing oil and natural gas resources VITAL TO THE WORLD’S HEALTH AND WELFARE Q3 2022 Net Sales 1 13,278 Boe/d 76% oil 13% gas 11% NGL 3
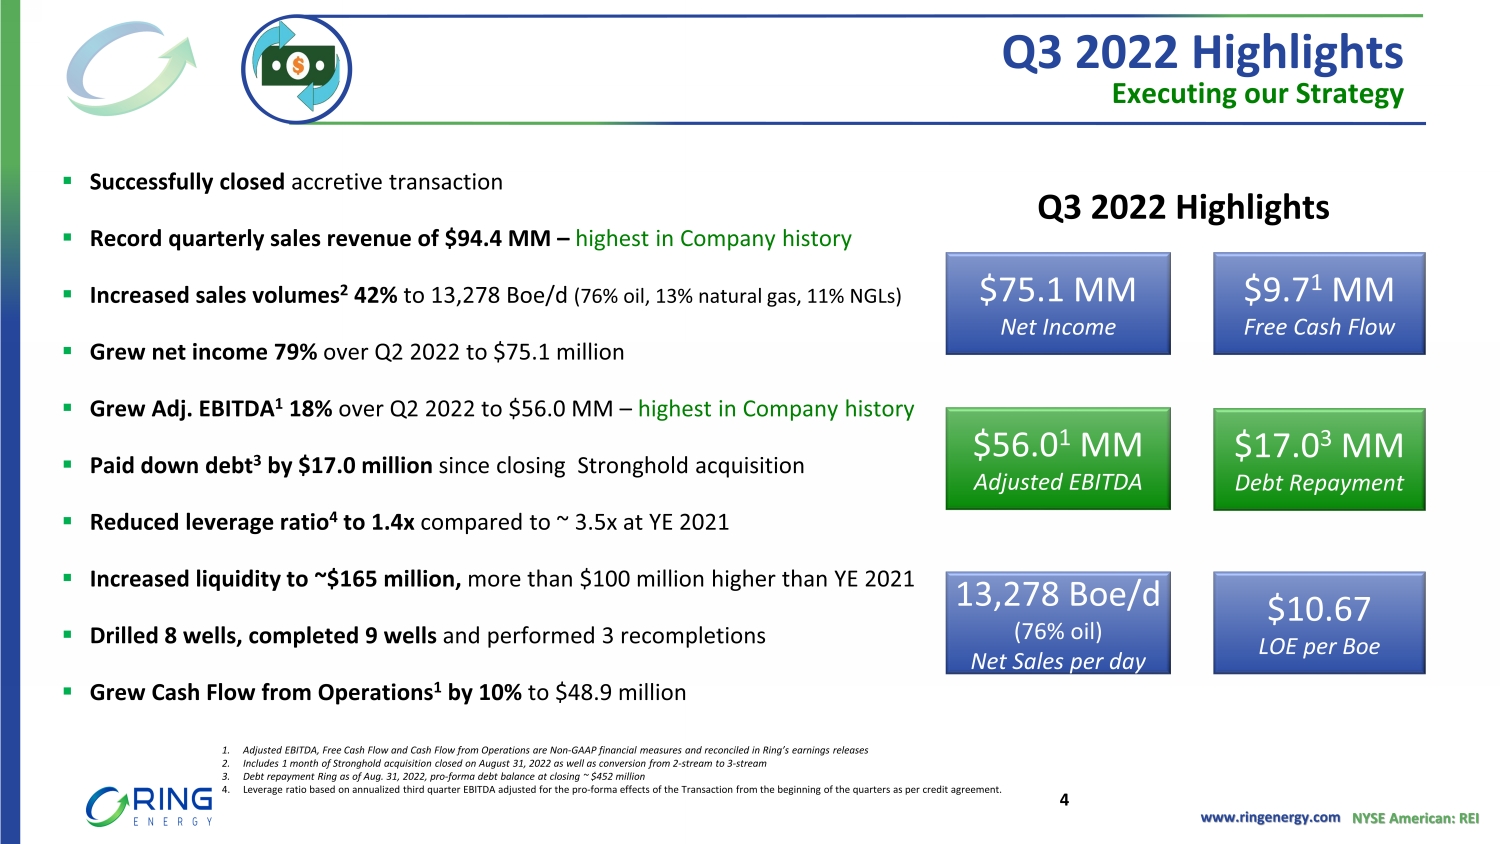
www.ringenergy.com NYSE American: REI Q3 2022 Highlights Executing our Strategy ▪ Successfully closed accretive transaction ▪ Record quarterly sales revenue of $94.4 MM – highest in Company history ▪ Increased sales volumes 2 42% to 13,278 Boe /d (76% oil, 13% natural gas, 11% NGLs) ▪ Grew net income 79% over Q2 2022 to $75.1 million ▪ Grew Adj. EBITDA 1 18% over Q2 2022 to $56.0 MM – highest in Company history ▪ Paid down debt 3 by $17.0 million since closing Stronghold acquisition ▪ Reduced leverage ratio 4 to 1.4x compared to ~ 3.5x at YE 2021 ▪ Increased liquidity to ~$165 million, more than $100 million higher than YE 2021 ▪ Drilled 8 wells, completed 9 wells and performed 3 recompletions ▪ Grew Cash Flow from Operations 1 by 10% to $48.9 million $9.7 1 MM Free Cash Flow $56.0 1 MM Adjusted EBITDA $75.1 MM Net Income $17.0 3 MM Debt Repayment 13 ,278 Boe /d (76% oil) Net Sales per day $10.67 LOE per Boe 1. Adjusted EBITDA, Free Cash Flow and Cash Flow from Operations are Non - GAAP financial measures and reconciled in Ring’s earnings releases 2. Includes 1 month of Stronghold acquisition closed on August 31, 2022 as well as conversion from 2 - stream to 3 - stream 3. Debt repayment Ring as of Aug. 31, 2022, pro - forma debt balance at closing ~ $452 million 4. Leverage ratio based on annualized third quarter EBITDA adjusted for the pro - forma effects of the Transaction from the beginning of the quarters as per credit agreement. Q3 2022 Highlights 4
www.ringenergy.com NYSE American: REI Committed to ESG Critical to Sustainable Success 5
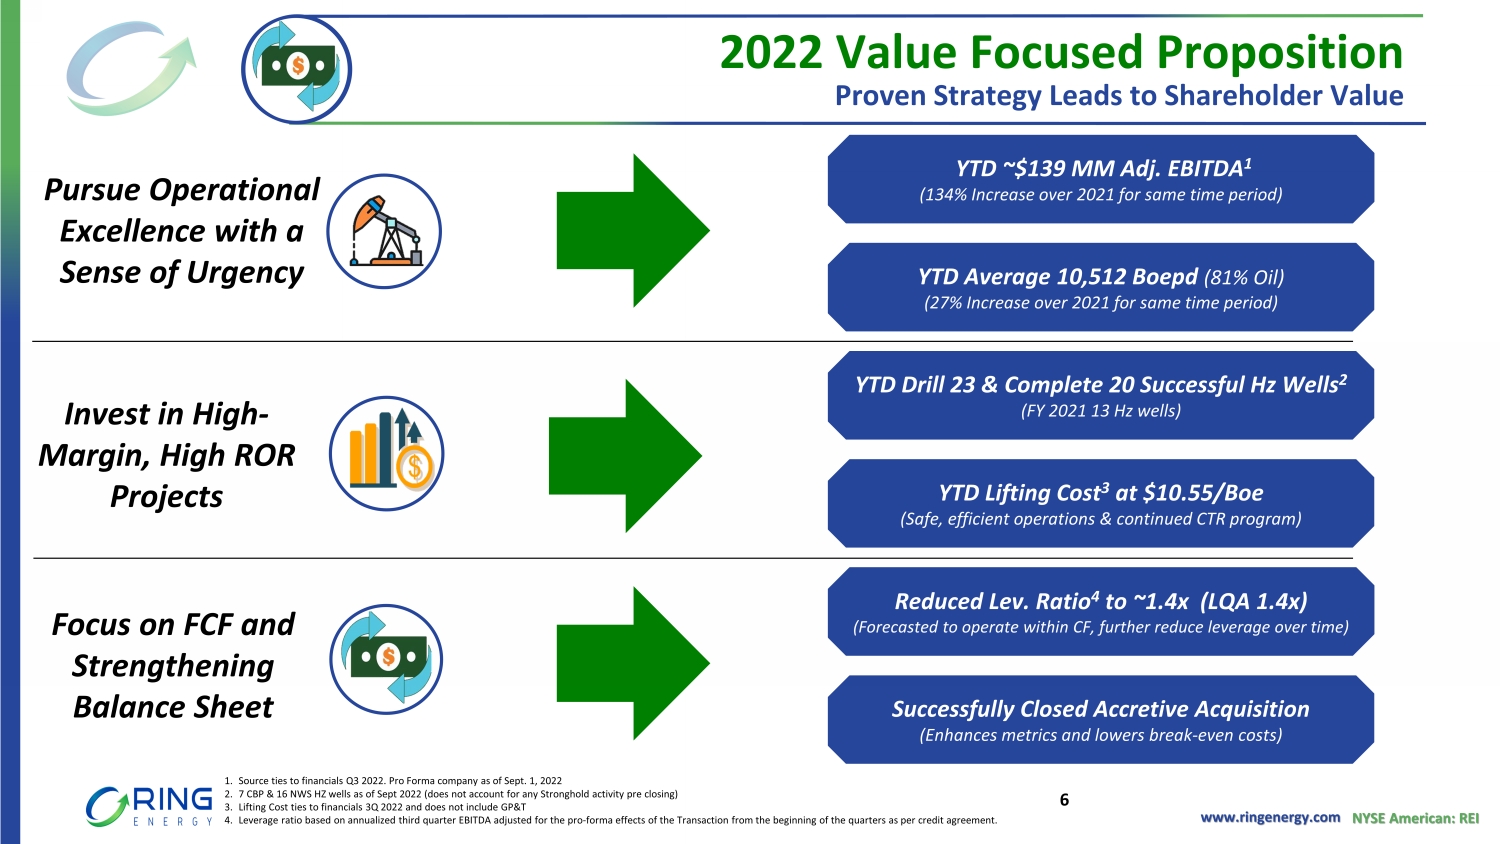
www.ringenergy.com NYSE American: REI Focus on FCF and Strengthening Balance Sheet Pursue Operational Excellence with a Sense of Urgency Invest in High - Margin, High ROR Projects YTD Drill 23 & Complete 20 Successful Hz Wells 2 (FY 2021 13 Hz wells) YTD Average 10,512 Boepd (81% Oil) (27% Increase over 2021 for same time period) YTD ~$139 MM Adj. EBITDA 1 (134% Increase over 2021 for same time period) Reduced Lev. Ratio 4 to ~1.4x (LQA 1.4x) (Forecasted to operate within CF, further reduce leverage over time) Successfully Closed Accretive Acquisition (Enhances metrics and lowers break - even costs) 2022 Value Focused Proposition Proven Strategy Leads to Shareholder Value YTD Lifting Cost 3 at $10.55/Boe (Safe, efficient operations & continued CTR program) 1. Source ties to financials Q3 2022. Pro Forma company as of Sept. 1, 2022 2. 7 CBP & 16 NWS HZ wells as of Sept 2022 (does not account for any Stronghold activity pre closing) 3. Lifting Cost ties to financials 3Q 2022 and does not include GP&T 4. Leverage ratio based on annualized third quarter EBITDA adjusted for the pro - forma effects of the Transaction from the beginning of the quarters as per credit agreement. 6

Financials
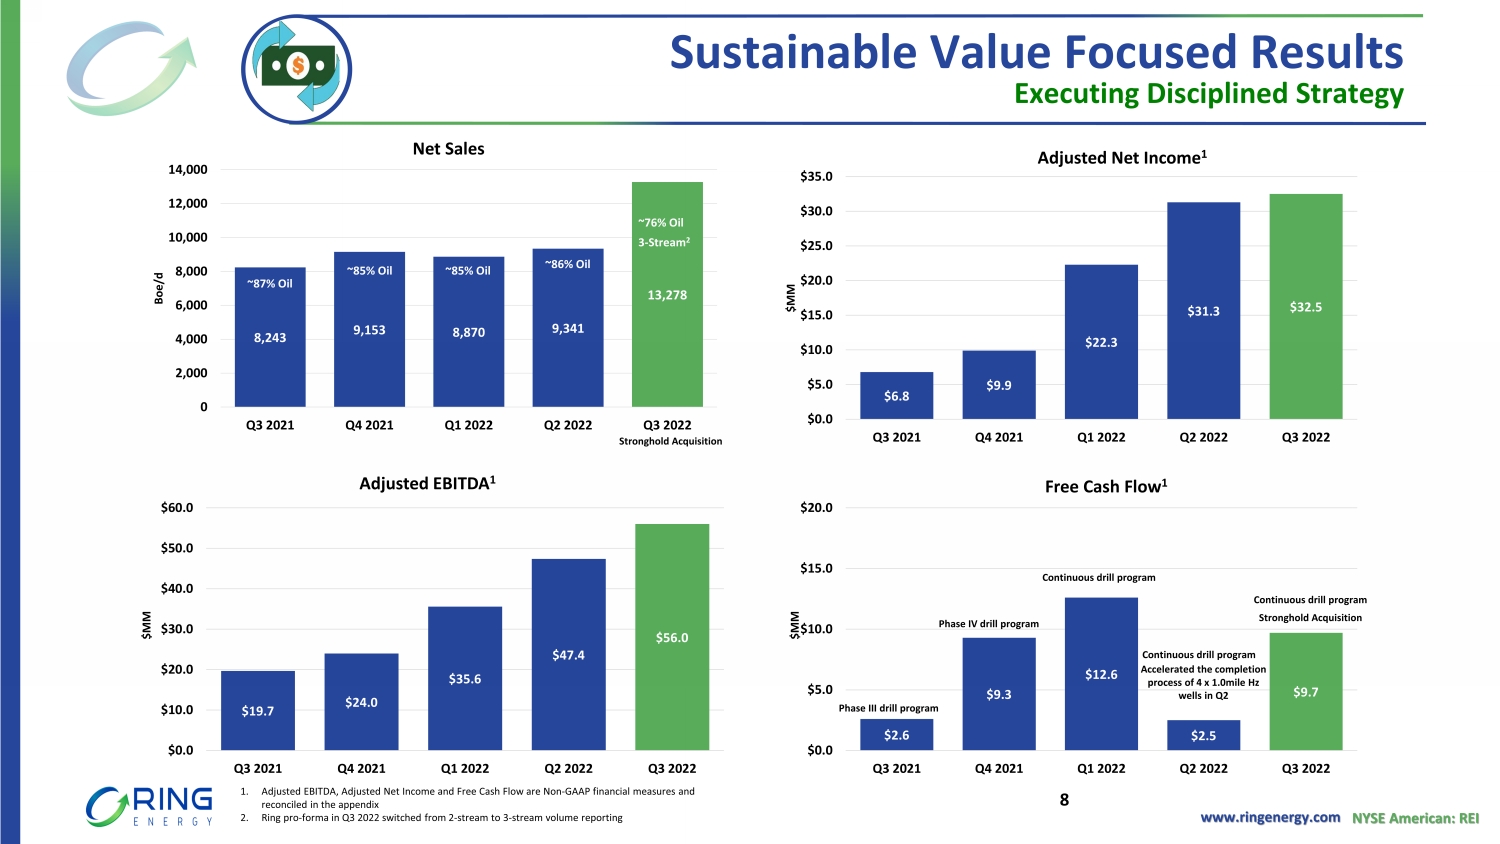
www.ringenergy.com NYSE American: REI Sustainable Value Focused Results 8,243 9,153 8,870 9,341 13,278 0 2,000 4,000 6,000 8,000 10,000 12,000 14,000 Q3 2021 Q4 2021 Q1 2022 Q2 2022 Q3 2022 Boe /d Net Sales $6.8 $9.9 $22.3 $31.3 $32.5 $0.0 $5.0 $10.0 $15.0 $20.0 $25.0 $30.0 $35.0 Q3 2021 Q4 2021 Q1 2022 Q2 2022 Q3 2022 $MM Adjusted Net Income 1 $19.7 $24.0 $35.6 $47.4 $56.0 $0.0 $10.0 $20.0 $30.0 $40.0 $50.0 $60.0 Q3 2021 Q4 2021 Q1 2022 Q2 2022 Q3 2022 $MM Adjusted EBITDA 1 $2.6 $9.3 $12.6 $2.5 $9.7 $0.0 $5.0 $10.0 $15.0 $20.0 Q3 2021 Q4 2021 Q1 2022 Q2 2022 Q3 2022 $MM Free Cash Flow 1 Executing Disciplined Strategy 1. Adjusted EBITDA, Adjusted Net Income and Free Cash Flow are Non - GAAP financial measures and reconciled in the appendix 2. Ring pro - forma in Q3 2022 switched from 2 - stream to 3 - stream volume reporting Continuous drill program Stronghold Acquisition ~85% Oil ~85% Oil ~87% Oil ~76% Oil 3 - Stream 2 Phase III drill program ~86% Oil Phase IV drill program Continuous drill program Continuous drill program Accelerated the completion process of 4 x 1.0mile Hz wells in Q2 Stronghold Acquisition 8
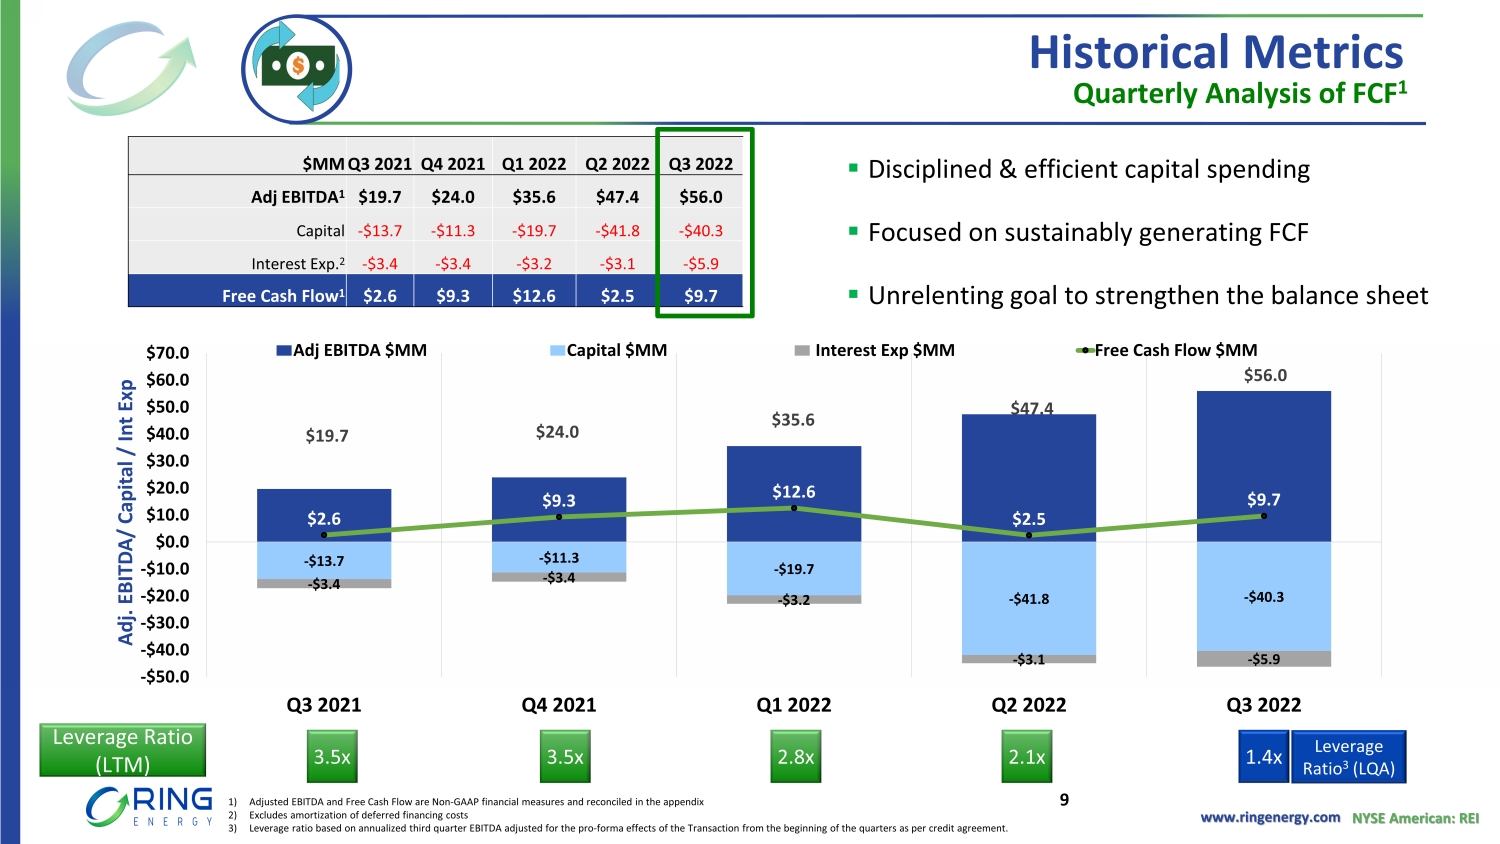
www.ringenergy.com NYSE American: REI Historical Metrics Quarterly Analysis of FCF 1 $MM Q3 2021 Q4 2021 Q1 2022 Q2 2022 Q3 2022 Adj EBITDA 1 $19.7 $24.0 $35.6 $47.4 $56.0 Capital - $13.7 - $11.3 - $19.7 - $41.8 - $40.3 Interest Exp. 2 - $3.4 - $3.4 - $3.2 - $3.1 - $5.9 Free Cash Flow 1 $2.6 $9.3 $12.6 $2.5 $9.7 $19.7 $24.0 $35.6 $47.4 $56.0 - $13.7 - $11.3 - $19.7 - $41.8 - $40.3 - $3.4 - $3.4 - $3.2 - $3.1 - $5.9 $2.6 $9.3 $12.6 $2.5 $9.7 -$50.0 -$40.0 -$30.0 -$20.0 -$10.0 $0.0 $10.0 $20.0 $30.0 $40.0 $50.0 $60.0 $70.0 Q3 2021 Q4 2021 Q1 2022 Q2 2022 Q3 2022 Adj. EBITDA/ Capital / Int Exp Adj EBITDA $MM Capital $MM Interest Exp $MM Free Cash Flow $MM ▪ Disciplined & efficient capital spending ▪ Focused on sustainably generating FCF ▪ Unrelenting goal to strengthen the balance sheet 1) Adjusted EBITDA and Free Cash Flow are Non - GAAP financial measures and reconciled in the appendix 2) Excludes amortization of deferred financing costs 3) Leverage ratio based on annualized third quarter EBITDA adjusted for the pro - forma effects of the Transaction from the beginning of the quarters as per credit agreement. Leverage Ratio (LTM) 2.8x 3.5x 3.5x 2.1x 1.4x Leverage Ratio 3 (LQA) 9
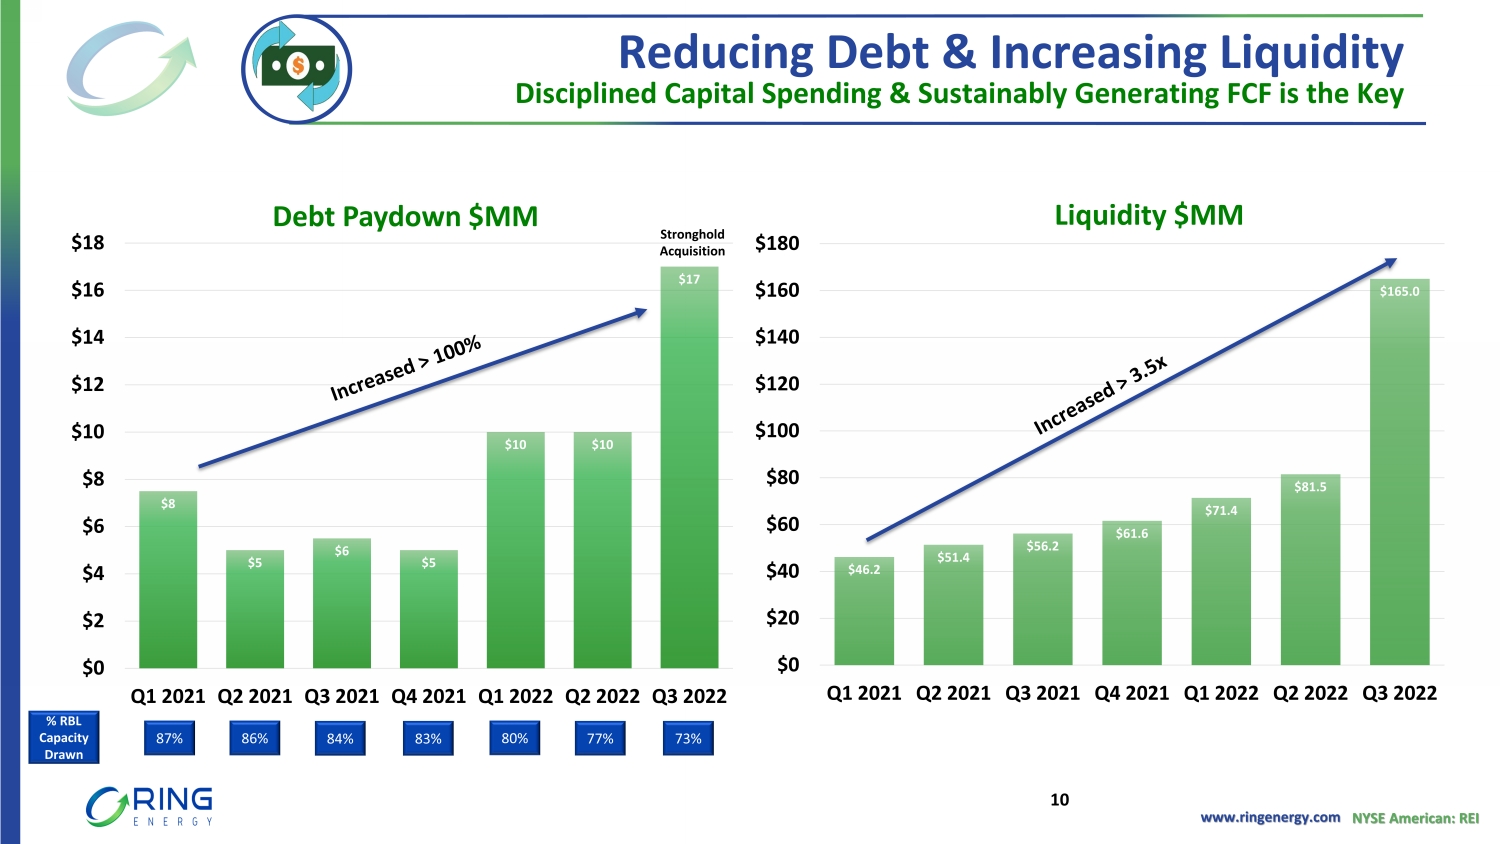
www.ringenergy.com NYSE American: REI $8 $5 $6 $5 $10 $10 $17 $0 $5 $10 $15 $20 $25 $30 $35 $40 $45 $50 $0 $2 $4 $6 $8 $10 $12 $14 $16 $18 Q1 2021 Q2 2021 Q3 2021 Q4 2021 Q1 2022 Q2 2022 Q3 2022 Debt Paydown $MM $313 MM outstanding debt with $36 MM in Surplus Cash Reducing Debt & Increasing Liquidity Disciplined Capital Spending & Sustainably Generating FCF is the Key $46.2 $51.4 $56.2 $61.6 $71.4 $81.5 $165.0 $0 $20 $40 $60 $80 $100 $120 $140 $160 $180 Q1 2021 Q2 2021 Q3 2021 Q4 2021 Q1 2022 Q2 2022 Q3 2022 Liquidity $MM Stronghold Acquisition % RBL Capacity Drawn 87% 86% 84% 83% 80% 77% 73% 10
Asset Areas
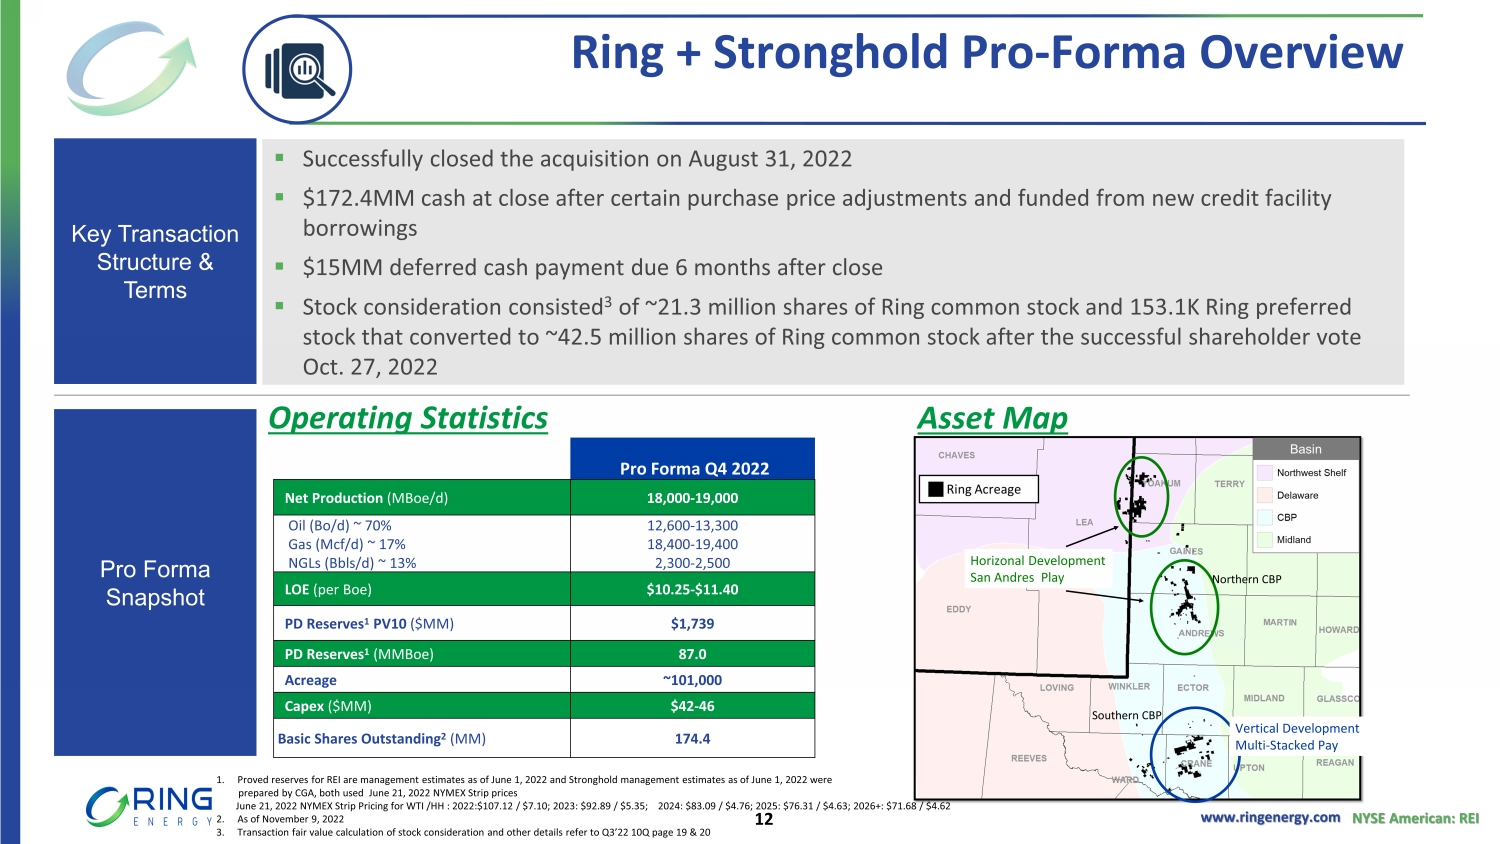
www.ringenergy.com NYSE American: REI Ring + Stronghold Pro - Forma Overview 1. Proved reserves for REI are management estimates as of June 1, 2022 and Stronghold management estimates as of June 1, 2022 we re prepared by CGA, both used June 21, 2022 NYMEX Strip prices June 21, 2022 NYMEX Strip Pricing for WTI /HH : 2022:$107.12 / $7.10; 2023: $92.89 / $5.35; 2024: $83.09 / $4.76; 202 5: $76.31 / $4.63; 2026+: $71.68 / $4.62 2. As of November 9, 2022 3. Transaction fair value calculation of stock consideration and other details refer to Q3’22 10Q page 19 & 20 ▪ Successfully closed the acquisition on August 31, 2022 ▪ $172.4MM cash at close after certain purchase price adjustments and funded from new credit facility borrowings ▪ $15MM deferred cash payment due 6 months after close ▪ Stock consideration consisted 3 of ~21.3 million shares of Ring common stock and 153.1K Ring preferred stock that converted to ~42.5 million shares of Ring common stock after the successful shareholder vote Oct. 27, 2022 Operating Statistics Asset Map Key Transaction Structure & Terms Pro Forma Snapshot Pro Forma Q4 2022 Net Production ( MBoe /d) 18,000 - 19,000 Oil (Bo/d) ~ 70% Gas (Mcf/d) ~ 17% NGLs ( Bbls /d) ~ 13% 12,600 - 13,300 18,400 - 19,400 2,300 - 2,500 LOE (per Boe ) $10.25 - $11.40 PD Reserves 1 PV10 ($MM) $1,739 PD Reserves 1 ( MMBoe ) 87.0 Acreage ~101,000 Capex ($MM) $42 - 46 Basic Shares Outstanding 2 (MM) 174.4 Vertical Development Multi - Stacked Pay Horizonal Development San Andres Play Northern CBP Southern CBP 12
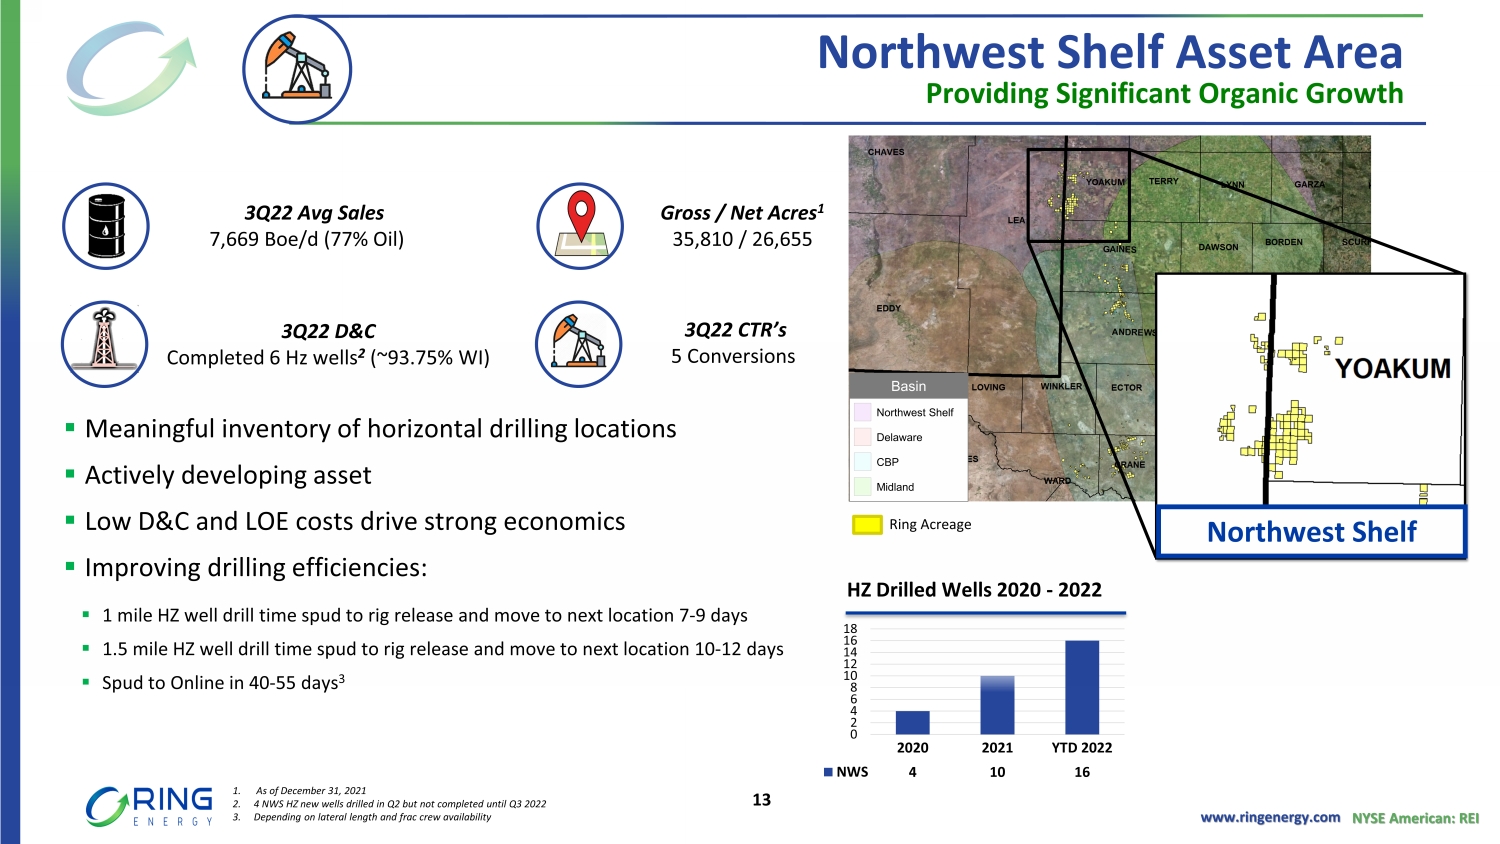
www.ringenergy.com NYSE American: REI ▪ Meaningful inventory of horizontal drilling locations ▪ Actively developing asset ▪ Low D&C and LOE costs drive strong economics ▪ Improving drilling efficiencies: ▪ 1 mile HZ well drill time spud to rig release and move to next location 7 - 9 days ▪ 1.5 mile HZ well drill time spud to rig release and move to next location 10 - 12 days ▪ Spud to Online in 40 - 55 days 3 Providing Significant Organic Growth 3Q22 Avg Sales 7,669 Boe /d (77% Oil) 3Q22 D&C Completed 6 Hz wells 2 (~93.75% WI) Gross / Net Acres 1 35,810 / 26,655 Northwest Shelf Asset Area 3Q22 CTR’s 5 Conversions 1. As of December 31, 2021 2. 4 NWS HZ new wells drilled in Q2 but not completed until Q3 2022 3. Depending on lateral length and frac crew availability Northwest Shelf Delaware Basin CBP Midland Ring Acreage Northwest Shelf 2020 2021 YTD 2022 NWS 4 10 16 0 2 4 6 8 10 12 14 16 18 HZ Drilled Wells 2020 - 2022 13
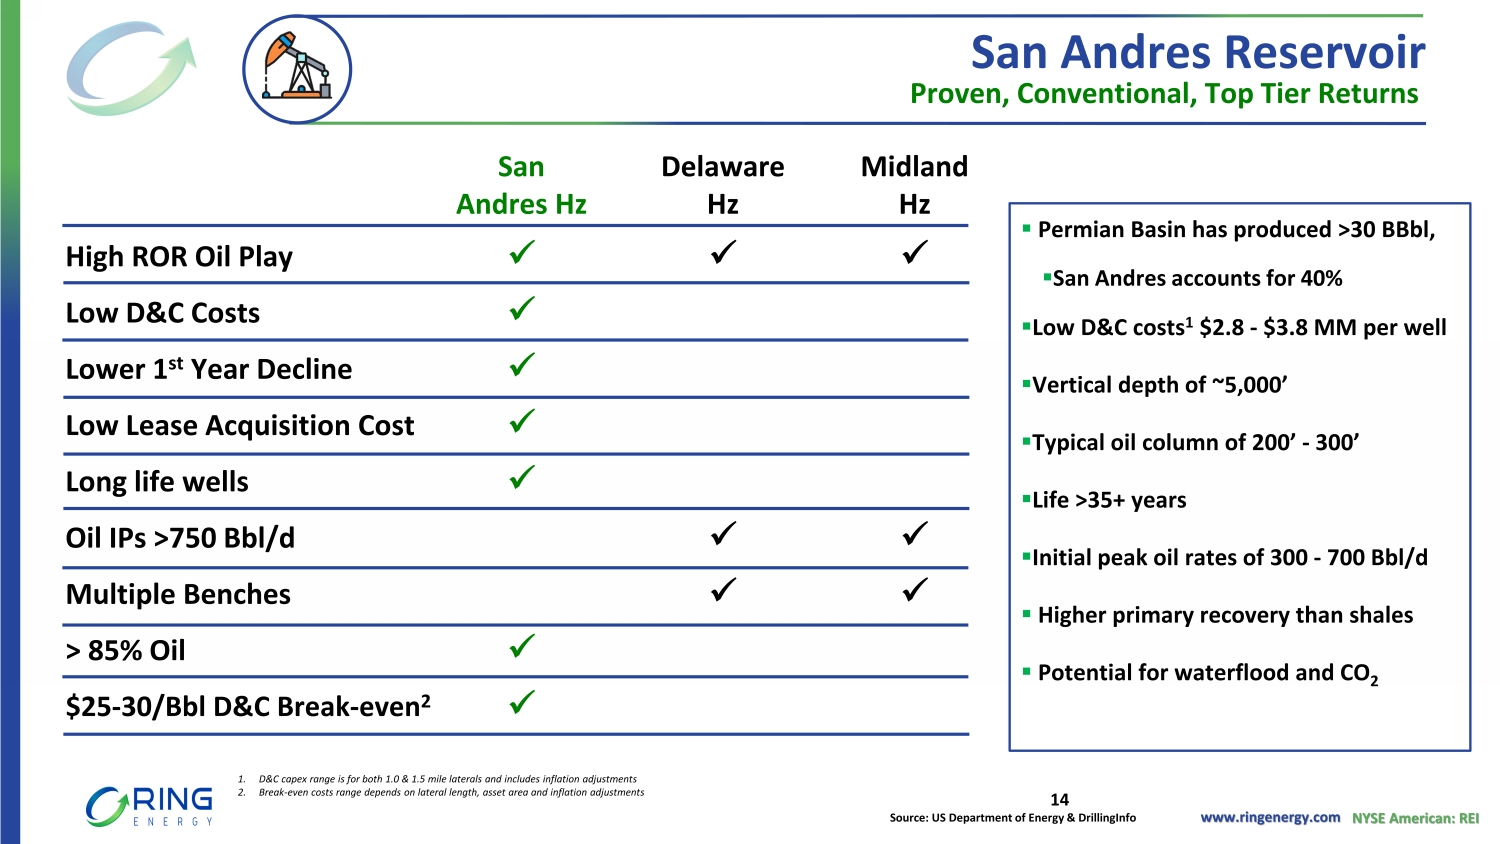
www.ringenergy.com NYSE American: REI Proven, Conventional, Top Tier Returns San Andres Hz Delaware Hz Midland Hz High ROR Oil Play x x x Low D&C Costs x Lower 1 st Year Decline x Low Lease Acquisition Cost x Long life wells x Oil IPs >750 Bbl /d x x Multiple Benches x x > 85% Oil x $25 - 30/ Bbl D&C Break - even 2 x ▪ Permian Basin has produced >30 BBbl , ▪ San Andres accounts for 40% ▪ Low D&C costs 1 $2.8 - $3.8 MM per well ▪ Vertical depth of ~5,000’ ▪ Typical oil column of 200’ - 300’ ▪ Life >35+ years ▪ Initial peak oil rates of 300 - 700 Bbl/d ▪ Higher primary recovery than shales ▪ Potential for waterflood and CO 2 Source: US Department of Energy & DrillingInfo San Andres Reservoir 1. D&C capex range is for both 1.0 & 1.5 mile laterals and includes inflation adjustments 2. Break - even costs range depends on lateral length, asset area and inflation adjustments 14
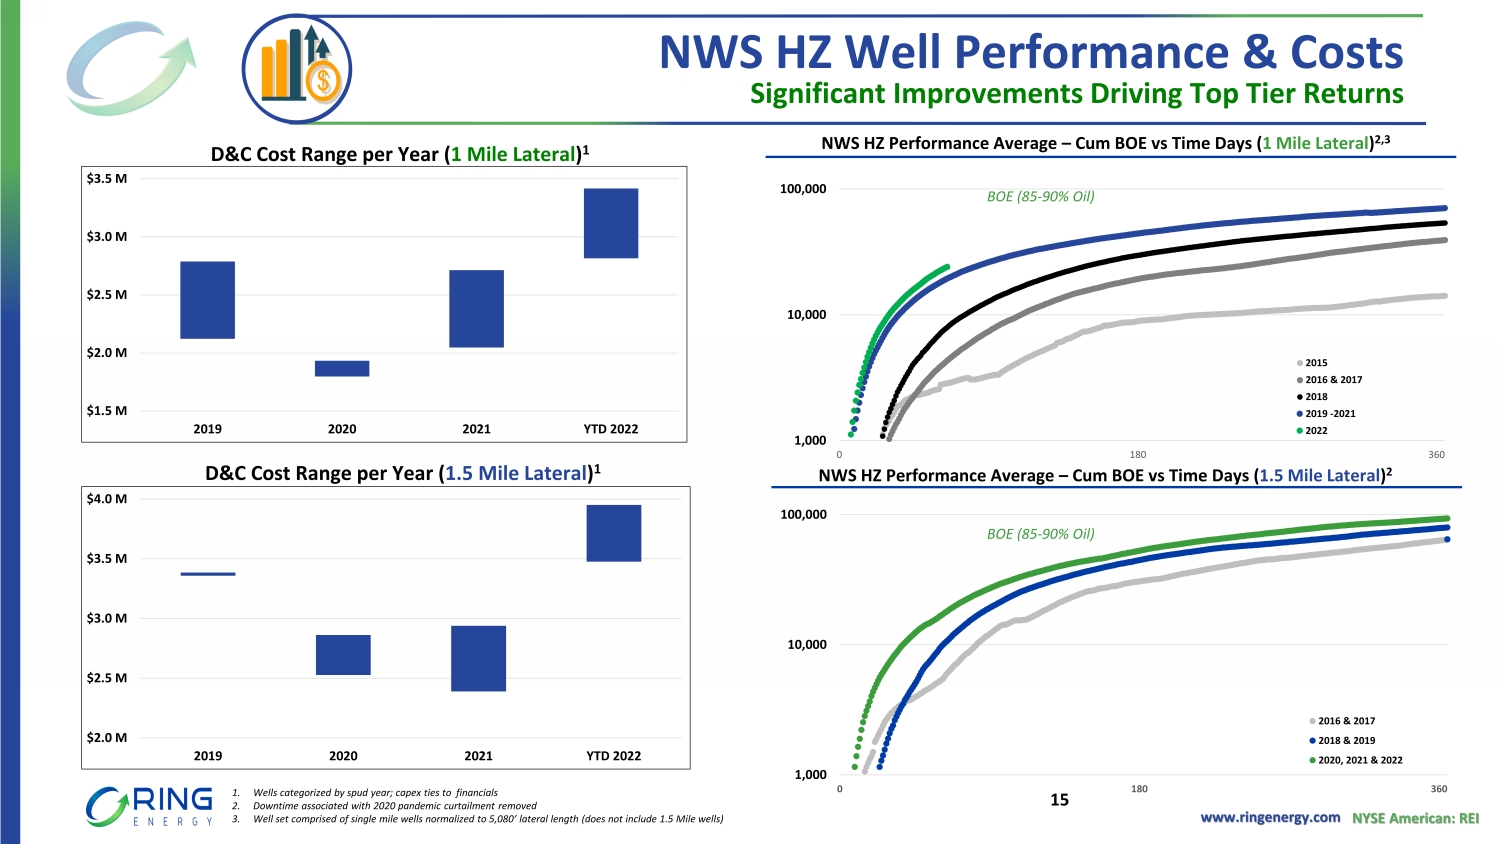
www.ringenergy.com NYSE American: REI NWS HZ Performance Average – Cum BOE vs Time Days ( 1.5 Mile Lateral ) 2 1,000 10,000 100,000 0 180 360 2016 & 2017 2018 & 2019 2020, 2021 & 2022 NWS HZ Well Performance & Costs Significant Improvements Driving Top Tier Returns D&C Cost Range per Year ( 1 Mile Lateral ) 1 NWS HZ Performance Average – Cum BOE vs Time Days ( 1 Mile Lateral ) 2,3 1. Wells categorized by spud year; capex ties to financials 2. Downtime associated with 2020 pandemic curtailment removed 3. Well set comprised of single mile wells normalized to 5,080’ lateral length (does not include 1.5 Mile wells) ~530 Avg ~410 Avg ~420 Avg D&C Cost Range per Year ( 1.5 Mile Lateral ) 1 BOE (85 - 90% Oil) $1.5 M $2.0 M $2.5 M $3.0 M $3.5 M 2019 2020 2021 YTD 2022 $2.0 M $2.5 M $3.0 M $3.5 M $4.0 M 2019 2020 2021 YTD 2022 1,000 10,000 100,000 0 180 360 2015 2016 & 2017 2018 2019 -2021 2022 15 BOE (85 - 90% Oil)
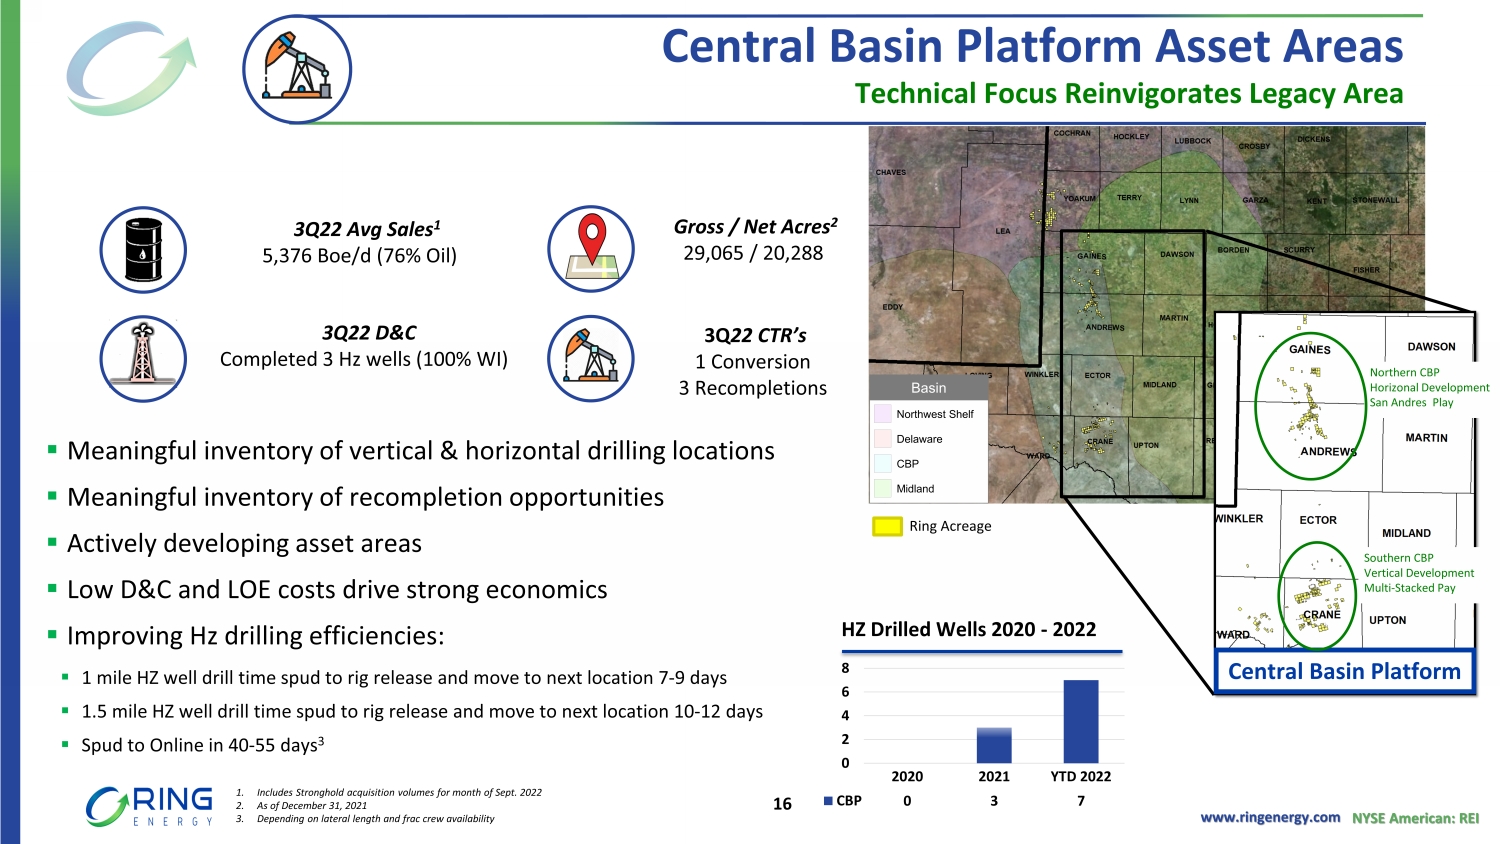
www.ringenergy.com NYSE American: REI 3Q22 Avg Sales 1 5,376 Boe /d (76% Oil) 3Q 22 CTR’s 1 Conversion 3 Recompletions 3Q22 D&C Completed 3 Hz wells (100% WI) Gross / Net Acres 2 29,065 / 20,288 Technical Focus Reinvigorates Legacy Area Central Basin Platform Asset Areas 1. Includes Stronghold acquisition volumes for month of Sept. 2022 2. As of December 31, 2021 3. Depending on lateral length and frac crew availability ▪ Meaningful inventory of vertical & horizontal drilling locations ▪ Meaningful inventory of recompletion opportunities ▪ Actively developing asset areas ▪ Low D&C and LOE costs drive strong economics ▪ Improving Hz drilling efficiencies: ▪ 1 mile HZ well drill time spud to rig release and move to next location 7 - 9 days ▪ 1.5 mile HZ well drill time spud to rig release and move to next location 10 - 12 days ▪ Spud to Online in 40 - 55 days 3 Northwest Shelf Delaware Basin CBP Midland Ring Acreage Central Basin Platform 2020 2021 YTD 2022 CBP 0 3 7 0 2 4 6 8 HZ Drilled Wells 2020 - 2022 Northern CBP Horizonal Development San Andres Play Southern CBP Vertical Development Multi - Stacked Pay 16
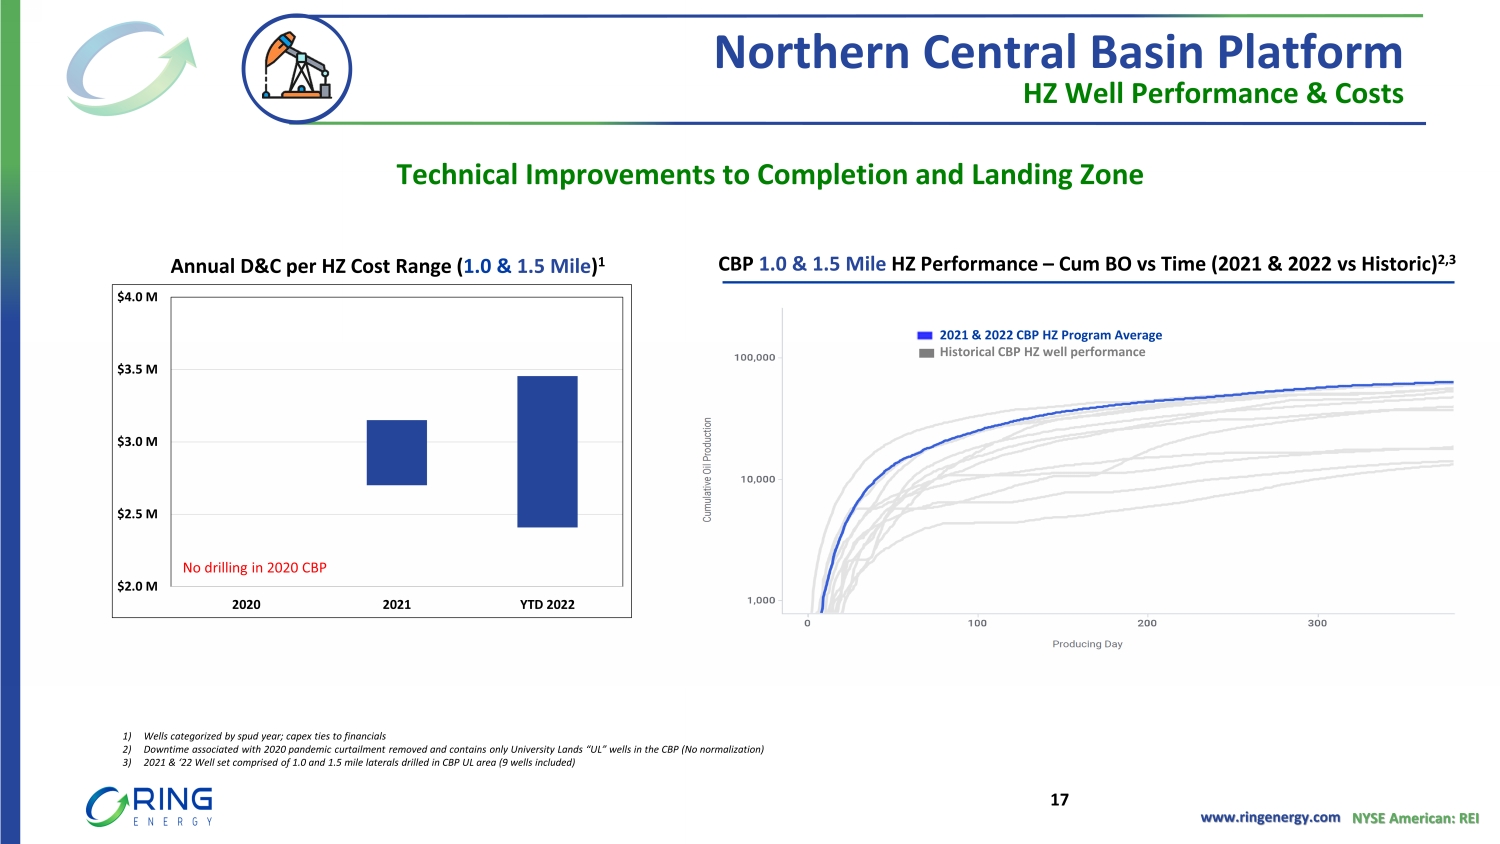
www.ringenergy.com NYSE American: REI Northern Central Basin Platform HZ Well Performance & Costs Annual D&C per HZ Cost Range ( 1.0 & 1.5 Mile ) 1 ~530 Avg ~410 Avg ~420 Avg CBP 1.0 & 1.5 Mile HZ Performance – Cum BO vs Time (2021 & 2022 vs Historic) 2,3 1) Wells categorized by spud year; capex ties to financials 2) Downtime associated with 2020 pandemic curtailment removed and contains only University Lands “UL” wells in the CBP (No norma liz ation) 3) 2021 & ‘22 Well set comprised of 1.0 and 1.5 mile laterals drilled in CBP UL area (9 wells included) $2.0 M $2.5 M $3.0 M $3.5 M $4.0 M 2020 2021 YTD 2022 No drilling in 2020 CBP 2021 & 2022 CBP HZ Program Average Historical CBP HZ well performance Technical Improvements to Completion and Landing Zone 17
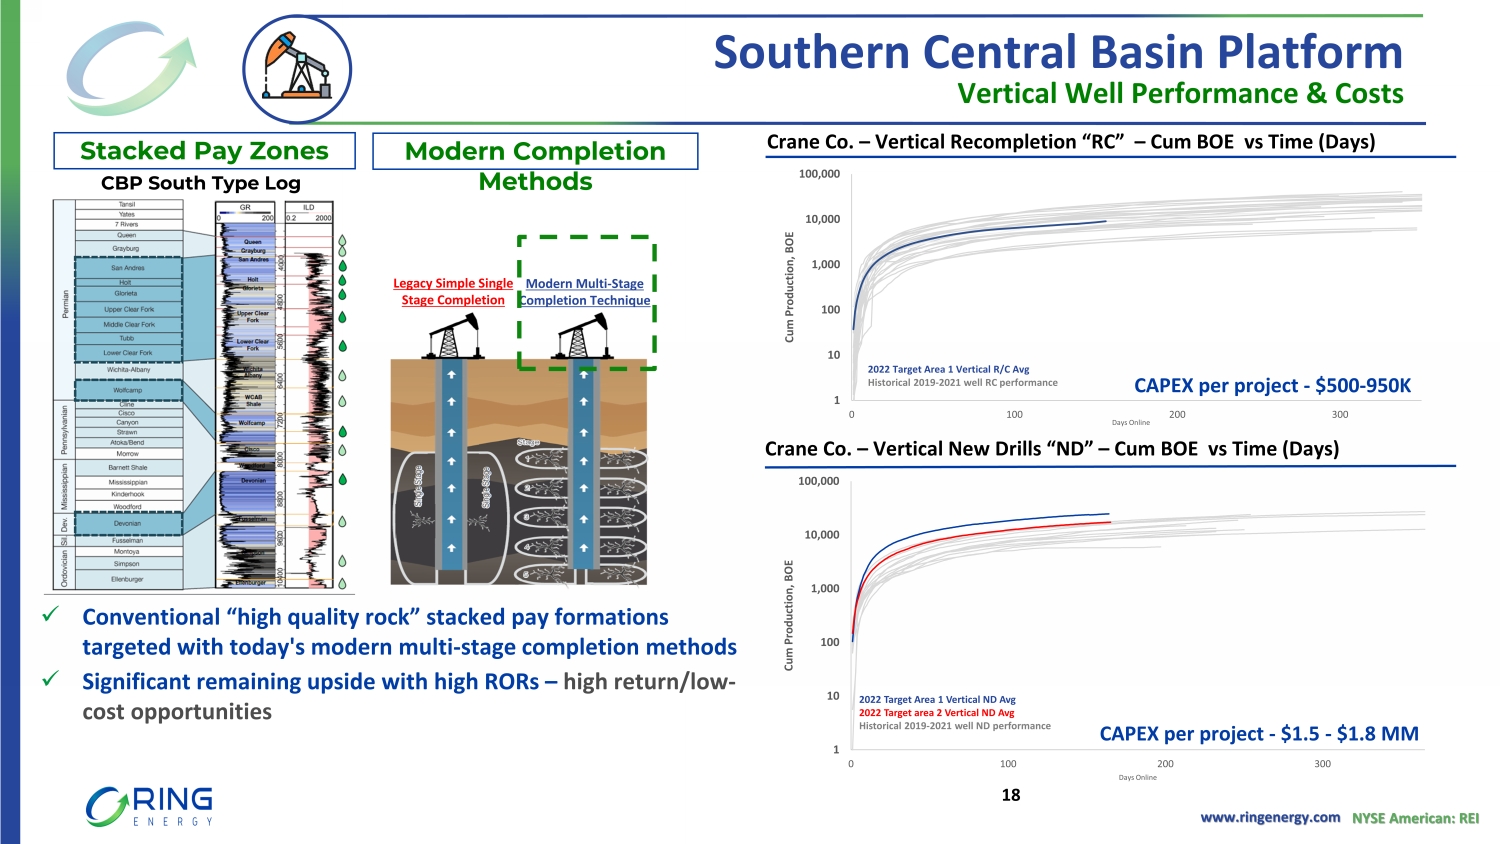
www.ringenergy.com NYSE American: REI 1 10 100 1,000 10,000 100,000 0 100 200 300 Cum Production, BOE Days Online 2022 Target Area 1 Vertical R/C Avg Historical 2019 - 2021 well RC performance Southern Central Basin Platform Vertical Well Performance & Costs ~530 Avg ~410 Avg ~420 Avg Modern Completion Methods x Conventional “high quality rock” stacked pay formations targeted with today's modern multi - stage completion methods x Significant remaining upside with high RORs – high return/low - cost opportunities Legacy Simple Single Stage Completion Modern Multi - Stage Completion Technique Crane Co . – Vertical New Drills “ND” – Cum BOE vs Time (Days) Crane Co . – Vertical Recompletion “RC” – Cum BOE vs Time (Days) 1 10 100 1,000 10,000 100,000 0 100 200 300 Cum Production, BOE Days Online 2022 Target Area 1 Vertical ND Avg 2022 Target area 2 Vertical ND Avg Historical 2019 - 2021 well ND performance CBP South Type Log CAPEX per project - $500 - 950K CAPEX per project - $1.5 - $1.8 MM Stacked Pay Zones 18
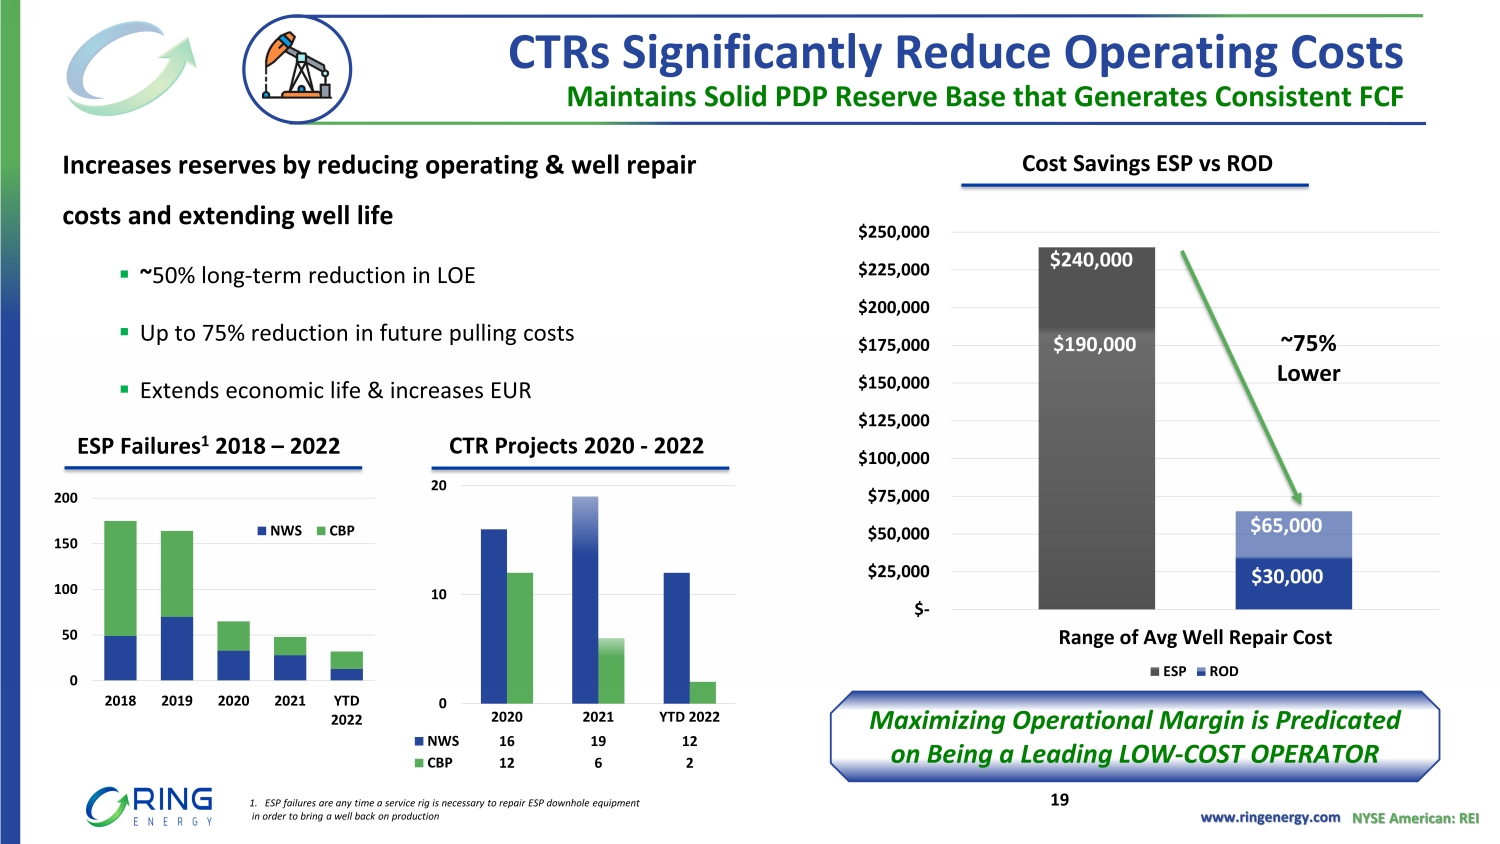
www.ringenergy.com NYSE American: REI 0 50 100 150 200 2018 2019 2020 2021 YTD 2022 NWS CBP Maintains Solid PDP Reserve Base that Generates Consistent FCF Increases reserves by reducing operating & well repair costs and extending well life ▪ ~ 50% long - term reduction in LOE ▪ Up to 75% reduction in future pulling costs ▪ Extends economic life & increases EUR CTRs Significantly Reduce Operating Costs 2020 2021 YTD 2022 NWS 16 19 12 CBP 12 6 2 0 10 20 $- $25,000 $50,000 $75,000 $100,000 $125,000 $150,000 $175,000 $200,000 $225,000 $250,000 Range of Avg Well Repair Cost ESP ROD $190,000 $65,000 $30,000 Cost Savings ESP vs ROD Maximizing Operational Margin is Predicated on Being a Leading LOW - COST OPERATOR ~75% Lower $240,000 CTR Projects 2020 - 2022 ESP Failures 1 2018 – 2022 1. ESP failures are any time a service rig is necessary to repair ESP downhole equipment in order to bring a well back on production 19
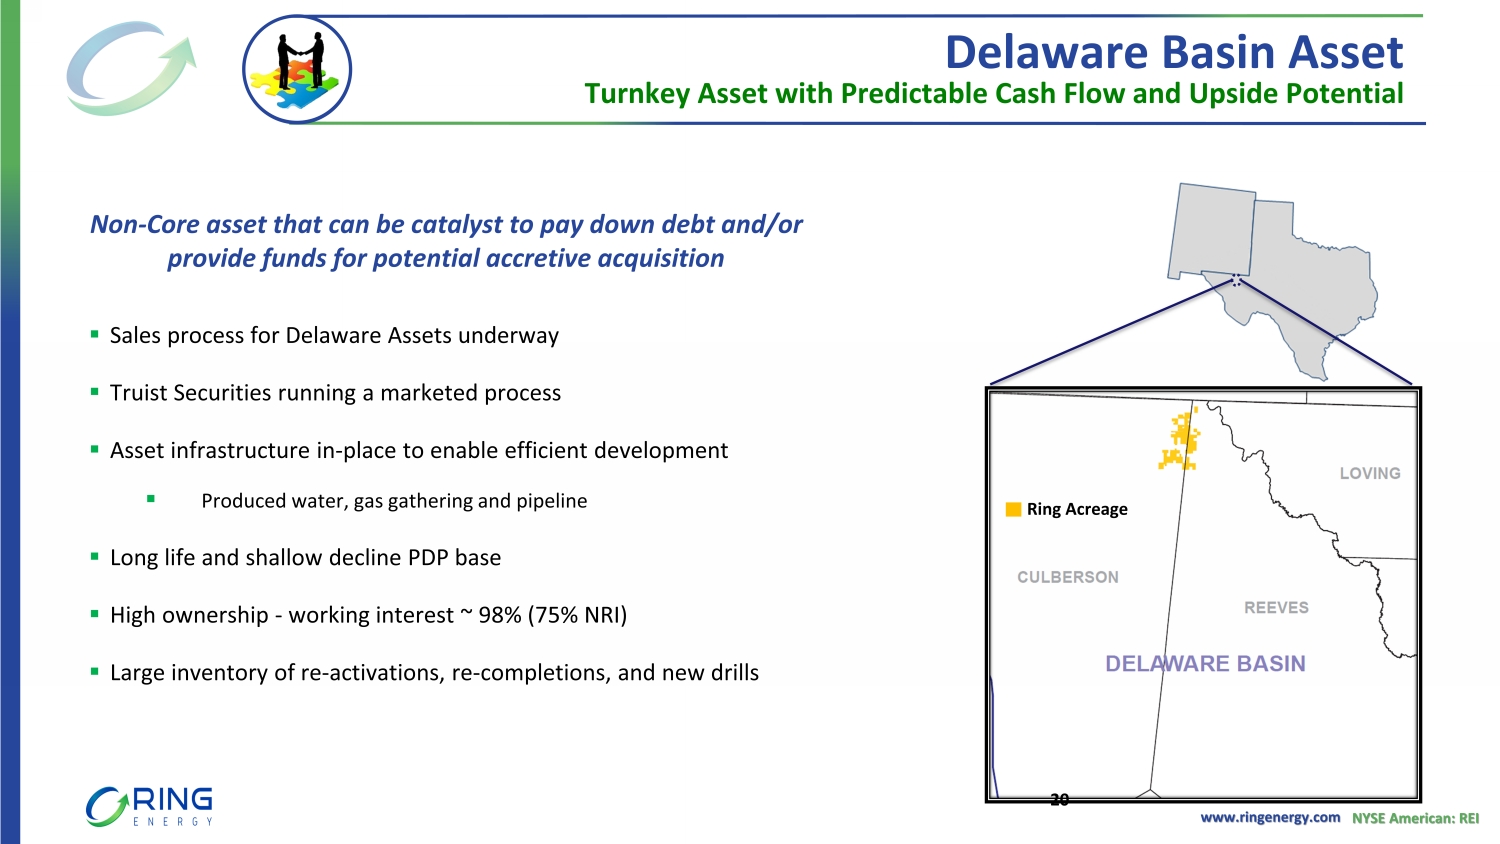
www.ringenergy.com NYSE American: REI Turnkey Asset with Predictable Cash Flow and Upside Potential Delaware Basin Asset ▪ Sales process for Delaware Assets underway ▪ Truist Securities running a marketed process ▪ Asset infrastructure in - place to enable efficient development ▪ Produced water, gas gathering and pipeline ▪ Long life and shallow decline PDP base ▪ High ownership - working interest ~ 98% (75% NRI) ▪ Large inventory of re - activations, re - completions, and new drills Ring Acreage Non - Core asset that can be catalyst to pay down debt and/or provide funds for potential accretive acquisition 20
www.ringenergy.com NYSE American: REI Value Proposition 2022 and Beyond Positioned for Substantial Increase in Revenue and FCF Achieving High - Return Organic Growth Pursuing Acquisition Opportunities to Further Increase Scale and Lower Break - Even Costs 21
Appendix
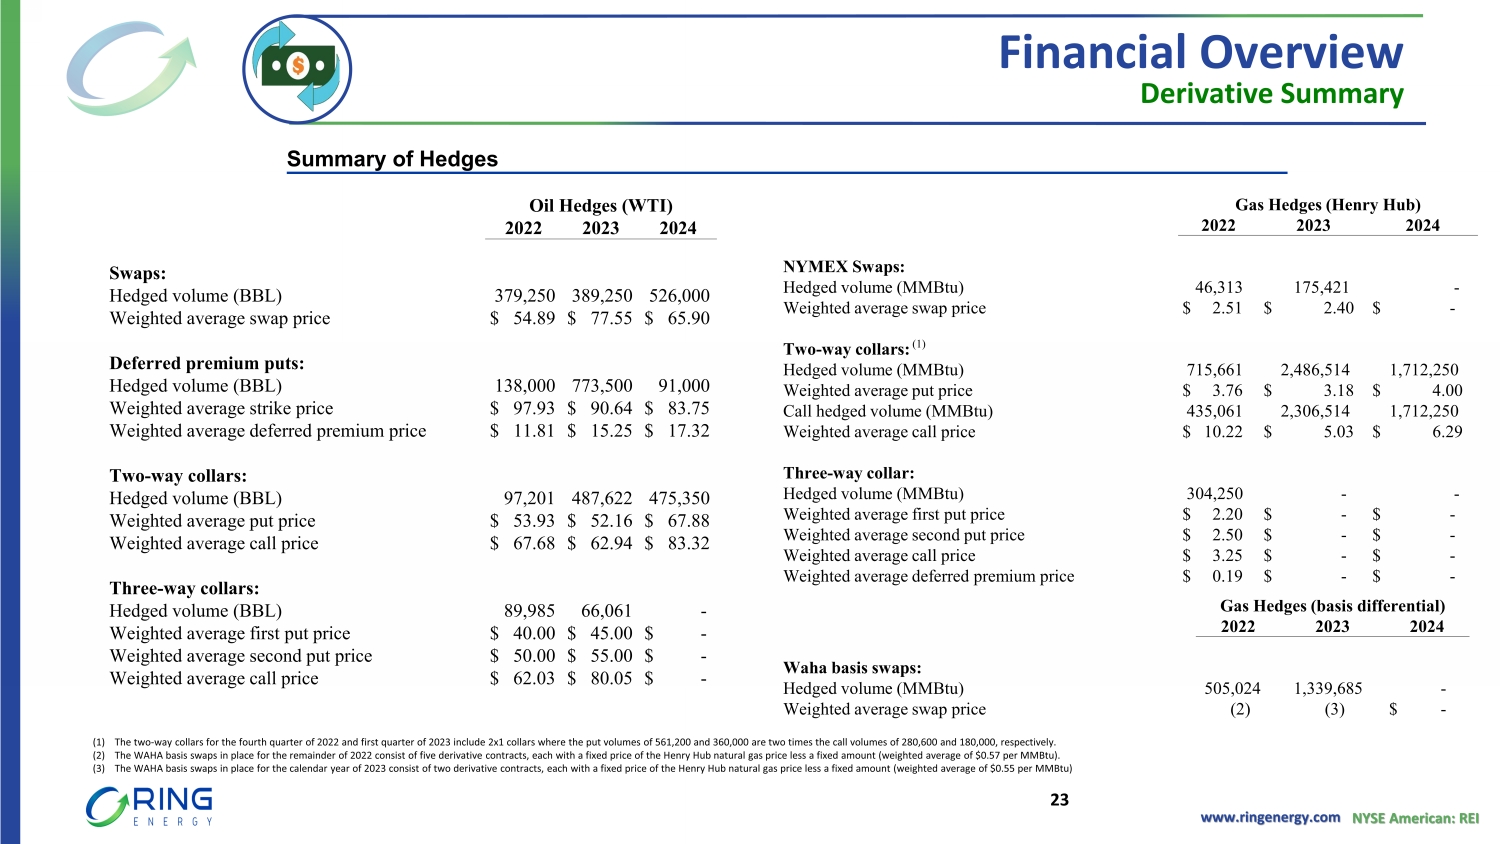
www.ringenergy.com NYSE American: REI Gas Hedges (basis differential) 2022 2023 2024 Waha basis swaps: Hedged volume (MMBtu) 505,024 1,339,685 - Weighted average swap price (2) (3) $ - Financial Overview Derivative Summary Summary of Hedges Oil Hedges (WTI) 2022 2023 2024 Swaps: Hedged volume (BBL) 379,250 389,250 526,000 Weighted average swap price $ 54.89 $ 77.55 $ 65.90 Deferred premium puts: Hedged volume (BBL) 138,000 773,500 91,000 Weighted average strike price $ 97.93 $ 90.64 $ 83.75 Weighted average deferred premium price $ 11.81 $ 15.25 $ 17.32 Two - way collars: Hedged volume (BBL) 97,201 487,622 475,350 Weighted average put price $ 53.93 $ 52.16 $ 67.88 Weighted average call price $ 67.68 $ 62.94 $ 83.32 Three - way collars: Hedged volume (BBL) 89,985 66,061 - Weighted average first put price $ 40.00 $ 45.00 $ - Weighted average second put price $ 50.00 $ 55.00 $ - Weighted average call price $ 62.03 $ 80.05 $ - Gas Hedges (Henry Hub) 2022 2023 2024 NYMEX Swaps: Hedged volume (MMBtu) 46,313 175,421 - Weighted average swap price $ 2.51 $ 2.40 $ - Two - way collars: (1) Hedged volume (MMBtu) 715,661 2,486,514 1,712,250 Weighted average put price $ 3.76 $ 3.18 $ 4.00 Call hedged volume (MMBtu) 435,061 2,306,514 1,712,250 Weighted average call price $ 10.22 $ 5.03 $ 6.29 Three - way collar: Hedged volume (MMBtu) 304,250 - - Weighted average first put price $ 2.20 $ - $ - Weighted average second put price $ 2.50 $ - $ - Weighted average call price $ 3.25 $ - $ - Weighted average deferred premium price $ 0.19 $ - $ - (1) The two - way collars for the fourth quarter of 2022 and first quarter of 2023 include 2x1 collars where the put volumes of 561,200 and 360,000 are two times the call volumes of 280,600 and 180,000, respectively. (2) The WAHA basis swaps in place for the remainder of 2022 consist of five derivative contracts, each with a fixed price of the Henry Hub natural gas price less a fixed amount (weighted average of $0.57 per MMBtu). (3) The WAHA basis swaps in place for the calendar year of 2023 consist of two derivative contracts, each with a fixed price of the Henry Hub natural gas price less a fixed amount (weighted average of $0.55 per MMBtu) 23
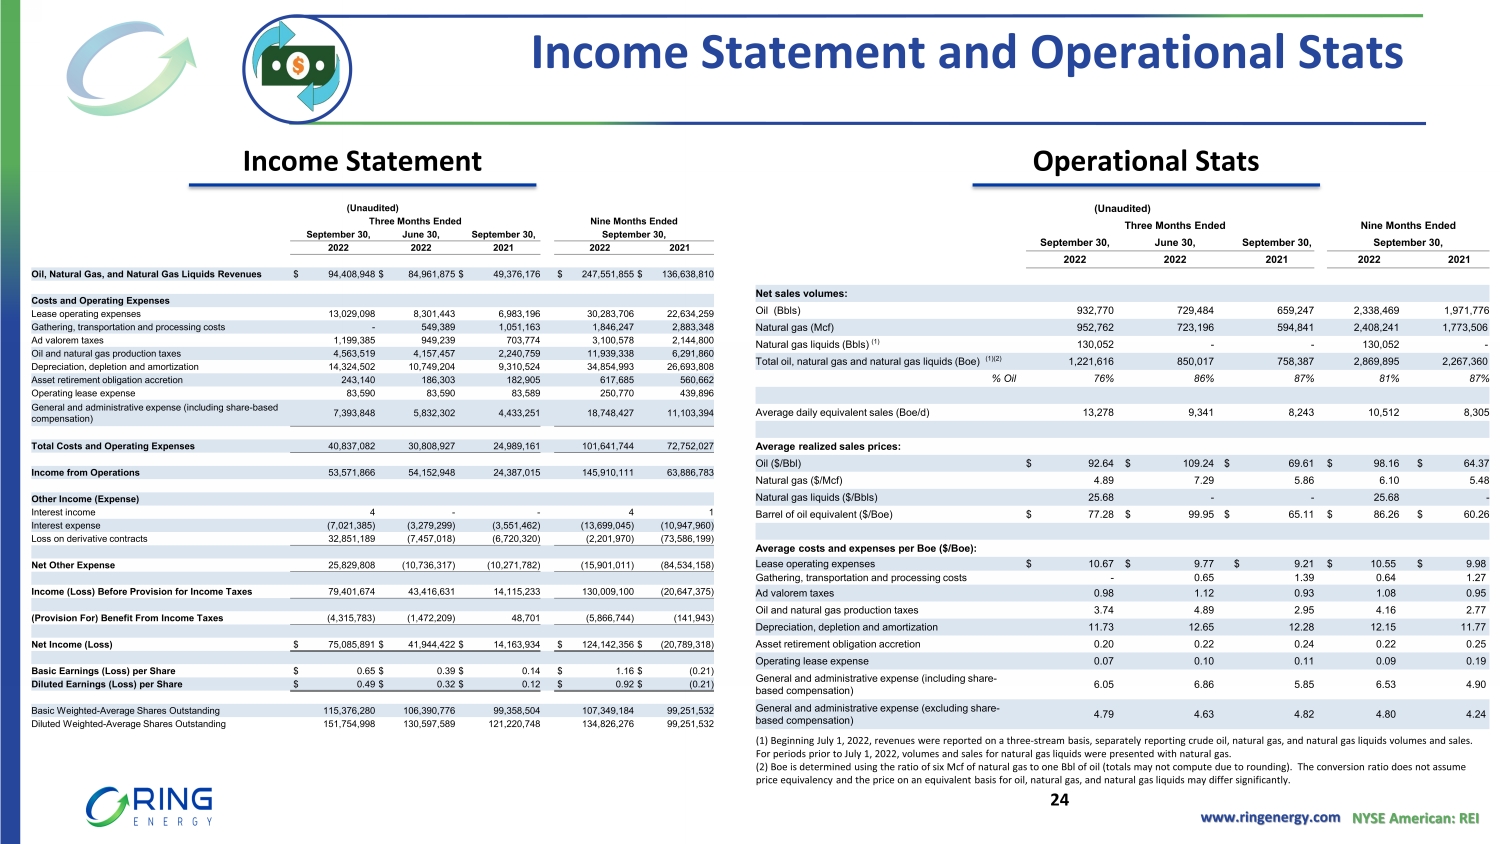
www.ringenergy.com NYSE American: REI Income Statement and Operational Stats Income Statement Operational Stats (Unaudited) Three Months Ended Nine Months Ended September 30, June 30, September 30, September 30, 2022 2022 2021 2022 2021 Oil, Natural Gas, and Natural Gas Liquids Revenues $ 94,408,948 $ 84,961,875 $ 49,376,176 $ 247,551,855 $ 136,638,810 Costs and Operating Expenses Lease operating expenses 13,029,098 8,301,443 6,983,196 30,283,706 22,634,259 Gathering, transportation and processing costs - 549,389 1,051,163 1,846,247 2,883,348 Ad valorem taxes 1,199,385 949,239 703,774 3,100,578 2,144,800 Oil and natural gas production taxes 4,563,519 4,157,457 2,240,759 11,939,338 6,291,860 Depreciation, depletion and amortization 14,324,502 10,749,204 9,310,524 34,854,993 26,693,808 Asset retirement obligation accretion 243,140 186,303 182,905 617,685 560,662 Operating lease expense 83,590 83,590 83,589 250,770 439,896 General and administrative expense (including share - based compensation) 7,393,848 5,832,302 4,433,251 18,748,427 11,103,394 Total Costs and Operating Expenses 40,837,082 30,808,927 24,989,161 101,641,744 72,752,027 Income from Operations 53,571,866 54,152,948 24,387,015 145,910,111 63,886,783 Other Income (Expense) Interest income 4 - - 4 1 Interest expense (7,021,385) (3,279,299) (3,551,462) (13,699,045) (10,947,960) Loss on derivative contracts 32,851,189 (7,457,018) (6,720,320) (2,201,970) (73,586,199) Net Other Expense 25,829,808 (10,736,317) (10,271,782) (15,901,011) (84,534,158) Income (Loss) Before Provision for Income Taxes 79,401,674 43,416,631 14,115,233 130,009,100 (20,647,375) (Provision For) Benefit From Income Taxes (4,315,783) (1,472,209) 48,701 (5,866,744) (141,943) Net Income (Loss) $ 75,085,891 $ 41,944,422 $ 14,163,934 $ 124,142,356 $ (20,789,318) Basic Earnings (Loss) per Share $ 0.65 $ 0.39 $ 0.14 $ 1.16 $ (0.21) Diluted Earnings (Loss) per Share $ 0.49 $ 0.32 $ 0.12 $ 0.92 $ (0.21) Basic Weighted - Average Shares Outstanding 115,376,280 106,390,776 99,358,504 107,349,184 99,251,532 Diluted Weighted - Average Shares Outstanding 151,754,998 130,597,589 121,220,748 134,826,276 99,251,532 (Unaudited) Three Months Ended Nine Months Ended September 30, June 30, September 30, September 30, 2022 2022 2021 2022 2021 Net sales volumes : Oil (Bbls) 932,770 729,484 659,247 2,338,469 1,971,776 Natural gas (Mcf) 952,762 723,196 594,841 2,408,241 1,773,506 Natural gas liquids (Bbls) (1) 130,052 - - 130,052 - Total oil, natural gas and natural gas liquids (Boe) (1)(2) 1,221,616 850,017 758,387 2,869,895 2,267,360 % Oil 76% 86% 87% 81% 87% Average daily equivalent sales (Boe/d) 13,278 9,341 8,243 10,512 8,305 Average realized sales prices : Oil ($/Bbl) $ 92.64 $ 109.24 $ 69.61 $ 98.16 $ 64.37 Natural gas ($/Mcf) 4.89 7.29 5.86 6.10 5.48 Natural gas liquids ($/Bbls) 25.68 - - 25.68 - Barrel of oil equivalent ($/Boe) $ 77.28 $ 99.95 $ 65.11 $ 86.26 $ 60.26 Average costs and expenses per Boe ( $ /Boe) : Lease operating expenses $ 10.67 $ 9.77 $ 9.21 $ 10.55 $ 9.98 Gathering, transportation and processing costs - 0.65 1.39 0.64 1.27 Ad valorem taxes 0.98 1.12 0.93 1.08 0.95 Oil and natural gas production taxes 3.74 4.89 2.95 4.16 2.77 Depreciation, depletion and amortization 11.73 12.65 12.28 12.15 11.77 Asset retirement obligation accretion 0.20 0.22 0.24 0.22 0.25 Operating lease expense 0.07 0.10 0.11 0.09 0.19 General and administrative expense (including share - based compensation) 6.05 6.86 5.85 6.53 4.90 General and administrative expense (excluding share - based compensation) 4.79 4.63 4.82 4.80 4.24 (1) Beginning July 1, 2022, revenues were reported on a three - stream basis, separately reporting crude oil, natural gas, and nat ural gas liquids volumes and sales. For periods prior to July 1, 2022, volumes and sales for natural gas liquids were presented with natural gas. (2) Boe is determined using the ratio of six Mcf of natural gas to one Bbl of oil (totals may not compute due to rounding). The conversion ratio does not assume price equivalency and the price on an equivalent basis for oil, natural gas, and natural gas liquids may differ significantly . 24
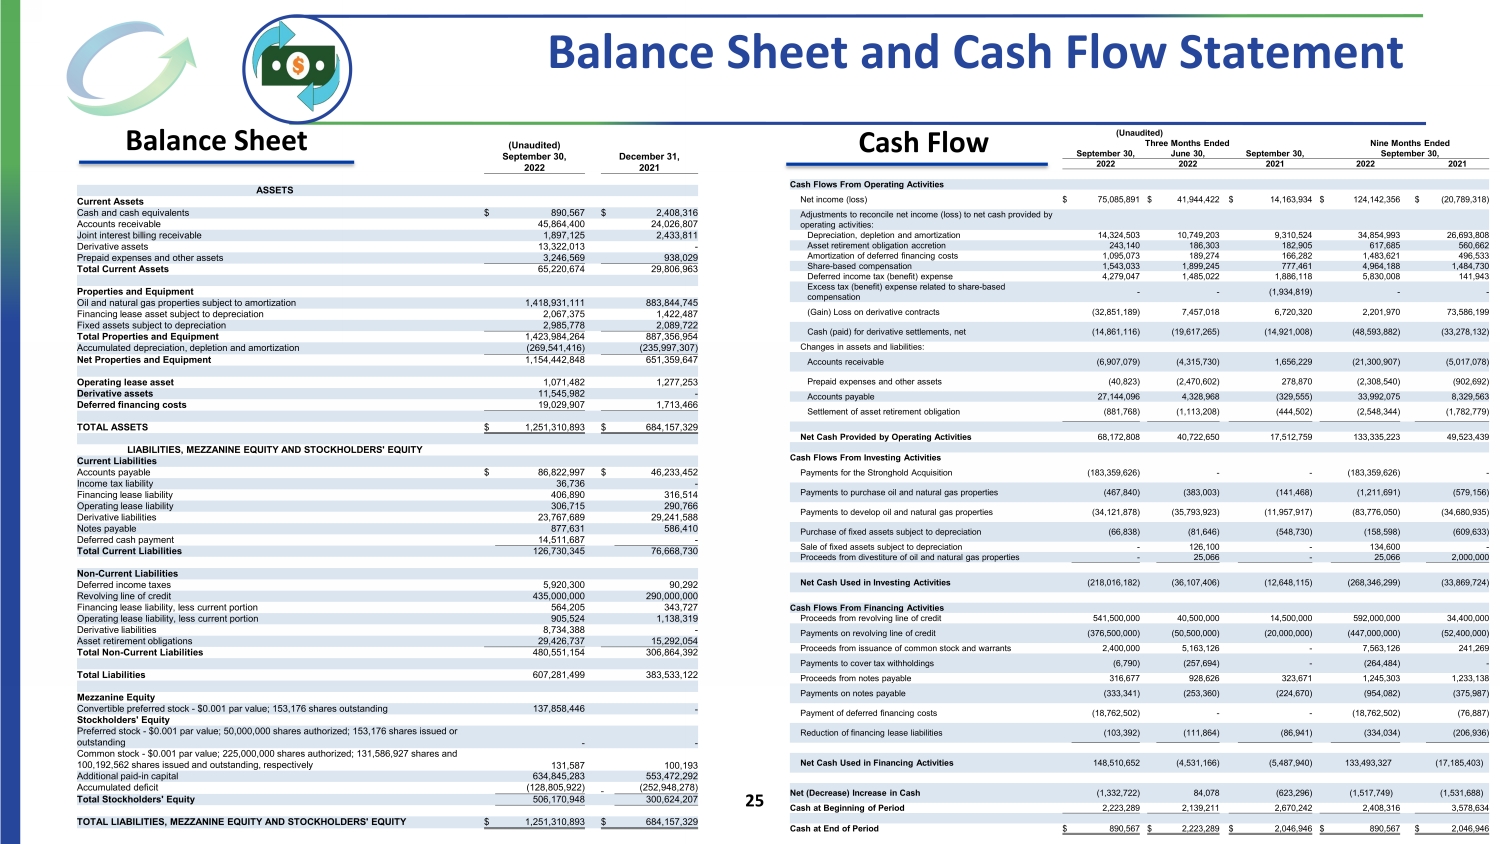
www.ringenergy.com NYSE American: REI (Unaudited) Three Months Ended Nine Months Ended September 30, June 30, September 30, September 30, 2022 2022 2021 2022 2021 Cash Flows From Operating Activities Net income (loss) $ 75,085,891 $ 41,944,422 $ 14,163,934 $ 124,142,356 $ (20,789,318) Adjustments to reconcile net income (loss) to net cash provided by operating activities: Depreciation, depletion and amortization 14,324,503 10,749,203 9,310,524 34,854,993 26,693,808 Asset retirement obligation accretion 243,140 186,303 182,905 617,685 560,662 Amortization of deferred financing costs 1,095,073 189,274 166,282 1,483,621 496,533 Share - based compensation 1,543,033 1,899,245 777,461 4,964,188 1,484,730 Deferred income tax (benefit) expense 4,279,047 1,485,022 1,886,118 5,830,008 141,943 Excess tax (benefit) expense related to share - based compensation - - (1,934,819) - - (Gain) Loss on derivative contracts (32,851,189) 7,457,018 6,720,320 2,201,970 73,586,199 Cash (paid) for derivative settlements, net (14,861,116) (19,617,265) (14,921,008) (48,593,882) (33,278,132) Changes in assets and liabilities: Accounts receivable (6,907,079) (4,315,730) 1,656,229 (21,300,907) (5,017,078) Prepaid expenses and other assets (40,823) (2,470,602) 278,870 (2,308,540) (902,692) Accounts payable 27,144,096 4,328,968 (329,555) 33,992,075 8,329,563 Settlement of asset retirement obligation (881,768) (1,113,208) (444,502) (2,548,344) (1,782,779) Net Cash Provided by Operating Activities 68,172,808 40,722,650 17,512,759 133,335,223 49,523,439 Cash Flows From Investing Activities Payments for the Stronghold Acquisition (183,359,626) - - (183,359,626) - Payments to purchase oil and natural gas properties (467,840) (383,003) (141,468) (1,211,691) (579,156) Payments to develop oil and natural gas properties (34,121,878) (35,793,923) (11,957,917) (83,776,050) (34,680,935) Purchase of fixed assets subject to depreciation (66,838) (81,646) (548,730) (158,598) (609,633) Sale of fixed assets subject to depreciation - 126,100 - 134,600 - Proceeds from divestiture of oil and natural gas properties - 25,066 - 25,066 2,000,000 Net Cash Used in Investing Activities (218,016,182) (36,107,406) (12,648,115) (268,346,299) (33,869,724) Cash Flows From Financing Activities Proceeds from revolving line of credit 541,500,000 40,500,000 14,500,000 592,000,000 34,400,000 Payments on revolving line of credit (376,500,000) (50,500,000) (20,000,000) (447,000,000) (52,400,000) Proceeds from issuance of common stock and warrants 2,400,000 5,163,126 - 7,563,126 241,269 Payments to cover tax withholdings (6,790) (257,694) - (264,484) - Proceeds from notes payable 316,677 928,626 323,671 1,245,303 1,233,138 Payments on notes payable (333,341) (253,360) (224,670) (954,082) (375,987) Payment of deferred financing costs (18,762,502) - - (18,762,502) (76,887) Reduction of financing lease liabilities (103,392) (111,864) (86,941) (334,034) (206,936) Net Cash Used in Financing Activities 148,510,652 (4,531,166) (5,487,940) 133,493,327 (17,185,403) Net (Decrease) Increase in Cash (1,332,722) 84,078 (623,296) (1,517,749) (1,531,688) Cash at Beginning of Period 2,223,289 2,139,211 2,670,242 2,408,316 3,578,634 Cash at End of Period $ 890,567 $ 2,223,289 $ 2,046,946 $ 890,567 $ 2,046,946 (Unaudited) September 30, December 31, 2022 2021 ASSETS Current Assets Cash and cash equivalents $ 890,567 $ 2,408,316 Accounts receivable 45,864,400 24,026,807 Joint interest billing receivable 1,897,125 2,433,811 Derivative assets 13,322,013 - Prepaid expenses and other assets 3,246,569 938,029 Total Current Assets 65,220,674 29,806,963 Properties and Equipment Oil and natural gas properties subject to amortization 1,418,931,111 883,844,745 Financing lease asset subject to depreciation 2,067,375 1,422,487 Fixed assets subject to depreciation 2,985,778 2,089,722 Total Properties and Equipment 1,423,984,264 887,356,954 Accumulated depreciation, depletion and amortization (269,541,416) (235,997,307) Net Properties and Equipment 1,154,442,848 651,359,647 Operating lease asset 1,071,482 1,277,253 Derivative assets 11,545,982 - Deferred financing costs 19,029,907 1,713,466 TOTAL ASSETS $ 1,251,310,893 $ 684,157,329 LIABILITIES, MEZZANINE EQUITY AND STOCKHOLDERS' EQUITY Current Liabilities Accounts payable $ 86,822,997 $ 46,233,452 Income tax liability 36,736 - Financing lease liability 406,890 316,514 Operating lease liability 306,715 290,766 Derivative liabilities 23,767,689 29,241,588 Notes payable 877,631 586,410 Deferred cash payment 14,511,687 - Total Current Liabilities 126,730,345 76,668,730 Non - Current Liabilities Deferred income taxes 5,920,300 90,292 Revolving line of credit 435,000,000 290,000,000 Financing lease liability, less current portion 564,205 343,727 Operating lease liability, less current portion 905,524 1,138,319 Derivative liabilities 8,734,388 - Asset retirement obligations 29,426,737 15,292,054 Total Non - Current Liabilities 480,551,154 306,864,392 Total Liabilities 607,281,499 383,533,122 Mezzanine Equity Convertible preferred stock - $0.001 par value; 153,176 shares outstanding 137,858,446 - Stockholders' Equity Preferred stock - $0.001 par value; 50,000,000 shares authorized; 153,176 shares issued or outstanding - - Common stock - $0.001 par value; 225,000,000 shares authorized; 131,586,927 shares and 100,192,562 shares issued and outstanding, respectively 131,587 100,193 Additional paid - in capital 634,845,283 553,472,292 Accumulated deficit (128,805,922) (252,948,278) Total Stockholders' Equity 506,170,948 300,624,207 TOTAL LIABILITIES, MEZZANINE EQUITY AND STOCKHOLDERS' EQUITY $ 1,251,310,893 $ 684,157,329 Balance Sheet and Cash Flow Statement Balance Sheet Cash Flow 25
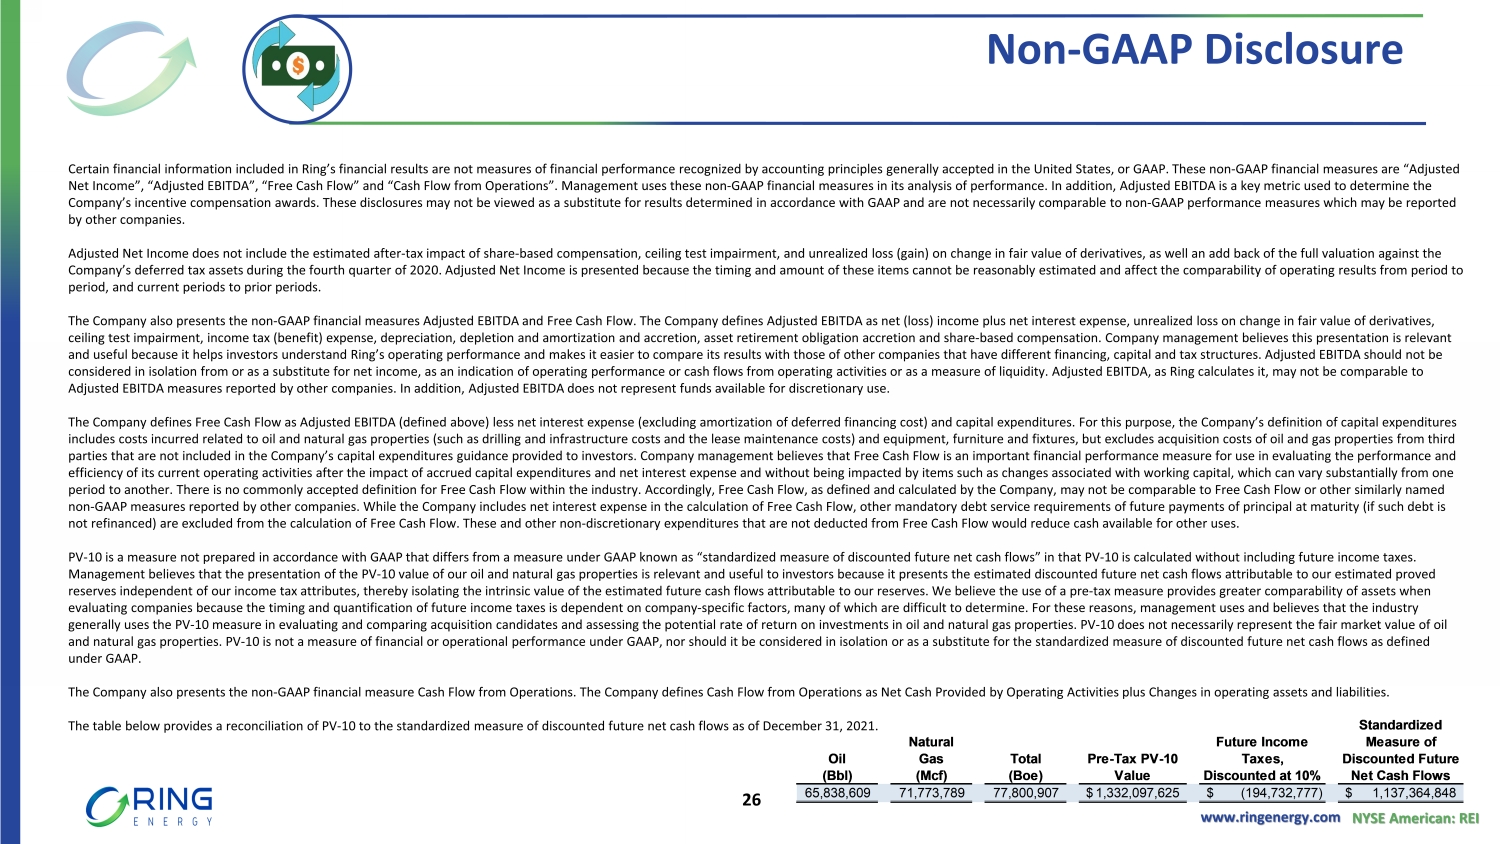
www.ringenergy.com NYSE American: REI Non - GAAP Disclosure Certain financial information included in Ring’s financial results are not measures of financial performance recognized by ac cou nting principles generally accepted in the United States, or GAAP. These non - GAAP financial measures are “Adjusted Net Income”, “Adjusted EBITDA”, “Free Cash Flow” and “Cash Flow from Operations”. Management uses these non - GAAP financial measu res in its analysis of performance. In addition, Adjusted EBITDA is a key metric used to determine the Company’s incentive compensation awards. These disclosures may not be viewed as a substitute for results determined in accord anc e with GAAP and are not necessarily comparable to non - GAAP performance measures which may be reported by other companies. Adjusted Net Income does not include the estimated after - tax impact of share - based compensation, ceiling test impairment, and un realized loss (gain) on change in fair value of derivatives, as well an add back of the full valuation against the Company’s deferred tax assets during the fourth quarter of 2020. Adjusted Net Income is presented because the timing and amou nt of these items cannot be reasonably estimated and affect the comparability of operating results from period to period, and current periods to prior periods. The Company also presents the non - GAAP financial measures Adjusted EBITDA and Free Cash Flow. The Company defines Adjusted EBITD A as net (loss) income plus net interest expense, unrealized loss on change in fair value of derivatives, ceiling test impairment, income tax (benefit) expense, depreciation, depletion and amortization and accretion, asset retireme nt obligation accretion and share - based compensation. Company management believes this presentation is relevant and useful because it helps investors understand Ring’s operating performance and makes it easier to compare its results with th ose of other companies that have different financing, capital and tax structures. Adjusted EBITDA should not be considered in isolation from or as a substitute for net income, as an indication of operating performance or cash flows from ope rating activities or as a measure of liquidity. Adjusted EBITDA, as Ring calculates it, may not be comparable to Adjusted EBITDA measures reported by other companies. In addition, Adjusted EBITDA does not represent funds available for dis cre tionary use. The Company defines Free Cash Flow as Adjusted EBITDA (defined above) less net interest expense (excluding amortization of de fer red financing cost) and capital expenditures. For this purpose, the Company’s definition of capital expenditures includes costs incurred related to oil and natural gas properties (such as drilling and infrastructure costs and the lease ma int enance costs) and equipment, furniture and fixtures, but excludes acquisition costs of oil and gas properties from third parties that are not included in the Company’s capital expenditures guidance provided to investors. Company management believ es that Free Cash Flow is an important financial performance measure for use in evaluating the performance and efficiency of its current operating activities after the impact of accrued capital expenditures and net interest expense and wit hout being impacted by items such as changes associated with working capital, which can vary substantially from one period to another. There is no commonly accepted definition for Free Cash Flow within the industry. Accordingly, Free Cash Fl ow, as defined and calculated by the Company, may not be comparable to Free Cash Flow or other similarly named non - GAAP measures reported by other companies. While the Company includes net interest expense in the calculation of Free Cash F low, other mandatory debt service requirements of future payments of principal at maturity (if such debt is not refinanced) are excluded from the calculation of Free Cash Flow. These and other non - discretionary expenditures that are not deducted from Free Cash Flow would reduce cash available for other uses. PV - 10 is a measure not prepared in accordance with GAAP that differs from a measure under GAAP known as “standardized measure of discounted future net cash flows” in that PV - 10 is calculated without including future income taxes. Management believes that the presentation of the PV - 10 value of our oil and natural gas properties is relevant and useful to inv estors because it presents the estimated discounted future net cash flows attributable to our estimated proved reserves independent of our income tax attributes, thereby isolating the intrinsic value of the estimated future cash flows a ttr ibutable to our reserves. We believe the use of a pre - tax measure provides greater comparability of assets when evaluating companies because the timing and quantification of future income taxes is dependent on company - specific factors, many of which are difficult to determine. For these reasons, management uses and believes that the industry generally uses the PV - 10 measure in evaluating and comparing acquisition candidates and assessing the potential rate of return o n investments in oil and natural gas properties. PV - 10 does not necessarily represent the fair market value of oil and natural gas properties. PV - 10 is not a measure of financial or operational performance under GAAP, nor should it be consider ed in isolation or as a substitute for the standardized measure of discounted future net cash flows as defined under GAAP. The Company also presents the non - GAAP financial measure Cash Flow from Operations. The Company defines Cash Flow from Operation s as Net Cash Provided by Operating Activities plus Changes in operating assets and liabilities. The table below provides a reconciliation of PV - 10 to the standardized measure of discounted future net cash flows as of Decembe r 31, 2021. 26
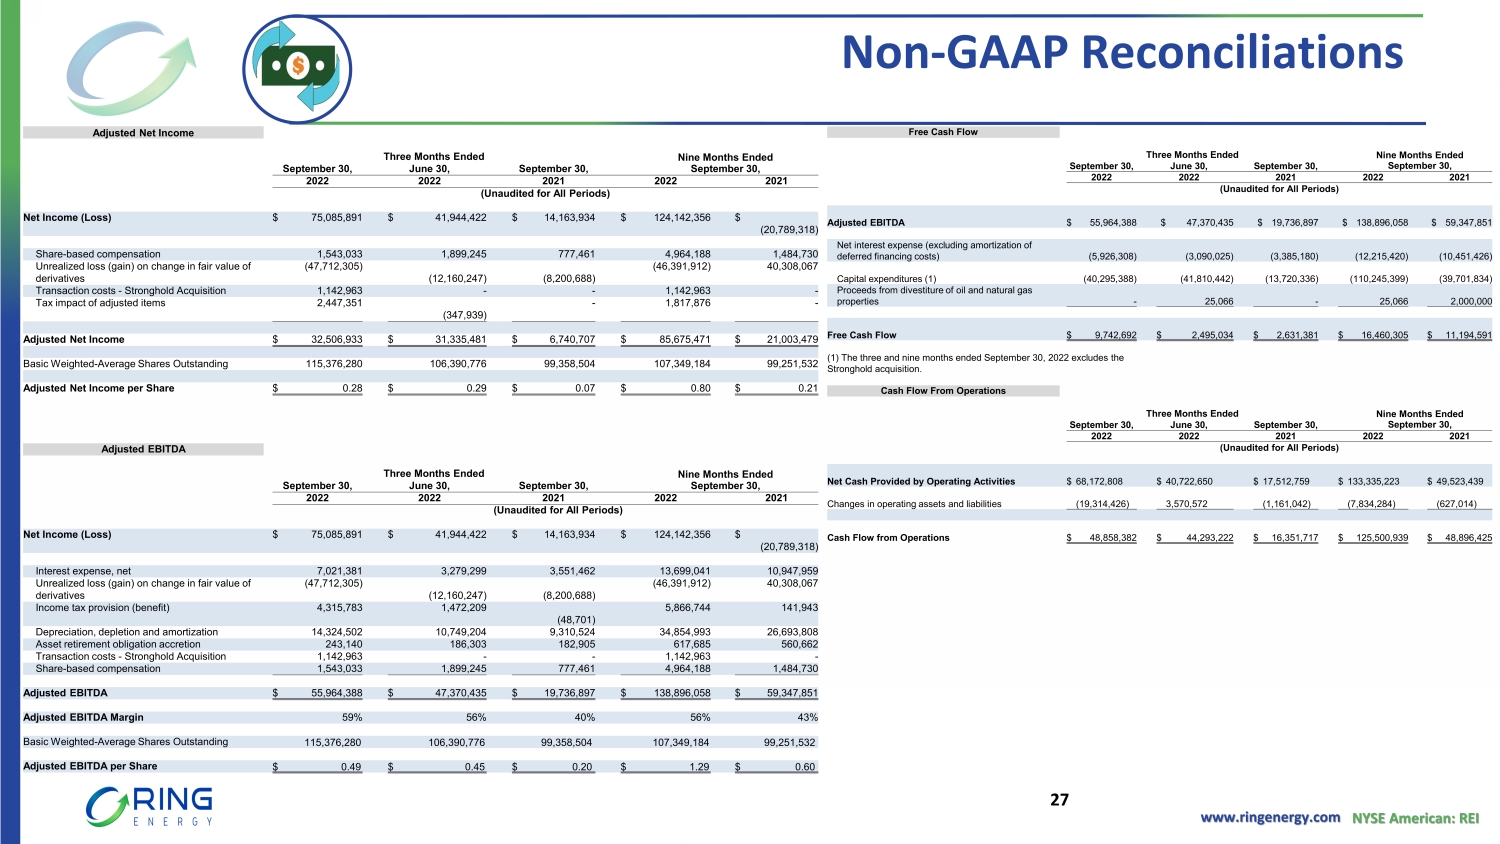
www.ringenergy.com NYSE American: REI Non - GAAP Reconciliations Adjusted Net Income Three Months Ended Nine Months Ended September 30, June 30, September 30, September 30, 2022 2022 2021 2022 2021 (Unaudited for All Periods) Net Income (Loss) $ 75,085,891 $ 41,944,422 $ 14,163,934 $ 124,142,356 $ (20,789,318) Share - based compensation 1,543,033 1,899,245 777,461 4,964,188 1,484,730 Unrealized loss (gain) on change in fair value of derivatives (47,712,305) (12,160,247) (8,200,688) (46,391,912) 40,308,067 Transaction costs - Stronghold Acquisition 1,142,963 - - 1,142,963 - Tax impact of adjusted items 2,447,351 (347,939) - 1,817,876 - Adjusted Net Income $ 32,506,933 $ 31,335,481 $ 6,740,707 $ 85,675,471 $ 21,003,479 Basic Weighted - Average Shares Outstanding 115,376,280 106,390,776 99,358,504 107,349,184 99,251,532 Adjusted Net Income per Share $ 0.28 $ 0.29 $ 0.07 $ 0.80 $ 0.21 Adjusted EBITDA Three Months Ended Nine Months Ended September 30, June 30, September 30, September 30, 2022 2022 2021 2022 2021 (Unaudited for All Periods) Net Income (Loss) $ 75,085,891 $ 41,944,422 $ 14,163,934 $ 124,142,356 $ (20,789,318) Interest expense, net 7,021,381 3,279,299 3,551,462 13,699,041 10,947,959 Unrealized loss (gain) on change in fair value of derivatives (47,712,305) (12,160,247) (8,200,688) (46,391,912) 40,308,067 Income tax provision (benefit) 4,315,783 1,472,209 (48,701) 5,866,744 141,943 Depreciation, depletion and amortization 14,324,502 10,749,204 9,310,524 34,854,993 26,693,808 Asset retirement obligation accretion 243,140 186,303 182,905 617,685 560,662 Transaction costs - Stronghold Acquisition 1,142,963 - - 1,142,963 - Share - based compensation 1,543,033 1,899,245 777,461 4,964,188 1,484,730 Adjusted EBITDA $ 55,964,388 $ 47,370,435 $ 19,736,897 $ 138,896,058 $ 59,347,851 Adjusted EBITDA Margin 59% 56% 40% 56% 43% Basic Weighted - Average Shares Outstanding 115,376,280 106,390,776 99,358,504 107,349,184 99,251,532 Adjusted EBITDA per Share $ 0.49 $ 0.45 $ 0.20 $ 1.29 $ 0.60 Free Cash Flow Three Months Ended Nine Months Ended September 30, June 30, September 30, September 30, 2022 2022 2021 2022 2021 (Unaudited for All Periods) Adjusted EBITDA $ 55,964,388 $ 47,370,435 $ 19,736,897 $ 138,896,058 $ 59,347,851 Net interest expense (excluding amortization of deferred financing costs) (5,926,308) (3,090,025) (3,385,180) (12,215,420) (10,451,426) Capital expenditures (1) (40,295,388) (41,810,442) (13,720,336) (110,245,399) (39,701,834) Proceeds from divestiture of oil and natural gas properties - 25,066 - 25,066 2,000,000 Free Cash Flow $ 9,742,692 $ 2,495,034 $ 2,631,381 $ 16,460,305 $ 11,194,591 (1) The three and nine months ended September 30, 2022 excludes the Stronghold acquisition. Cash Flow From Operations Three Months Ended Nine Months Ended September 30, June 30, September 30, September 30, 2022 2022 2021 2022 2021 (Unaudited for All Periods) Net Cash Provided by Operating Activities $ 68,172,808 $ 40,722,650 $ 17,512,759 $ 133,335,223 $ 49,523,439 Changes in operating assets and liabilities (19,314,426) 3,570,572 (1,161,042) (7,834,284) (627,014) Cash Flow from Operations $ 48,858,382 $ 44,293,222 $ 16,351,717 $ 125,500,939 $ 48,896,425 27
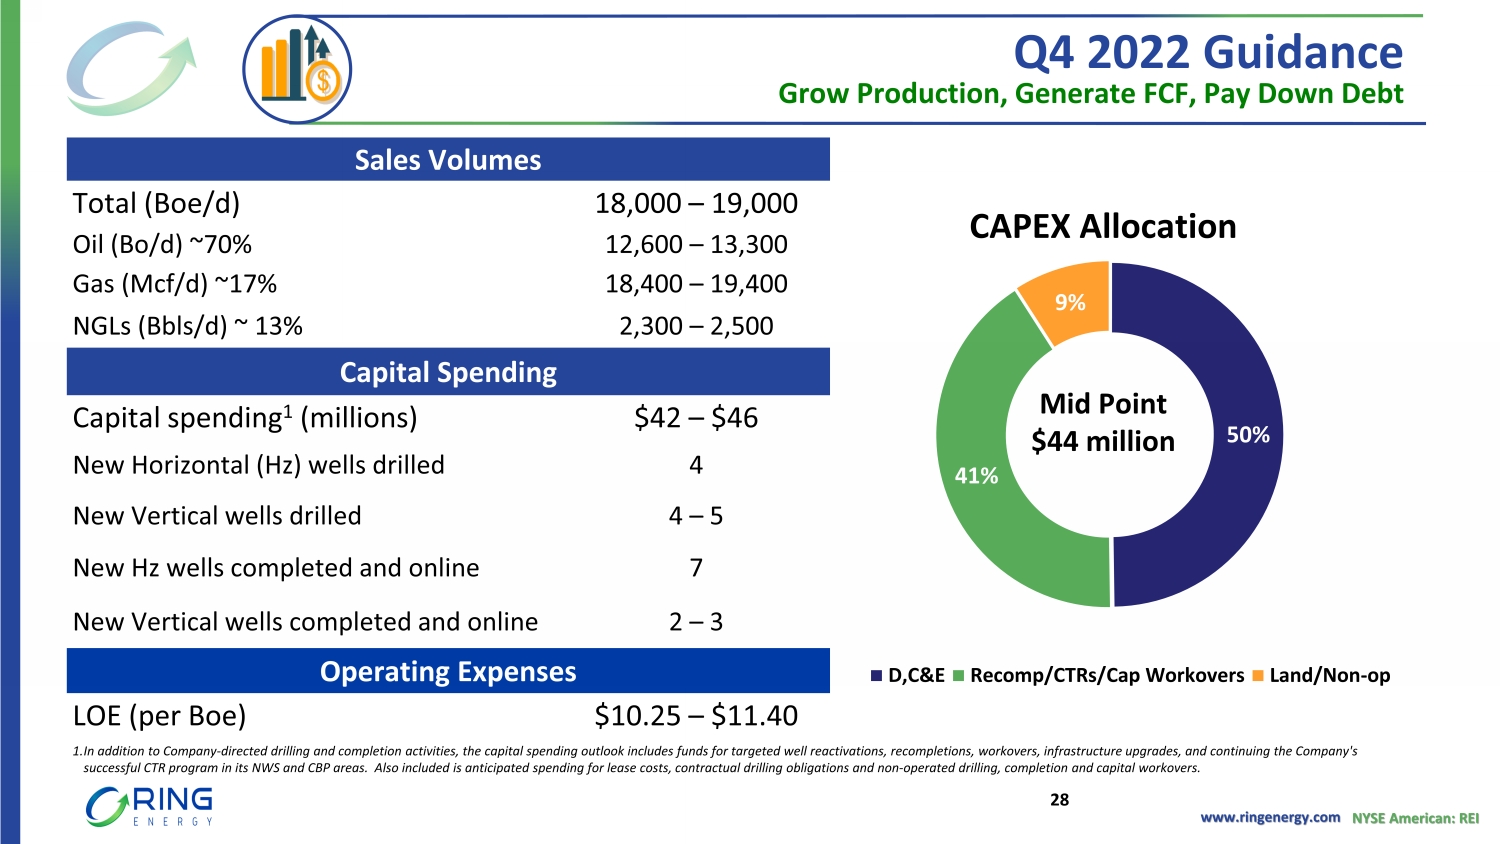
www.ringenergy.com NYSE American: REI 50% 41% 9% D,C&E Recomp/CTRs/Cap Workovers Land/Non-op CAPEX Allocation Mid Point $44 million Q4 2022 Guidance Grow Production, Generate FCF, Pay Down Debt Sales Volumes Total (Boe/d) 18,000 – 19,000 Oil (Bo/d) ~70% 12,600 – 13,300 Gas (Mcf/d) ~17% 18,400 – 19,400 NGLs (Bbls/d) ~ 13% 2,300 – 2,500 Capital Spending Capital spending 1 (millions) $42 – $46 New Horizontal (Hz) wells drilled 4 New Vertical wells drilled 4 – 5 New Hz wells completed and online 7 New Vertical wells completed and online 2 – 3 Operating Expenses LOE (per Boe) $10.25 – $11.40 1. In addition to Company - directed drilling and completion activities, the capital spending outlook includes funds for targeted wel l reactivations, recompletions, workovers, infrastructure upgrades, and continuing the Company's successful CTR program in its NWS and CBP areas. Also included is anticipated spending for lease costs, contractual drilling ob ligations and non - operated drilling, completion and capital workovers. 28
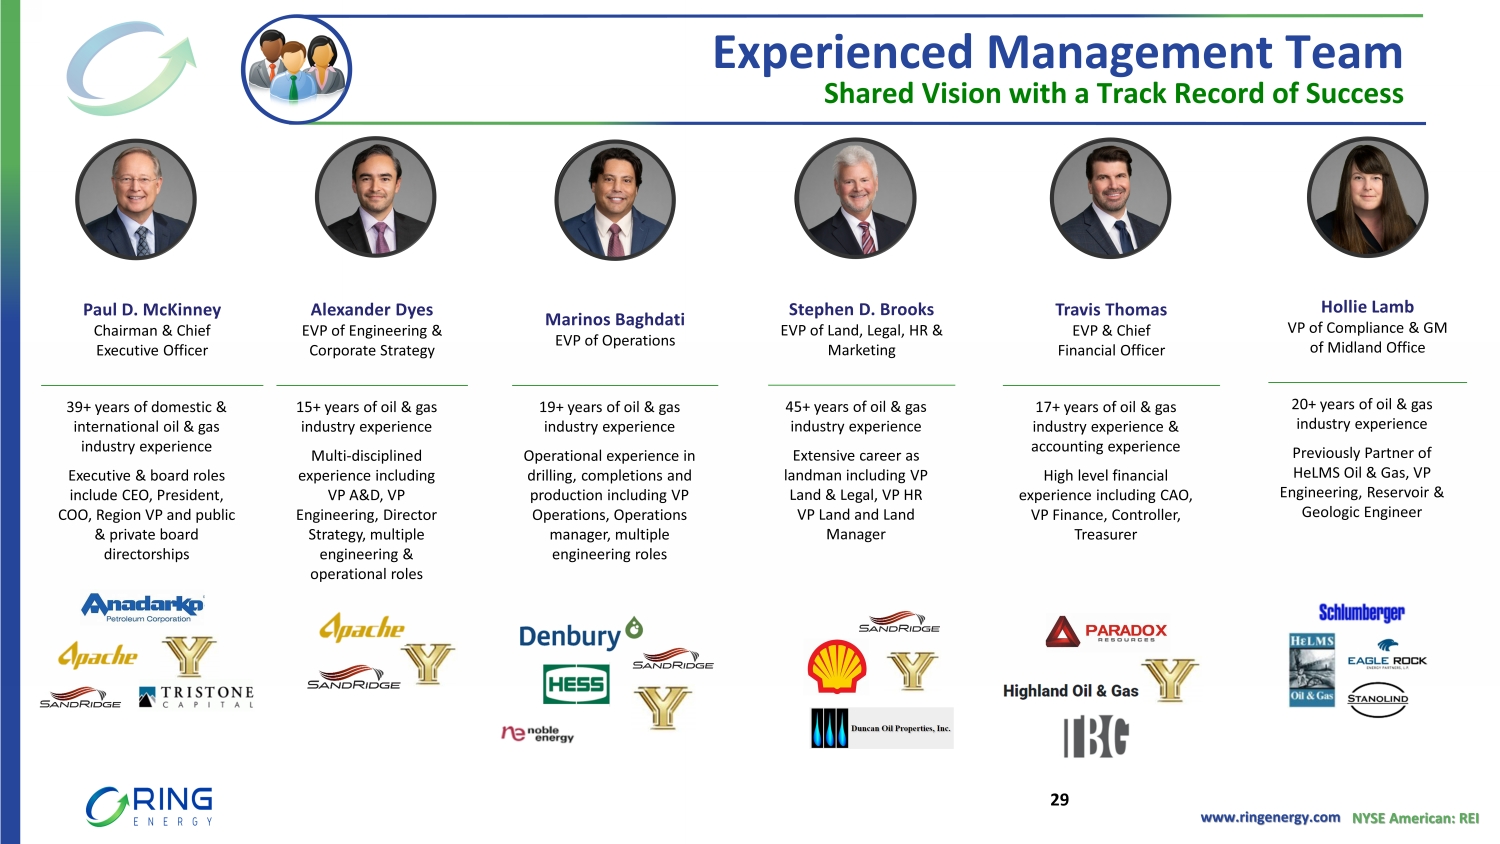
www.ringenergy.com NYSE American: REI Add Photo Add Photo Add Photo Add Photo Add Photo Paul D. McKinney Chairman & Chief Executive Officer 39+ years of domestic & international oil & gas industry experience Executive & board roles include CEO, President, COO, Region VP and public & private board directorships Travis Thomas EVP & Chief Financial Officer 17+ years of oil & gas industry experience & accounting experience High level financial experience including CAO, VP Finance, Controller, Treasurer Alexander Dyes EVP of Engineering & Corporate Strategy 15+ years of oil & gas industry experience Multi - disciplined experience including VP A&D, VP Engineering, Director Strategy, multiple engineering & operational roles Marinos Baghdati EVP of Operations 19+ years of oil & gas industry experience Operational experience in drilling, completions and production including VP Operations, Operations manager, multiple engineering roles Stephen D. Brooks EVP of Land, Legal, HR & Marketing 45+ years of oil & gas industry experience Extensive career as landman including VP Land & Legal, VP HR VP Land and Land Manager Hollie Lamb VP of Compliance & GM of Midland Office 20+ years of oil & gas industry experience Previously Partner of HeLMS Oil & Gas, VP Engineering, Reservoir & Geologic Engineer Experienced Management Team Shared Vision with a Track Record of Success 29
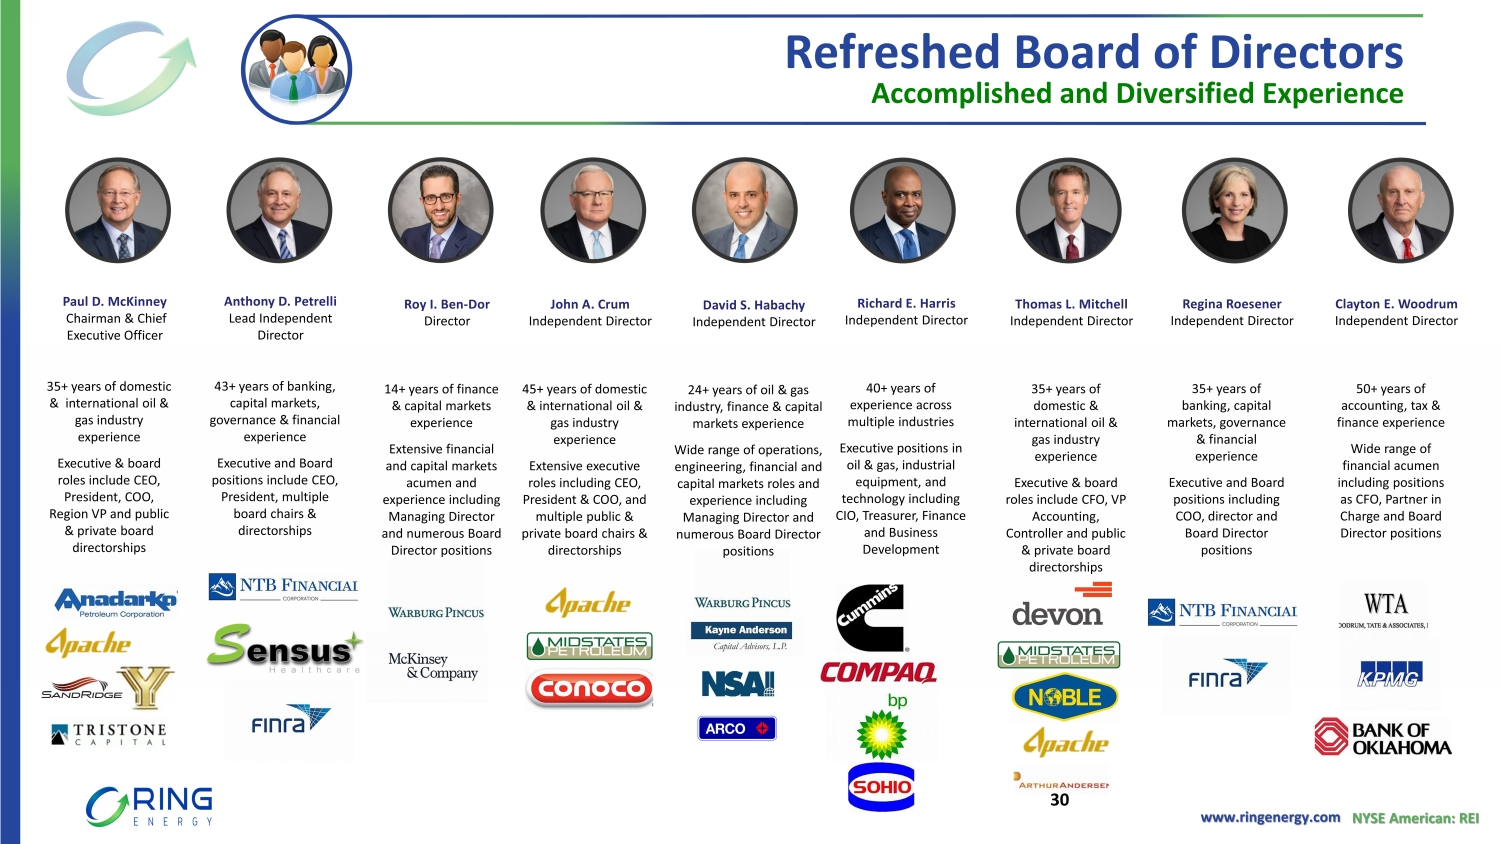
www.ringenergy.com NYSE American: REI Paul D. McKinney Chairman & Chief Executive Officer 35+ years of domestic & international oil & gas industry experience Executive & board roles include CEO, President, COO, Region VP and public & private board directorships Anthony D. Petrelli Lead Independent Director 43+ years of banking, capital markets, governance & financial experience Executive and Board positions include CEO, President, multiple board chairs & directorships Refreshed Board of Directors Accomplished and Diversified Experience Roy I. Ben - Dor Director 14+ years of finance & capital markets experience Extensive financial and capital markets acumen and experience including Managing Director and numerous Board Director positions David S. Habachy Independent Director 24+ years of oil & gas industry, finance & capital markets experience Wide range of operations, engineering, financial and capital markets roles and experience including Managing Director and numerous Board Director positions John A. Crum Independent Director 45+ years of domestic & international oil & gas industry experience Extensive executive roles including CEO, President & COO, and multiple public & private board chairs & directorships Richard E. Harris Independent Director 40+ years of experience across multiple industries Executive positions in oil & gas, industrial equipment, and technology including CIO, Treasurer, Finance and Business Development Thomas L. Mitchell Independent Director 35+ years of domestic & international oil & gas industry experience Executive & board roles include CFO, VP Accounting, Controller and public & private board directorships Regina Roesener Independent Director 35+ years of banking, capital markets, governance & financial experience Executive and Board positions including COO, director and Board Director positions Clayton E. Woodrum Independent Director 50+ years of accounting, tax & finance experience Wide range of financial acumen including positions as CFO, Partner in Charge and Board Director positions 30
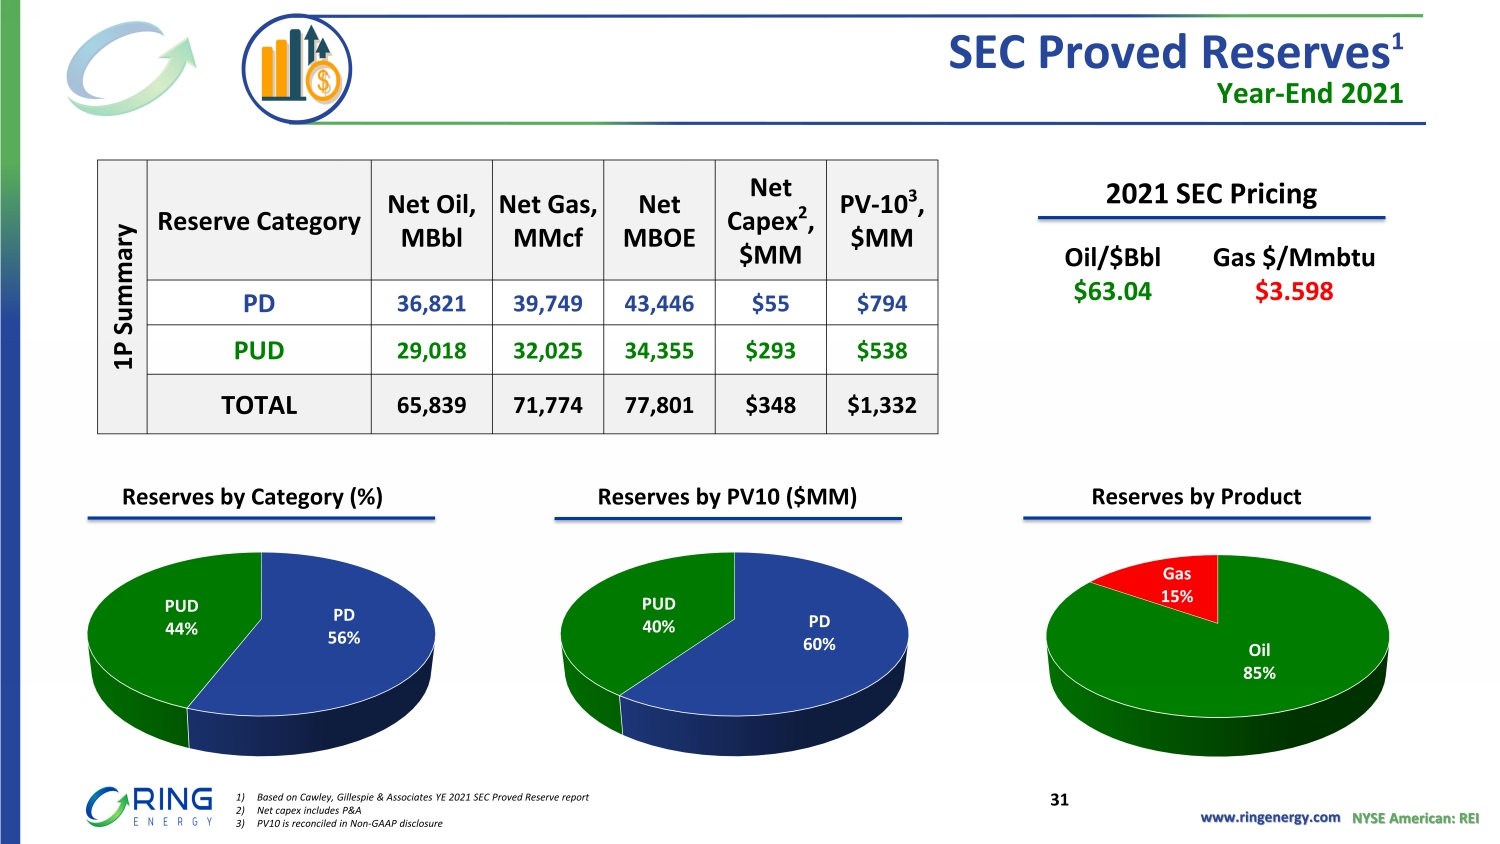
www.ringenergy.com NYSE American: REI PD 60% PUD 40% 1P Summary Reserve Category Net Oil, MBbl Net Gas, MMcf Net MBOE Net Capex 2 , $MM PV - 10 3 , $MM PD 36,821 39,749 43,446 $55 $794 PUD 29,018 32,025 34,355 $293 $538 TOTAL 65,839 71,774 77,801 $348 $1,332 SEC Proved Reserves 1 Year - End 2021 2021 SEC Pricing Reserves by Category ( % ) Reserves by PV 10 ( $ MM) Reserves by Product Oil/$ Bbl $63.04 Gas $/ Mmbtu $3.598 Oil 85% Gas 15% PD 56% PUD 44% 1) Based on Cawley, Gillespie & Associates YE 2021 SEC Proved Reserve report 2) Net capex includes P&A 3) PV10 is reconciled in Non - GAAP disclosure 31
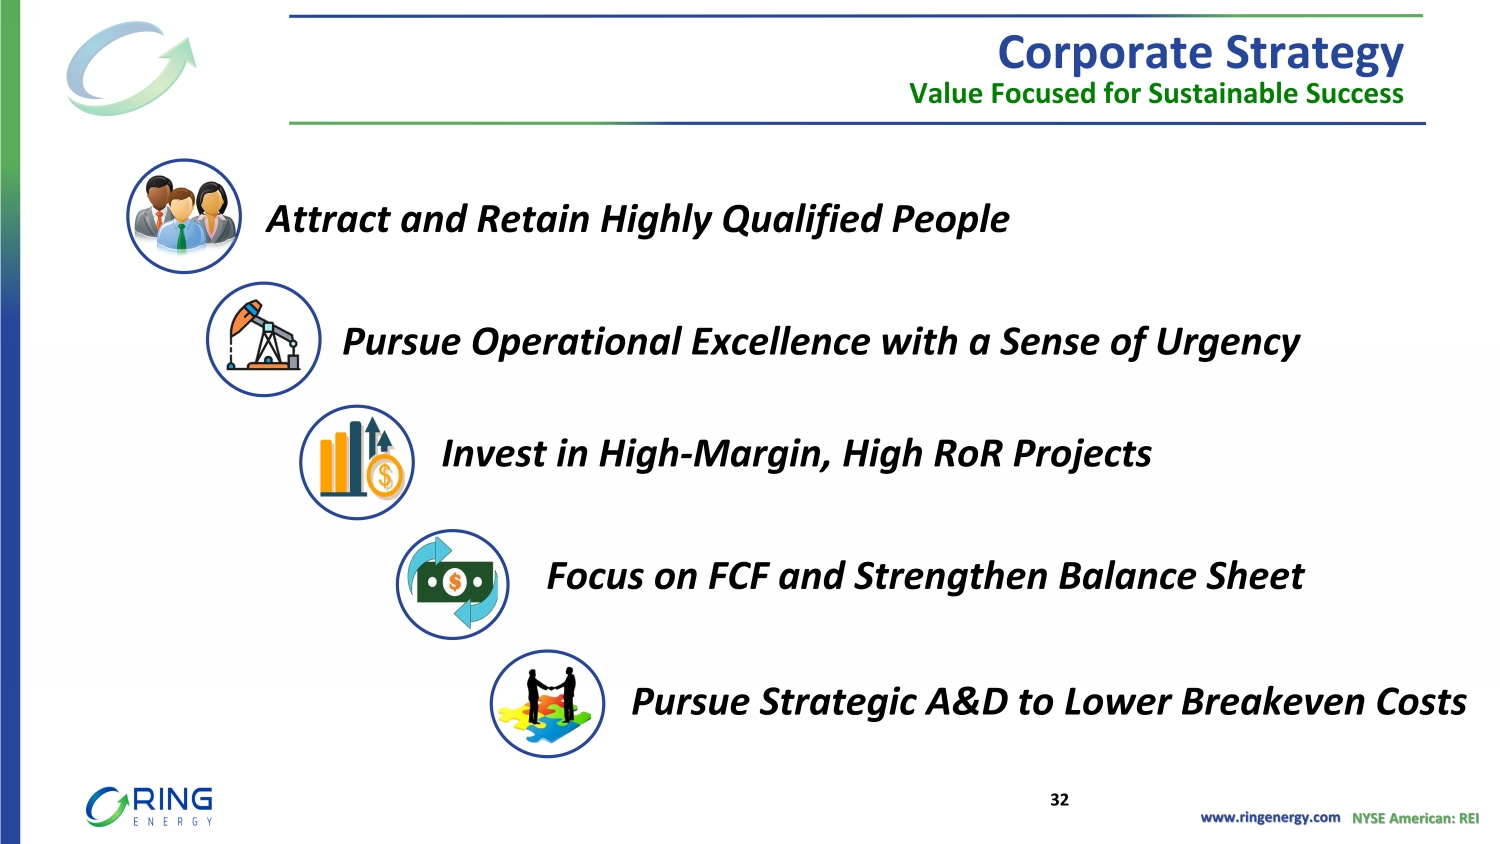
www.ringenergy.com NYSE American: REI Corporate Strategy Value Focused for Sustainable Success Attract and Retain Highly Qualified People Pursue Operational Excellence with a Sense of Urgency Invest in High - Margin, High RoR Projects Focus on FCF and Strengthen Balance Sheet Pursue Strategic A&D to Lower Breakeven Costs 32
ANALYST COVERAGE Alliance Global Partners (A.G.P.) Jeff Campbell (203) 577 - 5427 [email protected] Tuohy Brothers Investment Noel Parks (215) 913 - 7320 [email protected] ROTH Capital Partners John M. White (949) 720 - 7115 [email protected] Truist Financial Neal Dingmann (713) 247 - 9000 [email protected] COMPANY CONTACT Al Petrie (281) 975 - 2146 [email protected] Chris Delange (281) 975 - 2146 cdelange @ringenergy.com