Remitly Reports Fourth Quarter and Full Year 2022 Results
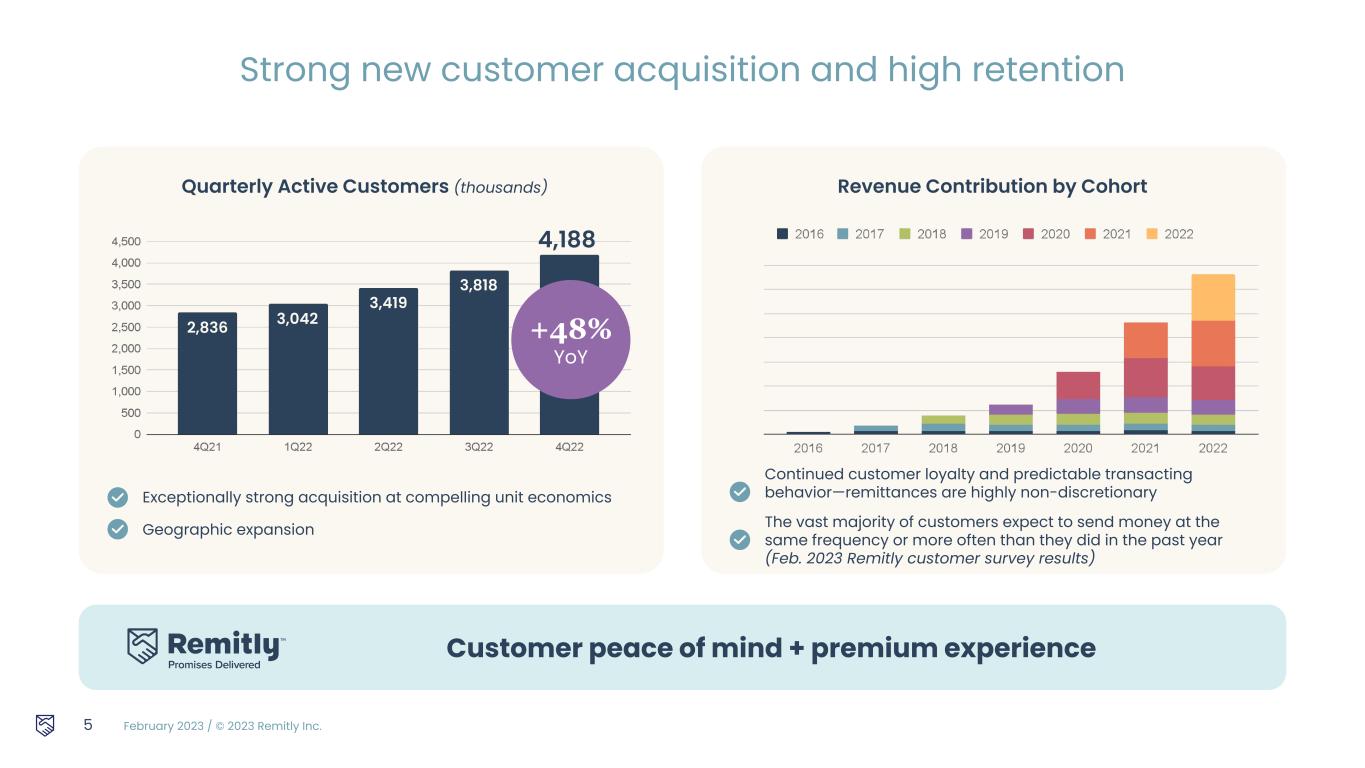
Active customers up 48% year over year
Send volume up 35% year over year
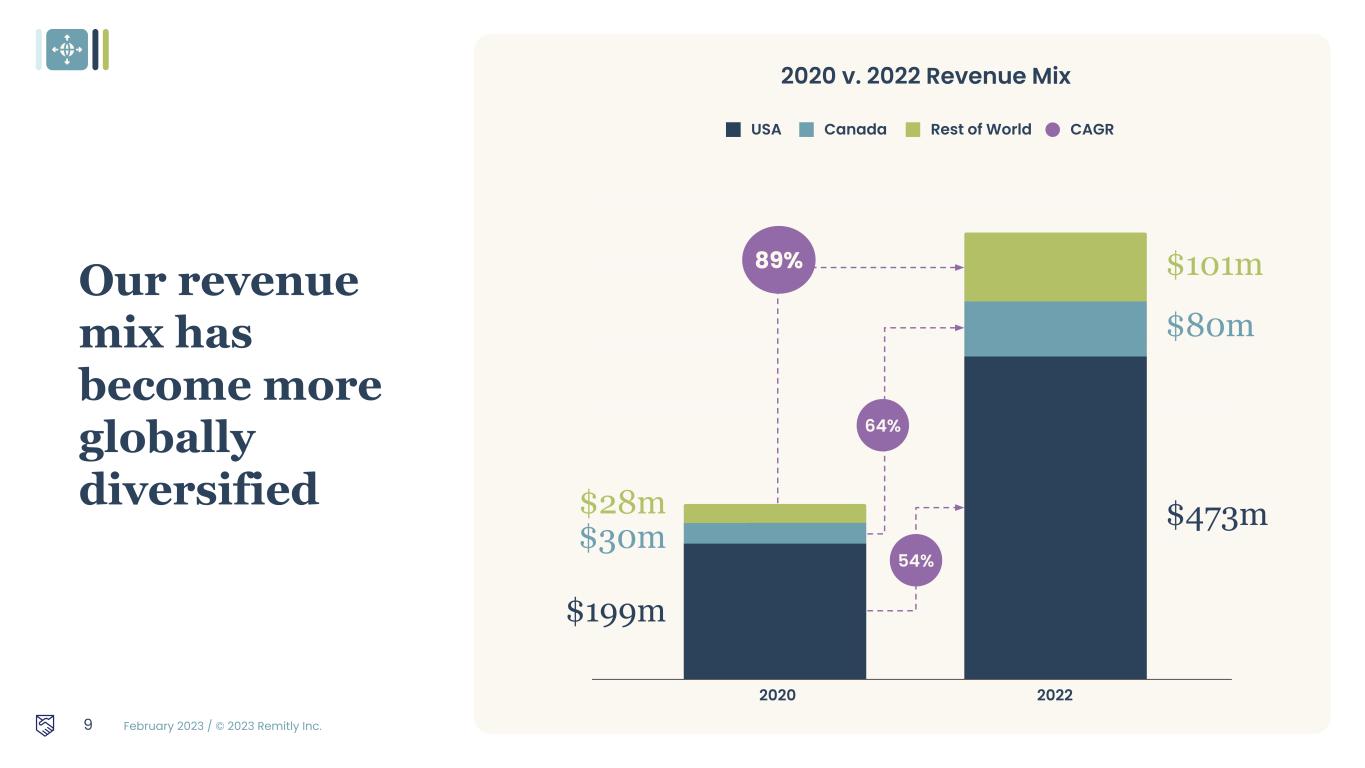
Revenue up 41% year over year
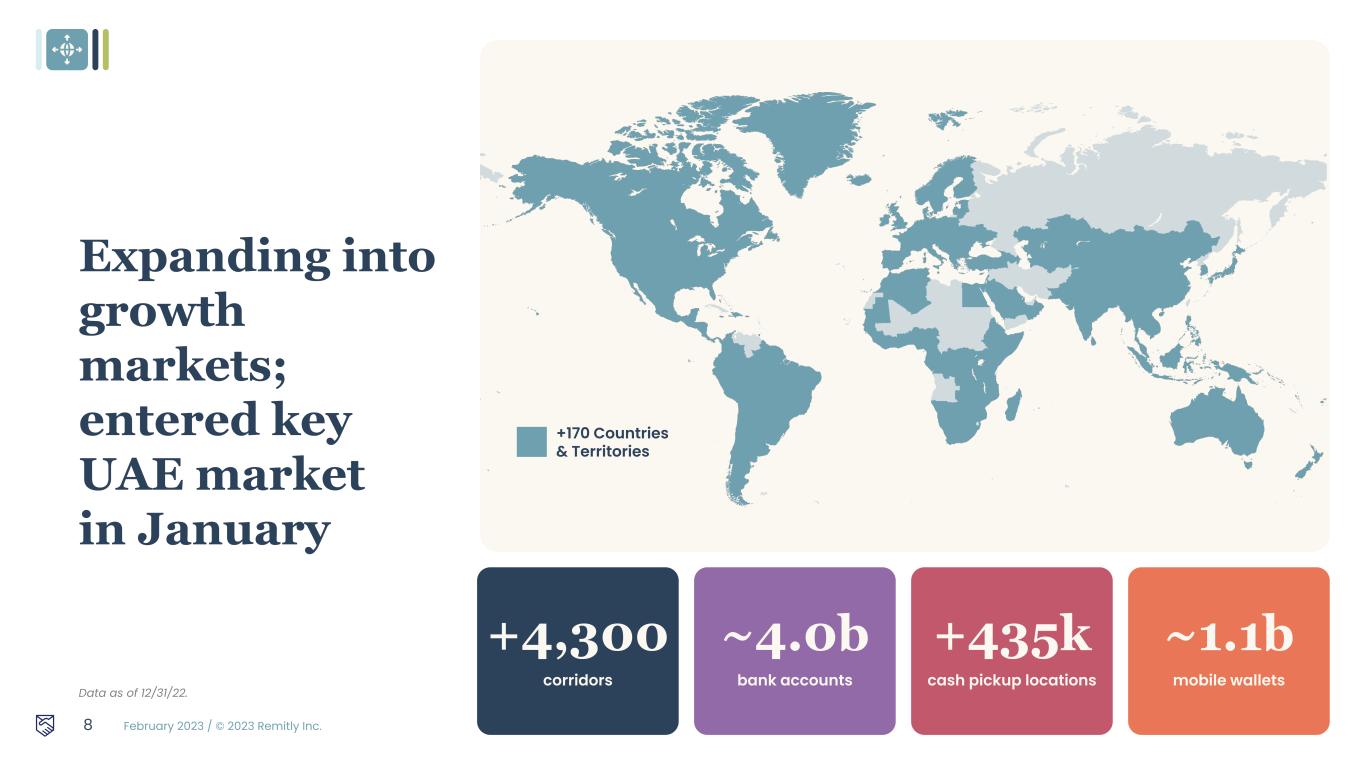
SEATTLE, WA / February 22, 2023 / GlobeNewswire / - Remitly Global, Inc. (NASDAQ: RELY), a leading digital financial services provider for immigrants and their families in over 170 countries around the world, reported results for the fourth quarter and full year ended December 31, 2022.
“Remitly’s consistent out-performance in 2022 is a testament to the unique value we offer customers and the demonstrated effectiveness of our focus on delivering efficient growth," said Matt Oppenheimer, co-founder and Chief Executive Officer, Remitly. “In 2023, our increasing scale, customer loyalty, and superior technology will allow us to drive greater efficiencies, while we also invest in our strategic priorities to drive sustainable returns. We look forward to continuing to deliver value for our customers and long-term returns from our investments as we execute our vision of transforming the lives of immigrants and their families by providing the most trusted financial services on the planet."
Fourth Quarter 2022 Highlights and Key Operating Data
(All comparisons relative to the fourth quarter of 2021)
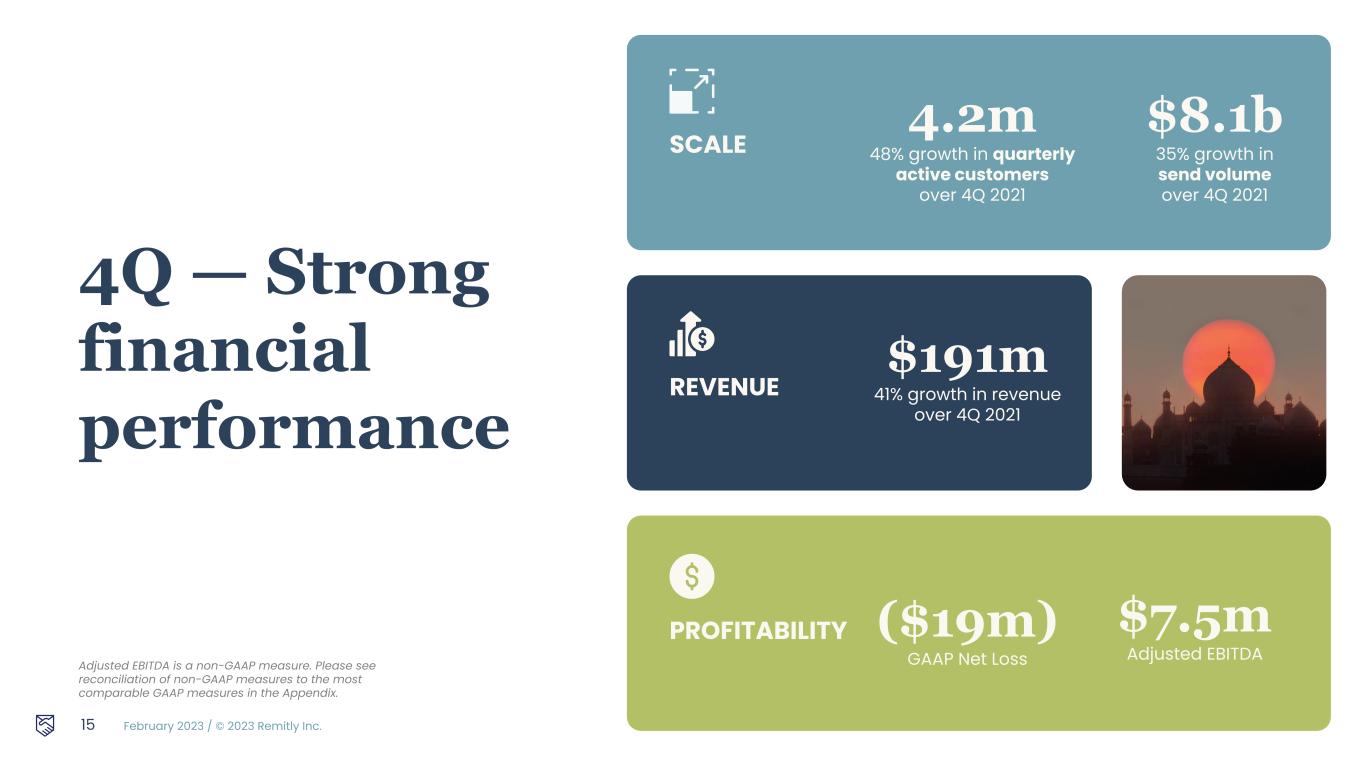
•Active customers increased to 4.2 million, from 2.8 million, up 48%.
•Send volume increased to $8.1 billion, from $6.0 billion, up 35%.
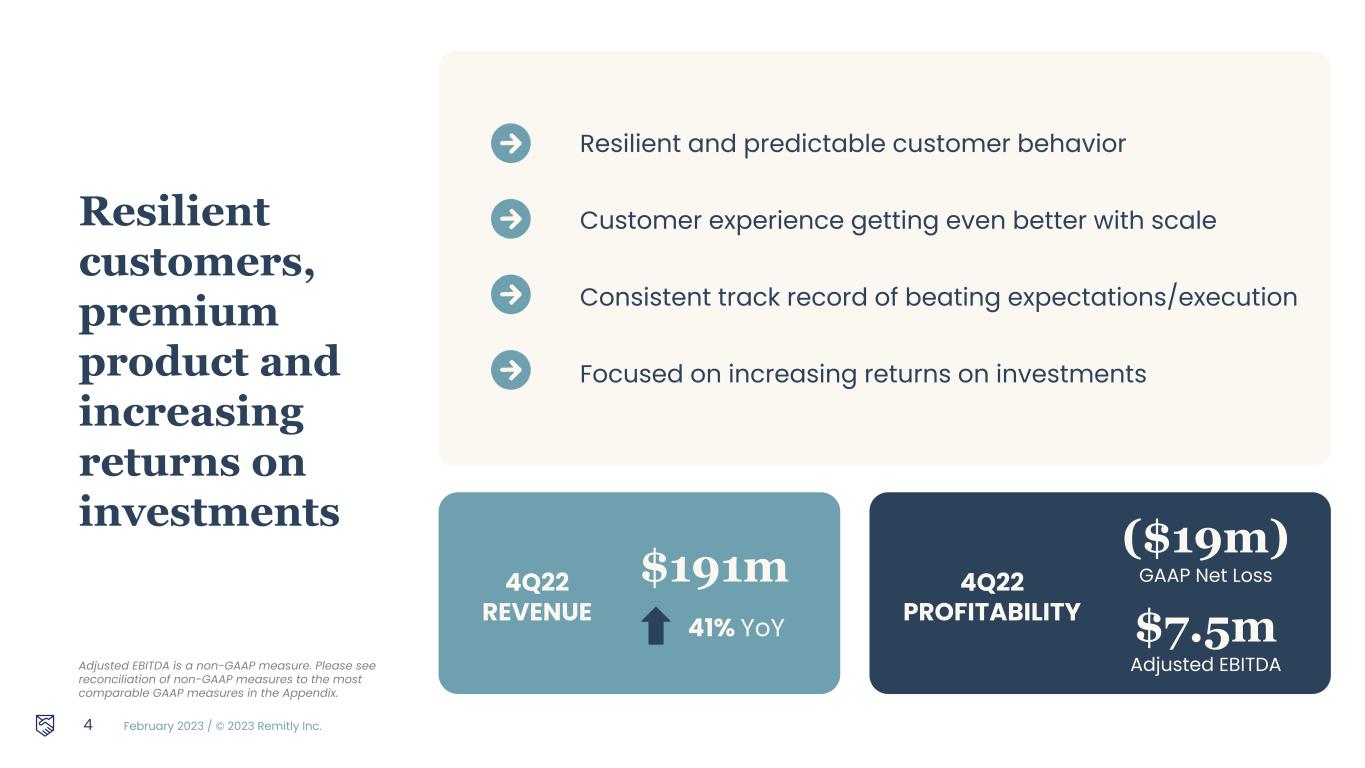
•Revenue totaled $191.0 million, compared to $135.3 million, up 41%.
•Net loss was $19.4 million, compared to a net loss of $16.6 million.
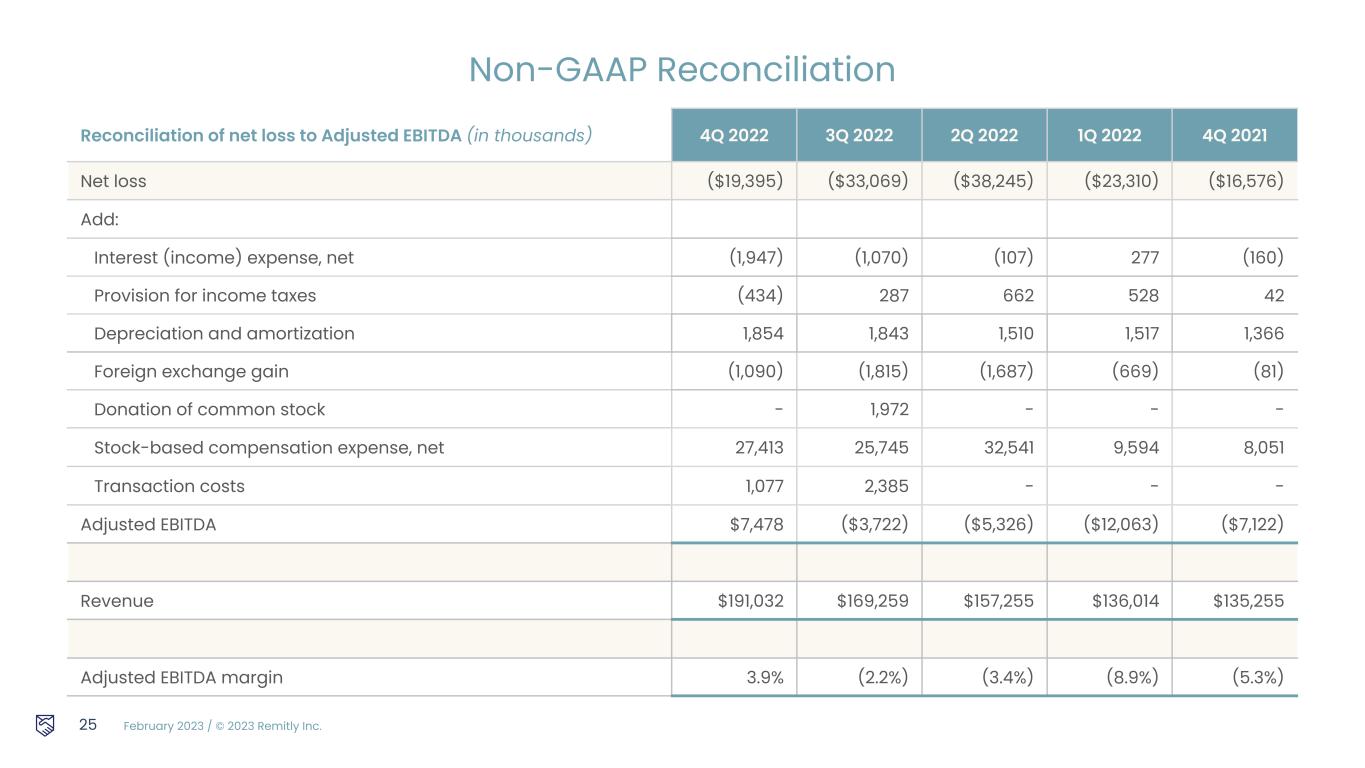
•Adjusted EBITDA was $7.5 million, compared to $(7.1) million.
Full Year 2022 Highlights and Key Operating Data:
(All comparisons relative to the full year 2021)
•Send volume increased to $28.6 billion, from $20.4 billion, up 40%.
•Revenue totaled $653.6 million, compared to $458.6 million, up 43%.
•Net loss was $114.0 million and Adjusted EBITDA was $(13.6) million.
2023 Financial Outlook
For fiscal year 2023, Remitly currently expects:
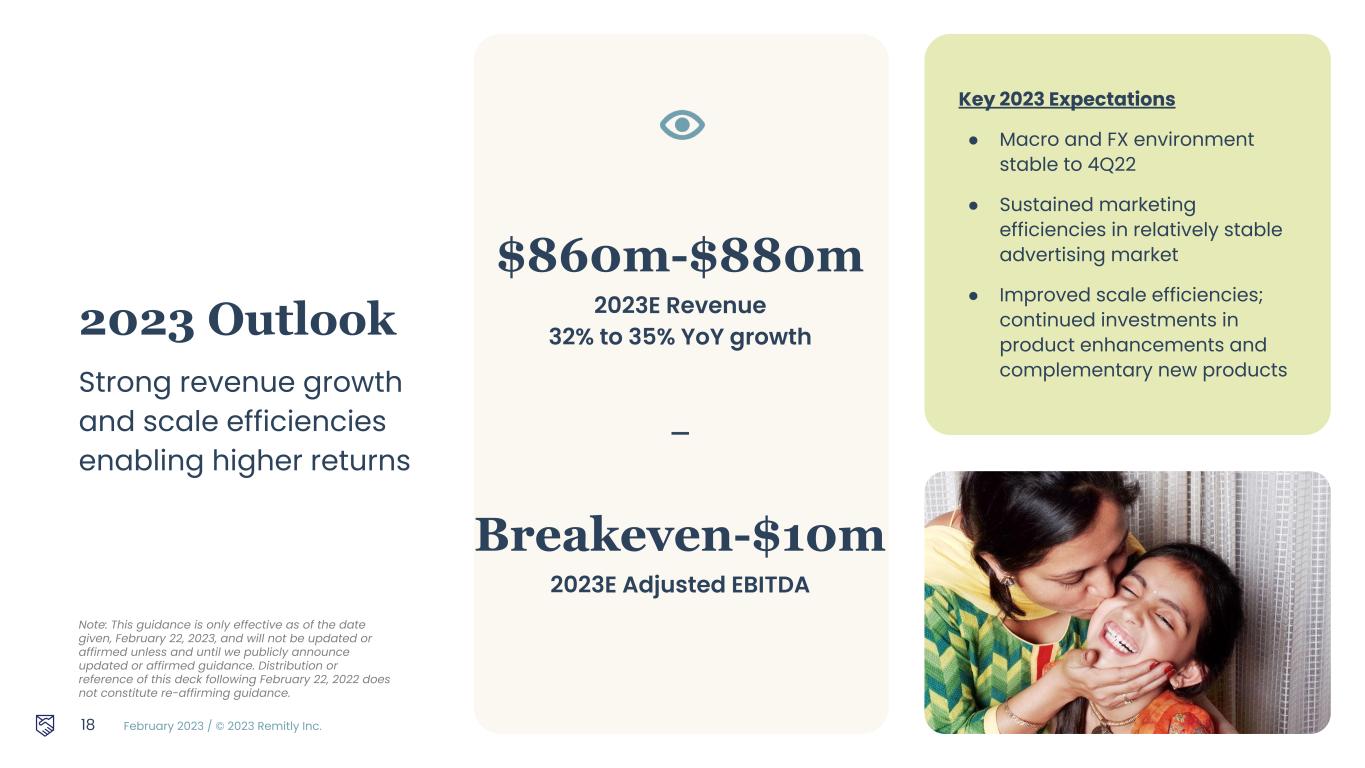
•Total revenue in the range of $860 million to $880 million, representing a growth rate of 32% to 35% year over year.
•Adjusted EBITDA to be between breakeven and $10 million and to remain in a GAAP net loss position for 2023.
Reconciliation of GAAP to Non-GAAP Financial Measures:
A reconciliation of GAAP to non-GAAP financial measures has been provided in the financial statement tables included in this earnings release. An explanation of these measures is also included below under the heading “Non-GAAP Financial Measures.” We have not provided a quantitative reconciliation of forecasted Adjusted EBITDA to forecasted GAAP net income (loss) or to forecasted GAAP income (loss) before income taxes within this earnings release because we cannot, without unreasonable effort, calculate certain reconciling items with confidence due to the variability, complexity, and limited visibility of the adjusting items that would be excluded from forecasted Adjusted EBITDA. These items include but are not limited to income taxes and stock-based compensation expense, which are directly impacted by unpredictable fluctuations in the market price of our common stock.
Note: All percentage changes described within this press release are calculated using amounts in the Company’s Annual Reports on Form 10-K and Quarterly Reports on Form 10-Q filed with the Securities and Exchange Commission (the “SEC”), for which revenue
1
and active customers are presented in thousands and send volume is presented in millions. Rounding differences may occur when individually calculating percentages or totals from rounded amounts included within the press release body as compared to the amounts included with the Company’s SEC filings.
Webcast Information
Remitly will host a webcast at 5:00 p.m. Eastern Time on Wednesday, February 22, 2023 to discuss its fourth quarter and full year 2022 financial results. The live webcast and investor presentation will be accessible on Remitly’s website at https://ir.remitly.com/. A webcast replay will be available on our website at https://ir.remitly.com/ following the live event.
We have used, and intend to continue to use, the Investor Relations section of our website at https://ir.remitly.com as a means of disclosing material non-public information and for complying with our disclosure obligations under Regulation FD.
Non-GAAP Financial Measures
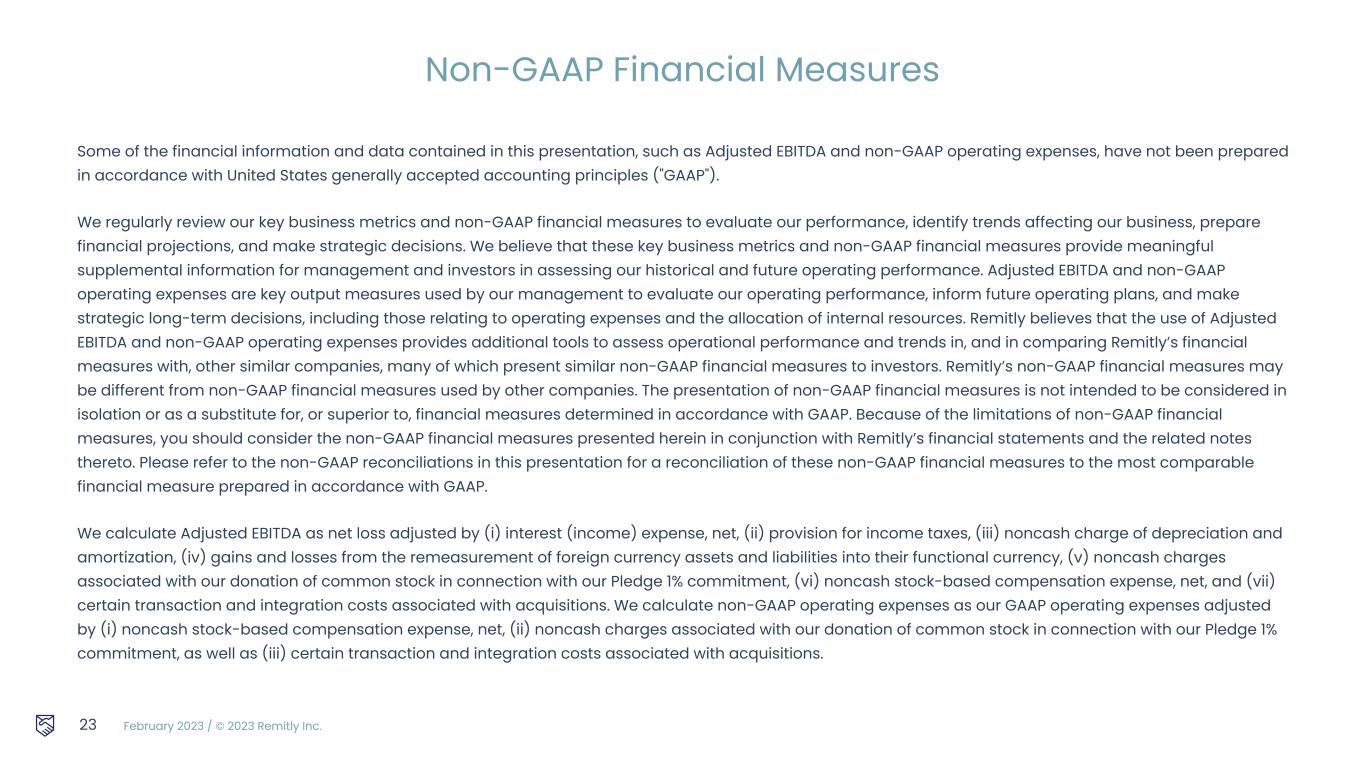
Some of the financial information and data contained in this earnings release, such as Adjusted EBITDA and non-GAAP operating expenses, have not been prepared in accordance with United States generally accepted accounting principles (“GAAP”).
We regularly review our key business metrics and non-GAAP financial measures to evaluate our performance, identify trends affecting our business, prepare financial projections, and make strategic decisions. We believe that these key business metrics and non-GAAP financial measures provide meaningful supplemental information for management and investors in assessing our historical and future operating performance. Adjusted EBITDA and non-GAAP operating expenses are key output measures used by our management to evaluate our operating performance, inform future operating plans, and make strategic long-term decisions, including those relating to operating expenses and the allocation of internal resources. Remitly believes that the use of Adjusted EBITDA and non-GAAP operating expenses provides additional tools to assess operational performance and trends in, and in comparing Remitly’s financial measures with, other similar companies, many of which present similar non-GAAP financial measures to investors. Remitly’s non-GAAP financial measures may be different from non-GAAP financial measures used by other companies. The presentation of non-GAAP financial measures is not intended to be considered in isolation or as a substitute for, or superior to, financial measures determined in accordance with GAAP. Because of the limitations of non-GAAP financial measures, you should consider the non-GAAP financial measures presented herein in conjunction with Remitly’s financial statements and the related notes thereto. Please refer to the non-GAAP reconciliations in this press release for a reconciliation of these non-GAAP financial measures to the most comparable financial measure prepared in accordance with GAAP.
We calculate Adjusted EBITDA as net loss adjusted by (i) interest (income) expense, net, (ii) provision for income taxes, (iii) noncash charge of depreciation and amortization, (iv) gains and losses from the remeasurement of foreign currency assets and liabilities into their functional currency, (v) noncash charges associated with our donation of common stock in connection with our Pledge 1% commitment, (vi) noncash stock-based compensation expense, net, and (vii) certain transaction and integration costs associated with acquisitions. We calculate non-GAAP operating expenses as our GAAP operating expenses adjusted by (i) noncash stock-based compensation expense, net, (ii) noncash charges associated with our donation of common stock in connection with our Pledge 1% commitment, as well as (iii) certain transaction and integration costs associated with acquisitions.
Forward-Looking Statements
This press release contains forward-looking statements within the meaning of the Private Securities Litigation Reform Act of 1995. All statements other than statements of historical fact are forward-looking statements. These statements include, but are not limited to, statements regarding our future operating results and financial position, including our fiscal year 2023 financial outlook, including forecasted fiscal year 2023 revenue and Adjusted EBITDA, anticipated future expenses and investments, expectations relating to certain of our key financial and operating metrics, our business strategy and plans, market growth, our market position and potential market opportunities, and our objectives for future operations. The words “believe,” “may,” “will,” “estimate,” “potential,” “continue,” “anticipate,” “intend,” “expect,” “could,” “would,” “project,” “plan,” “target,” and similar expressions are intended to identify forward-looking statements. Forward-looking statements are based on management’s expectations, assumptions, and projections based on information available at the time the statements were made. These forward-looking statements are subject to a number of risks, uncertainties, and assumptions, including risks and uncertainties related to our ability to successfully execute our business and growth strategy, our ability to achieve and maintain future profitability, our ability to further penetrate our existing customer base and expand our customer base in existing and new corridors, our ability to expand into broader financial services, our ability to expand internationally, the effects of seasonal trends on our results of operations, our expectations concerning relationships with third parties, including strategic, banking, and disbursement partners, our ability to obtain, maintain, protect, and enhance our intellectual property and other proprietary rights, our ability to keep data and our technology platform secure, the success of any acquisitions or investments that we make, our ability to compete effectively, our ability to stay in compliance with applicable laws and
2
regulations, our ability to buy foreign currency at generally advantageous rates, and the effects of changes to immigration laws, macroeconomic conditions, and geopolitical forces on our customers and business operations. It is not possible for our management to predict all risks, nor can we assess the impact of all factors on our business or the extent to which any factor, or combination of factors, may cause actual results to differ materially from those contained in any forward-looking statements we may make. In light of these risks, uncertainties, and assumptions, our actual results could differ materially and adversely from those anticipated or implied in the forward-looking statements. Further information on risks that could cause actual results to differ materially from forecasted results are included in our annual report on Form 10-K for the year ended December 31, 2021 filed with the SEC, and within our annual report on Form 10-K for the year ended December 31, 2022 to be filed with the SEC, which are or will be available on our website at https://ir.remitly.com and on the SEC’s website at www.sec.gov. Except as required by law, we assume no obligation to update these forward-looking statements, or to update the reasons if actual results differ materially from those anticipated in the forward-looking statements.
3
About Remitly
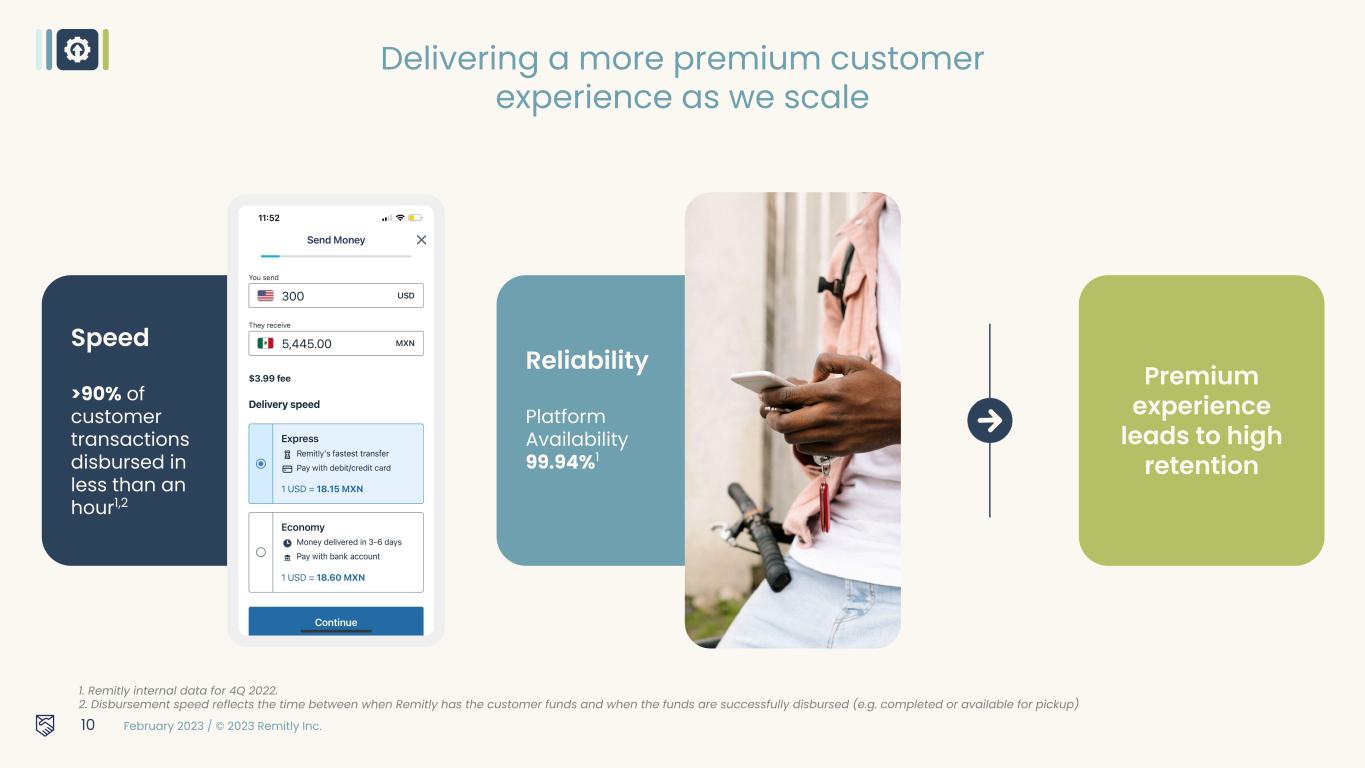
Remitly is a leading digital financial services provider for immigrants and their families in over 170 countries around the world. Remitly helps immigrants send money home in a safe, reliable and transparent manner. Its digitally native, cross-border remittance app eliminates the long wait times, complexities and fees typical of traditional remittance processes. Building on its strong foundation, Remitly is expanding its suite of products to further its mission and transform financial services for immigrants all around the world.
Contacts
Media:
Kendall Sadler
Investor Relations:
Stephen Shulstein
4
REMITLY GLOBAL, INC.
Condensed Consolidated Statements of Operations
(unaudited)
| Three Months Ended December 31, | Twelve Months Ended December 31, | ||||||||||||||||||||||
| (in thousands, except share and per share data) | 2022 | 2021 | 2022 | 2021 | |||||||||||||||||||
| Revenue | $ | 191,032 | $ | 135,255 | $ | 653,560 | $ | 458,605 | |||||||||||||||
| Costs and expenses | |||||||||||||||||||||||
Transaction expenses(1) | 71,866 | 56,431 | 258,827 | 191,606 | |||||||||||||||||||
Customer support and operations(1) | 19,239 | 13,090 | 68,106 | 45,525 | |||||||||||||||||||
Marketing(1) | 43,163 | 38,267 | 170,970 | 120,906 | |||||||||||||||||||
Technology and development(1) | 42,883 | 19,128 | 138,719 | 64,093 | |||||||||||||||||||
General and administrative(1) | 34,895 | 23,512 | 131,250 | 70,941 | |||||||||||||||||||
| Depreciation and amortization | 1,854 | 1,366 | 6,724 | 5,256 | |||||||||||||||||||
| Total costs and expenses | 213,900 | 151,794 | 774,596 | 498,327 | |||||||||||||||||||
| Loss from operations | (22,868) | (16,539) | (121,036) | (39,722) | |||||||||||||||||||
| Interest income | 2,274 | 48 | 4,149 | 140 | |||||||||||||||||||
| Interest expense | (327) | (208) | (1,302) | (1,256) | |||||||||||||||||||
| Other income, net | 1,092 | 81 | 5,213 | 3,125 | |||||||||||||||||||
| Loss before provision for income taxes | (19,829) | (16,618) | (112,976) | (37,713) | |||||||||||||||||||
| Provision for income taxes | (434) | (42) | 1,043 | 1,043 | |||||||||||||||||||
| Net loss attributable to common stockholders | $ | (19,395) | $ | (16,576) | $ | (114,019) | $ | (38,756) | |||||||||||||||
| Net loss per share attributable to common stockholders: | |||||||||||||||||||||||
| Basic and diluted | $ | (0.11) | $ | (0.10) | $ | (0.68) | $ | (0.64) | |||||||||||||||
| Weighted-average shares used in computing net loss per share attributable to common stockholders: | |||||||||||||||||||||||
| Basic and diluted | 171,505,584 | 163,616,647 | 167,774,123 | 60,728,748 | |||||||||||||||||||
(1) Exclusive of depreciation and amortization, shown separately, above.
Stock-Based Compensation Expense, net:
| Three Months Ended December 31, | Twelve Months Ended December 31, | ||||||||||||||||||||||
| (in thousands) | 2022 | 2021 | 2022 | 2021 | |||||||||||||||||||
| Customer support and operations | $ | 220 | $ | 76 | $ | 816 | $ | 153 | |||||||||||||||
| Marketing | 3,363 | 1,118 | 10,512 | 2,325 | |||||||||||||||||||
| Technology and development | 15,461 | 3,409 | 46,420 | 6,931 | |||||||||||||||||||
| General and administrative | 8,369 | 3,448 | 37,545 | 7,607 | |||||||||||||||||||
| Total | $ | 27,413 | $ | 8,051 | $ | 95,293 | $ | 17,016 | |||||||||||||||
5
REMITLY GLOBAL, INC.
Condensed Consolidated Balance Sheets
(unaudited)
| December 31, | December 31, | ||||||||||
| (in thousands) | 2022 | 2021 | |||||||||
| Assets | |||||||||||
| Current assets | |||||||||||
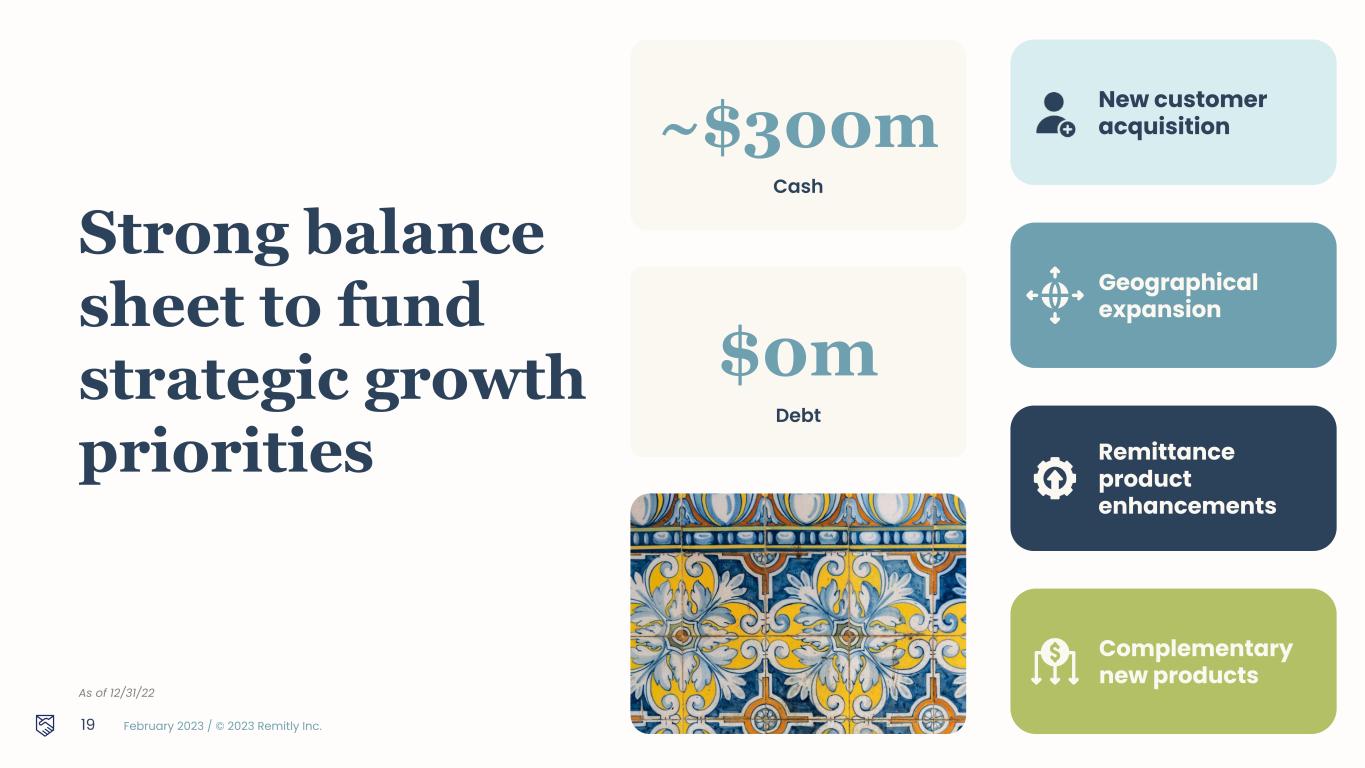
| Cash and cash equivalents | $ | 300,635 | $ | 403,262 | |||||||
| Disbursement prefunding | 158,055 | 119,627 | |||||||||
| Customer funds receivable, net | 191,402 | 67,215 | |||||||||
| Prepaid expenses and other current assets | 19,327 | 17,448 | |||||||||
| Total current assets | 669,419 | 607,552 | |||||||||
| Restricted cash | 99 | 51 | |||||||||
| Property and equipment, net | 11,546 | 9,249 | |||||||||
| Operating lease right-of-use assets | 8,675 | 5,302 | |||||||||
| Other noncurrent assets, net | 6,214 | 3,510 | |||||||||
| Total assets | $ | 695,953 | $ | 625,664 | |||||||
Liabilities and Stockholders’ Equity | |||||||||||
| Current liabilities | |||||||||||
| Accounts payable | $ | 6,794 | $ | 1,210 | |||||||
| Customer liabilities | 111,075 | 70,483 | |||||||||
| Accrued expenses and other current liabilities | 87,752 | 66,683 | |||||||||
| Operating lease liabilities | 3,521 | 3,240 | |||||||||
| Total current liabilities | 209,142 | 141,616 | |||||||||
| Operating lease liabilities, noncurrent | 5,674 | 2,907 | |||||||||
| Other noncurrent liabilities | 1,050 | 813 | |||||||||
| Total liabilities | $ | 215,866 | $ | 145,336 | |||||||
| Commitments and contingencies | |||||||||||
Stockholders’ equity | |||||||||||
| Common stock | $ | 17 | $ | 16 | |||||||
| Additional paid-in capital | 854,276 | 739,503 | |||||||||
| Accumulated other comprehensive (loss) income | (743) | 253 | |||||||||
| Accumulated deficit | (373,463) | (259,444) | |||||||||
| Total stockholders’ equity | 480,087 | 480,328 | |||||||||
| Total liabilities and stockholders’ equity | $ | 695,953 | $ | 625,664 | |||||||
6
REMITLY GLOBAL, INC.
Condensed Consolidated Statements of Cash Flows
(unaudited)
| Year Ended December 31, | ||||||||||||||
| (in thousands) | 2022 | 2021 | ||||||||||||
| Cash flows from operating activities | ||||||||||||||
| Net loss | $ | (114,019) | $ | (38,756) | ||||||||||
| Adjustments to reconcile net loss to net cash used in operating activities | ||||||||||||||
| Depreciation and amortization | 6,724 | 5,256 | ||||||||||||
| Stock-based compensation expense, net | 95,293 | 17,016 | ||||||||||||
| Donation of common stock | 1,972 | 6,933 | ||||||||||||
| Other | 356 | 452 | ||||||||||||
| Changes in operating assets and liabilities: | ||||||||||||||
| Disbursement prefunding | (38,428) | (18,069) | ||||||||||||
| Customer funds receivable | (126,942) | (17,282) | ||||||||||||
| Prepaid expenses and other assets | (4,598) | (12,559) | ||||||||||||
| Operating lease right-of-use assets | 3,763 | 2,780 | ||||||||||||
| Accounts payable | 5,535 | (3,035) | ||||||||||||
| Customer liabilities | 42,979 | 16,097 | ||||||||||||
| Accrued expenses and other liabilities | 26,298 | 26,071 | ||||||||||||
| Operating lease liabilities | (4,073) | (3,295) | ||||||||||||
| Net cash used in operating activities | (105,140) | (18,391) | ||||||||||||
| Cash flows from investing activities | ||||||||||||||
| Purchases of property and equipment | (3,679) | (1,956) | ||||||||||||
| Capitalized internal-use software costs | (3,382) | (2,578) | ||||||||||||
| Cash paid for acquisition, net of acquired cash and cash equivalents | (248) | — | ||||||||||||
| Net cash used in investing activities | (7,309) | (4,534) | ||||||||||||
| Cash flows from financing activities | ||||||||||||||
| Proceeds from issuance of common stock upon initial public offering and private placements, net of underwriting discounts and commissions and other offering costs | — | 305,191 | ||||||||||||
| Repayment of non-recourse promissory note | — | 3,060 | ||||||||||||
| Proceeds from issuance of Series F convertible preferred stock, net of issuance costs | — | 2,980 | ||||||||||||
| Proceeds from exercise of stock options | 11,554 | 8,345 | ||||||||||||
| Payment of debt issuance costs | — | (1,373) | ||||||||||||
| Repayments of revolving credit facility borrowings, net | — | (80,000) | ||||||||||||
| Taxes paid related to net share settlement of equity awards | (99) | — | ||||||||||||
| Repayment of long-term debt | (384) | — | ||||||||||||
| Net cash provided by financing activities | 11,071 | 238,203 | ||||||||||||
| Effect of foreign exchange rate changes on cash, cash equivalents, and restricted cash | (1,201) | (40) | ||||||||||||
| Net (decrease) increase in cash, cash equivalents and restricted cash | (102,579) | 215,238 | ||||||||||||
| Cash, cash equivalents, and restricted cash at beginning of period | 403,313 | 188,075 | ||||||||||||
| Cash, cash equivalents, and restricted cash at end of period | $ | 300,734 | $ | 403,313 | ||||||||||
| Supplemental disclosure of cash flow information | ||||||||||||||
| Cash paid for interest | $ | 906 | $ | 934 | ||||||||||
| Cash paid for income taxes | $ | 2,282 | $ | 756 | ||||||||||
| Supplemental disclosure of noncash investing and financing activities | ||||||||||||||
| Operating lease right-of-use assets obtained in exchange for operating lease liabilities | $ | 7,441 | $ | 2,532 | ||||||||||
| Vesting of early exercised options | 716 | 482 | ||||||||||||
| Noncash issuance of common stock in connection with ESPP | 3,516 | — | ||||||||||||
| Stock-based compensation expense capitalized to internal-use software | 1,821 | — | ||||||||||||
| IPO and debt issuance costs incurred but not yet paid | — | 2,287 | ||||||||||||
| Conversion of redeemable convertible preferred stock to common stock in connection with initial public offering | — | 390,687 | ||||||||||||
| Reconciliation of cash, cash equivalents, and restricted cash | ||||||||||||||
| Cash and cash equivalents | $ | 300,635 | $ | 403,262 | ||||||||||
| Restricted cash | 99 | 51 | ||||||||||||
| Total cash, cash equivalents, and restricted cash | $ | 300,734 | $ | 403,313 | ||||||||||
7
REMITLY GLOBAL, INC.
Reconciliation of GAAP to Non-GAAP Financial Measures
(unaudited)
| Reconciliation of net loss to Adjusted EBITDA: | ||||||||||||||||||||||||||
| Three Months Ended December 31, | Twelve Months Ended December 31, | |||||||||||||||||||||||||
| (in thousands) | 2022 | 2021 | 2022 | 2021 | ||||||||||||||||||||||
| Net loss | $ | (19,395) | $ | (16,576) | $ | (114,019) | $ | (38,756) | ||||||||||||||||||
| Add: | ||||||||||||||||||||||||||
| Interest (income) expense, net | (1,947) | 160 | (2,847) | 1,116 | ||||||||||||||||||||||
| Provision for income taxes | (434) | (42) | 1,043 | 1,043 | ||||||||||||||||||||||
| Depreciation and amortization | 1,854 | 1,366 | 6,724 | 5,256 | ||||||||||||||||||||||
| Foreign exchange gain | (1,090) | (81) | (5,261) | (3,125) | ||||||||||||||||||||||
| Donation of common stock | — | — | 1,972 | 6,933 | ||||||||||||||||||||||
| Stock-based compensation expense, net | 27,413 | 8,051 | 95,293 | 17,016 | ||||||||||||||||||||||
Transaction costs(1) | 1,077 | — | 3,462 | — | ||||||||||||||||||||||
| Adjusted EBITDA | $ | 7,478 | $ | (7,122) | $ | (13,633) | $ | (10,517) | ||||||||||||||||||
(1) Transaction costs primarily represents expenses related to the acquisition of Rewire (O.S.G) Research and Development Ltd.
| Reconciliation of operating expenses to non-GAAP operating expenses: | ||||||||||||||||||||||||||
| Three Months Ended December 31, | Twelve Months Ended December 31, | |||||||||||||||||||||||||
| (in thousands) | 2022 | 2021 | 2022 | 2021 | ||||||||||||||||||||||
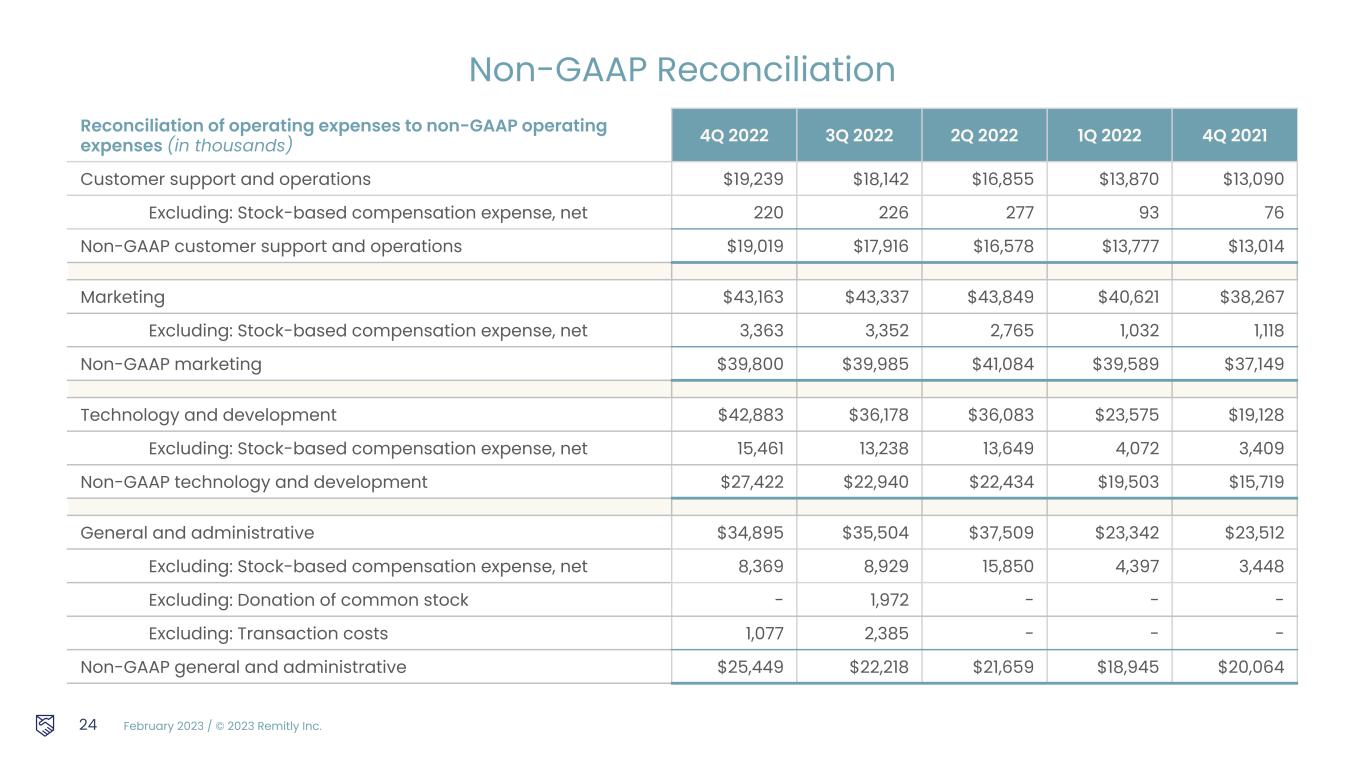
| Customer support and operations | $ | 19,239 | $ | 13,090 | $ | 68,106 | $ | 45,525 | ||||||||||||||||||
| Excluding: Stock-based compensation expense, net | 220 | 76 | 816 | 153 | ||||||||||||||||||||||
| Non-GAAP customer support and operations | $ | 19,019 | $ | 13,014 | $ | 67,290 | $ | 45,372 | ||||||||||||||||||
| Three Months Ended December 31, | Twelve Months Ended December 31, | |||||||||||||||||||||||||
| 2022 | 2021 | 2022 | 2021 | |||||||||||||||||||||||
| Marketing | $ | 43,163 | $ | 38,267 | $ | 170,970 | $ | 120,906 | ||||||||||||||||||
| Excluding: Stock-based compensation expense, net | 3,363 | 1,118 | 10,512 | 2,325 | ||||||||||||||||||||||
| Non-GAAP marketing | $ | 39,800 | $ | 37,149 | $ | 160,458 | $ | 118,581 | ||||||||||||||||||
| Three Months Ended December 31, | Twelve Months Ended December 31, | |||||||||||||||||||||||||
| 2022 | 2021 | 2022 | 2021 | |||||||||||||||||||||||
| Technology and development | $ | 42,883 | $ | 19,128 | $ | 138,719 | $ | 64,093 | ||||||||||||||||||
| Excluding: Stock-based compensation expense, net | 15,461 | 3,409 | 46,420 | 6,931 | ||||||||||||||||||||||
| Non-GAAP technology and development | $ | 27,422 | $ | 15,719 | $ | 92,299 | $ | 57,162 | ||||||||||||||||||
| Three Months Ended December 31, | Twelve Months Ended December 31, | |||||||||||||||||||||||||
| 2022 | 2021 | 2022 | 2021 | |||||||||||||||||||||||
| General and administrative | $ | 34,895 | $ | 23,512 | $ | 131,250 | $ | 70,941 | ||||||||||||||||||
| Excluding: Stock-based compensation expense, net | 8,369 | 3,448 | 37,545 | 7,607 | ||||||||||||||||||||||
| Excluding: Donation of common stock | — | — | 1,972 | 6,933 | ||||||||||||||||||||||
| Excluding: Transaction costs | 1,077 | — | 3,462 | — | ||||||||||||||||||||||
| Non-GAAP general and administrative | $ | 25,449 | $ | 20,064 | $ | 88,271 | $ | 56,401 | ||||||||||||||||||
8