Fiscal Second Quarter 2021 Operations and Financial Update May 11, 2021

Riley Permian at a Glance New breed of small-cap E&P outperforming large-caps in operating and
financial metricsLow base-decline assets enable less capital-intensive reinvestment for maintenance and growthShareholder-focused capital allocation framework includes growing within moderate reinvestment rate and robust dividend
payoutConservative balance sheet and low leverageNew ventures beginning with enhanced oil recovery (EOR); Riley aims to use anthropogenic sources of CO2 (ACO2), which leads to the production of low-carbon barrels 2 Future dividends are
subject to approval by the board of directors.

Successful Completion of Reverse Merger Merger completed February 26, 2021; represented public debut
for REP LLCManagement constituted primarily from REP LLCNew board with representation of 1 director from each of REP LLC and TGC, 1 from largest shareholder and 2 independents18.0 million shares outstanding Headquartered in Oklahoma City with
50 employeesOil & gas assets entirely from REP LLC following April 2021 divestiture of legacy TGC properties 3 NYSE American: REPX Riley Exploration – Permian LLC (“REP LLC”) Formed in 2016; management has worked together in prior
entities since 2007Core assets on the Northwest Shelf of the Permian BasinDesire for public market listing, though traditional IPO markets were unattractive Tengasco, Inc. (“TGC”) Traded on NYSE under symbol TGCAssists consisted of cash and
small Kansas properties, now divested Shares outstanding as of March 31, 2021.
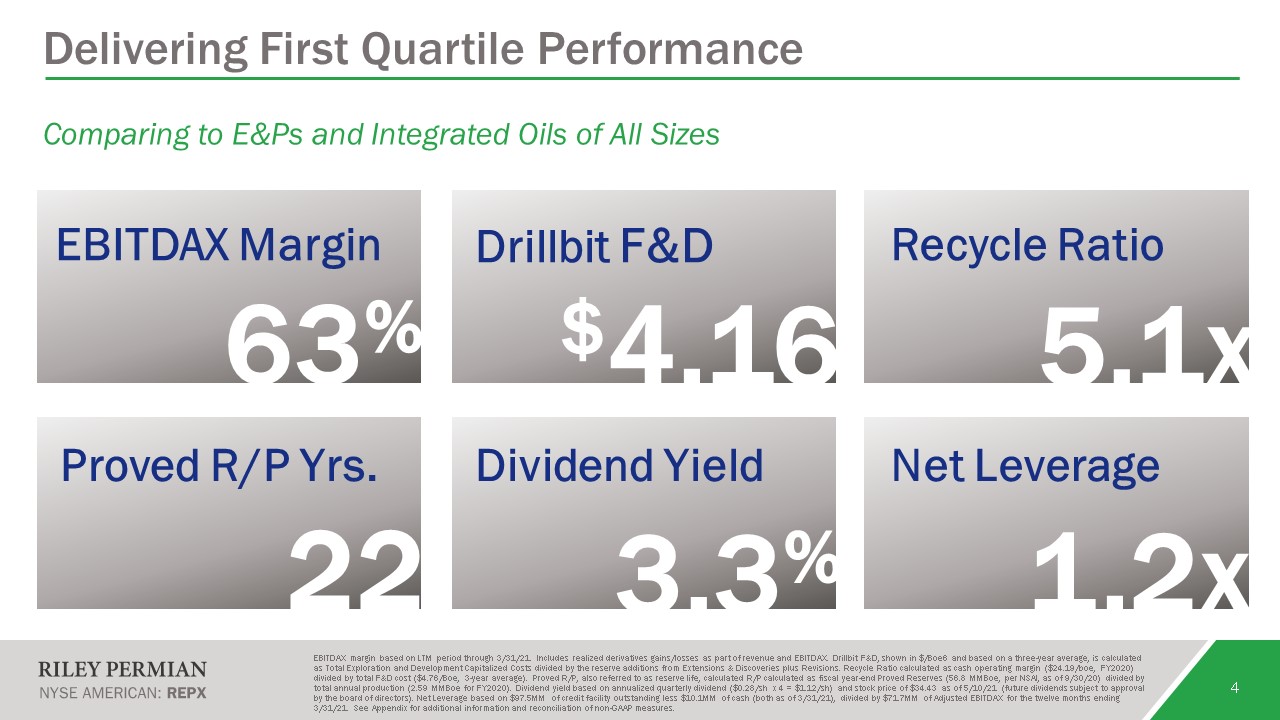
Delivering First Quartile Performance 4 EBITDAX margin based on LTM period through 3/31/21. Includes
realized derivatives gains/losses as part of revenue and EBITDAX. Drillbit F&D, shown in $/Boe6 and based on a three-year average, is calculated as Total Exploration and Development Capitalized Costs divided by the reserve additions from
Extensions & Discoveries plus Revisions. Recycle Ratio calculated as cash operating margin ($24.19/boe, FY2020) divided by total F&D cost ($4.76/Boe, 3-year average). Proved R/P, also referred to as reserve life, calculated R/P
calculated as fiscal year-end Proved Reserves (56.8 MMBoe, per NSAI, as of 9/30/20) divided by total annual production (2.59 MMBoe for FY2020). Dividend yield based on annualized quarterly dividend ($0.28/sh x 4 = $1.12/sh) and stock price of
$34.43 as of 5/10/21 (future dividends subject to approval by the board of directors). Net Leverage based on $97.5MM of credit facility outstanding less $10.1MM of cash (both as of 3/31/21), divided by $71.7MM of Adjusted EBITDAX for the
twelve months ending 3/31/21. See Appendix for additional information and reconciliation of non-GAAP measures. 63% $4.16 5.1x 22 3.3% 1.2x EBITDAX Margin Drillbit F&D Recycle Ratio Proved R/P Yrs. Dividend
Yield Net Leverage Comparing to E&Ps and Integrated Oils of All Sizes
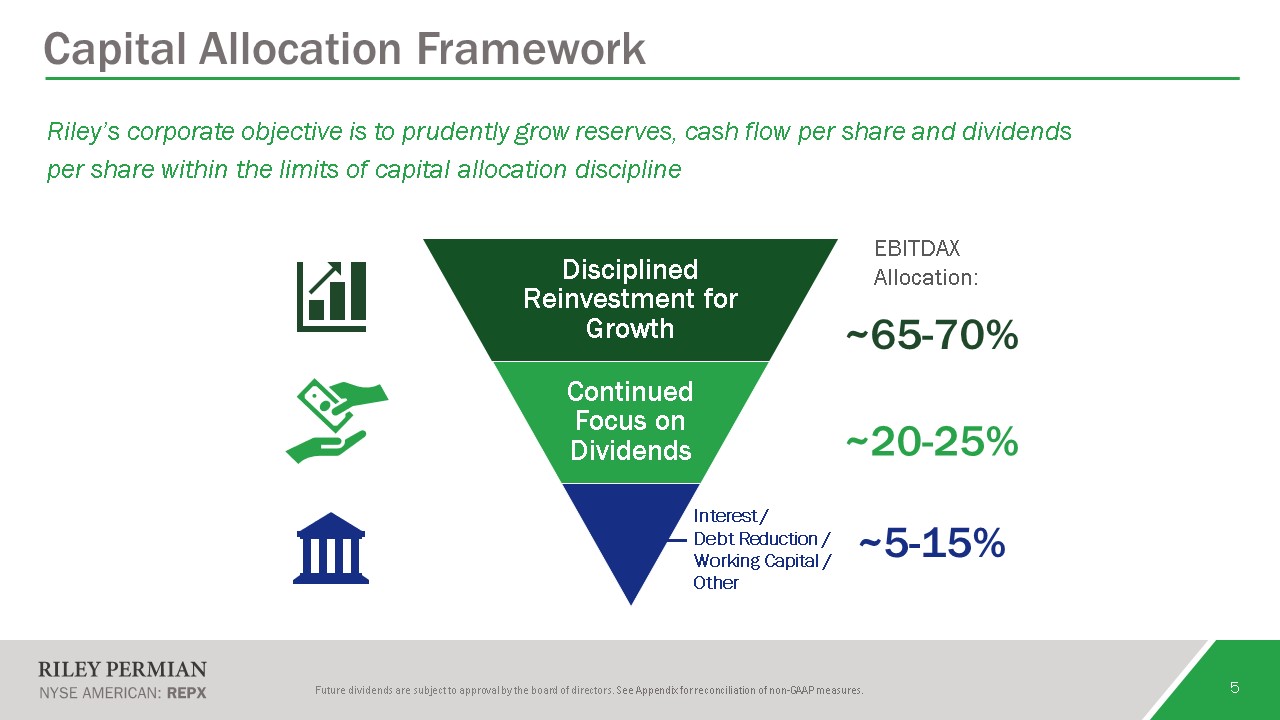
Capital Allocation Framework 5 Future dividends are subject to approval by the board of directors.
See Appendix for reconciliation of non-GAAP measures. Riley’s corporate objective is to prudently grow reserves, cash flow per share and dividends per share within the limits of capital allocation
discipline ~65-70% ~20-25% ~5-15% Interest / Debt Reduction /Working Capital /Other EBITDAX Allocation:
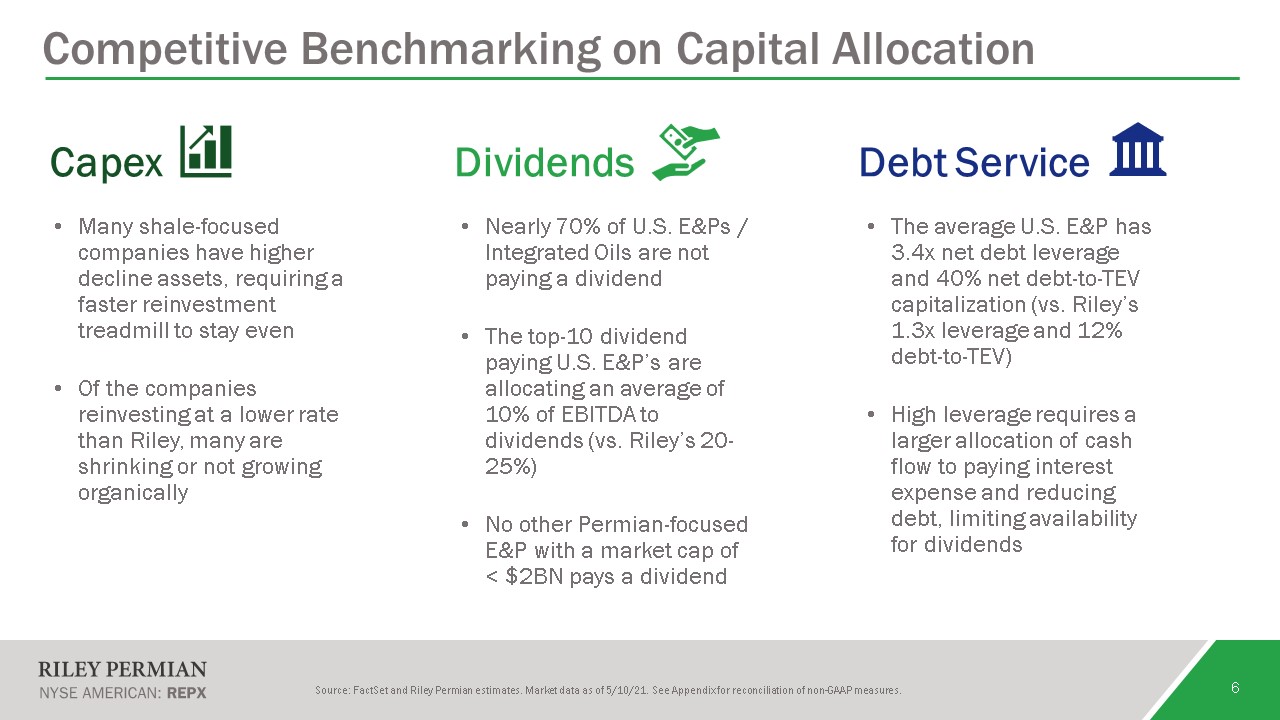
Many shale-focused companies have higher decline assets, requiring a faster reinvestment treadmill to
stay evenOf the companies reinvesting at a lower rate than Riley, many are shrinking or not growing organically 6 Competitive Benchmarking on Capital Allocation Source: FactSet and Riley Permian estimates. Market data as of 5/10/21. See
Appendix for reconciliation of non-GAAP measures. Nearly 70% of U.S. E&Ps / Integrated Oils are not paying a dividendThe top-10 dividend paying U.S. E&P’s are allocating an average of 10% of EBITDA to dividends (vs. Riley’s 20-25%)No
other Permian-focused E&P with a market cap of < $2BN pays a dividend The average U.S. E&P has 3.4x net debt leverage and 40% net debt-to-TEV capitalization (vs. Riley’s 1.3x leverage and 12% debt-to-TEV)High leverage requires a
larger allocation of cash flow to paying interest expense and reducing debt, limiting availability for dividends Capex Dividends Debt Service

Riley’s Dividend Information 7 FY19 and FY20 based on actual dividends paid by private, predecessor
entity, and current share count for illustrative dividends per share. FY21 based on forecasted $18MM of dividends payable and $85MM of EBITDAX, per Management’s guidance and current commodity prices. Future dividends are subject to approval
by the board of directors. See Appendix for reconciliation of non-GAAP measures. The payment of a regular quarterly dividend has long been a priority for Riley Permian, dating back to its predecessor entity as a private company. Going
forward, one of Riley Permian’s core priorities is to continue to pay – and grow – a regular quarterly dividend, consistent with our shareholder-focused business model. 10 consecutive quarters of returning cash to our shareholders
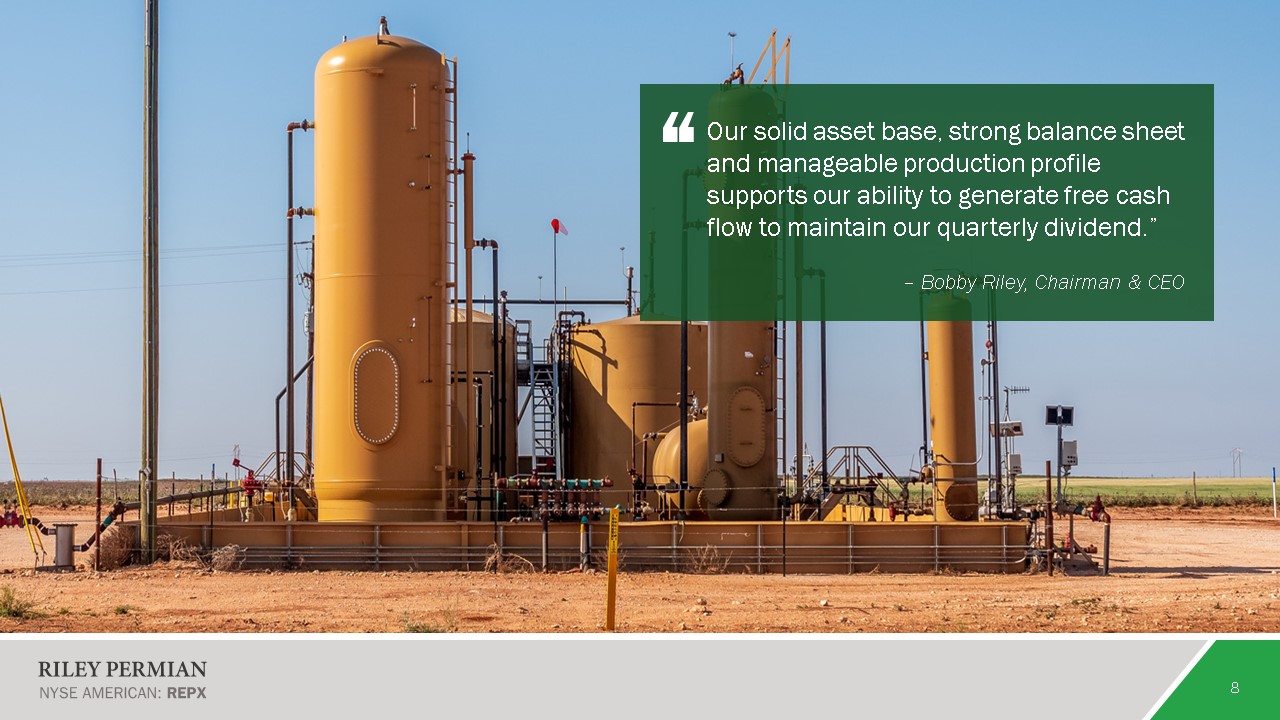
8 Our solid asset base, strong balance sheet and manageable production profile supports our
ability to generate free cash flow to maintain our quarterly dividend.” – Bobby Riley, Chairman & CEO “
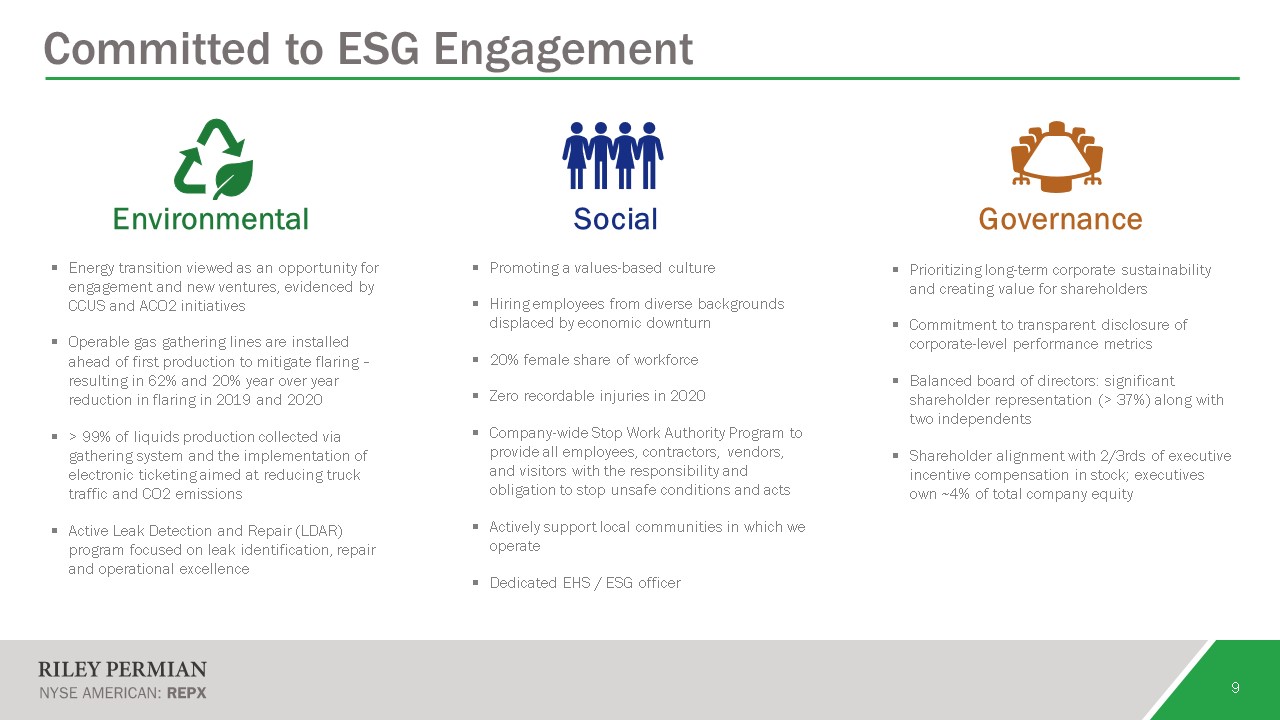
Committed to ESG Engagement 9 Energy transition viewed as an opportunity for engagement and new
ventures, evidenced by CCUS and ACO2 initiativesOperable gas gathering lines are installed ahead of first production to mitigate flaring – resulting in 62% and 20% year over year reduction in flaring in 2019 and 2020> 99% of liquids
production collected via gathering system and the implementation of electronic ticketing aimed at reducing truck traffic and CO2 emissionsActive Leak Detection and Repair (LDAR) program focused on leak identification, repair and operational
excellence Promoting a values-based cultureHiring employees from diverse backgrounds displaced by economic downturn20% female share of workforceZero recordable injuries in 2020Company-wide Stop Work Authority Program to provide all
employees, contractors, vendors, and visitors with the responsibility and obligation to stop unsafe conditions and acts Actively support local communities in which we operateDedicated EHS / ESG officer Prioritizing long-term corporate
sustainability and creating value for shareholdersCommitment to transparent disclosure of corporate-level performance metricsBalanced board of directors: significant shareholder representation (> 37%) along with two independentsShareholder
alignment with 2/3rds of executive incentive compensation in stock; executives own ~4% of total company equity Environmental Social Governance
Asset Overview 10
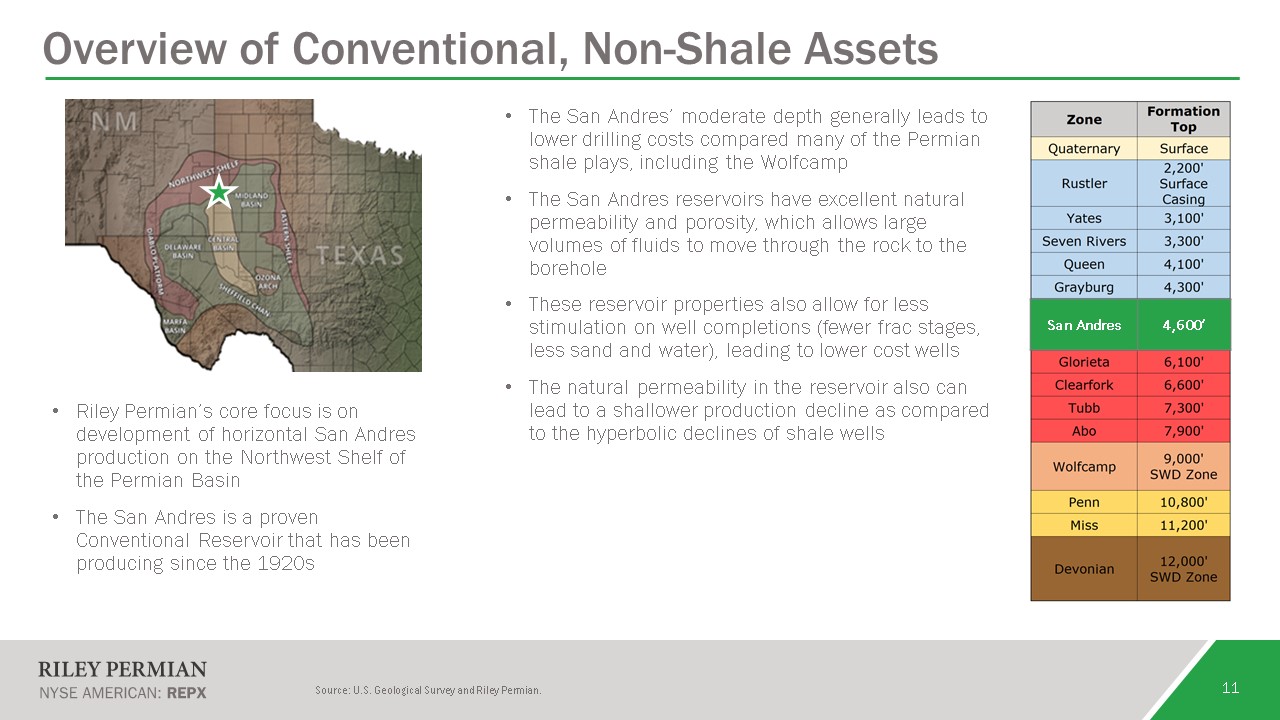
11 Overview of Conventional, Non-Shale Assets Source: U.S. Geological Survey and Riley Permian.
Riley Permian’s core focus is on development of horizontal San Andres production on the Northwest Shelf of the Permian BasinThe San Andres is a proven Conventional Reservoir that has been producing since the 1920s The San Andres’
moderate depth generally leads to lower drilling costs compared many of the Permian shale plays, including the WolfcampThe San Andres reservoirs have excellent natural permeability and porosity, which allows large volumes of fluids to move
through the rock to the boreholeThese reservoir properties also allow for less stimulation on well completions (fewer frac stages, less sand and water), leading to lower cost wells The natural permeability in the reservoir also can lead to a
shallower production decline as compared to the hyperbolic declines of shale wells San Andres 4,600’
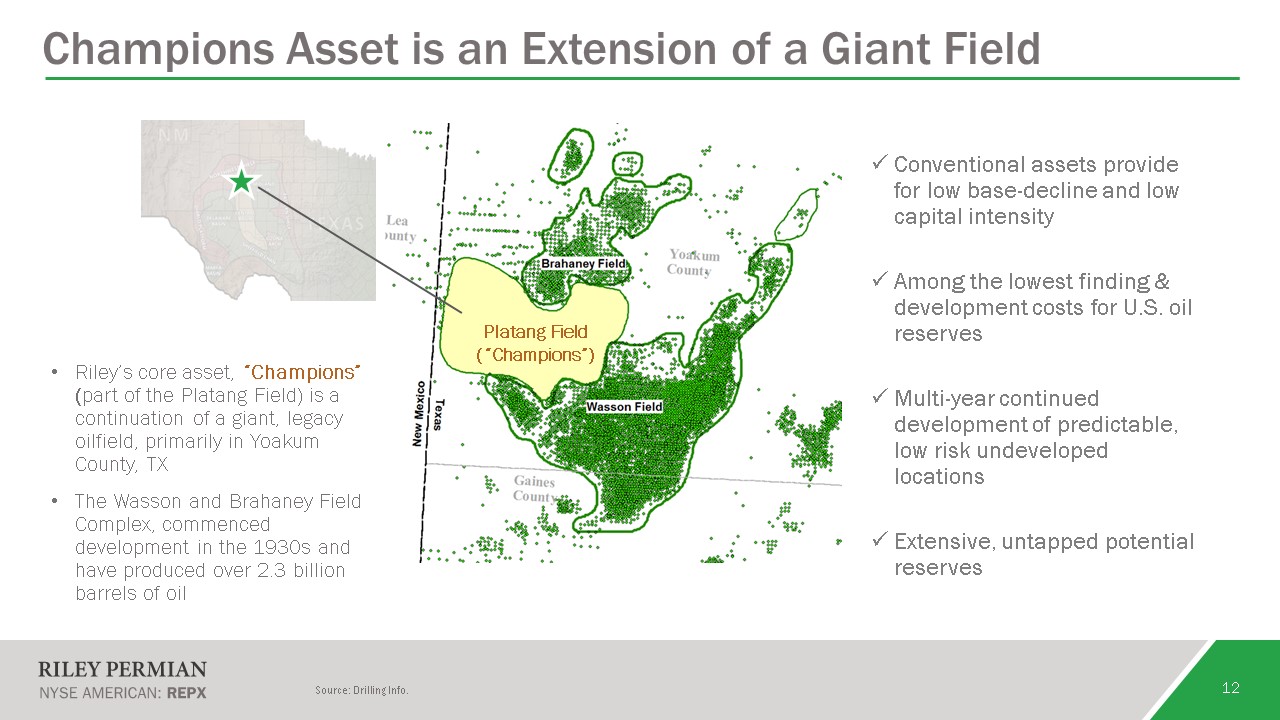
12 Champions Asset is an Extension of a Giant Field Conventional assets provide for low base-decline
and low capital intensityAmong the lowest finding & development costs for U.S. oil reservesMulti-year continued development of predictable, low risk undeveloped locationsExtensive, untapped potential reserves Platang Field
(“Champions”) Riley’s core asset, “Champions” (part of the Platang Field) is a continuation of a giant, legacy oilfield, primarily in Yoakum County, TXThe Wasson and Brahaney Field Complex, commenced development in the 1930s and have
produced over 2.3 billion barrels of oil Source: Drilling Info.
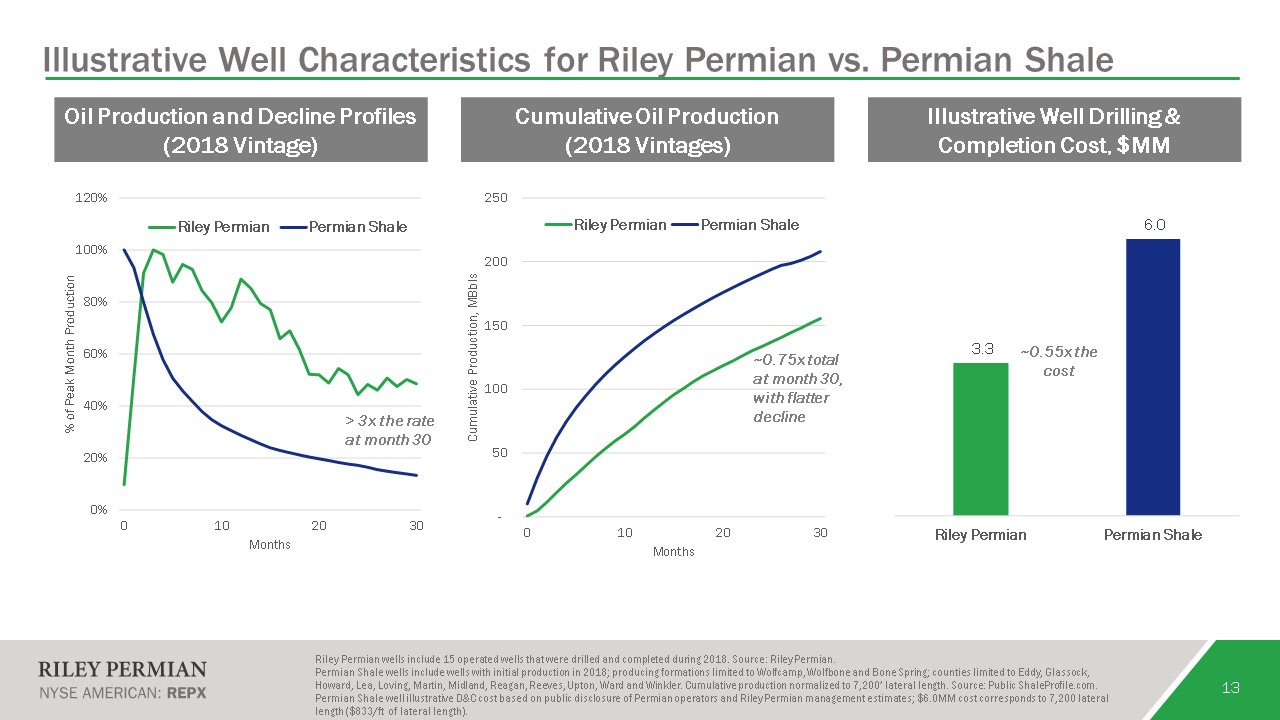
13 Riley Permian wells include 15 operated wells that were drilled and completed during 2018. Source:
Riley Permian. Permian Shale wells include wells with initial production in 2018; producing formations limited to Wolfcamp, Wolfbone and Bone Spring; counties limited to Eddy, Glassock, Howard, Lea, Loving, Martin, Midland, Reagan, Reeves,
Upton, Ward and Winkler. Cumulative production normalized to 7,200’ lateral length. Source: Public ShaleProfile.com.Permian Shale well illustrative D&C cost based on public disclosure of Permian operators and Riley Permian management
estimates; $6.0MM cost corresponds to 7,200 lateral length ($833/ft of lateral length). Oil Production and Decline Profiles (2018 Vintage) Cumulative Oil Production (2018 Vintages) Illustrative Well Drilling & Completion Cost,
$MM Illustrative Well Characteristics for Riley Permian vs. Permian Shale > 3x the rateat month 30 ~0.75x total at month 30, with flatter decline ~0.55x the cost
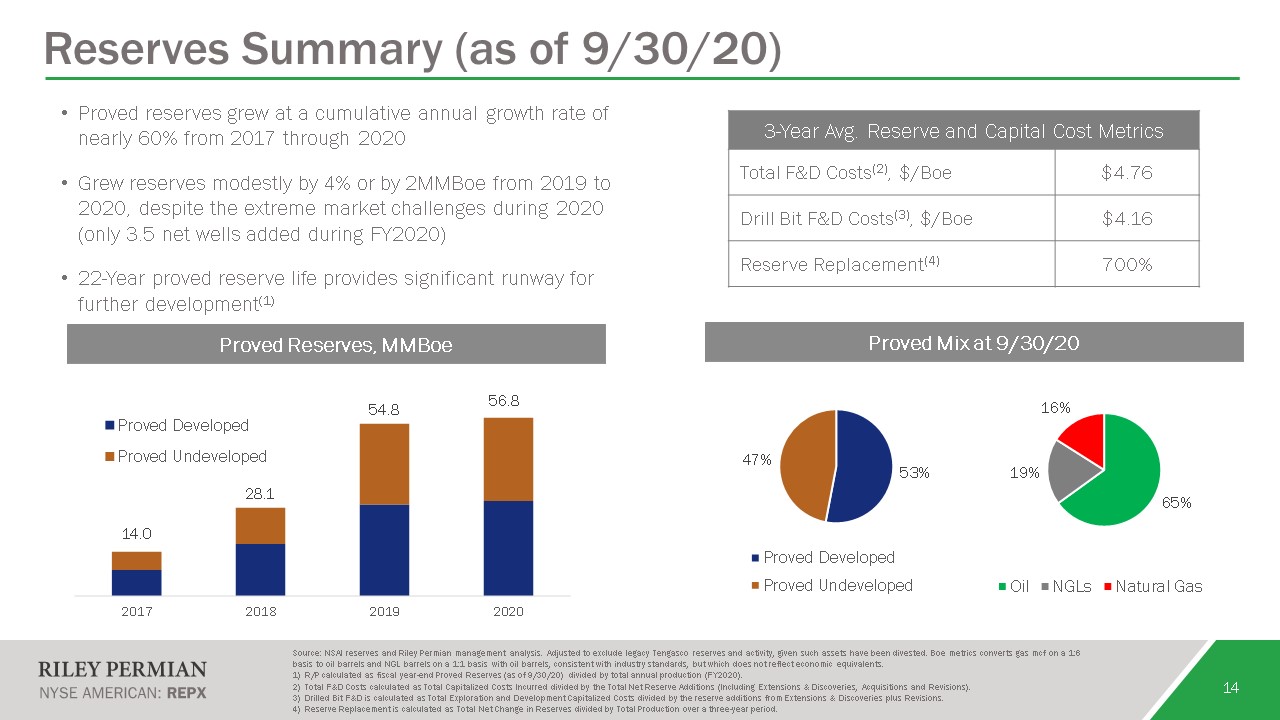
Reserves Summary (as of 9/30/20) 14 Proved reserves grew at a cumulative annual growth rate of nearly
60% from 2017 through 2020Grew reserves modestly by 4% or by 2MMBoe from 2019 to 2020, despite the extreme market challenges during 2020 (only 3.5 net wells added during FY2020)22-Year proved reserve life provides significant runway for
further development(1) Proved Reserves, MMBoe 3-Year Avg. Reserve and Capital Cost Metrics Total F&D Costs(2), $/Boe $4.76 Drill Bit F&D Costs(3), $/Boe $4.16 Reserve Replacement(4) 700% Source: NSAI reserves and Riley
Permian management analysis. Adjusted to exclude legacy Tengasco reserves and activity, given such assets have been divested. Boe metrics converts gas mcf on a 1:6 basis to oil barrels and NGL barrels on a 1:1 basis with oil barrels,
consistent with industry standards, but which does not reflect economic equivalents. R/P calculated as fiscal year-end Proved Reserves (as of 9/30/20) divided by total annual production (FY2020). Total F&D Costs calculated as Total
Capitalized Costs Incurred divided by the Total Net Reserve Additions (Including Extensions & Discoveries, Acquisitions and Revisions).Drilled Bit F&D is calculated as Total Exploration and Development Capitalized Costs divided by the
reserve additions from Extensions & Discoveries plus Revisions.Reserve Replacement is calculated as Total Net Change in Reserves divided by Total Production over a three-year period. Proved Mix at 9/30/20 14.0 28.1 54.8 56.8
New Ventures EOR and CCUS 15
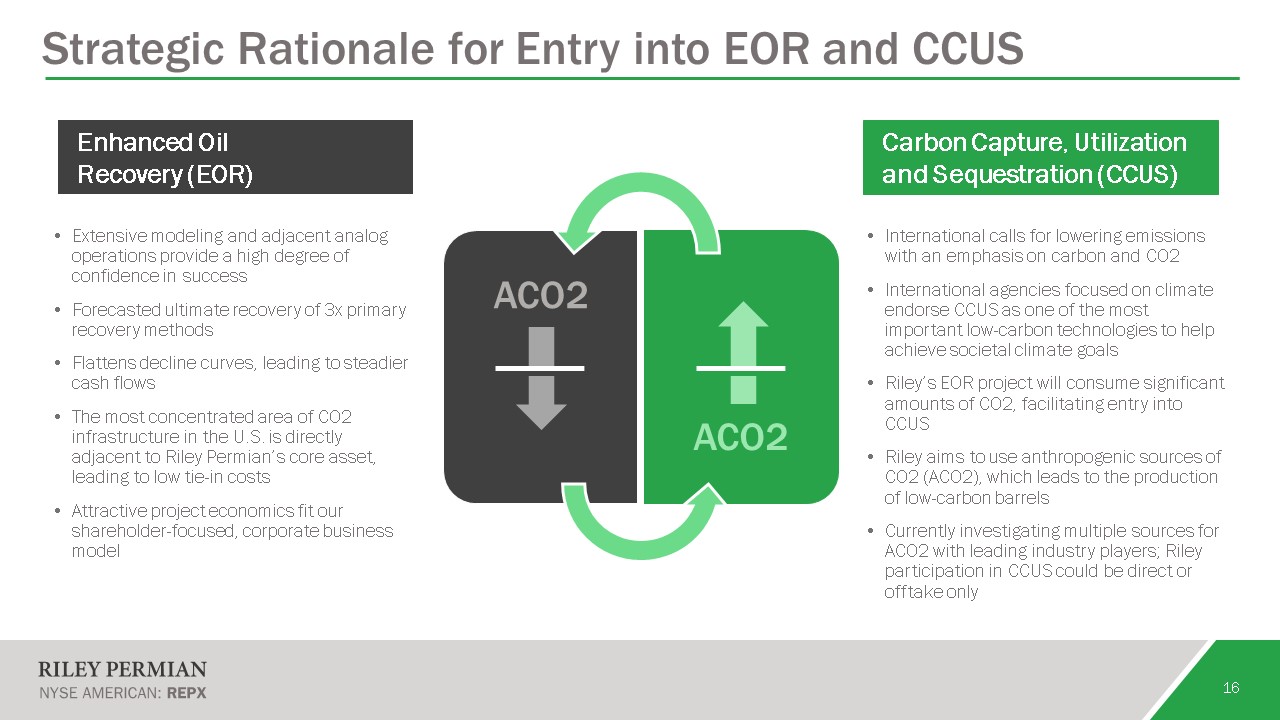
16 Strategic Rationale for Entry into EOR and CCUS International calls for lowering emissions with an
emphasis on carbon and CO2International agencies focused on climate endorse CCUS as one of the most important low-carbon technologies to help achieve societal climate goalsRiley’s EOR project will consume significant amounts of CO2,
facilitating entry into CCUSRiley aims to use anthropogenic sources of CO2 (ACO2), which leads to the production of low-carbon barrelsCurrently investigating multiple sources for ACO2 with leading industry players; Riley participation in CCUS
could be direct or offtake only Extensive modeling and adjacent analog operations provide a high degree of confidence in successForecasted ultimate recovery of 3x primary recovery methodsFlattens decline curves, leading to steadier cash
flowsThe most concentrated area of CO2 infrastructure in the U.S. is directly adjacent to Riley Permian’s core asset, leading to low tie-in costsAttractive project economics fit our shareholder-focused, corporate business model Enhanced Oil
Recovery (EOR) Carbon Capture, Utilization and Sequestration (CCUS) ACO2 ACO2
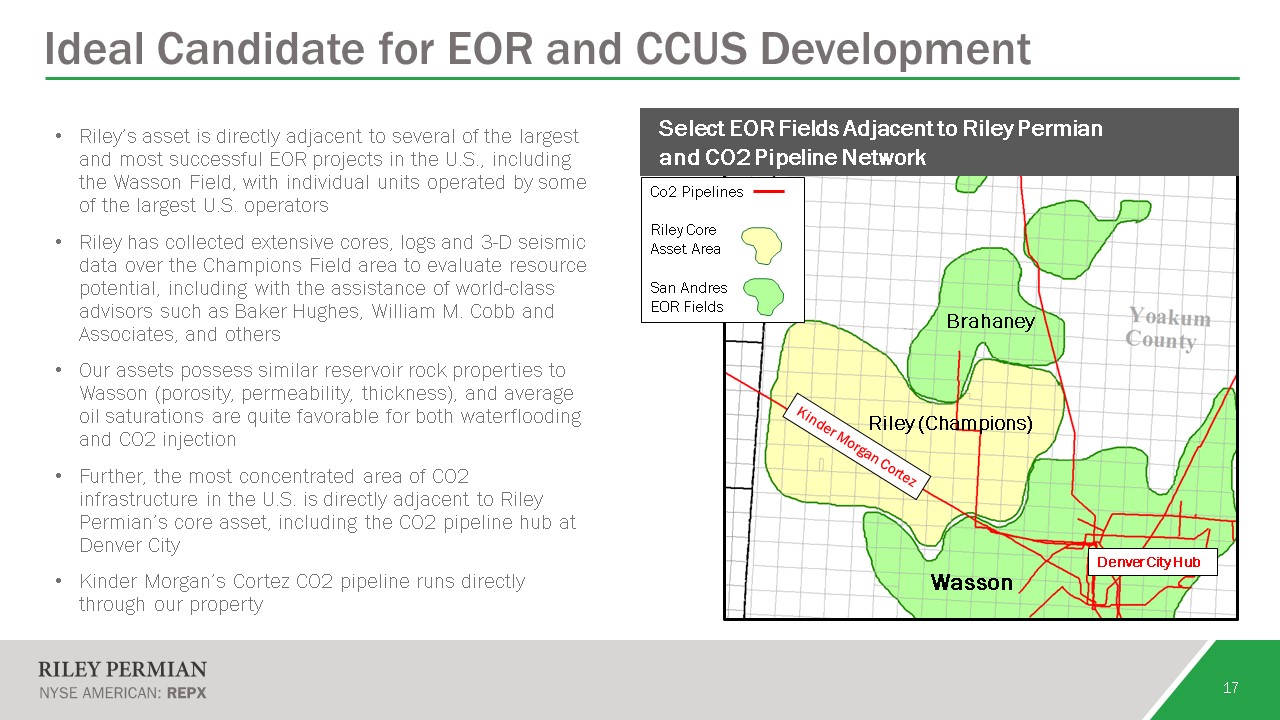
Riley’s asset is directly adjacent to several of the largest and most successful EOR projects in the
U.S., including the Wasson Field, with individual units operated by some of the largest U.S. operatorsRiley has collected extensive cores, logs and 3-D seismic data over the Champions Field area to evaluate resource potential, including with
the assistance of world-class advisors such as Baker Hughes, William M. Cobb and Associates, and othersOur assets possess similar reservoir rock properties to Wasson (porosity, permeability, thickness), and average oil saturations are quite
favorable for both waterflooding and CO2 injection Further, the most concentrated area of CO2 infrastructure in the U.S. is directly adjacent to Riley Permian’s core asset, including the CO2 pipeline hub at Denver CityKinder Morgan’s Cortez
CO2 pipeline runs directly through our property 17 Ideal Candidate for EOR and CCUS Development Brahaney Co2 PipelinesRiley Core Asset AreaSan Andres EOR Fields Wasson Denver City Hub Kinder Morgan Cortez Riley (Champions) Select
EOR Fields Adjacent to Riley Permianand CO2 Pipeline Network
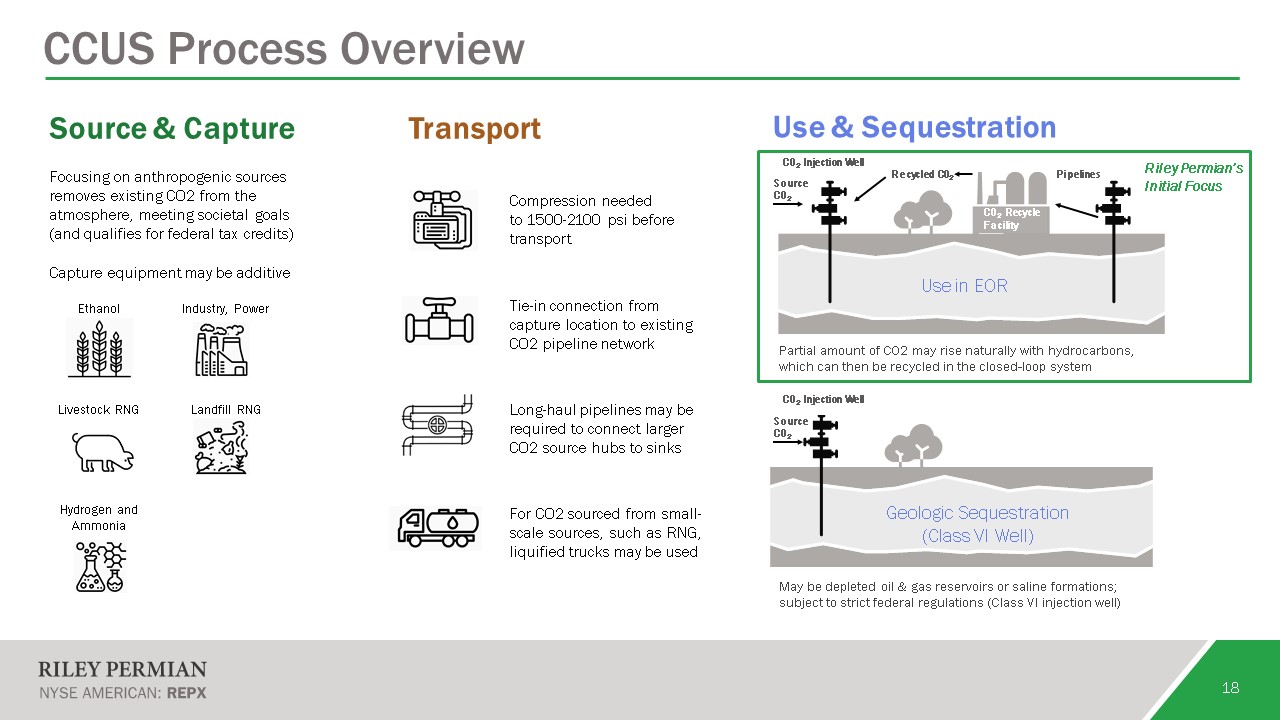
Ethanol Industry, Power Livestock RNG Landfill RNG Hydrogen and Ammonia CCUS Process
Overview 18 Compression needed to 1500-2100 psi before transport Tie-in connection from capture location to existing CO2 pipeline network Long-haul pipelines may be required to connect larger CO2 source hubs to sinks For CO2
sourced from small-scale sources, such as RNG, liquified trucks may be used Focusing on anthropogenic sources removes existing CO2 from the atmosphere, meeting societal goals (and qualifies for federal tax credits)Capture equipment may be
additive Source & Capture Transport Use & Sequestration Partial amount of C02 may rise naturally with hydrocarbons, which can then be recycled in the closed-loop system May be depleted oil & gas reservoirs or saline
formations; subject to strict federal regulations (Class VI injection well) Geologic Sequestration (Class VI Well) C02 Recycle Facility Recycled C02 Source C02 C02 Injection Well Pipelines Source C02 C02 Injection Well Use in
EOR Riley Permian’s Initial Focus
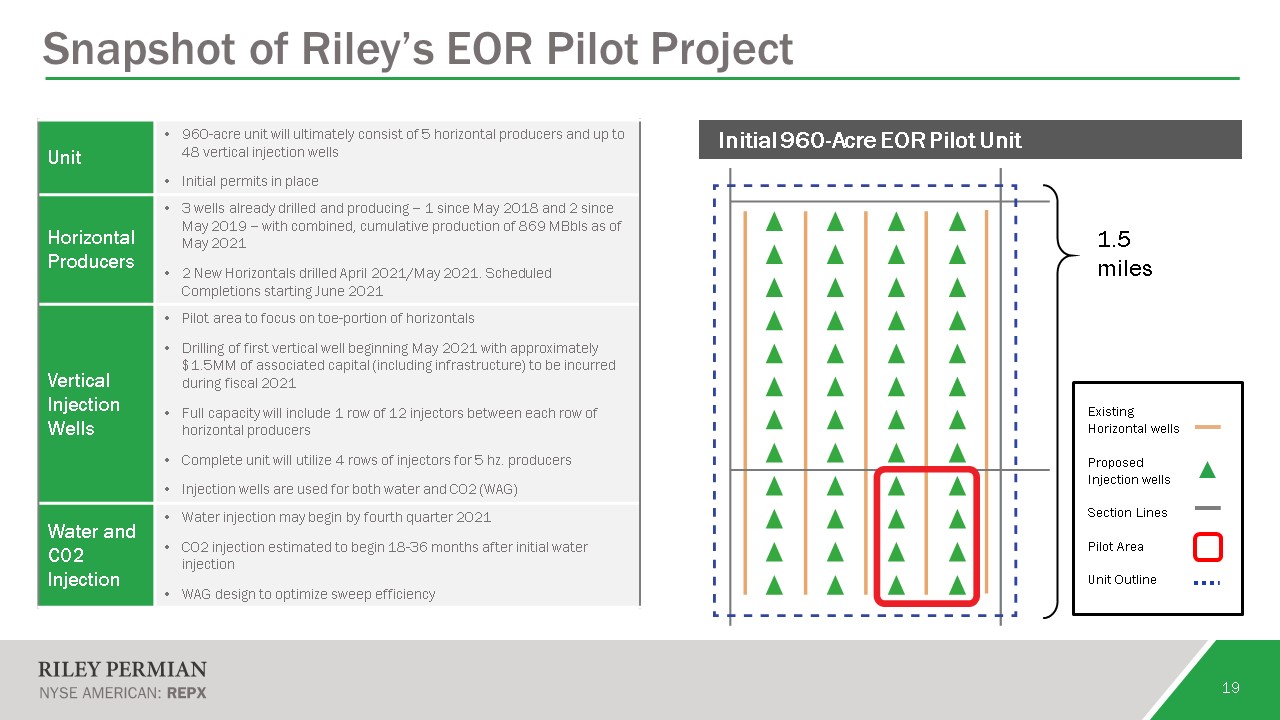
Snapshot of Riley’s EOR Pilot Project 19 Unit 960-acre unit will ultimately consist of 5 horizontal
producers and up to 48 vertical injection wellsInitial permits in place Horizontal Producers 3 wells already drilled and producing – 1 since May 2018 and 2 since May 2019 – with combined, cumulative production of 869 MBbls as of May 20212
New Horizontals drilled April 2021/May 2021. Scheduled Completions starting June 2021 Vertical Injection Wells Pilot area to focus on toe-portion of horizontalsDrilling of first vertical well beginning May 2021 with approximately $1.5MM of
associated capital (including infrastructure) to be incurred during fiscal 2021Full capacity will include 1 row of 12 injectors between each row of horizontal producersComplete unit will utilize 4 rows of injectors for 5 hz.
producersInjection wells are used for both water and CO2 (WAG) Water and CO2 Injection Water injection may begin by fourth quarter 2021CO2 injection estimated to begin 18-36 months after initial water injectionWAG design to optimize sweep
efficiency 1.5 miles Existing Horizontal wells Proposed Injection wellsSection LinesPilot AreaUnit Outline Initial 960-Acre EOR Pilot Unit
20 [ insert footnotes here ] Updated Results and Guidance Results through March 31, 2021
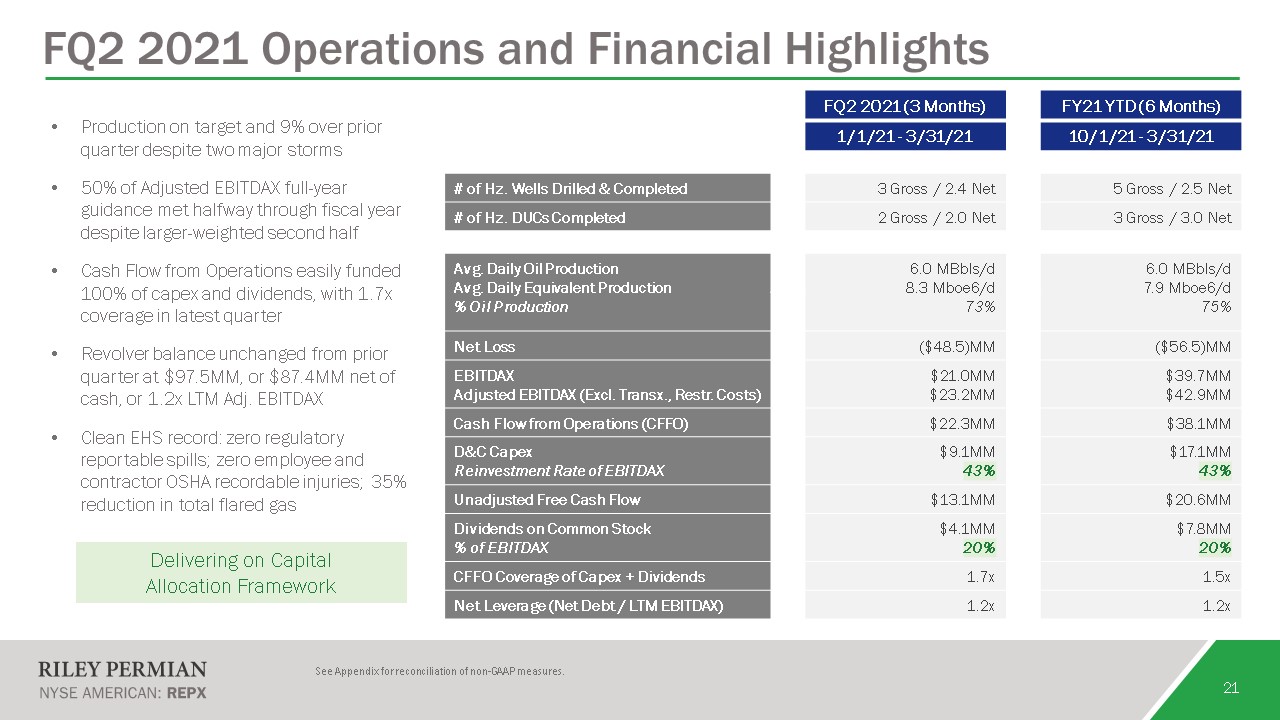
21 FQ2 2021 Operations and Financial Highlights FQ2 2021 (3 Months) FY21 YTD (6
Months) 1/1/21 - 3/31/21 10/1/21 - 3/31/21 # of Hz. Wells Drilled & Completed 3 Gross / 2.4 Net 5 Gross / 2.5 Net # of Hz. DUCs Completed 2 Gross / 2.0 Net 3 Gross / 3.0 Net Avg. Daily Oil
ProductionAvg. Daily Equivalent Production% Oil Production 6.0 MBbls/d8.3 Mboe6/d73% 6.0 MBbls/d7.9 Mboe6/d75% Avg. Daily Equivalent Production 8.4 Mboe6/d 8.3-8.7 Mboe6/d Net Loss ($48.5)MM ($56.5)MM EBITDAXAdjusted
EBITDAX (Excl. Transx., Restr. Costs) $21.0MM$23.2MM $39.7MM$42.9MM Cash Flow from Operations (CFFO) $22.3MM $38.1MM D&C CapexReinvestment Rate of EBITDAX $9.1MM43% $17.1MM43% Unadjusted Free Cash
Flow $13.1MM $20.6MM Dividends on Common Stock% of EBITDAX $4.1MM20% $7.8MM20% CFFO Coverage of Capex + Dividends 1.7x 1.5x Net Leverage (Net Debt / LTM EBITDAX) 1.2x 1.2x Production on target and 9% over prior
quarter despite two major storms50% of Adjusted EBITDAX full-year guidance met halfway through fiscal year despite larger-weighted second halfCash Flow from Operations easily funded 100% of capex and dividends, with 1.7x coverage in latest
quarterRevolver balance unchanged from prior quarter at $97.5MM, or $87.4MM net of cash, or 1.2x LTM Adj. EBITDAXClean EHS record: zero regulatory reportable spills; zero employee and contractor OSHA recordable injuries; 35% reduction in
total flared gas Delivering on Capital Allocation Framework See Appendix for reconciliation of non-GAAP measures.
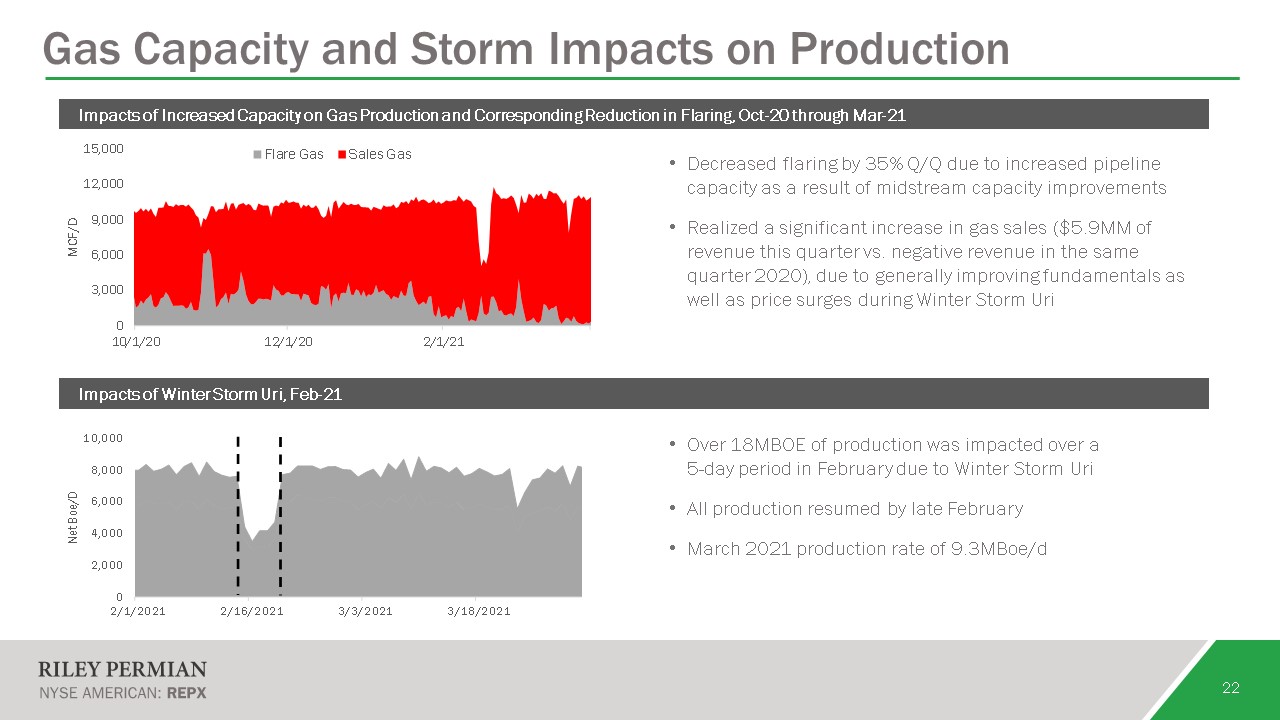
22 Gas Capacity and Storm Impacts on Production Decreased flaring by 35% Q/Q due to increased
pipeline capacity as a result of midstream capacity improvementsRealized a significant increase in gas sales ($5.9MM of revenue this quarter vs. negative revenue in the same quarter 2020), due to generally improving fundamentals as well as
price surges during Winter Storm Uri Impacts of Increased Capacity on Gas Production and Corresponding Reduction in Flaring, Oct-20 through Mar-21 Impacts of Winter Storm Uri, Feb-21 Over 18MBOE of production was impacted over a 5-day
period in February due to Winter Storm UriAll production resumed by late FebruaryMarch 2021 production rate of 9.3MBoe/d
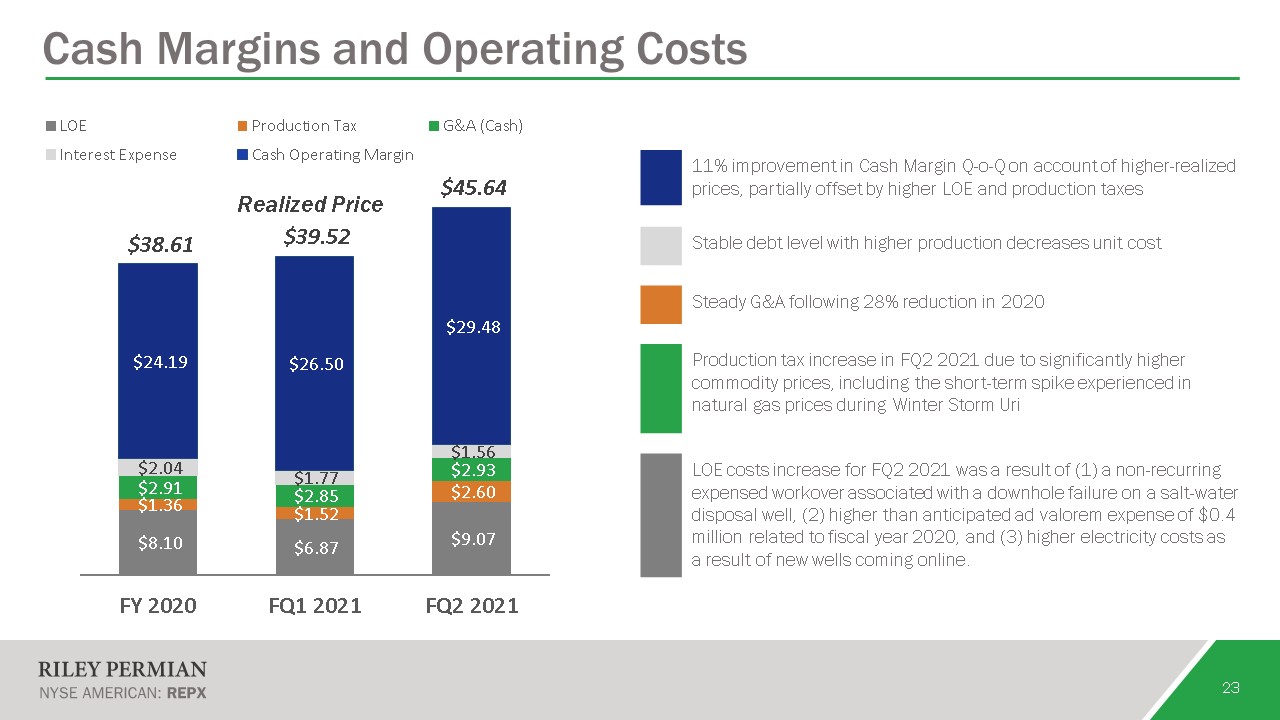
23 Cash Margins and Operating Costs 11% improvement in Cash Margin Q-o-Q on account of
higher-realized prices, partially offset by higher LOE and production taxes Stable debt level with higher production decreases unit cost Steady G&A following 28% reduction in 2020 Production tax increase in FQ2 2021
due to significantly higher commodity prices, including the short-term spike experienced in natural gas prices during Winter Storm Uri LOE costs increase for FQ2 2021 was a result of (1) a non-recurring expensed workover associated
with a downhole failure on a salt-water disposal well, (2) higher than anticipated ad valorem expense of $0.4 million related to fiscal year 2020, and (3) higher electricity costs as a result of new wells coming online. Realized Price
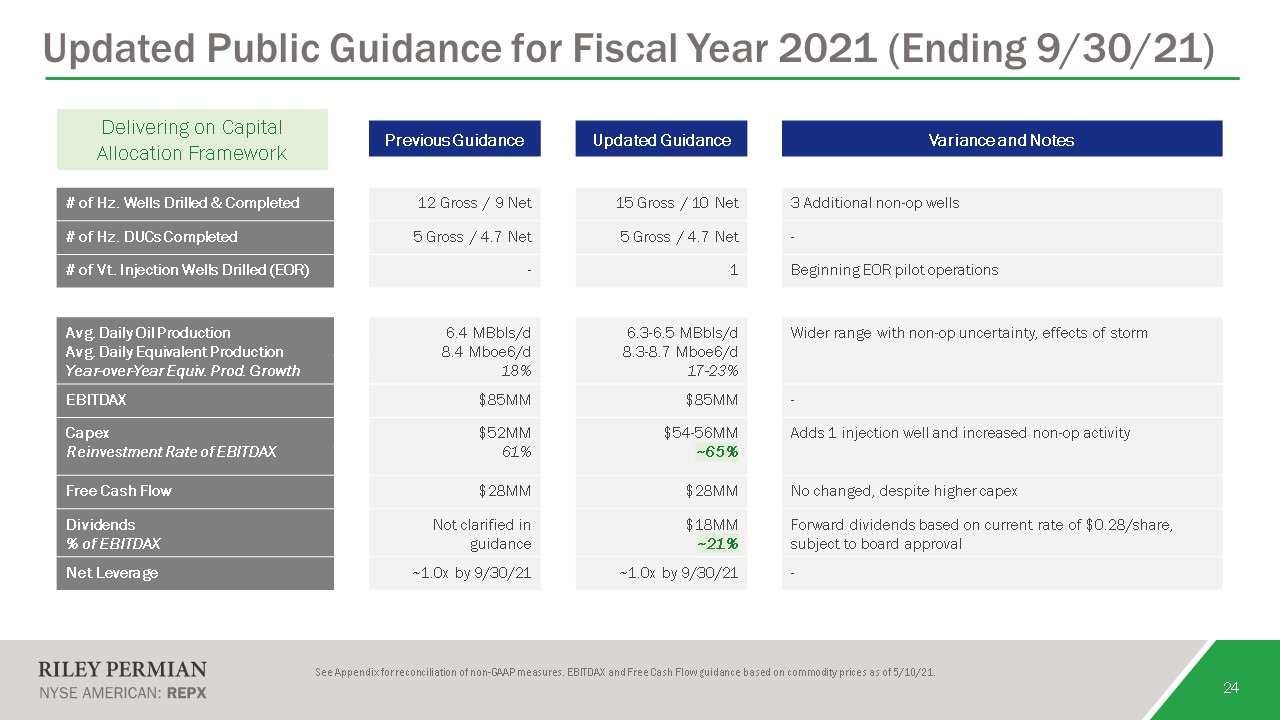
24 Updated Public Guidance for Fiscal Year 2021 (Ending 9/30/21) Ne Previous Guidance Updated
Guidance Variance and Notes # of Hz. Wells Drilled & Completed 12 Gross / 9 Net 15 Gross / 10 Net 3 Additional non-op wells # of Hz. DUCs Completed 5 Gross / 4.7 Net 5 Gross / 4.7 Net - # of Vt.
Injection Wells Drilled (EOR) - 1 Beginning EOR pilot operations Avg. Daily Oil ProductionAvg. Daily Equivalent ProductionYear-over-Year Equiv. Prod. Growth 6.4 MBbls/d8.4 Mboe6/d18% 6.3-6.5 MBbls/d8.3-8.7
Mboe6/d17-23% Wider range with non-op uncertainty, effects of storm Avg. Daily Equivalent Production 8.4 Mboe6/d 8.3-8.7 Mboe6/d EBITDAX $85MM $85MM - CapexReinvestment Rate of
EBITDAX $52MM61% $54-56MM~65% Adds 1 injection well and increased non-op activity Reinvestment Rate of EBITDA ##% 65% [TBD] Free Cash Flow $28MM $28MM No changed, despite higher capex Dividends% of EBITDAX Not
clarified in guidance $18MM~21% Forward dividends based on current rate of $0.28/share, subject to board approval Net Leverage ~1.0x by 9/30/21 ~1.0x by 9/30/21 - Delivering on Capital Allocation Framework See Appendix for
reconciliation of non-GAAP measures. EBITDAX and Free Cash Flow guidance based on commodity prices as of 5/10/21.
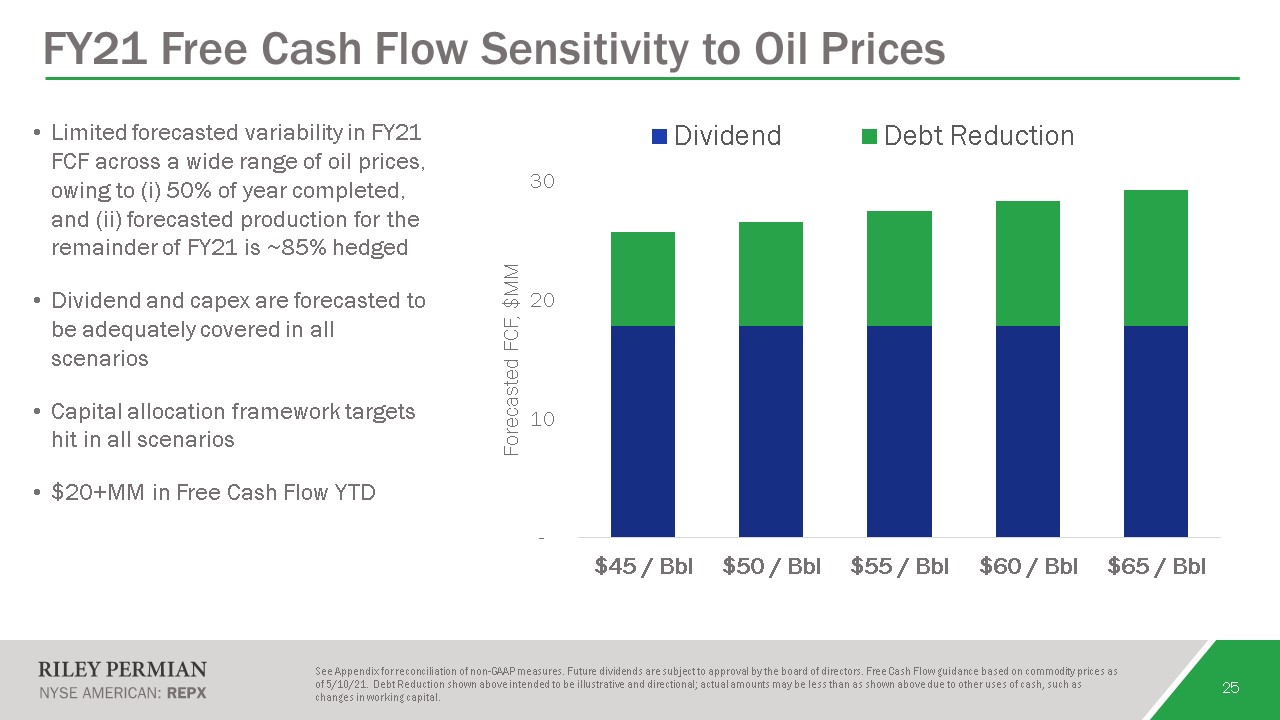
25 FY21 Free Cash Flow Sensitivity to Oil Prices Limited forecasted variability in FY21 FCF across a
wide range of oil prices, owing to (i) 50% of year completed, and (ii) forecasted production for the remainder of FY21 is ~85% hedgedDividend and capex are forecasted to be adequately covered in all scenarios Capital allocation framework
targets hit in all scenarios$20+MM in Free Cash Flow YTD See Appendix for reconciliation of non-GAAP measures. Future dividends are subject to approval by the board of directors. Free Cash Flow guidance based on commodity prices as of
5/10/21. Debt Reduction shown above intended to be illustrative and directional; actual amounts may be less than as shown above due to other uses of cash, such as changes in working capital.
Appendix 26 [ insert footnotes here ]
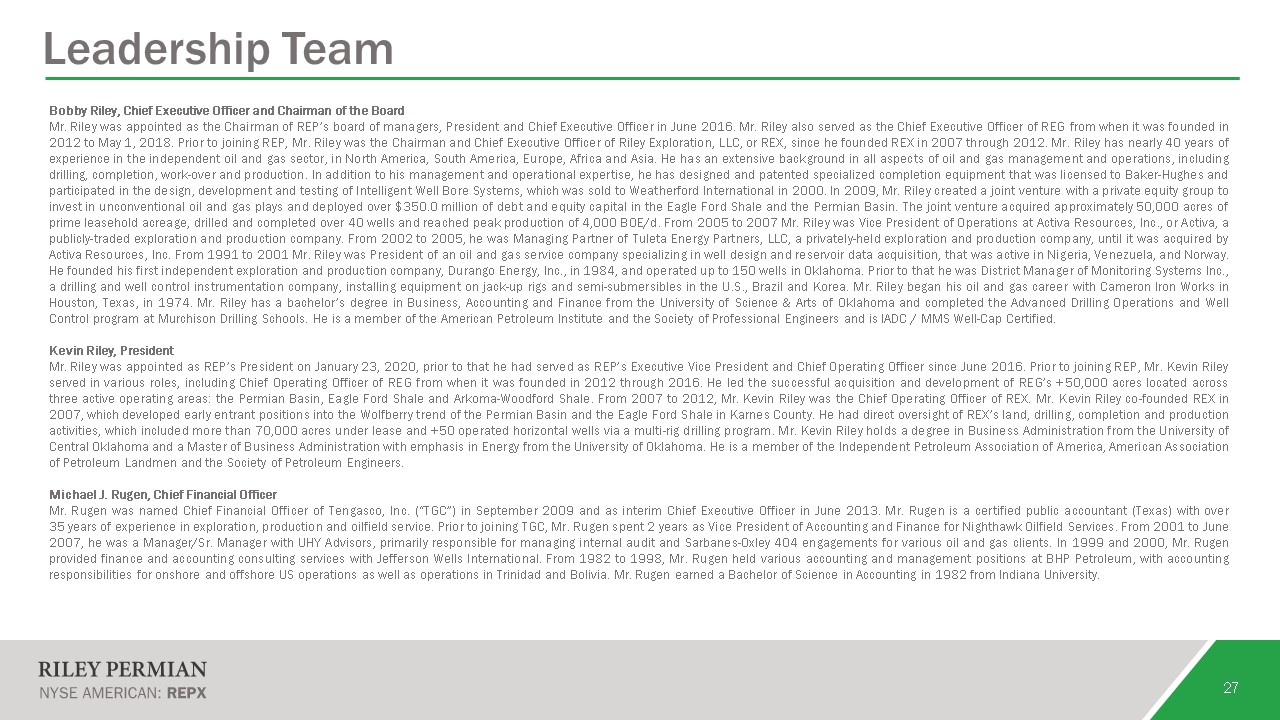
27 Leadership Team Bobby Riley, Chief Executive Officer and Chairman of the BoardMr. Riley was
appointed as the Chairman of REP’s board of managers, President and Chief Executive Officer in June 2016. Mr. Riley also served as the Chief Executive Officer of REG from when it was founded in 2012 to May 1, 2018. Prior to joining REP,
Mr. Riley was the Chairman and Chief Executive Officer of Riley Exploration, LLC, or REX, since he founded REX in 2007 through 2012. Mr. Riley has nearly 40 years of experience in the independent oil and gas sector, in North America, South
America, Europe, Africa and Asia. He has an extensive background in all aspects of oil and gas management and operations, including drilling, completion, work-over and production. In addition to his management and operational expertise, he
has designed and patented specialized completion equipment that was licensed to Baker-Hughes and participated in the design, development and testing of Intelligent Well Bore Systems, which was sold to Weatherford International in 2000. In
2009, Mr. Riley created a joint venture with a private equity group to invest in unconventional oil and gas plays and deployed over $350.0 million of debt and equity capital in the Eagle Ford Shale and the Permian Basin. The joint venture
acquired approximately 50,000 acres of prime leasehold acreage, drilled and completed over 40 wells and reached peak production of 4,000 BOE/d. From 2005 to 2007 Mr. Riley was Vice President of Operations at Activa Resources, Inc., or Activa,
a publicly-traded exploration and production company. From 2002 to 2005, he was Managing Partner of Tuleta Energy Partners, LLC, a privately-held exploration and production company, until it was acquired by Activa Resources, Inc. From 1991 to
2001 Mr. Riley was President of an oil and gas service company specializing in well design and reservoir data acquisition, that was active in Nigeria, Venezuela, and Norway. He founded his first independent exploration and production company,
Durango Energy, Inc., in 1984, and operated up to 150 wells in Oklahoma. Prior to that he was District Manager of Monitoring Systems Inc., a drilling and well control instrumentation company, installing equipment on jack-up rigs and
semi-submersibles in the U.S., Brazil and Korea. Mr. Riley began his oil and gas career with Cameron Iron Works in Houston, Texas, in 1974. Mr. Riley has a bachelor’s degree in Business, Accounting and Finance from the University of Science
& Arts of Oklahoma and completed the Advanced Drilling Operations and Well Control program at Murchison Drilling Schools. He is a member of the American Petroleum Institute and the Society of Professional Engineers and is IADC / MMS
Well-Cap Certified. Kevin Riley, PresidentMr. Riley was appointed as REP’s President on January 23, 2020, prior to that he had served as REP’s Executive Vice President and Chief Operating Officer since June 2016. Prior to joining REP,
Mr. Kevin Riley served in various roles, including Chief Operating Officer of REG from when it was founded in 2012 through 2016. He led the successful acquisition and development of REG’s +50,000 acres located across three active operating
areas: the Permian Basin, Eagle Ford Shale and Arkoma-Woodford Shale. From 2007 to 2012, Mr. Kevin Riley was the Chief Operating Officer of REX. Mr. Kevin Riley co-founded REX in 2007, which developed early entrant positions into the
Wolfberry trend of the Permian Basin and the Eagle Ford Shale in Karnes County. He had direct oversight of REX’s land, drilling, completion and production activities, which included more than 70,000 acres under lease and +50 operated
horizontal wells via a multi-rig drilling program. Mr. Kevin Riley holds a degree in Business Administration from the University of Central Oklahoma and a Master of Business Administration with emphasis in Energy from the University of
Oklahoma. He is a member of the Independent Petroleum Association of America, American Association of Petroleum Landmen and the Society of Petroleum Engineers.Michael J. Rugen, Chief Financial OfficerMr. Rugen was named Chief Financial
Officer of Tengasco, Inc. (“TGC”) in September 2009 and as interim Chief Executive Officer in June 2013. Mr. Rugen is a certified public accountant (Texas) with over 35 years of experience in exploration, production and oilfield service.
Prior to joining TGC, Mr. Rugen spent 2 years as Vice President of Accounting and Finance for Nighthawk Oilfield Services. From 2001 to June 2007, he was a Manager/Sr. Manager with UHY Advisors, primarily responsible for managing internal
audit and Sarbanes-Oxley 404 engagements for various oil and gas clients. In 1999 and 2000, Mr. Rugen provided finance and accounting consulting services with Jefferson Wells International. From 1982 to 1998, Mr. Rugen held various accounting
and management positions at BHP Petroleum, with accounting responsibilities for onshore and offshore US operations as well as operations in Trinidad and Bolivia. Mr. Rugen earned a Bachelor of Science in Accounting in 1982 from Indiana
University.
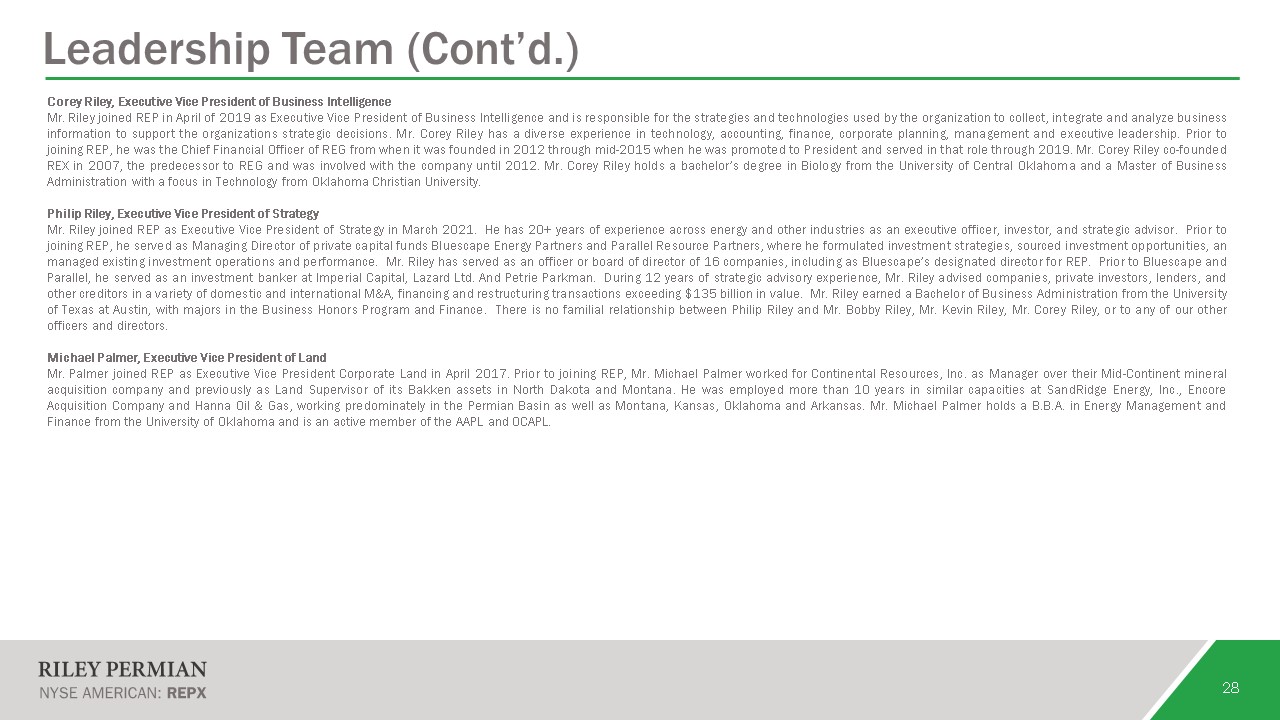
28 Leadership Team (Cont’d.) Corey Riley, Executive Vice President of Business IntelligenceMr. Riley
joined REP in April of 2019 as Executive Vice President of Business Intelligence and is responsible for the strategies and technologies used by the organization to collect, integrate and analyze business information to support the
organizations strategic decisions. Mr. Corey Riley has a diverse experience in technology, accounting, finance, corporate planning, management and executive leadership. Prior to joining REP, he was the Chief Financial Officer of REG from when
it was founded in 2012 through mid-2015 when he was promoted to President and served in that role through 2019. Mr. Corey Riley co-founded REX in 2007, the predecessor to REG and was involved with the company until 2012. Mr. Corey Riley holds
a bachelor’s degree in Biology from the University of Central Oklahoma and a Master of Business Administration with a focus in Technology from Oklahoma Christian University.Philip Riley, Executive Vice President of StrategyMr. Riley joined
REP as Executive Vice President of Strategy in March 2021. He has 20+ years of experience across energy and other industries as an executive officer, investor, and strategic advisor. Prior to joining REP, he served as Managing Director of
private capital funds Bluescape Energy Partners and Parallel Resource Partners, where he formulated investment strategies, sourced investment opportunities, an managed existing investment operations and performance. Mr. Riley has served as an
officer or board of director of 16 companies, including as Bluescape’s designated director for REP. Prior to Bluescape and Parallel, he served as an investment banker at Imperial Capital, Lazard Ltd. And Petrie Parkman. During 12 years of
strategic advisory experience, Mr. Riley advised companies, private investors, lenders, and other creditors in a variety of domestic and international M&A, financing and restructuring transactions exceeding $135 billion in value. Mr.
Riley earned a Bachelor of Business Administration from the University of Texas at Austin, with majors in the Business Honors Program and Finance. There is no familial relationship between Philip Riley and Mr. Bobby Riley, Mr. Kevin Riley,
Mr. Corey Riley, or to any of our other officers and directors.Michael Palmer, Executive Vice President of LandMr. Palmer joined REP as Executive Vice President Corporate Land in April 2017. Prior to joining REP, Mr. Michael Palmer worked for
Continental Resources, Inc. as Manager over their Mid-Continent mineral acquisition company and previously as Land Supervisor of its Bakken assets in North Dakota and Montana. He was employed more than 10 years in similar capacities at
SandRidge Energy, Inc., Encore Acquisition Company and Hanna Oil & Gas, working predominately in the Permian Basin as well as Montana, Kansas, Oklahoma and Arkansas. Mr. Michael Palmer holds a B.B.A. in Energy Management and Finance from
the University of Oklahoma and is an active member of the AAPL and OCAPL.
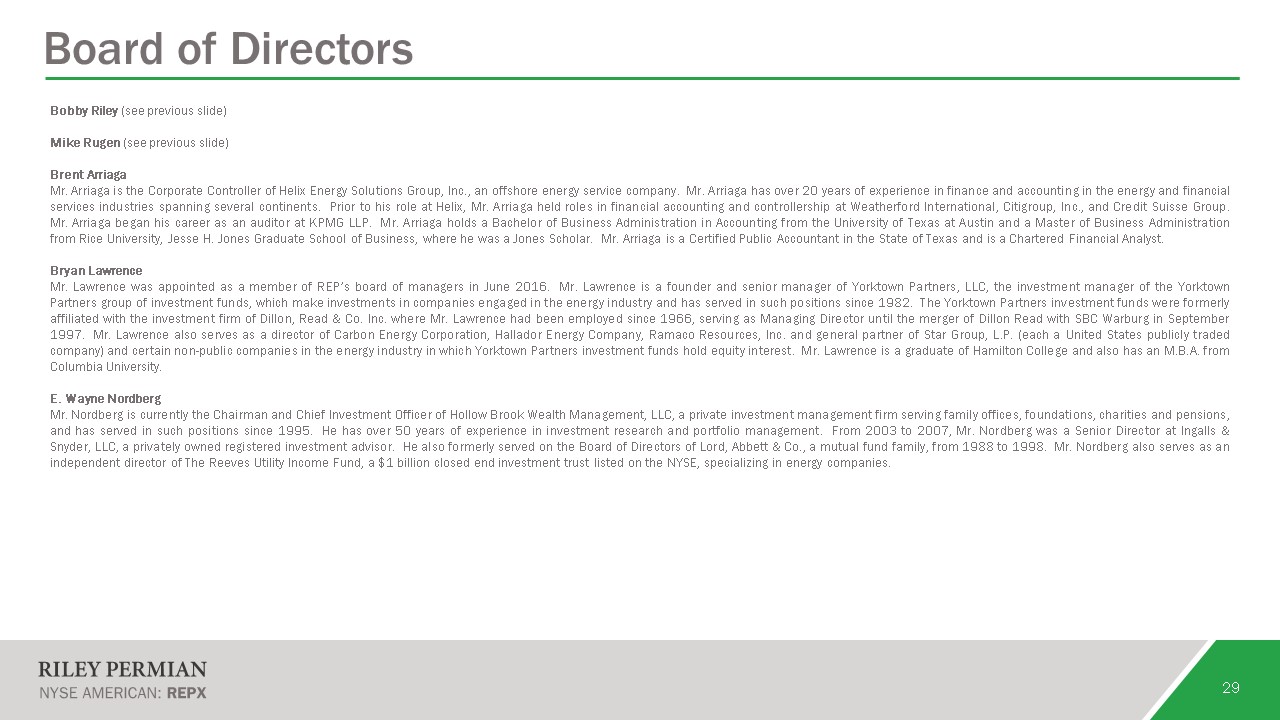
Board of Directors 29 Bobby Riley (see previous slide)Mike Rugen (see previous slide)Brent ArriagaMr.
Arriaga is the Corporate Controller of Helix Energy Solutions Group, Inc., an offshore energy service company. Mr. Arriaga has over 20 years of experience in finance and accounting in the energy and financial services industries spanning
several continents. Prior to his role at Helix, Mr. Arriaga held roles in financial accounting and controllership at Weatherford International, Citigroup, Inc., and Credit Suisse Group. Mr. Arriaga began his career as an auditor at KPMG LLP.
Mr. Arriaga holds a Bachelor of Business Administration in Accounting from the University of Texas at Austin and a Master of Business Administration from Rice University, Jesse H. Jones Graduate School of Business, where he was a Jones
Scholar. Mr. Arriaga is a Certified Public Accountant in the State of Texas and is a Chartered Financial Analyst.Bryan LawrenceMr. Lawrence was appointed as a member of REP’s board of managers in June 2016. Mr. Lawrence is a founder and
senior manager of Yorktown Partners, LLC, the investment manager of the Yorktown Partners group of investment funds, which make investments in companies engaged in the energy industry and has served in such positions since 1982. The Yorktown
Partners investment funds were formerly affiliated with the investment firm of Dillon, Read & Co. Inc. where Mr. Lawrence had been employed since 1966, serving as Managing Director until the merger of Dillon Read with SBC Warburg in
September 1997. Mr. Lawrence also serves as a director of Carbon Energy Corporation, Hallador Energy Company, Ramaco Resources, Inc. and general partner of Star Group, L.P. (each a United States publicly traded company) and certain non-public
companies in the energy industry in which Yorktown Partners investment funds hold equity interest. Mr. Lawrence is a graduate of Hamilton College and also has an M.B.A. from Columbia University.E. Wayne NordbergMr. Nordberg is currently the
Chairman and Chief Investment Officer of Hollow Brook Wealth Management, LLC, a private investment management firm serving family offices, foundations, charities and pensions, and has served in such positions since 1995. He has over 50 years
of experience in investment research and portfolio management. From 2003 to 2007, Mr. Nordberg was a Senior Director at Ingalls & Snyder, LLC, a privately owned registered investment advisor. He also formerly served on the Board of
Directors of Lord, Abbett & Co., a mutual fund family, from 1988 to 1998. Mr. Nordberg also serves as an independent director of The Reeves Utility Income Fund, a $1 billion closed end investment trust listed on the NYSE, specializing in
energy companies.
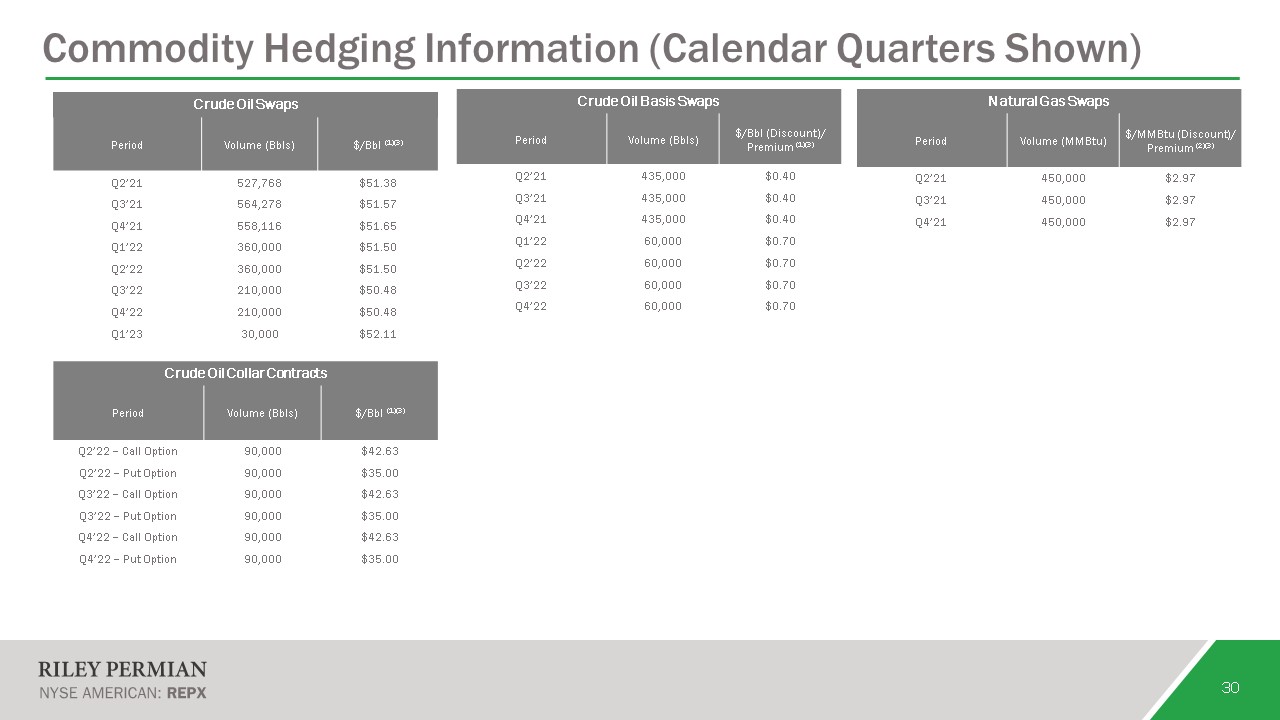
30 Commodity Hedging Information (Calendar Quarters Shown) Crude Oil Swaps Period Volume
(Bbls) $/Bbl (1)(3) Q2’21 527,768 $51.38 Q3’21 564,278 $51.57 Q4’21 558,116 $51.65 Q1’22 360,000 $51.50 Q2’22 360,000 $51.50 Q3’22 210,000 $50.48 Q4’22 210,000 $50.48 Q1’23 30,000 $52.11 Crude Oil Basis
Swaps Period Volume (Bbls) $/Bbl (Discount)/ Premium (1)(3) Q2’21 435,000 $0.40 Q3’21 435,000 $0.40 Q4’21 435,000 $0.40 Q1’22 60,000 $0.70 Q2’22 60,000 $0.70 Q3’22 60,000 $0.70 Q4’22 60,000 $0.70 Crude Oil Collar
Contracts Period Volume (Bbls) $/Bbl (1)(3) Q2’22 – Call Option 90,000 $42.63 Q2’22 – Put Option 90,000 $35.00 Q3’22 – Call Option 90,000 $42.63 Q3’22 – Put Option 90,000 $35.00 Q4’22 – Call Option 90,000 $42.63 Q4’22 –
Put Option 90,000 $35.00 Natural Gas Swaps Period Volume (MMBtu) $/MMBtu (Discount)/ Premium (2)(3) Q2’21 450,000 $2.97 Q3’21 450,000 $2.97 Q4’21 450,000 $2.97
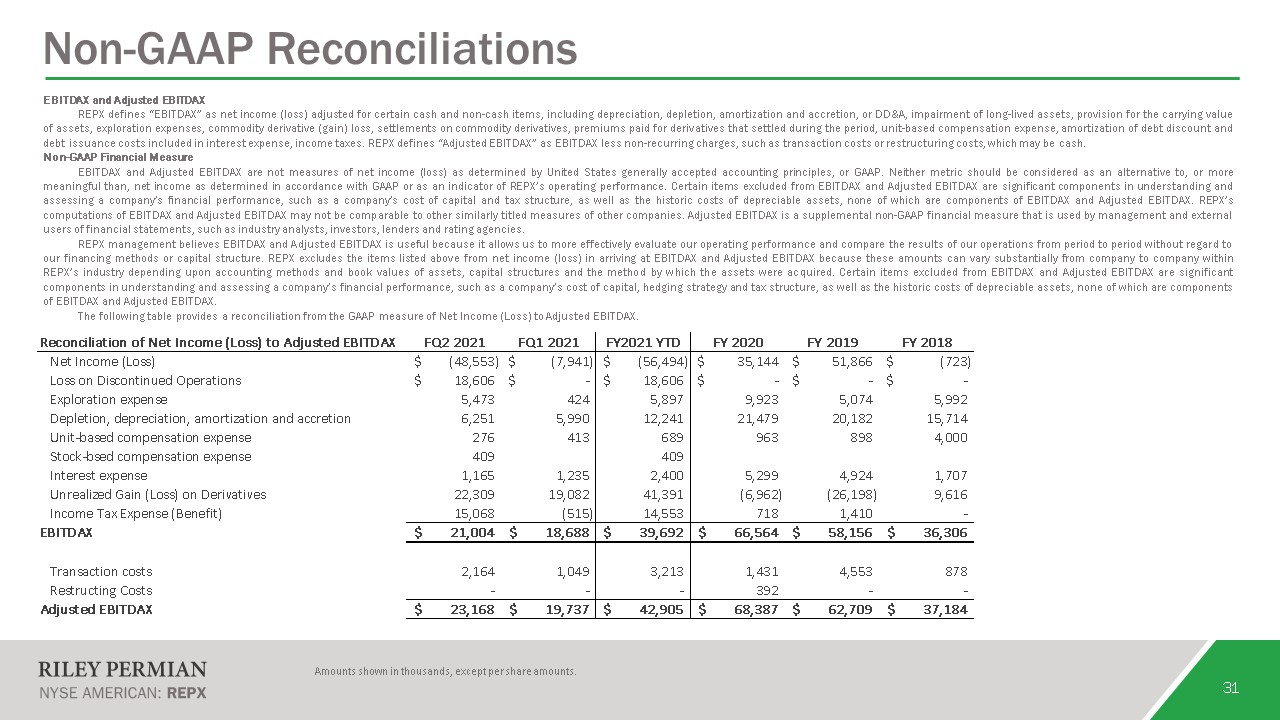
31 Non-GAAP Reconciliations EBITDAX and Adjusted EBITDAXREPX defines “EBITDAX” as net income (loss)
adjusted for certain cash and non-cash items, including depreciation, depletion, amortization and accretion, or DD&A, impairment of long-lived assets, provision for the carrying value of assets, exploration expenses, commodity derivative
(gain) loss, settlements on commodity derivatives, premiums paid for derivatives that settled during the period, unit-based compensation expense, amortization of debt discount and debt issuance costs included in interest expense, income
taxes. REPX defines “Adjusted EBITDAX” as EBITDAX less non-recurring charges, such as transaction costs or restructuring costs, which may be cash. Non-GAAP Financial MeasureEBITDAX and Adjusted EBITDAX are not measures of net income (loss) as
determined by United States generally accepted accounting principles, or GAAP. Neither metric should be considered as an alternative to, or more meaningful than, net income as determined in accordance with GAAP or as an indicator of REPX’s
operating performance. Certain items excluded from EBITDAX and Adjusted EBITDAX are significant components in understanding and assessing a company’s financial performance, such as a company’s cost of capital and tax structure, as well as the
historic costs of depreciable assets, none of which are components of EBITDAX and Adjusted EBITDAX. REPX’s computations of EBITDAX and Adjusted EBITDAX may not be comparable to other similarly titled measures of other companies. Adjusted
EBITDAX is a supplemental non-GAAP financial measure that is used by management and external users of financial statements, such as industry analysts, investors, lenders and rating agencies. REPX management believes EBITDAX and Adjusted
EBITDAX is useful because it allows us to more effectively evaluate our operating performance and compare the results of our operations from period to period without regard to our financing methods or capital structure. REPX excludes the
items listed above from net income (loss) in arriving at EBITDAX and Adjusted EBITDAX because these amounts can vary substantially from company to company within REPX’s industry depending upon accounting methods and book values of assets,
capital structures and the method by which the assets were acquired. Certain items excluded from EBITDAX and Adjusted EBITDAX are significant components in understanding and assessing a company’s financial performance, such as a company’s
cost of capital, hedging strategy and tax structure, as well as the historic costs of depreciable assets, none of which are components of EBITDAX and Adjusted EBITDAX. The following table provides a reconciliation from the GAAP measure of Net
Income (Loss) to Adjusted EBITDAX. Amounts shown in thousands, except per share amounts.
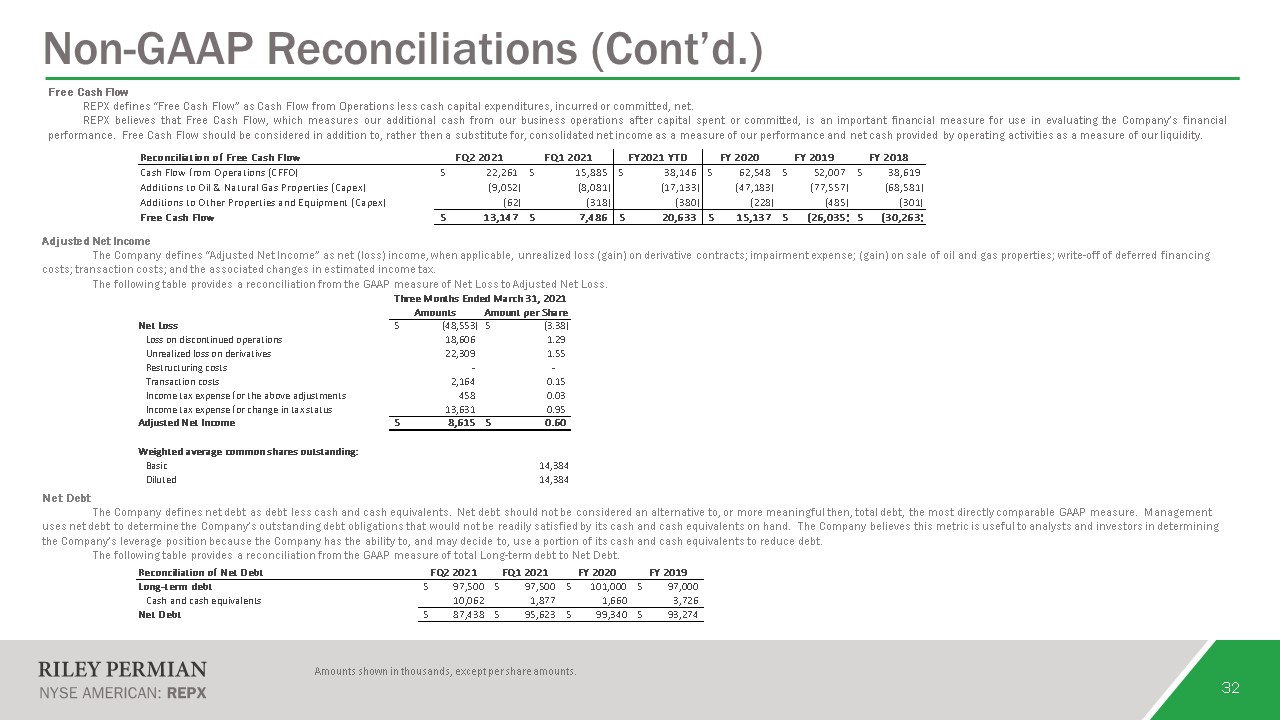
32 Non-GAAP Reconciliations (Cont’d.) Free Cash FlowREPX defines “Free Cash Flow” as Cash Flow from
Operations less cash capital expenditures, incurred or committed, net.REPX believes that Free Cash Flow, which measures our additional cash from our business operations after capital spent or committed, is an important financial measure for
use in evaluating the Company’s financial performance. Free Cash Flow should be considered in addition to, rather then a substitute for, consolidated net income as a measure of our performance and net cash provided by operating activities as
a measure of our liquidity. Adjusted Net Income The Company defines “Adjusted Net Income” as net (loss) income, when applicable, unrealized loss (gain) on derivative contracts; impairment expense; (gain) on sale of oil and gas properties;
write-off of deferred financing costs; transaction costs; and the associated changes in estimated income tax. The following table provides a reconciliation from the GAAP measure of Net Loss to Adjusted Net Loss. Net Debt The Company defines
net debt as debt less cash and cash equivalents. Net debt should not be considered an alternative to, or more meaningful then, total debt, the most directly comparable GAAP measure. Management uses net debt to determine the Company’s
outstanding debt obligations that would not be readily satisfied by its cash and cash equivalents on hand. The Company believes this metric is useful to analysts and investors in determining the Company’s leverage position because the Company
has the ability to, and may decide to, use a portion of its cash and cash equivalents to reduce debt. The following table provides a reconciliation from the GAAP measure of total Long-term debt to Net Debt. Amounts shown in thousands, except
per share amounts.
33 Forward-Looking Statements Forward-Looking Statements This presentation contains projections and
other forward-looking statements within the meaning of federal securities laws. These projections and statements reflect Riley Exploration Permian, Inc.’s (“Riley Permian”) current views with respect to future events and financial
performance. No assurances can be given, however, that these events will occur or that these projections will be achieved, and actual results could differ materially from those projected as a result of certain factors. A discussion of these
factors is included in Riley Permian’s periodic reports filed with the U.S. Securities and Exchange Commission (“SEC”). This presentation also contains Riley Permian’s updated capital expenditure and production guidance for 2021 and certain
forward-looking information with respect to 2022. The actual levels of production, capital expenditures, expenses and other estimates may be higher or lower than these estimates due to, among other things, uncertainty in drilling schedules,
changes in market demand, availability and cost of drilling rigs and other equipment, failure of wells to produce in line with historic performance or our expectations, and unanticipated delays in production. All statements, other than
historical facts, that address activities that Riley Permian assumes, plans, expects, believes, intends or anticipates (and other similar expressions) will, should or may occur in the future are forward-looking statements. The forward-looking
statements are based on management’s current beliefs, based on currently available information, as to the outcome and timing of future events, including the current adverse industry and macroeconomic conditions, commodity price volatility,
production levels, the impact of the recent presidential and congressional elections on energy and environmental policies and regulations, any other potential regulatory actions (including those that may impose production limits in the
Permian Basin), the impact and duration of the ongoing COVID-19 pandemic, acquisitions and sales of assets, future dividends, production, drilling and capital expenditure plans, severe weather conditions (including the impact of the recent
severe winter storms on production volumes), impact of impairment charges and effects of hedging arrangements. These forward-looking statements involve certain risks and uncertainties that could cause the results to differ materially from
those expected by the management of Riley Permian. These forward-looking statements involve significant risks and uncertainties that could cause actual results to differ materially from those anticipated, including, but not limited to, the
risk that Riley Permian may reduce, suspend or totally eliminate dividend payments in the future, whether variable or fixed, due to insufficient liquidity or other factors, potential adverse reactions or changes to the business or operations
of Riley Permian resulting from the recently completed merger, including Riley Permian’s future financial condition, results of operations, strategy and plans; changes in capital markets and the ability of Riley Permian to finance operations
in the manner expected; the risks of oil and gas activities; and the fact that operating costs and business disruption may be greater than expected following the consummation of the merger.Riley Permian encourages readers to consider the
risks and uncertainties associated with projections and other forward-looking statements. In addition, Riley Permian assumes no obligation to publicly revise or update any forward-looking statements based on future events or circumstances.
For additional discussion of the factors that may cause us not to achieve our financial projections and/or production estimates, see Riley Permian’s filings with the SEC, including its forms 10-K, 10-Q and 8-K and any amendments thereto. We
do not undertake any obligation to release publicly the results of any future revisions we may make to this prospective data or to update this prospective data to reflect events or circumstances after the date of this presentation. Therefore,
you are cautioned not to place undue reliance on this information. None of the information contained in this presentation has been audited by any independent auditor. This presentation is prepared as a convenience for securities analysts and
investors and may be useful as a reference tool. Riley Permian may elect to modify the format or discontinue publication at any time, without notice to securities analysts or investors. Use of non-GAAP Financial Information This presentation
includes certain financial measures that are not calculated in accordance with U.S. generally accepted accounting principles (“GAAP”). These measures include (i) EBITDA, (ii) Adjusted EBITDA, (iii) Net Debt, (iv) Free Cash Flow and (v) PV-10.
These non-GAAP financial measures are not measures of financial performance prepared or presented in accordance with GAAP and may exclude items that are significant in understanding and assessing our financial results. Therefore, these
measures should not be considered in isolation, and users of any such information should not place undue reliance thereon. See the Appendix for the descriptions and reconciliations of these non-GAAP measures presented in this presentation to
the most directly comparable financial measures calculated in accordance with GAAP. Riley Permian is unable to provide a reconciliation of non-GAAP financial measures contained in this presentation that are presented on a forward-looking
basis because Riley Permian is unable, without unreasonable efforts, to estimate and quantify the most directly comparable GAAP components, largely because predicting future operating results is subject to many factors outside of Riley
Permian's control and not readily predictable and that are not part of Riley Permian's routine operating activities, including various domestic and international economic, regulatory, political and legal factors. Oil & Gas Reserves The
SEC generally permits oil and natural gas companies, in filings made with the SEC, to disclose proved reserves, which are reserve estimates that geological and engineering data demonstrate with reasonable certainty to be recoverable in future
years from known reservoirs under existing economic and operating conditions, and certain probable and possible reserves that meet the SEC’s definitions for such terms. In this presentation, Riley Permian may use the terms “resource
potential,” “resource play,” “estimated ultimate recovery,” or “EURs,” “type curve” and “standardized measure,” each of which the SEC guidelines restrict from being included in filings with the SEC without strict compliance with SEC
definitions. These terms refer to Riley Permian’s internal estimates of unbooked hydrocarbon quantities that may be potentially discovered through exploratory drilling or recovered with additional drilling or recovery techniques. “Resource
potential” is used by Riley Permian to refer to the estimated quantities of hydrocarbons that may be added to proved reserves, largely from a specified resource play potentially supporting numerous drilling locations. A “resource play” is a
term used by Riley Permian to describe an accumulation of hydrocarbons known to exist over a large areal expanse and/or thick vertical section potentially supporting numerous drilling locations, which, when compared to a conventional play,
typically has a lower geological and/or commercial development risk. “EURs” are based on Riley Permian’s previous operating experience in a given area and publicly available information relating to the operations of producers who are
conducting operations in these areas. Unbooked resource potential or “EURs” do not constitute reserves within the meaning of the Society of Petroleum Engineer’s Petroleum Resource Management System or SEC rules and do not include any proved
reserves. Actual quantities of reserves that may be ultimately recovered from Riley Permian’s interests may differ substantially from those presented herein. Factors affecting ultimate recovery include the scope of Riley Permian’s ongoing
drilling program, which will be directly affected by the availability of capital, decreases in oil, natural gas liquids and natural gas prices, well spacing, drilling and production costs, availability and cost of drilling services and
equipment, lease expirations, transportation constraints, regulatory approvals, negative revisions to reserve estimates and other factors, as well as actual drilling results, including geological and mechanical factors affecting recovery
rates. “EURs” from reserves may change significantly as development of Riley Permian’s core assets provides additional data. In addition, Riley Permian’s production forecasts and expectations for future periods are dependent upon many
assumptions, including estimates of production decline rates from existing wells and the undertaking and outcome of future drilling activity, which may be affected by significant commodity price declines or drilling cost increases. “Type
curve” refers to a production profile of a well, or a particular category of wells, for a specific play and/or area. The “standardized measure” of discounted future new cash flows is calculated in accordance with SEC regulations and a
discount rate of 10%. Actual results may vary considerably and should not be considered to represent the fair market value of Riley Permian’s proved reserves.