Document
false0001281761false 0001281761 2020-10-20 2020-10-20 0001281761 us-gaap:SeriesAPreferredStockMember 2020-10-20 2020-10-20 0001281761 us-gaap:SeriesBPreferredStockMember 2020-10-20 2020-10-20 0001281761 us-gaap:CommonStockMember 2020-10-20 2020-10-20 0001281761 us-gaap:SeriesCPreferredStockMember 2020-10-20 2020-10-20


UNITED STATES
SECURITIES AND EXCHANGE COMMISSION
Washington, DC 20549
  FORM 8-K
 CURRENT REPORT
PURSUANT TO SECTION 13 OR 15(d) OF
THE SECURITIES EXCHANGE ACT OF 1934
Date of Report (Date of earliest event reported): October 20, 2020
 REGIONS FINANCIAL CORPORATION
(Exact name of registrant as specified in its charter)
Delaware
 
001-34034
 
63-0589368
(State or other jurisdiction
of incorporation)
 
(Commission
File Number)
 
(IRS Employer
Identification No.)
1900 Fifth Avenue North
Birmingham, Alabama 35203
(Address, including zip code, of principal executive office)
Registrant’s telephone number, including area code: (800734-4667
Check the appropriate box below if the Form 8-K filing is intended to simultaneously satisfy the filing obligation of the registrant under any of the following provisions:
Written communication pursuant to Rule 425 under the Securities Act (17 CFR 230.425)
Soliciting material pursuant to Rule 14a-12 under the Exchange Act (17 CFR 240.14a-12)
Pre-commencement communications pursuant to Rule 14d-2(b) under the Exchange Act (17 CFR 240.14d-2(b))
Pre-commencement communications pursuant to Rule 13e-4(c) under the Exchange Act (17 CFR 240.13e-4(c))
Indicate by check mark whether the registrant is an emerging growth company as defined in Rule 405 of the Securities Act of 1933 (17 CFR 230.405) or Rule 12b-2 of the Securities Exchange Act of 1934 (17 CFR 240.12b-2).                                                         Emerging growth company
If an emerging growth company, indicate by check mark if the registrant has elected not to use the extended transition period for complying with any new or revised financial accounting standards provided pursuant to Section 13(a) of the Exchange Act.¨
Securities registered pursuant to Section 12(b) of the Act:
Title of each class
Trading Symbol(s)
Name of each exchange on which registered
Common Stock, $.01 par value
RF
New York Stock Exchange
Depositary Shares, each representing a 1/40th Interest in a Share of
 
 
6.375% Non-Cumulative Perpetual Preferred Stock, Series A
RF PRA
New York Stock Exchange
Depositary Shares, each representing a 1/40th Interest in a Share of
 
 
6.375% Fixed-to-Floating Rate Non-Cumulative Perpetual Preferred Stock, Series B
RF PRB
New York Stock Exchange
Depositary Shares, each representing a 1/40th Interest in a Share of
 
 
5.700% Fixed-to-Floating Rate Non-Cumulative Perpetual Preferred Stock, Series C
RF PRC
New York Stock Exchange


Item 2.02    Results of Operations and Financial Condition.
Item 7.01    Regulation FD Disclosure.
On October 20, 2020, Regions Financial Corporation (“Regions”) will issue a press release announcing its preliminary results of operations for the quarter ended September 30, 2020. A copy of the press release is attached hereto as Exhibit 99.1. Supplemental financial information for the quarter ended September 30, 2020 is attached as Exhibit 99.2. Executives from Regions will review the results via a live audio webcast at 11 a.m. Eastern time on October 20, 2020. A copy of a visual presentation that will be a part of that review is attached as Exhibit 99.3. All of the attached exhibits are incorporated herein by reference and may also be found on Regions' website at www.regions.com. An archived recording of the webcast will be available for a limited time on the Investor Relations page of that website.
    
In accordance with general instruction B.2 of Form 8-K, this information is being furnished and shall not be deemed filed for purposes of Section 18 of the Securities Exchange Act of 1934.


Item 9.01    Financial Statements and Exhibits.
(d) Exhibits
 
Exhibit No.     Description of Exhibit
99.1

  
99.2

  
99.3


SIGNATURES
Pursuant to the requirements of the Securities Exchange Act of 1934, the registrant has duly caused this report to be signed on its behalf by the undersigned hereunto duly authorized.


REGIONS FINANCIAL CORPORATION
 
 
By:
 
/s/ Hardie B. Kimbrough, Jr.
Name:
 
Hardie B. Kimbrough, Jr.
Title:
 
Executive Vice President and Controller (Chief Accounting Officer and Authorized Officer)
Date: October 19, 2020


newsrelease_logoa73.jpgExhibit 99.1
  
Media Contact:


Investor Relations Contact:
Evelyn Mitchell


Dana Nolan
(205) 264-4551


(205) 264-7040

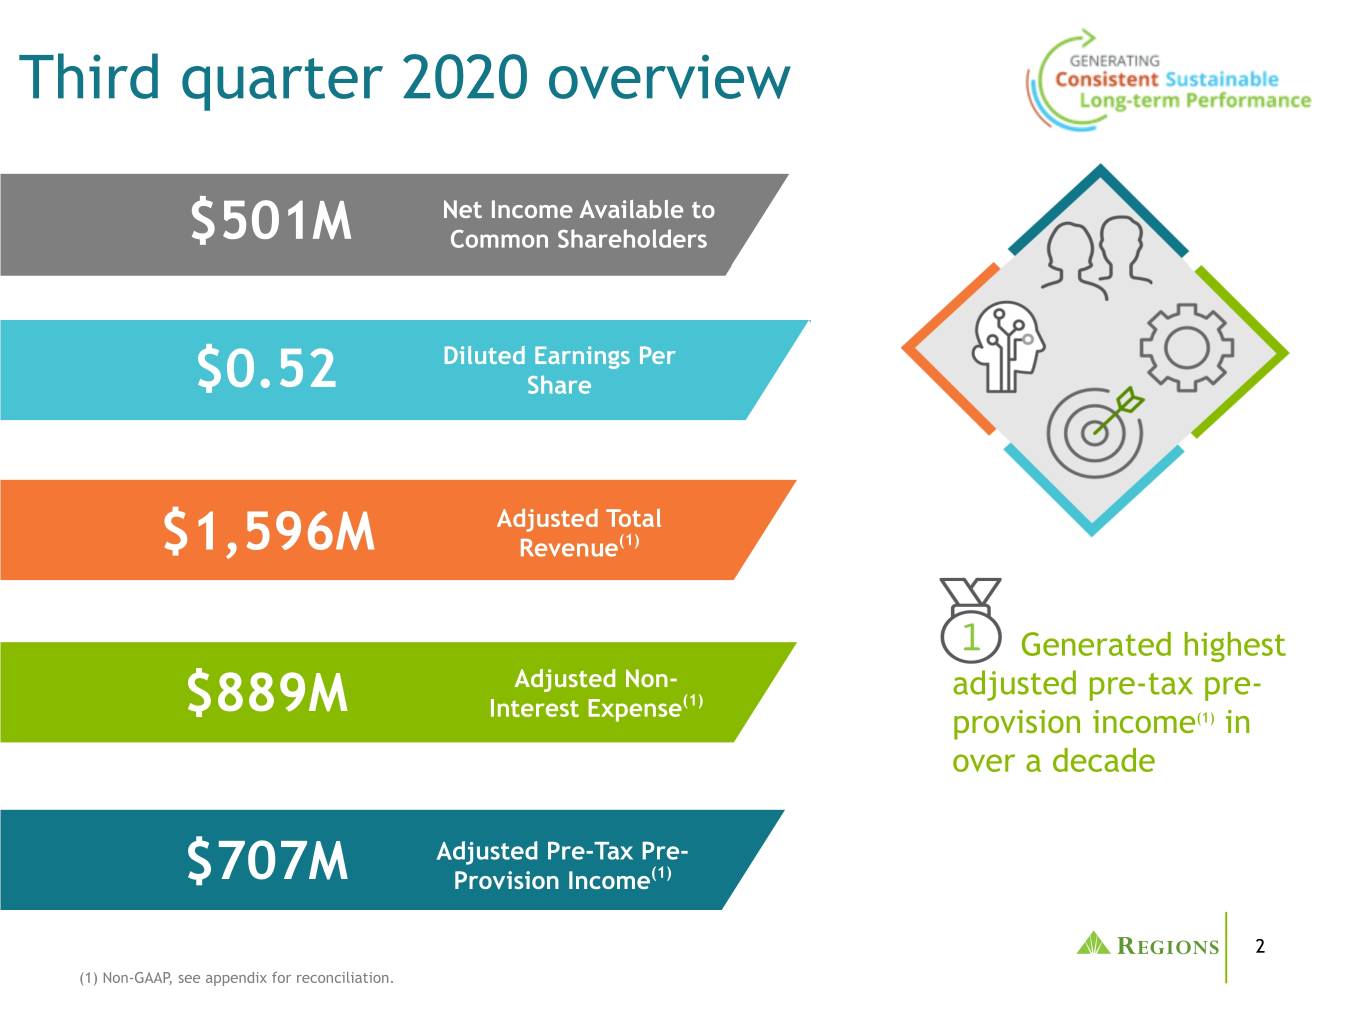
Regions reports third quarter 2020 earnings of $501 million, up 30 percent over the prior year, and earnings per share of $0.52, up 33 percent
Delivers strong revenue and pre-tax pre-provision income(1) growth over the prior year  

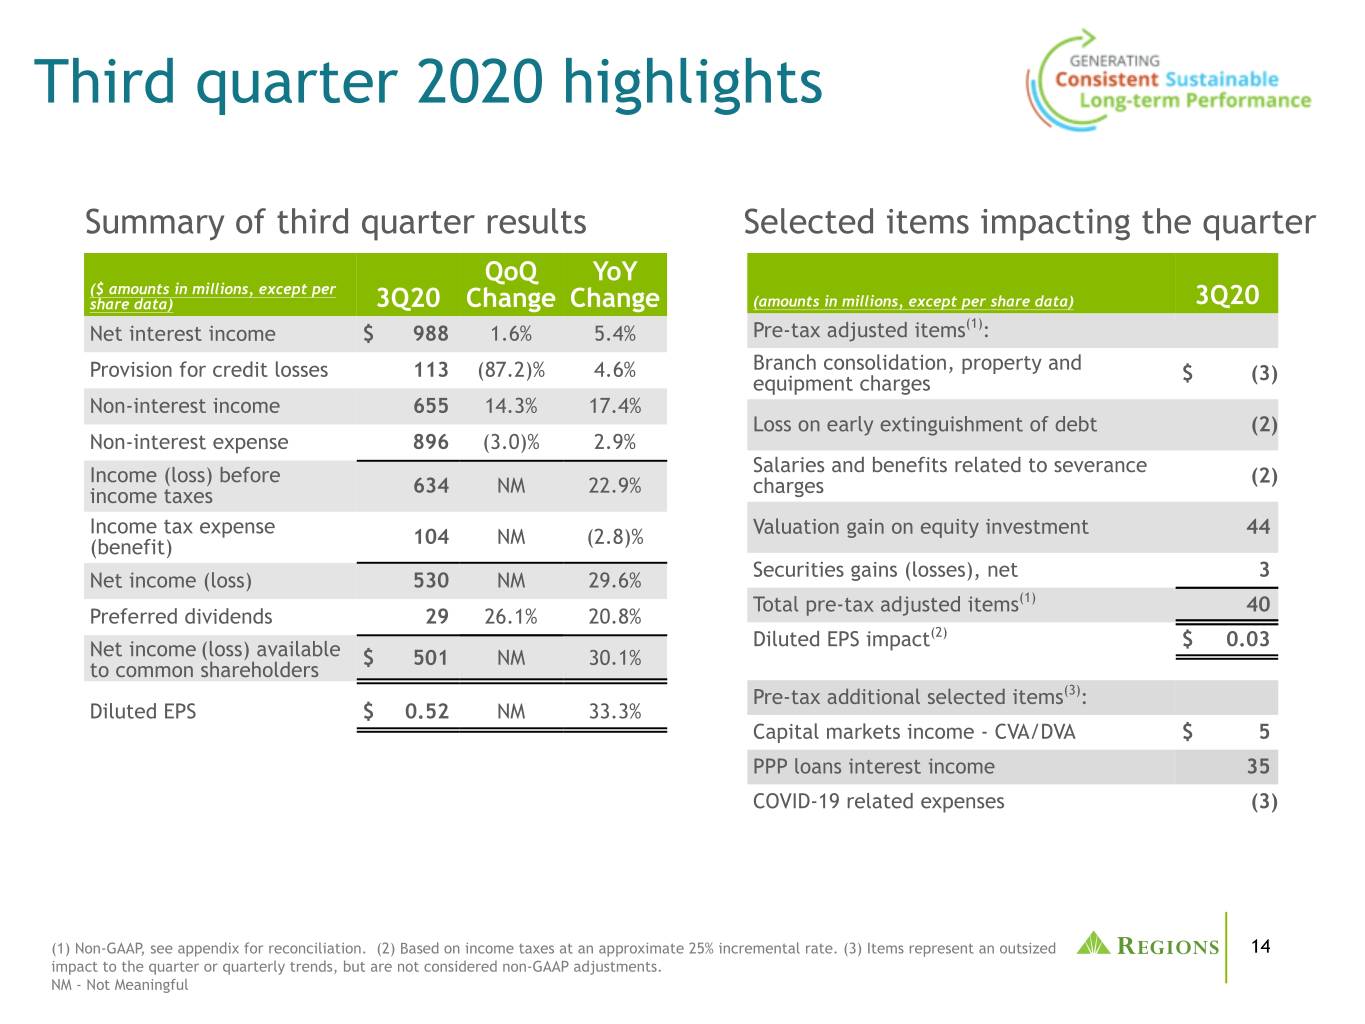
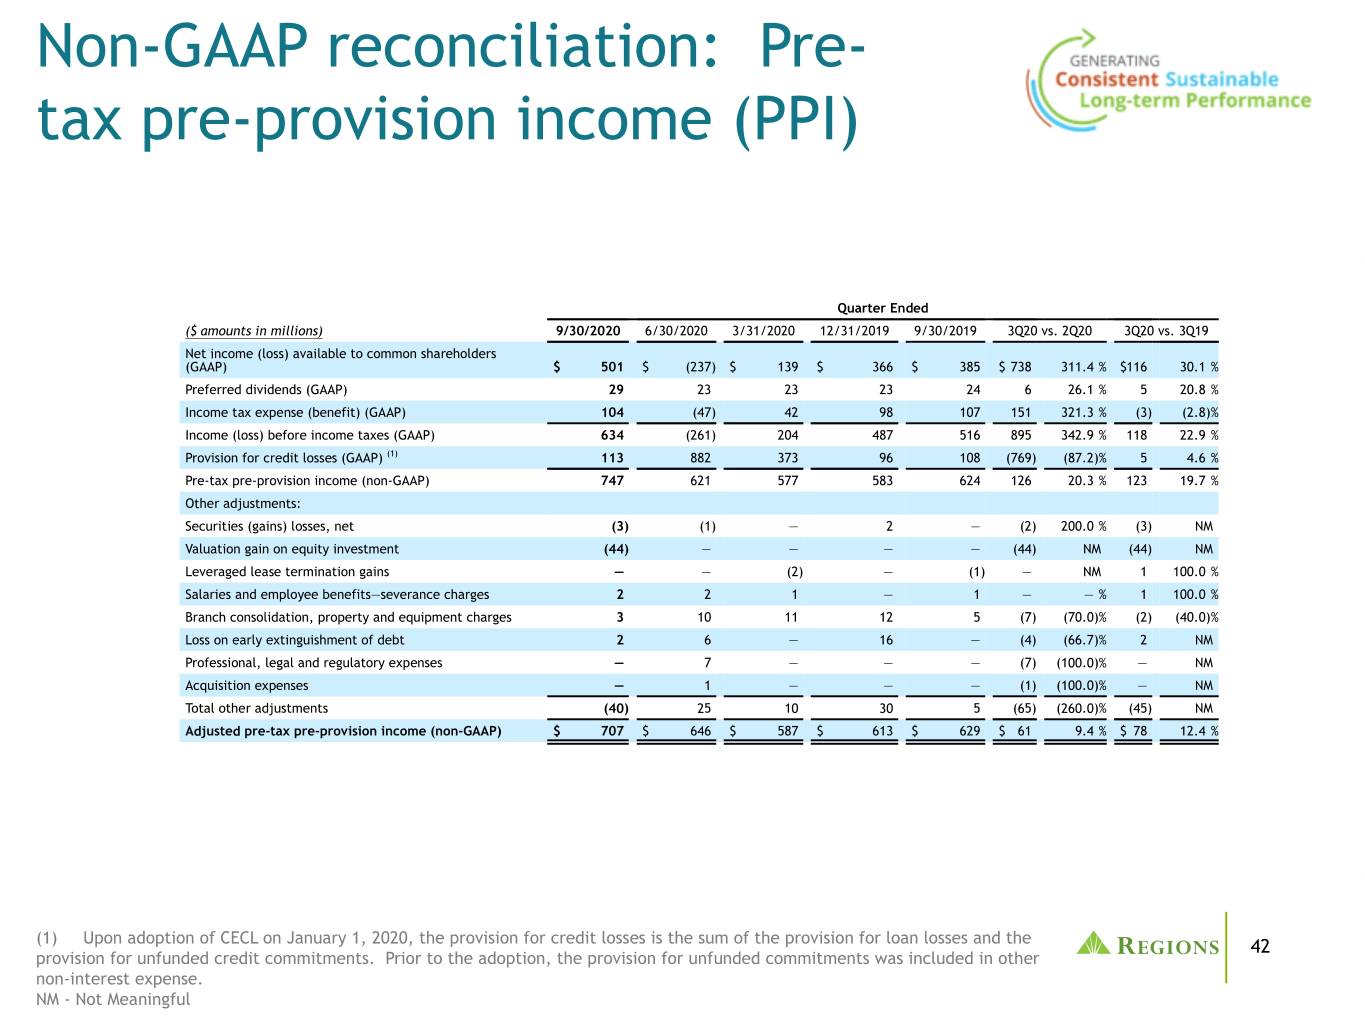
BIRMINGHAM, Ala. - (BUSINESS WIRE) - October 20, 2020 - Regions Financial Corporation (NYSE:RF) today announced earnings for the third quarter ended September 30, 2020. The company reported net income available to common shareholders of $501 million, an increase of 30 percent compared to the third quarter of 2019. Earnings per diluted share were $0.52, a 33 percent increase. Total revenue grew 10 percent while pre-tax pre-provision income(1) increased 20 percent over the prior year. Adjusted revenue(1) grew 7 percent while adjusted pre-tax pre-provision income(1) increased 12 percent. The company also generated year-to-date positive operating leverage of 2.4 percent on a reported basis and 2.0 percent on an adjusted basis(1) versus the comparable prior year period.

"This quarter our team delivered strong results during a period of continued uncertainty by staying focused on meeting customer needs, controlling expenses and proactively managing both credit risk and interest rate risk," said John Turner, president and CEO. "We generated our highest adjusted pre-tax pre-provision income(1) in over a decade while improving our adjusted efficiency ratio(1) to its lowest level since 2008."

"The COVID-19 pandemic has accelerated changes in customer behavior and we continue to invest in talented bankers to provide valuable advice and guidance while modernizing our branch network and accelerating digital transformation," continued Turner. "Our efforts to adapt our mobile and online banking platforms to meet customer needs were recently recognized by J.D. Power and our customers who ranked us first among regional banks for online banking satisfaction and second for highest mobile app satisfaction. By executing our strategic plan we will continue to be a source of economic strength for our customers and communities and will deliver sustainable, long-term performance for our shareholders."


1


SUMMARY OF THIRD QUARTER 2020 RESULTS:


Quarter Ended
(amounts in millions, except per share data)

9/30/2020

6/30/2020

9/30/2019
Net income (loss)

$
530


$
(214
)

$
409

Preferred dividends

29


23


24

Net income (loss) available to common shareholders

$
501


$
(237
)

$
385


Weighted-average diluted shares outstanding

962


960


991

Actual shares outstanding—end of period

960


960


964


Diluted earnings (loss) per common share

$
0.52


$
(0.25
)

$
0.39


Selected items impacting earnings:


Pre-tax adjusted items(1):


Branch consolidation, property and equipment charges

$
(3
)

$
(10
)

$
(5
)
Loss on early extinguishment of debt

(2
)

(6
)


Salaries and benefits related to severance charges

(2
)

(2
)

(1
)
Professional and related fees associated with the purchase of Ascentium Capital


(8
)
 

Valuation gain on equity investment
 
44


Securities gains (losses), net

3


1


Leveraged lease termination gains


1

Total pre-tax adjusted items(1)

$
40


$
(25
)

$
(5
)


Diluted EPS impact*
 
$
0.03

 
$
(0.02
)
 
$


Pre-tax additional selected items**:


CECL provision in excess of net charge-offs***

$


$
(700
)

$

Capital markets income - CVA/DVA

5


34


(6
)
MSR net hedge performance


2


15

PPP loans interest income****
 
35

 
20


COVID-19 related expenses
 
(3
)
 
(19
)
 

Total pre-tax additional selected items**

$
37


$
(663
)

$
9

*
Based on income taxes at an approximate 25% incremental rate. Tax rates associated with leveraged lease terminations are incrementally higher based on their structure.
**
Items represent an outsized impact to the quarter or quarterly trends, but are not considered non-GAAP adjustments.
***
CECL was adopted January 1, 2020. Periods prior to January 1, 2020 reflect results under the incurred loss model.
**** 2nd quarter PPP loans interest income has been revised to remove estimated funding costs.

During the third quarter of 2020, total revenue increased approximately 6 percent on a reported basis and 3 percent on an adjusted basis(1) compared to the second quarter of 2020, reflecting growth in both net interest income and non-interest income. Despite lower market interest rates, net interest income benefited from the company's significant hedging program, stronger than anticipated deposit growth, a modest increase in the securities portfolio, and one extra day in the quarter. Non-interest income benefited from continued strong mortgage production and capital markets activity, as well as improvement in service charges and card and ATM

2


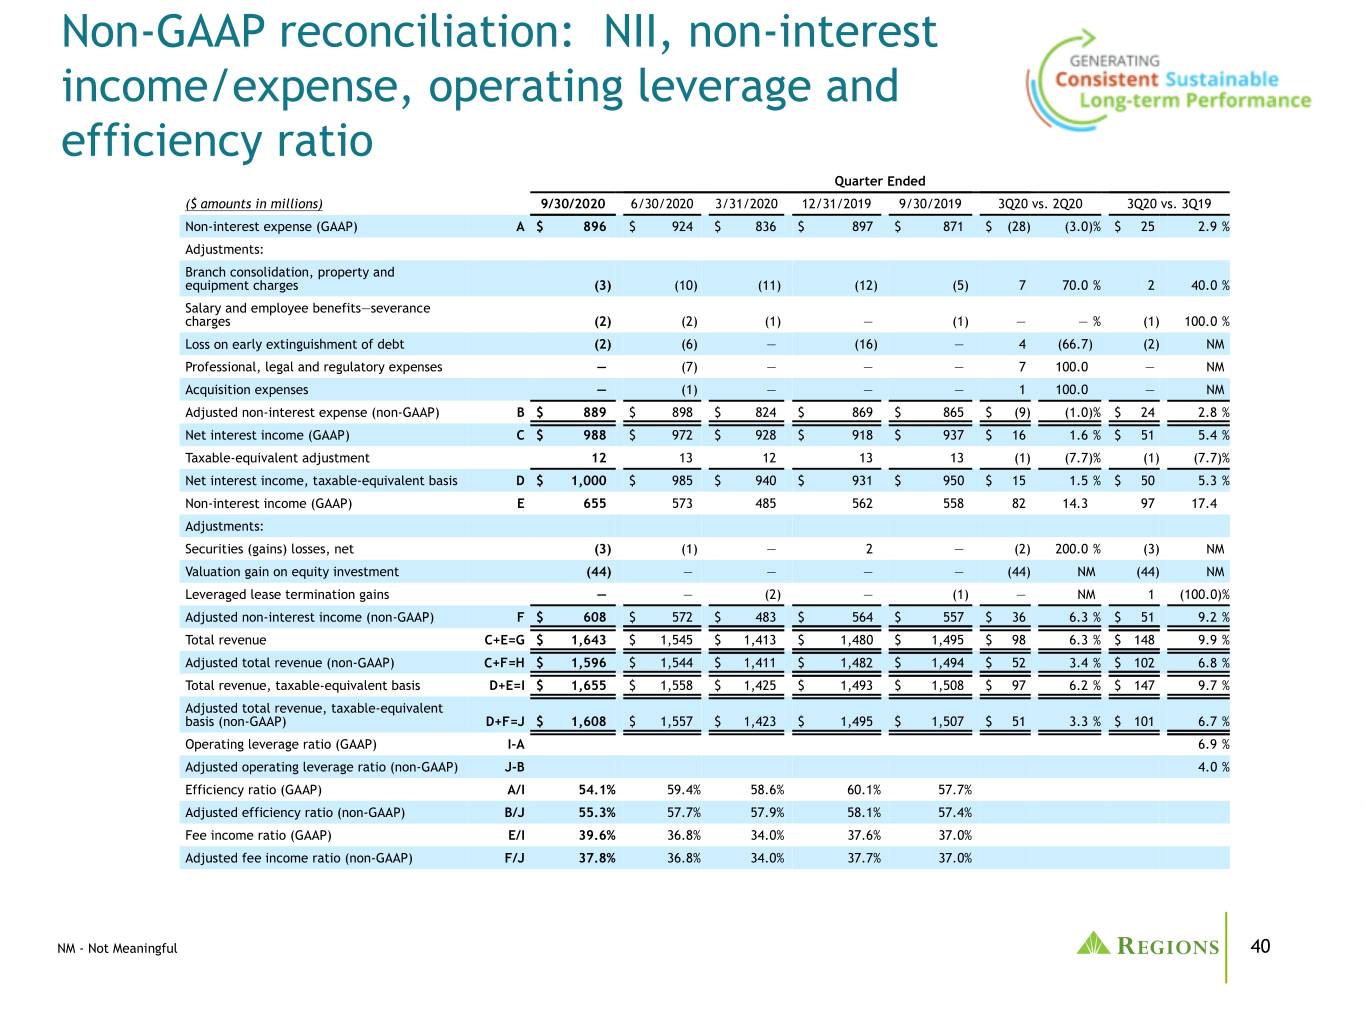
fees. Non-interest expense decreased 3 percent during the quarter on a reported basis and 1 percent on an adjusted basis(1), driven by decreases in professional fees, FDIC insurance assessments, and expenses related to the COVID-19 pandemic. Despite a challenging economic backdrop, pre-tax pre-provision income(1) increased 20 percent, and adjusted pre-tax pre-provision income(1) increased 9 percent, in each case, versus the prior quarter. The company's third quarter efficiency ratio improved to 54.1 percent on a reported basis and 55.3 percent on an adjusted basis(1); its lowest level in over twelve years.

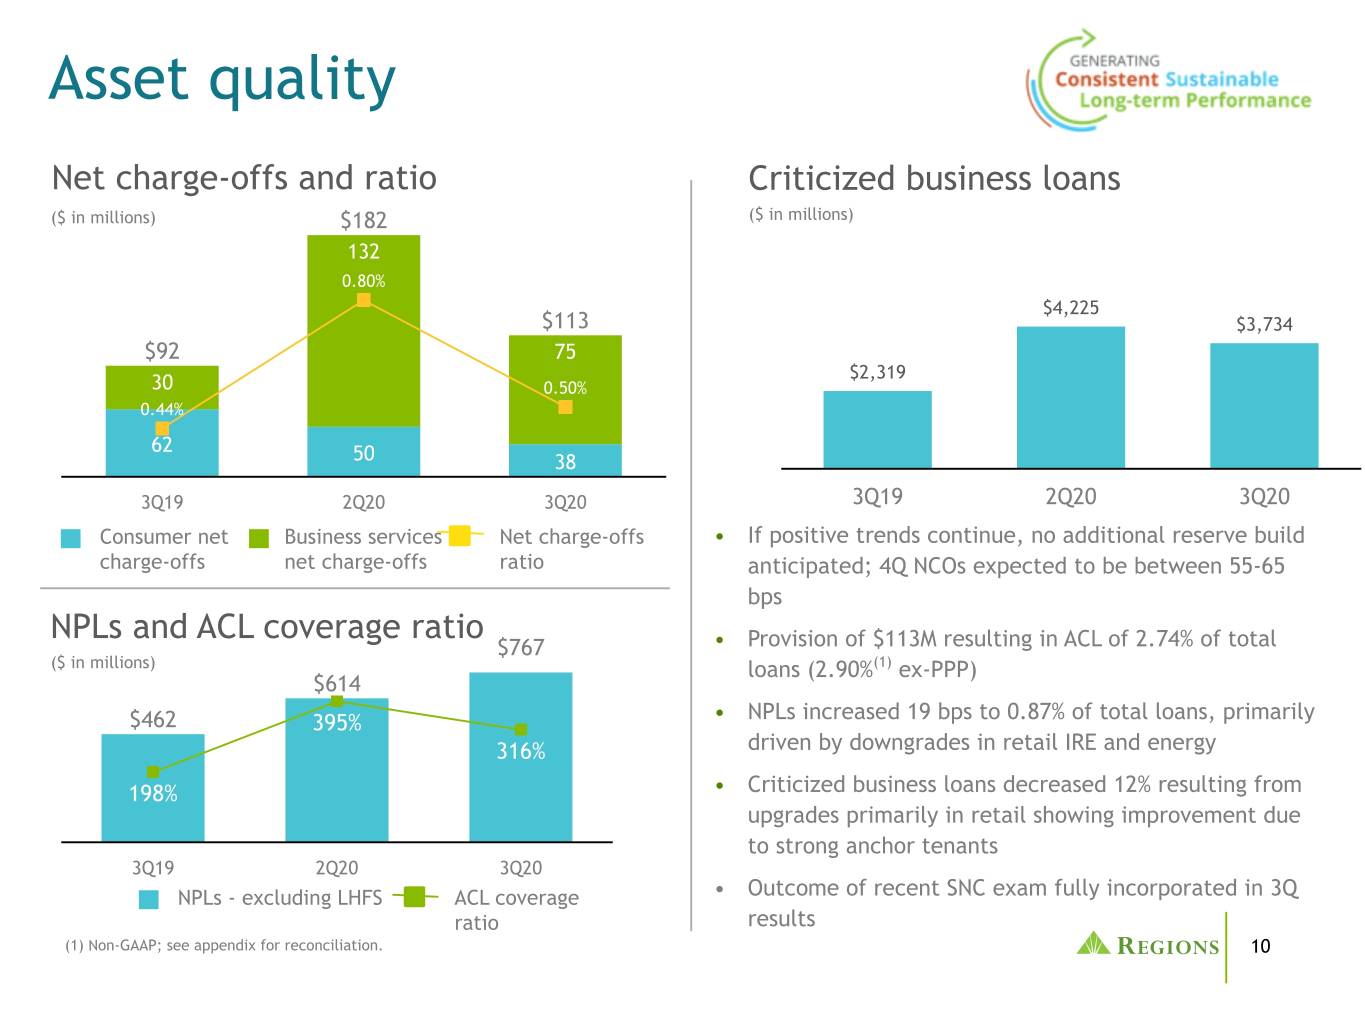
During the third quarter, the credit loss provision totaled $113 million reflecting continued economic risk in certain portfolios, the impact of net charge-offs and reductions in loan balances. Compared to the second quarter of 2020, annualized net charge-offs decreased 30 basis points to 0.50 percent of average loans, while total non-performing loans increased 19 basis points to 0.87 percent of total loans outstanding. Business services criticized loans decreased 59 basis points to 6.4 percent of total business services loans outstanding. The allowance for credit losses increased to 2.74 percent of total loans representing 316 percent of non-performing loans, excluding loans held for sale. Excluding the Small Business Administration's (SBA) Paycheck Protection Program (PPP) loans, which are fully government guaranteed, the allowance for credit losses increased to 2.90 percent(1).

Non-GAAP adjusted items(1) impacting the company's earnings are identified to assist investors in analyzing Regions' operating results on the same basis as that applied by management and provide a basis to predict future performance. Non-GAAP adjusted items(1) in the current quarter reflect, among other items, a $44 million valuation gain associated with an equity investment in a company which executed an initial public offering during the third quarter.


3


Total revenue
 
 
Quarter Ended
($ amounts in millions)
 
9/30/2020
 
6/30/2020
 
9/30/2019
 
3Q20 vs. 2Q20
 
3Q20 vs. 3Q19
Net interest income
 
$
988

 
$
972

 
$
937

 
$
16

 
1.6
 %
 
$
51

 
5.4
 %
Taxable equivalent adjustment
 
12

 
13

 
13

 
(1
)
 
(7.7
)%
 
(1
)
 
(7.7
)%
Net interest income, taxable equivalent basis
 
$
1,000

 
$
985

 
$
950

 
$
15

 
1.5
 %
 
$
50

 
5.3
 %
Net interest margin (FTE)
 
3.13
%
 
3.19
%
 
3.44
%


Non-interest income:


Service charges on deposit accounts
 
$
152

 
$
131

 
$
186

 
$
21

 
16.0
 %
 
$
(34
)
 
(18.3
)%
Card and ATM fees
 
115

 
101

 
114

 
14

 
13.9
 %
 
1

 
0.9
 %
Wealth management income
 
85

 
79

 
83

 
6

 
7.6
 %
 
2

 
2.4
 %
Capital markets income
 
61

 
95

 
36

 
(34
)
 
(35.8
)%
 
25

 
69.4
 %
Mortgage income
 
108

 
82

 
56

 
26

 
31.7
 %
 
52

 
92.9
 %
Commercial credit fee income
 
20

 
17

 
19

 
3

 
17.6
 %
 
1

 
5.3
 %
Bank-owned life insurance
 
17

 
18

 
18

 
(1
)
 
(5.6
)%
 
(1
)
 
(5.6
)%
Securities gains (losses), net
 
3

 
1


2

 
200.0
 %
 
3

 
NM

Market value adjustments on employee benefit assets*
 
14

 
16

 
7

 
(2
)
 
(12.5
)%
 
7

 
100.0
 %
Valuation gain on equity investment
 
44


44

 
NM

 
44

 
NM

Other
 
36

 
33

 
39

 
3

 
9.1
 %
 
(3
)
 
(7.7
)%
Non-interest income
 
$
655

 
$
573

 
$
558

 
$
82

 
14.3
 %
 
$
97

 
17.4
 %
Total revenue
 
$
1,643

 
$
1,545

 
$
1,495

 
$
98

 
6.3
 %
 
$
148

 
9.9
 %


Adjusted total revenue (non-GAAP)(1)
 
$
1,596

 
$
1,544

 
$
1,494

 
$
52

 
3.4
 %
 
$
102

 
6.8
 %


NM - Not Meaningful
* These market value adjustments relate to assets held for employee benefits that are offset within salaries and employee benefits expense.

Comparison of third quarter 2020 to second quarter 2020
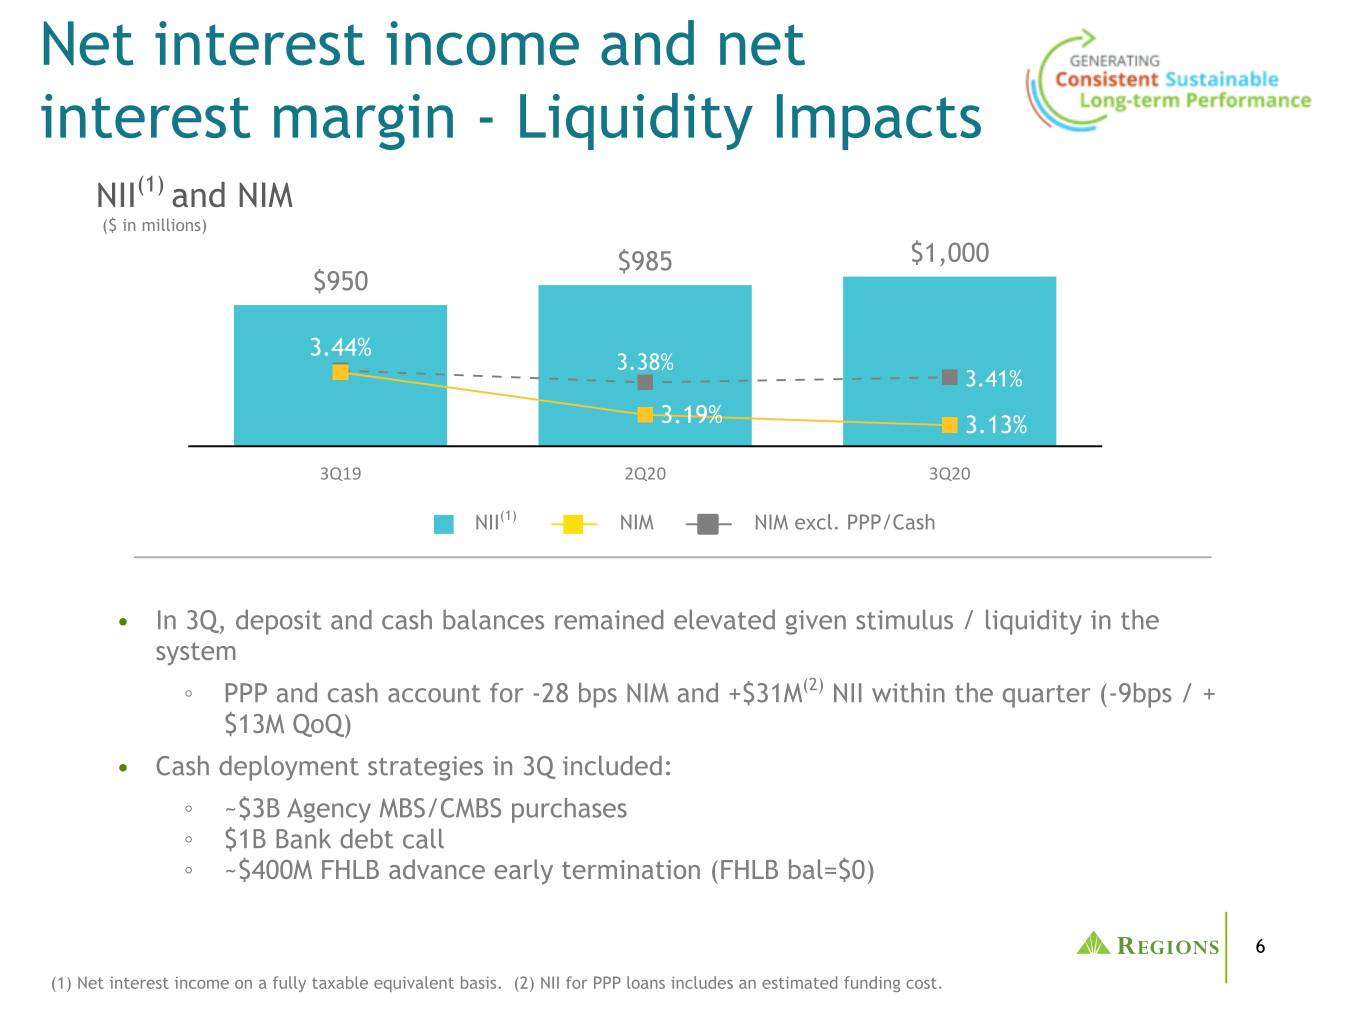
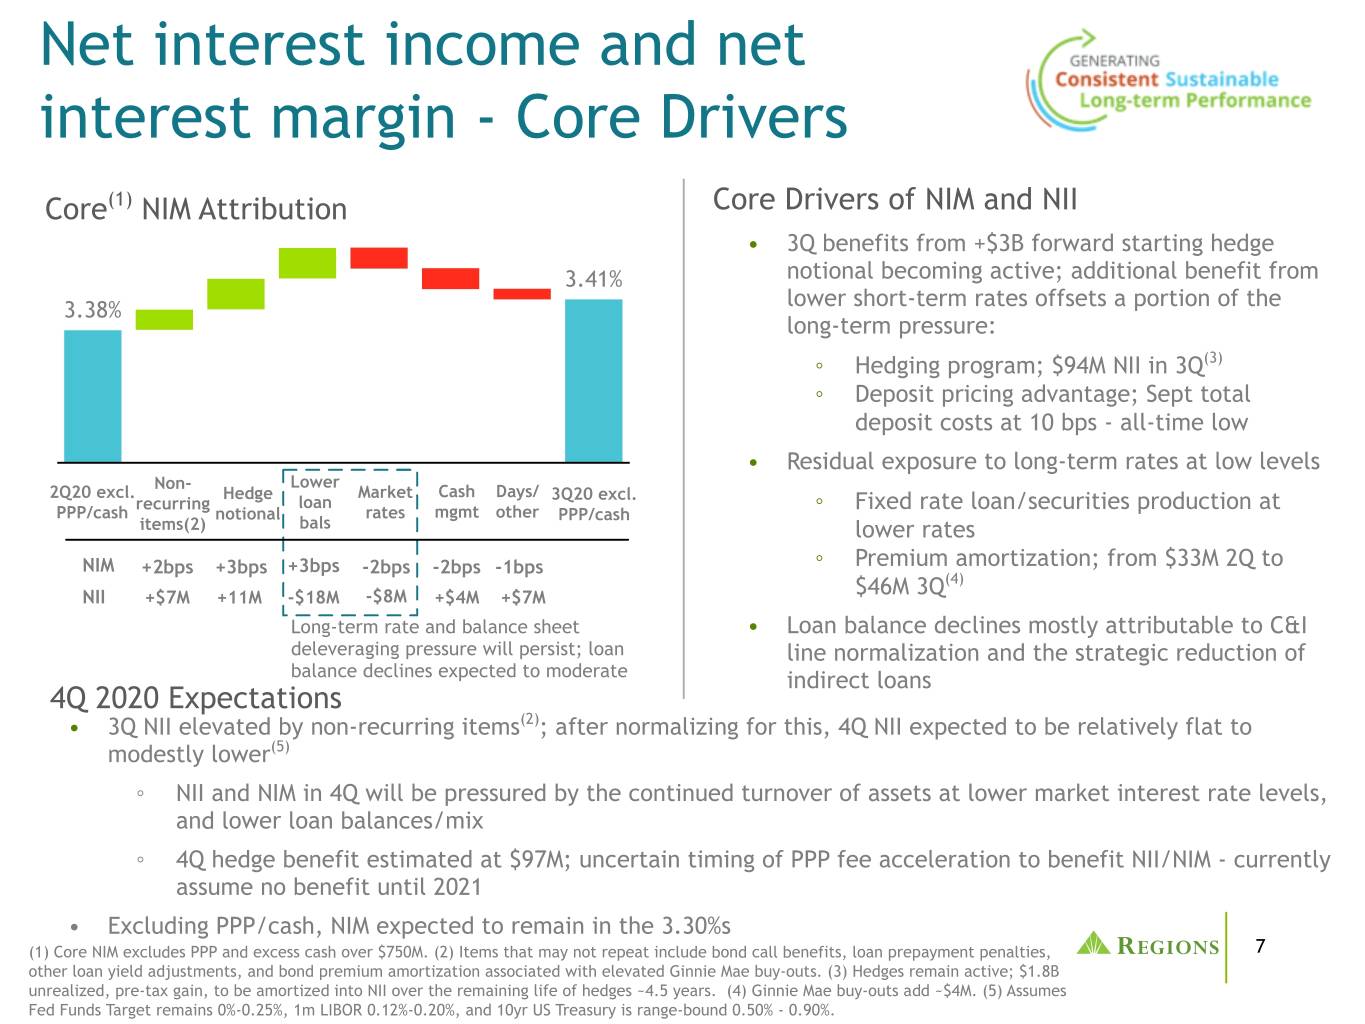
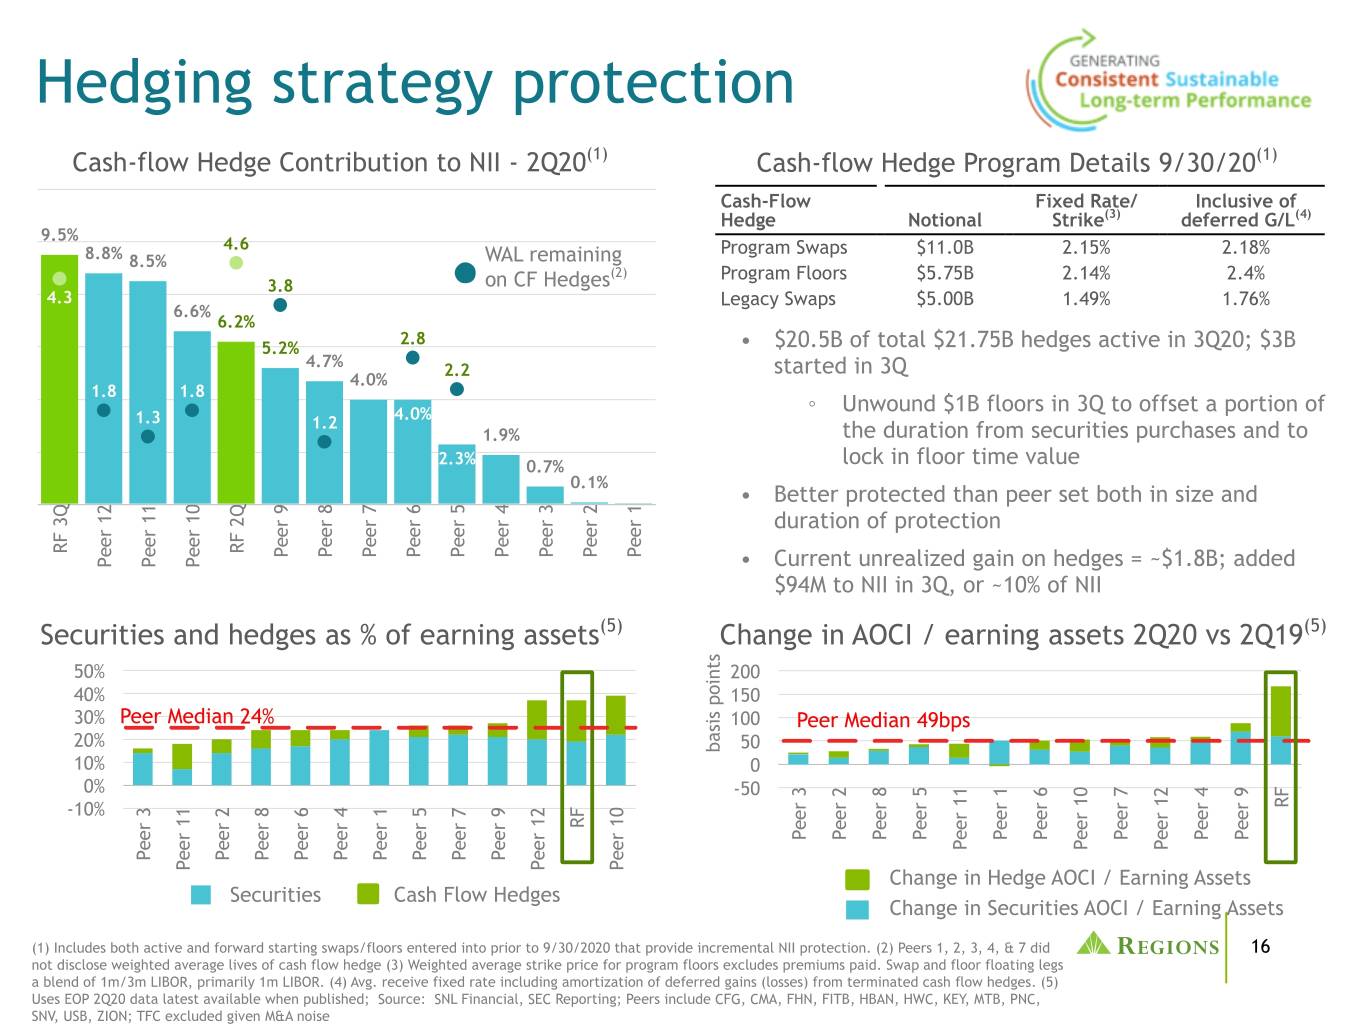
Total revenue of approximately $1.6 billion increased 6 percent on a reported basis and 3 percent on an adjusted basis(1) compared to the prior quarter. Net interest income increased 2 percent, while net interest margin decreased 6 basis points to 3.13 percent. Net interest income was supported primarily by increased hedging benefits, stronger than anticipated deposit growth, cash deployment into securities, liability management activities, and one extra day in the quarter. Hedging benefits include a $3 billion increase in active notional from previously transacted forward starting hedges. Moreover, while market interest rates have fallen to near-zero levels, benefits from hedging and deposit cost reductions more than offset negative rate pressure on asset yields and premium amortization within the quarter. Yet, while the second quarter benefited from elevated loan balances, the current quarter was pressured by loan balance normalization, excluding the SBA's PPP loans. Strong deposit growth trends continued in the third quarter, pushing cash balances higher which negatively impacted net interest margin.
 

4


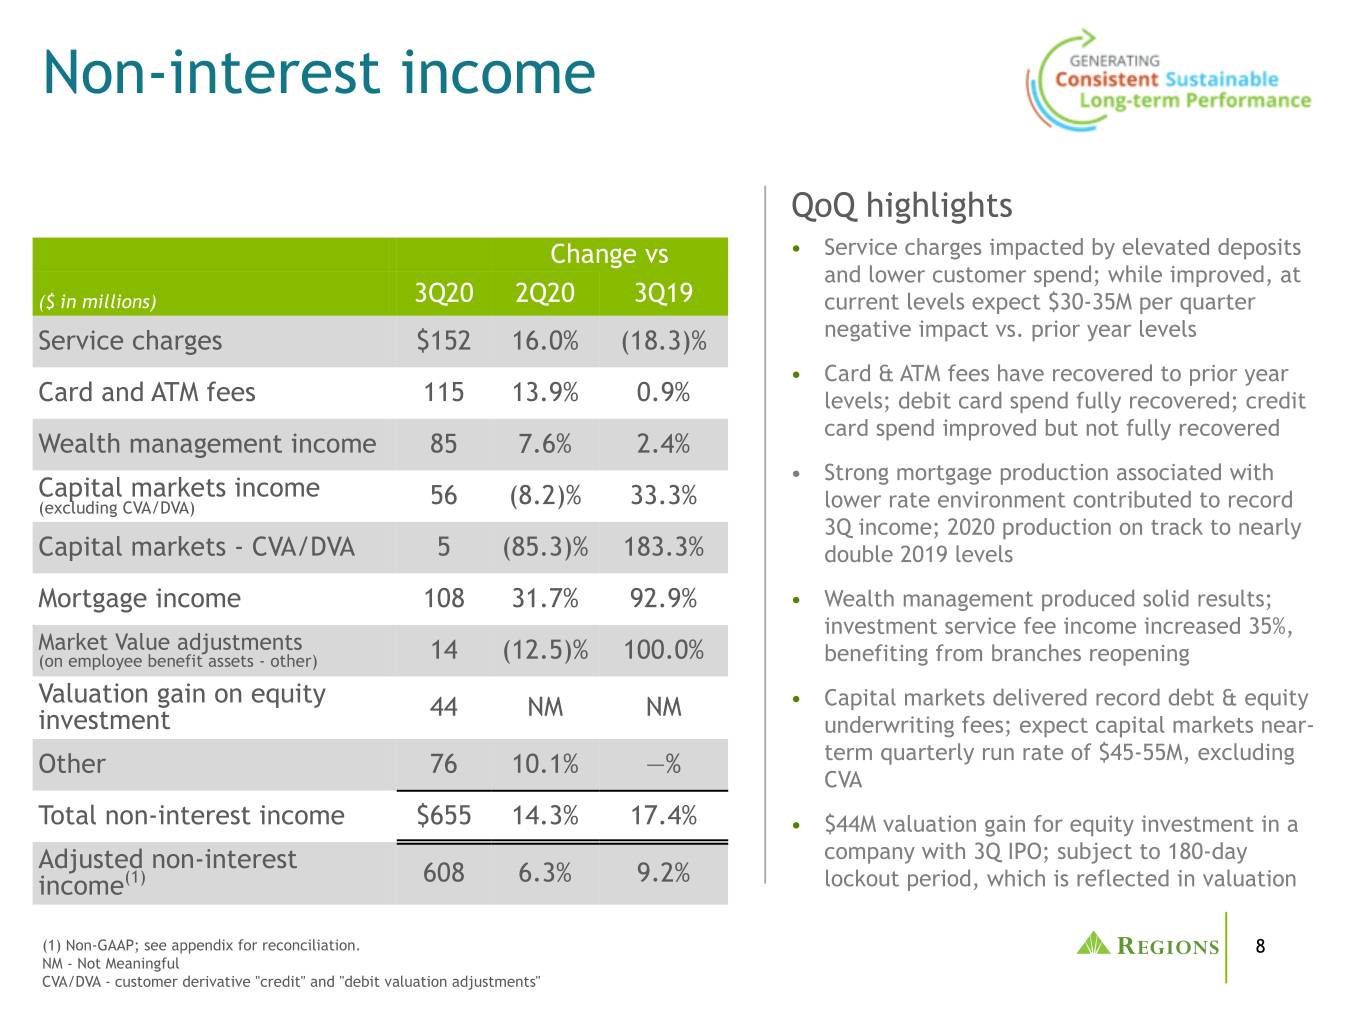
Non-interest income increased approximately 14 percent on a reported basis and 6 percent on an adjusted basis(1) as increases in mortgage, service charges, card and ATM fees and wealth management income more than offset declines in capital markets. Mortgage income increased 32 percent driven by continued strong production and modestly higher gain on sale. Service charges and card and ATM fees increased 16 and 14 percent, respectively as consumer spending continued to normalize during the quarter. Wealth management income increased 8 percent reflecting improved sales volumes as states and local economies began reopening. Capital markets income decreased 36 percent from a record level during the prior quarter. Within capital markets, debt and equity underwriting experienced another record quarter, but this benefit was more than offset by declines in commercial swap income and reduced permanent financing placements for real estate clients. Capital markets income was also impacted by $5 million of positive market-related credit valuation adjustments, compared to $34 million of positive valuation adjustments during the prior quarter. Market value adjustments on employee benefit assets remained positive during the quarter; however, this benefit was offset through a corresponding increase in salaries and benefits. The company also recognized a $44 million valuation gain associated with an equity investment in a company which executed an initial public offering during the third quarter. These shares are subject to a 180-day lockup period which is reflected in the investment valuation.

Comparison of third quarter 2020 to third quarter 2019
Total revenue increased 10 percent on a reported basis and 7 percent on an adjusted basis(1) compared to the third quarter of 2019. Net interest income increased 5 percent, while net interest margin decreased 31 basis points. Net interest income was supported by higher loan balances attributable to the company's Ascentium Capital equipment finance acquisition, PPP loans, and strong mortgage production as well as strong deposit growth. While these items support net interest income, elevated liquidity in the form of lower-returning assets such as excess cash held at the Federal Reserve and PPP loans reduced net interest margin. Additionally, while net interest income and net interest margin are well-protected from declines in short-term interest rates through hedging and deposit cost management, long-term interest rate reductions did introduce pressure when compared to the third quarter of 2019, through higher mortgaged-back securities premium amortization and repricing of the portfolio of fixed-rate loans and securities at lower market interest rate levels.
 
Non-interest income increased 17 percent on a reported basis and 9 percent on an adjusted basis(1). Mortgage income increased significantly, driven by strong production volumes and sales income reflecting a 103 percent increase in total mortgage production as lower market interest rates drove increased activity. Capital markets income also increased significantly reflecting growth across most categories and an improvement in market-related credit valuation adjustments tied to customer derivatives. Service charges declined 18 percent driven primarily by reduced overdraft fees resulting from increased customer liquidity associated with the COVID-19 pandemic. Card and ATM fees were stable with the prior period as consumers continue to resume normal spending activities.


5


Non-interest expense
 
 
Quarter Ended
($ amounts in millions)
 
9/30/2020
 
6/30/2020
 
9/30/2019
 
3Q20 vs. 2Q20
 
3Q20 vs. 3Q19
Salaries and employee benefits
 
$
525

 
$
527

 
$
481

 
$
(2
)
 
(0.4
)%
 
$
44

 
9.1
 %
Net occupancy expense
 
80

 
76

 
80

 
4

 
5.3
 %


 %
Furniture and equipment expense
 
89

 
86

 
83

 
3

 
3.5
 %
 
6

 
7.2
 %
Outside services
 
44

 
44

 
48


 %
 
(4
)
 
(8.3
)%
Professional, legal and regulatory expenses
 
22

 
28

 
21

 
(6
)
 
(21.4
)%
 
1

 
4.8
 %
Marketing
 
22

 
22

 
23


 %
 
(1
)
 
(4.3
)%
FDIC insurance assessments
 
10

 
15

 
12

 
(5
)
 
(33.3
)%
 
(2
)
 
(16.7
)%
Credit/checkcard expenses
 
12

 
12

 
19


 %
 
(7
)
 
(36.8
)%
Branch consolidation, property and equipment charges
 
3

 
10

 
5

 
(7
)
 
(70.0
)%
 
(2
)
 
(40.0
)%
Visa class B shares expense
 
5

 
9

 
5

 
(4
)
 
(44.4
)%


 %
Provision (credit) for unfunded credit losses


(2
)


 %
 
2

 
100.0
 %
Loss on early extinguishment of debt
 
2

 
6


(4
)
 
(66.7
)%
 
2

 
NM

Other
 
82

 
89

 
96

 
(7
)
 
(7.9
)%
 
(14
)
 
(14.6
)%
Total non-interest expense
 
$
896

 
$
924

 
$
871

 
$
(28
)
 
(3.0
)%
 
$
25

 
2.9
 %
Total adjusted non-interest expense(1)
 
$
889

 
$
898

 
$
865

 
$
(9
)
 
(1.0
)%
 
$
24

 
2.8
 %


NM - Not Meaningful

Comparison of third quarter 2020 to second quarter 2020
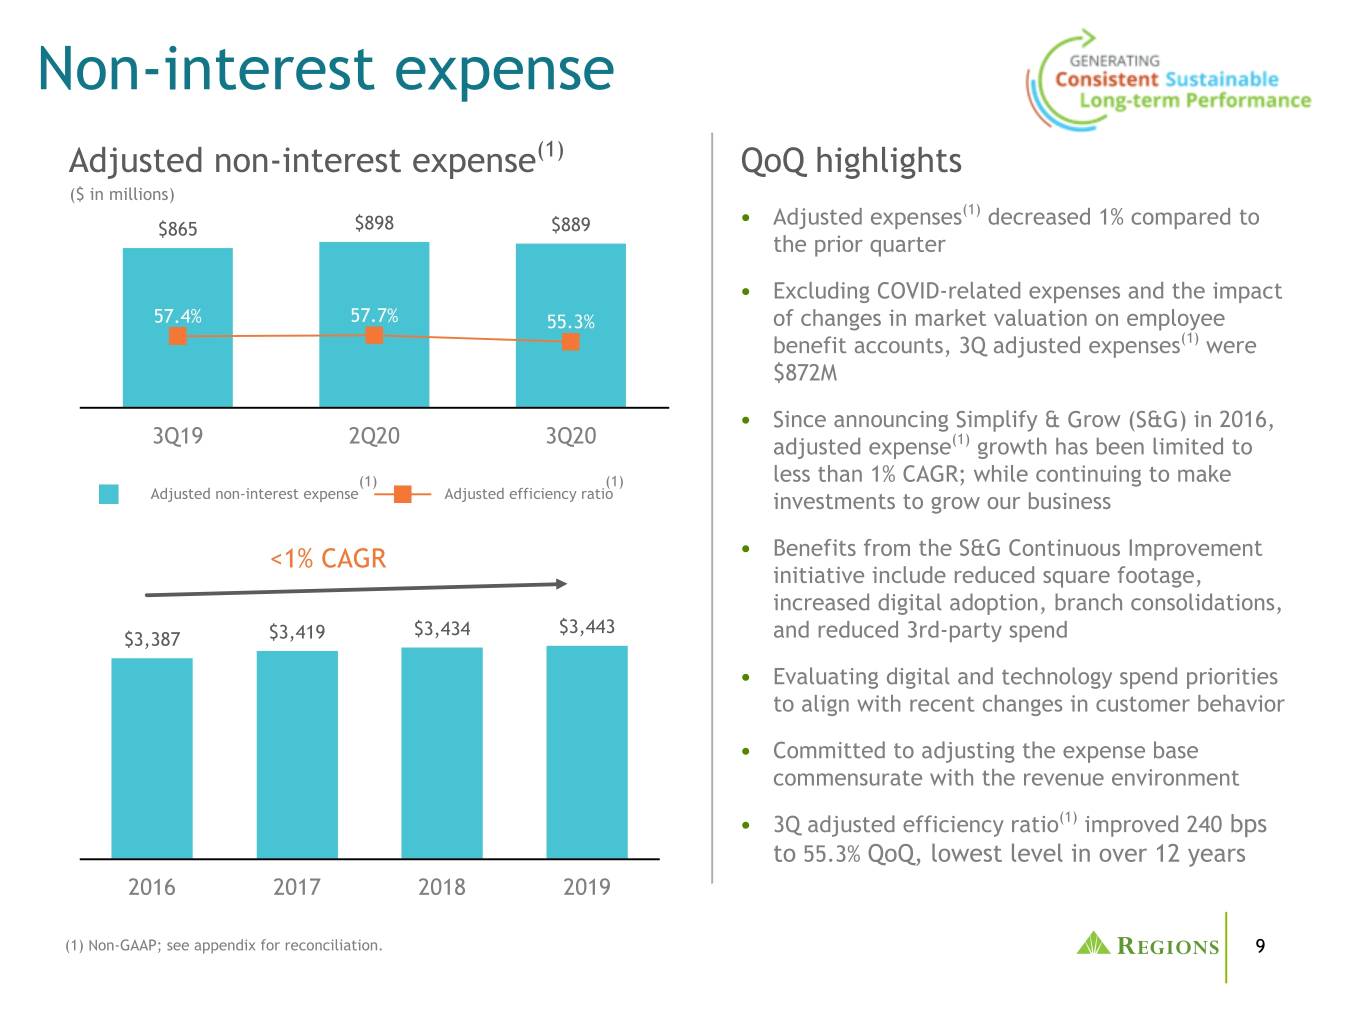
Non-interest expense decreased 3 percent on a reported basis and 1 percent on an adjusted basis(1) compared to the prior quarter. Salaries and benefits decreased modestly due to higher COVID-19 related special pay in the second quarter as well as the timing of production-based incentives tied to elevated mortgage and capital markets income. Professional fees decreased 21 percent driven primarily by costs associated with the company's equipment finance acquisition that did not repeat. FDIC insurance assessments decreased 33 percent attributable primarily to higher levels of cash at the Federal Reserve. In addition, the company incurred a $2 million loss associated with $401 million of early extinguishment of FHLB advances and a $1 billion bank debt tender. These liability management actions were executed in response to excess liquidity levels resulting from this quarter's significant deposit growth.


6


The company's third quarter efficiency ratio was 54.1 percent on a reported basis and 55.3 percent on an adjusted basis(1). The effective tax rate was 16.5 percent.

Comparison of third quarter 2020 to third quarter 2019
Non-interest expense increased 3 percent on a reported and adjusted basis(1) compared to the third quarter of 2019. Salaries and benefits increased 9 percent driven primarily by higher production-based incentives and the addition of associates through the company's equipment finance acquisition. Furniture and equipment expense increased 7 percent driven primarily by increased investment in technology. Outside services decreased 8 percent driven primarily by reductions in servicing costs related to third-party consumer unsecured loan balances. In addition, other non-interest expense decreased driven primarily by reductions in travel expenses and operational losses.

Loans and Leases
 
 
Average Balances


($ amounts in millions)
 
3Q20
 
2Q20
 
3Q19
 
3Q20 vs. 2Q20
 
3Q20 vs. 3Q19
Commercial and industrial*
 
$
46,405

 
$
49,296

 
$
40,200

 
$
(2,891
)
 
(5.9
)%
 
$
6,205

 
15.4%
Commercial real estate—owner-occupied
 
5,816

 
5,804

 
5,871

 
12

 
0.2
 %
 
(55
)
 
(0.9)%
Investor real estate
 
7,298

 
7,019

 
6,388

 
279

 
4.0
 %
 
910

 
14.2%
Business Lending
 
59,519

 
62,119

 
52,459

 
(2,600
)
 
(4.2
)%
 
7,060

 
13.5%
Residential first mortgage
 
15,786

 
14,884

 
14,298

 
902

 
6.1
 %
 
1,488

 
10.4%
Home equity
 
7,727

 
8,042

 
8,683

 
(315
)
 
(3.9
)%
 
(956
)
 
(11.0)%
Indirect—vehicles**
 
1,223

 
1,441

 
2,247

 
(218
)

(15.1
)%
 
(1,024
)
 
(45.6)%
Indirect—other consumer***
 
2,835

 
3,111

 
2,750

 
(276
)
 
(8.9
)%
 
85

 
3.1%
Consumer credit card
 
1,194

 
1,230

 
1,310

 
(36
)
 
(2.9
)%
 
(116
)
 
(8.9)%
Other consumer
 
1,086

 
1,137

 
1,239

 
(51
)
 
(4.5
)%
 
(153
)
 
(12.3)%
Consumer Lending
 
29,851

 
29,845

 
30,527

 
6

 
 %
 
(676
)
 
(2.2)%
Total Loans
 
$
89,370

 
$
91,964

 
$
82,986

 
$
(2,594
)
 
(2.8
)%
 
$
6,384

 
7.7%


Adjusted Business Lending (non-GAAP)(1)
 
$
54,961

 
$
58,906

 
$
52,459

 
(3,945
)
 
(6.7
)%
 
$
2,502

 
4.8%
Adjusted Consumer Lending (non-GAAP)(1)
 
27,310

 
26,911

 
26,374

 
399

 
1.5
 %
 
936

 
3.5%
Adjusted Total Loans (non-GAAP)(1)
 
$
82,271

 
$
85,817

 
$
78,833

 
$
(3,546
)
 
(4.1
)%
 
$
3,438

 
4.4%


NM - Not meaningful.
* Includes ~$4.5B of average PPP loans that are excluded from adjusted loans.
** Indirect vehicles is an exit portfolio.
*** A portion of indirect other consumer is an exit portfolio due to the company's decision not to renew a 3rd party relationship in the fourth quarter of 2019.

Comparison of third quarter 2020 to second quarter 2020
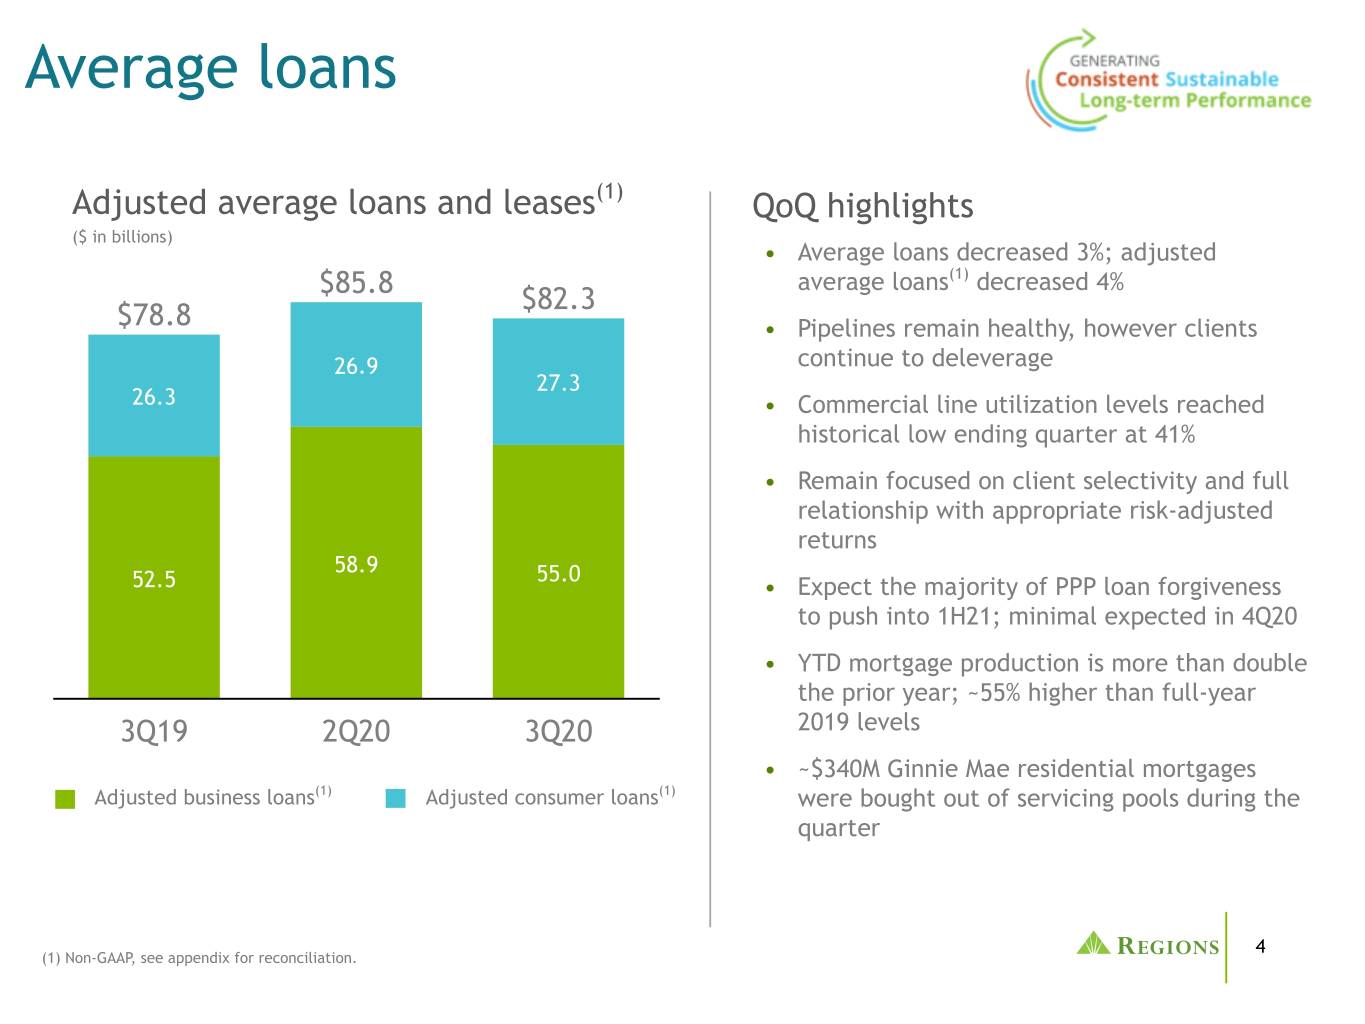
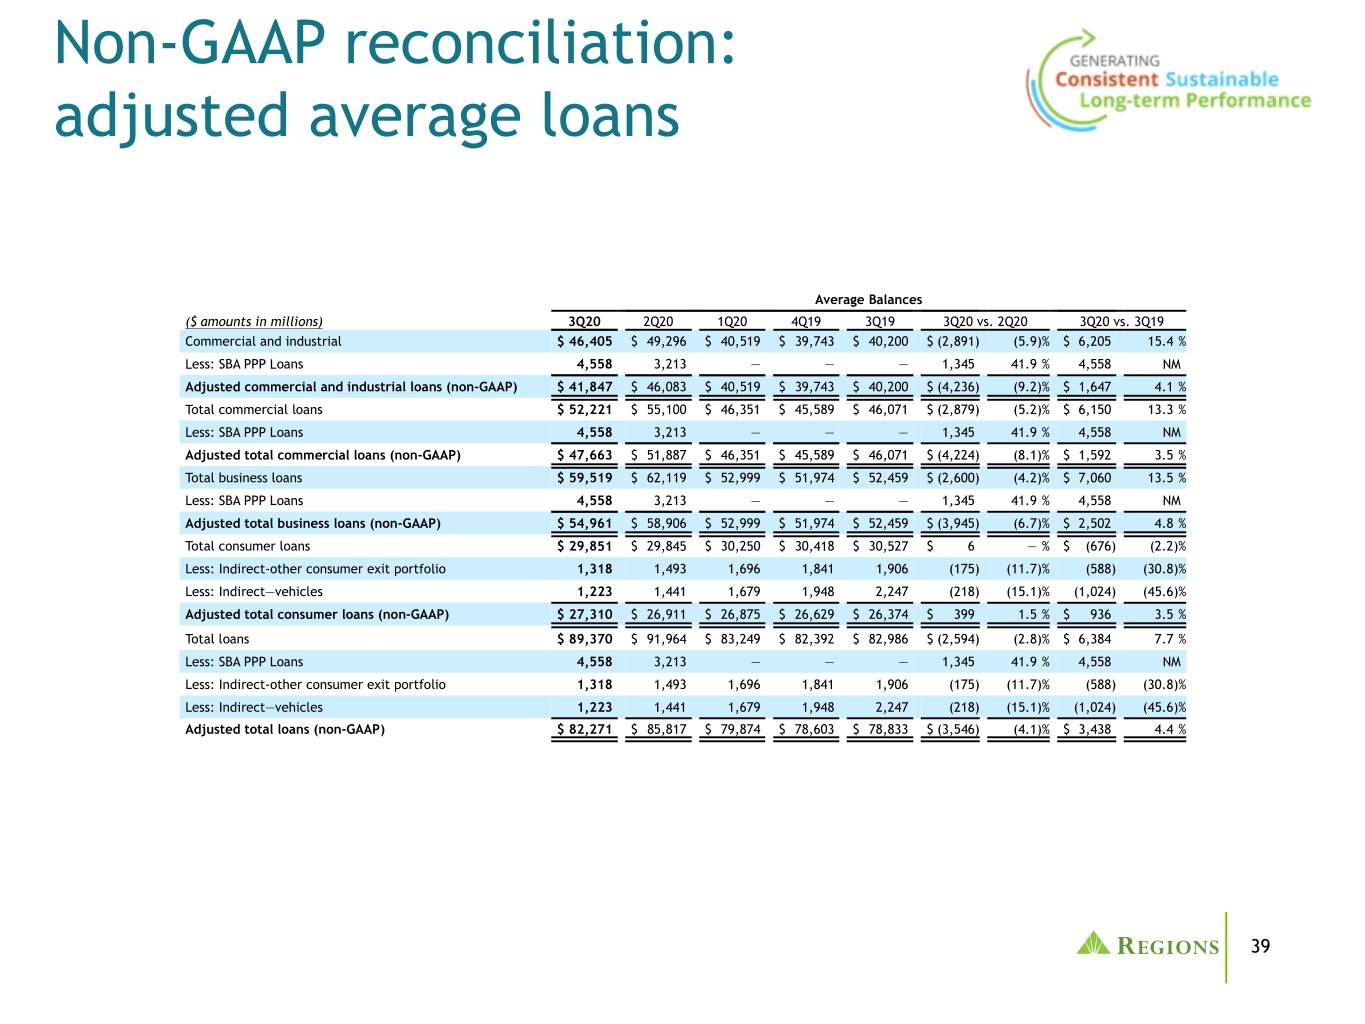
Average loans and leases decreased approximately 3 percent compared to the prior quarter. Excluding the company's indirect auto and indirect-other consumer exit portfolios, as well as outstanding PPP loans, adjusted

7


average loans and leases(1) decreased approximately 4 percent. Adjusted business lending(1) decreased 7 percent driven by clients building liquidity and reducing leverage by paying down lines of credit. Loans originated through the SBA's PPP added $1.3 billion to average loans during the quarter. Commercial loan utilization levels ended the quarter at approximately 41 percent, below pre-pandemic trends. Excluding exit portfolios, adjusted consumer lending(1) increased 1 percent as growth in residential first mortgage was partially offset by declines in other categories. Third quarter average mortgage loan growth was also benefited by the company's decision to repurchase approximately $340 million of delinquent residential mortgage loans from Ginnie Mae during the quarter.

Comparison of third quarter 2020 to third quarter 2019
Average loans and leases increased 8 percent compared to the third quarter of 2019. Adjusted average loans and leases(1) increased 4 percent. Average balances in the business lending portfolio increased 13 percent led by growth in commercial and industrial loans resulting primarily from the company's equipment finance acquisition and PPP loans. Owner-occupied commercial real estate loans declined 1 percent, while investor real estate loans increased 14 percent. Growth in investor real estate was a mix of construction and term lending primarily within the office, industrial and multi-family property types. Excluding exit portfolios, adjusted consumer lending(1) increased 4 percent as growth in residential first mortgage and indirect-other consumer was partially offset by declines in consumer credit card, home equity lending and other consumer loans.

Deposits
 
 
Average Balances


($ amounts in millions)
 
3Q20
 
2Q20
 
3Q19
 
3Q20 vs. 2Q20
 
3Q20 vs. 3Q19
Customer low-cost deposits
 
$
110,493

 
$
104,159

 
$
85,367

 
$
6,334

 
6.1%
 
$
25,126

 
29.4%
Customer time deposits
 
6,150

 
6,690

 
7,712

 
(540
)
 
(8.1)%
 
(1,562
)
 
(20.3)%
Corporate treasury time deposits
 
13

 
72

 
436

 
(59
)
 
(81.9)%
 
(423
)
 
(97.0)%
Corporate treasury other deposits


541


NM
 
(541
)
 
(100.0)%
Total Deposits
 
$
116,656

 
$
110,921

 
$
94,056

 
$
5,735

 
5.2%
 
$
22,600

 
24.0%


($ amounts in millions)
 
3Q20
 
2Q20
 
3Q19
 
3Q20 vs. 2Q20
 
3Q20 vs. 3Q19
Consumer Bank Segment
 
$
68,842

 
$
65,722

 
$
59,217

 
$
3,120

 
4.7%
 
$
9,625

 
16.3%
Corporate Bank Segment
 
38,755

 
36,409

 
25,690

 
2,346

 
6.4%
 
13,065

 
50.9%
Wealth Management Segment
 
8,658

 
8,382

 
7,843

 
276

 
3.3%
 
815

 
10.4%
Other
 
401

 
408

 
1,306

 
(7
)
 
(1.7)%
 
(905
)
 
(69.3)%
Total Deposits
 
$
116,656

 
$
110,921

 
$
94,056

 
$
5,735

 
5.2%
 
$
22,600

 
24.0%


8


Comparison of third quarter 2020 to second quarter 2020
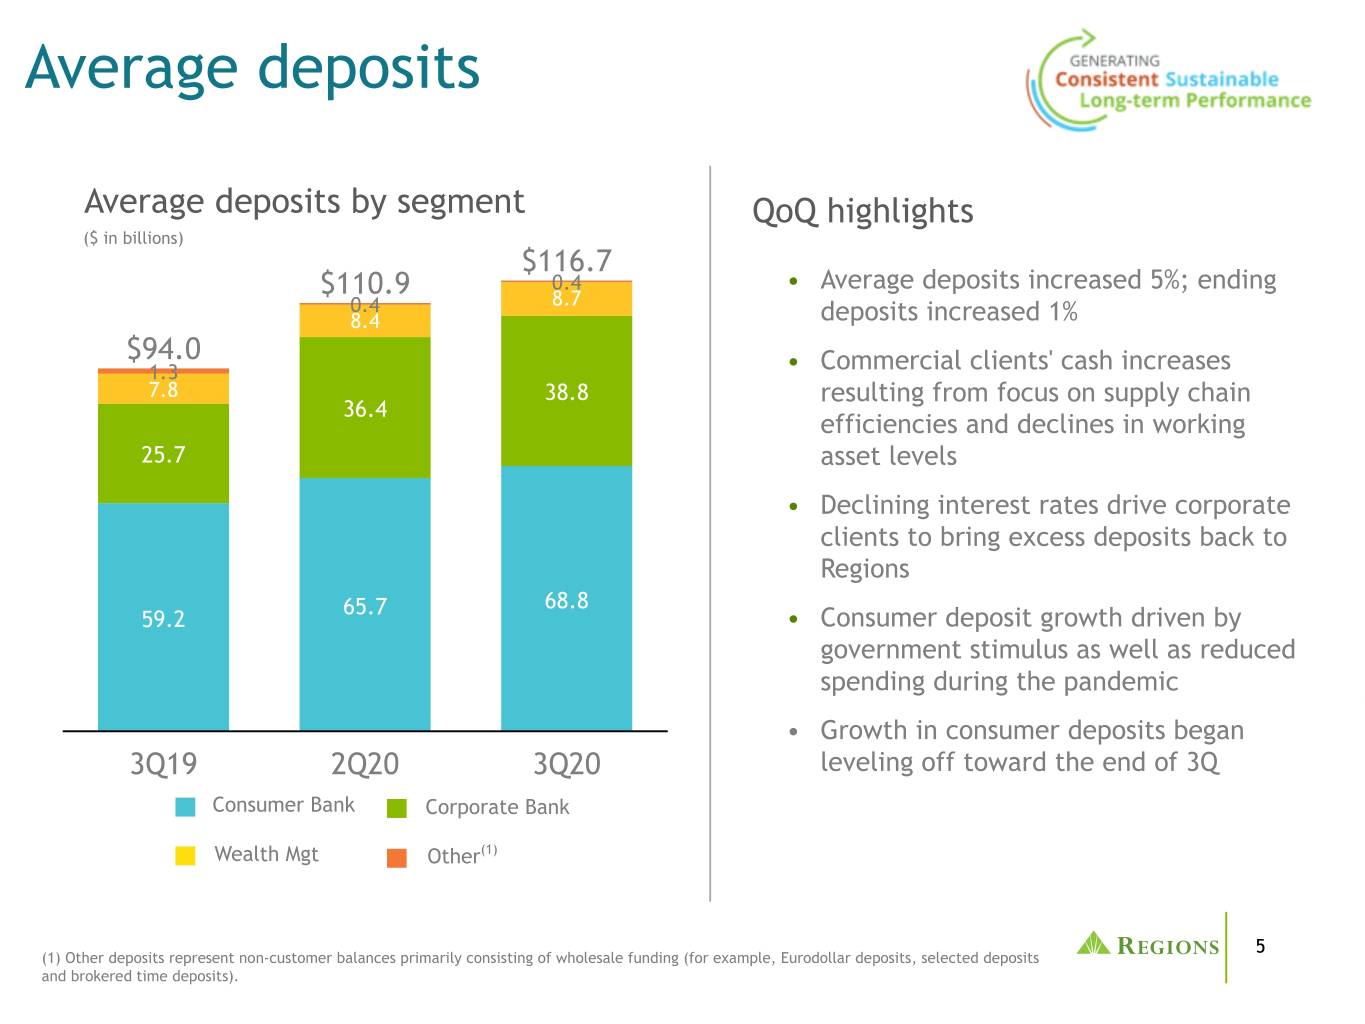
Total average deposit balances increased 5 percent to $117 billion in the third quarter. Average Consumer segment deposit growth was driven by government stimulus payments as well as reduced spending related to the COVID-19 pandemic. Corporate segment deposit growth reflects clients bringing excess deposits back to Regions. In addition, many corporate clients are building liquidity by focusing on supply chain efficiencies and turnover of receivables. Similarly, Wealth segment deposit growth was driven primarily by clients' desire to hold additional liquidity during the pandemic.

Comparison of third quarter 2020 to third quarter 2019
Total average deposit balances increased 24 percent compared to the third quarter of 2019 as growth in low-cost deposits was partially offset by a decrease in average time deposits. Growth in average Consumer, Wealth and Corporate segment deposits was partially offset by declines in average Other segment deposits.

Asset quality
 
 
As of and for the Quarter Ended
($ amounts in millions)
 
9/30/2020
 
6/30/2020
 
9/30/2019
ACL/Loans, net
 
2.74%
 
2.68%
 
1.11%
ALL/Loans, net
 
2.58%
 
2.51%
 
1.05%
Allowance for credit losses to non-performing loans, excluding loans held for sale
 
316%
 
395%
 
198%
Allowance for loan losses to non-performing loans, excluding loans held for sale
 
297%
 
370%
 
188%
Provision for credit losses*
 
$113
 
$882
 
$108
Net loans charged-off
 
$113
 
$182
 
$92
Net loan charge-offs as a % of average loans, annualized
 
0.50%
 
0.80%
 
0.44%
Non-accrual loans, excluding loans held for sale/Loans, net
 
0.87%
 
0.68%
 
0.56%
NPAs (ex. 90+ past due)/Loans, foreclosed properties, non-marketable investments and non-performing loans held for sale
 
0.90%
 
0.74%
 
0.65%
NPAs (inc. 90+ past due)/Loans, foreclosed properties, non-marketable investments and non-performing loans held for sale**
 
1.08%
 
0.91%
 
0.82%
Total TDRs, excluding loans held for sale
 
$645
 
$626
 
$657
Total Criticized Loans—Business Services***
 
$3,734
 
$4,225
 
$2,319
* CECL was adopted January 1, 2020. Periods prior to January 1, 2020 reflect results under the incurred loss model. Upon adoption of CECL, the provision for credit losses is the sum of the provision for loan losses and the provision for unfunded credit commitments. Prior to the adoption of CECL, the provision for unfunded commitments was included in other non-interest expense.
** Excludes guaranteed residential first mortgages that are 90+ days past due and still accruing.
*** Business services represents the combined total of commercial and investor real estate loans.

Comparison of third quarter 2020 to second quarter 2020
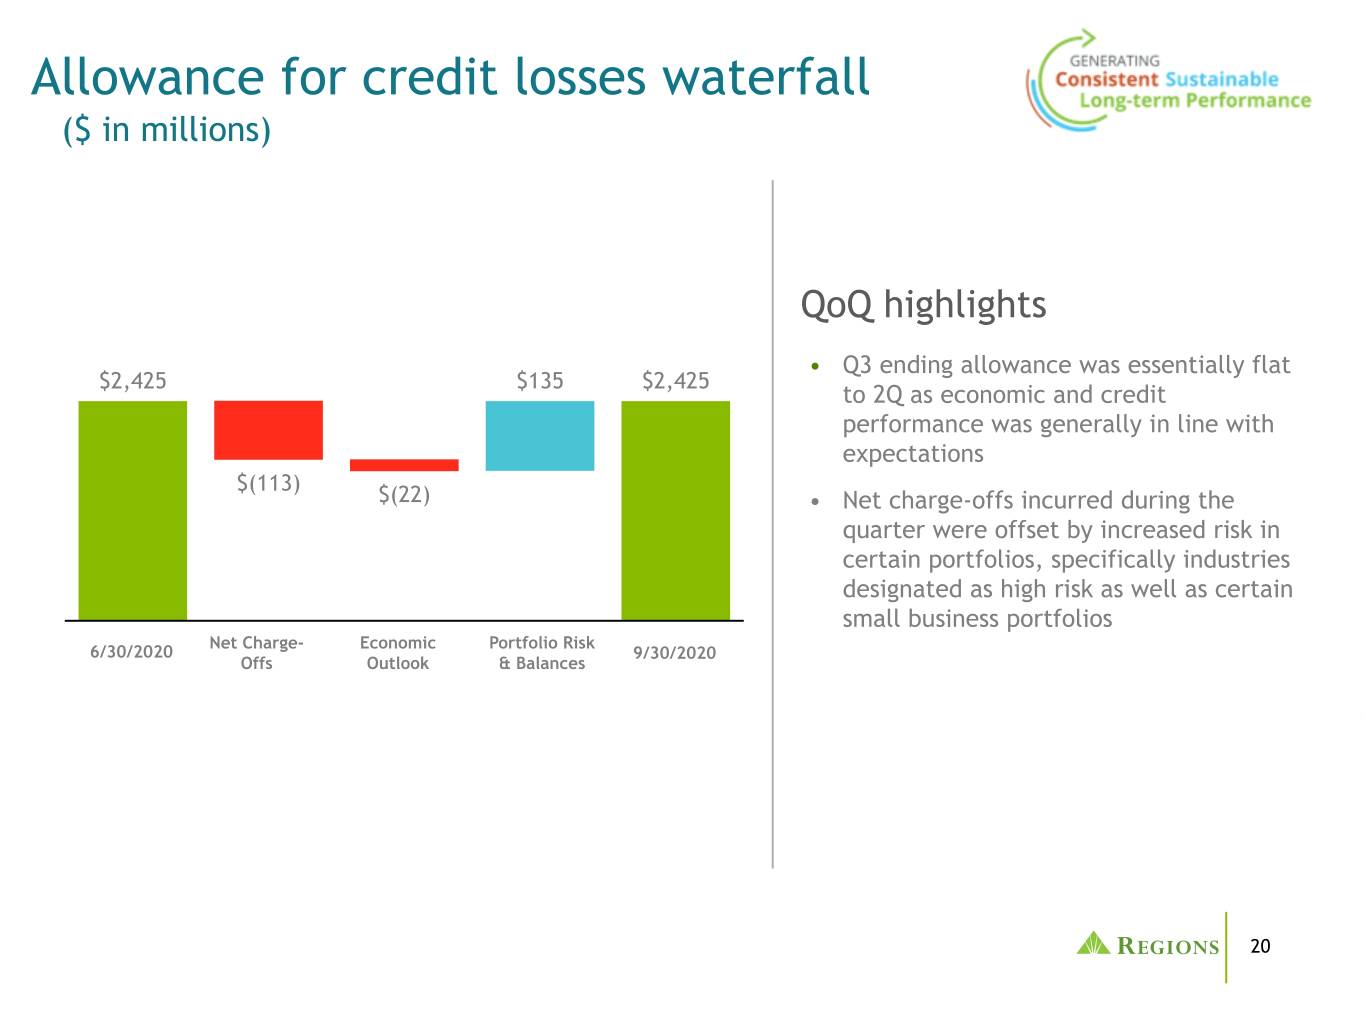
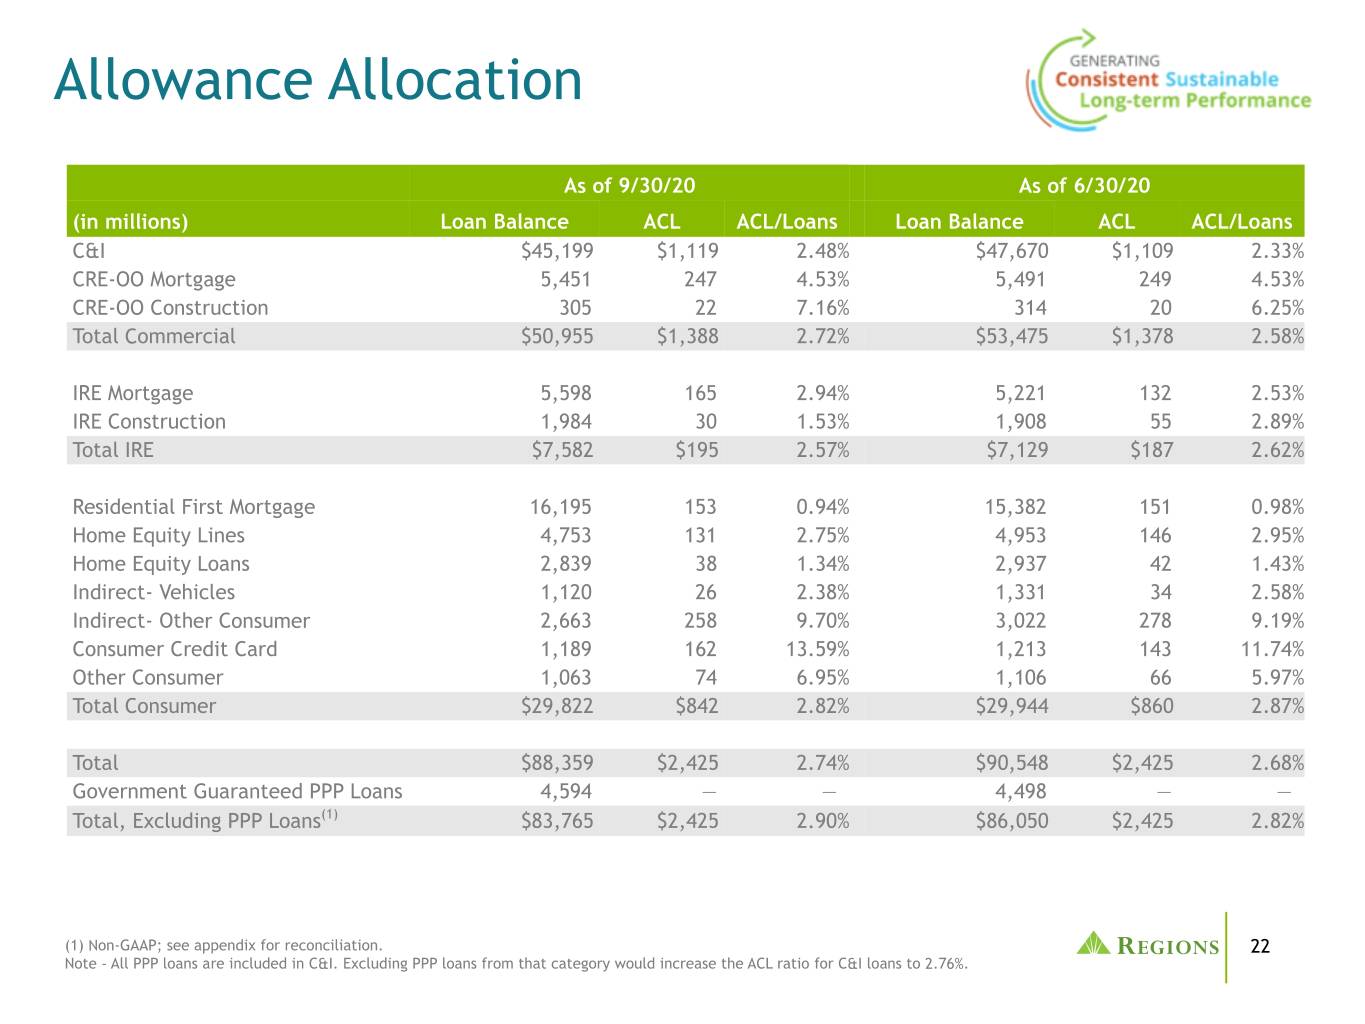
The credit loss provision for the third quarter totaled $113 million representing a significant decrease from the second quarter. The provision reflects continued economic risk in certain portfolios as well as the impact of $113 million in net charge-offs and reductions in loan balances. The resulting allowance for credit losses is equal to 2.74 percent of total loans and 316 percent of total non-accrual loans, excluding loans held for sale. Excluding PPP loans, which are fully government guaranteed, the allowance for credit losses increased to 2.90 percent(1) of

9


total loans. Annualized net charge-offs decreased from 80 basis points to 50 basis points of average loans. The decrease reflects lower losses within the energy and restaurant portfolios as well as lower overall consumer net charge-offs. Total non-accrual loans, excluding loans held for sale, increased 19 basis points to 0.87 percent of total loans. Total delinquencies decreased 11 percent while troubled debt restructured loans increased 3 percent. As the company has continued to work with customers through loan deferral or forbearance, existing credit policies remain in effect including risk-rating revisions as necessary. Business services criticized loans decreased 12 percent given ongoing review of customer performance resulting in certain upgrades in specific industries that have adapted to the pandemic and are performing well.

Comparison of third quarter 2020 to third quarter 2019
Annualized net charge-offs increased 6 basis points compared with the third quarter of 2019, and the allowance for credit losses as a percent of total loans increased 163 basis points reflecting the adoption of CECL and deterioration in the loan portfolio due to the onset of COVID-19. In addition, the current year period includes net charge-offs associated with the company's recent equipment finance acquisition. As a percent of total non-accrual loans, excluding loans held for sale, the allowance for credit losses increased 118 percentage points. Total business services criticized loans increased 61 percent driven primarily by an increase in the energy, restaurant, hotel and retail portfolios. Total delinquencies and total troubled debt restructured loans decreased 12 percent and 2 percent, respectively.
    
Capital and liquidity
 
 
As of and for Quarter Ended
 
 
9/30/2020
 
6/30/2020
 
9/30/2019
Basel III Common Equity Tier 1 ratio(2)
 
9.3%
 
8.9%
 
9.6%
Tier 1 capital ratio(2)
 
10.8%
 
10.4%
 
10.8%
Tangible common stockholders’ equity to tangible assets (non-GAAP)(1)
 
7.88%
 
7.72%
 
8.44%
Tangible common book value per share (non-GAAP)(1)*
 
$11.49
 
$11.16
 
$10.79
Loans, net of unearned income, to total deposits
 
74.6%
 
77.5%
 
87.8%
* Tangible common book value per share includes the impact of quarterly earnings and changes to market value adjustments within accumulated other comprehensive income, as well as continued capital returns.
 
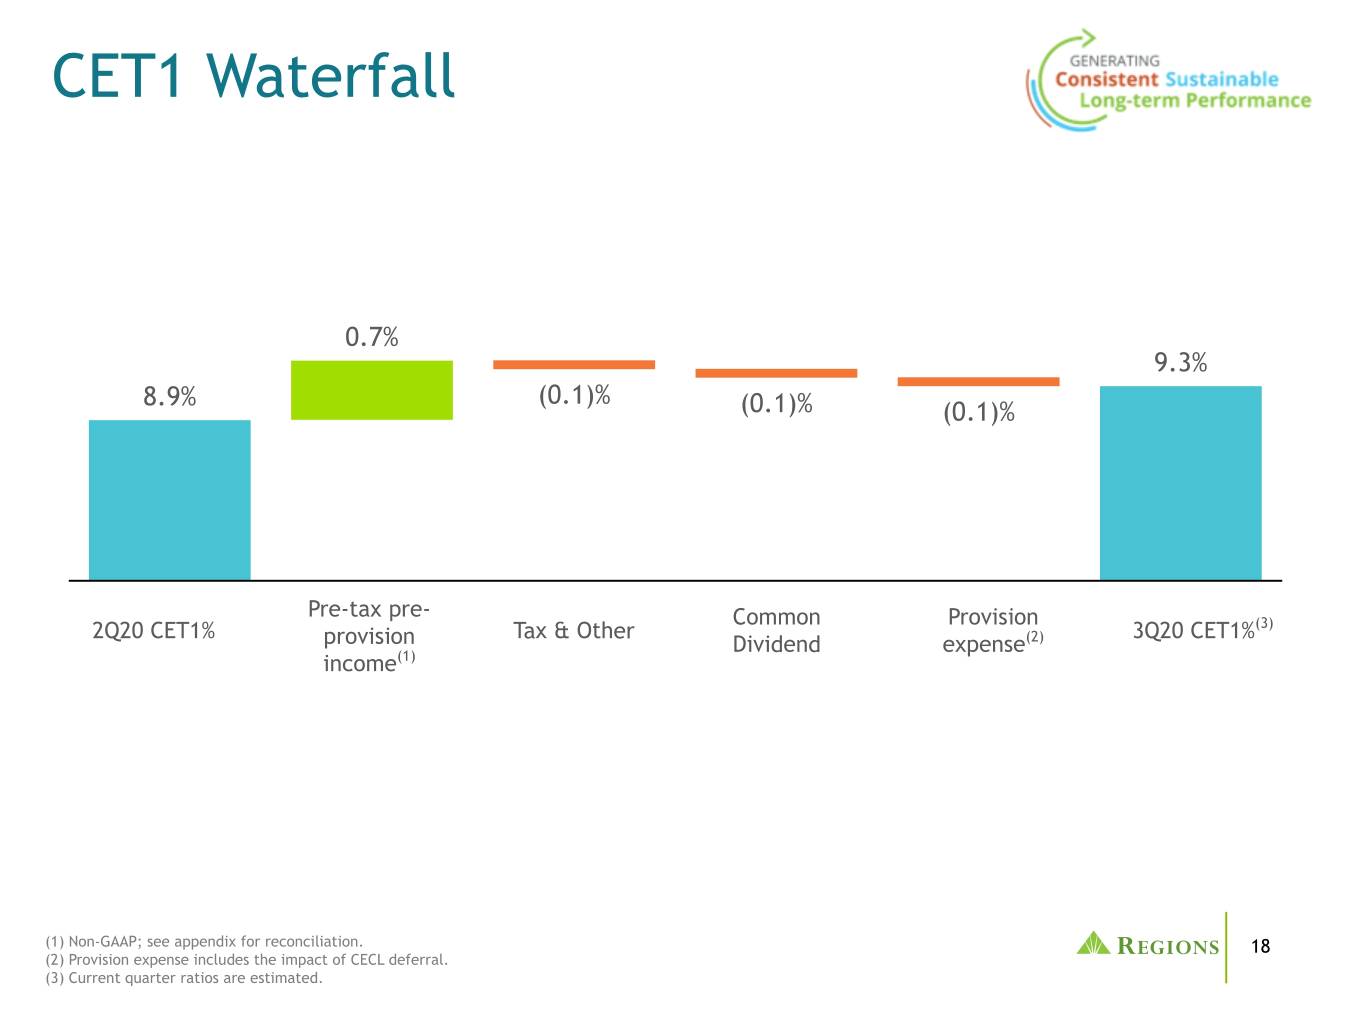
Regions maintains a strong capital position. Estimated capital ratios remain well above current regulatory requirements under the Basel III capital rules. The Tier 1(2) and Common Equity Tier 1(2) ratios were estimated at 10.8 percent and 9.3 percent, respectively, at quarter-end.

The company declared $149 million in dividends to common shareholders during the third quarter. Consistent with its previous announcement to temporarily suspend share repurchases through year-end 2020, the company did not repurchase shares in the quarter.


10


During the third quarter, the Federal Reserve Bank (FRB) finalized Regions' Stress Capital Buffer (SCB) requirement for the fourth quarter of 2020 through the third quarter of 2021 at 3.0 percent.

(1)
Non-GAAP; refer to pages 7, 11, 12, 13, 15, 20, 21, and 24 of the financial supplement to this earnings release.
(2)
Current quarter Basel III common equity Tier 1, and Tier 1 capital ratios are estimated.

Conference Call
A replay of the earnings call will be available beginning Tuesday, October 20, 2020, at 2 p.m. ET through Friday, November 20, 2020. To listen by telephone, please dial 855-859-2056, and use access code 8758319. An archived webcast will also be available on the Investor Relations page of www.regions.com.

About Regions Financial Corporation
Regions Financial Corporation (NYSE:RF), with $145 billion in assets, is a member of the S&P 500 Index and is one of the nation’s largest full-service providers of consumer and commercial banking, wealth management, and mortgage products and services. Regions serves customers across the South, Midwest and Texas, and through its subsidiary, Regions Bank, operates approximately 1,400 banking offices and 2,000 ATMs. Regions Bank is an Equal Housing Lender and Member FDIC. Additional information about Regions and its full line of products and services can be found at www.regions.com.

Forward-Looking Statements
This release may include forward-looking statements as defined in the Private Securities Litigation Reform Act of 1995. Any statement that does not describe historical or current facts is a forward-looking statement. Forward-looking statements are not based on historical information, but rather are related to future operations, strategies, financial results or other developments. Forward-looking statements are based on management’s current expectations as well as certain assumptions and estimates made by, and information available to, management at the time the statements are made. Those statements are based on general assumptions and are subject to various risks, and because they also relate to the future they are likewise subject to inherent uncertainties and other factors that may cause actual results to differ materially from the views, beliefs and projections expressed in such statements. Therefore, we caution you against relying on any of these forward-looking statements. These risks, uncertainties and other factors include, but are not limited to, those described below:
Current and future economic and market conditions in the United States generally or in the communities we serve (in particular the Southeastern United States), including the effects of possible declines in property values, increases in unemployment rates, financial market disruptions and potential reductions of economic growth, which may adversely affect our lending and other businesses and our financial results and conditions.
Possible changes in trade, monetary and fiscal policies of, and other activities undertaken by, governments, agencies, central banks and similar organizations, which could have a material adverse effect on our earnings.
Possible changes in market interest rates or capital markets could adversely affect our revenue and expense, the value of assets and obligations, and the availability and cost of capital and liquidity.
The impact of pandemics, including the ongoing COVID-19 pandemic, on our businesses and financial results and conditions. The duration and severity of the ongoing COVID-19 pandemic, which has disrupted the global economy, has and could continue to adversely affect our capital and liquidity position, impair the ability of borrowers to repay outstanding loans and increase our allowance for credit losses, impair collateral values, and result in lost revenue or additional expenses. The pandemic could also cause an outflow of deposits, result in goodwill impairment charges and the impairment of other financial and nonfinancial assets, and increase our cost of capital.
Any impairment of our goodwill or other intangibles, any repricing of assets, or any adjustment of valuation allowances on our deferred tax assets due to changes in law, adverse changes in the economic environment, declining operations of the reporting unit or other factors.
The effect of changes in tax laws, including the effect of any future interpretations of or amendments to Tax Reform, which may impact our earnings, capital ratios and our ability to return capital to shareholders.
Possible changes in the creditworthiness of customers and the possible impairment of the collectability of loans and leases, including operating leases.
Changes in the speed of loan prepayments, loan origination and sale volumes, charge-offs, loan loss provisions or actual loan losses where our allowance for loan losses may not be adequate to cover our eventual losses.
Possible acceleration of prepayments on mortgage-backed securities due to low interest rates, and the related acceleration of premium amortization on those securities.
Loss of customer checking and savings account deposits as customers pursue other, higher-yield investments, which could increase our funding costs.
Possible changes in consumer and business spending and saving habits and the related effect on our ability to increase assets and to attract deposits, which could adversely affect our net income.
Our ability to effectively compete with other traditional and non-traditional financial services companies, some of whom possess greater financial resources than we do or are subject to different regulatory standards than we are.

11


Our inability to develop and gain acceptance from current and prospective customers for new products and services and the enhancement of existing products and services to meet customers’ needs and respond to emerging technological trends in a timely manner could have a negative impact on our revenue.
Our inability to keep pace with technological changes could result in losing business to competitors.
Changes in laws and regulations affecting our businesses, including legislation and regulations relating to bank products and services, as well as changes in the enforcement and interpretation of such laws and regulations by applicable governmental and self-regulatory agencies, which could require us to change certain business practices, increase compliance risk, reduce our revenue, impose additional costs on us, or otherwise negatively affect our businesses.
Our capital actions, including dividend payments, common stock repurchases, or redemptions of preferred stock or other regulatory capital instruments, must not cause us to fall below minimum capital ratio requirements, with applicable buffers taken into account, and must comply with other requirements under law or imposed by our regulators, which may impact our ability to return capital to shareholders.
Our ability to comply with stress testing and capital planning requirements (as part of the CCAR process or otherwise) may continue to require a significant investment of our managerial resources due to the importance of such tests and requirements.
Our ability to comply with applicable capital and liquidity requirements (including, among other things, the Basel III capital standards), including our ability to generate capital internally or raise capital on favorable terms, and if we fail to meet requirements, our financial condition and market perceptions of us could be negatively impacted.
The effects of any developments, changes or actions relating to any litigation or regulatory proceedings brought against us or any of our subsidiaries.
The costs, including possibly incurring fines, penalties, or other negative effects (including reputational harm) of any adverse judicial, administrative, or arbitral rulings or proceedings, regulatory enforcement actions, or other legal actions to which we or any of our subsidiaries are a party, and which may adversely affect our results.
Our ability to manage fluctuations in the value of assets and liabilities and off-balance sheet exposure so as to maintain sufficient capital and liquidity to support our business.
Our ability to execute on our strategic and operational plans, including our ability to fully realize the financial and non-financial benefits relating to our strategic initiatives.
The risks and uncertainties related to our acquisition or divestiture of businesses.
The success of our marketing efforts in attracting and retaining customers.
Our ability to recruit and retain talented and experienced personnel to assist in the development, management and operation of our products and services may be affected by changes in laws and regulations in effect from time to time.
Fraud or misconduct by our customers, employees or business partners.
Any inaccurate or incomplete information provided to us by our customers or counterparties.
Inability of our framework to manage risks associated with our business such as credit risk and operational risk, including third-party vendors and other service providers, which could, among other things, result in a breach of operating or security systems as a result of a cyber attack or similar act or failure to deliver our services effectively.
Dependence on key suppliers or vendors to obtain equipment and other supplies for our business on acceptable terms.
The inability of our internal controls and procedures to prevent, detect or mitigate any material errors or fraudulent acts.
The effects of geopolitical instability, including wars, conflicts and terrorist attacks and the potential impact, directly or indirectly, on our businesses.
The effects of man-made and natural disasters, including fires, floods, droughts, tornadoes, hurricanes, and environmental damage (specifically in the Southeastern United States), which may negatively affect our operations and/or our loan portfolios and increase our cost of conducting business. The severity and impact of future earthquakes, fires, hurricanes, tornadoes, droughts, floods and other weather-related events are difficult to predict and may be exacerbated by global climate change.
Changes in commodity market prices and conditions could adversely affect the cash flows of our borrowers operating in industries that are impacted by changes in commodity prices (including businesses indirectly impacted by commodities prices such as businesses that transport commodities or manufacture equipment used in the production of commodities), which could impair their ability to service any loans outstanding to them and/or reduce demand for loans in those industries.
Our ability to identify and address cyber-security risks such as data security breaches, malware, “denial of service” attacks, “hacking” and identity theft, including account take-overs, a failure of which could disrupt our business and result in the disclosure of and/or misuse or misappropriation of confidential or proprietary information, disruption or damage to our systems, increased costs, losses, or adverse effects to our reputation.
Our ability to achieve our expense management initiatives.
Market replacement of LIBOR and the related effect on our LIBOR-based financial products and contracts, including, but not limited to, derivative products, debt obligations, deposits, investments, and loans.
Possible downgrades in our credit ratings or outlook could, among other negative impacts, increase the costs of funding from capital markets.
The effects of a possible downgrade in the U.S. government’s sovereign credit rating or outlook, which could result in risks to us and general economic conditions that we are not able to predict.
The effects of problems encountered by other financial institutions that adversely affect us or the banking industry generally could require us to change certain business practices, reduce our revenue, impose additional costs on us, or otherwise negatively affect our businesses.
The effects of the failure of any component of our business infrastructure provided by a third party could disrupt our businesses, result in the disclosure of and/or misuse of confidential information or proprietary information, increase our costs, negatively affect our reputation, and cause losses.

12


Our ability to receive dividends from our subsidiaries could affect our liquidity and ability to pay dividends to shareholders.
Changes in accounting policies or procedures as may be required by the FASB or other regulatory agencies could materially affect our financial statements and how we report those results, and expectations and preliminary analyses relating to how such changes will affect our financial results could prove incorrect.
Other risks identified from time to time in reports that we file with the SEC.
Fluctuations in the price of our common stock and inability to complete stock repurchases in the time frame and/or on the terms anticipated.
The effects of any damage to our reputation resulting from developments related to any of the items identified above.
The foregoing list of factors is not exhaustive. For discussion of these and other factors that may cause actual results to differ from expectations, look under the captions “Forward-Looking Statements” and “Risk Factors” of Regions’ Annual Report on Form 10-K for the year ended December 31, 2019 and the "Risk Factors" of Regions' Quarterly Report on Form 10-Q for the quarter ended June 30, 2020 as filed with the SEC.

Further, statements about the potential effects of the COVID-19 pandemic on our businesses and financial results and conditions may constitute forward-looking statements and are subject to the risk that the actual effects may differ, possibly materially, from what is reflected in those forward-looking statements due to factors and future developments that are uncertain, unpredictable and in many cases beyond our control, including the scope and duration of the pandemic (including any second wave or resurgences), actions taken by governmental authorities in response to the pandemic, and the direct and indirect impact of the pandemic on our customers, third parties and us.
The words “future,” “anticipates,” “assumes,” “intends,” “plans,” “seeks,” “believes,” “predicts,” “potential,” “objectives,” “estimates,” “expects,” “targets,” “projects,” “outlook,” “forecast,” “would,” “will,” “may,” “might,” “could,” “should,” “can,” and similar terms and expressions often signify forward-looking statements.
You should not place undue reliance on any forward-looking statements, which speak only as of the date made. Factors or events that could cause our actual results to differ may emerge from time to time, and it is not possible to predict all of them. We assume no obligation and do not intend to update or revise any forward-looking statements that are made from time to time, either as a result of future developments, new information or otherwise, except as may be required by law.
Regions’ Investor Relations contact is Dana Nolan at (205) 264-7040; Regions’ Media contact is Evelyn Mitchell at (205) 264-4551.
Use of non-GAAP financial measures
Management uses pre-tax pre-provision income (non-GAAP) and adjusted pre-tax pre-provision income (non-GAAP), as well as the adjusted efficiency ratio (non-GAAP) and the adjusted fee income ratio (non-GAAP) to monitor performance and believes these measures provide meaningful information to investors. Non-interest expense (GAAP) is presented excluding certain adjustments to arrive at adjusted non-interest expense (non-GAAP), which is the numerator for the efficiency ratio. Non-interest income (GAAP) is presented excluding certain adjustments to arrive at adjusted non-interest income (non-GAAP), which is the numerator for the fee income ratio. Adjusted non-interest income (non-GAAP) and adjusted non-interest expense (non-GAAP) are used to determine adjusted pre-tax pre-provision income (non-GAAP). Net interest income (GAAP) on a taxable-equivalent basis and non-interest income are added together to arrive at total revenue on a taxable-equivalent basis. Adjustments are made to arrive at adjusted total revenue on a taxable-equivalent basis (non-GAAP), which is the denominator for the fee income and efficiency ratios. Regions believes that the exclusion of these adjustments provides a meaningful base for period-to-period comparisons, which management believes will assist investors in analyzing the operating results of the Company and predicting future performance. These non-GAAP financial measures are also used by management to assess the performance of Regions’ business. It is possible that the activities related to the adjustments may recur; however, management does not consider the activities related to the adjustments to be indications of ongoing operations. Regions believes that presentation of these non-GAAP financial measures will permit investors to assess the performance of the Company on the same basis as that applied by management.

The allowance for credit losses (ACL) as a percentage of total loans is an important ratio, especially during periods of economic stress. Management believes this ratio provides investors with meaningful additional information about credit loss allowance levels when the SBA's Paycheck Protection Program loans, which are fully backed by the U.S. government, are excluded from total loans which is the denominator used in the ACL ratio. This adjusted ACL ratio represents a non-GAAP financial measure.

Tangible common stockholders’ equity ratios have become a focus of some investors and management believes they may assist investors in analyzing the capital position of the Company absent the effects of intangible assets and preferred stock. Analysts and banking regulators have assessed Regions’ capital adequacy using the tangible common stockholders’ equity measure. Because tangible common stockholders’ equity is not formally defined by GAAP or prescribed in any amount by federal banking regulations it is currently considered to be a non-GAAP financial measure and other entities may calculate it differently than Regions’ disclosed calculations. Since analysts and banking regulators may assess Regions’ capital adequacy using tangible common stockholders’ equity, management believes that it is useful to provide investors the ability to assess Regions’ capital adequacy on this same basis.

Non-GAAP financial measures have inherent limitations, are not required to be uniformly applied and are not audited. Although these non-GAAP financial measures are frequently used by stakeholders in the evaluation of a company, they have limitations as analytical tools, and should not be considered in isolation, or as a substitute for analyses of results as reported under GAAP. In particular, a measure of earnings that excludes selected items does not represent the amount that effectively accrues directly to stockholders.
Management and the Board of Directors utilize non-GAAP measures as follows:
Preparation of Regions' operating budgets
Monthly financial performance reporting
Monthly close-out reporting of consolidated results (management only)
Presentation to investors of company performance

13
Exhibit 99.2

regionslogob20.jpg
Regions Financial Corporation and Subsidiaries
Financial Supplement
Third Quarter 2020


Regions Financial Corporation and Subsidiaries                                
Financial Supplement to Third Quarter 2020 Earnings Release


Table of Contents


Page
 
 
Financial Highlights


Selected Ratios and Other Information


Consolidated Statements of Operations


Consolidated Average Daily Balances and Yield / Rate Analysis


Pre-Tax Pre-Provision Income ("PPI") and Adjusted PPI


Non-Interest Income, Mortgage Income, Wealth Management Income and Capital Markets Income


Non-Interest Expense


Reconciliation to GAAP Financial Measures
  
 
Adjusted Efficiency Ratios, Adjusted Fee Income Ratios, Adjusted Non-Interest Income / Expense, Adjusted Operating Leverage Ratios, and Return Ratios


Credit Quality
  
 
Allowance for Credit Losses, Net Charge-Offs and Related Ratios
  
Non-Accrual Loans (excludes loans held for sale), Early and Late Stage Delinquencies
  
Troubled Debt Restructurings


Consolidated Balance Sheets


Loans


Deposits


Reconciliation to GAAP Financial Measures
  
 
Tangible Common Ratios


Forward-Looking Statements


Regions Financial Corporation and Subsidiaries                                
Financial Supplement to Third Quarter 2020 Earnings Release

Financial Highlights
 
Quarter Ended
($ amounts in millions, except per share data)
9/30/2020

6/30/2020

3/31/2020

12/31/2019

9/30/2019
Earnings Summary


Interest income - taxable equivalent
$
1,071


$
1,076


$
1,091


$
1,111


$
1,163

Interest expense - taxable equivalent
71


91


151


180


213

Net interest income - taxable equivalent
1,000


985


940


931


950

Less: Taxable-equivalent adjustment
12


13

12


13

13
Net interest income
988


972


928


918


937

Provision for credit losses (1)
113


882


373


96


108

Net interest income after provision for credit losses (1)
875


90


555


822


829

Non-interest income
655


573


485


562


558

Non-interest expense
896


924


836


897


871

Income (loss) before income taxes
634


(261
)

204


487


516

Income tax expense (benefit)
104


(47
)

42


98


107

Net income (loss)
$
530


$
(214
)

$
162


$
389


$
409

Net income (loss) available to common shareholders
$
501


$
(237
)

$
139


$
366


$
385


Earnings (loss) per common share - basic
0.52


(0.25
)

0.15


0.38


0.39

Earnings (loss) per common share - diluted
0.52


(0.25
)

0.14


0.38


0.39


Balance Sheet Summary


At quarter-end


Loans, net of unearned income
$
88,359

 
$
90,548

 
$
88,098

 
$
82,963

 
$
82,786

Allowance for loan losses
(2,276
)
 
(2,276
)
 
(1,560
)
 
(869
)
 
(869
)
Allowance for credit losses
(2,425
)
 
(2,425
)
 
(1,665
)
 
(914
)
 
(917
)
Assets
145,180

 
144,070

 
133,542

 
126,240

 
128,147

Deposits
118,445

 
116,779

 
100,030

 
97,475

 
94,305

Long-term borrowings - Federal Home Loan Bank advances

 
401

 
4,651

 
2,501

 
3,001

Long-term borrowings - Other
4,919

 
6,007

 
5,454

 
5,378

 
6,127

Shareholders' equity
17,904

 
17,602

 
17,332

 
16,295

 
16,581

Average balances


Loans, net of unearned income
$
89,370

 
$
91,964

 
$
83,249

 
$
82,392

 
$
82,986

Assets
142,845

 
139,820

 
124,771

 
124,138

 
124,663

Deposits
116,656

 
110,921

 
95,672

 
94,512

 
94,056

Long-term borrowings - Federal Home Loan Bank advances
392

 
1,266

 
3,003

 
2,659

 
3,222

Long-term borrowings - Other
5,437

 
6,301

 
5,399

 
5,942

 
6,118

Shareholders' equity
17,759

 
17,384

 
16,460

 
16,564

 
16,621

_______
(1) Upon adoption of the Current Expected Credit Losses (CECL) accounting guidance on January 1, 2020, the provision for credit losses is the sum of the provision for loan losses and the provision for unfunded credit commitments. Prior to the adoption of CECL, the provision for unfunded commitments was included in other non-interest expense.


1

Regions Financial Corporation and Subsidiaries                                
Financial Supplement to Third Quarter 2020 Earnings Release

Selected Ratios and Other Information
 
As of and for Quarter Ended
 
9/30/2020
 
6/30/2020
 
3/31/2020
 
12/31/2019
 
9/30/2019
Return on average assets* (1)
1.48
%
 
(0.61
)%
 
0.52
%
 
1.24
%
 
1.30
%
Return on average common shareholders' equity*
12.38
%
 
(5.96
)%
 
3.69
%
 
9.51
%
 
9.98
%
Return on average tangible common shareholders’ equity (non-GAAP)* (2)
18.32
%
 
(8.90
)%
 
5.43
%
 
13.95
%
 
14.62
%
Efficiency ratio
54.1
%
 
59.4
 %
 
58.6
%
 
60.1
%
 
57.7
%
Adjusted efficiency ratio (non-GAAP) (2)
55.3
%
 
57.7
 %
 
57.9
%
 
58.1
%
 
57.4
%
Common book value per share
$
16.92

 
$
16.61

 
$
16.73

 
$
15.65

 
$
15.83

Tangible common book value per share (non-GAAP) (2)
$
11.49

 
$
11.16

 
$
11.67

 
$
10.58

 
$
10.79

Tangible common shareholders’ equity to tangible assets (non-GAAP) (2)
7.88
%
 
7.72
 %
 
8.68
%
 
8.34
%
 
8.44
%
Basel III common equity (3)
$
10,092

 
$
9,716

 
$
10,294

 
$
10,228

 
$
10,121

Total risk-weighted assets (3)
$
108,764

 
$
109,539

 
$
108,985

 
$
105,705

 
$
105,652

Basel III common equity Tier 1 ratio (3)
9.3
%
 
8.9
 %
 
9.4
%
 
9.7
%
 
9.6
%
Tier 1 capital ratio (3)
10.8
%
 
10.4
 %
 
10.6
%
 
10.9
%
 
10.8
%
Total risk-based capital ratio (3)
13.0
%
 
12.6
 %
 
12.5
%
 
12.7
%
 
12.6
%
Leverage ratio (3)
8.5
%
 
8.4
 %
 
9.6
%
 
9.6
%
 
9.5
%
Effective tax rate
16.5
%
 
18.3
 %
 
20.6
%
 
20.3
%
 
20.6
%
Allowance for loan losses as a percentage of loans, net of unearned income
2.58
%
 
2.51
 %
 
1.77
%
 
1.05
%
 
1.05
%
Allowance for loan losses to non-performing loans, excluding loans held for sale
297
%
 
370
 %
 
244
%
 
171
%
 
188
%
Allowance for credit losses as a percentage of loans, net of unearned income
2.74
%
 
2.68
 %
 
1.89
%
 
1.10
%
 
1.11
%
Allowance for credit losses as a percentage of loans excluding PPP, net of unearned income (non-GAAP)(2)
2.90
%
 
2.82
 %
 
1.89
%
 
1.10
%
 
1.11
%
Allowance for credit losses to non-performing loans, excluding loans held for sale
316
%
 
395
 %
 
261
%
 
180
%
 
198
%
Net interest margin (FTE)*
3.13
%
 
3.19
 %
 
3.44
%
 
3.39
%
 
3.44
%
Loans, net of unearned income, to total deposits
74.6
%
 
77.5
 %
 
88.1
%
 
85.1
%
 
87.8
%
Net charge-offs as a percentage of average loans*
0.50
%
 
0.80
 %
 
0.59
%
 
0.46
%
 
0.44
%
Non-accrual loans, excluding loans held for sale, as a percentage of loans
0.87
%
 
0.68
 %
 
0.72
%
 
0.61
%
 
0.56
%
Non-performing assets (excluding loans 90 days past due) as a percentage of loans, foreclosed properties, non-marketable investments and non-performing loans held for sale
0.90
%
 
0.74
 %
 
0.79
%
 
0.70
%
 
0.65
%
Non-performing assets (including loans 90 days past due) as a percentage of loans, foreclosed properties, non-marketable investments and non-performing loans held for sale (4)
1.08
%
 
0.91
 %
 
0.96
%
 
0.89
%
 
0.82
%
Associate headcount—full-time equivalent (5)
19,766

 
20,073

 
19,743

 
19,564

 
19,549

ATMs
2,058

 
2,038

 
2,042

 
2,028

 
1,993

Branch Statistics


Full service
1,334

 
1,340

 
1,374

 
1,374

 
1,370

Drive-through/transaction service only
47

 
51

 
53

 
54

 
55

Total branch outlets
1,381

 
1,391

 
1,427

 
1,428

 
1,425


*Annualized
(1)
Calculated by dividing income by consolidated average assets.
(2)
See reconciliation of GAAP to non-GAAP Financial Measures on pages 7, 11, 12, 13, 15, 20, 21, and 24.
(3)
Current quarter Basel III common equity as well as Total risk-weighted assets, Basel III common equity Tier 1, Tier 1 capital, Total risk-based capital and Leverage ratios are estimated.
(4)
Excludes guaranteed residential first mortgages that are 90+ days past due and still accruing. Refer to the footnotes on page 16 for amounts related to these loans.
(5)
Associate headcount for the second quarter of 2020 includes 463 associates from the Ascentium acquisition.


2

Regions Financial Corporation and Subsidiaries                                
Financial Supplement to Third Quarter 2020 Earnings Release

Consolidated Statements of Operations (unaudited)
 
Quarter Ended
($ amounts in millions, except per share data)
9/30/2020
 
6/30/2020
 
3/31/2020
 
12/31/2019
 
9/30/2019
Interest income on:


Loans, including fees
$
903

 
$
898

 
$
903

 
$
923

 
$
970

Debt securities
140

 
148

 
158

 
155

 
160

Loans held for sale
8

 
6

 
5

 
5

 
5

Other earning assets
8

 
11

 
13

 
15

 
15

Total interest income
1,059

 
1,063

 
1,079

 
1,098

 
1,150

Interest expense on:


Deposits
32

 
40

 
84

 
98

 
116

Short-term borrowings

 
2

 
8

 
12

 
14

Long-term borrowings
39

 
49

 
59

 
70

 
83

Total interest expense
71

 
91

 
151

 
180

 
213

Net interest income
988

 
972

 
928

 
918

 
937

Provision for credit losses (1)
113

 
882

 
373

 
96

 
108

Net interest income after provision for credit losses (1)
875

 
90

 
555

 
822

 
829

Non-interest income:


Service charges on deposit accounts
152

 
131

 
178

 
187

 
186

Card and ATM fees
115

 
101

 
105

 
112

 
114

Wealth management income
85

 
79

 
84

 
84

 
83

Capital markets income
61

 
95

 
9

 
61

 
36

Mortgage income
108

 
82

 
68

 
49

 
56

Securities gains (losses), net
3

 
1


(2
)
 

Other
131

 
84

 
41

 
71

 
83

Total non-interest income
655

 
573

 
485

 
562

 
558

Non-interest expense:


Salaries and employee benefits
525

 
527

 
467

 
488

 
481

Net occupancy expense
80

 
76

 
79

 
79

 
80

Furniture and equipment expense
89

 
86

 
83

 
82

 
83

Other
202

 
235

 
207

 
248

 
227

Total non-interest expense
896

 
924

 
836

 
897

 
871

Income (loss) before income taxes
634

 
(261
)
 
204

 
487

 
516

Income tax expense (benefit)
104

 
(47
)
 
42

 
98

 
107

Net income (loss)
$
530

 
$
(214
)
 
$
162

 
$
389

 
$
409

Net income (loss) available to common shareholders
$
501

 
$
(237
)
 
$
139

 
$
366

 
$
385

Weighted-average shares outstanding—during quarter:


Basic
960

 
960

 
957

 
963

 
988

Diluted
962

 
960

 
961

 
968

 
991

Actual shares outstanding—end of quarter
960

 
960

 
957

 
957

 
964

Earnings (loss) per common share: (2)


Basic
$
0.52

 
$
(0.25
)
 
$
0.15

 
$
0.38

 
$
0.39

Diluted
$
0.52

 
$
(0.25
)
 
$
0.14

 
$
0.38

 
$
0.39

Taxable-equivalent net interest income
$
1,000

 
$
985

 
$
940

 
$
931

 
$
950

________
(1) Upon adoption of CECL on January 1, 2020, the provision for credit losses is the sum of the provision for loan losses and the provision for unfunded credit commitments. Prior to the
adoption of CECL, the provision for unfunded commitments was included in other non-interest expense.
(2) Quarterly amounts may not add to year-to-date amounts due to rounding.


3

Regions Financial Corporation and Subsidiaries                                
Financial Supplement to Third Quarter 2020 Earnings Release

Consolidated Statements of Operations (continued) (unaudited)
 
Nine Months Ended September 30
($ amounts in millions, except per share data)
2020
 
2019
Interest income on:


Loans, including fees
$
2,704

 
$
2,943

Debt securities
446

 
488

Loans held for sale
19

 
12

Other earning assets
32

 
55

Total interest income
3,201

 
3,498

Interest expense on:


Deposits
156

 
349

Short-term borrowings
10

 
41

Long-term borrowings
147

 
281

Total interest expense
313

 
671

Net interest income
2,888

 
2,827

Provision for credit losses (1)
1,368

 
291

Net interest income after provision for credit losses (1)
1,520

 
2,536

Non-interest income:


Service charges on deposit accounts
461

 
542

Card and ATM fees
321

 
343

Wealth management income
248

 
238

Capital markets income
165

 
117

Mortgage income
258

 
114

Securities gains (losses), net
4

 
(26
)
Other
256

 
226

Total non-interest income
1,713

 
1,554

Non-interest expense:


Salaries and employee benefits
1,519

 
1,428

Net occupancy expense
235

 
242

Furniture and equipment expense
258

 
243

Other
644

 
679

Total non-interest expense
2,656

 
2,592

Income before income taxes
577

 
1,498

Income tax expense
99

 
305

Net income
$
478

 
$
1,193

Net income available to common shareholders
$
403

 
$
1,137

Weighted-average shares outstanding—during year:


Basic
959

 
1,005

Diluted
961

 
1,010

Actual shares outstanding—end of period
960

 
964

Earnings per common share:


Basic
$
0.42

 
$
1.13

Diluted
$
0.42

 
$
1.13

Taxable-equivalent net interest income
$
2,925

 
$
2,867


(1) Upon adoption of CECL on January 1, 2020, the provision for credit losses is the sum of the provision for loan losses and the provision for unfunded credit commitments. Prior to the
adoption of CECL, the provision for unfunded commitments was included in other non-interest expense.


4

Regions Financial Corporation and Subsidiaries                                
Financial Supplement to Third Quarter 2020 Earnings Release

Consolidated Average Daily Balances and Yield/Rate Analysis
 
Quarter Ended
 
9/30/2020
 
6/30/2020
($ amounts in millions; yields on taxable-equivalent basis)
Average Balance
 
Income/ Expense
 
Yield/ Rate
 
Average Balance
 
Income/ Expense
 
Yield/ Rate
Assets


Earning assets:


Debt securities (1)
$
24,950

 
$
140

 
2.24
 %
 
$
23,828

 
$
148

 
2.49
%
Loans held for sale
1,147

 
8

 
2.89

 
807

 
6

 
3.06

Loans, net of unearned income:


Commercial and industrial
46,405

 
474

 
4.05

 
49,296

 
461

 
3.74

Commercial real estate mortgage—owner-occupied
5,498

 
63

 
4.50

 
5,492

 
61

 
4.41

Commercial real estate construction—owner-occupied
318

 
3

 
4.04

 
312

 
3

 
4.20

Commercial investor real estate mortgage
5,324

 
31

 
2.27

 
5,150

 
33

 
2.53

Commercial investor real estate construction
1,974

 
15

 
2.87

 
1,869

 
15

 
3.30

Residential first mortgage
15,786

 
135

 
3.41

 
14,884

 
130

 
3.50

Home equity
7,727

 
70

 
3.59

 
8,042

 
73

 
3.65

Indirect—vehicles
1,223

 
10

 
3.25

 
1,441

 
11

 
3.24

Indirect—other consumer
2,835

 
57

 
8.06

 
3,111

 
65

 
8.36

Consumer credit card
1,194

 
38

 
12.62

 
1,230

 
36

 
11.65

Other consumer
1,086

 
19

 
7.36

 
1,137

 
23

 
7.54

Total loans, net of unearned income
89,370

 
915

 
4.06

 
91,964

 
911

 
3.96

Other earning assets
11,695

 
8

 
0.30

 
7,541

 
11

 
0.53

Total earning assets
127,162

 
1,071

 
3.35

 
124,140

 
1,076

 
3.46

Unrealized gains/(losses) on debt securities available for sale, net (1)
1,143


1,031


Allowance for loan losses
(2,308
)


(1,860
)


Cash and due from banks
2,174


2,070


Other non-earning assets
14,674


14,439


$
142,845


$
139,820


Liabilities and Shareholders’ Equity


Interest-bearing liabilities:


Savings
$
10,935

 
4

 
0.14

 
$
10,152

 
3

 
0.13

Interest-bearing checking
22,098

 
4

 
0.07

 
21,755

 
6

 
0.11

Money market
29,146

 
8

 
0.12

 
27,870

 
10

 
0.13

Time deposits
6,150

 
16

 
1.08

 
6,690

 
21

 
1.26

Other deposits
13


1.87

 
72


1.64

Total interest-bearing deposits (2)
68,342

 
32

 
0.19

 
66,539

 
40

 
0.24

Other short-term borrowings


1,558

 
2

 
0.53

Long-term borrowings
5,829

 
39

 
2.63

 
7,567

 
49

 
2.56

Total interest-bearing liabilities
74,171

 
71

 
0.38

 
75,664

 
91

 
0.48

Non-interest-bearing deposits (2)
48,314


44,382


Total funding sources
122,485

 
71

 
0.23

 
120,046

 
91

 
0.30

Net interest spread (1)


2.97


2.98

Other liabilities
2,576


2,390


Shareholders’ equity
17,759


17,384


Noncontrolling interest
25


$
142,845


$
139,820


Net interest income /margin FTE basis (1)
 
 
$
1,000

 
3.13
 %


$
985

 
3.19
%
_______
(1) Debt securities are included on an amortized cost basis with yield and net interest margin calculated accordingly.
(2)
Total deposit costs may be calculated by dividing total interest expense on deposits by the sum of interest-bearing deposits and non-interest bearing deposits. The rates for total deposit costs equal 0.11% for the quarter ended September 30, 2020 and 0.14% for the quarter ended June 30, 2020.


5

Regions Financial Corporation and Subsidiaries                                
Financial Supplement to Third Quarter 2020 Earnings Release

Consolidated Average Daily Balances and Yield/Rate Analysis (continued)
 
Quarter Ended
 
03/31/2020
 
12/31/2019
 
9/30/2019
($ amounts in millions; yields on taxable-equivalent basis)
Average Balance
 
Income/ Expense
 
Yield/ Rate
 
Average Balance
 
Income/ Expense
 
Yield/ Rate
 
Average Balance
 
Income/ Expense
 
Yield/ Rate
Assets


Earning assets:


Debt securities (1)
$
23,766

 
$
158

 
2.66
%
 
$
23,830

 
$
155

 
2.61
%
 
$
23,909

 
$
160

 
2.67
%
Loans held for sale
514

 
5

 
3.72

 
540

 
5

 
3.58

 
557

 
5

 
3.73

Loans, net of unearned income:


Commercial and industrial
40,519

 
405

 
4.00

 
39,743

 
416

 
4.14

 
40,200

 
441

 
4.34

Commercial real estate mortgage—owner-occupied
5,509

 
63

 
4.51

 
5,489

 
63

 
4.47

 
5,481

 
66

 
4.74

Commercial real estate construction—owner-occupied
323

 
4

 
4.62

 
357

 
4

 
4.59

 
390

 
5

 
4.63

Commercial investor real estate mortgage
4,975

 
46

 
3.69

 
4,841

 
49

 
3.97

 
4,859

 
54

 
4.35

Commercial investor real estate construction
1,673

 
19

 
4.40

 
1,544

 
19

 
4.80

 
1,529

 
21

 
5.25

Residential first mortgage
14,469

 
140

 
3.86

 
14,416

 
141

 
3.92

 
14,298

 
142

 
3.99

Home equity
8,275

 
89

 
4.31

 
8,478

 
95

 
4.46

 
8,683

 
104

 
4.79

Indirect—vehicles
1,679

 
14

 
3.26

 
1,948

 
16

 
3.29

 
2,247

 
19

 
3.30

Indirect—other consumer
3,263

 
71

 
8.74

 
3,005

 
67

 
8.93

 
2,750

 
63

 
9.16

Consumer credit card
1,348

 
41

 
12.26

 
1,337

 
42

 
12.35

 
1,310

 
43

 
13.11

Other consumer
1,216

 
23

 
7.95

 
1,234

 
24

 
7.96

 
1,239

 
25

 
8.02

Total loans, net of unearned income
83,249

 
915

 
4.40

 
82,392

 
936

 
4.51

 
82,986

 
983

 
4.70

Other earning assets
2,302

 
13

 
2.37

 
2,210

 
15

 
2.63

 
2,087

 
15

 
2.82

Total earning assets 
109,831

 
1,091

 
3.97

 
108,972

 
1,111

 
4.05

 
109,539

 
1,163

 
4.21

Unrealized gains/(losses) on debt securities available for sale, net (1)
510


296


251


Allowance for loan losses
(1,315
)


(872
)


(857
)


Cash and due from banks
1,915


1,939


1,891


Other non-earning assets
13,830


13,803


13,839


$
124,771


$
124,138


$
124,663


Liabilities and Shareholders’ Equity


Interest-bearing liabilities:


Savings
$
8,822

 
4

 
0.17

 
$
8,616

 
3

 
0.14

 
$
8,607

 
4

 
0.16

Interest-bearing checking
19,273

 
22

 
0.47

 
18,668

 
26

 
0.57

 
18,257

 
33

 
0.71

Money market
25,151

 
28

 
0.46

 
25,289

 
36

 
0.56

 
24,904

 
42

 
0.68

Time deposits
7,302

 
26

 
1.44

 
7,543

 
32

 
1.60

 
7,712

 
31

 
1.67

Other deposits
919

 
4

 
1.57

 
298

 
1

 
1.69

 
977

 
6

 
2.25

Total interest-bearing deposits (2)
61,467

 
84

 
0.55

 
60,414

 
98

 
0.64

 
60,457

 
116

 
0.77

Federal funds purchased and securities sold under agreements to repurchase
151

 
1

 
1.39

 
110

 
1

 
1.58

 
208

 
1

 
2.28

Other short-term borrowings
1,644

 
7

 
1.69

 
2,164

 
11

 
2.08

 
2,187

 
13

 
2.31

Long-term borrowings
8,402

 
59

 
2.81

 
8,601

 
70

 
3.23

 
9,340

 
83

 
3.47

Total interest-bearing liabilities 
71,664

 
151

 
0.85

 
71,289

 
180

 
1.00

 
72,192

 
213

 
1.17

Non-interest-bearing deposits (2)
34,205


34,098


33,599


Total funding sources
105,869

 
151

 
0.57

 
105,387

 
180

 
0.67

 
105,791

 
213

 
0.80

Net interest spread (1)


3.12


3.05


3.04

Other liabilities
2,442


2,187


2,251


Shareholders’ equity
16,460


16,564


16,621


$
124,771


$
124,138


$
124,663


Net interest income/margin FTE basis (1)
 
 
$
940

 
3.44
%


$
931

 
3.39
%


$
950

 
3.44
%
_______
(1) Debt securities are included on an amortized cost basis with yield and net interest margin calculated accordingly.
(2) Total deposit costs may be calculated by dividing total interest expense on deposits by the sum of interest-bearing deposits and non-interest bearing deposits. The rates for total deposit costs equal 0.35% for the quarter ended March 31, 2020, 0.41% for the quarter ended December 31, 2019 and 0.49% for the quarter ended September 30, 2019.


6

Regions Financial Corporation and Subsidiaries                                
Financial Supplement to Third Quarter 2020 Earnings Release

Pre-Tax Pre-Provision Income ("PPI") and Adjusted PPI (non-GAAP)
The Pre-Tax Pre-Provision Income tables below present computations of pre-tax pre-provision income excluding certain adjustments (non-GAAP). Regions believes that the presentation of PPI and the exclusion of certain items from PPI provides a meaningful base for period-to-period comparisons, which management believes will assist investors in analyzing the operating results of the Company and predicting future performance. These non-GAAP financial measures are also used by management to assess the performance of Regions’ business. It is possible that the activities related to the adjustments may recur; however, management does not consider the activities related to the adjustments to be indications of ongoing operations. Regions believes that presentation of these non-GAAP financial measures will permit investors to assess the performance of the Company on the same basis as that applied by management. Non-GAAP financial measures have inherent limitations, are not required to be uniformly applied and are not audited. Although these non-GAAP financial measures are frequently used by stakeholders in the evaluation of a company, they have limitations as analytical tools, and should not be considered in isolation, or as a substitute for analyses of results as reported under GAAP. In particular, a measure of income that excludes certain adjustments does not represent the amount that effectively accrues directly to shareholders.
 
Quarter Ended
($ amounts in millions)
9/30/2020
 
6/30/2020
 
3/31/2020
 
12/31/2019
 
9/30/2019
 
3Q20 vs. 2Q20
 
3Q20 vs. 3Q19
Net income (loss) available to common shareholders (GAAP)
$
501

 
$
(237
)
 
$
139

 
$
366

 
$
385

 
$
738

 
311.4
 %
 
$
116

 
30.1
 %
Preferred dividends (GAAP)
29

 
23

 
23

 
23

 
24

 
6

 
26.1
 %
 
5

 
20.8
 %
Income tax expense (benefit) (GAAP)
104

 
(47
)
 
42

 
98

 
107

 
151

 
321.3
 %
 
(3
)
 
(2.8
)%
Income (loss) before income taxes (GAAP)
634

 
(261
)
 
204

 
487

 
516

 
895

 
342.9
 %
 
118

 
22.9
 %
Provision for credit losses (GAAP) (1)
113

 
882

 
373

 
96

 
108

 
(769
)
 
(87.2
)%
 
5

 
4.6
 %
Pre-tax pre-provision income (non-GAAP)
747

 
621

 
577

 
583

 
624

 
126

 
20.3
 %
 
123

 
19.7
 %
Other adjustments:


Securities (gains) losses, net
(3
)
 
(1
)


2


(2
)
 
200.0
 %
 
(3
)
 
NM

Valuation gain on equity investment (2)
(44
)


(44
)
 
NM

 
(44
)
 
NM

Leveraged lease termination gains


(2
)


(1
)


NM

 
1

 
100.0
 %
Salaries and employee benefits—severance charges
2

 
2

 
1


1


 %
 
1

 
100.0
 %
Branch consolidation, property and equipment charges
3

 
10

 
11

 
12

 
5

 
(7
)
 
(70.0
)%
 
(2
)
 
(40.0
)%
Loss on early extinguishment of debt
2

 
6


16


(4
)
 
(66.7
)%
 
2

 
NM

Professional, legal and regulatory expenses

 
7


(7
)
 
(100.0
)%


NM

Acquisition expenses

 
1


(1
)
 
(100.0
)%


NM

Total other adjustments
(40
)
 
25

 
10

 
30

 
5

 
(65
)
 
(260.0
)%
 
(45
)
 
NM

Adjusted pre-tax pre-provision income (non-GAAP)
$
707

 
$
646

 
$
587

 
$
613

 
$
629

 
$
61

 
9.4
 %
 
$
78

 
12.4
 %
 
______
NM - Not Meaningful
(1) Upon adoption of CECL on January 1, 2020, the provision for credit losses is the sum of the provision for loan losses and the provision for unfunded credit commitments. Prior to the
adoption, the provision for unfunded commitments was included in other non-interest expense.
(2) In the third quarter of 2020, the equity investee executed an initial public offering. However, the Company is subject to a conventional post-issuance 180 day lock-up period, which prevents the sale of its position.


7

Regions Financial Corporation and Subsidiaries                                
Financial Supplement to Third Quarter 2020 Earnings Release

Non-Interest Income
 
Quarter Ended
($ amounts in millions)
9/30/2020
 
6/30/2020
 
3/31/2020
 
12/31/2019
 
9/30/2019
 
3Q20 vs. 2Q20
 
3Q20 vs. 3Q19
Service charges on deposit accounts
$
152

 
$
131

 
$
178

 
$
187

 
$
186

 
$
21

 
16.0
 %
 
$
(34
)
 
(18.3
)%
Card and ATM fees
115

 
101

 
105

 
112

 
114

 
14

 
13.9
 %
 
1

 
0.9
 %
Wealth management income
85

 
79

 
84

 
84

 
83

 
6

 
7.6
 %
 
2

 
2.4
 %
Capital markets income (1)
61

 
95

 
9

 
61

 
36

 
(34
)
 
(35.8
)%
 
25

 
69.4
 %
Mortgage income
108

 
82

 
68

 
49

 
56

 
26

 
31.7
 %
 
52

 
92.9
 %
Commercial credit fee income
20

 
17

 
18

 
18

 
19

 
3

 
17.6
 %
 
1

 
5.3
 %
Bank-owned life insurance
17

 
18

 
17

 
18

 
18

 
(1
)
 
(5.6
)%
 
(1
)
 
(5.6
)%
Securities gains (losses), net
3

 
1


(2
)


2

 
200.0
 %
 
3

 
NM

Market value adjustments on employee benefit assets (2)
14

 
16

 
(25
)
 
7

 
7

 
(2
)
 
(12.5
)%
 
7

 
100.0
 %
Valuation gain on equity investment (3)
44


44

 
NM

 
44

 
NM

Other
36

 
33

 
31

 
28

 
39

 
3

 
9.1
 %
 
(3
)
 
(7.7
)%
Total non-interest income
$
655

 
$
573

 
$
485

 
$
562

 
$
558

 
$
82

 
14.3
 %
 
$
97

 
17.4
 %
Mortgage Income
 
Quarter Ended
($ amounts in millions)
9/30/2020
 
6/30/2020
 
3/31/2020
 
12/31/2019
 
9/30/2019
 
3Q20 vs. 2Q20
 
3Q20 vs. 3Q19
Production and sales
$
99

 
$
75

 
$
48

 
$
30

 
$
31

 
$
24

 
32.0
 %
 
$
68

 
219.4
 %
Loan servicing
23

 
23

 
25

 
25

 
25


 %
 
(2
)
 
(8.0
)%
MSR and related hedge impact:


MSRs fair value increase (decrease) due to change in valuation inputs or assumptions

 
(11
)
 
(83
)
 
40

 
(31
)
 
11

 
100.0
 %
 
31

 
100.0
 %
MSRs hedge gain (loss)

 
13

 
97

 
(33
)
 
46

 
(13
)
 
(100.0
)%
 
(46
)
 
(100.0
)%
MSRs change due to payment decay (4)
(14
)
 
(18
)
 
(19
)
 
(13
)
 
(15
)
 
4

 
22.2
 %
 
1

 
6.7
 %
MSR and related hedge impact (4)
(14
)
 
(16
)

(5
)

(6
)


2

 
12.5
 %
 
(14
)
 
NM

Total mortgage income
$
108

 
$
82

 
$
68

 
$
49

 
$
56

 
$
26

 
31.7
 %
 
$
52

 
92.9
 %


Mortgage production - purchased
$
1,776

 
$
1,390

 
$
894

 
$
1,014

 
$
1,139

 
$
386

 
27.8
 %
 
$
637

 
55.9
 %
Mortgage production - refinanced
1,712

 
2,563

 
576

 
639

 
578

 
(851
)
 
(33.2
)%
 
1,134

 
196.2
 %
Total mortgage production (5)
$
3,488

 
$
3,953

 
$
1,470

 
$
1,653

 
$
1,717

 
$
(465
)
 
(11.8
)%
 
$
1,771

 
103.1
 %
 
Wealth Management Income
 
Quarter Ended
($ amounts in millions)
9/30/2020
 
6/30/2020
 
3/31/2020
 
12/31/2019
 
9/30/2019
 
3Q20 vs. 2Q20
 
3Q20 vs. 3Q19
Investment management and trust fee income
$
62

 
$
62

 
$
62

 
$
64

 
$
63

 
$

 
%
 
$
(1
)
 
(1.6
)%
Investment services fee income
23

 
17

 
22

 
20

 
20

 
6

 
35.3
%
 
3

 
15.0
 %
Total wealth management income (6)
$
85

 
$
79


$
84

 
$
84

 
$
83

 
$
6

 
7.6
%
 
$
2

 
2.4
 %
Capital Markets Income
 
Quarter Ended
($ amounts in millions)
9/30/2020
 
6/30/2020
 
3/31/2020
 
12/31/2019
 
9/30/2019
 
3Q20 vs. 2Q20
 
3Q20 vs. 3Q19
Capital markets income
$
61

 
$
95

 
$
9

 
$
61

 
$
36

 
$
(34
)
 
(35.8
)%
 
$
25

 
69.4
%
Less: Valuation adjustments on customer derivatives (7)
5

 
34

 
(34
)
 
5

 
(6
)
 
(29
)
 
(85.3
)%
 
11

 
183.3
%
Capital markets income excluding valuation adjustments
$
56

 
$
61

 
$
43

 
$
56

 
$
42

 
$
(5
)
 
(8.2
)%
 
$
14

 
33.3
%
_________
NM - Not Meaningful
(1)
Capital markets income primarily relates to capital raising activities that includes debt securities underwriting and placement, loan syndication and placement, as well as foreign exchange, derivative and merger and acquisition advisory services.
(2)
These market value adjustments relate to assets held for employee benefits that are offset within salaries and employee benefits expense.
(3)
In the third quarter of 2020, the equity investee executed an initial public offering. However, the Company is subject to a conventional post-issuance 180 day lock-up period, which prevents the sale of its position.
(4)
In the first quarter of 2020, Regions revised its MSR decay methodology from a passage of time approach to a discounted net cash flow approach. The change in methodology results in shifts between decay and hedge impacts, but does not impact the overall valuation.
(5)
Total mortgage production represents production during the period, including amounts sold into the secondary market as well as amounts retained in Regions' residential first mortgage loan portfolio.
(6)
Total wealth management income presented above does not include the portion of service charges on deposit accounts and similar smaller dollar amounts that are also attributable to the wealth management segment.
(7)
For the purposes of determining the fair value of customer derivatives, the Company considers the risk of nonperformance by counterparties, as well as the Company's own risk of nonperformance. The valuation adjustments above are reflective of the values associated with these considerations.


8

Regions Financial Corporation and Subsidiaries                                
Financial Supplement to Third Quarter 2020 Earnings Release

Non-Interest Income
 
Nine Months Ended
 
Year-to-Date 9/30/2020 vs. 9/30/2019
($ amounts in millions)
9/30/2020
 
9/30/2019
 
Amount
 
Percent
Service charges on deposit accounts
$
461

 
$
542

 
$
(81
)
 
(14.9
)%
Card and ATM fees
321

 
343

 
(22
)
 
(6.4
)%
Wealth management income
248

 
238

 
10

 
4.2
 %
Capital markets income (1)
165

 
117

 
48

 
41.0
 %
Mortgage income
258

 
114

 
144

 
126.3
 %
Commercial credit fee income
55

 
55


 %
Bank-owned life insurance
52

 
60

 
(8
)
 
(13.3
)%
Securities gains (losses), net
4

 
(26
)
 
30

 
115.4
 %
Market value adjustments on employee benefit assets - defined benefit (2)

 
5

 
(5
)
 
(100.0
)%
Market value adjustments on employee benefit assets - other (3)
5

 
4

 
1

 
25.0
 %
Valuation gain on equity investment (4)
44


44

 
NM

Other
100

 
102

 
(2
)
 
(2.0
)%
Total non-interest income
$
1,713

 
$
1,554

 
$
159

 
10.2
 %
Mortgage Income
 
Nine Months Ended
 
Year-to-Date 9/30/2020 vs. 9/30/2019
($ amounts in millions)
9/30/2020
 
9/30/2019
 
Amount
 
Percent
Production and sales
$
222

 
$
76

 
$
146

 
192.1
 %
Loan servicing
71

 
77

 
(6
)
 
(7.8
)%
MSR and related hedge impact:


MSRs fair value increase (decrease) due to change in valuation inputs or assumptions
(94
)
 
(102
)
 
8

 
7.8
 %
MSRs hedge gain (loss)
110

 
103

 
7

 
6.8
 %
MSRs change due to payment decay (5)
(51
)
 
(40
)
 
(11
)
 
(27.5
)%
MSR and related hedge impact (5)
(35
)
 
(39
)
 
4

 
10.3
 %
Total mortgage income
$
258

 
$
114

 
$
144

 
126.3
 %


Mortgage production - purchased
$
4,060

 
$
3,000

 
$
1,060

 
35.3
 %
Mortgage production - refinanced
4,851

 
1,099

 
3,752

 
341.4
 %
Total mortgage production (6)
$
8,911

 
$
4,099

 
$
4,812

 
117.4
 %
Wealth Management Income
 
Nine Months Ended
 
Year-to-Date 9/30/2020 vs. 9/30/2019
($ amounts in millions)
9/30/2020
 
9/30/2019
 
Amount
 
Percent
Investment management and trust fee income
$
186

 
$
179

 
$
7

 
3.9
%
Investment services fee income
62

 
59

 
3

 
5.1
%
Total wealth management income (7)
$
248

 
$
238

 
$
10

 
4.2
%
Capital Markets Income
 
Nine Months Ended
 
Year-to-Date 9/30/2020 vs. 9/30/2019
($ amounts in millions)
9/30/2020
 
9/30/2019
 
Amount
 
Percent
Capital markets income
$
165

 
$
117

 
$
48

 
41.0
%
Less: Valuation adjustments on customer derivatives (8)
5

 
(15
)
 
20

 
133.3
%
Capital markets income excluding valuation adjustments
$
160

 
$
132

 
$
28

 
21.2
%
_________
NM - Not Meaningful
(1)
Capital markets income primarily relates to capital raising activities that includes debt securities underwriting and placement, loan syndication and placement, as well as foreign exchange, derivative and merger and acquisition advisory services.
(2)
During the second quarter of 2019, the Company reallocated these employee benefit assets from primarily equity securities to fixed income investments. Market valuation adjustments for fixed income investments are recorded in other comprehensive income, and as such these adjustments have not impacted non-interest income since the first quarter of 2019.
(3)
These market value adjustments relate to assets held for employee benefits that are offset within salaries and employee benefits expense.
(4)
In the third quarter of 2020, the equity investee executed an initial public offering. However, the Company is subject to a conventional post-issuance 180 day lock-up period, which prevents the sale of its position.
(5)
In the first quarter of 2020, Regions revised its MSR decay methodology from a passage of time approach to a discounted net cash flow approach. The change in methodology results in shifts between decay and hedge impacts, but does not impact the overall valuation.
(6)
Total mortgage production represents production during the period, including amounts sold into the secondary market as well as amounts retained in Regions' residential first mortgage loan portfolio.
(7)
Total wealth management income presented above does not include the portion of service charges on deposit accounts and similar smaller dollar amounts that are also attributable to the wealth management segment.
(8)
For the purposes of determining the fair value of customer derivatives, the Company considers the risk of nonperformance by counterparties, as well as the Company's own risk of nonperformance. The valuation adjustments above are reflective of the values associated with these considerations.


9

Regions Financial Corporation and Subsidiaries                                
Financial Supplement to Third Quarter 2020 Earnings Release

Non-Interest Expense
 
Quarter Ended
($ amounts in millions)
9/30/2020
 
6/30/2020
 
3/31/2020
 
12/31/2019
 
9/30/2019
 
3Q20 vs. 2Q20
 
3Q20 vs. 3Q19
Salaries and employee benefits
$
525

 
$
527

 
$
467

 
$
488

 
$
481

 
$
(2
)
 
(0.4
)%

$
44

 
9.1
 %
Net occupancy expense
80

 
76

 
79

 
79

 
80

 
4

 
5.3
 %


 %
Furniture and equipment expense
89

 
86

 
83

 
82

 
83

 
3

 
3.5
 %
 
6

 
7.2
 %
Outside services
44

 
44

 
45

 
44

 
48


 %
 
(4
)
 
(8.3
)%
Professional, legal and regulatory expenses
22

 
28

 
18

 
28

 
21

 
(6
)
 
(21.4
)%
 
1

 
4.8
 %
Marketing
22

 
22

 
24

 
28

 
23


 %
 
(1
)
 
(4.3
)%
FDIC insurance assessments
10

 
15

 
11

 
11

 
12

 
(5
)
 
(33.3
)%
 
(2
)
 
(16.7
)%
Credit/checkcard expenses
12

 
12

 
13

 
15

 
19


 %
 
(7
)
 
(36.8
)%
Branch consolidation, property and equipment charges
3

 
10

 
11

 
12

 
5

 
(7
)
 
(70.0
)%
 
(2
)
 
(40.0
)%
Visa class B shares expense
5

 
9

 
4

 
2

 
5

 
(4
)
 
(44.4
)%


 %
Provision (credit) for unfunded credit losses (1)


(3
)
 
(2
)


 %
 
2

 
100.0
 %
Loss on early extinguishment of debt
2

 
6


16


(4
)
 
(66.7
)%
 
2

 
NM

Other
82

 
89

 
81

 
95

 
96

 
(7
)
 
(7.9
)%
 
(14
)
 
(14.6
)%
Total non-interest expense
$
896

 
$
924

 
$
836

 
$
897

 
$
871

 
$
(28
)
 
(3.0
)%
 
$
25

 
2.9
 %
 
 
Nine Months Ended
 
Year-to-Date 9/30/2020 vs. 9/30/2019
($ amounts in millions)
9/30/2020
 
9/30/2019
 
Amount
 
Percent
Salaries and employee benefits
$
1,519

 
$
1,428

 
$
91

 
6.4
 %
Net occupancy expense
235

 
242

 
(7
)
 
(2.9
)%
Furniture and equipment expense
258

 
243

 
15

 
6.2
 %
Outside services
133

 
145

 
(12
)
 
(8.3
)%
Professional, legal and regulatory expenses
68

 
67

 
1

 
1.5
 %
Marketing
68

 
69

 
(1
)
 
(1.4
)%
FDIC insurance assessments
36

 
37

 
(1
)
 
(2.7
)%
Credit/checkcard expenses
37

 
53

 
(16
)
 
(30.2
)%
Branch consolidation, property and equipment charges
24

 
13

 
11

 
84.6
 %
Visa class B shares expense
18

 
12

 
6

 
50.0
 %
Provision (credit) for unfunded credit losses (1)

 
(3
)
 
3

 
100.0
 %
Loss on early extinguishment of debt
8


8

 
NM

Other
252

 
286

 
(34
)
 
(11.9
)%
Total non-interest expense
$
2,656

 
$
2,592

 
$
64

 
2.5
 %
_________
NM - Not Meaningful
(1) Upon adoption of CECL on January 1, 2020, the provision for credit losses presented within net interest income after provision for credit losses is the sum of the provision for loan losses and the provision for unfunded credit commitments. Prior to the adoption of CECL, the provision for unfunded commitments was included in other non-interest expense.


10

Regions Financial Corporation and Subsidiaries                                
Financial Supplement to Third Quarter 2020 Earnings Release

Reconciliation to GAAP Financial Measures
Adjusted Efficiency Ratios, Adjusted Fee Income Ratios, Adjusted Non-Interest Income/Expense, and Adjusted Operating Leverage Ratios
The table below and on the following page present computations of the efficiency ratio, which is a measure of productivity, generally calculated as non-interest expense divided by total revenue; and the fee income ratio, generally calculated as non-interest income divided by total revenue. Management uses these ratios to monitor performance and believes these measures provide meaningful information to investors. Non-interest expense (GAAP) is presented excluding certain adjustments to arrive at adjusted non-interest expense (non-GAAP), which is the numerator for the efficiency ratio. Non-interest income (GAAP) is presented excluding certain adjustments to arrive at adjusted non-interest income (non-GAAP), which is the numerator for the fee income ratio. Net interest income and non-interest income are added together to arrive at total revenue. Adjustments are made to arrive at adjusted total revenue (non-GAAP). Net interest income on a taxable-equivalent basis and non-interest income are added together to arrive at total revenue on a taxable-equivalent basis. Adjustments are made to arrive at adjusted total revenue on a taxable-equivalent basis (non-GAAP), which is the denominator for the fee income and efficiency ratios. Regions believes that the exclusion of these adjustments provides a meaningful base for period-to-period comparisons, which management believes will assist investors in analyzing the operating results of the Company and predicting future performance. These non-GAAP financial measures are also used by management to assess the performance of Regions’ business. It is possible that the activities related to the adjustments may recur; however, management does not consider the activities related to the adjustments to be indications of ongoing operations. The table on the following page also presents a computation of the operating leverage ratio (non-GAAP) which is the period to period percentage change in adjusted total revenue on a taxable-equivalent basis (non-GAAP) less the percentage change in adjusted non-interest expense (non-GAAP). Regions believes that presentation of these non-GAAP financial measures will permit investors to assess the performance of the Company on the same basis as that applied by management.
 
 
Quarter Ended
($ amounts in millions)
 
9/30/2020
 
6/30/2020
 
3/31/2020
 
12/31/2019
 
9/30/2019
 
3Q20 vs. 2Q20
 
3Q20 vs. 3Q19
Non-interest expense (GAAP)
A
$
896

 
$
924

 
$
836

 
$
897

 
$
871

 
$
(28
)
 
(3.0
)%
 
$
25

 
2.9
 %
Adjustments:


Branch consolidation, property and equipment charges
 
(3
)
 
(10
)
 
(11
)
 
(12
)
 
(5
)
 
7

 
70.0
 %
 
2

 
40.0
 %
Salary and employee benefits—severance charges
 
(2
)
 
(2
)
 
(1
)


(1
)


 %
 
(1
)
 
100.0
 %
Loss on early extinguishment of debt
 
(2
)
 
(6
)


(16
)


4

 
(66.7
)
 
(2
)
 
NM

Professional, legal and regulatory expenses


(7
)


7

 
100.0


NM

Acquisition expenses


(1
)


1

 
100.0


NM

Adjusted non-interest expense (non-GAAP)
B
$
889

 
$
898

 
$
824

 
$
869

 
$
865

 
$
(9
)
 
(1.0
)%
 
$
24

 
2.8
 %
Net interest income (GAAP)
C
$
988

 
$
972

 
$
928

 
$
918

 
$
937

 
$
16

 
1.6
 %
 
$
51

 
5.4
 %
Taxable-equivalent adjustment
 
12

 
13

 
12

 
13

 
13

 
(1
)
 
(7.7
)%
 
(1
)
 
(7.7
)%
Net interest income, taxable-equivalent basis
D
$
1,000

 
$
985

 
$
940

 
$
931

 
$
950

 
$
15

 
1.5
 %
 
$
50

 
5.3
 %
Non-interest income (GAAP)
E
655

 
573

 
485

 
562

 
558

 
82

 
14.3

 
97

 
17.4

Adjustments:


Securities (gains) losses, net
 
(3
)
 
(1
)


2


(2
)
 
200.0
 %
 
(3
)
 
NM

Valuation gain on equity investment
 
(44
)


(44
)
 
NM

 
(44
)
 
NM

Leveraged lease termination gains


(2
)


(1
)


NM

 
1

 
(100.0
)%
Adjusted non-interest income (non-GAAP)
F
$
608

 
$
572

 
$
483

 
$
564

 
$
557

 
$
36

 
6.3
 %
 
$
51

 
9.2
 %
Total revenue
C+E=G
$
1,643

 
$
1,545

 
$
1,413

 
$
1,480

 
$
1,495

 
$
98

 
6.3
 %
 
$
148

 
9.9
 %
Adjusted total revenue (non-GAAP)
C+F=H
$
1,596

 
$
1,544

 
$
1,411

 
$
1,482

 
$
1,494

 
$
52

 
3.4
 %
 
$
102

 
6.8
 %
Total revenue, taxable-equivalent basis
D+E=I
$
1,655

 
$
1,558

 
$
1,425

 
$
1,493

 
$
1,508

 
$
97

 
6.2
 %
 
$
147

 
9.7
 %
Adjusted total revenue, taxable-equivalent basis (non-GAAP)
D+F=J
$
1,608

 
$
1,557

 
$
1,423

 
$
1,495

 
$
1,507

 
$
51

 
3.3
 %
 
$
101

 
6.7
 %
Operating leverage ratio (GAAP)(1)
I-A


6.9
 %
Adjusted operating leverage ratio (non-GAAP)(1)
J-B


4.0
 %
Efficiency ratio (GAAP)
A/I
54.1
%
 
59.4
%
 
58.6
%
 
60.1
%
 
57.7
%


Adjusted efficiency ratio (non-GAAP)
B/J
55.3
%
 
57.7
%
 
57.9
%
 
58.1
%
 
57.4
%


Fee income ratio (GAAP)
E/I
39.6
%
 
36.8
%
 
34.0
%
 
37.6
%
 
37.0
%


Adjusted fee income ratio (non-GAAP)
F/J
37.8
%
 
36.8
%
 
34.0
%
 
37.7
%
 
37.0
%


________
NM - Not Meaningful
(1) Amounts have been calculated using whole dollar values.


11

Regions Financial Corporation and Subsidiaries                                
Financial Supplement to Third Quarter 2020 Earnings Release

Reconciliation to GAAP Financial Measures
Adjusted Efficiency Ratios, Adjusted Fee Income Ratios, Adjusted Non-Interest Income/Expense, and Adjusted Operating Leverage Ratios (continued)
 
 
Nine Months Ended September 30
($ amounts in millions)
 
2020
 
2019
 
2020 vs. 2019
Non-interest expense (GAAP)
K
$
2,656

 
$
2,592

 
$
64

 
2.5
 %
Adjustments:


Branch consolidation, property and equipment charges
 
(24
)
 
(13
)
 
(11
)
 
(84.6
)%
Salary and employee benefits—severance charges
 
(5
)
 
(5
)


 %
Loss on early extinguishment of debt
 
(8
)


(8
)
 
NM

Professional, legal and regulatory expenses
 
(7
)


(7
)
 
NM

Acquisition expenses
 
(1
)


(1
)
 
NM

Adjusted non-interest expense (non-GAAP)
L
$
2,611

 
$
2,574

 
$
37

 
1.4
 %
Net interest income (GAAP)
M
$
2,888

 
$
2,827

 
$
61

 
2.2
 %
Taxable-equivalent adjustment
 
37

 
40

 
(3
)
 
(7.5
)%
Net interest income, taxable-equivalent basis
N
$
2,925

 
$
2,867

 
$
58

 
2.0
 %
Non-interest income (GAAP)
O
$
1,713

 
$
1,554

 
$
159

 
10.2
 %
Adjustments:


Securities (gains) losses, net
 
(4
)
 
26

 
(30
)
 
(115.4
)%
Valuation gain on equity investment
 
(44
)


(44
)
 
NM

Leveraged lease termination gains
 
(2
)
 
(1
)
 
(1
)
 
100.0
 %
Gain on sale of affordable housing residential mortgage loans (1)


(8
)
 
8

 
100.0
 %
Adjusted non-interest income (non-GAAP)
P
$
1,663

 
$
1,571

 
$
92

 
5.9
 %
Total revenue
M+O=Q
$
4,601

 
$
4,381

 
$
220

 
5.0
 %
Adjusted total revenue (non-GAAP)
M+P=R
$
4,551

 
$
4,398

 
$
153

 
3.5
 %
Total revenue, taxable-equivalent basis
N+O=S
$
4,638

 
$
4,421

 
$
217

 
4.9
 %
Adjusted total revenue, taxable-equivalent basis (non-GAAP)
N+P=T
$
4,588

 
$
4,438

 
$
150

 
3.4
 %
Operating leverage ratio (GAAP)
S-K


2.4
 %
Adjusted operating leverage ratio (non-GAAP)(2)
T-L


1.9
 %
Efficiency ratio (GAAP)
K/S
57.3
%
 
58.6
%


Adjusted efficiency ratio (non-GAAP)
L/T
56.9
%
 
58.0
%


Fee income ratio (GAAP)
O/S
36.9
%
 
35.2
%


Adjusted fee income ratio (non-GAAP)
P/T
36.3
%
 
35.4
%


______
NM - Not Meaningful
(1) The gain on sale of affordable housing residential mortgage loans in the first quarter of 2019 was the result of the sale of approximately $167 million of loans.
(2) Amounts have been calculated using whole dollar values.


12

Regions Financial Corporation and Subsidiaries                                
Financial Supplement to Third Quarter 2020 Earnings Release

Reconciliation to GAAP Financial Measure

Return Ratio

The table below provides a calculation of “return on average tangible common shareholders’ equity”. Tangible common shareholders’ equity ratios have become a focus of some investors and management believes they may assist investors in analyzing the capital position of the Company absent the effects of intangible assets and preferred stock. Analysts and banking regulators have assessed Regions’ capital adequacy using the tangible common shareholders’ equity measure. Because tangible common shareholders’ equity is not formally defined by GAAP or prescribed in any amount by federal banking regulations it is currently considered to be a non-GAAP financial measure and other entities may calculate it differently than Regions’ disclosed calculations. Since analysts and banking regulators may assess Regions’ capital adequacy using tangible common shareholders’ equity, management believes that it is useful to provide investors the ability to assess Regions’ capital adequacy on this same basis.
 
 
Quarter Ended
($ amounts in millions)
 
9/30/2020

 
6/30/2020

 
3/31/2020

 
12/31/2019

 
9/30/2019

RETURN ON AVERAGE TANGIBLE COMMON SHAREHOLDERS' EQUITY


Net income (loss) available to common shareholders (GAAP)
A
$
501

 
$
(237
)
 
$
139

 
$
366

 
$
385

Average shareholders' equity (GAAP)
 
$
17,759

 
$
17,384

 
$
16,460

 
$
16,564

 
$
16,621

Less:


Average intangible assets (GAAP)
 
5,322

 
5,373

 
4,947

 
4,953

 
4,949

Average deferred tax liability related to intangibles (GAAP)
 
(103
)
 
(94
)
 
(92
)
 
(93
)
 
(93
)
Average preferred stock (GAAP)
 
1,656

 
1,409

 
1,310

 
1,310

 
1,310

Average tangible common shareholders' equity (non-GAAP)
B
$
10,884

 
$
10,696

 
$
10,295

 
$
10,394

 
$
10,455

Return on average tangible common shareholders' equity (non-GAAP)*
A/B
18.32
%
 
(8.90
)%
 
5.43
%
 
13.95
%
 
14.62
%
___
*Annualized


13

Regions Financial Corporation and Subsidiaries                                
Financial Supplement to Third Quarter 2020 Earnings Release

Credit Quality
 
As of and for Quarter Ended
($ amounts in millions)
9/30/2020
 
6/30/2020
 
3/31/2020
 
12/31/2019
 
9/30/2019
Components:


Beginning allowance for loan losses (ALL)
$
2,276

 
$
1,560

 
$
869

 
$
869

 
$
853

Cumulative change in accounting guidance (1)


438


Beginning allowance for loan losses (ALL), as adjusted for change in accounting guidance
2,276


1,560


1,307


869


853


Loans charged-off:


Commercial and industrial
84

 
139

 
68

 
33

 
36

Commercial real estate mortgage—owner-occupied
2

 
3

 
3

 
3

 
3

Commercial real estate construction—owner-occupied


1


Total commercial
86

 
142

 
71

 
37

 
39

Commercial investor real estate mortgage


1


Commercial investor real estate construction


Total investor real estate


1


Residential first mortgage
1

 
1

 
1


1

Home equity—lines of credit
2

 
3

 
4

 
8

 
5

Home equity—closed-end
1


1

 
1

 
1

Indirect—vehicles
4

 
6

 
6

 
6

 
7

Indirect—other consumer
17

 
18

 
23

 
23

 
19

Consumer credit card
13

 
17

 
16

 
16

 
17

Other consumer
15

 
17

 
22

 
22

 
25

Total consumer
53

 
62

 
73

 
76

 
75

Total
139

 
204

 
144

 
114

 
114


Recoveries of loans previously charged-off:


Commercial and industrial
10

 
9

 
5

 
5

 
7

Commercial real estate mortgage—owner-occupied
1

 
1

 
2


2

Commercial real estate construction—owner-occupied


Total commercial
11

 
10

 
7

 
5

 
9

Commercial investor real estate mortgage


1

 
2


Commercial investor real estate construction


Total investor real estate


1

 
2


Residential first mortgage
1

 
1

 
1


1

Home equity—lines of credit
3

 
2

 
3

 
3

 
3

Home equity—closed-end
1


1

 
1

 
1

Indirect—vehicles
3

 
3

 
2

 
3

 
2

Indirect—other consumer
1


Consumer credit card
2

 
3

 
2

 
2

 
3

Other consumer
4

 
3

 
4

 
2

 
3

Total consumer
15

 
12

 
13

 
11

 
13

Total
26

 
22

 
21

 
18

 
22


Net loans charged-off:


Commercial and industrial
74

 
130

 
63

 
28

 
29

Commercial real estate mortgage—owner-occupied
1

 
2

 
1

 
3

 
1

Commercial real estate construction—owner-occupied


1


Total commercial
75

 
132

 
64

 
32

 
30

Commercial investor real estate mortgage


(1
)
 
(1
)
 

Commercial investor real estate construction


Total investor real estate


(1
)
 
(1
)
 

Residential first mortgage


Home equity—lines of credit
(1
)
 
1

 
1

 
5

 
2

Home equity—closed-end


Indirect—vehicles
1

 
3

 
4

 
3

 
5

Indirect—other consumer
16

 
18

 
23

 
23

 
19

Consumer credit card
11

 
14

 
14

 
14

 
14

Other consumer
11

 
14

 
18

 
20

 
22

Total consumer
38

 
50

 
60

 
65

 
62

Total
$
113

 
$
182

 
$
123

 
$
96

 
$
92

Provision for loan losses
$
113

 
$
838

 
$
376

 
$
96

 
$
108

Initial allowance on acquired purchased credit deteriorated loans
$

 
$
60

 
$

 
$

 
$

Ending allowance for loan losses (ALL)
$
2,276

 
$
2,276

 
$
1,560

 
$
869

 
$
869

Beginning reserve for unfunded credit commitments
149

 
105

 
45

 
48

 
50

Cumulative change in accounting guidance (1)


63


Beginning reserve for unfunded credit commitments, as adjusted for change in accounting guidance
149

 
105

 
108

 
48

 
50

Provision (credit) for unfunded credit losses

 
44

 
(3
)
 
(3
)
 
(2
)
Ending reserve for unfunded commitments
149

 
149

 
105

 
45

 
48

Allowance for credit losses (ACL) at period end
$
2,425

 
$
2,425

 
$
1,665

 
$
914

 
$
917


14

Regions Financial Corporation and Subsidiaries                                
Financial Supplement to Third Quarter 2020 Earnings Release

Credit Quality (continued)


As of and for Quarter Ended
($ amounts in millions)
9/30/2020
 
6/30/2020
 
3/31/2020
 
12/31/2019
 
9/30/2019
Net loan charge-offs as a % of average loans, annualized:


Commercial and industrial
0.63
 %
 
1.06
 %
 
0.63
 %
 
0.28
 %
 
0.29
 %
Commercial real estate mortgage—owner-occupied
0.06
 %
 
0.17
 %
 
0.07
 %
 
0.19
 %
 
0.07
 %
Total commercial
0.57
 %
 
0.96
 %
 
0.56
 %
 
0.27
 %
 
0.26
 %
Commercial investor real estate mortgage
(0.01
)%
 
(0.03
)%
 
(0.06
)%
 
(0.03
)%
 
(0.03
)%
Commercial investor real estate construction
 %
 
 %
 
(0.01
)%
 
 %
 
(0.02
)%
Total investor real estate
(0.01
)%
 
(0.02
)%
 
(0.05
)%
 
(0.02
)%
 
(0.03
)%
Residential first mortgage
 %
 
 %
 
 %
 
0.01
 %
 
0.01
 %
Home equity—lines of credit
(0.11
)%
 
0.06
 %
 
0.10
 %
 
0.31
 %
 
0.13
 %
Home equity—closed-end
(0.01
)%
 
 %
 
(0.02
)%
 
 %
 
0.05
 %
Indirect—vehicles
0.30
 %
 
0.85
 %
 
0.94
 %
 
0.76
 %
 
0.74
 %
Indirect—other consumer
2.23
 %
 
2.35
 %
 
2.83
 %
 
3.00
 %
 
2.83
 %
Consumer credit card
3.73
 %
 
4.41
 %
 
4.16
 %
 
4.18
 %
 
4.31
 %
Other consumer
4.12
 %
 
5.15
 %
 
5.73
 %
 
6.56
 %
 
6.85
 %
Total consumer
0.51
 %
 
0.68
 %
 
0.79
 %
 
0.85
 %
 
0.81
 %
Total
0.50
 %
 
0.80
 %
 
0.59
 %
 
0.46
 %
 
0.44
 %
Non-accrual loans, excluding loans held for sale
$
767

 
$
614

 
$
638

 
$
507

 
$
462

Non-performing loans held for sale
5

 
10

 
3

 
13

 
8

Non-accrual loans, including loans held for sale
772

 
624

 
641

 
520

 
470

Foreclosed properties
26

 
43

 
54

 
53

 
59

Non-marketable investments received in foreclosure


5

 
5

Non-performing assets (NPAs)
$
798

 
$
667

 
$
695

 
$
578

 
$
534

Loans past due > 90 days (2)
$
158

 
$
245

 
$
209

 
$
224

 
$
149

Criticized loans- business (3)
$
3,734

 
$
4,225

 
$
2,524

 
$
2,251

 
$
2,319

Credit Ratios:


ACL/Loans, net
2.74
 %
 
2.68
 %
 
1.89
 %
 
1.10
 %
 
1.11
 %
ALL/Loans, net
2.58
 %
 
2.51
 %
 
1.77
 %
 
1.05
 %
 
1.05
 %
Allowance for credit losses to non-performing loans, excluding loans held for sale
316
 %
 
395
 %
 
261
 %
 
180
 %
 
198
 %
Allowance for loan losses to non-performing loans, excluding loans held for sale
297
 %
 
370
 %
 
244
 %
 
171
 %
 
188
 %
Non-accrual loans, excluding loans held for sale/Loans, net
0.87
 %
 
0.68
 %
 
0.72
 %
 
0.61
 %
 
0.56
 %
NPAs (ex. 90+ past due)/Loans, foreclosed properties, non-marketable investments and non-performing loans held for sale
0.90
 %
 
0.74
 %
 
0.79
 %
 
0.70
 %
 
0.65
 %
NPAs (inc. 90+ past due)/Loans, foreclosed properties, non-marketable investments and non-performing loans held for sale (2)
1.08
 %
 
0.91
 %
 
0.96
 %
 
0.89
 %
 
0.82
 %
            
(1)
Regions adopted the CECL accounting guidance on January 1, 2020 and recorded the cumulative effect of the change in accounting guidance as a reduction to retained earnings and an increase to deferred tax assets.
(2)
Excludes guaranteed residential first mortgages that are 90+ days past due and still accruing. Refer to the footnotes on page 16 for amounts related to these loans.
(3)
Business represents the combined total of commercial and investor real estate loans.

ACL/ Loans excluding PPP, net (non-GAAP)
Regions believes this ACL ratio provides investors with meaningful additional information about credit loss allowance levels when the SBA's Paycheck Protection Program (PPP) loans, which are fully backed by the U.S. government, are excluded from total loans.

 
As of
($ amounts in millions)
9/30/2020
 
6/30/2020
 
3/31/2020
 
12/31/2019
 
9/30/2019
Total Loans
$
88,359

 
$
90,548

 
$
88,098

 
$
82,963

 
$
82,786

Less: SBA PPP Loans
4,594

 
4,498


Loans excluding PPP, net (non-GAAP)
$
83,765


$
86,050


$
88,098


$
82,963


$
82,786

Allowance for credit losses (ACL) at period end
$
2,425

 
$
2,425

 
$
1,665

 
$
914

 
$
917

ACL/Loans excluding PPP, net (non-GAAP)
2.90
%
 
2.82
%
 
1.89
%
 
1.10
%
 
1.11
%


15

Regions Financial Corporation and Subsidiaries                                
Financial Supplement to Third Quarter 2020 Earnings Release

Non-Accrual Loans (excludes loans held for sale)
 
As of
($ amounts in millions)
9/30/2020
 
6/30/2020
 
3/31/2020
 
12/31/2019
 
9/30/2019
Commercial and industrial
$
459

 
1.02
%
 
$
445

 
0.93
%
 
$
496

 
1.09
%
 
$
347

 
0.87
%
 
$
292

 
0.73
%
Commercial real estate mortgage—owner-occupied
85

 
1.56
%
 
74

 
1.35
%
 
58

 
1.05
%
 
73

 
1.31
%
 
68

 
1.23
%
Commercial real estate construction—owner-occupied
12

 
3.69
%
 
10

 
3.09
%
 
11

 
3.49
%
 
11

 
3.47
%
 
15

 
4.10
%
Total commercial
556

 
1.09
%
 
529

 
0.99
%
 
565

 
1.10
%
 
431

 
0.94
%
 
375

 
0.81
%
Commercial investor real estate mortgage
114

 
2.04
%
 
1

 
0.02
%
 
1

 
0.03
%
 
2

 
0.03
%
 
9

 
0.19
%
Commercial investor real estate construction
4

 
0.19
%


%


%


%


%
Total investor real estate
118

 
1.56
%
 
1

 
0.01
%
 
1

 
0.02
%
 
2

 
0.03
%
 
9

 
0.14
%
Residential first mortgage
36

 
0.22
%
 
32

 
0.21
%
 
27

 
0.18
%
 
27

 
0.19
%
 
29

 
0.20
%
Home equity—lines of credit
47

 
0.98
%
 
46

 
0.92
%
 
40

 
0.77
%
 
41

 
0.78
%
 
43

 
0.79
%
Home equity—closed-end
9

 
0.31
%
 
6

 
0.22
%
 
5

 
0.17
%
 
6

 
0.19
%
 
6

 
0.21
%
Indirect- vehicles
1

 
0.08
%


%


%


%


%
Total consumer
93

 
0.31
%
 
84

 
0.28
%
 
72

 
0.24
%
 
74

 
0.24
%
 
78

 
0.26
%
Total non-accrual loans
$
767

 
0.87
%
 
$
614

 
0.68
%
 
$
638

 
0.72
%
 
$
507

 
0.61
%
 
$
462

 
0.56
%

Early and Late Stage Delinquencies
Accruing 30-89 Days Past Due Loans
As of
($ amounts in millions)
9/30/2020
 
6/30/2020
 
3/31/2020
 
12/31/2019
 
9/30/2019
Commercial and industrial
$
50

 
0.11
%
 
$
81

 
0.17
%
 
$
58

 
0.13
%
 
$
51

 
0.13
%
 
$
50

 
0.12
%
Commercial real estate mortgage—owner-occupied
21

 
0.39
%
 
11

 
0.20
%
 
12

 
0.22
%
 
14

 
0.26
%
 
31

 
0.56
%
Commercial real estate construction—owner-occupied

 
0.01
%
 
1

 
0.15
%


0.01
%
 
2

 
0.65
%


%
Total commercial
71

 
0.14
%
 
93

 
0.17
%
 
70

 
0.14
%
 
67

 
0.15
%
 
81

 
0.18
%
Commercial investor real estate mortgage
15

 
0.26
%
 
1

 
0.02
%
 
2

 
0.04
%
 
2

 
0.03
%
 
2

 
0.03
%
Commercial investor real estate construction

 
%


0.01
%


0.01
%


%


%
Total investor real estate
15

 
0.19
%
 
1

 
0.02
%
 
2

 
0.03
%
 
2

 
0.02
%
 
2

 
0.02
%
Residential first mortgage—non-guaranteed (1)
79

 
0.51
%
 
105

 
0.71
%
 
88

 
0.62
%
 
88

 
0.63
%
 
91

 
0.65
%
Home equity—lines of credit
26

 
0.53
%
 
32

 
0.64
%
 
43

 
0.83
%
 
42

 
0.79
%
 
53

 
0.98
%
Home equity—closed-end
17

 
0.61
%
 
25

 
0.85
%
 
16

 
0.53
%
 
18

 
0.60
%
 
19

 
0.60
%
Indirect—vehicles
22

 
1.96
%
 
27

 
2.04
%
 
33

 
2.15
%
 
41

 
2.26
%
 
40

 
1.91
%
Indirect—other consumer
19

 
0.69
%
 
16

 
0.51
%
 
24

 
0.75
%
 
25

 
0.77
%
 
22

 
0.78
%
Consumer credit card
13

 
1.12
%
 
13

 
1.09
%
 
18

 
1.37
%
 
19

 
1.38
%
 
18

 
1.37
%
Other consumer
14

 
1.34
%
 
14

 
1.32
%
 
16

 
1.34
%
 
18

 
1.43
%
 
20

 
1.63
%
Total consumer (1)
190

 
0.65
%
 
232

 
0.79
%
 
238

 
0.81
%
 
251

 
0.83
%
 
263

 
0.88
%
Total accruing 30-89 days past due loans (1)
$
276

 
0.31
%
 
$
326

 
0.36
%
 
$
310

 
0.35
%
 
$
320

 
0.39
%
 
$
346

 
0.42
%


Accruing 90+ Days Past Due Loans
As of
($ amounts in millions)
9/30/2020
 
6/30/2020
 
3/31/2020
 
12/31/2019
 
9/30/2019
Commercial and industrial
$
10

 
0.02
%
 
$
11

 
0.02
%
 
$
9

 
0.02
%
 
$
11

 
0.03
%
 
$
10

 
0.02
%
Commercial real estate mortgage—owner-occupied

 
0.01
%
 
3

 
0.05
%
 
1

 
0.01
%
 
1

 
0.01
%
 
2

 
0.03
%
Total commercial
10

 
0.02
%
 
14

 
0.03
%
 
10

 
0.02
%
 
12

 
0.03
%
 
12

 
0.03
%
Commercial investor real estate mortgage
1

 
0.01
%


%


%


%


%
Total investor real estate
1

 
0.01
%


%


%


%


%
Residential first mortgage—non-guaranteed (2)
86

 
0.56
%
 
75

 
0.50
%
 
69

 
0.49
%
 
70

 
0.50
%
 
62

 
0.44
%
Home equity—lines of credit
25

 
0.53
%
 
26

 
0.53
%
 
26

 
0.50
%
 
32

 
0.60
%
 
32

 
0.58
%
Home equity—closed-end
12

 
0.41
%
 
12

 
0.42
%
 
11

 
0.36
%
 
10

 
0.31
%
 
9

 
0.30
%
Indirect—vehicles
5

 
0.42
%
 
8

 
0.55
%
 
6

 
0.38
%
 
7

 
0.40
%
 
7

 
0.34
%
Indirect—other consumer
3

 
0.11
%
 
3

 
0.10
%
 
4

 
0.12
%
 
3

 
0.10
%
 
3

 
0.12
%
Consumer credit card
13

 
1.08
%
 
17

 
1.38
%
 
19

 
1.49
%
 
19

 
1.38
%
 
19

 
1.43
%
Other consumer
3

 
0.27
%
 
5

 
0.49
%
 
5

 
0.44
%
 
5

 
0.42
%
 
5

 
0.38
%
Total consumer (2)
147

 
0.50
%
 
146

 
0.49
%
 
140

 
0.47
%
 
146

 
0.49
%
 
137

 
0.46
%
Total accruing 90+ days past due loans (2)
$
158

 
0.18
%
 
$
160

 
0.18
%
 
$
150

 
0.17
%
 
$
158

 
0.19
%
 
$
149

 
0.18
%


Total delinquencies (1) (2)
$
434

 
0.49
%
 
$
486

 
0.54
%
 
$
460

 
0.52
%
 
$
478

 
0.58
%
 
$
495

 
0.60
%
                 
(1)
Excludes loans that are 100% guaranteed by FHA. Total 30-89 days past due guaranteed loans excluded were $57 million at 9/30/2020, $56 million at 6/30/2020, $37 million at 3/31/2020, $42 million at 12/31/2019, and $37 million at 9/30/2019.
(2)
Excludes loans that are 100% guaranteed by FHA and all guaranteed loans sold to GNMA where Regions has the right but not the obligation to repurchase. Total 90 days or more past due guaranteed loans excluded were $47 million at 9/30/2020, $55 million at 6/30/2020, $59 million at 3/31/2020, and $66 million at 12/31/2019 and 9/30/2019.


16

Regions Financial Corporation and Subsidiaries                                
Financial Supplement to Third Quarter 2020 Earnings Release

Troubled Debt Restructurings
 
 
As of
($ amounts in millions)
9/30/2020
 
6/30/2020
 
3/31/2020
 
12/31/2019
 
9/30/2019
Current:


Commercial
$
73

 
$
47

 
$
51

 
$
105

 
$
93

Investor real estate
45

 
6

 
14

 
32

 
30

Residential first mortgage
162

 
158

 
156

 
152

 
156

Home equity—lines of credit
36

 
37

 
38

 
40

 
42

Home equity—closed-end
79

 
83

 
92

 
103

 
110

Consumer credit card
1

 
1

 
1

 
1

 
1

Other consumer
3

 
3

 
3

 
4

 
4

Total current
399

 
335

 
355

 
437

 
436

Accruing 30-89 DPD:


Commercial
1

 
2

 
5

 
1

 
6

Residential first mortgage
16

 
20

 
25

 
25

 
26

Home equity—lines of credit
1

 
1

 
2

 
2

 
2

Home equity—closed-end
4

 
7

 
6

 
6

 
7

Other consumer


1


1

Total accruing 30-89 DPD
22

 
30

 
39

 
34

 
42

Total accruing and <90 DPD
421

 
365

 
394

 
471

 
478

Non-accrual or 90+ DPD:


Commercial
178

 
214

 
159

 
139

 
130

Investor real estate


1

 
1

 
5

Residential first mortgage
36

 
37

 
37

 
40

 
35

Home equity—lines of credit
2

 
3

 
2

 
2

 
2

Home equity—closed-end
8

 
7

 
6

 
6

 
7

Total non-accrual or 90+DPD
224

 
261

 
205

 
188

 
179

Total TDRs - Loans
$
645

 
$
626

 
$
599

 
$
659

 
$
657

TDRs - Held For Sale


1

 
4

Total TDRs
$
645

 
$
626

 
$
599

 
$
660

 
$
661


Total TDRs - Loans by Portfolio


As of
($ amounts in millions)
9/30/2020
 
6/30/2020
 
3/31/2020
 
12/31/2019
 
9/30/2019
Total commercial TDRs
$
252


$
263


$
215


$
245


$
229

Total investor real estate TDRs
45


6


15


33


35

Total consumer TDRs
348


357


369


381


393

Total TDRs - Loans
$
645


$
626


$
599


$
659


$
657


17

Regions Financial Corporation and Subsidiaries                                
Financial Supplement to Third Quarter 2020 Earnings Release


Consolidated Balance Sheets (unaudited)
 
As of
($ amounts in millions)
9/30/2020
 
6/30/2020
 
3/31/2020
 
12/31/2019
 
9/30/2019
Assets:


Cash and due from banks
$
1,972

 
$
1,619

 
$
2,101

 
$
1,598

 
$
1,966

Interest-bearing deposits in other banks
11,501

 
11,579

 
3,154

 
2,516

 
3,101

Debt securities held to maturity
1,190

 
1,255

 
1,296

 
1,332

 
1,375

Debt securities available for sale
27,007

 
23,898

 
23,775

 
22,606

 
22,986

Loans held for sale
1,187

 
1,152

 
566

 
637

 
548

Loans, net of unearned income
88,359

 
90,548

 
88,098

 
82,963

 
82,786

Allowance for loan losses 
(2,276
)
 
(2,276
)
 
(1,560
)
 
(869
)
 
(869
)
Net loans
86,083

 
88,272

 
86,538

 
82,094

 
81,917

Other earning assets
1,267

 
1,238

 
1,722

 
1,518

 
1,760

Premises and equipment, net
1,896

 
1,929

 
1,935

 
1,960

 
1,944

Interest receivable
347

 
343

 
349

 
362

 
377

Goodwill
5,187

 
5,193

 
4,845

 
4,845

 
4,845

Residential mortgage servicing rights at fair value (MSRs)
267

 
249

 
254

 
345

 
307

Other identifiable intangible assets, net
129

 
137

 
98

 
105

 
111

Other assets
7,147

 
7,206

 
6,909

 
6,322

 
6,910

Total assets
$
145,180

 
$
144,070

 
$
133,542

 
$
126,240

 
$
128,147

Liabilities and Equity:


Deposits:


Non-interest-bearing
$
49,754

 
$
47,964

 
$
37,133

 
$
34,113

 
$
34,360

Interest-bearing
68,691

 
68,815

 
62,897

 
63,362

 
59,945

Total deposits
118,445

 
116,779

 
100,030

 
97,475

 
94,305

Borrowed funds:


Short-term borrowings


3,150

 
2,050

 
5,401

Long-term borrowings
4,919

 
6,408

 
10,105

 
7,879

 
9,128

Total borrowed funds
4,919

 
6,408

 
13,255

 
9,929

 
14,529

Other liabilities
3,912

 
3,255

 
2,925

 
2,541

 
2,732

Total liabilities
127,276

 
126,442

 
116,210

 
109,945

 
111,566

Equity:


Preferred stock, non-cumulative perpetual
1,656

 
1,656

 
1,310

 
1,310

 
1,310

Common stock
10

 
10

 
10

 
10

 
10

Additional paid-in capital
12,714

 
12,703

 
12,695

 
12,685

 
12,803

Retained earnings
3,330

 
2,978

 
3,364

 
3,751

 
3,534

Treasury stock, at cost
(1,371
)
 
(1,371
)
 
(1,371
)
 
(1,371
)
 
(1,371
)
Accumulated other comprehensive income, net
1,565

 
1,626

 
1,324

 
(90
)
 
295

Total shareholders’ equity
17,904

 
17,602

 
17,332

 
16,295

 
16,581

Noncontrolling interest

 
26


Total equity
17,904

 
17,628

 
17,332

 
16,295

 
16,581

Total liabilities and equity
$
145,180

 
$
144,070

 
$
133,542

 
$
126,240

 
$
128,147


18

Regions Financial Corporation and Subsidiaries                                
Financial Supplement to Third Quarter 2020 Earnings Release

End of Period Loans
 
As of


9/30/2020
 
9/30/2020
($ amounts in millions)
9/30/2020
 
6/30/2020
 
3/31/2020
 
12/31/2019
 
9/30/2019
 
 vs. 6/30/2020
 
 vs. 9/30/2019
Commercial and industrial
$
45,199

 
$
47,670

 
$
45,388

 
$
39,971

 
$
40,179

 
$
(2,471
)
 
(5.2
)%
 
$
5,020

 
12.5
 %
Commercial real estate mortgage—owner-occupied
5,451

 
5,491

 
5,550

 
5,537

 
5,532

 
(40
)
 
(0.7
)%
 
(81
)
 
(1.5
)%
Commercial real estate construction—owner-occupied
305

 
314

 
309

 
331

 
365

 
(9
)
 
(2.9
)%
 
(60
)
 
(16.4
)%
Total commercial
50,955

 
53,475

 
51,247

 
45,839

 
46,076

 
(2,520
)
 
(4.7
)%
 
4,879

 
10.6
 %
Commercial investor real estate mortgage
5,598

 
5,221

 
5,079

 
4,936

 
4,769

 
377

 
7.2
 %
 
829

 
17.4
 %
Commercial investor real estate construction
1,984

 
1,908

 
1,784

 
1,621

 
1,475

 
76

 
4.0
 %
 
509

 
34.5
 %
Total investor real estate
7,582

 
7,129

 
6,863

 
6,557

 
6,244

 
453

 
6.4
 %
 
1,338

 
21.4
 %
Total business
58,537

 
60,604

 
58,110

 
52,396

 
52,320

 
(2,067
)
 
(3.4
)%
 
6,217

 
11.9
 %
Residential first mortgage
16,195

 
15,382

 
14,535

 
14,485

 
14,397

 
813

 
5.3
 %
 
1,798

 
12.5
 %
Home equity—lines of credit (1)
4,753

 
4,953

 
5,201

 
5,300

 
5,430

 
(200
)
 
(4.0
)%
 
(677
)
 
(12.5
)%
Home equity—closed-end (2)
2,839

 
2,937

 
3,000

 
3,084

 
3,167

 
(98
)
 
(3.3
)%
 
(328
)
 
(10.4
)%
Indirect—vehicles
1,120

 
1,331

 
1,557

 
1,812

 
2,095

 
(211
)
 
(15.9
)%
 
(975
)
 
(46.5
)%
Indirect—other consumer
2,663

 
3,022

 
3,202

 
3,249

 
2,821

 
(359
)
 
(11.9
)%
 
(158
)
 
(5.6
)%
Consumer credit card
1,189

 
1,213

 
1,303

 
1,387

 
1,322

 
(24
)
 
(2.0
)%
 
(133
)
 
(10.1
)%
Other consumer
1,063

 
1,106

 
1,190

 
1,250

 
1,234

 
(43
)
 
(3.9
)%
 
(171
)
 
(13.9
)%
Total consumer
29,822

 
29,944

 
29,988

 
30,567

 
30,466

 
(122
)
 
(0.4
)%
 
(644
)
 
(2.1
)%
Total Loans
$
88,359

 
$
90,548

 
$
88,098

 
$
82,963

 
$
82,786

 
$
(2,189
)
 
(2.4
)%
 
$
5,573

 
6.7
 %
_______
(1)
The balance of Regions' home equity lines of credit consists of $2,583 million of first lien and $2,170 million of second lien at 9/30/2020.
(2)
The balance of Regions' closed-end home equity loans consists of $2,594 million of first lien and $245 million of second lien at 9/30/2020.

 
As of
End of Period Loans by Percentage
9/30/2020
 
6/30/2020
 
3/31/2020
 
12/31/2019
 
9/30/2019
Commercial and industrial
51.2
%
 
52.6
%
 
51.5
%
 
48.2
%
 
48.5
%
Commercial real estate mortgage—owner-occupied
6.2
%
 
6.1
%
 
6.3
%
 
6.7
%
 
6.7
%
Commercial real estate construction—owner-occupied
0.3
%
 
0.3
%
 
0.4
%
 
0.4
%
 
0.4
%
Total commercial
57.7
%
 
59.0
%
 
58.2
%
 
55.3
%
 
55.6
%
Commercial investor real estate mortgage
6.3
%
 
5.8
%
 
5.8
%
 
5.9
%
 
5.8
%
Commercial investor real estate construction
2.2
%
 
2.1
%
 
2.0
%
 
2.0
%
 
1.8
%
Total investor real estate
8.5
%
 
7.9
%
 
7.8
%
 
7.9
%
 
7.6
%
Total business
66.2
%
 
66.9
%
 
66.0
%
 
63.2
%
 
63.2
%
Residential first mortgage
18.3
%
 
17.0
%
 
16.5
%
 
17.5
%
 
17.4
%
Home equity—lines of credit
5.4
%
 
5.5
%
 
5.9
%
 
6.4
%
 
6.6
%
Home equity—closed-end
3.2
%
 
3.2
%
 
3.4
%
 
3.7
%
 
3.8
%
Indirect—vehicles
1.3
%
 
1.5
%
 
1.8
%
 
2.2
%
 
2.5
%
Indirect—other consumer
3.0
%
 
3.3
%
 
3.6
%
 
3.9
%
 
3.4
%
Consumer credit card
1.3
%
 
1.3
%
 
1.5
%
 
1.7
%
 
1.6
%
Other consumer
1.3
%
 
1.3
%
 
1.3
%
 
1.4
%
 
1.5
%
Total consumer
33.8
%
 
33.1
%
 
34.0
%
 
36.8
%
 
36.8
%
Total Loans
100.0
%
 
100.0
%
 
100.0
%
 
100.0
%
 
100.0
%


19

Regions Financial Corporation and Subsidiaries                                
Financial Supplement to Third Quarter 2020 Earnings Release


Average Balances of Loans
 
Average Balances
($ amounts in millions)
3Q20
 
2Q20
 
1Q20
 
4Q19
 
3Q19
 
3Q20 vs. 2Q20
 
3Q20 vs. 3Q19
Commercial and industrial
$
46,405

 
$
49,296

 
$
40,519

 
$
39,743

 
$
40,200

 
$
(2,891
)
 
(5.9
)%
 
$
6,205

 
15.4
 %
Commercial real estate mortgage—owner-occupied
5,498

 
5,492

 
5,509

 
5,489

 
5,481

 
6

 
0.1
 %
 
17

 
0.3
 %
Commercial real estate construction—owner-occupied
318

 
312

 
323

 
357

 
390

 
6

 
1.9
 %
 
(72
)
 
(18.5
)%
Total commercial
52,221

 
55,100

 
46,351

 
45,589

 
46,071

 
(2,879
)
 
(5.2
)%
 
6,150

 
13.3
 %
Commercial investor real estate mortgage
5,324

 
5,150

 
4,975

 
4,841

 
4,859

 
174

 
3.4
 %
 
465

 
9.6
 %
Commercial investor real estate construction
1,974

 
1,869

 
1,673

 
1,544

 
1,529

 
105

 
5.6
 %
 
445

 
29.1
 %
Total investor real estate
7,298

 
7,019

 
6,648

 
6,385

 
6,388

 
279

 
4.0
 %
 
910

 
14.2
 %
Total business
59,519

 
62,119

 
52,999

 
51,974

 
52,459

 
(2,600
)
 
(4.2
)%
 
7,060

 
13.5
 %
Residential first mortgage
15,786

 
14,884

 
14,469

 
14,416

 
14,298

 
902

 
6.1
 %
 
1,488

 
10.4
 %
Home equity—lines of credit
4,842

 
5,072

 
5,237

 
5,357

 
5,482

 
(230
)
 
(4.5
)%
 
(640
)
 
(11.7
)%
Home equity—closed-end
2,885

 
2,970

 
3,038

 
3,121

 
3,201

 
(85
)
 
(2.9
)%
 
(316
)
 
(9.9
)%
Indirect—vehicles
1,223

 
1,441

 
1,679

 
1,948

 
2,247

 
(218
)
 
(15.1
)%
 
(1,024
)
 
(45.6
)%
Indirect—other consumer
2,835

 
3,111

 
3,263

 
3,005

 
2,750

 
(276
)
 
(8.9
)%
 
85

 
3.1
 %
Consumer credit card
1,194

 
1,230

 
1,348

 
1,337

 
1,310

 
(36
)
 
(2.9
)%
 
(116
)
 
(8.9
)%
Other consumer
1,086

 
1,137

 
1,216

 
1,234

 
1,239

 
(51
)
 
(4.5
)%
 
(153
)
 
(12.3
)%
Total consumer
29,851

 
29,845

 
30,250

 
30,418

 
30,527

 
6

 
 %
 
(676
)
 
(2.2
)%
Total loans
$
89,370

 
$
91,964

 
$
83,249

 
$
82,392

 
$
82,986

 
$
(2,594
)
 
(2.8
)%
 
$
6,384

 
7.7
 %

Adjusted Average Balances of Loans (non-GAAP)
Regions believes adjusting total average loans for the impact of SBA PPP loans, the indirect- other consumer exit portfolio and the indirect vehicles exit portfolio, provides a meaningful calculation of loan growth rates and presents them on the same basis as that applied by management.
 
Average Balances
($ amounts in millions)
3Q20
 
2Q20
 
1Q20
 
4Q19
 
3Q19
 
3Q20 vs. 2Q20
 
3Q20 vs. 3Q19
Commercial and industrial
$
46,405

 
$
49,296

 
$
40,519

 
$
39,743

 
$
40,200

 
$
(2,891
)
 
(5.9
)%
 
$
6,205

 
15.4
 %
Less: SBA PPP Loans
4,558

 
3,213


1,345

 
41.9
 %
 
4,558

 
NM

Adjusted commercial and industrial loans (non-GAAP)
$
41,847

 
$
46,083

 
$
40,519

 
$
39,743

 
$
40,200

 
$
(4,236
)
 
(9.2
)%
 
$
1,647

 
4.1
 %
Total commercial loans
$
52,221

 
$
55,100

 
$
46,351

 
$
45,589

 
$
46,071

 
$
(2,879
)
 
(5.2
)%
 
$
6,150

 
13.3
 %
Less: SBA PPP Loans
4,558

 
3,213


1,345

 
41.9
 %
 
4,558

 
NM

Adjusted total commercial loans (non-GAAP)
$
47,663

 
$
51,887

 
$
46,351

 
$
45,589

 
$
46,071

 
$
(4,224
)
 
(8.1
)%
 
$
1,592

 
3.5
 %
Total business loans
$
59,519

 
$
62,119

 
$
52,999

 
$
51,974

 
$
52,459

 
$
(2,600
)
 
(4.2
)%
 
$
7,060

 
13.5
 %
Less: SBA PPP Loans
4,558

 
3,213


1,345

 
41.9
 %
 
4,558

 
NM

Adjusted total business loans (non-GAAP)
$
54,961

 
$
58,906

 
$
52,999

 
$
51,974

 
$
52,459

 
$
(3,945
)
 
(6.7
)%
 
$
2,502

 
4.8
 %
Total consumer loans
$
29,851

 
$
29,845

 
$
30,250

 
$
30,418

 
$
30,527

 
$
6

 
 %
 
$
(676
)
 
(2.2
)%
Less: Indirect-other consumer exit portfolio (1)
1,318

 
1,493

 
1,696

 
1,841

 
1,906

 
(175
)
 
(11.7
)%
 
(588
)
 
(30.8
)%
Less: Indirect—vehicles
1,223

 
1,441

 
1,679

 
1,948

 
2,247

 
(218
)
 
(15.1
)%
 
(1,024
)
 
(45.6
)%
Adjusted total consumer loans (non-GAAP)
$
27,310

 
$
26,911

 
$
26,875

 
$
26,629

 
$
26,374

 
$
399

 
1.5
 %
 
$
936

 
3.5
 %
Total loans
$
89,370

 
$
91,964

 
$
83,249

 
$
82,392

 
$
82,986

 
$
(2,594
)
 
(2.8
)%
 
$
6,384

 
7.7
 %
Less: SBA PPP Loans
4,558

 
3,213


1,345

 
41.9
 %
 
4,558

 
NM

Less: Indirect-other consumer exit portfolio (1)
1,318

 
1,493

 
1,696

 
1,841

 
1,906

 
(175
)
 
(11.7
)%
 
(588
)
 
(30.8
)%
Less: Indirect—vehicles
1,223

 
1,441

 
1,679

 
1,948

 
2,247

 
(218
)
 
(15.1
)%
 
(1,024
)
 
(45.6
)%
Adjusted total loans (non-GAAP)
$
82,271

 
$
85,817

 
$
79,874

 
$
78,603

 
$
78,833

 
$
(3,546
)
 
(4.1
)%
 
$
3,438

 
4.4
 %
            
(1)
In the forth quarter of 2019, Regions decided not to renew a third party relationship.


20

Regions Financial Corporation and Subsidiaries                                
Financial Supplement to Third Quarter 2020 Earnings Release

Average Balances of Loans (continued)

 
Average Balances
 
Nine Months Ended September 30
($ amounts in millions)
2020
 
2019
 
2020 vs. 2019
Commercial and industrial
$
45,410

 
$
40,303

 
$
5,107

 
12.7
 %
Commercial real estate mortgage—owner-occupied
5,500

 
5,496

 
4

 
0.1
 %
Commercial real estate construction—owner-occupied
318

 
415

 
(97
)
 
(23.4
)%
Total commercial
51,228

 
46,214

 
5,014

 
10.8
 %
Commercial investor real estate mortgage
5,150

 
4,763

 
387

 
8.1
 %
Commercial investor real estate construction
1,839

 
1,715

 
124

 
7.2
 %
Total investor real estate
6,989

 
6,478

 
511

 
7.9
 %
Total business
58,217

 
52,692

 
5,525

 
10.5
 %
Residential first mortgage
15,049

 
14,217

 
832

 
5.9
 %
Home equity—lines of credit
5,050

 
5,636

 
(586
)
 
(10.4
)%
Home equity—closed-end
2,964

 
3,272

 
(308
)
 
(9.4
)%
Indirect—vehicles
1,447

 
2,581

 
(1,134
)
 
(43.9
)%
Indirect—other consumer
3,069

 
2,615

 
454

 
17.4
 %
Consumer credit card
1,257

 
1,300

 
(43
)
 
(3.3
)%
Other consumer
1,146

 
1,223

 
(77
)
 
(6.3
)%
Total consumer
29,982

 
30,844

 
(862
)
 
(2.8
)%
Total Loans
$
88,199

 
$
83,536

 
$
4,663

 
5.6
 %

Adjusted Average Balances of Loans (non-GAAP)
Regions believes adjusting total average loans for the impact of SBA PPP loans, the indirect- other consumer exit portfolio and the indirect vehicles exit portfolio, provides a meaningful calculation of loan growth rates and presents them on the same basis as that applied by management.
 
Average Balances
 
Nine Months Ended September 30
($ amounts in millions)
2020
 
2019
 
2020 vs. 2019
Commercial and industrial
$
45,410

 
$
40,303

 
$
5,107

 
12.7
 %
Less: SBA PPP Loans
28


28

 
NM

Adjusted commercial and industrial loans (non-GAAP)
$
45,382

 
$
40,303

 
$
5,079

 
12.6
 %
Total commercial loans
$
51,228

 
$
46,214

 
$
5,014

 
10.8
 %
Less: SBA PPP Loans
28


28

 
NM

Adjusted total commercial loans (non-GAAP)
$
51,200

 
$
46,214

 
$
4,986

 
10.8
 %
Total business loans
$
58,217

 
$
52,692

 
$
5,525

 
10.5
 %
Less: SBA PPP Loans
28


28

 
NM

Adjusted total business loans (non-GAAP)
$
58,189

 
$
52,692

 
$
5,497

 
10.4
 %
Total consumer loans
$
29,982

 
$
30,844

 
$
(862
)
 
(2.8
)%
Less: Indirect-other consumer exit portfolio (1)
1,502

 
1,853

 
(351
)
 
(18.9
)%
Less: Indirect—vehicles
1,447

 
2,581

 
(1,134
)
 
(43.9
)%
Adjusted total consumer loans (non-GAAP)
$
27,033

 
$
26,410

 
$
623

 
2.4
 %
Total Loans
$
88,199

 
$
83,536

 
$
4,663

 
5.6
 %
Less: SBA PPP Loans
28


28

 
NM

Less: Indirect—other consumer exit portfolio (1)
1,502

 
1,853

 
(351
)
 
(18.9
)%
Less: Indirect—vehicles
1,447

 
2,581

 
(1,134
)
 
(43.9
)%
Adjusted total loans (non-GAAP)
$
85,222

 
$
79,102

 
$
6,120

 
7.7
 %
            
(1)
In the fourth quarter of 2019, Regions decided not to renew a third party relationship.


21

Regions Financial Corporation and Subsidiaries                                
Financial Supplement to Third Quarter 2020 Earnings Release

End of Period Deposits
 
As of


9/30/2020
 
9/30/2020
($ amounts in millions)
9/30/2020
 
6/30/2020
 
3/31/2020
 
12/31/2019
 
9/30/2019
 
 vs. 6/30/2020
 
 vs. 9/30/2019
Interest-free deposits
$
49,754

 
$
47,964

 
$
37,133

 
$
34,113

 
$
34,360

 
$
1,790

 
3.7
 %
 
$
15,394

 
44.8
 %
Interest-bearing checking
22,294

 
22,407

 
19,992

 
20,046

 
18,107

 
(113
)
 
(0.5
)%
 
4,187

 
23.1
 %
Savings
11,159

 
10,698

 
9,199

 
8,640

 
8,588

 
461

 
4.3
 %
 
2,571

 
29.9
 %
Money market—domestic
29,387

 
29,263

 
26,328

 
25,326

 
25,329

 
124

 
0.4
 %
 
4,058

 
16.0
 %
Low-cost deposits
112,594

 
110,332

 
92,652

 
88,125

 
86,384

 
2,262

 
2.1
 %
 
26,210

 
30.3
 %
Time deposits
5,840

 
6,428

 
7,122

 
7,442

 
7,639

 
(588
)
 
(9.1
)%
 
(1,799
)
 
(23.6
)%
Total Customer Deposits
118,434

 
116,760

 
99,774

 
95,567

 
94,023

 
1,674

 
1.4
 %
 
24,411

 
26.0
 %
Corporate treasury time deposits
11

 
19

 
256

 
108

 
282

 
(8
)
 
(42.1
)%
 
(271
)
 
(96.1
)%
Corporate treasury other deposits


1,800


NM


NM

Total Deposits
$
118,445

 
$
116,779

 
$
100,030

 
$
97,475

 
$
94,305

 
$
1,666

 
1.4
 %
 
$
24,140

 
25.6
 %


As of


9/30/2020
 
9/30/2020
($ amounts in millions)
9/30/2020
 
6/30/2020
 
3/31/2020
 
12/31/2019
 
9/30/2019
 
 vs. 6/30/2020
 
 vs. 9/30/2019
Consumer Bank Segment
$
69,265

 
$
68,616

 
$
61,238

 
$
59,438

 
$
59,422

 
$
649

 
0.9
 %
 
$
9,843

 
16.6
 %
Corporate Bank Segment
39,799

 
38,848

 
29,862

 
27,626

 
26,312

 
951

 
2.4
 %
 
13,487

 
51.3
 %
Wealth Management Segment
8,982

 
8,888

 
8,372

 
8,162

 
7,905

 
94

 
1.1
 %
 
1,077

 
13.6
 %
Other (1)
399

 
427

 
558

 
2,249

 
666

 
(28
)
 
(6.6
)%
 
(267
)
 
(40.1
)%
Total Deposits
$
118,445

 
$
116,779

 
$
100,030

 
$
97,475

 
$
94,305

 
$
1,666

 
1.4
 %
 
$
24,140

 
25.6
 %


As of


9/30/2020
 
9/30/2020
($ amounts in millions)
9/30/2020
 
6/30/2020
 
3/31/2020
 
12/31/2019
 
9/30/2019
 
 vs. 6/30/2020
 
 vs. 9/30/2019
Wealth Management - Private Wealth
$
7,726

 
$
7,816

 
$
7,168

 
$
7,180

 
$
6,913

 
$
(90
)
 
(1.2
)%
 
$
813

 
11.8
 %
Wealth Management - Institutional Services
1,256

 
1,072

 
1,204

 
982

 
992

 
184

 
17.2
 %
 
264

 
26.6
 %
Total Wealth Management Segment Deposits
$
8,982

 
$
8,888

 
$
8,372

 
$
8,162

 
$
7,905

 
$
94

 
1.1
 %
 
$
1,077

 
13.6
 %


As of
End of Period Deposits by Percentage


9/30/2020
 
6/30/2020
 
3/31/2020
 
12/31/2019
 
9/30/2019
Interest-free deposits


42.0
%
 
41.1
%

37.1
 %
 
35.0
%
 
36.4
 %
Interest-bearing checking


18.8
%
 
19.2
%

20.0
 %
 
20.6
%
 
19.2
 %
Savings


9.4
%
 
9.2
%

9.2
 %
 
8.9
%
 
9.1
 %
Money market—domestic


24.8
%
 
25.1
%
 
26.3
 %
 
26.0
%
 
26.9
 %
Low-cost deposits


95.0
%
 
94.6
%

92.6
 %
 
90.5
%
 
91.6
 %
Time deposits


5.0
%
 
5.5
%

7.1
 %
 
7.6
%
 
8.1
 %
Total Customer Deposits


100.0
%
 
100.0
%

99.7
 %
 
98.1
%
 
99.7
 %
Corporate treasury time deposits


%
 
%

0.3
 %
 
0.1
%
 
0.3
 %
Corporate treasury other deposits


%
 
%
 
 %
 
1.8
%
 
 %
Total Deposits


100.0
%
 
100.0
%

100.0
 %
 
100.0
%
 
100.0
 %
                
(1)
Other deposits represent non-customer balances primarily consisting of wholesale funding (for example, Eurodollar trade deposits, selected deposits and brokered time deposits).


22

Regions Financial Corporation and Subsidiaries                                
Financial Supplement to Third Quarter 2020 Earnings Release

Average Balances of Deposits
 
Average Balances
($ amounts in millions)
3Q20
 
2Q20
 
1Q20
 
4Q19
 
3Q19
 
3Q20 vs. 2Q20
 
3Q20 vs. 3Q19
Interest-free deposits
$
48,314

 
$
44,382

 
$
34,205

 
$
34,098

 
$
33,599

 
$
3,932

 
8.9
 %
 
$
14,715

 
43.8
 %
Interest-bearing checking
22,098

 
21,755

 
19,273

 
18,668

 
18,257

 
343

 
1.6
 %
 
3,841

 
21.0
 %
Savings
10,935

 
10,152

 
8,822

 
8,616

 
8,607

 
783

 
7.7
 %
 
2,328

 
27.0
 %
Money market—domestic
29,146

 
27,870

 
25,151

 
25,289

 
24,904

 
1,276

 
4.6
 %
 
4,242

 
17.0
 %
Low-cost deposits
110,493

 
104,159

 
87,451

 
86,671

 
85,367

 
6,334

 
6.1
 %
 
25,126

 
29.4
 %
Time deposits
6,150

 
6,690

 
7,302

 
7,543

 
7,712

 
(540
)
 
(8.1
)%
 
(1,562
)
 
(20.3
)%
Total Customer Deposits
116,643

 
110,849

 
94,753

 
94,214

 
93,079

 
5,794

 
5.2
 %
 
23,564

 
25.3
 %
Corporate treasury time deposits
13

 
72

 
280

 
189

 
436

 
(59
)
 
(81.9
)%
 
(423
)
 
(97.0
)%
Corporate treasury other deposits


639

 
109

 
541


NM

 
(541
)
 
(100.0
)%
Total Deposits
$
116,656

 
$
110,921

 
$
95,672

 
$
94,512

 
$
94,056

 
$
5,735

 
5.2
 %
 
22,600

 
24.0
 %
 
Average Balances
($ amounts in millions)
3Q20
 
2Q20
 
1Q20
 
4Q19
 
3Q19
 
3Q20 vs. 2Q20
 
3Q20 vs. 3Q19
Consumer Bank Segment
$
68,842

 
$
65,722

 
$
59,711

 
$
59,359

 
$
59,217

 
$
3,120

 
4.7
 %
 
$
9,625

 
16.3
 %
Corporate Bank Segment
38,755

 
36,409

 
26,618

 
26,627

 
25,690

 
2,346

 
6.4
 %
 
13,065

 
50.9
 %
Wealth Management Segment
8,658

 
8,382

 
8,073

 
7,891

 
7,843

 
276

 
3.3
 %
 
815

 
10.4
 %
Other (1)
401

 
408

 
1,270

 
635

 
1,306

 
(7
)
 
(1.7
)%
 
(905
)
 
(69.3
)%
Total Deposits
$
116,656

 
$
110,921

 
$
95,672

 
$
94,512

 
$
94,056

 
$
5,735

 
5.2
 %
 
$
22,600

 
24.0
 %

 
Average Balances
($ amounts in millions)
3Q20
 
2Q20
 
1Q20
 
4Q19
 
3Q19
 
3Q20 vs. 2Q20
 
3Q20 vs. 3Q19
Wealth Management - Private Wealth
$
7,723

 
$
7,395

 
$
7,062

 
$
7,040

 
$
6,984

 
$
328

 
4.4
 %
 
$
739

 
10.6
%
Wealth Management - Institutional Services
935

 
987

 
1,011

 
851

 
859

 
(52
)
 
(5.3
)%
 
76

 
8.8
%
Total Wealth Management Segment Deposits
$
8,658

 
$
8,382

 
$
8,073

 
$
7,891

 
$
7,843


$
276

 
3.3
 %
 
$
815

 
10.4
%
 
Average Balances
 
Nine Months Ended September 30
($ amounts in millions)
2020
 
2019
 
2020 vs. 2019
Interest-free deposits
$
42,323

 
$
33,791

 
$
8,532

 
25.2
 %
Interest-bearing checking
21,046

 
18,808

 
2,238

 
11.9
 %
Savings
9,973

 
8,754

 
1,219

 
13.9
 %
Money market—domestic
27,395

 
24,418

 
2,977

 
12.2
 %
Low-cost deposits
100,737

 
85,771

 
14,966

 
17.4
 %
Time deposits
6,712

 
7,662

 
(950
)
 
(12.4
)%
Total Customer Deposits
107,449

 
93,433

 
14,016

 
15.0
 %
Corporate treasury time deposits
121

 
529

 
(408
)
 
(77.1
)%
Corporate treasury other deposits
212

 
419

 
(207
)
 
(49.4
)%
Total Deposits
$
107,782

 
$
94,381

 
$
13,401

 
14.2
 %
 
Average Balances
 
Nine Months Ended September 30
($ amounts in millions)
2020
 
2019
 
2020 vs. 2019
Consumer Bank Segment
$
64,773

 
$
58,820

 
$
5,953

 
10.1
 %
Corporate Bank Segment
33,945

 
26,245

 
7,700

 
29.3
 %
Wealth Management Segment
8,372

 
7,904

 
468

 
5.9
 %
Other (1)
692

 
1,412

 
(720
)
 
(51.0
)%
Total Deposits
$
107,782

 
$
94,381

 
$
13,401

 
14.2
 %
 
Average Balances
 
Nine Months Ended September 30
($ amounts in millions)
2020
 
2019
 
2020 vs. 2019
Wealth Management - Private Wealth
$
7,395

 
$
7,042

 
$
353

 
5.0
%
Wealth Management - Institutional Services
977

 
862

 
115

 
13.3
%
Total Wealth Management Segment Deposits
$
8,372

 
$
7,904

 
$
468

 
5.9
%
________
(1)
Other deposits represent non-customer balances primarily consisting of wholesale funding (for example, Eurodollar trade deposits, selected deposits and brokered time deposits).


23

Regions Financial Corporation and Subsidiaries                                
Financial Supplement to Third Quarter 2020 Earnings Release

Reconciliation to GAAP Financial Measures
Tangible Common Ratios
The following tables provide the calculation of the end of period “tangible common shareholders’ equity” and "tangible common book value per share" ratios, and a reconciliation of shareholders’ equity (GAAP) to tangible common shareholders’ equity (non-GAAP). Since analysts and banking regulators may assess Regions’ capital adequacy using tangible common shareholders' equity, we believe that it is useful to provide investors the ability to assess Regions’ capital adequacy on this same basis.


As of and for Quarter Ended
($ amounts in millions, except per share data)
 
9/30/2020
 
6/30/2020
 
3/31/2020
 
12/31/2019
 
9/30/2019
Tangible Common Ratios


Shareholders’ equity (GAAP)
 
$
17,904

 
$
17,602

 
$
17,332

 
$
16,295

 
$
16,581

Less:


Preferred stock (GAAP)
 
1,656

 
1,656

 
1,310

 
1,310

 
1,310

Intangible assets (GAAP)
 
5,316

 
5,330

 
4,943

 
4,950

 
4,956

Deferred tax liability related to intangibles (GAAP)
 
(105
)
 
(103
)
 
(92
)
 
(92
)
 
(93
)
Tangible common shareholders’ equity (non-GAAP)
A
$
11,037

 
$
10,719

 
$
11,171

 
$
10,127

 
$
10,408

Total assets (GAAP)
 
$
145,180

 
$
144,070

 
$
133,542

 
$
126,240

 
$
128,147

Less:


Intangible assets (GAAP)
 
5,316

 
5,330

 
4,943

 
4,950

 
4,956

Deferred tax liability related to intangibles (GAAP)
 
(105
)
 
(103
)
 
(92
)
 
(92
)
 
(93
)
Tangible assets (non-GAAP)
B
$
139,969

 
$
138,843

 
$
128,691

 
$
121,382

 
$
123,284

Shares outstanding—end of quarter
C
960

 
960

 
957

 
957

 
964

Tangible common shareholders’ equity to tangible assets (non-GAAP)
A/B
7.88
%
 
7.72
%
 
8.68
%
 
8.34
%
 
8.44
%
Tangible common book value per share (non-GAAP)
A/C
$
11.49

 
$
11.16

 
$
11.67

 
$
10.58

 
$
10.79


24

Regions Financial Corporation and Subsidiaries                                
Financial Supplement to Third Quarter 2020 Earnings Release

Forward-Looking Statements
This release may include forward-looking statements as defined in the Private Securities Litigation Reform Act of 1995. Any statement that does not describe historical or current facts is a forward-looking statement. Forward-looking statements are not based on historical information, but rather are related to future operations, strategies, financial results or other developments. Forward-looking statements are based on management’s current expectations as well as certain assumptions and estimates made by, and information available to, management at the time the statements are made. Those statements are based on general assumptions and are subject to various risks, and because they also relate to the future they are likewise subject to inherent uncertainties and other factors that may cause actual results to differ materially from the views, beliefs and projections expressed in such statements. Therefore, we caution you against relying on any of these forward-looking statements. These risks, uncertainties and other factors include, but are not limited to, those described below:
Current and future economic and market conditions in the United States generally or in the communities we serve (in particular the Southeastern United States), including the effects of possible declines in property values, increases in unemployment rates, financial market disruptions and potential reductions of economic growth, which may adversely affect our lending and other businesses and our financial results and conditions.
Possible changes in trade, monetary and fiscal policies of, and other activities undertaken by, governments, agencies, central banks and similar organizations, which could have a material adverse effect on our earnings.
Possible changes in market interest rates or capital markets could adversely affect our revenue and expense, the value of assets and obligations, and the availability and cost of capital and liquidity.
The impact of pandemics, including the ongoing COVID-19 pandemic, on our businesses and financial results and conditions.The duration and severity of the ongoing COVID-19 pandemic, which has disrupted the global economy, has and could continue to adversely affect our capital and liquidity position, impair the ability of borrowers to repay outstanding loans and increase our allowance for credit losses, impair collateral values, and result in lost revenue or additional expenses. The pandemic could also cause an outflow of deposits, result in goodwill impairment charges and the impairment of other financial and nonfinancial assets, and increase our cost of capital.
Any impairment of our goodwill or other intangibles, any repricing of assets, or any adjustment of valuation allowances on our deferred tax assets due to changes in law, adverse changes in the economic environment, declining operations of the reporting unit or other factors.
The effect of changes in tax laws, including the effect of any future interpretations of or amendments to Tax Reform, which may impact our earnings, capital ratios and our ability to return capital to shareholders.
Possible changes in the creditworthiness of customers and the possible impairment of the collectability of loans and leases, including operating leases.
Changes in the speed of loan prepayments, loan origination and sale volumes, charge-offs, loan loss provisions or actual loan losses where our allowance for loan losses may not be adequate to cover our eventual losses.
Possible acceleration of prepayments on mortgage-backed securities due to low interest rates, and the related acceleration of premium amortization on those securities.
Loss of customer checking and savings account deposits as customers pursue other, higher-yield investments, which could increase our funding costs.
Possible changes in consumer and business spending and saving habits and the related effect on our ability to increase assets and to attract deposits, which could adversely affect our net income.
Our ability to effectively compete with other traditional and non-traditional financial services companies, some of whom possess greater financial resources than we do or are subject to different regulatory standards than we are.
Our inability to develop and gain acceptance from current and prospective customers for new products and services and the enhancement of existing products and services to meet customers’ needs and respond to emerging technological trends in a timely manner could have a negative impact on our revenue.
Our inability to keep pace with technological changes could result in losing business to competitors.
Changes in laws and regulations affecting our businesses, including legislation and regulations relating to bank products and services, as well as changes in the enforcement and interpretation of such laws and regulations by applicable governmental and self-regulatory agencies, which could require us to change certain business practices, increase compliance risk, reduce our revenue, impose additional costs on us, or otherwise negatively affect our businesses.
Our capital actions, including dividend payments, common stock repurchases, or redemptions of preferred stock or other regulatory capital instruments, must not cause us to fall below minimum capital ratio requirements, with applicable buffers taken into account, and must comply with other requirements under law or imposed by our regulators, which may impact our ability to return capital to shareholders.
Our ability to comply with stress testing and capital planning requirements (as part of the CCAR process or otherwise) may continue to require a significant investment of our managerial resources due to the importance of such tests and requirements.
Our ability to comply with applicable capital and liquidity requirements (including, among other things, the Basel III capital standards), including our ability to generate capital internally or raise capital on favorable terms, and if we fail to meet requirements, our financial condition and market perceptions of us could be negatively impacted.
The effects of any developments, changes or actions relating to any litigation or regulatory proceedings brought against us or any of our subsidiaries.
The costs, including possibly incurring fines, penalties, or other negative effects (including reputational harm) of any adverse judicial, administrative, or arbitral rulings or proceedings, regulatory enforcement actions, or other legal actions to which we or any of our subsidiaries are a party, and which may adversely affect our results.
Our ability to manage fluctuations in the value of assets and liabilities and off-balance sheet exposure so as to maintain sufficient capital and liquidity to support our business.
Our ability to execute on our strategic and operational plans, including our ability to fully realize the financial and non-financial benefits relating to our strategic initiatives.
The risks and uncertainties related to our acquisition or divestiture of businesses.
The success of our marketing efforts in attracting and retaining customers.


25

Regions Financial Corporation and Subsidiaries                                
Financial Supplement to Third Quarter 2020 Earnings Release

Our ability to recruit and retain talented and experienced personnel to assist in the development, management and operation of our products and services may be affected by changes in laws and regulations in effect from time to time.
Fraud or misconduct by our customers, employees or business partners.
Any inaccurate or incomplete information provided to us by our customers or counterparties.
Inability of our framework to manage risks associated with our business such as credit risk and operational risk, including third-party vendors and other service providers, which could, among other things, result in a breach of operating or security systems as a result of a cyber attack or similar act or failure to deliver our services effectively.
Dependence on key suppliers or vendors to obtain equipment and other supplies for our business on acceptable terms.
The inability of our internal controls and procedures to prevent, detect or mitigate any material errors or fraudulent acts.
The effects of geopolitical instability, including wars, conflicts and terrorist attacks and the potential impact, directly or indirectly, on our businesses.
The effects of man-made and natural disasters, including fires, floods, droughts, tornadoes, hurricanes, and environmental damage (specifically in the Southeastern United States), which may negatively affect our operations and/or our loan portfolios and increase our cost of conducting business. The severity and impact of future earthquakes, fires, hurricanes, tornadoes, droughts, floods and other weather-related events are difficult to predict and may be exacerbated by global climate change.
Changes in commodity market prices and conditions could adversely affect the cash flows of our borrowers operating in industries that are impacted by changes in commodity prices (including businesses indirectly impacted by commodities prices such as businesses that transport commodities or manufacture equipment used in the production of commodities), which could impair their ability to service any loans outstanding to them and/or reduce demand for loans in those industries.
Our ability to identify and address cyber-security risks such as data security breaches, malware, “denial of service” attacks, “hacking” and identity theft, including account take-overs, a failure of which could disrupt our business and result in the disclosure of and/or misuse or misappropriation of confidential or proprietary information, disruption or damage to our systems, increased costs, losses, or adverse effects to our reputation.
Our ability to achieve our expense management initiatives.
Market replacement of LIBOR and the related effect on our LIBOR-based financial products and contracts, including, but not limited to, derivative products, debt obligations, deposits, investments, and loans.
Possible downgrades in our credit ratings or outlook could, among other negative impacts, increase the costs of funding from capital markets.
The effects of a possible downgrade in the U.S. government’s sovereign credit rating or outlook, which could result in risks to us and general economic conditions that we are not able to predict.
The effects of problems encountered by other financial institutions that adversely affect us or the banking industry generally could require us to change certain business practices, reduce our revenue, impose additional costs on us, or otherwise negatively affect our businesses.
The effects of the failure of any component of our business infrastructure provided by a third party could disrupt our businesses, result in the disclosure of and/or misuse of confidential information or proprietary information, increase our costs, negatively affect our reputation, and cause losses.
Our ability to receive dividends from our subsidiaries could affect our liquidity and ability to pay dividends to shareholders.
Changes in accounting policies or procedures as may be required by the FASB or other regulatory agencies could materially affect our financial statements and how we report those results, and expectations and preliminary analyses relating to how such changes will affect our financial results could prove incorrect.
Other risks identified from time to time in reports that we file with the SEC.
Fluctuations in the price of our common stock and inability to complete stock repurchases in the time frame and/or on the terms anticipated.
The effects of any damage to our reputation resulting from developments related to any of the items identified above.
The foregoing list of factors is not exhaustive. For discussion of these and other factors that may cause actual results to differ from expectations, look under the captions “Forward-Looking Statements” and “Risk Factors” of Regions’ Annual Report on Form 10-K for the year ended December 31, 2019 and the "Risk Factors" of Regions' Quarterly Report on Form 10-Q for the quarter ended June 30, 2020 as filed with the SEC.
Further, statements about the potential effects of the COVID-19 pandemic on our businesses and financial results and conditions may constitute forward-looking statements and are subject to the risk that the actual effects may differ, possibly materially, from what is reflected in those forward-looking statements due to factors and future developments that are uncertain, unpredictable and in many cases beyond our control, including the scope and duration of the pandemic (including any second wave or resurgences), actions taken by governmental authorities in response to the pandemic, and the direct and indirect impact of the pandemic on our customers, third parties and us.
The words "future," “anticipates,” "assumes," “intends,” “plans,” “seeks,” “believes,” "predicts," "potential," "objectives," “estimates,” “expects,” “targets,” “projects,” “outlook,” “forecast,” "would," “will,” “may,” “might,” “could,” “should,” “can,” and similar terms and expressions often signify forward-looking statements. You should not place undue reliance on any forward-looking statements, which speak only as of the date made. Factors or events that could cause our actual results to differ may emerge from time to time, and it is not possible to predict all of them. We assume no obligation and do not intend to update or revise any forward-looking statements that are made from time to time, either as a result of future developments, new information or otherwise, except as may be required by law.
Regions’ Investor Relations contact is Dana Nolan at (205) 264-7040; Regions’ Media contact is Evelyn Mitchell at (205) 264-4551.


26
Exhibit 99.3 3rd Quarter Earnings Conference Call October 20, 2020


Third quarter 2020 overview Net Income Available to $501M Common Shareholders Diluted Earnings Per $0.52 Share Adjusted Total $1,596M Revenue(1) Generated highest Adjusted Non- adjusted pre-tax pre- $889M Interest Expense(1) provision income(1) in over a decade Adjusted Pre-Tax Pre- $707M Provision Income(1) 2 (1) Non-GAAP, see appendix for reconciliation.


Supporting our customers Customer Loan Modifications Highlights • 37% of active mortgage deferral As of 6/30/20 As of 9/30/20 balances as of 9/30/20 are due to Balances w/ Balances w/ deferral ($ in Deferral as % deferral ($ in Deferral as % GNMA repurchases during the millions) of total millions) of total quarter Mortgage (portfolio only) $1,422 9% $924 6% • As of 9/30/20, greater than 95% of Home Equity 251 3% 49 1% loans balances previously on deferral are current or less than 30 (1) Vehicles 102 8% 11 1% days past due Indirect-Other Consumer 84 3% 25 1% • Through September, and excluding Credit Card 27 2% 6 1% mortgage, there are second deferral requests on consumer Other Consumer 42 4% 9 1% products totaling $50M Total Consumer 1,928 6% 1,024 3% Total Business(2) 3,763 6% 468 1% Total $5,691 6% $1,492 2% (1) Indirect vehicles deferral metrics include Dealer Financial Services and Direct auto only. (2) Business loan deferral metrics include 3 Ascentium Capital.


Average loans Adjusted average loans and leases(1) QoQ highlights ($ in billions) • Average loans decreased 3%; adjusted $85.8 average loans(1) decreased 4% $82.3 $78.8 • Pipelines remain healthy, however clients 26.9 continue to deleverage 27.3 26.3 • Commercial line utilization levels reached historical low ending quarter at 41% • Remain focused on client selectivity and full relationship with appropriate risk-adjusted returns 58.9 55.0 52.5 • Expect the majority of PPP loan forgiveness to push into 1H21; minimal expected in 4Q20 • YTD mortgage production is more than double the prior year; ~55% higher than full-year 3Q19 2Q20 3Q20 2019 levels • ~$340M Ginnie Mae residential mortgages Adjusted business loans(1) Adjusted consumer loans(1) were bought out of servicing pools during the quarter 4 (1) Non-GAAP, see appendix for reconciliation.


Average deposits Average deposits by segment QoQ highlights ($ in billions) $116.7 $110.9 0.4 • Average deposits increased 5%; ending 0.4 8.7 8.4 deposits increased 1% $94.0 1.3 • Commercial clients' cash increases 7.8 38.8 resulting from focus on supply chain 36.4 efficiencies and declines in working 25.7 asset levels • Declining interest rates drive corporate clients to bring excess deposits back to Regions 65.7 68.8 59.2 • Consumer deposit growth driven by government stimulus as well as reduced spending during the pandemic • Growth in consumer deposits began 3Q19 2Q20 3Q20 leveling off toward the end of 3Q Consumer Bank Corporate Bank Wealth Mgt Other(1) 5 (1) Other deposits represent non-customer balances primarily consisting of wholesale funding (for example, Eurodollar deposits, selected deposits and brokered time deposits).


Net interest income and net interest margin - Liquidity Impacts NII(1) and NIM ($ in millions) $985 $1,000 $950 3.44% 3.38% 3.41% 3.19% 3.13% 3Q19 2Q20 3Q20 NII(1) NIM NIM excl. PPP/Cash • In 3Q, deposit and cash balances remained elevated given stimulus / liquidity in the system ◦ PPP and cash account for -28 bps NIM and +$31M(2) NII within the quarter (-9bps / + $13M QoQ) • Cash deployment strategies in 3Q included: ◦ ~$3B Agency MBS/CMBS purchases ◦ $1B Bank debt call ◦ ~$400M FHLB advance early termination (FHLB bal=$0) 6 (1) Net interest income on a fully taxable equivalent basis. (2) NII for PPP loans includes an estimated funding cost.


Net interest income and net interest margin - Core Drivers Core(1) NIM Attribution Core Drivers of NIM and NII • 3Q benefits from +$3B forward starting hedge 3.41% notional becoming active; additional benefit from 3.38% lower short-term rates offsets a portion of the long-term pressure: ◦ Hedging program; $94M NII in 3Q(3) ◦ Deposit pricing advantage; Sept total deposit costs at 10 bps - all-time low • Residual exposure to long-term rates at low levels Non- Lower 2Q20 excl. Hedge Market Cash Days/ 3Q20 excl. recurring loan ◦ Fixed rate loan/securities production at PPP/cash notional rates mgmt other PPP/cash items(2) bals lower rates NIM +2bps +3bps +3bps -2bps -2bps -1bps ◦ Premium amortization; from $33M 2Q to (4) NII +$7M +11M -$18M -$8M +$4M +$7M $46M 3Q Long-term rate and balance sheet • Loan balance declines mostly attributable to C&I deleveraging pressure will persist; loan line normalization and the strategic reduction of balance declines expected to moderate indirect loans 4Q 2020 Expectations • 3Q NII elevated by non-recurring items(2); after normalizing for this, 4Q NII expected to be relatively flat to modestly lower(5) ◦ NII and NIM in 4Q will be pressured by the continued turnover of assets at lower market interest rate levels, and lower loan balances/mix ◦ 4Q hedge benefit estimated at $97M; uncertain timing of PPP fee acceleration to benefit NII/NIM - currently assume no benefit until 2021 • Excluding PPP/cash, NIM expected to remain in the 3.30%s (1) Core NIM excludes PPP and excess cash over $750M. (2) Items that may not repeat include bond call benefits, loan prepayment penalties, 7 other loan yield adjustments, and bond premium amortization associated with elevated Ginnie Mae buy-outs. (3) Hedges remain active; $1.8B unrealized, pre-tax gain, to be amortized into NII over the remaining life of hedges ~4.5 years. (4) Ginnie Mae buy-outs add ~$4M. (5) Assumes Fed Funds Target remains 0%-0.25%, 1m LIBOR 0.12%-0.20%, and 10yr US Treasury is range-bound 0.50% - 0.90%.


Non-interest income QoQ highlights Change vs • Service charges impacted by elevated deposits and lower customer spend; while improved, at ($ in millions) 3Q20 2Q20 3Q19 current levels expect $30-35M per quarter Service charges $152 16.0% (18.3)% negative impact vs. prior year levels • Card & ATM fees have recovered to prior year Card and ATM fees 115 13.9% 0.9% levels; debit card spend fully recovered; credit card spend improved but not fully recovered Wealth management income 85 7.6% 2.4% • Strong mortgage production associated with Capital markets income (excluding CVA/DVA) 56 (8.2)% 33.3% lower rate environment contributed to record 3Q income; 2020 production on track to nearly Capital markets - CVA/DVA 5 (85.3)% 183.3% double 2019 levels Mortgage income 108 31.7% 92.9% • Wealth management produced solid results; investment service fee income increased 35%, Market Value adjustments (on employee benefit assets - other) 14 (12.5)% 100.0% benefiting from branches reopening Valuation gain on equity 44 NM NM • Capital markets delivered record debt & equity investment underwriting fees; expect capital markets near- Other 76 10.1% —% term quarterly run rate of $45-55M, excluding CVA Total non-interest income $655 14.3% 17.4% • $44M valuation gain for equity investment in a Adjusted non-interest company with 3Q IPO; subject to 180-day income(1) 608 6.3% 9.2% lockout period, which is reflected in valuation (1) Non-GAAP; see appendix for reconciliation. 8 NM - Not Meaningful CVA/DVA - customer derivative "credit" and "debit valuation adjustments"


Non-interest expense Adjusted non-interest expense(1) QoQ highlights ($ in millions) • Adjusted expenses(1) decreased 1% compared to $865 $898 $889 the prior quarter • Excluding COVID-related expenses and the impact 57.4% 57.7% 55.3% of changes in market valuation on employee benefit accounts, 3Q adjusted expenses(1) were $872M • Since announcing Simplify & Grow (S&G) in 2016, 3Q19 2Q20 3Q20 adjusted expense(1) growth has been limited to (1) (1) less than 1% CAGR; while continuing to make Adjusted non-interest expense Adjusted efficiency ratio investments to grow our business <1% CAGR • Benefits from the S&G Continuous Improvement initiative include reduced square footage, increased digital adoption, branch consolidations, $3,434 $3,443 $3,387 $3,419 and reduced 3rd-party spend • Evaluating digital and technology spend priorities to align with recent changes in customer behavior • Committed to adjusting the expense base commensurate with the revenue environment • 3Q adjusted efficiency ratio(1) improved 240 bps to 55.3% QoQ, lowest level in over 12 years 2016 2017 2018 2019 (1) Non-GAAP; see appendix for reconciliation. 9


Asset quality Net charge-offs and ratio Criticized business loans ($ in millions) $182 ($ in millions) 132 0.80% $4,225 $113 $3,734 $92 75 $2,319 30 0.50% 0.44% 62 50 38 3Q19 2Q20 3Q20 3Q19 2Q20 3Q20 Consumer net Business services Net charge-offs • If positive trends continue, no additional reserve build charge-offs net charge-offs ratio anticipated; 4Q NCOs expected to be between 55-65 bps NPLs and ACL coverage ratio $767 • Provision of $113M resulting in ACL of 2.74% of total ($ in millions) loans (2.90%(1) ex-PPP) $614 $462 395% • NPLs increased 19 bps to 0.87% of total loans, primarily 316% driven by downgrades in retail IRE and energy 198% • Criticized business loans decreased 12% resulting from upgrades primarily in retail showing improvement due to strong anchor tenants 3Q19 2Q20 3Q20 NPLs - excluding LHFS ACL coverage • Outcome of recent SNC exam fully incorporated in 3Q ratio results (1) Non-GAAP; see appendix for reconciliation. 10


Bottom up review informs and narrows COVID-19 high-risk industry sectors (as of September 30, 2020) % of Utilization Leveraged SNC % % C&I Portfolio BAL$(1) BAL$ Rate(2) % of BAL$ % of BAL$ Deferral Criticized Energy – Oil & Gas Extraction, Oilfield Services $1.15b 1.3% 60% —% 79% 3% 43% Healthcare – Offices of Physicians and Other Health Practitioners $1.11b 1.3% 74% 5% 5% 2% 4% Other Consumer Services – Religious Organizations $0.94b 1.1% 73% 26% 33% 4% 16% Restaurants – Full service $0.73b 0.8% 84% 24% 37% 4% 40% Travel and Leisure – Amusement, arts and recreation, charter bus industry $0.03b —% 93% —% —% 69% 49% Total $3.96b 4.5% 71% 12% 39% 4% 25% % of Utilization Leveraged SNC % % CRE related exposures including unsecured C&I BAL$(1) BAL$ Rate(2) % of BAL$ % of BAL$ Deferral Criticized Unsecured Hotels – Full service, limited service, extended stay $0.68b 0.8% 78% —% 96% —% —% IRE Hotels – Full service, limited service, extended stay $0.29b 0.3% 87% —% —% 16% 95% Unsecured Retail – Inclusive of malls and outlet centers excludes Grocery Anchored REITs $0.92b 1.0% 44% —% 100% —% 10% IRE Retail (non-essential) – Inclusive of malls and outlet centers $0.73b 0.8% 94% —% 28% 1% 25% Total $2.62b 3.0% 64% —% 68% 2% 21% Ongoing Portfolio Surveillance • Proactive, frequent customer dialogue • Central reporting on enterprise-wide relief initiatives • Closely monitoring most vulnerable customers • Established pandemic related monitoring • Monitoring ratings migration • Deferral requests • Revolver draws 11 (1) Amounts exclude PPP Loans, Operating Leases and Held For Sale exposure. (2) Borrowing Base Adjusted Commitments, excludes Operating Leases and Held For Sale.


Capital and liquidity Tier 1 capital ratio(1) QoQ highlights • During 3Q declared $149M in common dividends • 3.0% Stress Capital Buffer for 4Q20-3Q21 10.8% 10.8% 10.4% • Common Equity Tier 1 ratio increased ~40 bps to an estimated 9.3%; expect near-term capital levels to increase further • Historically high deposit balances contributed to 300 bps decline in 3Q loan-to-deposit ratio 3Q19 2Q20 3Q20 Common equity Tier 1 ratio(1) Loan-to-deposit ratio(2) 88% 78% 75% 9.6% 9.3% 8.9% 3Q19 2Q20 3Q20 3Q19 2Q20 3Q20 (1) Current quarter ratios are estimated. (2) Based on ending balances. 12


Appendix 13


Third quarter 2020 highlights Summary of third quarter results Selected items impacting the quarter QoQ YoY ($ amounts in millions, except per share data) 3Q20 Change Change (amounts in millions, except per share data) 3Q20 (1) Net interest income $ 988 1.6% 5.4% Pre-tax adjusted items : Provision for credit losses 113 (87.2)% 4.6% Branch consolidation, property and equipment charges $ (3) Non-interest income 655 14.3% 17.4% Loss on early extinguishment of debt (2) Non-interest expense 896 (3.0)% 2.9% Salaries and benefits related to severance Income (loss) before (2) income taxes 634 NM 22.9% charges Income tax expense Valuation gain on equity investment 44 (benefit) 104 NM (2.8)% Securities gains (losses), net 3 Net income (loss) 530 NM 29.6% Total pre-tax adjusted items(1) 40 Preferred dividends 29 26.1% 20.8% (2) Diluted EPS impact $ 0.03 Net income (loss) available $ 501 NM 30.1% to common shareholders Pre-tax additional selected items(3): Diluted EPS $ 0.52 NM 33.3% Capital markets income - CVA/DVA $ 5 PPP loans interest income 35 COVID-19 related expenses (3) (1) Non-GAAP, see appendix for reconciliation. (2) Based on income taxes at an approximate 25% incremental rate. (3) Items represent an outsized 14 impact to the quarter or quarterly trends, but are not considered non-GAAP adjustments. NM - Not Meaningful


Growth in Digital Active Digital Banking Users Active Mobile Banking Users Digital Banking Log-Ins (Millions) (Millions) (Millions) 9% YoY 22% YoY 5% YoY 2.0 2.0 285 286 2.7 2.8 2.8 234 147 143 120 1.8 138 143 114 3Q19 2Q20 3Q20 3Q19 2Q20 3Q20 3Q19 2Q20 3Q20 Mobile Banking Log-Ins Online Banking Log-Ins (2) Digital Sales(1) Customer Transactions Deposit Transactions by Channel Mix (Accounts in Thousands) 47% 68.4 71.2 40% 34% 33% 57% 49% 6.7 57.7 6.3 2.9 2.8 3.5 7.4 67% 66% 34% 60% 32% 59.2 61.7 30% 46.8 19% 20% 13% 3Q19 2Q20 3Q20 3Q19 2Q20 3Q20 3Q19 2Q20 3Q20 Deposits Credit Card Accounts Loans Digital Non-Digital Mobile ATM Branch 15 (1) Digital sales represents accounts opened. (2) Digital transactions represent online and mobile only; Non-digital transactions represent branches, contact centers and ATMs.


SNV, USB, ZION; TFC excluded given M&A noise Uses EOP 2Q20data latest available whenpublished; Source: SNL Financial, SECReporting; Peers include CFG,CMA, FHN, FITB,HBAN, HWC, KEY, MTB, PNC, a blendof 1m/3mLIBOR, primarily 1mLIBOR. (4) Avg. receive fixedrateincluding amortization ofdeferredgains (losses)from terminatedcash flowhedges.(5) not disclose weightedaverage livesofcash flowhedge(3)Weighted averagestrike priceforprogram floorsexcludes premiumspaid. Swapandfloorfloating legs (1) Includesboth active andforwardstartingswaps/floors enteredintopriorto9/30/2020 thatprovideincrementalNIIprotection. (2)Peers 1,2,3,4,&7 did Hedging strategyprotection Securities andhedgesas%ofearning assets 9 4 . . 5 3 - RF 3Q % Cash-flow HedgeContributiontoNII-2Q20 1 2 3 4 5 1 0 0 0 0 0 0 0 8 1 % % % % % % % . . 8 8 Peer 12 % Peer Median24% 8 1 . . 5 Peer 3 3 Peer 11 % 6 1 . . Peer 11 6 8 Peer 10 % 6 4 . Securities Peer 2 . 2 6 RF 2Q % 5 3 Peer 8 . . 2 8 Peer 9 % 4 Peer 6 1 . . 7 2 Peer 8 % Peer 4 4 . 0 Peer 7 % Peer 1 4 Cash FlowHedges 2 . . 0 8 Peer 5 Peer 6 % 2 2 . . 3 2 Peer 7 Peer 5 % 1 on CFHedges WAL remaining . 9 Peer 9 Peer 4 % 0 . Peer 12 7 Peer 3 % 0 . (1) RF 1 % (5) Peer 2 Peer 10 (2) Peer 1 Change in AOCI /earningassets2Q20 vs2Q19 basis points Legacy Swaps Program Floors Program Swaps Hedge Cash-Flow 1 1 2 - • • • 5 0 5 0 5 0 0 0 0 0 0 Cash-flow HedgeProgram Details9/30/20 $94M toNIIin3Q,or~10%of Current unrealizedgainonhedges=~$1.8B; added duration ofprotection Better protectedthanpeersetbothinsizeand started in3Q $20.5B oftotal$21.75Bhedgesactivein3Q20;$3B Peer Median49bps Peer 3 ◦ Peer 2 lock infloortimevalue the durationfromsecuritiespurchasesandto Unwound $1Bfloorsin3Qtooffsetaportionof Change inSecurities AOCI /Earning Assets Change inHedge AOCI /Earning Assets Peer 8 Notional Peer 5 $5.00B $5.75B $11.0B Peer 11 Peer 1 Peer 6 Fixed Rate/ Strike 1.49% 2.14% 2.15% Peer 10 (3) Peer 7 Peer 12 deferred G/L Peer 4 Inclusive of 1.76% 2.18% 2.4% 16 Peer 9 (1) RF (4) (5)


Interest rate exposure of future business and long-term rates Fixed / float loan mix(1) • The majority of Regions’ residual NII exposure to interest rates 100% comes from future business activities and cash-flow reinvestment; 90% full-year 2020 estimate: 80% 70% * ~$10.5B fixed-rate loan production 60% Peer median = 47% * ~$4.5B fixed-rate securities reinvestment 50% 40% • Balance sheet mix is a reasonable proxy for long-end rate sensitivity 30% 20% * Exposure to fixed-rate assets in-line with peers (~49% fixed 10% 0 1 2 3 1 2 3 4 5 6 7 8 9 excluding hedges) 0% F 1 1 1 1 R r r r r r r r r r r r r r e e e e e e e e e e e e e e e e e e e e e e e e e e P P P P P P P P P P P P P % Fixed % Variable • Within the securities portfolio, reinvestment and premium Securities portfolio composition(2) amortization contribute to a portion of Regions’ NII exposure to interest rates Corporate Bonds: 5.0% Agency/UST: 1.0% • Portfolio constructed to protect against lower market rates Non-Agency CMBS: * 29% of securities portfolio in bullet-like collateral (CMBS, 2.0% corporate bonds, and USTs) Agency CMBS: * Purchase MBS with loan characteristics that offer prepayment 22.0% protection: lower loan balances, seasoning, and state-specific geographic concentrations $28.2B ▪ Grew the securities portfolio by approximately $3B during 3Q in order to deploy elevated cash balances and optimize NII/NIM Agency MBS: ▪ During the quarter, the portfolio received make-whole and 70.0% prepayment penalties from corporate bond and Agency CMBS (NII ~$4M) 17 (1) 6/30/2020 data latest available; Source: SEC reporting, Call Report data for loan repricing within 1 year; Peers include CFG, CMA, FHN, FITB, HBAN, HWC, KEY, MTB, PNC, SNV, USB, ZION, and TFC. (2) Includes AFS, the unrealized AFS gain, and HTM securities as of 9/30/2020.


CET1 Waterfall 0.7% 9.3% 8.9% (0.1)% (0.1)% (0.1)% Pre-tax pre- Common Provision 2Q20 CET1% Tax & Other 3Q20 CET1%(3) provision Dividend expense(2) income(1) (1) Non-GAAP; see appendix for reconciliation. 18 (2) Provision expense includes the impact of CECL deferral. (3) Current quarter ratios are estimated.


COVID-19 high-risk industry sectors waterfall ($ in billions) QoQ highlights • COVID high-risk industries are continuously refined to those exhibiting higher levels of stress due $8.43 $0.03 to COVID impact $6.58 • Several sub-sectors were removed $(1.17) including but not limited to: $(0.71) ◦ Grocery Anchored REITs within CRE Unsecured Retail ◦ Freight Transportation 6/30/2020 Sector Sub-Sector 9/30/2020 Other ◦ C&I Retail (non-essential) High-Risk Additions Deletions High-Risk Activity(1) Balances Balances ◦ Personal Care services in C&I Other Consumer Services (1) Other activity includes payments, charge-offs, new loans, moves to held for sale and NAICs changes. 19


Allowance for credit losses waterfall ($ in millions) QoQ highlights • Q3 ending allowance was essentially flat $2,425 $135 $2,425 to 2Q as economic and credit performance was generally in line with expectations $(113) $(22) • Net charge-offs incurred during the quarter were offset by increased risk in certain portfolios, specifically industries designated as high risk as well as certain small business portfolios Net Charge- Economic Portfolio Risk 6/30/2020 9/30/2020 Offs Outlook & Balances 20


Base R&S Economic Outlook (as of September 18, 2020) Pre-R&S period 3Q2020 4Q2020 1Q2021 2Q2021 3Q2021 4Q2021 1Q2022 2Q2022 3Q2022 Real GDP, annualized % change 25.2% 8.5% 1.4% 1.9% 2.1% 2.1% 2.3% 2.3% 1.9% Unemployment rate 9.0% 8.4% 8.1% 7.7% 7.4% 7.0% 6.8% 6.6% 6.4% HPI, year-over-year % change 5.0% 4.7% 3.9% 3.3% 2.6% 2.5% 2.6% 2.6% 2.5% S&P 500 3,345 3,395 3,407 3,421 3,436 3,453 3,467 3,483 3,497 • Economic forecasts represents Regions’ internal outlook for the economy over the reasonable & supportable forecast period. • Given uncertainty in the path of the economic recovery, management developed alternative analytics to support qualitative additions to our modeled results. 21


Allowance Allocation As of 9/30/20 As of 6/30/20 (in millions) Loan Balance ACL ACL/Loans Loan Balance ACL ACL/Loans C&I $45,199 $1,119 2.48% $47,670 $1,109 2.33% CRE-OO Mortgage 5,451 247 4.53% 5,491 249 4.53% CRE-OO Construction 305 22 7.16% 314 20 6.25% Total Commercial $50,955 $1,388 2.72% $53,475 $1,378 2.58% IRE Mortgage 5,598 165 2.94% 5,221 132 2.53% IRE Construction 1,984 30 1.53% 1,908 55 2.89% Total IRE $7,582 $195 2.57% $7,129 $187 2.62% Residential First Mortgage 16,195 153 0.94% 15,382 151 0.98% Home Equity Lines 4,753 131 2.75% 4,953 146 2.95% Home Equity Loans 2,839 38 1.34% 2,937 42 1.43% Indirect- Vehicles 1,120 26 2.38% 1,331 34 2.58% Indirect- Other Consumer 2,663 258 9.70% 3,022 278 9.19% Consumer Credit Card 1,189 162 13.59% 1,213 143 11.74% Other Consumer 1,063 74 6.95% 1,106 66 5.97% Total Consumer $29,822 $842 2.82% $29,944 $860 2.87% Total $88,359 $2,425 2.74% $90,548 $2,425 2.68% Government Guaranteed PPP Loans 4,594 — — 4,498 — — Total, Excluding PPP Loans(1) $83,765 $2,425 2.90% $86,050 $2,425 2.82% (1) Non-GAAP; see appendix for reconciliation. 22 Note - All PPP loans are included in C&I. Excluding PPP loans from that category would increase the ACL ratio for C&I loans to 2.76%.


Commercial & IRE loans As of 9/30/20 Total Outstanding ($ in millions) Commitments Balances % Utilization Administrative, Support, Waste & Repair $2,736 $1,739 64% • The outstanding balance for Agriculture 732 486 66% Real Estate within the Educational Services 3,972 3,052 77% Commercial section reflects Energy - Oil, Gas & Coal 4,088 1,878 46% $2,245M of Real Estate Financial Services 9,069 4,123 45% Services & Construction loans Government & Public Sector 3,588 2,954 82% as well as $5,360M of Healthcare 7,030 4,582 65% combined CRE-Unsecured Information 2,698 1,794 66% which includes REITs: Professional, Scientific & Technical Services 4,176 2,599 62% Real Estate 14,998 7,605 51% ◦ Hotel REITs total $676M Religious, Leisure, Personal & Non-Profit Services 2,966 2,219 75% in balances with $863M Restaurant, Accommodation & Lodging 2,791 2,426 87% in commitments Retail Trade 5,016 2,977 59% ◦ Retail REITs total Transportation & Warehousing 3,994 2,711 68% $1,406M in balances and Utilities 4,701 1,922 41% $2,979M in Wholesale 6,281 3,168 50% commitments Manufacturing 8,949 4,773 53% Other(1) 189 (53) N/A • Commitments to make Total Commercial $87,974 $50,955 58% commitments are not included Land $139 $101 73% • Utilization % presented Single-Family/Condo 1,610 745 46% incorporates all loan structures Hotel 333 289 87% in the portfolio; utilization on Industrial 1,223 1,052 86% Office 2,235 2,002 90% revolving line structures was Retail 812 764 94% ~41.1% at 9/30/2020 Multi-Family 3,312 1,887 57% Other(1) 940 752 80% Total Investor Real Estate $10,604 $7,582 72% 23 (1) Contains balances related to non-classifiable and invalid business industry codes offset by payments in process and fee accounts that are not available at the loan level.


Leveraged portfolio (outstanding balances as of September 30, 2020) Leveraged Balances by Industry Leverage Definition • Regions Leveraged Lending Definition - $5.7B in balances Professional • Commitments are $10M Services 18% • Leverage exceeds 3x senior debt; 4x total debt Information 14% • Includes investment & non-investment grade loans Healthcare 10% • Moody’s 2018 Regional Bank Survey Definition(1) - $3.1B in 16% 18% Manufacturing 10% outstanding balances Wholesale 9% 7% • Regions’ leveraged lending exposure just below the peer (1) Religious, Leisure, average 14% 8% $5.7B Personal & Non- Profit Services 8% Important Factors 8% Restaurant, • 10% Accommodation & Lodging 8% 9% 10% • Not a strategic growth objective; used to support client Financial Services relationships 7% • Sponsor-owned clients as a percentage of total portfolio Other 16% continue to decline (Portfolios <7% of total) • Enhanced centralized underwriting, servicing, and credit adjudication • Very limited participation in the highest risk segments of leveraged loans - Covenant Lite & Term Loan B • Approximately 79% of leveraged loans outstanding are also SNCs 24 (1) As measured against TCE. Moody’s Investor Services – “Regional banks’ leveraged loan exposures are modest but growing”


SNC portfolio (outstanding balances as of September 30, 2020) Shared National Credit Balances by Industry 10% • Portfolio Characteristics 8% • Diverse industry mix 8% $19.4B • 30% of balances are investment grade 55% 7% • 23% of balances are leveraged 6% 6% • 25% of balances are sponsor-backed • 8% of SNC balances are criticized Financial Services 10% Retail 8% Energy 8% Manufacturing 7% Information 6% Wholesale 6% Other 55% (Portfolios <6% of total) 25


Energy lending As of 9/30/20 Total Outstanding ($ in millions) # of Clients (1) Commitments Balances % Utilization $ Criticized % Criticized Oilfield services and supply (OFS)(2) 154 $484 $312 64% $114 37% Exploration and production (E&P)(2) 104 1,421 835 59% 381 46% Midstream 23 1,562 592 38% 135 23% Downstream 12 317 46 15% - 0% Other(3) 12 290 79 27% 33 42% PPP Loans 132 14 14 100% - 0% Total direct 437 $4,088 $1,878 46% $663 35% • Leader in the Energy lending business for over 50 years • No second lien exposure • Growth in Energy commitments and outstandings were • Midstream sector continues to benefit from protective essentially flat for FY19 and FY20 contracts for gathering, transporting and storing • $128.0M in charge-offs for YTD 2020, of which over 80% is hydrocarbons, although volumes are declining. Overall associated with loans originated prior to 2016 and were the midstream portfolio continues to perform well unable to restructure after the 2015/2016 downturn through the downturn. • 8.7% allocated reserve for COVID-19 high-risk energy loans(2) • Hedge positions are adequate for oil producers and strong (ex-PPP); 8.5% allocated reserve for total direct (ex-PPP) for natural gas producers. Average oil hedge position of 69% and 49% of proved developed producing reserves • No Leveraged loans within the direct energy related balances (PDP) for 2020 and 2021, respectively with natural gas • Utilization rate has remained between 40-60% since 1Q15 hedged at 61% and 76% of PDP for the same periods.  • Direct energy loans that are on non-accrual status are 7% of • Includes $1.15 billion in COVID-19 high-risk industry energy loans at 9/30/20 sectors for September 30, 2020. 26 (1) Represents the number of clients with loan balances outstanding. (2) OFS and E&P are designated as COVID-19 high-risk portfolios. (3) Other category is primarily related to Bituminous Coal Mining.


Energy lending (continued) Balances by Category Gross Losses $1,500 $140 $128.0 $120 $1,200 $100 ) s ) n $900 s n o $80 $75.1 i o l i l l i l i M M ( $600 ( $60 $ $ $40 $36.7 $28.5 $32.9 $300 $20 $6.0 $0.0 $0 $0 P es m m er ns 4 5 6 7 8 9 0 E& ic a a th a 01 01 01 01 01 01 02 rv tre tre O Lo 2 2 2 2 2 2 2 Se s s P TD d id wn P Y el M o P lfi D Oi E&P Oilfield Services 1Q2015 3Q2020 Midstream Downstream Other* 27 *Other Losses include losses to MLP funds as well as losses related to coal.


Restaurant lending As of 9/30/20 % of Total Outstanding Outstanding ($ in millions) # of Clients* Commitments Balances % Utilization $ Criticized Criticized Quick Service 17,821 $1,554 $1,278 82% $166 13% Casual Dining 30 500 447 89% 244 55% Other 22 150 121 81% 44 36% PPP Loans 2,649 407 407 100% — 0% Total Restaurants 20,522 $2,611 $2,253 86% $454 20% • Team of bankers in place with specialization in this • Charge-offs were $21 million in 2019 and are $32.7 industry million YTD 2020 • Greater risk focus on quality of sponsor • Quarantines, social distancing, and reduced business • $730M balances of full-service reflect COVID-19 high-risk travel will result in lost demand, much of which may not loans; 8.9% allocated reserve (ex-PPP); 6.7% allocated be recoverable reserve to total restaurant balances (ex-PPP) • Casual dining is the sector under the most stress • Prior to the pandemic, Regions had strategically exited • Quick service restaurants focus on fast food service and some higher risk restaurant relationships at par; through limited menus. Same store sales have held up reasonably natural attrition and proactive risk management actions, well given the digital platform, drive thru and delivery we have reduced our exposure capabilities. • 20% of Restaurant Outstandings are leveraged $173 million of balances and $180 million of commitments relating primarily to Traveler Accommodations have been excluded from the Restaurant totals and are reflected in the Hotel related exposure. 28 *Represents the number of clients with loan balances outstanding.


Hotel lending As of 9/30/20 % of Total Outstanding Outstanding ($ in millions) # of Clients* Commitments Balances % Utilization $ Criticized Criticized CRE-Unsecured (REITs) 11 $863 $676 78% $0 0% IRE – Mortgage 17 253 237 94% 222 94% IRE – Construction 3 80 51 64% 51 100% Consumer Services 3,545 143 136 95% 7 5% PPP Loans 334 37 37 100% — 0% Total Hotel related 3,910 $1,376 $1,137 83% $280 25% • CRE – Unsecured outstanding balance is comprised of 11 REIT customers • 57% of total hotel related loans are SNCs • The REIT portfolio benefits from low leverage, strong liquidity, and diversity of property holdings. Companies have also taken proactive steps to reduce CAPEX, cut dividends, and reduce overhead to preserve cash. • Includes $0.97 billion in COVID-19 high-risk industry sectors for September 30, 2020. *Represents the number of clients with loan balances outstanding Consumer services represents amounts relating primarily to Traveler Accommodations that have been excluded from the Restaurant totals and are 29 reflected in the Hotel related exposure


Commercial retail lending  As of 9/30/20 Total Outstanding ($ in millions) # of Clients* Commitments Balances % Utilization $ Criticized % Criticized CRE-Unsecured (REITs) 28 $2,979 $1,406 47% $92 7% IRE 149 780 733 94% 182 25% C&I: 28,121 2,777 1,461 53% 42 3% Leveraged 16 390 225 58% — —% Not Leveraged 28,105 2,387 1,236 52% 42 3% CRE-OO 885 775 735 95% 26 4% ABL 22 1,127 444 39% 202 45% PPP Loans 4,742 337 337 100% 0 0% Total Retail (1) 33,947 $8,775 $5,116 58% $544 11% • Approximately $425 million of outstanding balances across the REIT • C&I retail portfolio is also widely distributed; largest categories and IRE portfolios relate to shopping malls and outlet centers, include: comprised of ~$211 million Class A and ~$214 million Class B/C. • Motor vehicle & parts dealers ~$330 million outstanding to • Portfolio exposure to REITs specializing in enclosed malls consists of ~2,200 clients a small number of credits. • Gasoline stations ~$300 million to ~2,000 clients • 34% of balances are Investment Grade with low leverage • Building materials, garden equipment & supplies ~$225 • IRE portfolio is widely distributed; largest tenants typically include million outstanding to ~1,100 clients 'basic needs' anchors. However, almost all IRE Retail downgraded to • Non-store retailers ~$120 million outstanding to ~1,000 Criticized in May due to low rent collections and concerns over clients tenant viability longer term. With reopening of many parts of the economy, rent collections have surprised to the upside, and 75% of • CRE-OO portfolio consists primarily of small strip malls and the Retail IRE portfolio has moved back to Pass. convenience stores and is largely term loans where a higher utilization rate is expected • ABL portfolio is collateralized primarily by inventory and accounts receivable • Includes $1.65 billion in COVID-19 high-risk industry sectors for September 30, 2020. Securities portfolio includes ~$503 million (net of defeased loans) of post-financial crisis issued AAA rated CMBS with exposure to retail within the 30 diversified collateral pool; protected with 51% credit enhancement (defease adjusted), and losses expected to be de minimis in severely adverse scenario; portfolio also includes ~$86 million in retail related high quality, investment grade corporate bonds (1) Does not include $2 million of retail related held for sale and operating leases. *Represents the number of clients with loan balances outstanding.


Religious, Leisure, Personal & Non-Profit Services Lending As of 9/30/20 # of Total Outstanding % ($ in millions) Clients* Commitments Balances Utilization $ Criticized % Criticized Amusement, Gambling & Recreation 1,305 $581 $479 82% $102 21% Religious Organizations 4,718 447 303 68% 21 7% Arts, Entertainment & Recreation 898 264 161 61% 27 17% Death Care Services 279 272 167 61% 0 0% Business, Professional, Labor, Political & Similar53 586 189 142 75% 1 1% Organizations Community Housing Services 930 168 139 83% 8 6% Social Assistance 721 142 70 49% 12 17% Personal Care Services 3,783 122 104 85% 5 5% Other 2,774 442 315 71% 16 5% PPP Loans 6,665 339 339 100% 0 0% Total Religious, Leisure, Personal, & Non-Profit 22,659 $2,966 $2,219 75% $192 9% • 22% of balances are leveraged • 25% of balances are SNCs • 8% of balances are investment grade • Includes $0.94 billion in COVID-19 high-risk industry sectors for September 30, 2020. 31 *Represents the number of clients with loan balances outstanding


Healthcare Lending As of 9/30/20 # of Total Outstanding % ($ in millions) Clients* Commitments Balances Utilization $ Criticized % Criticized Facilities 2,434 $2,228 $1,296 58% $21 2% Patient Based Providers 12,618 2,007 1,517 76% 81 5% Goods & Services 1,351 2,097 1,071 51% 22 2% REITs — 3 0 —% 0 0% IRE 97 841 669 80% 1 0% PPP 5,345 698 698 100% 0 0% Total Healthcare 21,845 7,874 5,251 67% $125 2% • 11% of balances are leveraged • 20% of balances are SNCs • 21% of balances are investment grade • Includes $1.11 billion in COVID-19 high-risk industry sectors for September 30, 2020. 32 *Represents the number of clients with loan balances outstanding


Loans to Small Business and Small Farms (outstanding balances as of September 30, 2020) Healthcare 16% Balances by Industry Balances by State Real Estate 12% Professional, Scientific & Technical Services 9% Florida 29% 16% Transportation & 21% Alabama 10% Warehousing 9% 29% 37% Retail Trade 9% Tennessee 10% 12% 8% $8.5B Manufacturing $8.5B Georgia 7% 8% 8% 9% Texas 7% 11% 8% 9% Restaurant, 9% Accommodation 7% Other 37% & Lodging 8% 7% 10% (States <6% of total) Administrative, Support, Waste & Repair 8% Other 21% (Portfolios <8% of total) Portfolio Characteristics • Loans to Small Businesses are loans with original amounts of $1 million or less while Loans to Small Farms are loans with original amounts of $500 thousand or less • Includes $2.9 billion of the $5.4 billion SBA loans (including PPP) 33 Loans to Small Business and Small Farms are defined consistent with the RC-C, Part II Call Report Instructions Does not include $2 million of HFS


SBA loans (outstanding balances as of September 30, 2020) Balances by Industry Balances by State Healthcare 14% Manufacturing 13% Florida 29% Real Estate 12% 14% 26% Alabama 14% 24% Professional, 29% Scientific 11% Tennessee 12% 13% Restaurant, 8% $5.4B Accommodation $5.4B Georgia 10% & Lodging 10% 12% 9% 8% Texas 9% Retail Trade 8% 10% 11% 14% 10% Other 26% Religious, 12% (States <9% of Leisure 8% total) Other 24% (Portfolios <8% of total) Portfolio Characteristics • 85% are PPP Loans, 10% are 7(a) Program Loans; 4% are 504 Program Loans • $2.9 billion fall into the Loans to Small Business and Small Farms • 96% are wholly or partially guaranteed by the US Government The 7(a) Program loans can be used to buy a business or obtain working capital. The 504 Program loans provide commercial real estate financing 34 for owner-occupied properties. Loans to Small Business and Small Farms are defined consistent with the RC-C, Part II Call Report Instructions Does not include $2 million of HFS


Consumer lending portfolio statistics Consumer Third Party Residential Mortgage Lending Consumer Credit Card • Avg. origination FICO 751 • Avg. origination FICO 754 • Avg. origination FICO 766 • Current LTV 60% • Avg. new line $28,875 • Avg. new line $4,318 • 96% owner occupied • 42% home improvement loans • 3Q20 Yield 12.62% Home Equity • 3Q20 Yield 8.06% • 3Q20 QTD NCO 3.73% • 3Q20 QTD NCO 2.23% • Avg. origination FICO 757 • Current LTV 44% Consumer FICO Scores(1) • Only $102M of resets through 2021 3% 4% 3% • 68% of portfolio is 1st lien Not Available • Avg. loan size $38,744 63% Above 720 78% 75% 681-720 Other Consumer 620-680 Unsecured 16% Below 620 11% 9% 11% • Avg. origination FICO 737 6% 7% 4% 6% 5% • Avg. new loan $9,799 Cons R/E secured Cons non-R/E secured Total consumer (1) Refreshed FICO scores as of 9/30/2020. 35


LIBOR transition Four pillars of execution • Regions completed a comprehensive LIBOR Impact Assessment in 1H 2019 • Regions has established an Executive Steering Committee to guide program decisions and transition strategy. • Regions has begun enterprise-wide efforts to transition to alternative rates consistent with industry timelines. Core Products & Financial Strategy & Contracts Communications Integration Forecasting How do we adjust existing How do we forecast for the How will we treat existing When and how do we platforms and prepare to transition and measure its contracts and incorporate communicate effectively to offer a new rate(s)? impact over time? industry fallback language? all stakeholders? Cross functional team Cross functional team Cross functional team Cross functional team Corporate Banking Group Strategic Planning Corporate Banking Group Corporate Banking Group Consumer Banking Group Treasury Consumer Banking Group Consumer Banking Group Private Wealth Mgt. Accounting Private Wealth Mgt. Private Wealth Mgt. Capital Markets Finance Capital Markets Capital Markets Ops & Tech Capital Markets Risk Testing Organization Marketing Finance Corporate Banking Group Legal Investor Relations Risk Consumer Banking Group Ops & Tech Learning & Development Ops & Tech Legal Topics Risk Topics Corporate Communications Loan origination process Tech solutions to search & System updates Topics catalog LIBOR Contracts Topics Derivative systems Financial forecasting Regions360 approach Client education Business deposits Loan pricing (clients w/ multiple Associate training New swap arrangements Financial objectives products) External communication Corporate hedging Update fallback language Disclosures 36


Non-GAAP information Management uses pre-tax pre-provision income (non-GAAP) and adjusted pre-tax pre-provision income (non-GAAP), as well as the adjusted efficiency ratio (non-GAAP) and the adjusted fee income ratio (non-GAAP) to monitor performance and believes these measures provide meaningful information to investors. Non-interest expense (GAAP) is presented excluding certain adjustments to arrive at adjusted non-interest expense (non-GAAP), which is the numerator for the efficiency ratio. Non-interest income (GAAP) is presented excluding certain adjustments to arrive at adjusted non-interest income (non-GAAP), which is the numerator for the fee income ratio. Adjusted non-interest income (non-GAAP) and adjusted non-interest expense (non- GAAP) are used to determine adjusted pre-tax pre-provision income (non-GAAP). Net interest income (GAAP) on a taxable-equivalent basis and non-interest income are added together to arrive at total revenue on a taxable-equivalent basis. Adjustments are made to arrive at adjusted total revenue on a taxable-equivalent basis (non-GAAP), which is the denominator for the fee income and efficiency ratios. Regions believes that the exclusion of these adjustments provides a meaningful base for period-to-period comparisons, which management believes will assist investors in analyzing the operating results of the Company and predicting future performance. These non-GAAP financial measures are also used by management to assess the performance of Regions’ business. It is possible that the activities related to the adjustments may recur; however, management does not consider the activities related to the adjustments to be indications of ongoing operations. Regions believes that presentation of these non-GAAP financial measures will permit investors to assess the performance of the Company on the same basis as that applied by management. The allowance for credit losses (ACL) as a percentage of total loans is an important ratio, especially during periods of economic stress. Management believes this ratio provides investors with meaningful additional information about credit loss allowance levels when the SBA's Paycheck Protection Program loans, which are fully backed by the U.S. government, are excluded from total loans which is the denominator used in the ACL ratio. This adjusted ACL ratio represents a non-GAAP financial measure. Tangible common stockholders’ equity ratios have become a focus of some investors and management believes they may assist investors in analyzing the capital position of the Company absent the effects of intangible assets and preferred stock. Analysts and banking regulators have assessed Regions’ capital adequacy using the tangible common stockholders’ equity measure. Because tangible common stockholders’ equity is not formally defined by GAAP or prescribed in any amount by federal banking regulations it is currently considered to be a non- GAAP financial measure and other entities may calculate it differently than Regions’ disclosed calculations. Since analysts and banking regulators may assess Regions’ capital adequacy using tangible common stockholders’ equity, management believes that it is useful to provide investors the ability to assess Regions’ capital adequacy on this same basis. Non-GAAP financial measures have inherent limitations, are not required to be uniformly applied and are not audited. Although these non-GAAP financial measures are frequently used by stakeholders in the evaluation of a company, they have limitations as analytical tools, and should not be considered in isolation, or as a substitute for analyses of results as reported under GAAP. In particular, a measure of earnings that excludes selected items does not represent the amount that effectively accrues directly to stockholders. Management and the Board of Directors utilize non-GAAP measures as follows: • Preparation of Regions' operating budgets • Monthly financial performance reporting • Monthly close-out reporting of consolidated results (management only) • Presentation to investors of company performance 37


Non-GAAP and additional selected items impacting earnings Quarter Ended (amounts in millions, except per share data) 9/30/2020 6/30/2020 9/30/2019 Selected items impacting earnings: Pre-tax adjusted items(1): Branch consolidation, property and equipment charges $ (3) $ (10) $ (5) Loss on early extinguishment of debt (2) (6) — Salaries and benefits related to severance charges (2) (2) (1) Professional and related fees associated with the purchase of Ascentium Capital — (8) — Valuation gain on equity investment 44 — — Securities gains (losses), net 3 1 — Leveraged lease termination gains — — 1 Total pre-tax adjusted items(1) $ 40 $ (25) $ (5) Diluted EPS impact* $ 0.03 $ (0.02) $ — Pre-tax additional selected items**: CECL provision in excess of net charge-offs*** $ — $ (700) $ — Capital markets income - CVA/DVA 5 34 (6) MSR net hedge performance — 2 15 PPP loans interest income**** 35 16 — COVID-19 related expenses (3) (19) — Total pre-tax additional selected items** $ 37 $ (667) $ 9 (1) Non-GAAP; refer to appendix for reconciliation * Based on income taxes at an approximate 25% incremental rate. Tax rates associated with leveraged lease terminations are incrementally higher based on their structure. 38 ** Items represent an outsized impact to the quarter or quarterly trends, but are not considered non-GAAP adjustments. ***CECL was adopted 1/1/2020. Periods prior to January 1, 2020 reflect results under the incurred loss model. **** 2nd quarter PPP loans interest income has been revised to remove estimated funding costs.


Non-GAAP reconciliation: adjusted average loans Average Balances ($ amounts in millions) 3Q20 2Q20 1Q20 4Q19 3Q19 3Q20 vs. 2Q20 3Q20 vs. 3Q19 Commercial and industrial $ 46,405 $ 49,296 $ 40,519 $ 39,743 $ 40,200 $ (2,891) (5.9)% $ 6,205 15.4 % Less: SBA PPP Loans 4,558 3,213 — — — 1,345 41.9 % 4,558 NM Adjusted commercial and industrial loans (non-GAAP) $ 41,847 $ 46,083 $ 40,519 $ 39,743 $ 40,200 $ (4,236) (9.2)% $ 1,647 4.1 % Total commercial loans $ 52,221 $ 55,100 $ 46,351 $ 45,589 $ 46,071 $ (2,879) (5.2)% $ 6,150 13.3 % Less: SBA PPP Loans 4,558 3,213 — — — 1,345 41.9 % 4,558 NM Adjusted total commercial loans (non-GAAP) $ 47,663 $ 51,887 $ 46,351 $ 45,589 $ 46,071 $ (4,224) (8.1)% $ 1,592 3.5 % Total business loans $ 59,519 $ 62,119 $ 52,999 $ 51,974 $ 52,459 $ (2,600) (4.2)% $ 7,060 13.5 % Less: SBA PPP Loans 4,558 3,213 — — — 1,345 41.9 % 4,558 NM Adjusted total business loans (non-GAAP) $ 54,961 $ 58,906 $ 52,999 $ 51,974 $ 52,459 $ (3,945) (6.7)% $ 2,502 4.8 % Total consumer loans $ 29,851 $ 29,845 $ 30,250 $ 30,418 $ 30,527 $ 6 — % $ (676) (2.2)% Less: Indirect-other consumer exit portfolio 1,318 1,493 1,696 1,841 1,906 (175) (11.7)% (588) (30.8)% Less: Indirect—vehicles 1,223 1,441 1,679 1,948 2,247 (218) (15.1)% (1,024) (45.6)% Adjusted total consumer loans (non-GAAP) $ 27,310 $ 26,911 $ 26,875 $ 26,629 $ 26,374 $ 399 1.5 % $ 936 3.5 % Total loans $ 89,370 $ 91,964 $ 83,249 $ 82,392 $ 82,986 $ (2,594) (2.8)% $ 6,384 7.7 % Less: SBA PPP Loans 4,558 3,213 — — — 1,345 41.9 % 4,558 NM Less: Indirect-other consumer exit portfolio 1,318 1,493 1,696 1,841 1,906 (175) (11.7)% (588) (30.8)% Less: Indirect—vehicles 1,223 1,441 1,679 1,948 2,247 (218) (15.1)% (1,024) (45.6)% Adjusted total loans (non-GAAP) $ 82,271 $ 85,817 $ 79,874 $ 78,603 $ 78,833 $ (3,546) (4.1)% $ 3,438 4.4 % 39


Non-GAAP reconciliation: NII, non-interest income/expense, operating leverage and efficiency ratio Quarter Ended ($ amounts in millions) 9/30/2020 6/30/2020 3/31/2020 12/31/2019 9/30/2019 3Q20 vs. 2Q20 3Q20 vs. 3Q19 Non-interest expense (GAAP) A $ 896 $ 924 $ 836 $ 897 $ 871 $ (28) (3.0)% $ 25 2.9 % Adjustments: Branch consolidation, property and equipment charges (3) (10) (11) (12) (5) 7 70.0 % 2 40.0 % Salary and employee benefits—severance charges (2) (2) (1) — (1) — — % (1) 100.0 % Loss on early extinguishment of debt (2) (6) — (16) — 4 (66.7) (2) NM Professional, legal and regulatory expenses — (7) — — — 7 100.0 — NM Acquisition expenses — (1) — — — 1 100.0 — NM Adjusted non-interest expense (non-GAAP) B $ 889 $ 898 $ 824 $ 869 $ 865 $ (9) (1.0)% $ 24 2.8 % Net interest income (GAAP) C $ 988 $ 972 $ 928 $ 918 $ 937 $ 16 1.6 % $ 51 5.4 % Taxable-equivalent adjustment 12 13 12 13 13 (1) (7.7)% (1) (7.7)% Net interest income, taxable-equivalent basis D $ 1,000 $ 985 $ 940 $ 931 $ 950 $ 15 1.5 % $ 50 5.3 % Non-interest income (GAAP) E 655 573 485 562 558 82 14.3 97 17.4 Adjustments: Securities (gains) losses, net (3) (1) — 2 — (2) 200.0 % (3) NM Valuation gain on equity investment (44) — — — — (44) NM (44) NM Leveraged lease termination gains — — (2) — (1) — NM 1 (100.0)% Adjusted non-interest income (non-GAAP) F $ 608 $ 572 $ 483 $ 564 $ 557 $ 36 6.3 % $ 51 9.2 % Total revenue C+E=G $ 1,643 $ 1,545 $ 1,413 $ 1,480 $ 1,495 $ 98 6.3 % $ 148 9.9 % Adjusted total revenue (non-GAAP) C+F=H $ 1,596 $ 1,544 $ 1,411 $ 1,482 $ 1,494 $ 52 3.4 % $ 102 6.8 % Total revenue, taxable-equivalent basis D+E=I $ 1,655 $ 1,558 $ 1,425 $ 1,493 $ 1,508 $ 97 6.2 % $ 147 9.7 % Adjusted total revenue, taxable-equivalent basis (non-GAAP) D+F=J $ 1,608 $ 1,557 $ 1,423 $ 1,495 $ 1,507 $ 51 3.3 % $ 101 6.7 % Operating leverage ratio (GAAP) I-A 6.9 % Adjusted operating leverage ratio (non-GAAP) J-B 4.0 % Efficiency ratio (GAAP) A/I 54.1% 59.4% 58.6% 60.1% 57.7% Adjusted efficiency ratio (non-GAAP) B/J 55.3% 57.7% 57.9% 58.1% 57.4% Fee income ratio (GAAP) E/I 39.6% 36.8% 34.0% 37.6% 37.0% Adjusted fee income ratio (non-GAAP) F/J 37.8% 36.8% 34.0% 37.7% 37.0% NM - Not Meaningful 40


Non-GAAP reconciliation: non-interest expense Year Ended December 31 2019 2018 2017 2016 (Dollars in millions) ADJUSTED NON-INTEREST EXPENSE Non-interest expense (GAAP) $ 3,489 $ 3,570 $ 3,491 $ 3,483 Adjustments: Contribution to Regions Financial Corporation foundation — (60) (40) — Professional, legal and regulatory expenses — — — (3) Branch consolidation, property and equipment charges (25) (11) (22) (58) Expenses associated with residential mortgage loan sale — (4) — — Loss on early extinguishment of debt (16) — — (14) Salary and employee benefits—severance charges (5) (61) (10) (21) Adjusted non-interest expense (non-GAAP) $ 3,443 $ 3,434 $ 3,419 $ 3,387 41


Non-GAAP reconciliation: Pre- tax pre-provision income (PPI) Quarter Ended ($ amounts in millions) 9/30/2020 6/30/2020 3/31/2020 12/31/2019 9/30/2019 3Q20 vs. 2Q20 3Q20 vs. 3Q19 Net income (loss) available to common shareholders (GAAP) $ 501 $ (237) $ 139 $ 366 $ 385 $ 738 311.4 % $116 30.1 % Preferred dividends (GAAP) 29 23 23 23 24 6 26.1 % 5 20.8 % Income tax expense (benefit) (GAAP) 104 (47) 42 98 107 151 321.3 % (3) (2.8)% Income (loss) before income taxes (GAAP) 634 (261) 204 487 516 895 342.9 % 118 22.9 % Provision for credit losses (GAAP) (1) 113 882 373 96 108 (769) (87.2)% 5 4.6 % Pre-tax pre-provision income (non-GAAP) 747 621 577 583 624 126 20.3 % 123 19.7 % Other adjustments: Securities (gains) losses, net (3) (1) — 2 — (2) 200.0 % (3) NM Valuation gain on equity investment (44) — — — — (44) NM (44) NM Leveraged lease termination gains — — (2) — (1) — NM 1 100.0 % Salaries and employee benefits—severance charges 2 2 1 — 1 — — % 1 100.0 % Branch consolidation, property and equipment charges 3 10 11 12 5 (7) (70.0)% (2) (40.0)% Loss on early extinguishment of debt 2 6 — 16 — (4) (66.7)% 2 NM Professional, legal and regulatory expenses — 7 — — — (7) (100.0)% — NM Acquisition expenses — 1 — — — (1) (100.0)% — NM Total other adjustments (40) 25 10 30 5 (65) (260.0)% (45) NM Adjusted pre-tax pre-provision income (non-GAAP) $ 707 $ 646 $ 587 $ 613 $ 629 $ 61 9.4 % $ 78 12.4 % (1) Upon adoption of CECL on January 1, 2020, the provision for credit losses is the sum of the provision for loan losses and the 42 provision for unfunded credit commitments. Prior to the adoption, the provision for unfunded commitments was included in other non-interest expense. NM - Not Meaningful


Forward-looking statements Forward-Looking Statements This release may include forward-looking statements as defined in the Private Securities Litigation Reform Act of 1995. Any statement that does not describe historical or current facts is a forward-looking statement. Forward-looking statements are not based on historical information, but rather are related to future operations, strategies, financial results or other developments. Forward-looking statements are based on management’s current expectations as well as certain assumptions and estimates made by, and information available to, management at the time the statements are made. Those statements are based on general assumptions and are subject to various risks, and because they also relate to the future they are likewise subject to inherent uncertainties and other factors that may cause actual results to differ materially from the views, beliefs and projections expressed in such statements. Therefore, we caution you against relying on any of these forward-looking statements. These risks, uncertainties and other factors include, but are not limited to, those described below: • Current and future economic and market conditions in the United States generally or in the communities we serve (in particular the Southeastern United States), including the effects of possible declines in property values, increases in unemployment rates, financial market disruptions and potential reductions of economic growth, which may adversely affect our lending and other businesses and our financial results and conditions. • Possible changes in trade, monetary and fiscal policies of, and other activities undertaken by, governments, agencies, central banks and similar organizations, which could have a material adverse effect on our earnings. • Possible changes in market interest rates or capital markets could adversely affect our revenue and expense, the value of assets and obligations, and the availability and cost of capital and liquidity. • The impact of pandemics, including the ongoing COVID-19 pandemic, on our businesses and financial results and conditions.The duration and severity of the ongoing COVID-19 pandemic, which has disrupted the global economy, has and could continue to adversely affect our capital and liquidity position, impair the ability of borrowers to repay outstanding loans and increase our allowance for credit losses, impair collateral values, and result in lost revenue or additional expenses. The pandemic could also cause an outflow of deposits, result in goodwill impairment charges and the impairment of other financial and nonfinancial assets, and increase our cost of capital. • Any impairment of our goodwill or other intangibles, any repricing of assets, or any adjustment of valuation allowances on our deferred tax assets due to changes in law, adverse changes in the economic environment, declining operations of the reporting unit or other factors. • The effect of changes in tax laws, including the effect of any future interpretations of or amendments to Tax Reform, which may impact our earnings, capital ratios and our ability to return capital to shareholders. • Possible changes in the creditworthiness of customers and the possible impairment of the collectability of loans and leases, including operating leases. • Changes in the speed of loan prepayments, loan origination and sale volumes, charge-offs, loan loss provisions or actual loan losses where our allowance for loan losses may not be adequate to cover our eventual losses. • Possible acceleration of prepayments on mortgage-backed securities due to low interest rates, and the related acceleration of premium amortization on those securities. • Loss of customer checking and savings account deposits as customers pursue other, higher-yield investments, which could increase our funding costs. • Possible changes in consumer and business spending and saving habits and the related effect on our ability to increase assets and to attract deposits, which could adversely affect our net income. • Our ability to effectively compete with other traditional and non-traditional financial services companies, some of whom possess greater financial resources than we do or are subject to different regulatory standards than we are. • Our inability to develop and gain acceptance from current and prospective customers for new products and services and the enhancement of existing products and services to meet customers’ needs and respond to emerging technological trends in a timely manner could have a negative impact on our revenue. • Our inability to keep pace with technological changes could result in losing business to competitors. • Changes in laws and regulations affecting our businesses, including legislation and regulations relating to bank products and services, as well as changes in the enforcement and interpretation of such laws and regulations by applicable governmental and self-regulatory agencies, which could require us to change certain business practices, increase compliance risk, reduce our revenue, impose additional costs on us, or otherwise negatively affect our businesses. • Our capital actions, including dividend payments, common stock repurchases, or redemptions of preferred stock or other regulatory capital instruments, must not cause us to fall below minimum capital ratio requirements, with applicable buffers taken into account, and must comply with other requirements under law or imposed by our regulators, which may impact our ability to return capital to shareholders. 43


Forward-looking statements (continued) • Our ability to comply with stress testing and capital planning requirements (as part of the CCAR process or otherwise) may continue to require a significant investment of our managerial resources due to the importance of such tests and requirements. • Our ability to comply with applicable capital and liquidity requirements (including, among other things, the Basel III capital standards), including our ability to generate capital internally or raise capital on favorable terms, and if we fail to meet requirements, our financial condition and market perceptions of us could be negatively impacted. • The effects of any developments, changes or actions relating to any litigation or regulatory proceedings brought against us or any of our subsidiaries. • The costs, including possibly incurring fines, penalties, or other negative effects (including reputational harm) of any adverse judicial, administrative, or arbitral rulings or proceedings, regulatory enforcement actions, or other legal actions to which we or any of our subsidiaries are a party, and which may adversely affect our results. • Our ability to manage fluctuations in the value of assets and liabilities and off-balance sheet exposure so as to maintain sufficient capital and liquidity to support our business. • Our ability to execute on our strategic and operational plans, including our ability to fully realize the financial and non-financial benefits relating to our strategic initiatives. • The risks and uncertainties related to our acquisition or divestiture of businesses. • The success of our marketing efforts in attracting and retaining customers. • Our ability to recruit and retain talented and experienced personnel to assist in the development, management and operation of our products and services may be affected by changes in laws and regulations in effect from time to time. • Fraud or misconduct by our customers, employees or business partners. • Any inaccurate or incomplete information provided to us by our customers or counterparties. • Inability of our framework to manage risks associated with our business such as credit risk and operational risk, including third-party vendors and other service providers, which could, among other things, result in a breach of operating or security systems as a result of a cyber attack or similar act or failure to deliver our services effectively. • Dependence on key suppliers or vendors to obtain equipment and other supplies for our business on acceptable terms. • The inability of our internal controls and procedures to prevent, detect or mitigate any material errors or fraudulent acts. • The effects of geopolitical instability, including wars, conflicts and terrorist attacks and the potential impact, directly or indirectly, on our businesses. • The effects of man-made and natural disasters, including fires, floods, droughts, tornadoes, hurricanes, and environmental damage (specifically in the Southeastern United States), which may negatively affect our operations and/or our loan portfolios and increase our cost of conducting business. The severity and impact of future earthquakes, fires, hurricanes, tornadoes, droughts, floods and other weather-related events are difficult to predict and may be exacerbated by global climate change. • Changes in commodity market prices and conditions could adversely affect the cash flows of our borrowers operating in industries that are impacted by changes in commodity prices (including businesses indirectly impacted by commodities prices such as businesses that transport commodities or manufacture equipment used in the production of commodities), which could impair their ability to service any loans outstanding to them and/or reduce demand for loans in those industries. • Our ability to identify and address cyber-security risks such as data security breaches, malware, “denial of service” attacks, “hacking” and identity theft, including account take- overs, a failure of which could disrupt our business and result in the disclosure of and/or misuse or misappropriation of confidential or proprietary information, disruption or damage to our systems, increased costs, losses, or adverse effects to our reputation. • Our ability to achieve our expense management initiatives. • Market replacement of LIBOR and the related effect on our LIBOR-based financial products and contracts, including, but not limited to, derivative products, debt obligations, deposits, investments, and loans. • Possible downgrades in our credit ratings or outlook could, among other negative impacts, increase the costs of funding from capital markets. • The effects of a possible downgrade in the U.S. government’s sovereign credit rating or outlook, which could result in risks to us and general economic conditions that we are not able to predict. 44


Forward-looking statements (continued) • The effects of problems encountered by other financial institutions that adversely affect us or the banking industry generally could require us to change certain business practices, reduce our revenue, impose additional costs on us, or otherwise negatively affect our businesses. • The effects of the failure of any component of our business infrastructure provided by a third party could disrupt our businesses, result in the disclosure of and/or misuse of confidential information or proprietary information, increase our costs, negatively affect our reputation, and cause losses. • Our ability to receive dividends from our subsidiaries could affect our liquidity and ability to pay dividends to shareholders. • Changes in accounting policies or procedures as may be required by the FASB or other regulatory agencies could materially affect our financial statements and how we report those results, and expectations and preliminary analyses relating to how such changes will affect our financial results could prove incorrect. • Other risks identified from time to time in reports that we file with the SEC. • Fluctuations in the price of our common stock and inability to complete stock repurchases in the time frame and/or on the terms anticipated. • The effects of any damage to our reputation resulting from developments related to any of the items identified above. You should not place undue reliance on any forward-looking statements, which speak only as of the date made. Factors or events that could cause our actual results to differ may emerge from time to time, and it is not possible to predict all of them. We assume no obligation and do not intend to update or revise any forward-looking statements that are made from time to time, either as a result of future developments, new information or otherwise, except as may be required by law. The foregoing list of factors is not exhaustive. For discussion of these and other factors that may cause actual results to differ from expectations, look under the captions “Forward- Looking Statements” and “Risk Factors” of Regions’ Annual Report on Form 10-K for the year ended December 31, 2019 and the "Risk Factors" of Regions' Quarterly Report on Form 10-Q for the quarter ended June 30, 2020 as filed with the SEC. Further, statements about the potential effects of the COVID-19 pandemic on our businesses and financial results and conditions may constitute forward-looking statements and are subject to the risk that the actual effects may differ, possibly materially, from what is reflected in those forward-looking statements due to factors and future developments that are uncertain, unpredictable and in many cases beyond our control, including the scope and duration of the pandemic (including any second wave or resurgences), actions taken by governmental authorities in response to the pandemic, and the direct and indirect impact of the pandemic on our customers, third parties and us. The words “future,” “anticipates,” “assumes,” “intends,” “plans,” “seeks,” “believes,” “predicts,” “potential,” “objectives,” “estimates,” “expects,” “targets,” “projects,” “outlook,” “forecast,” “would,” “will,” “may,” “might,” “could,” “should,” “can,” and similar terms and expressions often signify forward-looking statements. You should not place undue reliance on any forward-looking statements, which speak only as of the date made. Factors or events that could cause our actual results to differ may emerge from time to time, and it is not possible to predict all of them. We assume no obligation and do not intend to update or revise any forward-looking statements that are made from time to time, either as a result of future developments, new information or otherwise, except as may be required by law. Regions’ Investor Relations contact is Dana Nolan at (205) 264-7040; Regions’ Media contact is Evelyn Mitchell at (205) 264-4551. 45


® 46