Exhibit 99.1
 | | | | | | | | | | | | | | |
| Media Contact: | | | | Investor Relations Contact: |
| Jeremy King | | | | Dana Nolan |
| (205) 264-4551 | | | | (205) 264-7040 |
Producing Results: Regions reports first quarter 2021 earnings of $614 million, earnings per share of $0.63
Delivers strong revenue and pre-tax pre-provision income(1) growth over the prior year
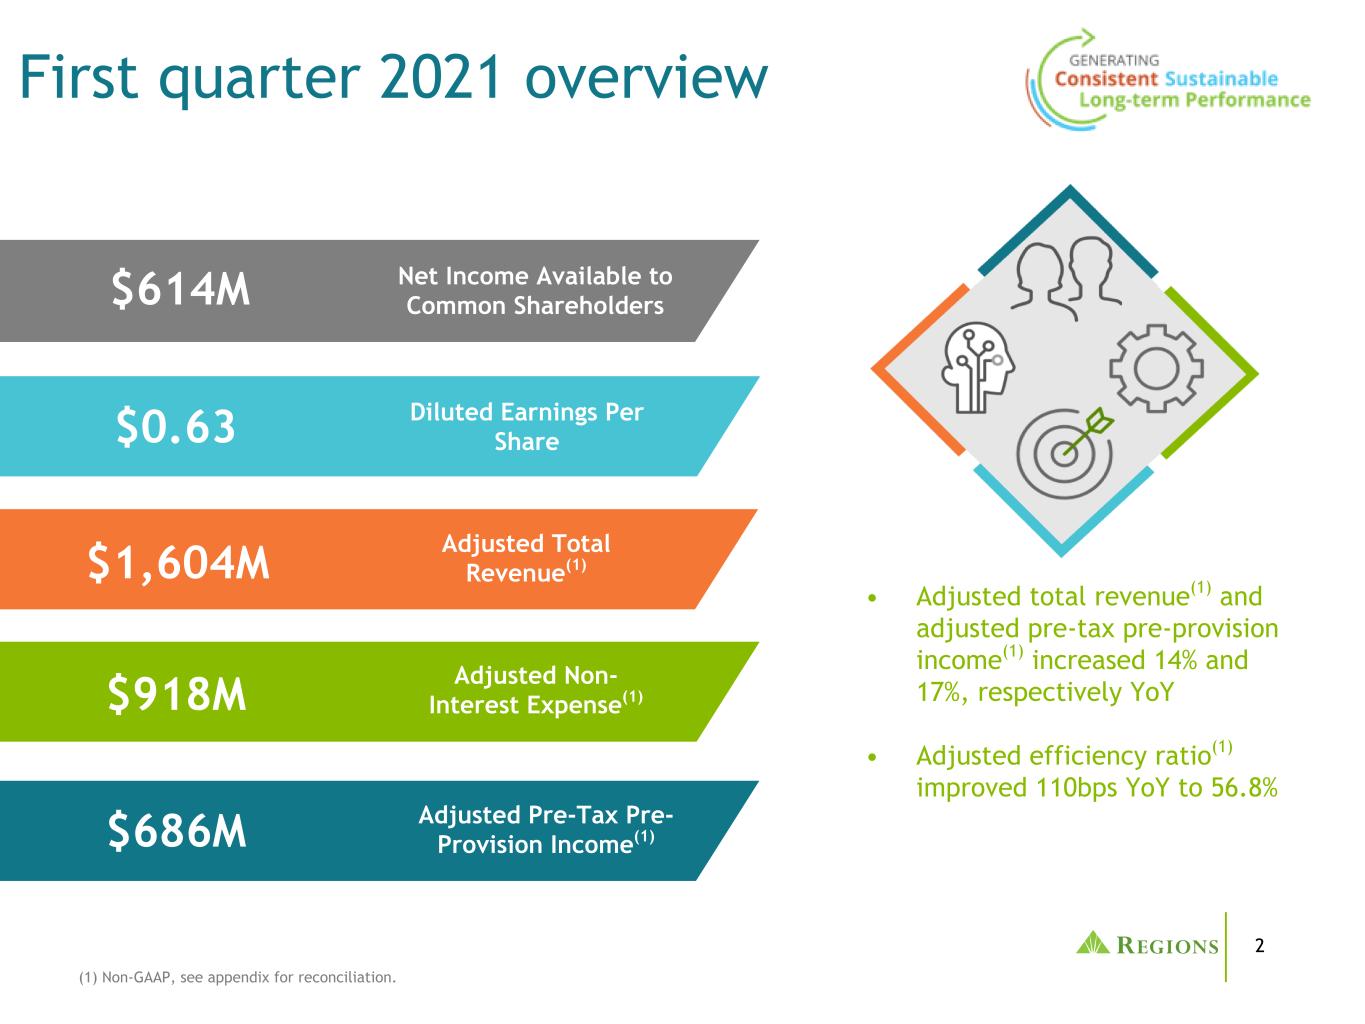
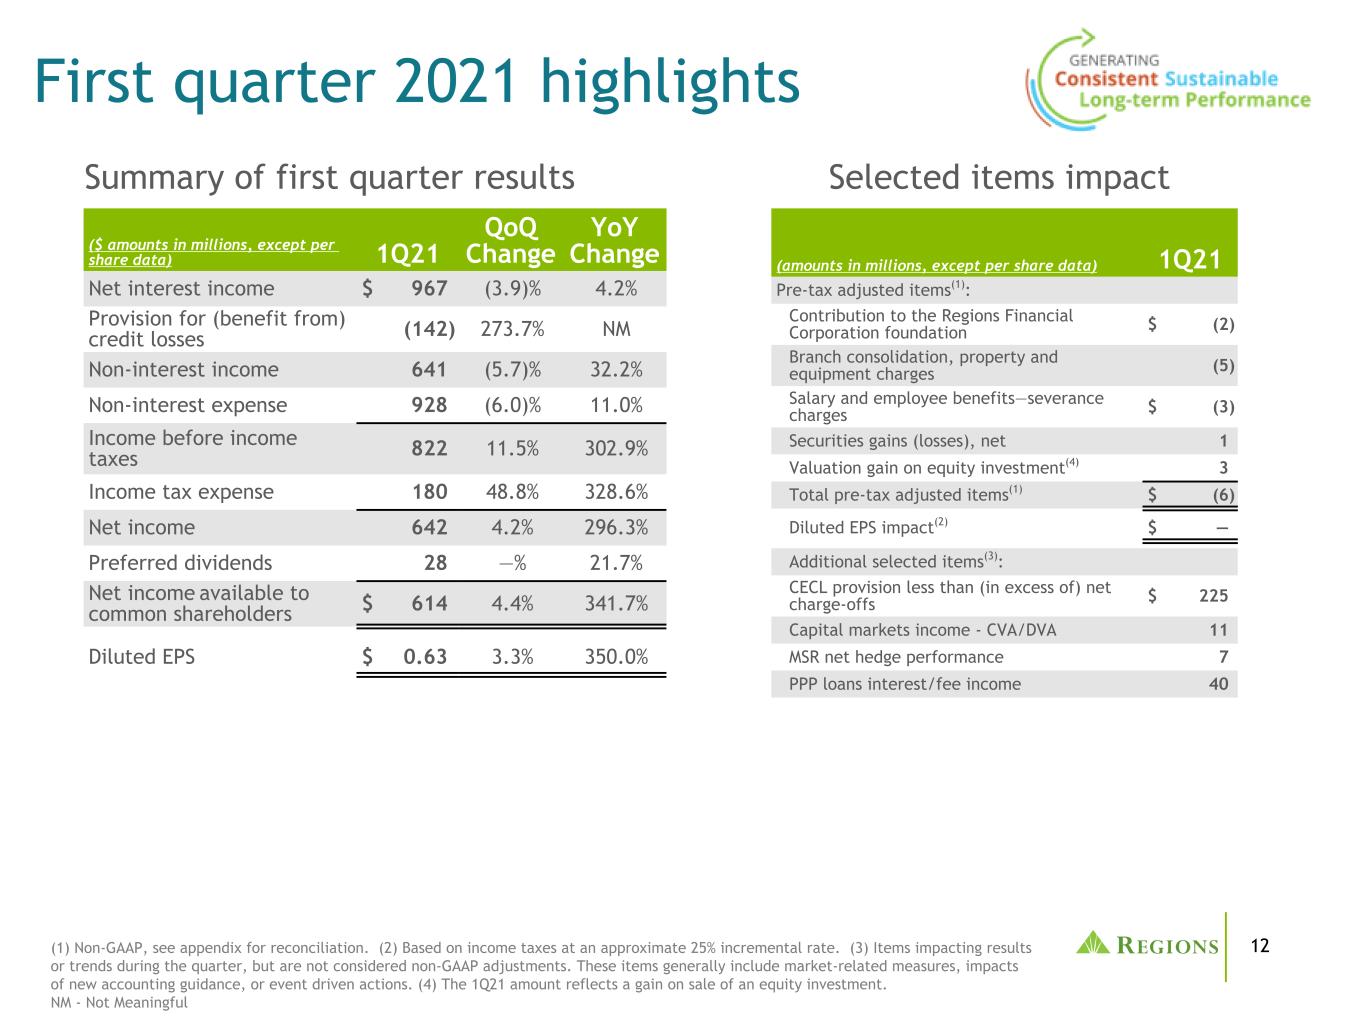
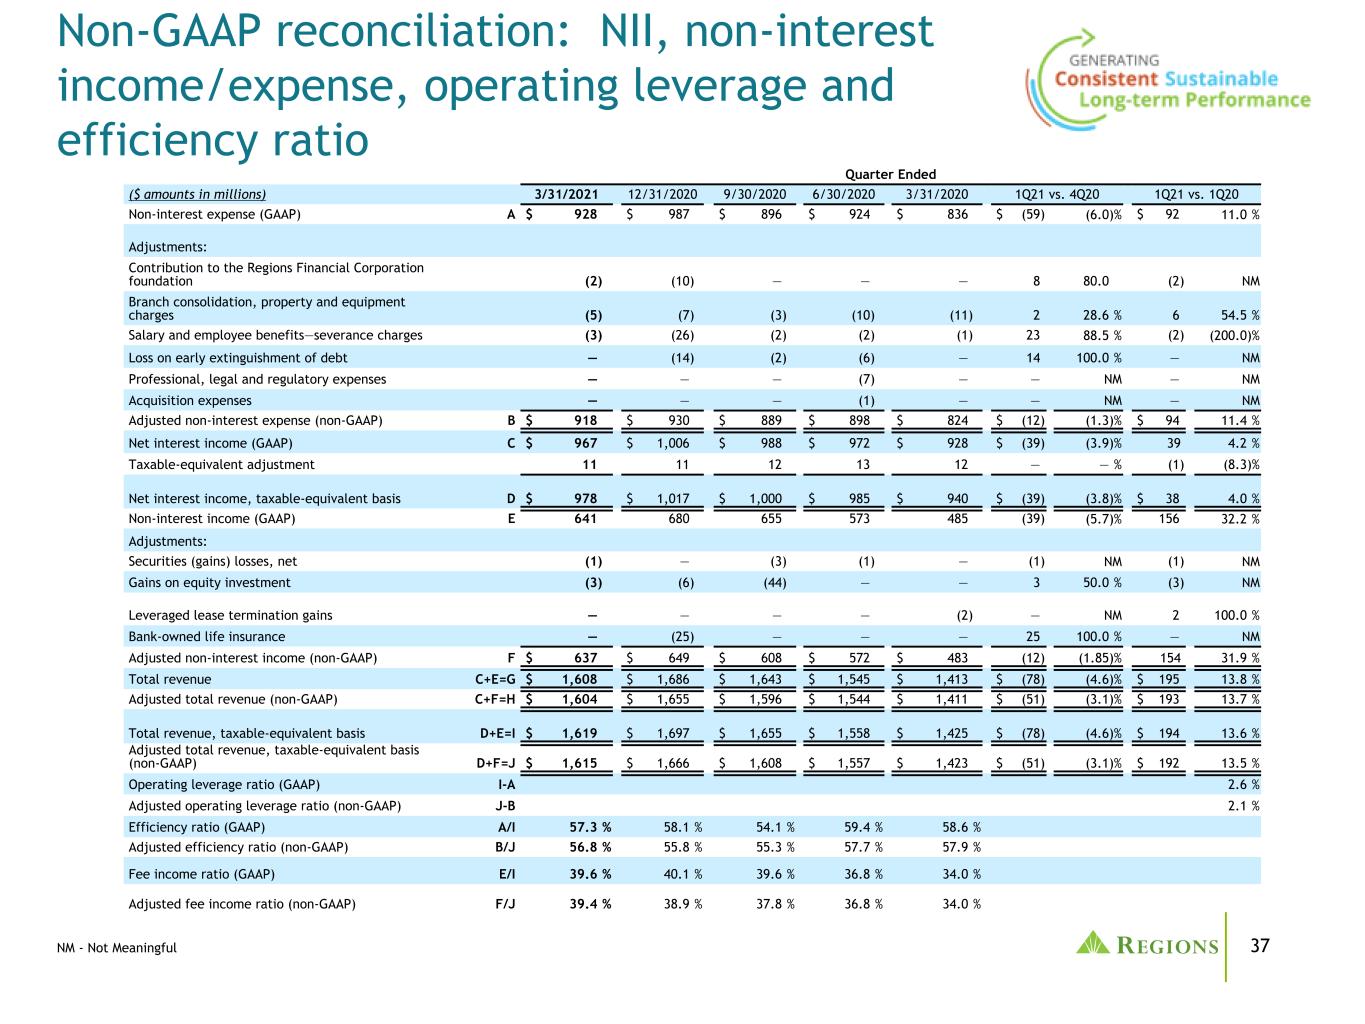
BIRMINGHAM, Ala. - (BUSINESS WIRE) - April. 23, 2021 - Regions Financial Corporation (NYSE:RF) today announced earnings for the first quarter ended March 31, 2021. The company reported net income available to common shareholders of $614 million, and earnings per diluted share of $0.63. Compared to the first quarter of 2020, strong revenue growth contributed to an 18 percent increase in pre-tax pre-provision income on a reported basis and a 17 percent increase on an adjusted basis(1). The company also generated positive operating leverage of 2.6 percent on a reported basis and 2.1 percent on an adjusted basis(1) versus the comparable prior-year period.
“Our ability to continue to deliver value in the first quarter is a testament to both the investments we've made as well as our associates' unwavering commitment to our customers and communities. With a 14 percent increase in total revenue compared to the first quarter of 2020, it is clear that our investments are producing solid results,” said John Turner, president and CEO.
"We have remained committed to prudent credit risk management across all our portfolios. The resiliency of our credit metrics reflects our clear and deliberate strategy which includes a focus on client selectivity as we are committed to generating appropriate risk-adjusted returns," Turner added. "We're pleased with the strength of our pipelines and the increase in business activity across industries. We're also encouraged by vaccination rates and rebounding employment across our footprint. While we are all still dealing with the lingering effects of the pandemic, our ongoing conversations with customers reflect optimism about further economic recovery and growth. We'll continue to deepen our relationships with customers by providing personalized solutions and financial guidance combined with technology solutions that make banking easier."
SUMMARY OF FIRST QUARTER 2021 RESULTS: | | | | | | | | | | | | | | | | | | | | | | | | | | |
| | Quarter Ended | | |
| (amounts in millions, except per share data) | | 3/31/2021 | | 12/31/2020 | | 3/31/2020 | | | | |
| | | | | | | | | | |
| | | | | | | | | | |
| Net income | | $ | 642 | | | $ | 616 | | | $ | 162 | | | | | |
| Preferred dividends | | 28 | | | 28 | | | 23 | | | | | |
| Net income available to common shareholders | | $ | 614 | | | $ | 588 | | | $ | 139 | | | | | |
| | | | | | | | | | |
| | | | | | | | | | |
| | | | | | | | | | |
| Weighted-average diluted shares outstanding | | 968 | | | 965 | | | 961 | | | | | |
| Actual shares outstanding—end of period | | 961 | | | 960 | | | 957 | | | | | |
| | | | | | | | | | |
| | | | | | | | | | |
| | | | | | | | | | |
| Diluted earnings per common share | | $ | 0.63 | | | $ | 0.61 | | | $ | 0.14 | | | | | |
| | | | | | | | | | |
| Selected items impacting earnings: | | | | | | | | | | |
Pre-tax adjusted items(1): | | | | | | | | | | |
| | | | | | | | | | |
Adjustments to non-interest expense(1) | | $ | (10) | | | $ | (57) | | | $ | (12) | | | | | |
Adjustments to non-interest income(1) | | 4 | | | 31 | | | 2 | | | | | |
| | | | | | | | | | |
| | | | | | | | | | |
| | | | | | | | | | |
| | | | | | | | | | |
| | | | | | | | | | |
| | | | | | | | | | |
| | | | | | | | | | |
| | | | | | | | | | |
| | | | | | | | | | |
| | | | | | | | | | |
| | | | | | | | | | |
Total pre-tax adjusted items(1) | | $ | (6) | | | $ | (26) | | | $ | (10) | | | | | |
| | | | | | | | | | |
| Diluted EPS impact* | | $ | — | | | $ | (0.01) | | | $ | (0.01) | | | | | |
| | | | | | | | | | |
| Pre-tax additional selected items**: | | | | | | | | | | |
| CECL provision less than (in excess of) net charge-offs | | $ | 225 | | | $ | 132 | | | $ | (250) | | | | | |
| Capital markets income - CVA/DVA | | 11 | | | 8 | | | (34) | | | | | |
| MSR net hedge performance | | 7 | | | (6) | | | 14 | | | | | |
| PPP loans interest income*** | | 40 | | | 54 | | | — | | | | | |
| COVID-19 related expenses | | — | | | (3) | | | — | | | | | |
| Reduction in unrecognized tax benefits | | — | | | 24 | | | — | | | | | |
| | | | | | | | | | |
— * Based on income taxes at an approximate 25% incremental rate. Tax rates associated with leveraged lease terminations are incrementally higher based on their structure. Fourth quarter of 2020 gain associated with the exchange of bank-owned life insurance policies is tax free.
** Items impacting results or trends during the quarter, but are not considered non-GAAP adjustments. These items generally include market-related measures, impacts of new accounting guidance, or event driven actions.
*** Interest income for PPP loans includes estimated funding costs.
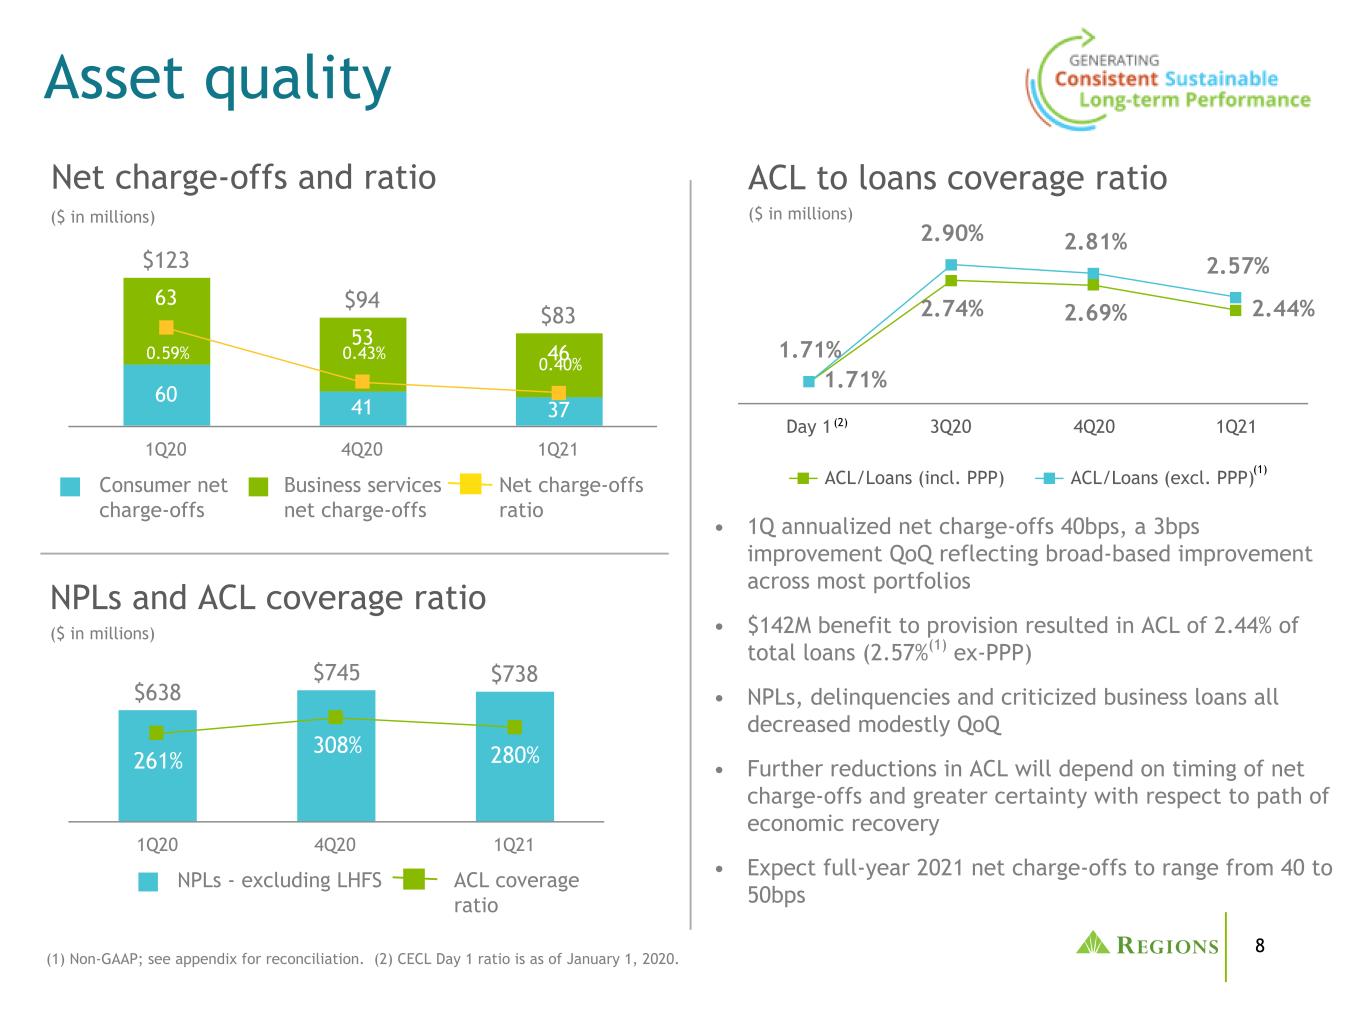
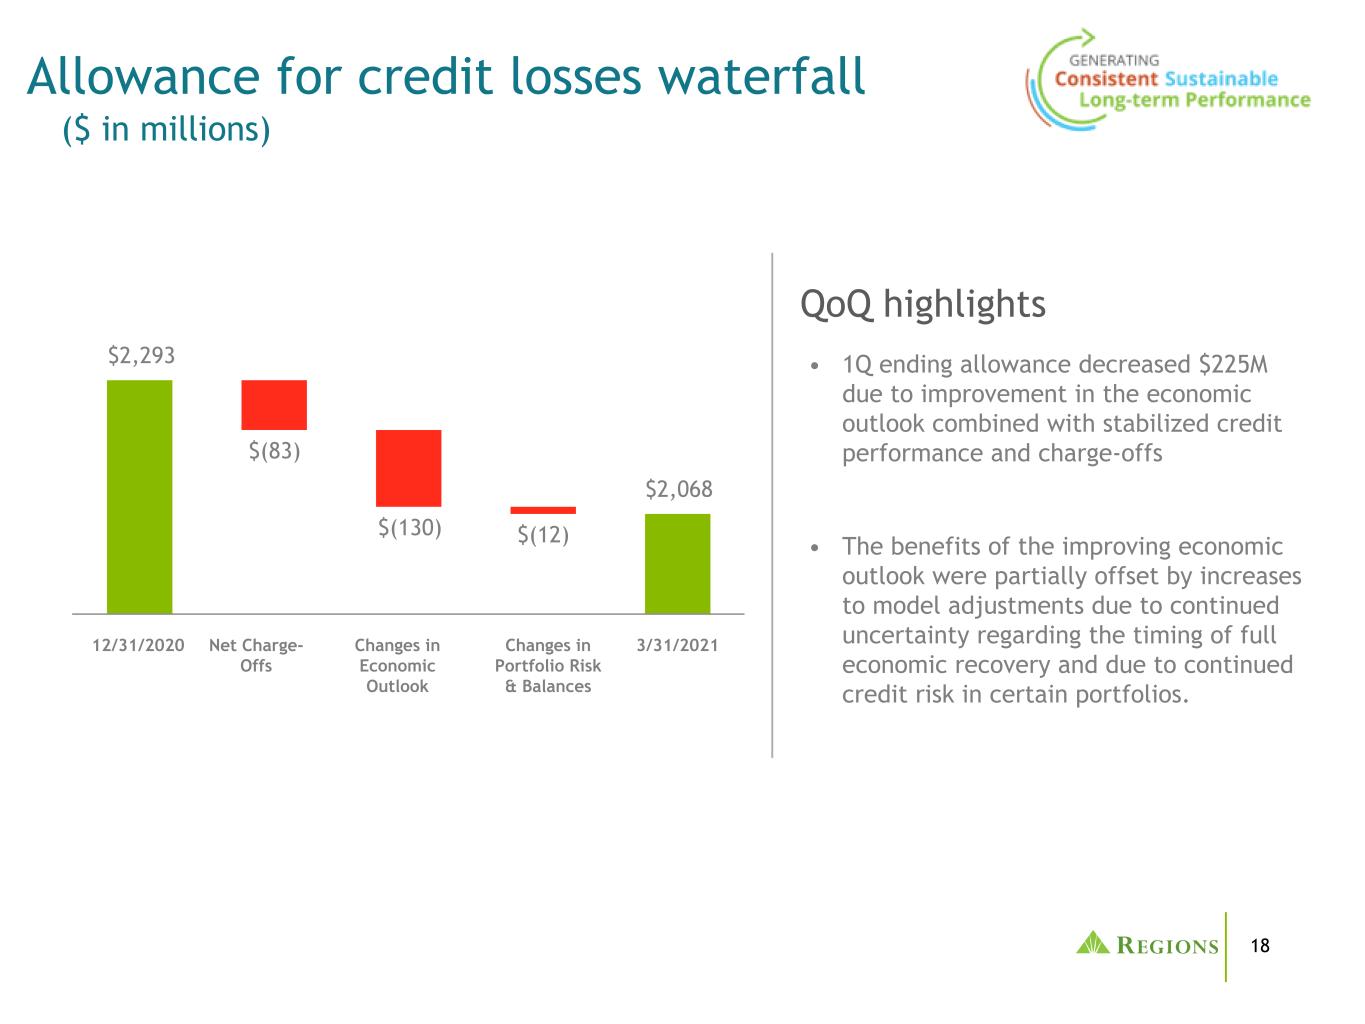
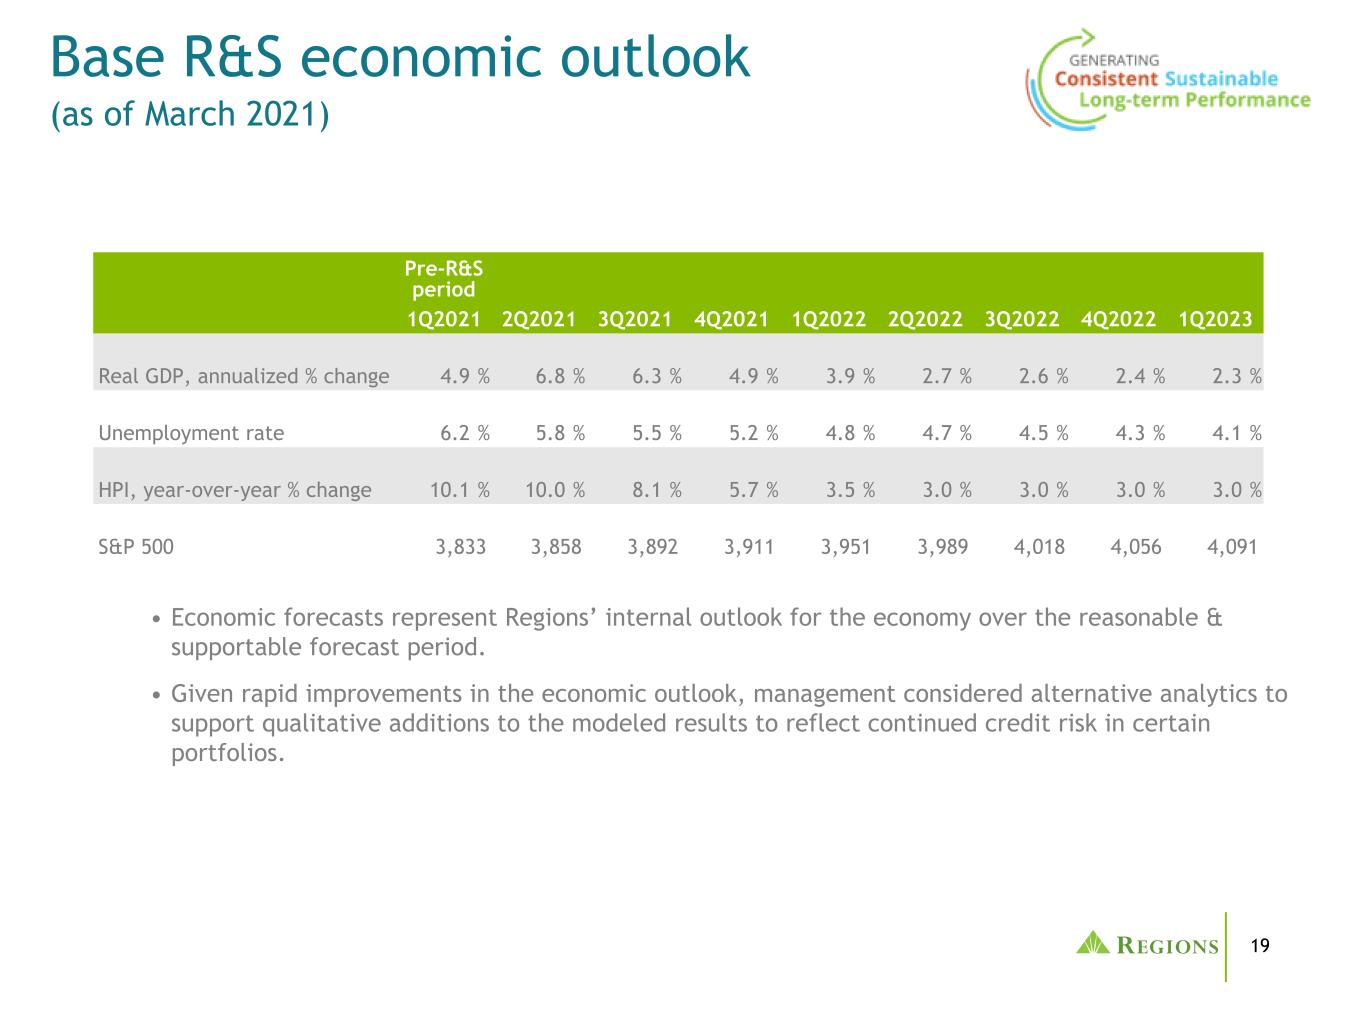
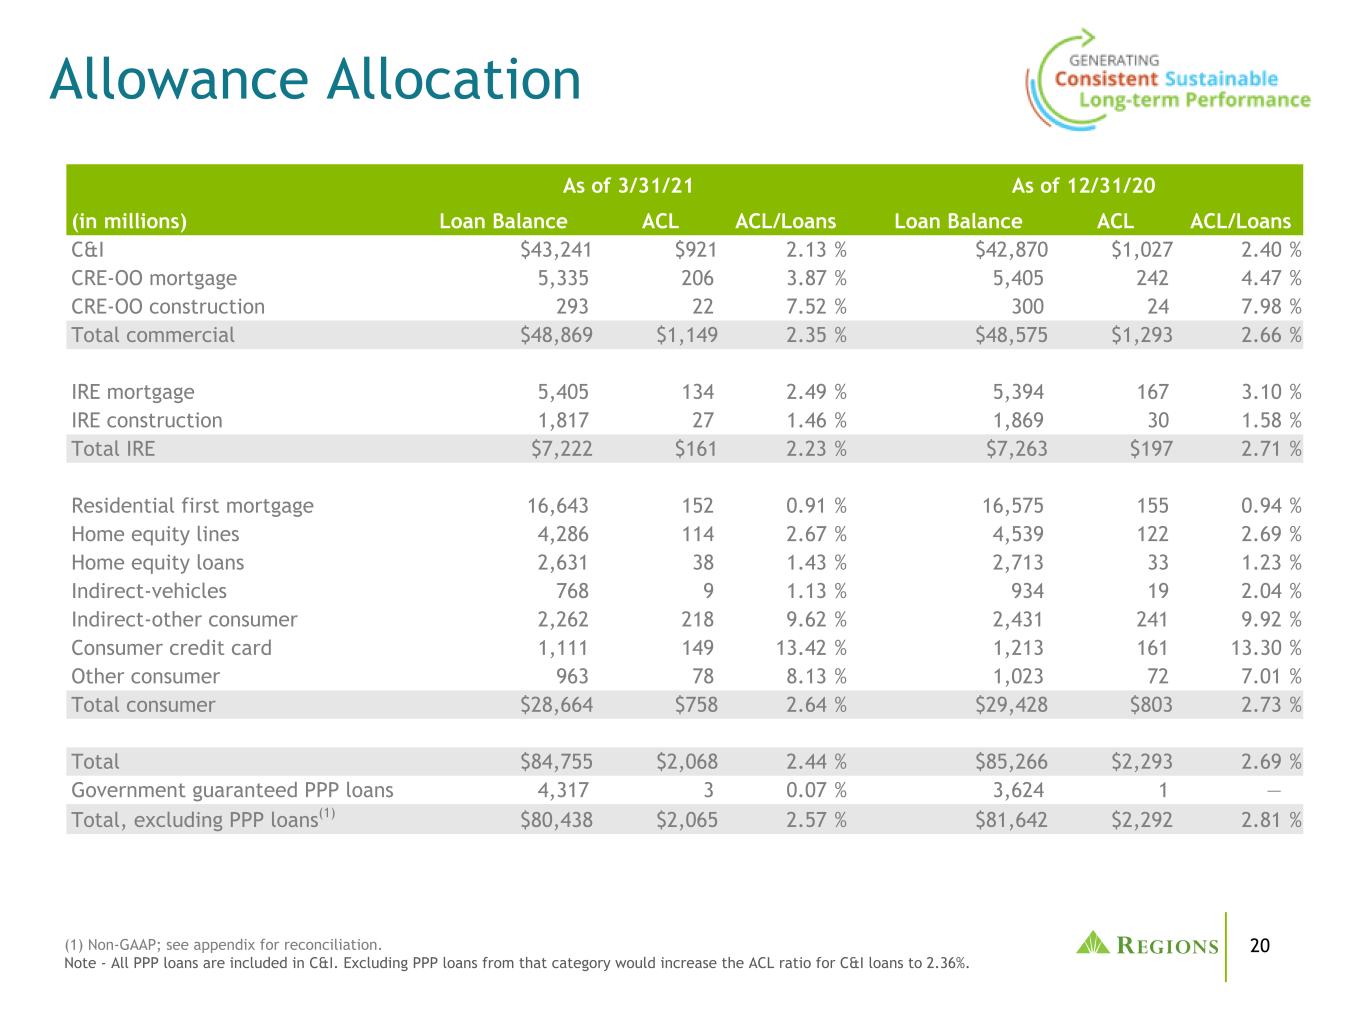
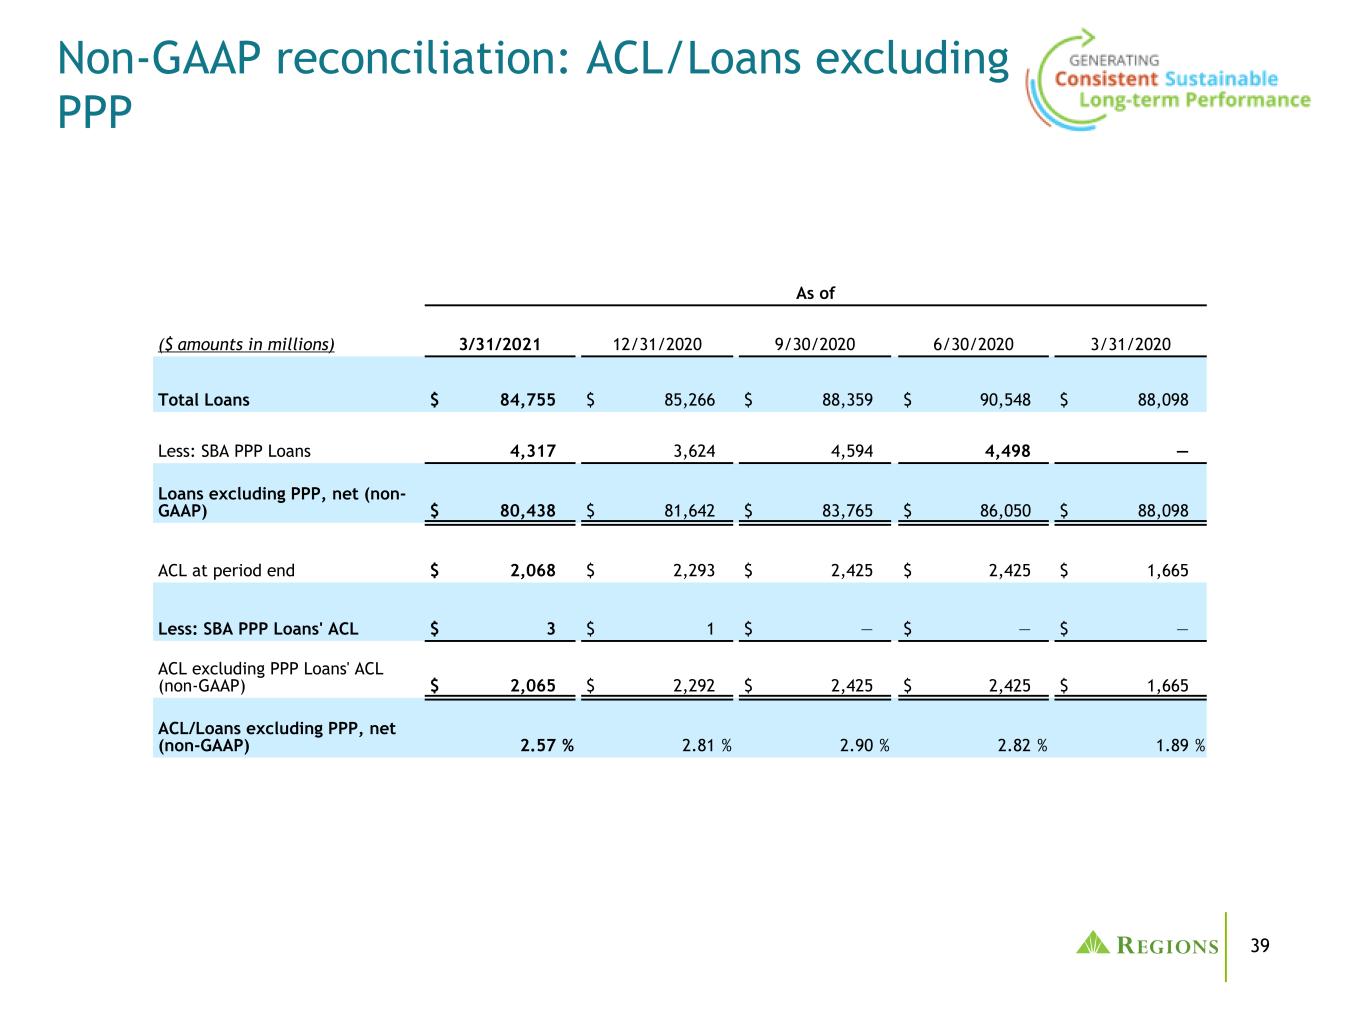
Compared to the fourth quarter of 2020, annualized net charge-offs decreased 3 basis points to 0.40 percent of average loans, while total non-performing loans, total delinquencies and business services criticized loans all declined modestly. The allowance for credit losses decreased 25 basis points to 2.44 percent of total loans, representing 280 percent of non-performing loans, excluding loans held for sale. Excluding PPP loans, which are fully government guaranteed, the allowance for credit losses was 2.57 percent(1) of total loans. Improvement in macroeconomic variables, recent government stimulus programs, as well as favorable credit performance led to the reduction in the allowance for credit losses during the quarter. The overall allowance reduction resulted in a net $142 million benefit to the credit loss provision during the quarter.
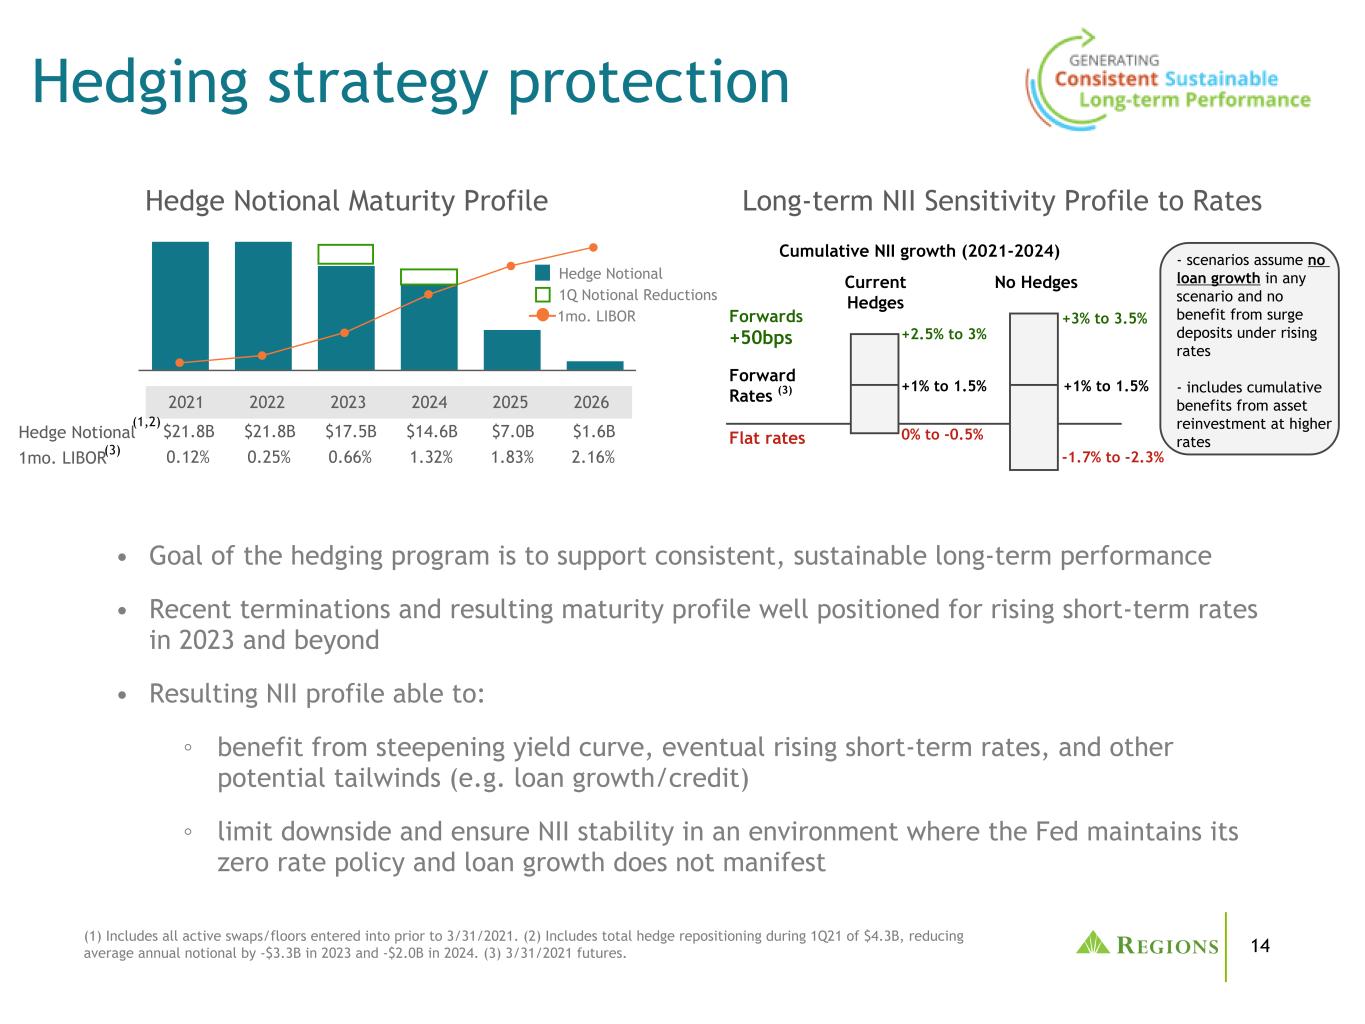
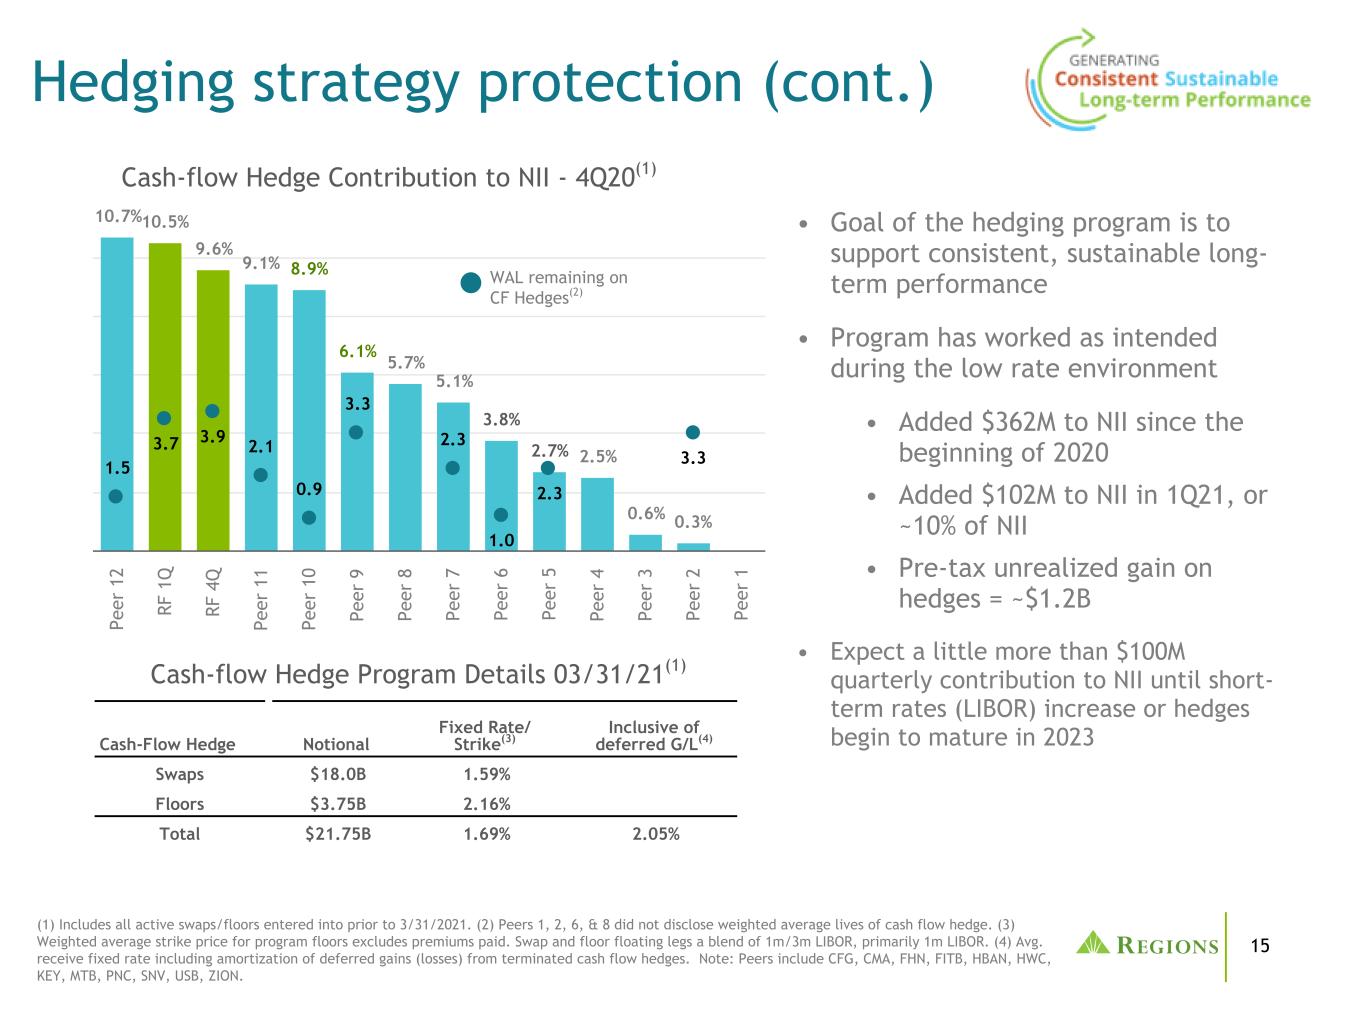
Compared to the fourth quarter of 2020, total revenue decreased approximately 5 percent on a reported basis and 3 percent on an adjusted basis(1) during the first quarter of 2021, reflecting decreases in both net interest income and non-interest income. Net interest income was negatively impacted during the quarter by lower Paycheck Protection Program ("PPP") interest income and fewer days in the quarter. Excluding these items, net interest income decreased modestly attributable to lower loan balances and the remixing out of higher yielding consumer indirect categories. At the same time, net interest income benefited from the company's significant hedging program, deposit cost reductions and active cash management strategies, offsetting the impacts of low interest rates. Non-interest income decreased 6 percent driven primarily by a decline in bank-owned life insurance resulting from a gain on policy exchanges in the prior quarter. Wealth management and mortgage income increased 2 percent and 20 percent, respectively, while capital markets income remained very strong but was lower following a record fourth quarter. Non-interest expense decreased 6 percent during the quarter on a reported basis and 1 percent on an adjusted basis(1), driven by decreases in salaries and benefits. The company's first quarter efficiency ratio was 57.3 percent on a reported basis and 56.8 percent on an adjusted basis(1). Pre-tax pre-provision income(1) decreased 3 percent on a reported basis compared to the fourth quarter of 2020, and 5 percent on an adjusted basis(1), but increased 18 percent and 17 percent(1), respectively versus the first quarter of 2020.
Non-GAAP adjusted items(1) impacting the company's earnings are identified to assist investors in analyzing Regions' operating results on the same basis as that applied by management and provide a basis to predict future performance. Non-GAAP adjusted items(1) in the current quarter reflect, among other items, $3 million of severance charges within salaries and benefits, a $5 million loss on branch and other equipment costs and a $2 million contribution to the Regions Foundation. Partially offsetting these adjusted items was a $3 million gain on an equity investment that was sold during the quarter.
Total revenue
| | | | | | | | | | | | | | | | | | | | | | | | | | | | | | | | | | | | | | | | | | | | |
| | Quarter Ended |
| ($ amounts in millions) | | 3/31/2021 | | 12/31/2020 | | 3/31/2020 | | 1Q21 vs. 4Q20 | | 1Q21 vs. 1Q20 |
| Net interest income | | $ | 967 | | | $ | 1,006 | | | $ | 928 | | | $ | (39) | | | (3.9) | % | | $ | 39 | | | 4.2 | % |
| | | | | | | | | | | | | | |
| | | | | | | | | | | | | | |
| Taxable equivalent adjustment | | 11 | | | 11 | | | 12 | | | — | | | — | % | | (1) | | | (8.3) | % |
| Net interest income, taxable equivalent basis | | $ | 978 | | | $ | 1,017 | | | $ | 940 | | | $ | (39) | | | (3.8) | % | | $ | 38 | | | 4.0 | % |
| Net interest margin (FTE) | | 3.02 | % | | 3.13 | % | | 3.44 | % | | | | | | | | |
Adjusted net interest margin (FTE) (non-GAAP)(1) | | 3.40 | % | | 3.40 | % | | 3.49 | % | | | | | | | | |
| | | | | | | | | | | | | | |
| Non-interest income: | | | | | | | | | | | | | | |
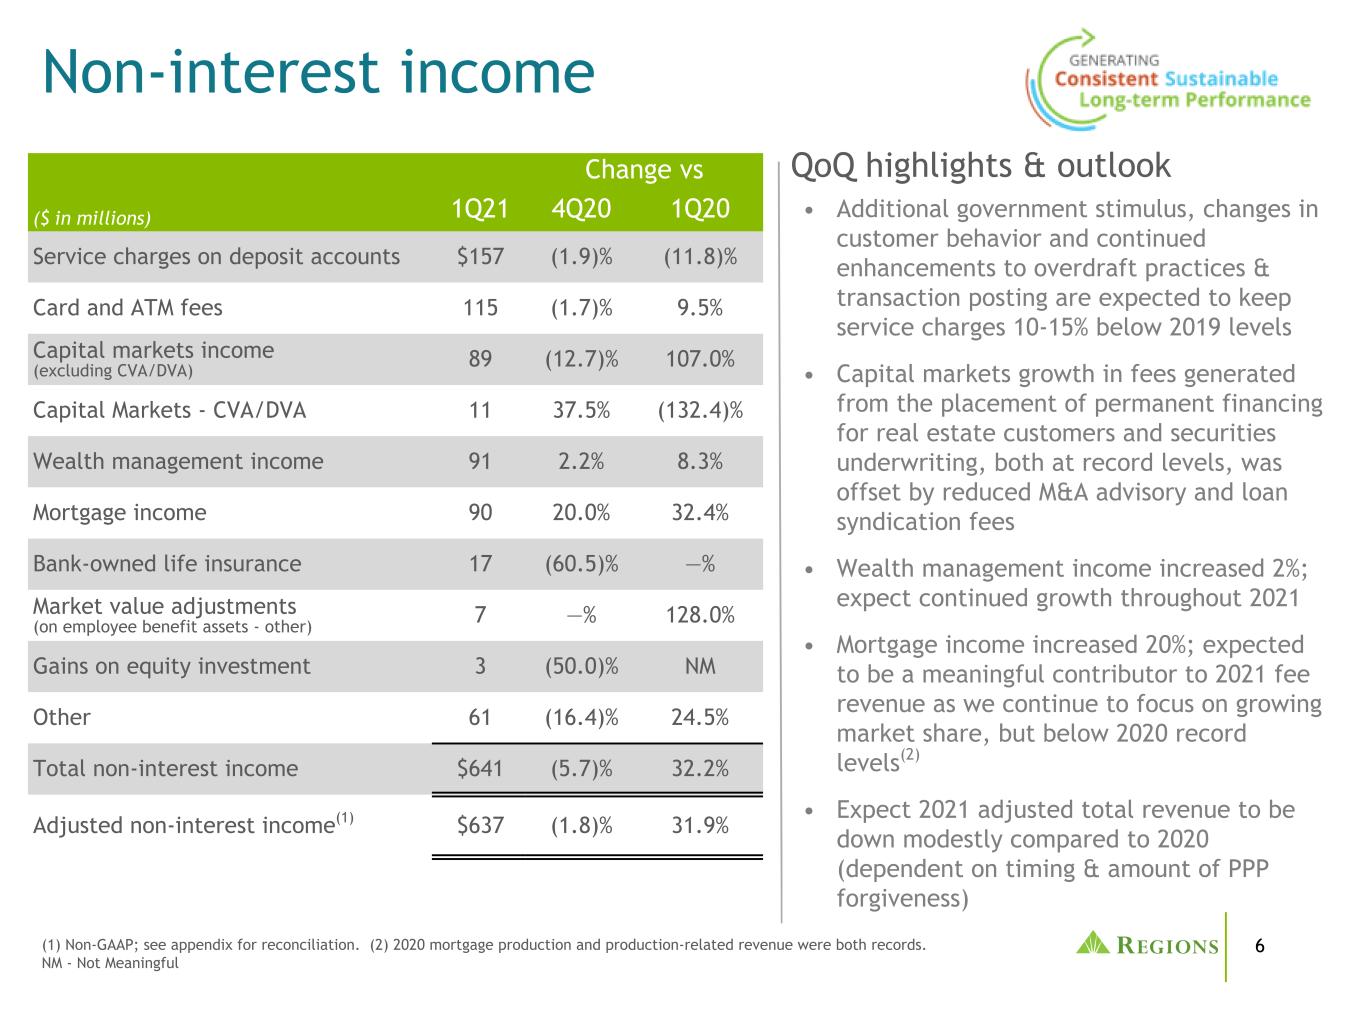
| Service charges on deposit accounts | | $ | 157 | | | $ | 160 | | | $ | 178 | | | (3) | | | (1.9) | % | | (21) | | | (11.8) | % |
| Card and ATM fees | | 115 | | | 117 | | | 105 | | | (2) | | | (1.7) | % | | 10 | | | 9.5 | % |
| Wealth management income | | 91 | | | 89 | | | 84 | | | 2 | | | 2.2 | % | | 7 | | | 8.3 | % |
| Capital markets income | | 100 | | | 110 | | | 9 | | | (10) | | | (9.1) | % | | 91 | | | NM |
| Mortgage income | | 90 | | | 75 | | | 68 | | | 15 | | | 20.0 | % | | 22 | | | 32.4 | % |
| Commercial credit fee income | | 22 | | | 22 | | | 18 | | | — | | | — | % | | 4 | | | 22.2 | % |
| Bank-owned life insurance | | 17 | | | 43 | | | 17 | | | (26) | | | (60.5) | % | | — | | | — | % |
| Securities gains (losses), net | | 1 | | | — | | | — | | | 1 | | | NM | | 1 | | | NM |
| | | | | | | | | | | | | | |
| Market value adjustments on employee benefit assets* | | 7 | | | 7 | | | (25) | | | — | | | — | % | | 32 | | | 128.0 | % |
| Gains on equity investment** | | 3 | | | 6 | | | — | | | (3) | | | (50.0) | | | 3 | | | NM |
| Other | | 38 | | | 51 | | | 31 | | | (13) | | | (25.5) | % | | 7 | | | 22.6 | % |
| Non-interest income | | $ | 641 | | | $ | 680 | | | $ | 485 | | | $ | (39) | | | (5.7) | % | | $ | 156 | | | 32.2 | % |
| Total revenue | | $ | 1,608 | | | $ | 1,686 | | | $ | 1,413 | | | $ | (78) | | | (4.6) | % | | $ | 195 | | | 13.8 | % |
| | | | | | | | | | | | | | |
Adjusted total revenue (non-GAAP)(1) | | $ | 1,604 | | | $ | 1,655 | | | $ | 1,411 | | | $ | (51) | | | (3.1) | % | | $ | 193 | | | 13.7 | % |
| | | | | | | | | | | | | | |
NM - Not Meaningful
* These market value adjustments relate to assets held for employee benefits that are offset within salaries and employee benefits expense.
** The first quarter of 2021 amount reflects a gain on sale of an equity investment, whereas the prior quarters reflect valuation gains.
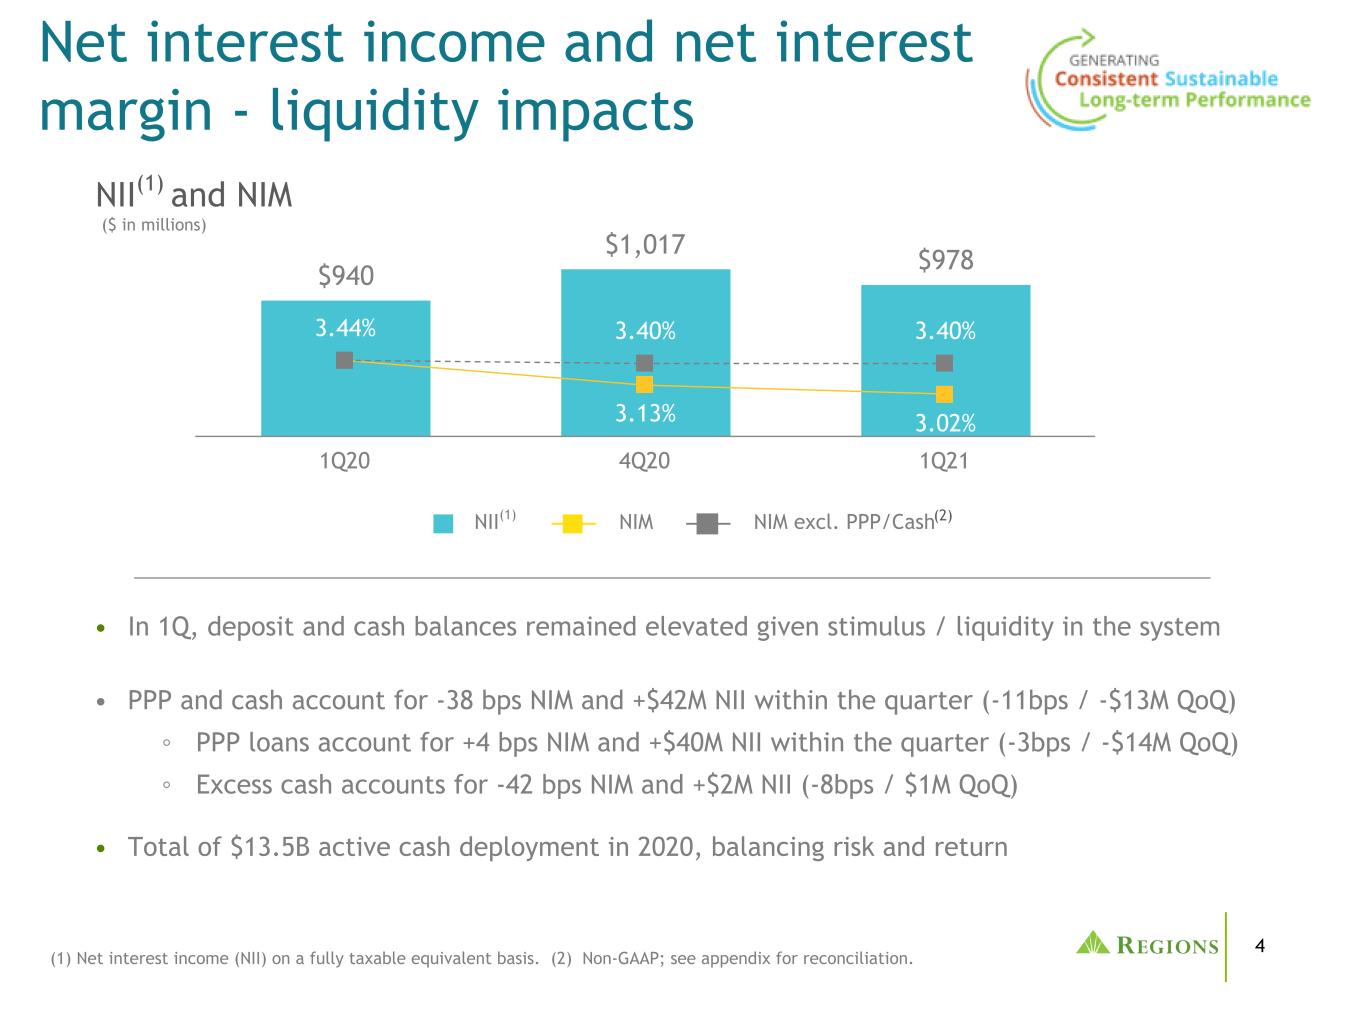
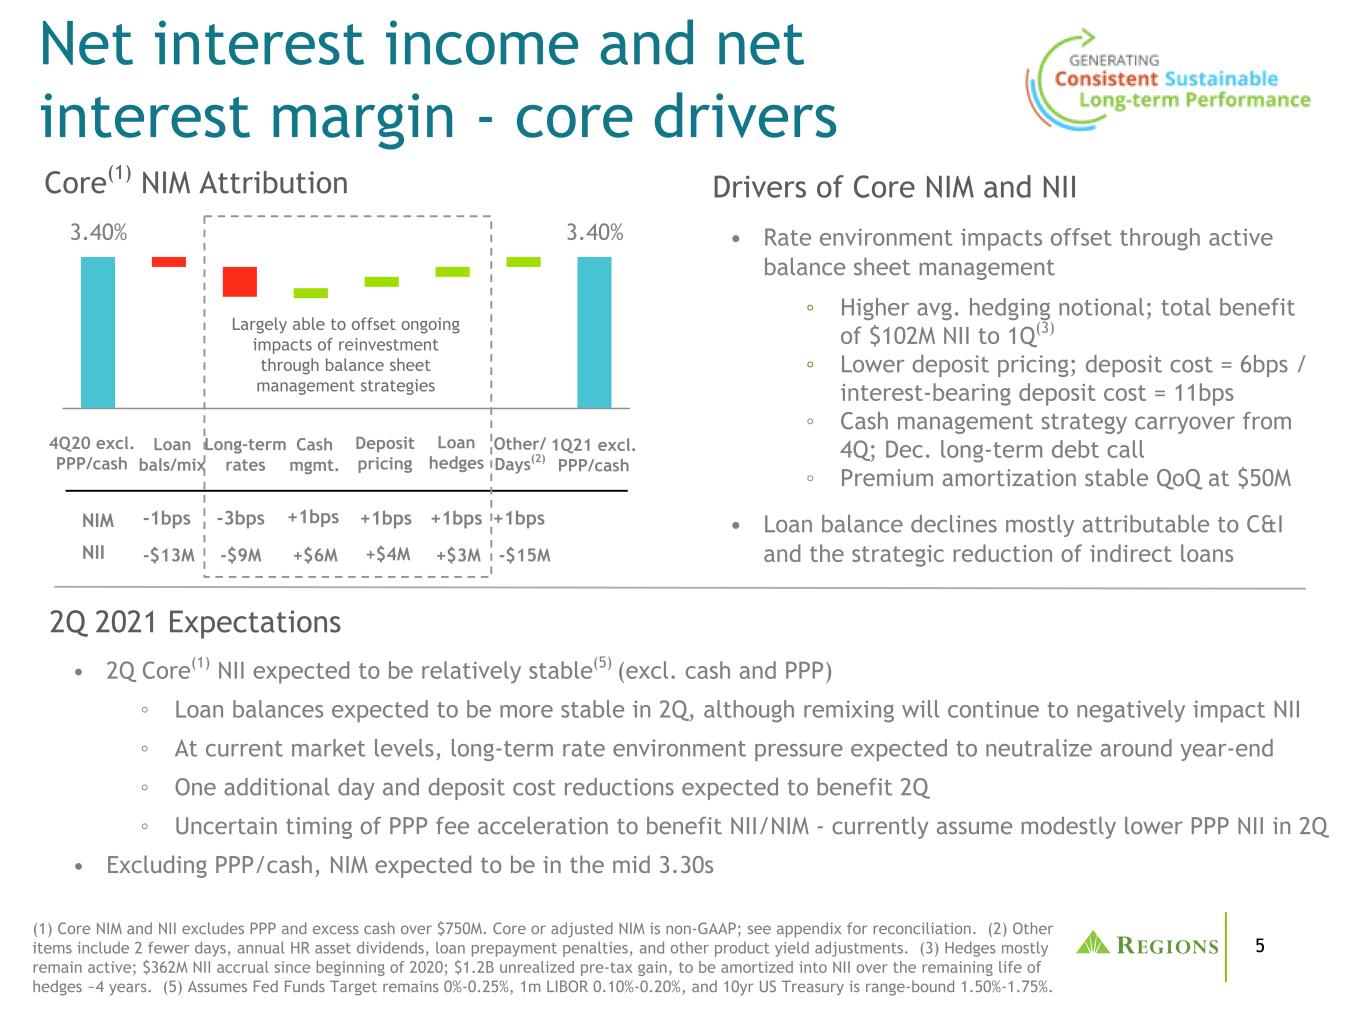
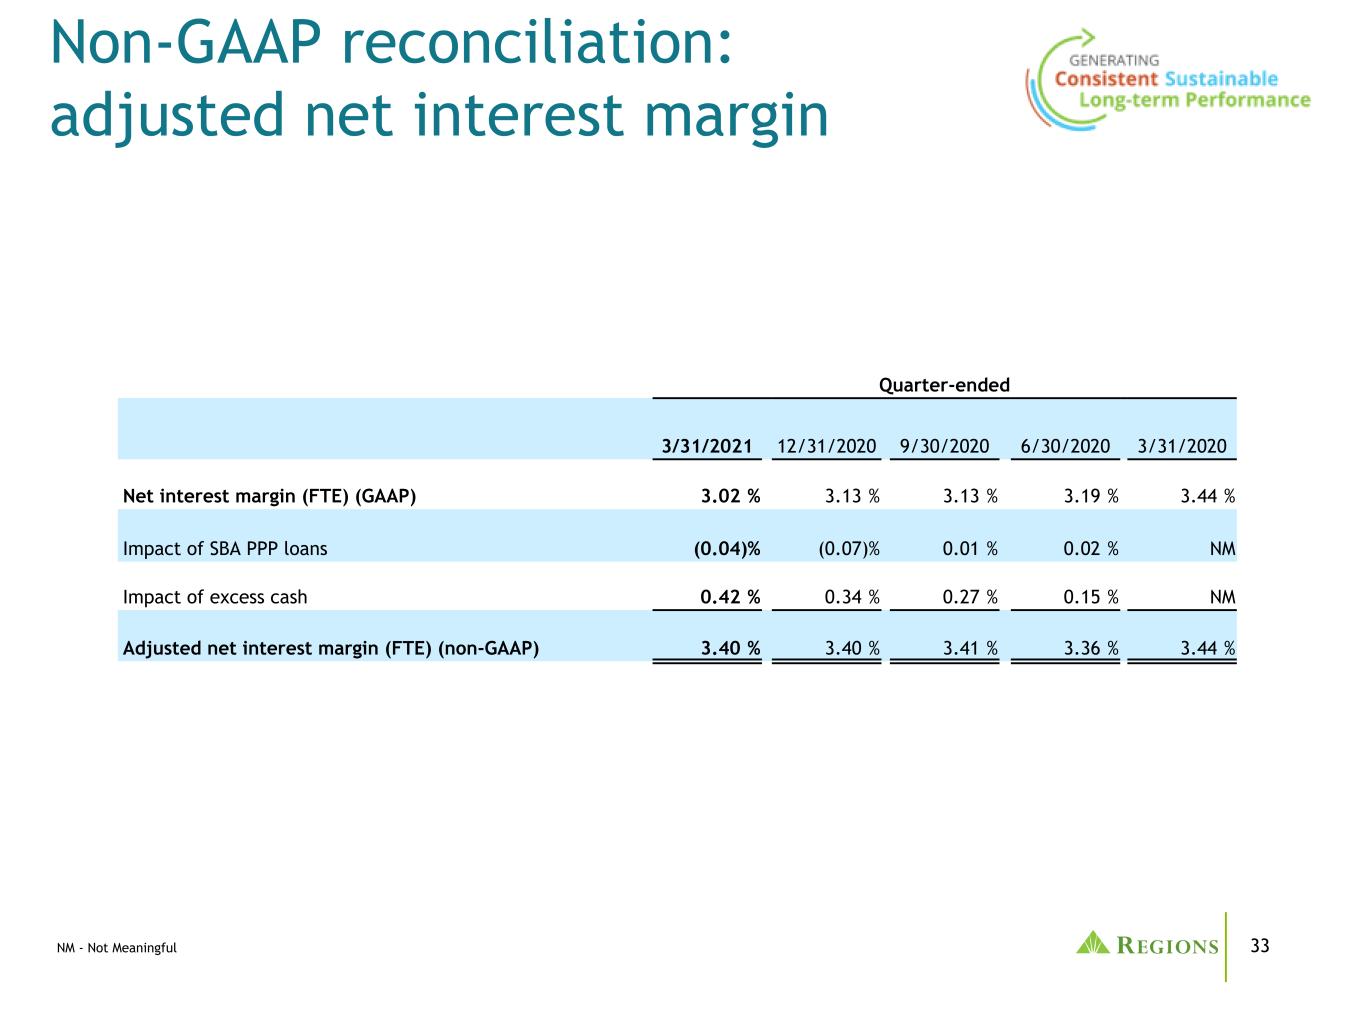
Total revenue of approximately $1.6 billion decreased 5 percent on a reported basis and 3 percent on an adjusted basis(1) compared to the fourth quarter of 2020. Net interest income decreased 4 percent, while net interest margin decreased 11 basis points. The decrease in net interest income was primarily attributable to lower PPP interest income stemming from a temporary closure of the Small Business Administration portal during the quarter, as well as two fewer days in the quarter. Excluding the impacts of PPP and days, net interest income was negatively impacted by lower loan balances and the remixing out of higher yielding consumer indirect categories. The company offset pressure on asset yields from the low rate environment through its interest rate hedging program, a continued focus on lower deposit costs and active cash management strategies. Strong deposit growth trends continued, as cash balances rose to record levels, negatively impacting net interest margin. Excluding the impact of PPP interest income and excess cash balances held at the Federal Reserve, the company's adjusted net interest margin(1) remained stable at 3.40 percent.
Non-interest income decreased approximately 6 percent on a reported basis and 2 percent on an adjusted basis(1) compared to the fourth quarter of 2020. Increases in mortgage and wealth management income were offset by declines in most other categories. Mortgage income increased to $90 million driven primarily by agency gain on sale and favorable mortgage servicing rights valuation. Wealth management income increased 2 percent reflecting higher sales volumes and improved market values. Capital markets experienced another strong quarter with income of $100 million. Almost every area within capital markets produced stronger than expected results as customers responded to interest rate changes and potential regulatory and tax headwinds. Service charges decreased 2 percent reflecting both seasonal declines and the impact of additional government stimulus while card and ATM fees decreased 2 percent. Additionally, bank-owned life insurance decreased to $17 million reflecting the impact of a gain associated with a policy exchange completed during the prior quarter.
Non-interest expense | | | | | | | | | | | | | | | | | | | | | | | | | | | | | | | | | | | | | | | | | | | | |
| | Quarter Ended |
| ($ amounts in millions) | | 3/31/2021 | | 12/31/2020 | | 3/31/2020 | | 1Q21 vs. 4Q20 | | 1Q21 vs. 1Q20 |
| Salaries and employee benefits | | $ | 546 | | | $ | 581 | | | $ | 467 | | | $ | (35) | | | (6.0) | % | | $ | 79 | | | 16.9 | % |
| Net occupancy expense | | 77 | | | 78 | | | 79 | | | (1) | | | (1.3) | % | | (2) | | | (2.5) | % |
| Equipment and software expense | | 90 | | | 90 | | | 83 | | | — | | | — | % | | 7 | | | 8.4 | % |
| Outside services | | 38 | | | 37 | | | 45 | | | 1 | | | 2.7 | % | | (7) | | | (15.6) | % |
| Professional, legal and regulatory expenses | | 29 | | | 21 | | | 18 | | | 8 | | | 38.1 | % | | 11 | | | 61.1 | % |
| Marketing | | 22 | | | 26 | | | 24 | | | (4) | | | (15.4) | % | | (2) | | | (8.3) | % |
| FDIC insurance assessments | | 10 | | | 12 | | | 11 | | | (2) | | | (16.7) | % | | (1) | | | (9.1) | % |
| Credit/checkcard expenses | | 14 | | | 13 | | | 13 | | | 1 | | | 7.7 | % | | 1 | | | 7.7 | % |
| Branch consolidation, property and equipment charges | | 5 | | | 7 | | | 11 | | | (2) | | | (28.6) | % | | (6) | | | (54.5) | % |
| Visa class B shares expense | | 4 | | | 6 | | | 4 | | | (2) | | | (33.3) | % | | — | | | — | % |
| | | | | | | | | | | | | | |
| Loss on early extinguishment of debt | | — | | | 14 | | | — | | | (14) | | | (100.0) | % | | — | | | NM |
| Other | | 93 | | | 102 | | | 81 | | | (9) | | | (8.8) | % | | 12 | | | 14.8 | % |
| Total non-interest expense | | $ | 928 | | | $ | 987 | | | $ | 836 | | | $ | (59) | | | (6.0) | % | | $ | 92 | | | 11.0 | % |
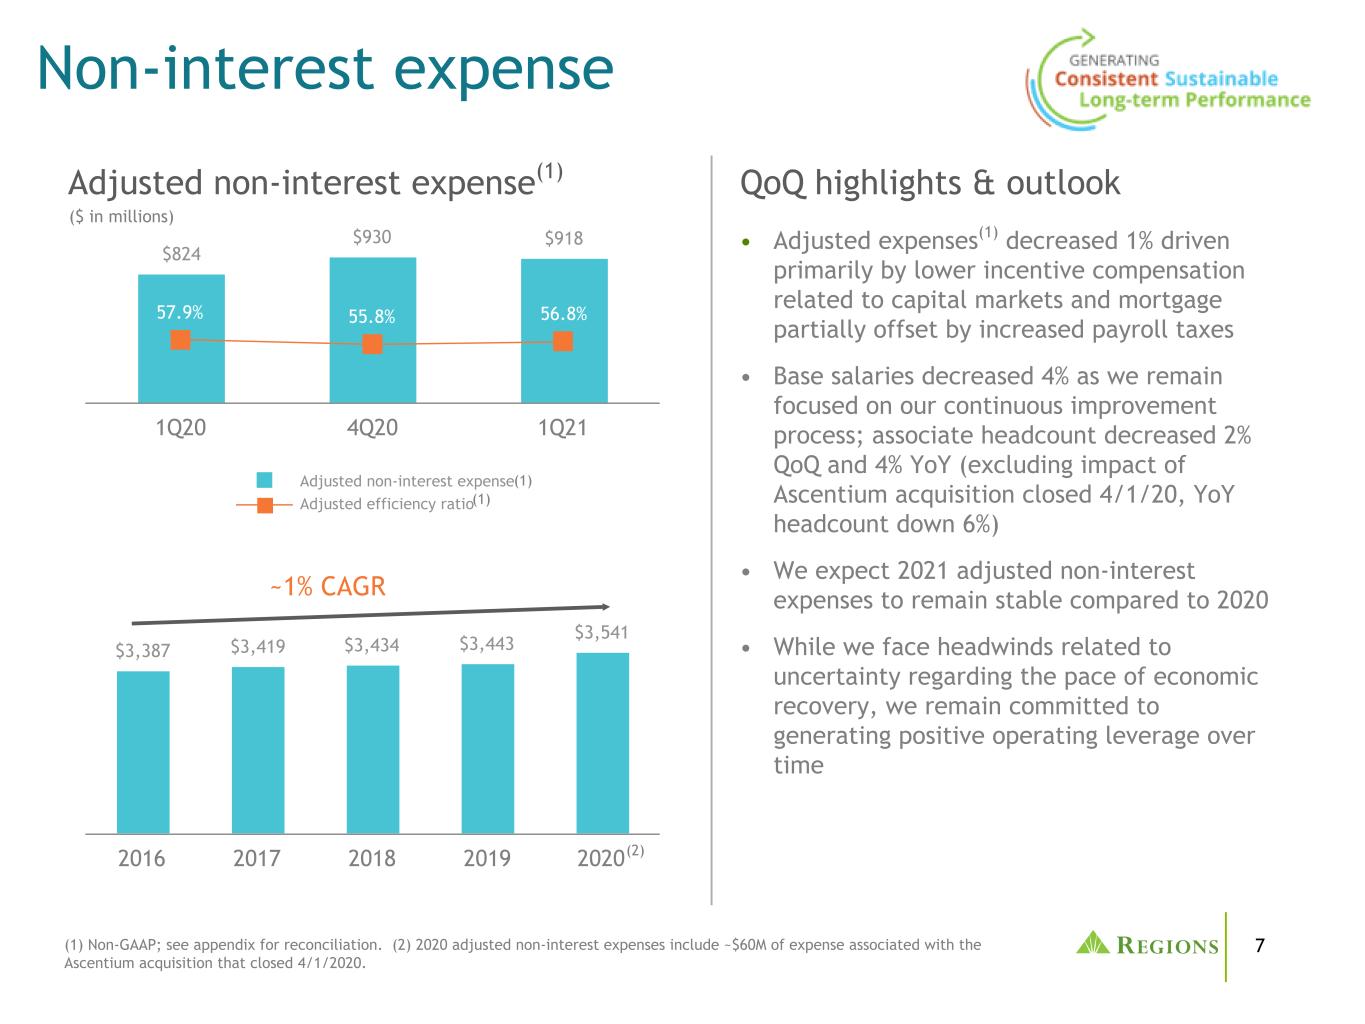
Total adjusted non-interest expense(1) | | $ | 918 | | | $ | 930 | | | $ | 824 | | | $ | (12) | | | (1.3) | % | | $ | 94 | | | 11.4 | % |
| | | | | | | | | | | | | | |
NM - Not Meaningful
Non-interest expense decreased 6 percent on a reported basis and 1 percent on an adjusted basis(1) compared to the fourth quarter of 2020. Salaries and benefits decreased 6 percent. Excluding the impact of severance charges, salaries and benefits decreased 2 percent driven primarily by a reduction in production-based incentives. Overall
base salaries were also lower as the company continued to build greater efficiencies through its ongoing continuous improvement process focused on making banking easier for customers and associates. Other expenses decreased 9 percent resulting primarily from a large contribution to the Regions Foundation in the fourth quarter. Partially offsetting these decreases was a 38 percent increase in professional fees driven by higher legal and consulting costs.
The company's first quarter efficiency ratio was 57.3 percent on a reported basis and 56.8 percent on an adjusted basis(1). The effective tax rate was 21.9 percent.
Loans and Leases
| | | | | | | | | | | | | | | | | | | | | | | | | | | | | | | | | | | | | | | | | | | | |
| | Average Balances |
| | | | | | | | | | |
| ($ amounts in millions) | | 1Q21 | | 4Q20 | | 1Q20 | | 1Q21 vs. 4Q20 | | 1Q21 vs. 1Q20 |
| | | | | | | | | | | | | | |
| | | | | | | | | | | | | | |
| | | | | | | | | | | | | | |
| Commercial and industrial | | $ | 42,816 | | | $ | 43,889 | | | $ | 40,519 | | | $ | (1,073) | | | (2.4) | % | | $ | 2,297 | | | 5.7% |
| | | | | | | | | | | | | | |
| | | | | | | | | | | | | | |
| Commercial real estate—owner-occupied | | 5,678 | | | 5,708 | | | 5,832 | | | (30) | | | (0.5) | % | | (154) | | | (2.6)% |
| Investor real estate | | 7,222 | | | 7,448 | | | 6,648 | | | (226) | | | (3.0) | % | | 574 | | | 8.6% |
| Business Lending | | 55,716 | | | 57,045 | | | 52,999 | | | (1,329) | | | (2.3) | % | | 2,717 | | | 5.1% |
| Residential first mortgage | | 16,606 | | | 16,433 | | | 14,469 | | | 173 | | | 1.1 | % | | 2,137 | | | 14.8% |
| | | | | | | | | | | | | | |
| | | | | | | | | | | | | | |
| Home equity | | 7,085 | | | 7,411 | | | 8,275 | | | (326) | | | (4.4) | % | | (1,190) | | | (14.4)% |
| Indirect—vehicles* | | 850 | | | 1,023 | | | 1,679 | | | (173) | | | (16.9) | % | | (829) | | | (49.4)% |
| | | | | | | | | | | | | | |
| Indirect—other consumer** | | 2,352 | | | 2,514 | | | 3,263 | | | (162) | | | (6.4) | % | | (911) | | | (27.9)% |
| Consumer credit card | | 1,151 | | | 1,190 | | | 1,348 | | | (39) | | | (3.3) | % | | (197) | | | (14.6)% |
| Other consumer | | 995 | | | 1,048 | | | 1,216 | | | (53) | | | (5.1) | % | | (221) | | | (18.2)% |
| Consumer Lending | | 29,039 | | | 29,619 | | | 30,250 | | | (580) | | | (2.0) | % | | (1,211) | | | (4.0)% |
| Total Loans | | $ | 84,755 | | | $ | 86,664 | | | $ | 83,249 | | | $ | (1,909) | | | (2.2) | % | | $ | 1,506 | | | 1.8% |
| | | | | | | | | | | | | | |
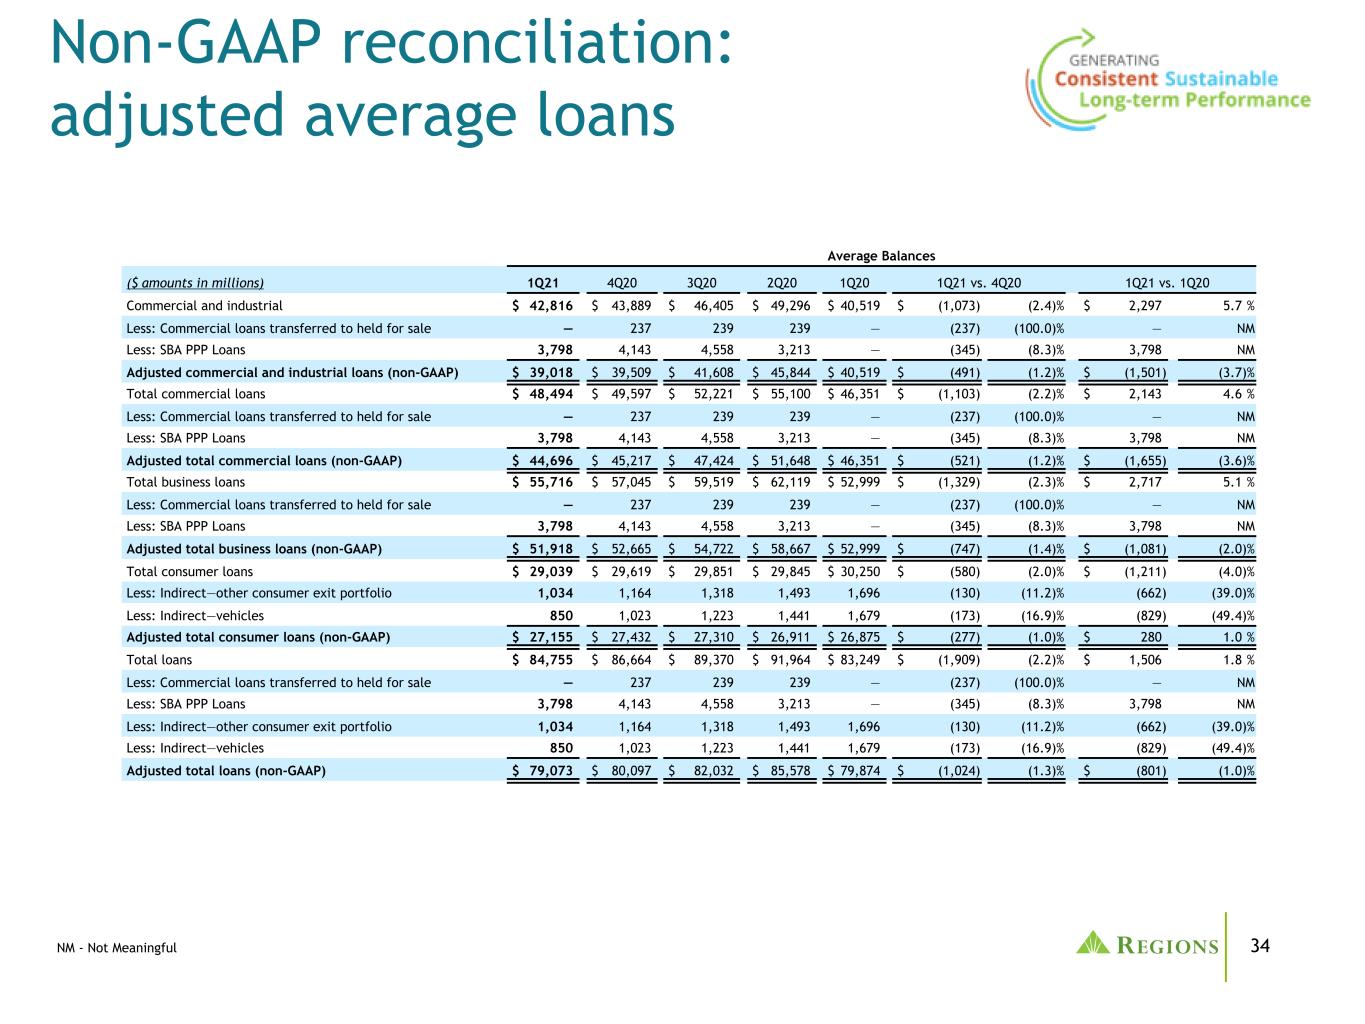
Adjusted Business Lending (non-GAAP)(1) | | $ | 51,918 | | | $ | 52,665 | | | $ | 52,999 | | | (747) | | | (1.4) | % | | $ | (1,081) | | | (2.0)% |
Adjusted Consumer Lending (non-GAAP)(1) | | 27,155 | | | 27,432 | | | 26,875 | | | (277) | | | (1.0) | % | | 280 | | | 1.0% |
Adjusted Total Loans (non-GAAP)(1) | | $ | 79,073 | | | $ | 80,097 | | | $ | 79,874 | | | $ | (1,024) | | | (1.3) | % | | $ | (801) | | | (1.0)% |
| | | | | | | | | | | | | | |
NM - Not meaningful.
* Indirect vehicles is an exit portfolio.
** A portion of indirect other consumer is an exit portfolio due to the company's decision not to renew a 3rd party relationship in the fourth quarter of 2019.
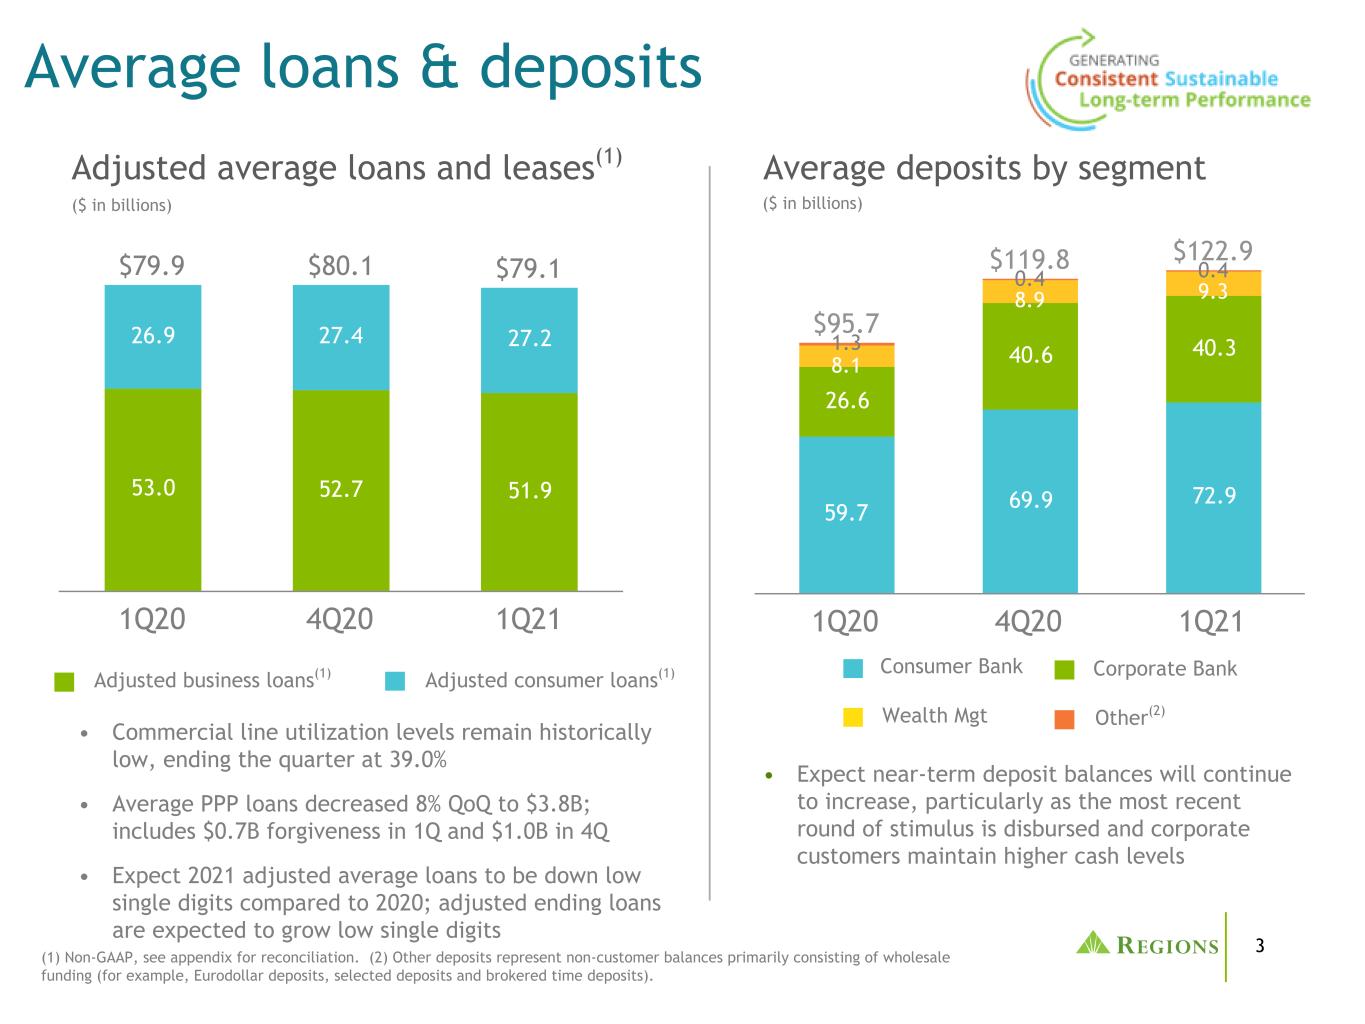
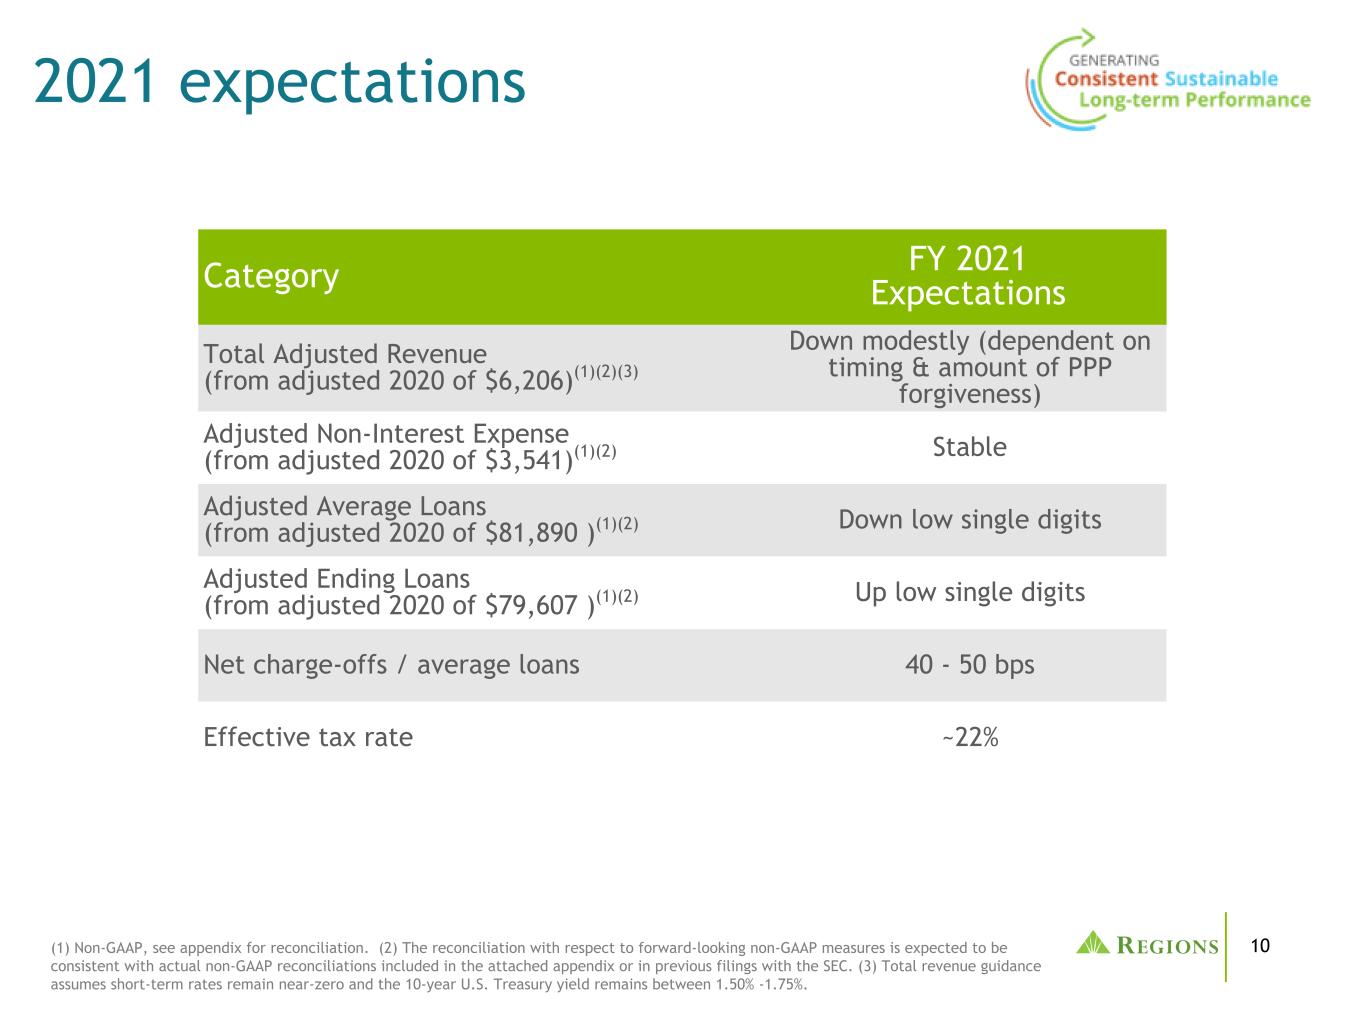
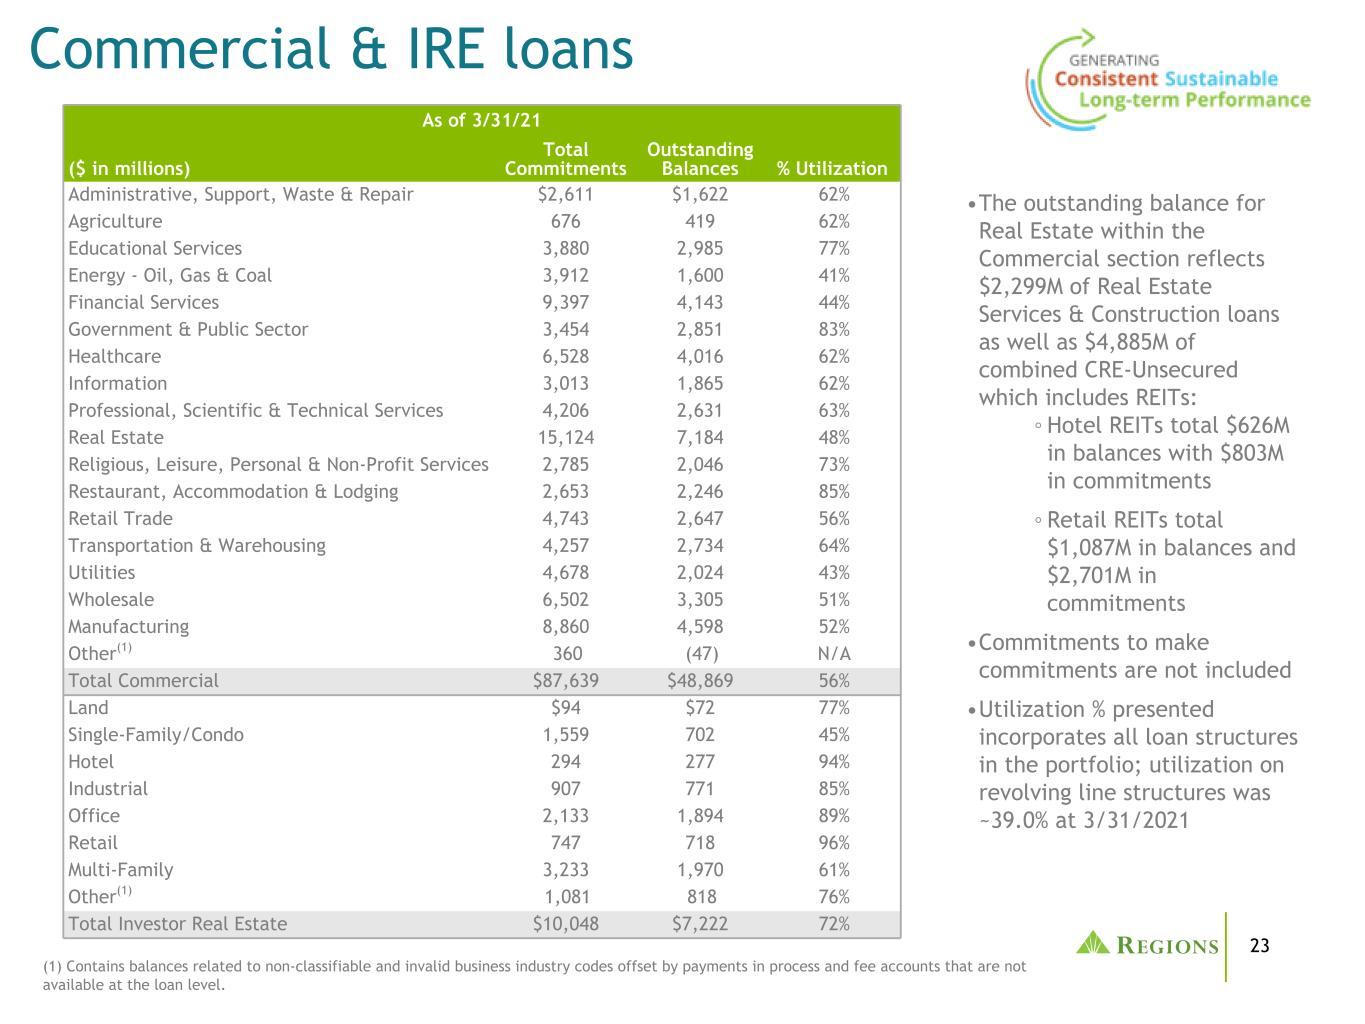
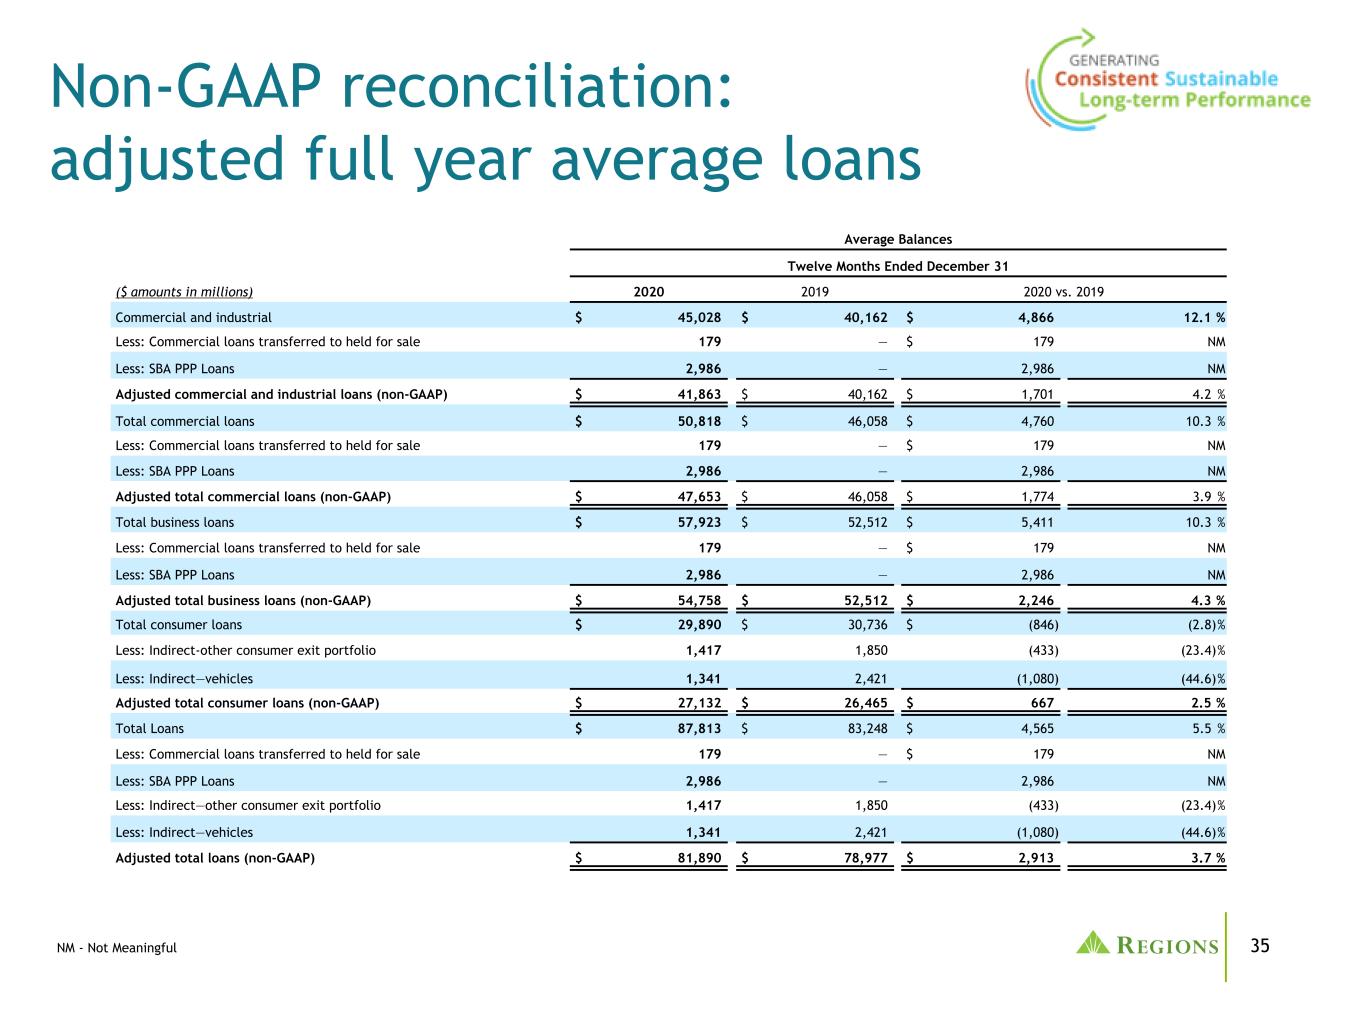
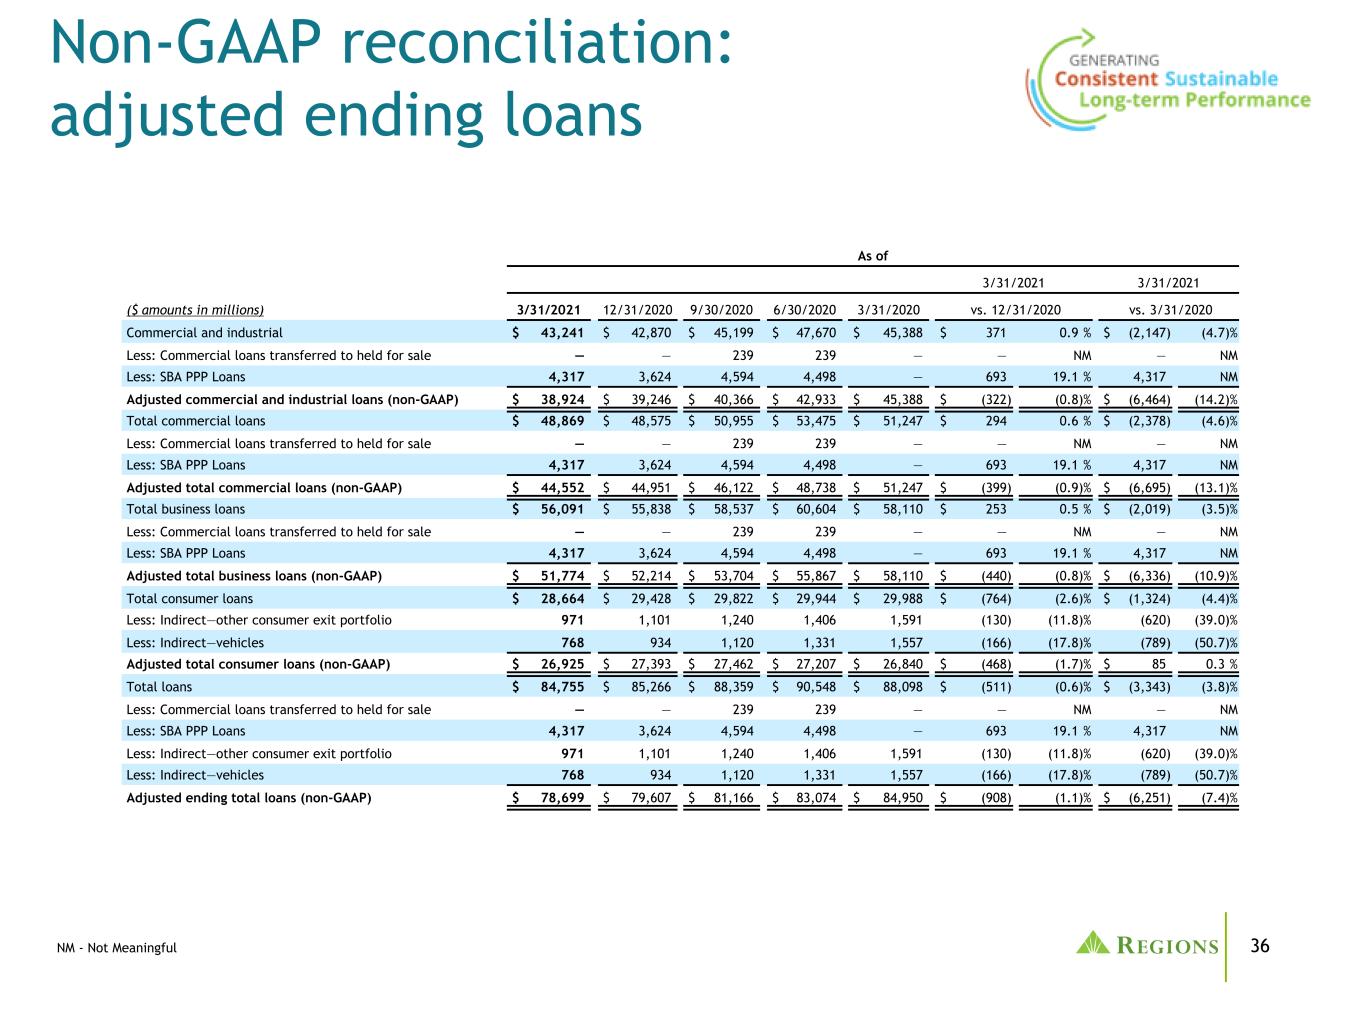
Average loans and leases decreased approximately 2 percent compared to the prior quarter. Excluding the company's indirect auto and indirect-other consumer exit portfolios, outstanding PPP loans, and certain commercial loans transferred to held for sale during the fourth quarter of 2020, adjusted average loans and leases(1) decreased approximately 1 percent. Adjusted business lending(1) decreased 1 percent driven by excess liquidity, customers' continued use of capital markets and further deleveraging. Commercial loan line utilization levels ended the quarter at approximately 39 percent, well below pre-pandemic trends. Excluding exit portfolios,
adjusted consumer lending(1) decreased 1 percent as growth in residential first mortgage was offset by declines in other categories.
Deposits
| | | | | | | | | | | | | | | | | | | | | | | | | | | | | | | | | | | | | | | | | | | | |
| | Average Balances |
| | | | | | | | | | |
| ($ amounts in millions) | | 1Q21 | | 4Q20 | | 1Q20 | | 1Q21 vs. 4Q20 | | 1Q21 vs. 1Q20 |
| Customer low-cost deposits | | $ | 117,775 | | | $ | 114,158 | | | $ | 87,451 | | | $ | 3,617 | | | 3.2% | | $ | 30,324 | | | 34.7% |
| Customer time deposits | | 5,158 | | | 5,598 | | | 7,302 | | | (440) | | | (7.9)% | | (2,144) | | | (29.4)% |
| Corporate treasury time deposits | | 4 | | | 11 | | | 280 | | | (7) | | | (63.6)% | | (276) | | | (98.6)% |
| Corporate treasury other deposits | | — | | | — | | | 639 | | | — | | | NM | | (639) | | | (100.0)% |
| Total Deposits | | $ | 122,937 | | | $ | 119,767 | | | $ | 95,672 | | | $ | 3,170 | | | 2.6% | | $ | 27,265 | | | 28.5% |
| | | | | | | | | | | | | | |
| ($ amounts in millions) | | 1Q21 | | 4Q20 | | 1Q20 | | 1Q21 vs. 4Q20 | | 1Q21 vs. 1Q20 |
| Consumer Bank Segment | | $ | 72,949 | | | $ | 69,912 | | | $ | 59,711 | | | $ | 3,037 | | | 4.3% | | $ | 13,238 | | | 22.2% |
| Corporate Bank Segment | | 40,285 | | | 40,581 | | | 26,618 | | | (296) | | | (0.7)% | | 13,667 | | | 51.3% |
| Wealth Management Segment | | 9,281 | | | 8,884 | | | 8,073 | | | 397 | | | 4.5% | | 1,208 | | | 15.0% |
| Other | | 422 | | | 390 | | | 1,270 | | | 32 | | | 8.2% | | (848) | | | (66.8)% |
| Total Deposits | | $ | 122,937 | | | $ | 119,767 | | | $ | 95,672 | | | $ | 3,170 | | | 2.6% | | $ | 27,265 | | | 28.5% |
| | | | | | | | | | | | | | |
Total average deposit balances increased 3 percent to a new record high in the first quarter of 2021. Growth was led by the Consumer segment reflecting the impact from recent government stimulus payments.
Asset quality | | | | | | | | | | | | | | | | | | | | |
| | As of and for the Quarter Ended |
| ($ amounts in millions) | | 3/31/2021 | | 12/31/2020 | | 3/31/2020 |
| ACL/Loans, net | | 2.44% | | 2.69% | | 1.89% |
| ALL/Loans, net | | 2.33% | | 2.54% | | 1.77% |
| Allowance for credit losses to non-performing loans, excluding loans held for sale | | 280% | | 308% | | 261% |
| Allowance for loan losses to non-performing loans, excluding loans held for sale | | 268% | | 291% | | 244% |
| Provision for (benefit from) credit losses | | $(142) | | $(38) | | $373 |
| Net loans charged-off | | $83 | | $94 | | $123 |
| Net loan charge-offs as a % of average loans, annualized | | 0.40% | | 0.43% | | 0.59% |
| Non-accrual loans, excluding loans held for sale/Loans, net | | 0.87% | | 0.87% | | 0.72% |
| NPAs (ex. 90+ past due)/Loans, foreclosed properties, non-marketable investments and non-performing loans held for sale | | 0.90% | | 0.91% | | 0.79% |
| NPAs (inc. 90+ past due)/Loans, foreclosed properties, non-marketable investments and non-performing loans held for sale* | | 1.09% | | 1.10% | | 0.96% |
| Total TDRs, excluding loans held for sale | | $577 | | $602 | | $599 |
Total Criticized Loans—Business Services** | | $3,756 | | $3,800 | | $2,524 |
* Excludes guaranteed residential first mortgages that are 90+ days past due and still accruing.
** Business services represents the combined total of commercial and investor real estate loans.
Improvement in macroeconomic variables, recent government stimulus programs, as well as credit metrics continuing to perform better than anticipated, resulted in a net $142 million benefit to the credit loss provision during the first quarter of 2021. The resulting allowance for credit losses was equal to 2.44 percent of total loans and 280 percent of total non-accrual loans, excluding loans held for sale. Excluding PPP loans, which are fully government guaranteed, the allowance for credit losses amounted to 2.57 percent(1) of total loans. Annualized net charge-offs decreased 3 basis points to 40 basis points of average loans. The decrease reflects broad-based improvement across the commercial and consumer loan portfolios. Total non-accrual loans, excluding loans held for sale, total delinquencies, and total business services criticized loans all declined modestly.
Capital and liquidity | | | | | | | | | | | | | | | | | | | | |
| | As of and for Quarter Ended |
| | 3/31/2021 | | 12/31/2020 | | 3/31/2020 |
| | | | | | |
Common Equity Tier 1 ratio(2) | | 10.3% | | 9.8% | | 9.4% |
Tier 1 capital ratio(2) | | 11.9% | | 11.4% | | 10.6% |
Tangible common stockholders’ equity to tangible assets (non-GAAP)(1) | | 7.43% | | 7.91% | | 8.68% |
Tangible common book value per share (non-GAAP)(1)* | | $11.46 | | $11.71 | | $11.67 |
| Loans, net of unearned income, to total deposits | | 65.4% | | 69.6% | | 88.1% |
* Tangible common book value per share includes the impact of quarterly earnings and changes to market value adjustments within accumulated other comprehensive income, as well as continued capital returns.
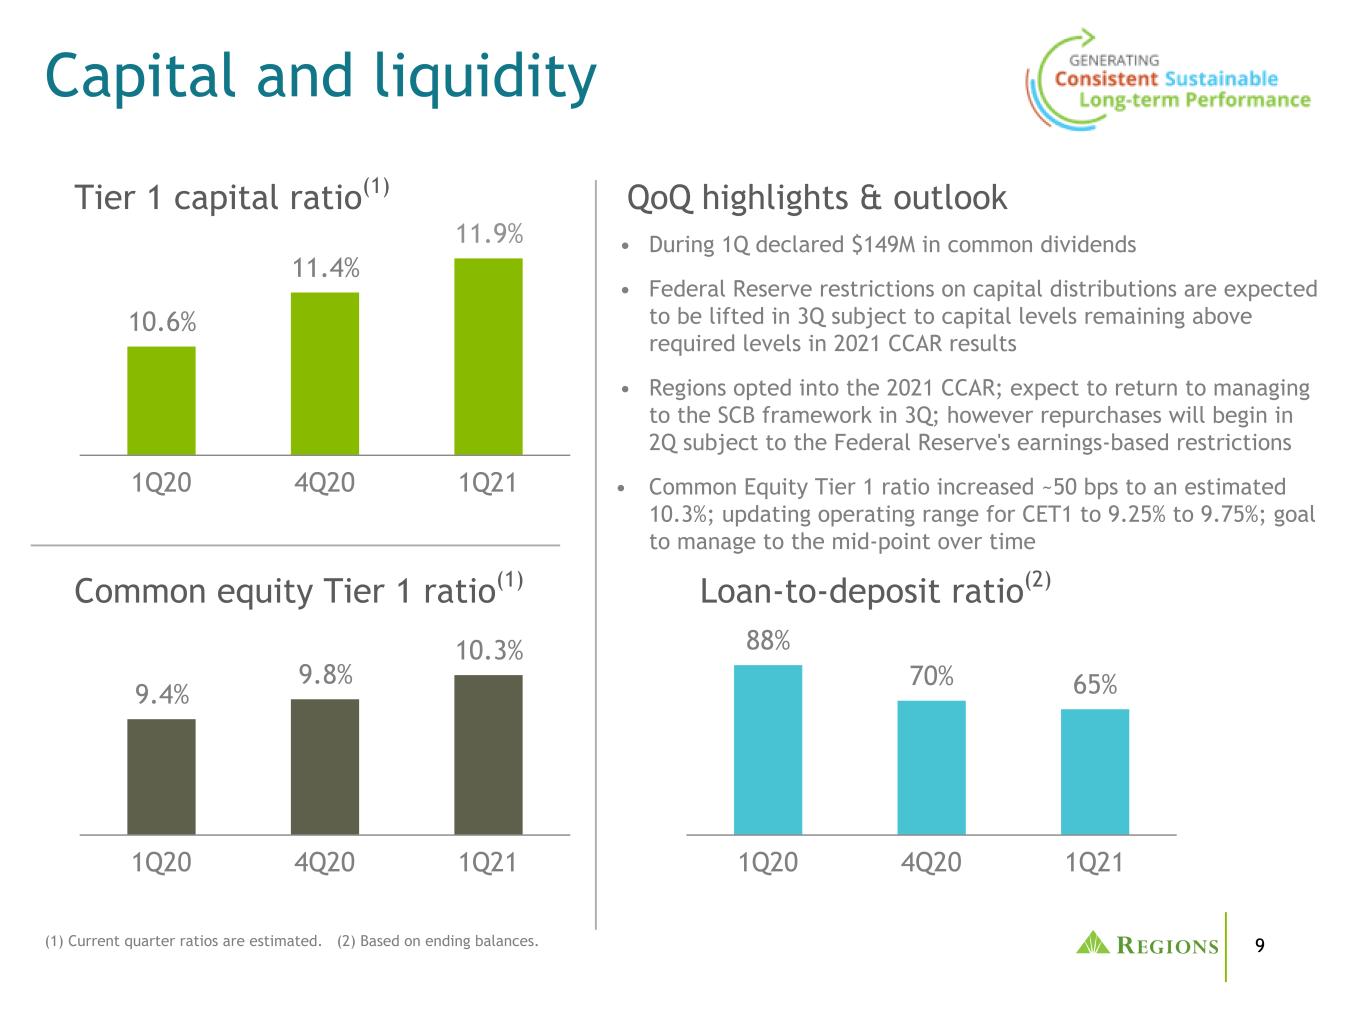
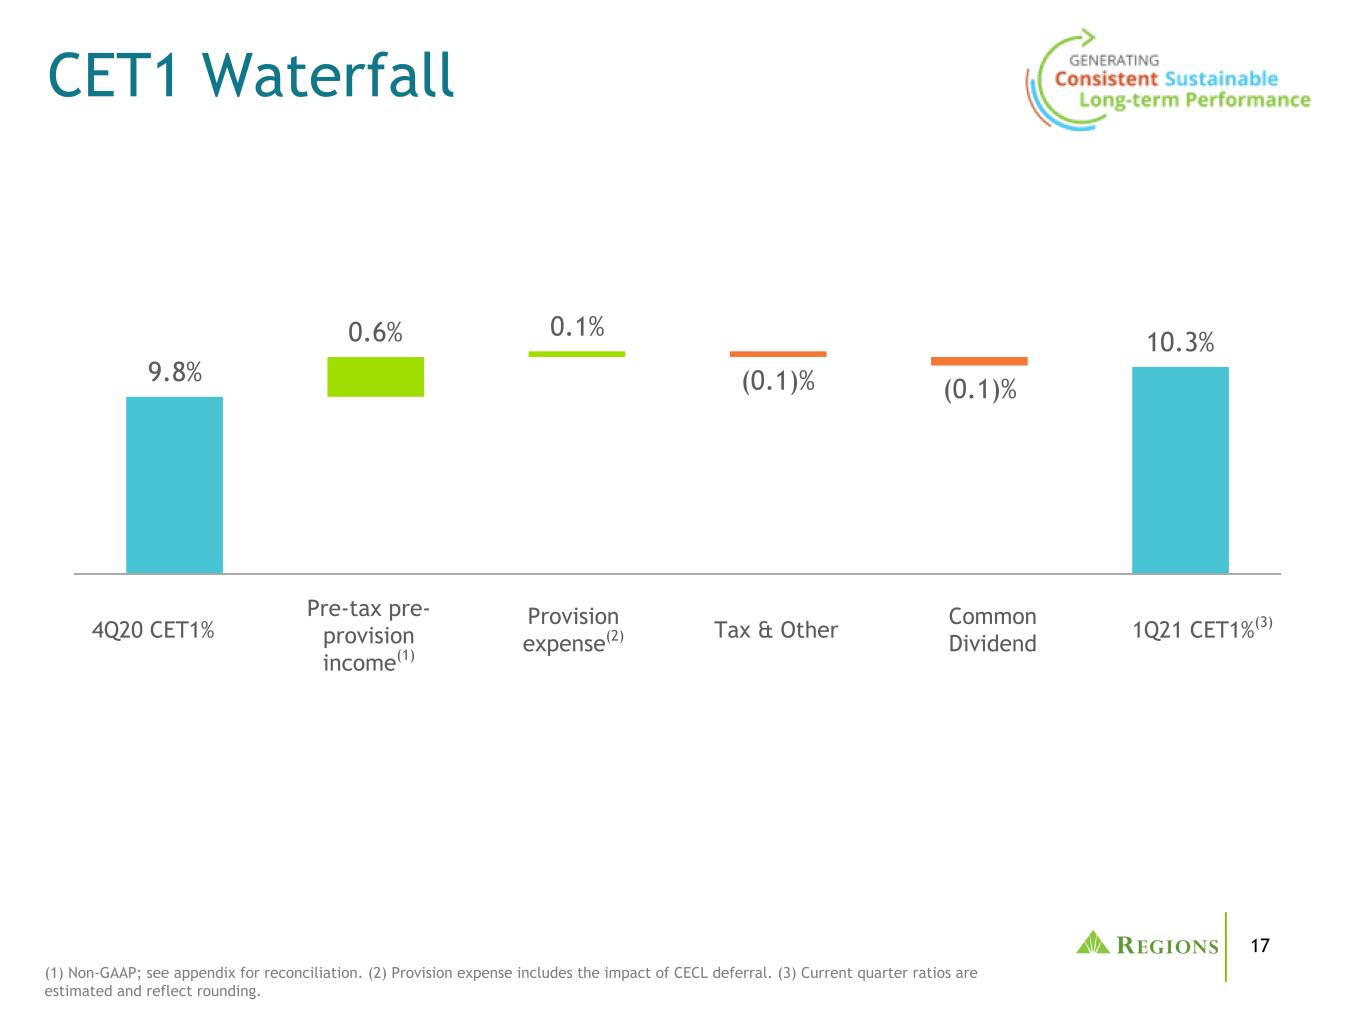
Regions maintains a solid capital position as estimated capital ratios remain well above current regulatory requirements. The Tier 1(2) and Common Equity Tier 1(2) ratios were estimated at 11.9 percent and 10.3 percent, respectively, at quarter-end.
The company declared $149 million in dividends to common shareholders during the first quarter of 2021. The company did not repurchase shares in the quarter.
Although not required, the company will participate in the Federal Reserve Supervisory Stress Test administered during the first half of 2021. During the Supervisory Stress Test Resubmission, results of which were received in December, Regions exceeded all minimum capital levels under the provided scenarios. Regions' robust capital planning process is designed to ensure efficient use of capital to support lending activities and appropriate shareholder returns.
(1)Non-GAAP; refer to pages 5, 6, 9, 10, 12, 16, 18 and 21 of the financial supplement to this earnings release.
(2)Current quarter Common Equity Tier 1, and Tier 1 capital ratios are estimated.
Conference Call
In addition to the live audio webcast at 10 a.m. ET on April 23, 2021, an archived recording of the webcast will be available at the Investor Relations page of www.regions.com following the live event. A replay of the earnings call will also be available beginning Friday, April 23, 2021, at 2:30 p.m. ET through Sunday, May 23, 2021. To listen by telephone, please dial 855-859-2056, and use access code 8791000.
About Regions Financial Corporation
Regions Financial Corporation (NYSE:RF), with $153 billion in assets, is a member of the S&P 500 Index and is one of the nation’s largest full-service providers of consumer and commercial banking, wealth management, and mortgage products and services. Regions serves customers across the South, Midwest and Texas, and through its subsidiary, Regions Bank, operates more than 1,300 banking offices and approximately 2,000 ATMs. Regions Bank is an Equal Housing Lender and Member FDIC. Additional information about Regions and its full line of products and services can be found at www.regions.com.
Forward-Looking Statements
This release may include forward-looking statements as defined in the Private Securities Litigation Reform Act of 1995. Forward-looking statements are not based on historical information, but rather are related to future operations, strategies, financial results or other developments. Forward-looking statements are based on management’s current expectations as well as certain assumptions and estimates made by, and information available to, management at the time the statements are made. Those statements are based on general assumptions and are subject to various risks, and because they also relate to the future they are likewise subject to inherent uncertainties and other factors that may cause actual results to differ materially from the views, beliefs and projections expressed in such statements. Therefore, we caution you against relying on any of these forward-looking statements. These risks, uncertainties and other factors include, but are not limited to, those described below:
•Current and future economic and market conditions in the United States generally or in the communities we serve (in particular the Southeastern United States), including the effects of possible declines in property values, increases in unemployment rates, financial market disruptions and potential reductions of economic growth, which may adversely affect our lending and other businesses and our financial results and conditions.
•Possible changes in trade, monetary and fiscal policies of, and other activities undertaken by, governments, agencies, central banks and similar organizations, which could have a material adverse effect on our earnings.
•Possible changes in market interest rates or capital markets could adversely affect our revenue and expense, the value of assets and obligations, and the availability and cost of capital and liquidity.
•The impact of pandemics, including the ongoing COVID-19 pandemic, on our businesses, operations, and financial results and conditions.The duration and severity of the ongoing COVID-19 pandemic, which has disrupted the global economy, has and could continue to adversely affect our capital and liquidity position, impair the ability of borrowers to repay outstanding loans and increase our allowance for credit losses, impair collateral values, and result in lost revenue or additional expenses. The pandemic could also cause an outflow of deposits, result in goodwill impairment charges and the impairment of other financial and nonfinancial assets, and increase our cost of capital.
•Any impairment of our goodwill or other intangibles, any repricing of assets, or any adjustment of valuation allowances on our deferred tax assets due to changes in law, adverse changes in the economic environment, declining operations of the reporting unit or other factors.
•The effect of changes in tax laws, including the effect of any future interpretations of or amendments to Tax Reform, which may impact our earnings, capital ratios and our ability to return capital to shareholders.
•Possible changes in the creditworthiness of customers and the possible impairment of the collectability of loans and leases, including operating leases.
•Changes in the speed of loan prepayments, loan origination and sale volumes, charge-offs, credit loss provisions or actual credit losses where our allowance for credit losses may not be adequate to cover our eventual losses.
•Possible acceleration of prepayments on mortgage-backed securities due to low interest rates, and the related acceleration of premium amortization on those securities.
•Loss of customer checking and savings account deposits as customers pursue other, higher-yield investments, which could increase our funding costs.
•Possible changes in consumer and business spending and saving habits and the related effect on our ability to increase assets and to attract deposits, which could adversely affect our net income.
•Our ability to effectively compete with other traditional and non-traditional financial services companies, including fintechs, some of whom possess greater financial resources than we do or are subject to different regulatory standards than we are.
•Our inability to develop and gain acceptance from current and prospective customers for new products and services and the enhancement of existing products and services to meet customers’ needs and respond to emerging technological trends in a timely manner could have a negative impact on our revenue.
•Our inability to keep pace with technological changes, including those related to the offering of digital banking and financial services, could result in losing business to competitors.
•Changes in laws and regulations affecting our businesses, including legislation and regulations relating to bank products and services, as well as changes in the enforcement and interpretation of such laws and regulations by applicable governmental and self-regulatory agencies, including
as a result of the recent change in U.S. presidential administration and control of the U.S. Congress, which could require us to change certain business practices, increase compliance risk, reduce our revenue, impose additional costs on us, or otherwise negatively affect our businesses.
•Our capital actions, including dividend payments, common stock repurchases, or redemptions of preferred stock or other regulatory capital instruments, must not cause us to fall below minimum capital ratio requirements, with applicable buffers taken into account, and must comply with other requirements and restrictions under law or imposed by our regulators, which may impact our ability to return capital to shareholders.
•Our ability to comply with stress testing and capital planning requirements (as part of the CCAR process or otherwise) may continue to require a significant investment of our managerial resources due to the importance of such tests and requirements.
•Our ability to comply with applicable capital and liquidity requirements (including, among other things, the Basel III capital standards), including our ability to generate capital internally or raise capital on favorable terms, and if we fail to meet requirements, our financial condition and market perceptions of us could be negatively impacted.
•The effects of any developments, changes or actions relating to any litigation or regulatory proceedings brought against us or any of our subsidiaries.
•The costs, including possibly incurring fines, penalties, or other negative effects (including reputational harm) of any adverse judicial, administrative, or arbitral rulings or proceedings, regulatory enforcement actions, or other legal actions to which we or any of our subsidiaries are a party, and which may adversely affect our results.
•Our ability to manage fluctuations in the value of assets and liabilities and off-balance sheet exposure so as to maintain sufficient capital and liquidity to support our business.
•Our ability to execute on our strategic and operational plans, including our ability to fully realize the financial and nonfinancial benefits relating to our strategic initiatives.
•The risks and uncertainties related to our acquisition or divestiture of businesses.
•The success of our marketing efforts in attracting and retaining customers.
•Our ability to recruit and retain talented and experienced personnel to assist in the development, management and operation of our products and services may be affected by changes in laws and regulations in effect from time to time.
•Fraud or misconduct by our customers, employees or business partners.
•Any inaccurate or incomplete information provided to us by our customers or counterparties.
•Inability of our framework to manage risks associated with our business such as credit risk and operational risk, including third-party vendors and other service providers, which could, among other things, result in a breach of operating or security systems as a result of a cyber attack or similar act or failure to deliver our services effectively.
•Dependence on key suppliers or vendors to obtain equipment and other supplies for our business on acceptable terms.
•The inability of our internal controls and procedures to prevent, detect or mitigate any material errors or fraudulent acts.
•The effects of geopolitical instability, including wars, conflicts, civil unrest, and terrorist attacks and the potential impact, directly or indirectly, on our businesses.
•The effects of man-made and natural disasters, including fires, floods, droughts, tornadoes, hurricanes, and environmental damage (specifically in the Southeastern United States), which may negatively affect our operations and/or our loan portfolios and increase our cost of conducting business. The severity and impact of future earthquakes, fires, hurricanes, tornadoes, droughts, floods and other weather-related events are difficult to predict and may be exacerbated by global climate change.
•Changes in commodity market prices and conditions could adversely affect the cash flows of our borrowers operating in industries that are impacted by changes in commodity prices (including businesses indirectly impacted by commodities prices such as businesses that transport commodities or manufacture equipment used in the production of commodities), which could impair their ability to service any loans outstanding to them and/or reduce demand for loans in those industries.
•Our ability to identify and address cyber-security risks such as data security breaches, malware, ransomware,“denial of service” attacks, “hacking” and identity theft, including account take-overs, a failure of which could disrupt our business and result in the disclosure of and/or misuse or misappropriation of confidential or proprietary information, disruption or damage to our systems, increased costs, losses, or adverse effects to our reputation.
•Our ability to achieve our expense management initiatives.
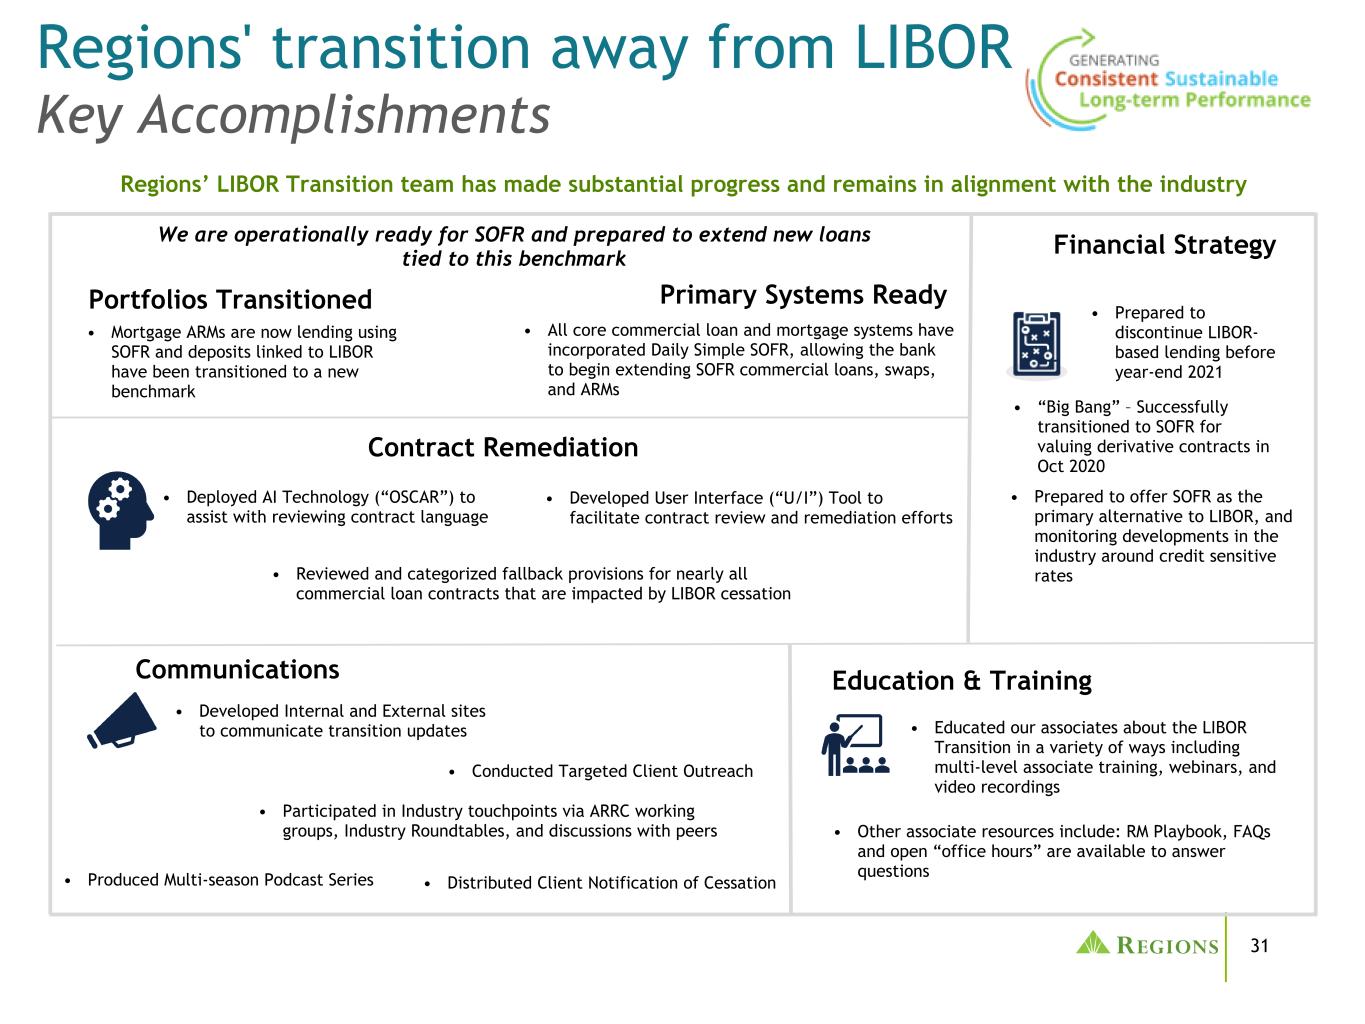
•Market replacement of LIBOR and the related effect on our LIBOR-based financial products and contracts, including, but not limited to, derivative products, debt obligations, deposits, investments, and loans.
•Possible downgrades in our credit ratings or outlook could, among other negative impacts, increase the costs of funding from capital markets.
•The effects of a possible downgrade in the U.S. government’s sovereign credit rating or outlook, which could result in risks to us and general economic conditions that we are not able to predict.
•The effects of problems encountered by other financial institutions that adversely affect us or the banking industry generally could require us to change certain business practices, reduce our revenue, impose additional costs on us, or otherwise negatively affect our businesses.
•The effects of the failure of any component of our business infrastructure provided by a third party could disrupt our businesses, result in the disclosure of and/or misuse of confidential information or proprietary information, increase our costs, negatively affect our reputation, and cause losses.
•Our ability to receive dividends from our subsidiaries could affect our liquidity and ability to pay dividends to shareholders.
•Changes in accounting policies or procedures as may be required by the FASB or other regulatory agencies could materially affect our financial statements and how we report those results, and expectations and preliminary analyses relating to how such changes will affect our financial results could prove incorrect.
•Other risks identified from time to time in reports that we file with the SEC.
•Fluctuations in the price of our common stock and inability to complete stock repurchases in the time frame and/or on the terms anticipated.
•The effects of any damage to our reputation resulting from developments related to any of the items identified above.
The foregoing list of factors is not exhaustive. For discussion of these and other factors that may cause actual results to differ from expectations, look under the captions “Forward-Looking Statements” and “Risk Factors” of Regions’ Annual Report on Form 10-K for the year ended December 31, 2020 as filed with the SEC.
Further, statements about the potential effects of the COVID-19 pandemic on our businesses and financial results and conditions may constitute forward-looking statements and are subject to the risk that the actual effects may differ, possibly materially, from what is reflected in those forward-looking statements due to factors and future developments that are uncertain, unpredictable and in many cases beyond our control, including the scope and duration of the pandemic (including any second wave or resurgences), actions taken by governmental authorities in response to the pandemic, and the direct and indirect impact of the pandemic on our customers, third parties and us.
The words "future," “anticipates,” "assumes," “intends,” “plans,” “seeks,” “believes,” "predicts," "potential," "objectives," “estimates,” “expects,” “targets,” “projects,” “outlook,” “forecast,” "would," “will,” “may,” “might,” “could,” “should,” “can,” and similar terms and expressions often signify forward-looking statements. You should not place undue reliance on any forward-looking statements, which speak only as of the date made. Factors or events that could cause our actual results to differ may emerge from time to time, and it is not possible to predict all of them. We assume no obligation and do not intend to update or revise any forward-looking statements that are made from time to time, either as a result of future developments, new information or otherwise, except as may be required by law.
Regions’ Investor Relations contact is Dana Nolan at (205) 264-7040; Regions’ Media contact is Jeremy King at (205) 264-4551.
Use of non-GAAP financial measures
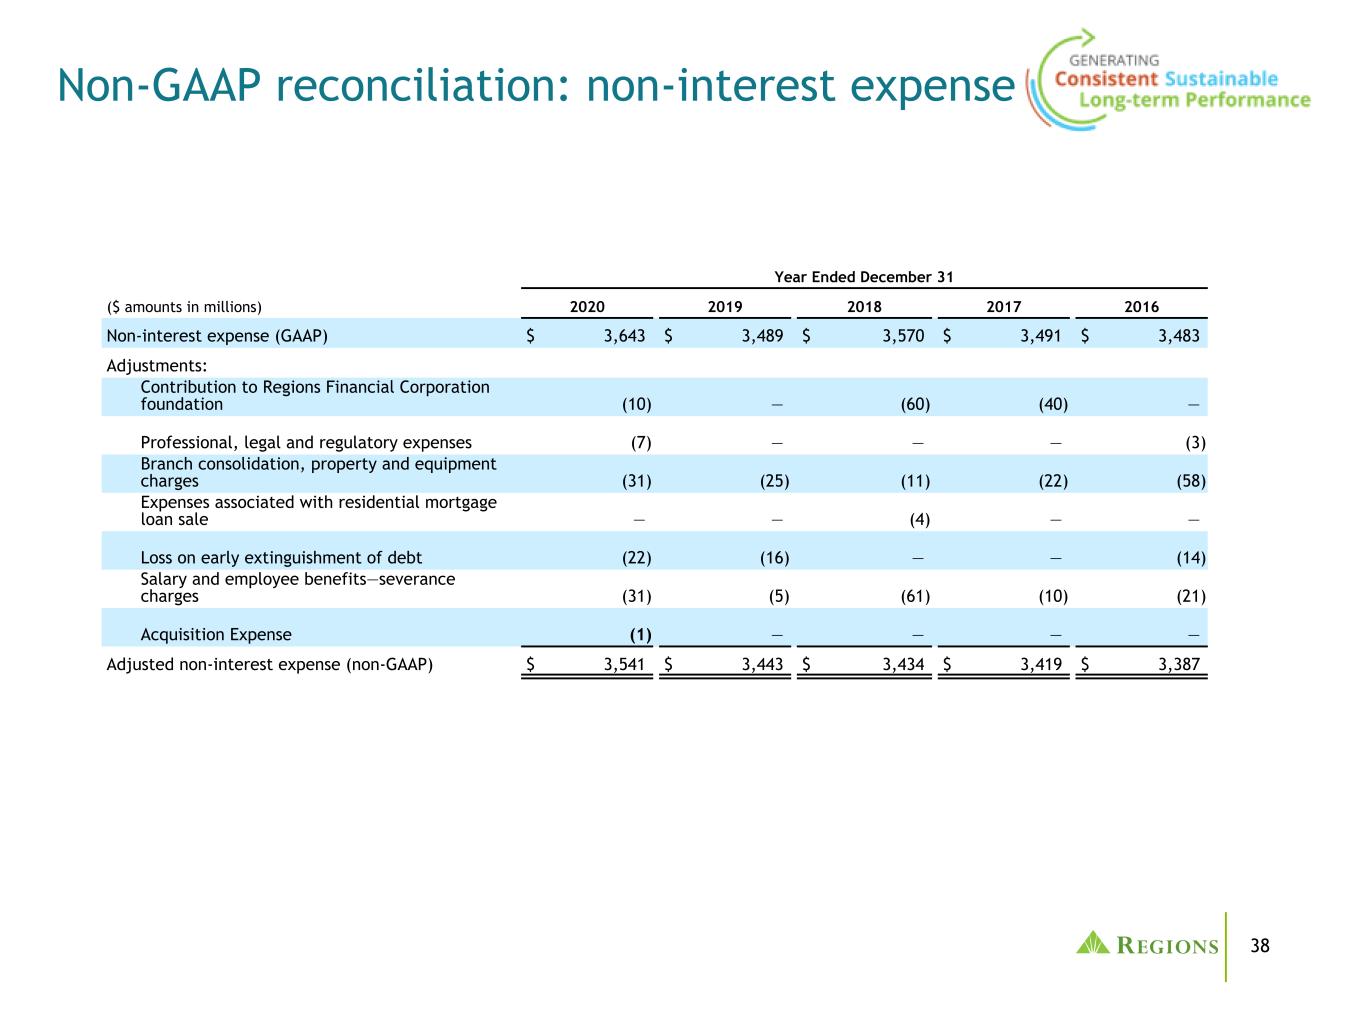
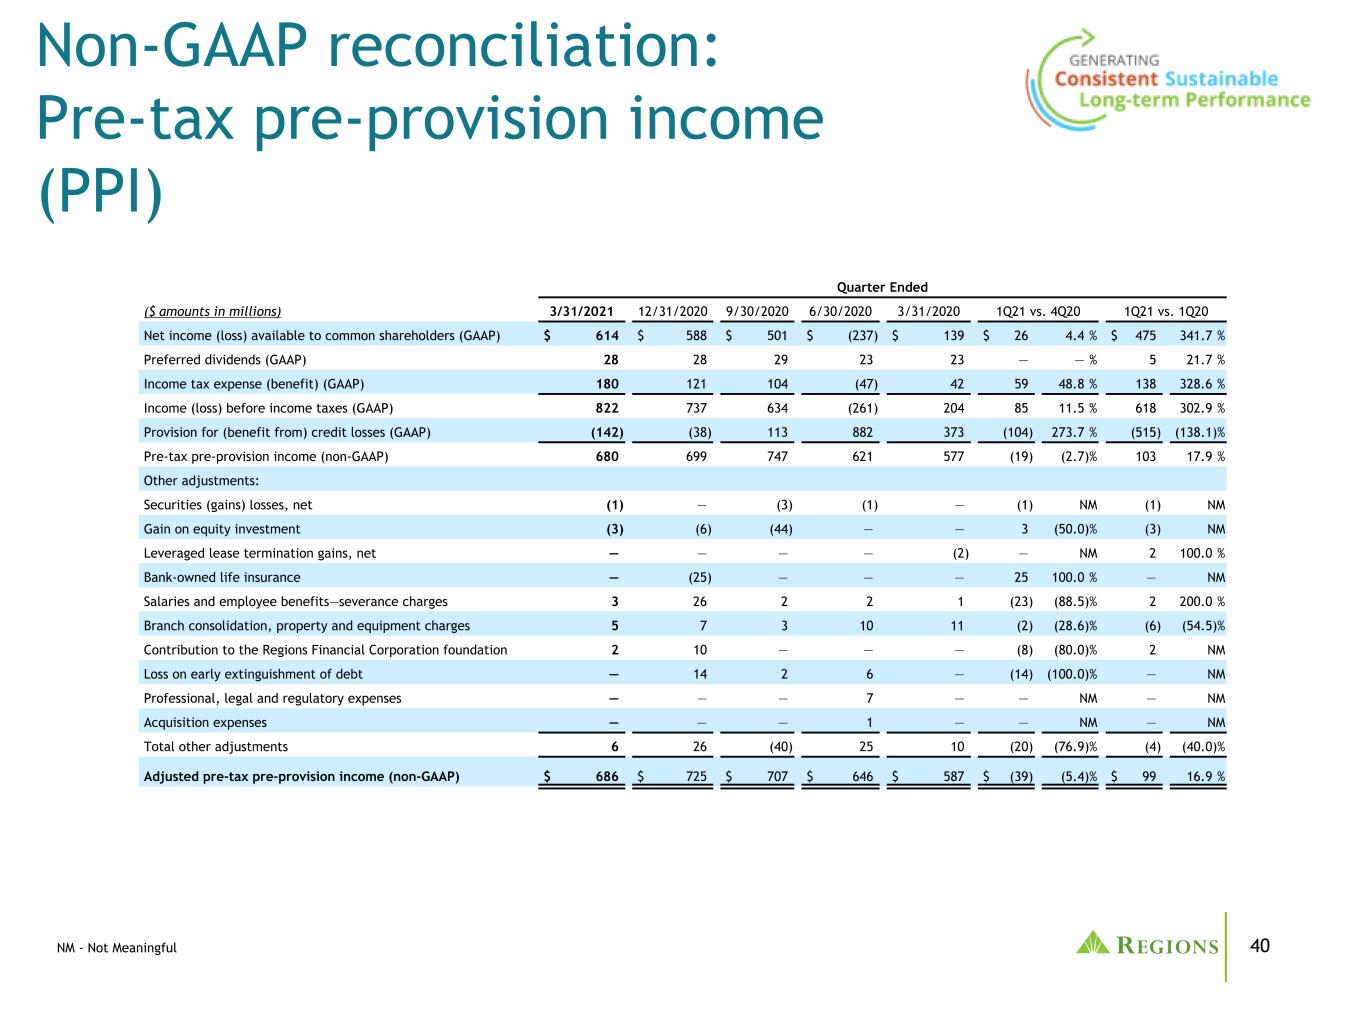
Management uses pre-tax pre-provision income (non-GAAP) and adjusted pre-tax pre-provision income (non-GAAP), as well as the adjusted efficiency ratio (non-GAAP) and the adjusted fee income ratio (non-GAAP) to monitor performance and believes these measures provide meaningful information to investors. Non-interest expense (GAAP) is presented excluding certain adjustments to arrive at adjusted non-interest expense (non-GAAP), which is the numerator for the efficiency ratio. Non-interest income (GAAP) is presented excluding certain adjustments to arrive at adjusted non-interest income (non-GAAP), which is the numerator for the fee income ratio. Adjusted non-interest income (non-GAAP) and adjusted non-interest expense (non-GAAP) are used to determine adjusted pre-tax pre-provision income (non-GAAP). Net interest income (GAAP) on a taxable-equivalent basis and non-interest income are added together to arrive at total revenue on a taxable-equivalent basis. Adjustments are made to arrive at adjusted total revenue on a taxable-equivalent basis (non-GAAP), which is the denominator for the fee income and efficiency ratios. Regions believes that the exclusion of these adjustments provides a meaningful basis for period-to-period comparisons, which management believes will assist investors in analyzing the operating results of the Company and predicting future performance. These non-GAAP financial measures are also used by management to assess the performance of Regions’ business. It is possible that the activities related to the adjustments may recur; however, management does not consider the activities related to the adjustments to be indications of ongoing operations. Regions believes that presentation of these non-GAAP financial measures will permit investors to assess the performance of the Company on the same basis as that applied by management.
The allowance for credit losses (ACL) as a percentage of total loans is an important ratio, especially during periods of economic stress. Management believes this ratio provides investors with meaningful additional information about credit loss allowance levels when the impact of SBA's Paycheck Protection Program loans, which are fully backed by the U.S. government, and any related allowance are excluded from total loans and total allowance which are the denominator and numerator, respectively, used in the ACL ratio. This adjusted ACL ratio represents a non-GAAP financial measure.
Tangible common stockholders’ equity ratios have become a focus of some investors and management believes they may assist investors in analyzing the capital position of the Company absent the effects of intangible assets and preferred stock. Analysts and banking regulators have assessed Regions’ capital adequacy using the tangible common stockholders’ equity measure. Because tangible common stockholders’ equity is not formally defined by GAAP or prescribed in any amount by federal banking regulations it is currently considered to be a non-GAAP financial measure and other entities may calculate it differently than Regions’ disclosed calculations. Since analysts and banking regulators may assess Regions’ capital adequacy using tangible common stockholders’ equity, management believes that it is useful to provide investors the ability to assess Regions’ capital adequacy on this same basis.
Non-GAAP financial measures have inherent limitations, are not required to be uniformly applied and are not audited. Although these non-GAAP financial measures are frequently used by stakeholders in the evaluation of a company, they have limitations as analytical tools, and should not be considered in isolation, or as a substitute for analyses of results as reported under GAAP. In particular, a measure of earnings that excludes selected items does not represent the amount that effectively accrues directly to stockholders.
Management and the Board of Directors utilize non-GAAP measures as follows:
•Preparation of Regions' operating budgets
•Monthly financial performance reporting
•Monthly close-out reporting of consolidated results (management only)
•Presentation to investors of company performance
•Metrics for incentive compensation
Exhibit 99.2
Regions Financial Corporation and Subsidiaries
Financial Supplement
First Quarter 2021
Regions Financial Corporation and Subsidiaries
Financial Supplement to First Quarter 2021 Earnings Release
Table of Contents
| | | | | | | | |
| | |
| | | Page |
| |
| Financial Highlights | | |
| |
| Selected Ratios and Other Information | | |
| |
| Consolidated Statements of Operations | | |
| |
| Consolidated Average Daily Balances and Yield / Rate Analysis | | |
| |
| Pre-Tax Pre-Provision Income ("PPI") and Adjusted PPI | | |
| |
| Non-Interest Income, Mortgage Income, Wealth Management Income and Capital Markets Income | | |
| |
| Non-Interest Expense | | |
| |
| Reconciliation to GAAP Financial Measures | | |
| Adjusted Efficiency Ratios, Adjusted Fee Income Ratios, Adjusted Non-Interest Income / Expense, Adjusted Operating Leverage Ratios, and Return Ratios | | |
| |
| Credit Quality | | |
| Allowance for Credit Losses, Net Charge-Offs and Related Ratios | | |
| Non-Accrual Loans (excludes loans held for sale), Early and Late Stage Delinquencies | | |
| Troubled Debt Restructurings | | |
| |
| Consolidated Balance Sheets | | |
| |
| Loans | | |
| |
| Deposits | | |
| |
| Reconciliation to GAAP Financial Measures | | |
| Tangible Common Ratios | | |
| |
| Forward-Looking Statements | | |
Regions Financial Corporation and Subsidiaries
Financial Supplement to First Quarter 2021 Earnings Release
Financial Highlights
| | | | | | | | | | | | | | | | | | | | | | | | | | | | | |
| Quarter Ended |
| ($ amounts in millions, except per share data) | 3/31/2021 | | 12/31/2020 | | 9/30/2020 | | 6/30/2020 | | 3/31/2020 |
| Earnings Summary | | | | | | | | | |
| Interest income - taxable equivalent | $ | 1,024 | | | $ | 1,072 | | | $ | 1,071 | | | $ | 1,076 | | | $ | 1,091 | |
| Interest expense - taxable equivalent | 46 | | | 55 | | | 71 | | | 91 | | | 151 | |
| | | | | | | | | |
| Net interest income - taxable equivalent | 978 | | | 1,017 | | | 1,000 | | | 985 | | | 940 | |
| Less: Taxable-equivalent adjustment | 11 | | | 11 | | | 12 | | | 13 | | | 12 | |
| Net interest income | 967 | | | 1,006 | | | 988 | | | 972 | | | 928 | |
| Provision for (benefit from) credit losses | (142) | | | (38) | | | 113 | | | 882 | | | 373 | |
| Net interest income after provision for (benefit from) credit losses | 1,109 | | | 1,044 | | | 875 | | | 90 | | | 555 | |
| Non-interest income | 641 | | | 680 | | | 655 | | | 573 | | | 485 | |
| Non-interest expense | 928 | | | 987 | | | 896 | | | 924 | | | 836 | |
| Income (loss) before income taxes | 822 | | | 737 | | | 634 | | | (261) | | | 204 | |
| Income tax expense (benefit) | 180 | | | 121 | | | 104 | | | (47) | | | 42 | |
| | | | | | | | | |
| | | | | | | | | |
| | | | | | | | | |
| | | | | | | | | |
| Net income (loss) | $ | 642 | | | $ | 616 | | | $ | 530 | | | $ | (214) | | | $ | 162 | |
| | | | | | | | | |
| Net income (loss) available to common shareholders | $ | 614 | | | $ | 588 | | | $ | 501 | | | $ | (237) | | | $ | 139 | |
| | | | | | | | | |
| | | | | | | | | |
| | | | | | | | | |
| Earnings (loss) per common share - basic | 0.64 | | | 0.61 | | | 0.52 | | | (0.25) | | | 0.15 | |
| Earnings (loss) per common share - diluted | 0.63 | | | 0.61 | | | 0.52 | | | (0.25) | | | 0.14 | |
| | | | | | | | | |
| Balance Sheet Summary | | | | | | | | | |
| At quarter-end | | | | | | | | | |
| Loans, net of unearned income | $ | 84,755 | | | $ | 85,266 | | | $ | 88,359 | | | $ | 90,548 | | | $ | 88,098 | |
| Allowance for credit losses | (2,068 | ) | | (2,293 | ) | | (2,425 | ) | | (2,425 | ) | | (1,665 | ) |
| Assets | 153,331 | | | 147,389 | | | 145,180 | | | 144,070 | | | 133,542 | |
| Deposits | 129,602 | | | 122,479 | | | 118,445 | | | 116,779 | | | 100,030 | |
| Long-term borrowings - Federal Home Loan Bank advances | — | | | — | | | — | | | 401 | | | 4,651 | |
| Long-term borrowings - Other | 2,916 | | | 3,569 | | | 4,919 | | | 6,007 | | | 5,454 | |
| Shareholders' equity | 17,862 | | | 18,111 | | | 17,904 | | | 17,602 | | | 17,332 | |
| Average balances | | | | | | | | | |
| Loans, net of unearned income | $ | 84,755 | | | $ | 86,664 | | | $ | 89,370 | | | $ | 91,964 | | | $ | 83,249 | |
| Assets | 146,554 | | | 144,819 | | | 142,845 | | | 139,820 | | | 124,771 | |
| Deposits | 122,937 | | | 119,767 | | | 116,656 | | | 110,921 | | | 95,672 | |
| Long-term borrowings - Federal Home Loan Bank advances | — | | | — | | | 392 | | | 1,266 | | | 3,003 | |
| Long-term borrowings - Other | 3,192 | | | 4,634 | | | 5,437 | | | 6,301 | | | 5,399 | |
| Shareholders' equity | 18,038 | | | 17,915 | | | 17,759 | | | 17,384 | | | 16,460 | |
Regions Financial Corporation and Subsidiaries
Financial Supplement to First Quarter 2021 Earnings Release
Selected Ratios and Other Information
| | | | | | | | | | | | | | | | | | | | | | | | | | | | | |
| As of and for Quarter Ended |
| | 3/31/2021 | | 12/31/2020 | | 9/30/2020 | | 6/30/2020 | | 3/31/2020 |
Return on average assets* (1) | 1.78 | % | | 1.69 | % | | 1.48 | % | | (0.61) | % | | 0.52 | % |
| Return on average common shareholders' equity* | 15.20 | % | | 14.37 | % | | 12.38 | % | | (5.96) | % | | 3.69 | % |
| | | | | | | | | |
Return on average tangible common shareholders’ equity (non-GAAP)* (2) | 22.28 | % | | 21.15 | % | | 18.32 | % | | (8.90) | % | | 5.43 | % |
| | | | | | | | | |
| Efficiency ratio | 57.3 | % | | 58.1 | % | | 54.1 | % | | 59.4 | % | | 58.6 | % |
Adjusted efficiency ratio (non-GAAP) (2) | 56.8 | % | | 55.8 | % | | 55.3 | % | | 57.7 | % | | 57.9 | % |
| Common book value per share | $ | 16.87 | | | $ | 17.13 | | | $ | 16.92 | | | $ | 16.61 | | | $ | 16.73 | |
Tangible common book value per share (non-GAAP) (2) | $ | 11.46 | | | $ | 11.71 | | | $ | 11.49 | | | $ | 11.16 | | | $ | 11.67 | |
Tangible common shareholders’ equity to tangible assets (non-GAAP) (2) | 7.43 | % | | 7.91 | % | | 7.88 | % | | 7.72 | % | | 8.68 | % |
| | | | | | | | | |
Common equity (3) | $ | 10,952 | | | $ | 10,525 | | | $ | 10,092 | | | $ | 9,716 | | | $ | 10,294 | |
Total risk-weighted assets (3) | $ | 106,204 | | | $ | 106,943 | | | $ | 108,285 | | | $ | 109,539 | | | $ | 108,985 | |
Common equity Tier 1 ratio (3) | 10.3 | % | | 9.8 | % | | 9.3 | % | | 8.9 | % | | 9.4 | % |
| | | | | | | | | |
Tier 1 capital ratio (3) | 11.9 | % | | 11.4 | % | | 10.8 | % | | 10.4 | % | | 10.6 | % |
Total risk-based capital ratio (3) | 14.0 | % | | 13.6 | % | | 13.0 | % | | 12.6 | % | | 12.5 | % |
Leverage ratio (3) | 8.9 | % | | 8.7 | % | | 8.5 | % | | 8.4 | % | | 9.6 | % |
| Effective tax rate | 21.9 | % | | 16.5 | % | | 16.5 | % | | 18.3 | % | | 20.6 | % |
| | | | | | | | | |
| | | | | | | | | |
| Allowance for credit losses as a percentage of loans, net of unearned income | 2.44 | % | | 2.69 | % | | 2.74 | % | | 2.68 | % | | 1.89 | % |
Allowance for credit losses as a percentage of loans excluding PPP, net of unearned income (non-GAAP)(2) | 2.57 | % | | 2.81 | % | | 2.90 | % | | 2.82 | % | | 1.89 | % |
| Allowance for credit losses to non-performing loans, excluding loans held for sale | 280 | % | | 308 | % | | 316 | % | | 395 | % | | 261 | % |
| Net interest margin (FTE)* | 3.02 | % | | 3.13 | % | | 3.13 | % | | 3.19 | % | | 3.44 | % |
Adjusted net interest margin (FTE) (non-GAAP) (2) * | 3.40 | % | | 3.40 | % | | 3.41 | % | | 3.36 | % | | 3.44 | % |
| Loans, net of unearned income, to total deposits | 65.4 | % | | 69.6 | % | | 74.6 | % | | 77.5 | % | | 88.1 | % |
| Net charge-offs as a percentage of average loans* | 0.40 | % | | 0.43 | % | | 0.50 | % | | 0.80 | % | | 0.59 | % |
| | | | | | | | | |
| Non-accrual loans, excluding loans held for sale, as a percentage of loans | 0.87 | % | | 0.87 | % | | 0.87 | % | | 0.68 | % | | 0.72 | % |
| Non-performing assets (excluding loans 90 days past due) as a percentage of loans, foreclosed properties, non-marketable investments and non-performing loans held for sale | 0.90 | % | | 0.91 | % | | 0.90 | % | | 0.74 | % | | 0.79 | % |
Non-performing assets (including loans 90 days past due) as a percentage of loans, foreclosed properties, non-marketable investments and non-performing loans held for sale (4) | 1.09 | % | | 1.10 | % | | 1.08 | % | | 0.91 | % | | 0.96 | % |
Associate headcount—full-time equivalent (5) | 18,926 | | | 19,406 | | | 19,766 | | | 20,073 | | | 19,743 | |
| ATMs | 2,101 | | | 2,083 | | | 2,058 | | | 2,038 | | | 2,042 | |
| Branch Statistics | | | | | | | | | |
| Full service | 1,332 | | | 1,333 | | | 1,334 | | | 1,340 | | | 1,374 | |
| Drive-through/transaction service only | 34 | | | 36 | | | 47 | | | 51 | | | 53 | |
| Total branch outlets | 1,366 | | | 1,369 | | | 1,381 | | | 1,391 | | | 1,427 | |
*Annualized
(1)Calculated by dividing net income by consolidated average assets.
(2)See reconciliation of GAAP to non-GAAP Financial Measures on pages 5, 6, 9, 10, 12, 16, 18, and 21.
(3)Current quarter Common equity as well as Total risk-weighted assets, Common equity Tier 1, Tier 1 capital, Total risk-based capital and Leverage ratios are estimated.
(4)Excludes guaranteed residential first mortgages that are 90+ days past due and still accruing. Refer to the footnotes on page 13 for amounts related to these loans.
(5)Associate headcount for the second quarter of 2020 includes 463 associates from the Ascentium acquisition.
Regions Financial Corporation and Subsidiaries
Financial Supplement to First Quarter 2021 Earnings Release
Consolidated Statements of Operations (unaudited)
| | | | | | | | | | | | | | | | | | | | | | | | | | | | | |
| Quarter Ended |
| ($ amounts in millions, except per share data) | 3/31/2021 | | 12/31/2020 | | 9/30/2020 | | 6/30/2020 | | 3/31/2020 |
| Interest income on: | | | | | | | | | |
| Loans, including fees | $ | 854 | | | $ | 906 | | | $ | 903 | | | $ | 898 | | | $ | 903 | |
| Debt securities | 133 | | | 136 | | | 140 | | | 148 | | | 158 | |
| Loans held for sale | 12 | | | 9 | | | 8 | | | 6 | | | 5 | |
| | | | | | | | | |
| Other earning assets | 14 | | | 10 | | | 8 | | | 11 | | | 13 | |
| | | | | | | | | |
| Total interest income | 1,013 | | | 1,061 | | | 1,059 | | | 1,063 | | | 1,079 | |
| Interest expense on: | | | | | | | | | |
| Deposits | 19 | | | 24 | | | 32 | | | 40 | | | 84 | |
| Short-term borrowings | — | | | — | | | — | | | 2 | | | 8 | |
| Long-term borrowings | 27 | | | 31 | | | 39 | | | 49 | | | 59 | |
| Total interest expense | 46 | | | 55 | | | 71 | | | 91 | | | 151 | |
| | | | | | | | | |
| | | | | | | | | |
| Net interest income | 967 | | | 1,006 | | | 988 | | | 972 | | | 928 | |
| Provision for (benefit from) credit losses | (142) | | | (38) | | | 113 | | | 882 | | | 373 | |
| Net interest income after provision for (benefit from) credit losses | 1,109 | | | 1,044 | | | 875 | | | 90 | | | 555 | |
| Non-interest income: | | | | | | | | | |
| Service charges on deposit accounts | 157 | | | 160 | | | 152 | | | 131 | | | 178 | |
| Card and ATM fees | 115 | | | 117 | | | 115 | | | 101 | | | 105 | |
| Wealth management income | 91 | | | 89 | | | 85 | | | 79 | | | 84 | |
| Capital markets income | 100 | | | 110 | | | 61 | | | 95 | | | 9 | |
| Mortgage income | 90 | | | 75 | | | 108 | | | 82 | | | 68 | |
| Securities gains (losses), net | 1 | | | — | | | 3 | | | 1 | | | — | |
| Other | 87 | | | 129 | | | 131 | | | 84 | | | 41 | |
| Total non-interest income | 641 | | | 680 | | | 655 | | | 573 | | | 485 | |
| Non-interest expense: | | | | | | | | | |
| Salaries and employee benefits | 546 | | | 581 | | | 525 | | | 527 | | | 467 | |
| Net occupancy expense | 77 | | | 78 | | | 80 | | | 76 | | | 79 | |
| Equipment and software expense | 90 | | | 90 | | | 89 | | | 86 | | | 83 | |
| Other | 215 | | | 238 | | | 202 | | | 235 | | | 207 | |
| Total non-interest expense | 928 | | | 987 | | | 896 | | | 924 | | | 836 | |
| Income (loss) before income taxes | 822 | | | 737 | | | 634 | | | (261) | | | 204 | |
| Income tax expense (benefit) | 180 | | | 121 | | | 104 | | | (47) | | | 42 | |
| | | | | | | | | |
| | | | | | | | | |
| | | | | | | | | |
| | | | | | | | | |
| | | | | | | | | |
| Net income (loss) | $ | 642 | | | $ | 616 | | | $ | 530 | | | $ | (214) | | | $ | 162 | |
| | | | | | | | | |
| Net income (loss) available to common shareholders | $ | 614 | | | $ | 588 | | | $ | 501 | | | $ | (237) | | | $ | 139 | |
| Weighted-average shares outstanding—during quarter: | | | | | | | | | |
| Basic | 961 | | | 960 | | | 960 | | | 960 | | | 957 | |
| Diluted | 968 | | | 965 | | | 962 | | | 960 | | | 961 | |
| Actual shares outstanding—end of quarter | 961 | | | 960 | | | 960 | | | 960 | | | 957 | |
| | | | | | | | | |
| | | | | | | | | |
| | | | | | | | | |
| | | | | | | | | |
| | | | | | | | | |
| | | | | | | | | |
Earnings (loss) per common share: (1) | | | | | | | | | |
| Basic | $ | 0.64 | | | $ | 0.61 | | | $ | 0.52 | | | $ | (0.25) | | | $ | 0.15 | |
| Diluted | $ | 0.63 | | | $ | 0.61 | | | $ | 0.52 | | | $ | (0.25) | | | $ | 0.14 | |
| | | | | | | | | |
| Taxable-equivalent net interest income | $ | 978 | | | $ | 1,017 | | | $ | 1,000 | | | $ | 985 | | | $ | 940 | |
________
(1) Quarterly amounts may not add to year-to-date amounts due to rounding.
Regions Financial Corporation and Subsidiaries
Financial Supplement to First Quarter 2021 Earnings Release
`Consolidated Average Daily Balances and Yield/Rate Analysis
| | | | | | | | | | | | | | | | | | | | | | | | | | | | | | | | | | | |
| | Quarter Ended |
| | 3/31/2021 | | 12/31/2020 |
| ($ amounts in millions; yields on taxable-equivalent basis) | Average Balance | | Income/ Expense | | Yield/ Rate | | Average Balance | | Income/ Expense | | Yield/ Rate |
| Assets | | | | | | | | | | | |
| Earning assets: | | | | | | | | | | | |
| | | | | | | | | | | |
Debt securities (1) | $ | 27,180 | | | $ | 133 | | | 1.96 | % | | $ | 26,779 | | | $ | 136 | | | 2.02 | % |
| Loans held for sale | 1,603 | | | 12 | | | 3.10 | | | 1,253 | | | 9 | | | 2.62 | |
| Loans, net of unearned income: | | | | | | | | | | | |
| Commercial and industrial | 42,816 | | | 459 | | | 4.33 | | | 43,889 | | | 491 | | | 4.44 | |
| Commercial real estate mortgage—owner-occupied | 5,375 | | | 60 | | | 4.48 | | | 5,405 | | | 62 | | | 4.49 | |
| Commercial real estate construction—owner-occupied | 303 | | | 3 | | | 3.89 | | | 303 | | | 3 | | | 3.95 | |
| Commercial investor real estate mortgage | 5,375 | | | 30 | | | 2.22 | | | 5,549 | | | 32 | | | 2.22 | |
| Commercial investor real estate construction | 1,847 | | | 13 | | | 2.75 | | | 1,899 | | | 13 | | | 2.82 | |
| Residential first mortgage | 16,606 | | | 134 | | | 3.23 | | | 16,433 | | | 135 | | | 3.30 | |
| Home equity | 7,085 | | | 62 | | | 3.55 | | | 7,411 | | | 67 | | | 3.61 | |
| Indirect—vehicles | 850 | | | 7 | | | 3.24 | | | 1,023 | | | 8 | | | 3.22 | |
| Indirect—other consumer | 2,352 | | | 44 | | | 7.51 | | | 2,514 | | | 49 | | | 7.74 | |
| Consumer credit card | 1,151 | | | 35 | | | 12.19 | | | 1,190 | | | 37 | | | 12.40 | |
| Other consumer | 995 | | | 18 | | | 7.43 | | | 1,048 | | | 20 | | | 7.47 | |
| Total loans, net of unearned income | 84,755 | | | 865 | | | 4.11 | | | 86,664 | | | 917 | | | 4.20 | |
| Other earning assets | 17,788 | | | 14 | | | 0.33 | | | 14,657 | | | 10 | | | 0.29 | |
| Total earning assets | 131,326 | | | 1,024 | | | 3.14 | | | 129,353 | | | 1,072 | | | 3.29 | |
Unrealized gains/(losses) on debt securities available for sale, net (1) | 867 | | | | | | | 1,055 | | | | | |
| Allowance for loan losses | (2,139) | | | | | | | (2,286) | | | | | |
| Cash and due from banks | 1,931 | | | | | | | 2,027 | | | | | |
| Other non-earning assets | 14,569 | | | | | | | 14,670 | | | | | |
| $ | 146,554 | | | | | | | $ | 144,819 | | | | | |
| Liabilities and Shareholders’ Equity | | | | | | | | | | | |
| Interest-bearing liabilities: | | | | | | | | | | | |
| Savings | $ | 12,340 | | | 5 | | | 0.15 | | | $ | 11,374 | | | 3 | | | 0.12 | |
| Interest-bearing checking | 24,171 | | | 2 | | | 0.04 | | | 22,940 | | | 3 | | | 0.05 | |
| Money market | 29,425 | | | 3 | | | 0.04 | | | 29,312 | | | 5 | | | 0.06 | |
| Time deposits | 5,158 | | | 9 | | | 0.74 | | | 5,598 | | | 13 | | | 0.86 | |
| Other deposits | 4 | | | — | | | 1.81 | | | 11 | | | — | | | 1.93 | |
Total interest-bearing deposits (2) | 71,098 | | | 19 | | | 0.11 | | | 69,235 | | | 24 | | | 0.13 | |
| Federal funds purchased and securities sold under agreements to repurchase | — | | | — | | | — | | | 35 | | | — | | | 0.24 | |
| | | | | | | | | | | |
| Long-term borrowings | 3,192 | | | 27 | | | 3.42 | | | 4,634 | | | 31 | | | 2.66 | |
| Total interest-bearing liabilities | 74,290 | | | 46 | | | 0.25 | | | 73,904 | | | 55 | | | 0.29 | |
Non-interest-bearing deposits (2) | 51,839 | | | — | | | — | | | 50,532 | | | — | | | — | |
| Total funding sources | 126,129 | | | 46 | | | 0.15 | | | 124,436 | | | 55 | | | 0.17 | |
Net interest spread (1) | | | | | 2.89 | | | | | | | 3.00 | |
| Other liabilities | 2,387 | | | | | | | 2,468 | | | | | |
| Shareholders’ equity | 18,038 | | | | | | | 17,915 | | | | | |
| | | | | | | | | | | |
| $ | 146,554 | | | | | | | $ | 144,819 | | | | | |
Net interest income /margin FTE basis (1) | | | $ | 978 | | | 3.02 | % | | | | $ | 1,017 | | | 3.13 | % |
_______
(1) Debt securities are included on an amortized cost basis with yield and net interest margin calculated accordingly.
(2) Total deposit costs may be calculated by dividing total interest expense on deposits by the sum of interest-bearing deposits and non-interest bearing deposits. The rates for total deposit costs equal 0.06% for the quarter ended March 31, 2021 and 0.08% for the quarter ended December 31, 2020.
Regions Financial Corporation and Subsidiaries
Financial Supplement to First Quarter 2021 Earnings Release
Consolidated Average Daily Balances and Yield/Rate Analysis (continued)
| | | | | | | | | | | | | | | | | | | | | | | | | | | | | | | | | | | | | | | | | | | | | | | | | | | | | |
| | Quarter Ended |
| | 9/30/2020 | | 6/30/2020 | | 3/31/2020 |
| ($ amounts in millions; yields on taxable-equivalent basis) | Average Balance | | Income/ Expense | | Yield/ Rate | | Average Balance | | Income/ Expense | | Yield/ Rate | | Average Balance | | Income/ Expense | | Yield/ Rate |
| Assets | | | | | | | | | | | | | | | | | |
| Earning assets: | | | | | | | | | | | | | | | | | |
| | | | | | | | | | | | | | | | | |
Debt securities (1) | $ | 24,950 | | | $ | 140 | | | 2.24 | % | | $ | 23,828 | | | $ | 148 | | | 2.49 | % | | $ | 23,766 | | | $ | 158 | | | 2.66 | % |
| Loans held for sale | 1,147 | | | 8 | | | 2.89 | | | 807 | | | 6 | | | 3.06 | | | 514 | | | 5 | | | 3.72 | |
| Loans, net of unearned income: | | | | | | | | | | | | | | | | | |
| Commercial and industrial | 46,405 | | | 474 | | | 4.05 | | | 49,296 | | | 461 | | | 3.74 | | | 40,519 | | | 405 | | | 4.00 | |
| Commercial real estate mortgage—owner-occupied | 5,498 | | | 63 | | | 4.50 | | | 5,492 | | | 61 | | | 4.41 | | | 5,509 | | | 63 | | | 4.51 | |
| Commercial real estate construction—owner-occupied | 318 | | | 3 | | | 4.04 | | | 312 | | | 3 | | | 4.20 | | | 323 | | | 4 | | | 4.62 | |
| Commercial investor real estate mortgage | 5,324 | | | 31 | | | 2.27 | | | 5,150 | | | 33 | | | 2.53 | | | 4,975 | | | 46 | | | 3.69 | |
| Commercial investor real estate construction | 1,974 | | | 15 | | | 2.87 | | | 1,869 | | | 15 | | | 3.30 | | | 1,673 | | | 19 | | | 4.40 | |
| Residential first mortgage | 15,786 | | | 135 | | | 3.41 | | | 14,884 | | | 130 | | | 3.50 | | | 14,469 | | | 140 | | | 3.86 | |
| Home equity | 7,727 | | | 70 | | | 3.59 | | | 8,042 | | | 73 | | | 3.65 | | | 8,275 | | | 89 | | | 4.31 | |
| Indirect—vehicles | 1,223 | | | 10 | | | 3.25 | | | 1,441 | | | 11 | | | 3.24 | | | 1,679 | | | 14 | | | 3.26 | |
| Indirect—other consumer | 2,835 | | | 57 | | | 8.06 | | | 3,111 | | | 65 | | | 8.36 | | | 3,263 | | | 71 | | | 8.74 | |
| Consumer credit card | 1,194 | | | 38 | | | 12.62 | | | 1,230 | | | 36 | | | 11.65 | | | 1,348 | | | 41 | | | 12.26 | |
| Other consumer | 1,086 | | | 19 | | | 7.36 | | | 1,137 | | | 23 | | | 7.54 | | | 1,216 | | | 23 | | | 7.95 | |
| Total loans, net of unearned income | 89,370 | | | 915 | | | 4.06 | | | 91,964 | | | 911 | | | 3.96 | | | 83,249 | | | 915 | | | 4.40 | |
| | | | | | | | | | | | | | | | | |
| Other earning assets | 11,695 | | | 8 | | | 0.30 | | | 7,541 | | | 11 | | | 0.53 | | | 2,302 | | | 13 | | | 2.37 | |
Total earning assets | 127,162 | | | 1,071 | | | 3.35 | | | 124,140 | | | 1,076 | | | 3.46 | | | 109,831 | | | 1,091 | | | 3.97 | |
Unrealized gains/(losses) on debt securities available for sale, net (1) | 1,143 | | | | | | | 1,031 | | | | | | | 510 | | | | | |
| Allowance for loan losses | (2,308) | | | | | | | (1,860) | | | | | | | (1,315) | | | | | |
| Cash and due from banks | 2,174 | | | | | | | 2,070 | | | | | | | 1,915 | | | | | |
| Other non-earning assets | 14,674 | | | | | | | 14,439 | | | | | | | 13,830 | | | | | |
| $ | 142,845 | | | | | | | $ | 139,820 | | | | | | | $ | 124,771 | | | | | |
| Liabilities and Shareholders’ Equity | | | | | | | | | | | | | | | | | |
| Interest-bearing liabilities: | | | | | | | | | | | | | | | | | |
| Savings | $ | 10,935 | | | 4 | | | 0.14 | | | $ | 10,152 | | | 3 | | | 0.13 | | | $ | 8,822 | | | 4 | | | 0.17 | |
| Interest-bearing checking | 22,098 | | | 4 | | | 0.07 | | | 21,755 | | | 6 | | | 0.11 | | | 19,273 | | | 22 | | | 0.47 | |
| Money market | 29,146 | | | 8 | | | 0.12 | | | 27,870 | | | 10 | | | 0.13 | | | 25,151 | | | 28 | | | 0.46 | |
| Time deposits | 6,150 | | | 16 | | | 1.08 | | | 6,690 | | | 21 | | | 1.26 | | | 7,302 | | | 26 | | | 1.44 | |
| Other deposits | 13 | | | — | | | 1.87 | | | 72 | | | — | | | 1.64 | | | 919 | | | 4 | | | 1.57 | |
Total interest-bearing deposits (2) | 68,342 | | | 32 | | | 0.19 | | | 66,539 | | | 40 | | | 0.24 | | | 61,467 | | | 84 | | | 0.55 | |
| Federal funds purchased and securities sold under agreements to repurchase | — | | | — | | | — | | | — | | | — | | | — | | | 151 | | | 1 | | | 1.39 | |
| Other short-term borrowings | — | | | — | | | — | | | 1,558 | | | 2 | | | 0.53 | | | 1,644 | | | 7 | | | 1.69 | |
| Long-term borrowings | 5,829 | | | 39 | | | 2.63 | | | 7,567 | | | 49 | | | 2.56 | | | 8,402 | | | 59 | | | 2.81 | |
| Total interest-bearing liabilities | 74,171 | | | 71 | | | 0.38 | | | 75,664 | | | 91 | | | 0.48 | | | 71,664 | | | 151 | | | 0.85 | |
Non-interest-bearing deposits (2) | 48,314 | | | — | | | — | | | 44,382 | | | — | | | — | | | 34,205 | | | — | | | — | |
| Total funding sources | 122,485 | | | 71 | | | 0.23 | | | 120,046 | | | 91 | | | 0.30 | | | 105,869 | | | 151 | | | 0.57 | |
Net interest spread (1) | | | | | 2.97 | | | | | | | 2.98 | | | | | | | 3.12 | |
| Other liabilities | 2,576 | | | | | | | 2,390 | | | | | | | 2,442 | | | | | |
| Shareholders’ equity | 17,759 | | | | | | | 17,384 | | | | | | | 16,460 | | | | | |
| Noncontrolling interest | 25 | | | | | | | — | | | | | | | — | | | | | |
| $ | 142,845 | | | | | | | $ | 139,820 | | | | | | | $ | 124,771 | | | | | |
Net interest income/margin FTE basis (1) | | | $ | 1,000 | | | 3.13 | % | | | | $ | 985 | | | 3.19 | % | | | | $ | 940 | | | 3.44 | % |
_______(1) Debt securities are included on an amortized cost basis with yield and net interest margin calculated accordingly.
(2) Total deposit costs may be calculated by dividing total interest expense on deposits by the sum of interest-bearing deposits and non-interest bearing deposits. The rates for total deposit costs equal 0.11% for the quarter ended September 30, 2020, 0.14% for the quarter ended June 30, 2020 and 0.35% for the quarter ended March 31, 2020.
Adjusted Net Interest Margin (non-GAAP)
Regions believes the adjusted net interest margin (non-GAAP) provides investors with meaningful additional information about Regions' performance when margin associated with the SBA's Paycheck Protection Program (PPP) loans and excess cash are excluded from net interest margin (GAAP).
| | | | | | | | | | | | | | | | | | | | | | | | | | | | | |
| Quarter-ended |
| 3/31/2021 | | 12/31/2020 | | 9/30/2020 | | 6/30/2020 | | 3/31/2020 |
| Net interest margin (FTE) (GAAP) | 3.02 | % | | 3.13 | % | | 3.13 | % | | 3.19 | % | | 3.44 | % |
Impact of SBA PPP loans (1) | (0.04) | % | | (0.07) | % | | 0.01 | % | | 0.02 | % | | NM |
Impact of excess cash (2) | 0.42 | % | | 0.34 | % | | 0.27 | % | | 0.15 | % | | NM |
| Adjusted net interest margin (FTE) (non-GAAP) | 3.40 | % | | 3.40 | % | | 3.41 | % | | 3.36 | % | | 3.44 | % |
_______
NM - Not Meaningful
(1) The impact of SBA PPP loans was determined using average PPP loan balances and the related net interest income.
(2) The impact of excess cash was determined using the average cash balance in excess of $750 million and the related net interest income.
Regions Financial Corporation and Subsidiaries
Financial Supplement to First Quarter 2021 Earnings Release
Pre-Tax Pre-Provision Income ("PPI") and Adjusted PPI (non-GAAP)
The Pre-Tax Pre-Provision Income tables below present computations of pre-tax pre-provision income excluding certain adjustments (non-GAAP). Regions believes that the presentation of PPI and the exclusion of certain items from PPI provides a meaningful base for period-to-period comparisons, which management believes will assist investors in analyzing the operating results of the Company and predicting future performance. These non-GAAP financial measures are also used by management to assess the performance of Regions’ business. It is possible that the activities related to the adjustments may recur; however, management does not consider the activities related to the adjustments to be indications of ongoing operations. Regions believes that presentation of these non-GAAP financial measures will permit investors to assess the performance of the Company on the same basis as that applied by management. Non-GAAP financial measures have inherent limitations, are not required to be uniformly applied and are not audited. Although these non-GAAP financial measures are frequently used by stakeholders in the evaluation of a company, they have limitations as analytical tools, and should not be considered in isolation, or as a substitute for analyses of results as reported under GAAP. In particular, a measure of income that excludes certain adjustments does not represent the amount that effectively accrues directly to shareholders.
| | | | | | | | | | | | | | | | | | | | | | | | | | | | | | | | | | | | | | | | | | | | | | | | | | | | | |
| | Quarter Ended |
| ($ amounts in millions) | 3/31/2021 | | 12/31/2020 | | 9/30/2020 | | 6/30/2020 | | 3/31/2020 | | 1Q21 vs. 4Q20 | | 1Q21 vs. 1Q20 |
| Net income (loss) available to common shareholders (GAAP) | $ | 614 | | | $ | 588 | | | $ | 501 | | | $ | (237) | | | $ | 139 | | | $ | 26 | | | 4.4 | % | | $ | 475 | | | 341.7 | % |
| Preferred dividends (GAAP) | 28 | | | 28 | | | 29 | | | 23 | | | 23 | | | — | | | — | % | | 5 | | | 21.7 | % |
| Income tax expense (benefit) (GAAP) | 180 | | | 121 | | | 104 | | | (47) | | | 42 | | | 59 | | | 48.8 | % | | 138 | | | 328.6 | % |
| Income (loss) before income taxes (GAAP) | 822 | | | 737 | | | 634 | | | (261) | | | 204 | | | 85 | | | 11.5 | % | | 618 | | | 302.9 | % |
| Provision for (benefit from) credit losses (GAAP) | (142) | | | (38) | | | 113 | | | 882 | | | 373 | | | (104) | | | 273.7 | % | | (515) | | | (138.1) | % |
| Pre-tax pre-provision income (non-GAAP) | 680 | | | 699 | | | 747 | | | 621 | | | 577 | | | (19) | | | (2.7) | % | | 103 | | | 17.9 | % |
| Other adjustments: | | | | | | | | | | | | | | | | | |
| | | | | | | | | | | | | | | | | |
| Securities (gains) losses, net | (1) | | | — | | | (3) | | | (1) | | | — | | | (1) | | | NM | | (1) | | | NM |
Gains on equity investment(1) | (3) | | | (6) | | | (44) | | | — | | | — | | | 3 | | | (50.0) | % | | (3) | | | NM |
| Leveraged lease termination gains, net | — | | | — | | | — | | | — | | | (2) | | | — | | | NM | | 2 | | | 100.0 | % |
Bank-owned life insurance(2) | — | | | (25) | | | — | | | — | | | — | | | 25 | | | 100.0 | % | | — | | | NM |
| Salaries and employee benefits—severance charges | 3 | | | 26 | | | 2 | | | 2 | | | 1 | | | (23) | | | (88.5) | % | | 2 | | | 200.0 | % |
| Branch consolidation, property and equipment charges | 5 | | | 7 | | | 3 | | | 10 | | | 11 | | | (2) | | | (28.6) | % | | (6) | | | (54.5) | % |
| Contribution to the Regions Financial Corporation foundation | 2 | | | 10 | | | — | | | — | | | — | | | (8) | | | (80.0) | % | | 2 | | | NM |
| Loss on early extinguishment of debt | — | | | 14 | | | 2 | | | 6 | | | — | | | (14) | | | (100.0) | % | | — | | | NM |
| Professional, legal and regulatory expenses | — | | | — | | | — | | | 7 | | | — | | | — | | | NM | | — | | | NM |
| | | | | | | | | | | | | | | | | |
| Acquisition expenses | — | | | — | | | — | | | 1 | | | — | | | — | | | NM | | — | | | NM |
| Total other adjustments | 6 | | | 26 | | | (40) | | | 25 | | | 10 | | | (20) | | | (76.9) | % | | (4) | | | (40.0) | % |
| Adjusted pre-tax pre-provision income (non-GAAP) | $ | 686 | | | $ | 725 | | | $ | 707 | | | $ | 646 | | | $ | 587 | | | $ | (39) | | | (5.4) | % | | $ | 99 | | | 16.9 | % |
______
NM - Not Meaningful
(1) The first quarter 2021 amount is a gain on the sale of an equity investment, whereas the prior quarters are valuations gains..
(2) During the fourth quarter of 2020, the Company recognized a gain on the exchange of BOLI policies.
Regions Financial Corporation and Subsidiaries
Financial Supplement to First Quarter 2021 Earnings Release
Non-Interest Income
| | | | | | | | | | | | | | | | | | | | | | | | | | | | | | | | | | | | | | | | | | | | | | | | | | | | | |
| | Quarter Ended |
| ($ amounts in millions) | 3/31/2021 | | 12/31/2020 | | 9/30/2020 | | 6/30/2020 | | 3/31/2020 | | 1Q21 vs. 4Q20 | | 1Q21 vs. 1Q20 |
| Service charges on deposit accounts | $ | 157 | | | $ | 160 | | | $ | 152 | | | $ | 131 | | | $ | 178 | | | $ | (3) | | | (1.9) | % | | $ | (21) | | | (11.8) | % |
| Card and ATM fees | 115 | | | 117 | | | 115 | | | 101 | | | 105 | | | (2) | | | (1.7) | % | | 10 | | | 9.5 | % |
| Wealth management income | 91 | | | 89 | | | 85 | | | 79 | | | 84 | | | 2 | | | 2.2 | % | | 7 | | | 8.3 | % |
Capital markets income (1) | 100 | | | 110 | | | 61 | | | 95 | | | 9 | | | (10) | | | (9.1) | % | | 91 | | | NM |
| Mortgage income | 90 | | | 75 | | | 108 | | | 82 | | | 68 | | | 15 | | | 20.0 | % | | 22 | | | 32.4 | % |
| Commercial credit fee income | 22 | | | 22 | | | 20 | | | 17 | | | 18 | | | — | | | — | % | | 4 | | | 22.2 | % |
| Bank-owned life insurance | 17 | | | 43 | | | 17 | | | 18 | | | 17 | | | (26) | | | (60.5) | % | | — | | | — | % |
| Securities gains (losses), net | 1 | | | — | | | 3 | | | 1 | | | — | | | 1 | | | NM | | 1 | | | NM |
| | | | | | | | | | | | | | | | | |
Market value adjustments on employee benefit assets (2) | 7 | | | 7 | | | 14 | | | 16 | | | (25) | | | — | | | — | % | | 32 | | | 128.0 | % |
Gains on equity investment (3) | 3 | | | 6 | | | 44 | | | — | | | — | | | (3) | | | (50.0) | % | | 3 | | | NM |
| Other | 38 | | | 51 | | | 36 | | | 33 | | | 31 | | | (13) | | | (25.5) | % | | 7 | | | 22.6 | % |
| Total non-interest income | $ | 641 | | | $ | 680 | | | $ | 655 | | | $ | 573 | | | $ | 485 | | | $ | (39) | | | (5.7) | % | | $ | 156 | | | 32.2 | % |
Mortgage Income | | | | | | | | | | | | | | | | | | | | | | | | | | | | | | | | | | | | | | | | | | | | | | | | | | | | | |
| Quarter Ended |
| ($ amounts in millions) | 3/31/2021 | | 12/31/2020 | | 9/30/2020 | | 6/30/2020 | | 3/31/2020 | | 1Q21 vs. 4Q20 | | 1Q21 vs. 1Q20 |
| Production and sales | $ | 76 | | | $ | 74 | | | $ | 99 | | | $ | 75 | | | $ | 48 | | | $ | 2 | | | 2.7 | % | | $ | 28 | | | 58.3 | % |
| Loan servicing | 24 | | | 24 | | | 23 | | | 23 | | | 25 | | | — | | | — | % | | (1) | | | (4.0) | % |
| MSR and related hedge impact: | | | | | | | | | | | | | | | | | |
| MSRs fair value increase (decrease) due to change in valuation inputs or assumptions | 90 | | | 5 | | | — | | | (11) | | | (83) | | | 85 | | | NM | | 173 | | | 208.4 | % |
| MSRs hedge gain (loss) | (83) | | | (11) | | | — | | | 13 | | | 97 | | | (72) | | | NM | | (180) | | | (185.6) | % |
| MSRs change due to payment decay | (17) | | | (17) | | | (14) | | | (18) | | | (19) | | | — | | | — | % | | 2 | | | 10.5 | % |
| MSR and related hedge impact | (10) | | | (23) | | | (14) | | | (16) | | | (5) | | | 13 | | | 56.5 | % | | (5) | | | (100.0) | % |
| Total mortgage income | $ | 90 | | | $ | 75 | | | $ | 108 | | | $ | 82 | | | $ | 68 | | | $ | 15 | | | 20.0 | % | | 22 | | | 32.4 | % |
| | | | | | | | | | | | | | | | | |
| Mortgage production - purchased | $ | 1,423 | | | $ | 1,669 | | | $ | 1,776 | | | $ | 1,390 | | | $ | 894 | | | $ | (246) | | | (14.7) | % | | $ | 529 | | | 59.2 | % |
| Mortgage production - refinanced | 1,353 | | | 1,717 | | | 1,712 | | | 2,563 | | | 576 | | | (364) | | | (21.2) | % | | 777 | | | 134.9 | % |
Total mortgage production (4) | $ | 2,776 | | | $ | 3,386 | | | $ | 3,488 | | | $ | 3,953 | | | $ | 1,470 | | | $ | (610) | | | (18.0) | % | | $ | 1,306 | | | 88.8 | % |
Wealth Management Income | | | | | | | | | | | | | | | | | | | | | | | | | | | | | | | | | | | | | | | | | | | | | | | | | | | | | | | |
| Quarter Ended | | |
| ($ amounts in millions) | 3/31/2021 | | 12/31/2020 | | 9/30/2020 | | 6/30/2020 | | 3/31/2020 | | 1Q21 vs. 4Q20 | | 1Q21 vs. 1Q20 | | |
| Investment management and trust fee income | $ | 66 | | | $ | 67 | | | $ | 62 | | | $ | 62 | | | $ | 62 | | | $ | (1) | | | (1.5) | % | | $ | 4 | | | 6.5 | % | | |
| Investment services fee income | 25 | | | 22 | | | 23 | | | 17 | | | 22 | | | 3 | | | 13.6 | % | | 3 | | | 13.6 | % | | |
Total wealth management income (5) | $ | 91 | | | $ | 89 | | | $ | 85 | | | $ | 79 | | | $ | 84 | | | $ | 2 | | | 2.2 | % | | $ | 7 | | | 8.3 | % | | |
Capital Markets Income
| | | | | | | | | | | | | | | | | | | | | | | | | | | | | | | | | | | | | | | | | | | | | | | | | | | | | |
| Quarter Ended |
| ($ amounts in millions) | 3/31/2021 | | 12/31/2020 | | 9/30/2020 | | 6/30/2020 | | 3/31/2020 | | 1Q21 vs. 4Q20 | | 1Q21 vs. 1Q20 |
| Capital markets income | $ | 100 | | | $ | 110 | | | $ | 61 | | | $ | 95 | | | $ | 9 | | | $ | (10) | | | (9.1) | % | | $ | 91 | | | NM |
Less: Valuation adjustments on customer derivatives (6) | 11 | | | 8 | | | 5 | | | 34 | | | (34) | | | 3 | | | 37.5 | % | | 45 | | | 132.4 | % |
| Capital markets income excluding valuation adjustments | $ | 89 | | | $ | 102 | | | $ | 56 | | | $ | 61 | | | $ | 43 | | | $ | (13) | | | (12.7) | % | | $ | 46 | | | 107.0 | % |
_________
NM - Not Meaningful
(1)Capital markets income primarily relates to capital raising activities that includes debt securities underwriting and placement, loan syndication and placement, as well as foreign exchange, derivative and merger and acquisition advisory services.
(2)These market value adjustments relate to assets held for employee benefits that are offset within salaries and employee benefits expense.
(3)The first quarter 2021 amount is a gain on the sale of an equity investment, whereas the prior quarters are valuations gains.
(4)Total mortgage production represents production during the period, including amounts sold into the secondary market as well as amounts retained in Regions' residential first mortgage loan portfolio.
(5)Total wealth management income presented above does not include the portion of service charges on deposit accounts and similar smaller dollar amounts that are also attributable to the wealth management segment.
(6)For the purposes of determining the fair value of customer derivatives, the Company considers the risk of nonperformance by counterparties, as well as the Company's own risk of nonperformance. The valuation adjustments above are reflective of the values associated with these considerations.
Regions Financial Corporation and Subsidiaries
Financial Supplement to First Quarter 2021 Earnings Release
Non-Interest Expense
| | | | | | | | | | | | | | | | | | | | | | | | | | | | | | | | | | | | | | | | | | | | | | | | | | | | | |
| Quarter Ended |
| ($ amounts in millions) | 3/31/2021 | | 12/31/2020 | | 9/30/2020 | | 6/30/2020 | | 3/31/2020 | | 1Q21 vs. 4Q20 | | 1Q21 vs. 1Q20 |
| Salaries and employee benefits | $ | 546 | | | $ | 581 | | | $ | 525 | | | $ | 527 | | | $ | 467 | | | $ | (35) | | | (6.0) | % | | $ | 79 | | | 16.9 | % |
| Net occupancy expense | 77 | | | 78 | | | 80 | | | 76 | | | 79 | | | (1) | | | (1.3) | % | | (2) | | | (2.5) | % |
| Equipment and software expense | 90 | | | 90 | | | 89 | | | 86 | | | 83 | | | — | | | — | % | | 7 | | | 8.4 | % |
| Outside services | 38 | | | 37 | | | 44 | | | 44 | | | 45 | | | 1 | | | 2.7 | % | | (7) | | | (15.6) | % |
| Professional, legal and regulatory expenses | 29 | | | 21 | | | 22 | | | 28 | | | 18 | | | 8 | | | 38.1 | % | | 11 | | | 61.1 | % |
| Marketing | 22 | | | 26 | | | 22 | | | 22 | | | 24 | | | (4) | | | (15.4) | % | | (2) | | | (8.3) | % |
| FDIC insurance assessments | 10 | | | 12 | | | 10 | | | 15 | | | 11 | | | (2) | | | (16.7) | % | | (1) | | | (9.1) | % |
| Credit/checkcard expenses | 14 | | | 13 | | | 12 | | | 12 | | | 13 | | | 1 | | | 7.7 | % | | 1 | | | 7.7 | % |
| Branch consolidation, property and equipment charges | 5 | | | 7 | | | 3 | | | 10 | | | 11 | | | (2) | | | (28.6) | % | | (6) | | | (54.5) | % |
| Visa class B shares expense | 4 | | | 6 | | | 5 | | | 9 | | | 4 | | | (2) | | | (33.3) | % | | — | | | — | % |
| Loss on early extinguishment of debt | — | | | 14 | | | 2 | | | 6 | | | — | | | (14) | | | (100.0) | % | | — | | | NM |
| Other | 93 | | | 102 | | | 82 | | | 89 | | | 81 | | | (9) | | | (8.8) | % | | 12 | | | 14.8 | % |
| Total non-interest expense | $ | 928 | | | $ | 987 | | | $ | 896 | | | $ | 924 | | | $ | 836 | | | $ | (59) | | | (6.0) | % | | $ | 92 | | | 11.0 | % |
_________
NM - Not Meaningful
Regions Financial Corporation and Subsidiaries
Financial Supplement to First Quarter 2021 Earnings Release
Reconciliation to GAAP Financial Measures
Adjusted Efficiency Ratios, Adjusted Fee Income Ratios, Adjusted Non-Interest Income/Expense, and Adjusted Operating Leverage Ratios
The table below presents computations of the efficiency ratio, which is a measure of productivity, generally calculated as non-interest expense divided by total revenue; and the fee income ratio, generally calculated as non-interest income divided by total revenue. Management uses these ratios to monitor performance and believes these measures provide meaningful information to investors. Non-interest expense (GAAP) is presented excluding certain adjustments to arrive at adjusted non-interest expense (non-GAAP), which is the numerator for the efficiency ratio. Non-interest income (GAAP) is presented excluding certain adjustments to arrive at adjusted non-interest income (non-GAAP), which is the numerator for the fee income ratio. Net interest income and non-interest income are added together to arrive at total revenue. Adjustments are made to arrive at adjusted total revenue (non-GAAP). Net interest income on a taxable-equivalent basis and non-interest income are added together to arrive at total revenue on a taxable-equivalent basis. Adjustments are made to arrive at adjusted total revenue on a taxable-equivalent basis (non-GAAP), which is the denominator for the fee income and efficiency ratios. Regions believes that the exclusion of these adjustments provides a meaningful basis for period-to-period comparisons, which management believes will assist investors in analyzing the operating results of the Company and predicting future performance. These non-GAAP financial measures are also used by management to assess the performance of Regions’ business. It is possible that the activities related to the adjustments may recur; however, management does not consider the activities related to the adjustments to be indications of ongoing operations. The table on the following page also presents a computation of the operating leverage ratio (non-GAAP) which is the period to period percentage change in adjusted total revenue on a taxable-equivalent basis (non-GAAP) less the percentage change in adjusted non-interest expense (non-GAAP). Regions believes that presentation of these non-GAAP financial measures will permit investors to assess the performance of the Company on the same basis as that applied by management.
| | | | | | | | | | | | | | | | | | | | | | | | | | | | | | | | | | | | | | | | | | | | | | | | | | | | | | | | |
| | Quarter Ended |
| ($ amounts in millions) | | 3/31/2021 | | 12/31/2020 | | 9/30/2020 | | 6/30/2020 | | 3/31/2020 | | 1Q21 vs. 4Q20 | | 1Q21 vs. 1Q20 |
| Non-interest expense (GAAP) | A | $ | 928 | | | $ | 987 | | | $ | 896 | | | $ | 924 | | | $ | 836 | | | $ | (59) | | | (6.0) | % | | $ | 92 | | | 11.0 | % |
| Adjustments: | | | | | | | | | | | | | | | | | | |
| Contribution to the Regions Financial Corporation foundation | | (2) | | | (10) | | | — | | | — | | | — | | | 8 | | | 80.0 | | | (2) | | | NM |
| Branch consolidation, property and equipment charges | | (5) | | | (7) | | | (3) | | | (10) | | | (11) | | | 2 | | | 28.6 | % | | 6 | | | 54.5 | % |
| | | | | | | | | | | | | | | | | | |
| Salary and employee benefits—severance charges | | (3) | | | (26) | | | (2) | | | (2) | | | (1) | | | 23 | | | 88.5 | % | | (2) | | | (200.0) | % |
| Loss on early extinguishment of debt | | — | | | (14) | | | (2) | | | (6) | | | — | | | 14 | | | 100.0 | % | | — | | | NM |
| Professional, legal and regulatory expenses | | — | | | — | | | — | | | (7) | | | — | | | — | | | NM | | — | | | NM |
| Acquisition expenses | | — | | | — | | | — | | | (1) | | | — | | | — | | | NM | | — | | | NM |
| Adjusted non-interest expense (non-GAAP) | B | $ | 918 | | | $ | 930 | | | $ | 889 | | | $ | 898 | | | $ | 824 | | | $ | (12) | | | (1.3) | % | | $ | 94 | | | 11.4 | % |
| | | | | | | | | | | | | | | | | | |
| | | | | | | | | | | | | | | | | | |
| | | | | | | | | | | | | | | | | | |
| Net interest income (GAAP) | C | $ | 967 | | | $ | 1,006 | | | $ | 988 | | | $ | 972 | | | $ | 928 | | | $ | (39) | | | (3.9) | % | | 39 | | 4.2 | % |
| Taxable-equivalent adjustment | | 11 | | | 11 | | | 12 | | | 13 | | | 12 | | | — | | | — | % | | (1) | | | (8.3) | % |
| Net interest income, taxable-equivalent basis | D | $ | 978 | | | $ | 1,017 | | | $ | 1,000 | | | $ | 985 | | | $ | 940 | | | $ | (39) | | | (3.8) | % | | $ | 38 | | | 4.0 | % |
| | | | | | | | | | | | | | | | | | |
| | | | | | | | | | | | | | | | | | |
| | | | | | | | | | | | | | | | | | |
| | | | | | | | | | | | | | | | | | |
| | | | | | | | | | | | | | | | | | |
| Non-interest income (GAAP) | E | 641 | | | 680 | | | 655 | | | 573 | | | 485 | | | (39) | | | (5.7) | % | | 156 | | | 32.2 | % |
| Adjustments: | | | | | | | | | | | | | | | | | | |
| Securities (gains) losses, net | | (1) | | | — | | | (3) | | | (1) | | | — | | | (1) | | | NM | | (1) | | | NM |
Gains on equity investment(1) | | (3) | | | (6) | | | (44) | | | — | | | — | | | 3 | | | 50.0 | % | | (3) | | | NM |
| Leveraged lease termination gains | | — | | | — | | | — | | | — | | | (2) | | | — | | | NM | | 2 | | | 100.0 | % |
Bank-owned life insurance(2) | | — | | | (25) | | | — | | | — | | | — | | | 25 | | | 100.0 | % | | — | | | NM |
| Adjusted non-interest income (non-GAAP) | F | $ | 637 | | | $ | 649 | | | $ | 608 | | | $ | 572 | | | $ | 483 | | | (12) | | | (1.85) | % | | 154 | | 31.9 | % |
| Total revenue | C+E=G | $ | 1,608 | | | $ | 1,686 | | | $ | 1,643 | | | $ | 1,545 | | | $ | 1,413 | | | $ | (78) | | | (4.6) | % | | $ | 195 | | | 13.8 | % |
| Adjusted total revenue (non-GAAP) | C+F=H | $ | 1,604 | | | $ | 1,655 | | | $ | 1,596 | | | $ | 1,544 | | | $ | 1,411 | | | $ | (51) | | | (3.1) | % | | $ | 193 | | | 13.7 | % |
| Total revenue, taxable-equivalent basis | D+E=I | $ | 1,619 | | | $ | 1,697 | | | $ | 1,655 | | | $ | 1,558 | | | $ | 1,425 | | | $ | (78) | | | (4.6) | % | | $ | 194 | | | 13.6 | % |
| Adjusted total revenue, taxable-equivalent basis (non-GAAP) | D+F=J | $ | 1,615 | | | $ | 1,666 | | | $ | 1,608 | | | $ | 1,557 | | | $ | 1,423 | | | $ | (51) | | | (3.1) | % | | $ | 192 | | | 13.5 | % |
Operating leverage ratio (GAAP)(3) | I-A | | | | | | | | | | | | | | | | | 2.6 | % |
Adjusted operating leverage ratio (non-GAAP)(2) | J-B | | | | | | | | | | | | | | | | | 2.1 | % |
Efficiency ratio (GAAP)(3) | A/I | 57.3 | % | | 58.1 | % | | 54.1 | % | | 59.4 | % | | 58.6 | % | | | | | | | | |
Adjusted efficiency ratio (non-GAAP)(3) | B/J | 56.8 | % | | 55.8 | % | | 55.3 | % | | 57.7 | % | | 57.9 | % | | | | | | | | |
Fee income ratio (GAAP)(3) | E/I | 39.6 | % | | 40.1 | % | | 39.6 | % | | 36.8 | % | | 34.0 | % | | | | | | | | |
Adjusted fee income ratio (non-GAAP)(3) | F/J | 39.4 | % | | 38.9 | % | | 37.8 | % | | 36.8 | % | | 34.0 | % | | | | | | | | |
________NM - Not Meaningful
(1)The first quarter 2021 amount is a gain on the sale of an equity investment, whereas the prior quarters are valuations gains..
(2) During the fourth quarter of 2020, the Company recognized a gain on the exchange of BOLI policies.
(3)Amounts have been calculated using whole dollar values.
Regions Financial Corporation and Subsidiaries
Financial Supplement to First Quarter 2021 Earnings Release
Reconciliation to GAAP Financial Measure
Return Ratio
The table below provides a calculation of “return on average tangible common shareholders’ equity”. Tangible common shareholders’ equity ratios have become a focus of some investors and management believes they may assist investors in analyzing the capital position of the Company absent the effects of intangible assets and preferred stock. Analysts and banking regulators have assessed Regions’ capital adequacy using the tangible common shareholders’ equity measure. Because tangible common shareholders’ equity is not formally defined by GAAP or prescribed in any amount by federal banking regulations it is currently considered to be a non-GAAP financial measure and other entities may calculate it differently than Regions’ disclosed calculations. Since analysts and banking regulators may assess Regions’ capital adequacy using tangible common shareholders’ equity, management believes that it is useful to provide investors the ability to assess Regions’ capital adequacy on this same basis.
| | | | | | | | | | | | | | | | | | | | | | | | | | | | | | | | |
| | Quarter Ended |
| ($ amounts in millions) | | 3/31/2021 | | 12/31/2020 | | 9/30/2020 | | 6/30/2020 | | 3/31/2020 |
| RETURN ON AVERAGE TANGIBLE COMMON SHAREHOLDERS' EQUITY | | | | | | | | | | |
| Net income (loss) available to common shareholders (GAAP) | A | $ | 614 | | | $ | 588 | | | $ | 501 | | | $ | (237) | | | $ | 139 | |
| Average shareholders' equity (GAAP) | | $ | 18,038 | | | $ | 17,915 | | | $ | 17,759 | | | $ | 17,384 | | | $ | 16,460 | |
| Less: | | | | | | | | | | |
| Average intangible assets (GAAP) | | 5,309 | | | 5,313 | | | 5,322 | | | 5,373 | | | 4,947 | |
| Average deferred tax liability related to intangibles (GAAP) | | (104) | | | (105) | | | (103) | | | (94) | | | (92) | |
| Average preferred stock (GAAP) | | 1,656 | | | 1,656 | | | 1,656 | | | 1,409 | | | 1,310 | |
| Average tangible common shareholders' equity (non-GAAP) | B | $ | 11,177 | | | $ | 11,051 | | | $ | 10,884 | | | $ | 10,696 | | | $ | 10,295 | |
Return on average tangible common shareholders' equity (non-GAAP)*(1) | A/B | 22.28 | % | | 21.15 | % | | 18.32 | % | | (8.90) | % | | 5.43 | % |
___
*Annualized
(1)Amounts have been calculated using whole dollar values.
Regions Financial Corporation and Subsidiaries
Financial Supplement to First Quarter 2021 Earnings Release
Credit Quality | | | | | | | | | | | | | | | | | | | | | | | | | | | | | |
| As of and for Quarter Ended |
| ($ amounts in millions) | 3/31/2021 | | 12/31/2020 | | 9/30/2020 | | 6/30/2020 | | 3/31/2020 |
| Components: | | | | | | | | | |
| Beginning allowance for loan losses (ALL) | $ | 2,167 | | | $ | 2,276 | | | $ | 2,276 | | | $ | 1,560 | | | $ | 869 | |
| | | | | | | | | |
| | | | | | | | | |
Cumulative change in accounting guidance (1) | — | | | — | | | — | | | — | | | 438 | |
| Beginning allowance for loan losses (ALL), as adjusted for change in accounting guidance | 2,167 | | | 2,276 | | | 2,276 | | | 1,560 | | | 1,307 | |
| | | | | | | | | |
| Loans charged-off: | | | | | | | | | |
| Commercial and industrial | 45 | | | 67 | | | 84 | | | 139 | | | 68 | |
| Commercial real estate mortgage—owner-occupied | 1 | | | 2 | | | 2 | | | 3 | | | 3 | |
| Commercial real estate construction—owner-occupied | 1 | | | — | | | — | | | — | | | — | |
| Total commercial | 47 | | | 69 | | | 86 | | | 142 | | | 71 | |
| Commercial investor real estate mortgage | 15 | | | 1 | | | — | | | — | | | — | |
| | | | | | | | | |
| Total investor real estate | 15 | | | 1 | | | — | | | — | | | — | |
| Residential first mortgage | 1 | | | 3 | | | 1 | | | 1 | | | 1 | |
| Home equity—lines of credit | 2 | | | 3 | | | 2 | | | 3 | | | 4 | |
| Home equity—closed-end | — | | | 1 | | | 1 | | | — | | | 1 | |
| | | | | | | | | |
| Indirect—vehicles | 2 | | | 2 | | | 4 | | | 6 | | | 6 | |
| Indirect—other consumer | 20 | | | 20 | | | 17 | | | 18 | | | 23 | |
| Consumer credit card | 12 | | | 12 | | | 13 | | | 17 | | | 16 | |
| Other consumer | 15 | | | 15 | | | 15 | | | 17 | | | 22 | |
| Total consumer | 52 | | | 56 | | | 53 | | | 62 | | | 73 | |
| Total | 114 | | | 126 | | | 139 | | | 204 | | | 144 | |
| | | | | | | | | |
| Recoveries of loans previously charged-off: | | | | | | | | | |
| Commercial and industrial | 16 | | | 14 | | | 10 | | | 9 | | | 5 | |
| Commercial real estate mortgage—owner-occupied | — | | | 1 | | | 1 | | | 1 | | | 2 | |
| Commercial real estate construction—owner-occupied | — | | | — | | | — | | | — | | | — | |
| Total commercial | 16 | | | 15 | | | 11 | | | 10 | | | 7 | |
| Commercial investor real estate mortgage | — | | | 2 | | | — | | | — | | | 1 | |
| | | | | | | | | |
| Total investor real estate | — | | | 2 | | | — | | | — | | | 1 | |
| Residential first mortgage | 1 | | | — | | | 1 | | | 1 | | | 1 | |
| Home equity—lines of credit | 3 | | | 4 | | | 3 | | | 2 | | | 3 | |
| Home equity—closed-end | — | | | 1 | | | 1 | | | — | | | 1 | |
| | | | | | | | | |
| Indirect—vehicles | 1 | | | 1 | | | 3 | | | 3 | | | 2 | |
| Indirect—other consumer | 1 | | | 1 | | | 1 | | | — | | | — | |
| Consumer credit card | 3 | | | 3 | | | 2 | | | 3 | | | 2 | |
| Other consumer | 6 | | | 5 | | | 4 | | | 3 | | | 4 | |
| Total consumer | 15 | | | 15 | | | 15 | | | 12 | | | 13 | |
| Total | 31 | | | 32 | | | 26 | | | 22 | | | 21 | |
| | | | | | | | | |
| Net loans charged-off: | | | | | | | | | |
| Commercial and industrial | 29 | | | 53 | | | 74 | | | 130 | | | 63 | |
| Commercial real estate mortgage—owner-occupied | 1 | | | 1 | | | 1 | | | 2 | | | 1 | |
| Commercial real estate construction—owner-occupied | 1 | | | — | | | — | | | — | | | — | |
| Total commercial | 31 | | | 54 | | | 75 | | | 132 | | | 64 | |
| Commercial investor real estate mortgage | 15 | | | (1) | | | — | | | — | | | (1) | |
| | | | | | | | | |
| Total investor real estate | 15 | | | (1) | | | — | | | — | | | (1) | |
| Residential first mortgage | — | | | 3 | | | — | | | — | | | — | |
| Home equity—lines of credit | (1) | | | (1) | | | (1) | | | 1 | | | 1 | |
| Home equity—closed-end | — | | | — | | | — | | | — | | | — | |
| | | | | | | | | |
| Indirect—vehicles | 1 | | | 1 | | | 1 | | | 3 | | | 4 | |
| Indirect—other consumer | 19 | | | 19 | | | 16 | | | 18 | | | 23 | |
| Consumer credit card | 9 | | | 9 | | | 11 | | | 14 | | | 14 | |
| Other consumer | 9 | | | 10 | | | 11 | | | 14 | | | 18 | |
| Total consumer | 37 | | | 41 | | | 38 | | | 50 | | | 60 | |
| Total | $ | 83 | | | $ | 94 | | | $ | 113 | | | $ | 182 | | | $ | 123 | |
| Provision for (benefit from) loan losses | $ | (108) | | | $ | (15) | | | $ | 113 | | | $ | 838 | | | $ | 376 | |
| Initial allowance on acquired purchased credit deteriorated loans | $ | — | | | $ | — | | | $ | — | | | $ | 60 | | | $ | — | |
| Ending allowance for loan losses (ALL) | $ | 1,976 | | | $ | 2,167 | | | $ | 2,276 | | | $ | 2,276 | | | $ | 1,560 | |
| Beginning reserve for unfunded credit commitments | 126 | | | 149 | | | 149 | | | 105 | | | 45 | |
Cumulative change in accounting guidance (1) | — | | | — | | | — | | | — | | | 63 | |
| Beginning reserve for unfunded credit commitments, as adjusted for change in accounting guidance | 126 | | | 149 | | | 149 | | | 105 | | | 108 | |
| Provision for (benefit from) unfunded credit losses | (34) | | | (23) | | | — | | | 44 | | | (3) | |
| Ending reserve for unfunded commitments | 92 | | | 126 | | | 149 | | | 149 | | | 105 | |
| Allowance for credit losses (ACL) at period end | $ | 2,068 | | | $ | 2,293 | | | $ | 2,425 | | | $ | 2,425 | | | $ | 1,665 | |
| | | | | | | | | |
| | | | | | | | | |
Regions Financial Corporation and Subsidiaries
Financial Supplement to First Quarter 2021 Earnings Release
| | | | | | | | | | | | | | | | | | | | | | | | | | | | | |
| Credit Quality (continued) | | | | | | | | | |
| | | | | | | | | |
| As of and for Quarter Ended |
| ($ amounts in millions) | 3/31/2021 | | 12/31/2020 | | 9/30/2020 | | 6/30/2020 | | 3/31/2020 |
Net loan charge-offs as a % of average loans, annualized(2): | | | | | | | | | |
| Commercial and industrial | 0.28 | % | | 0.48 | % | | 0.63 | % | | 1.06 | % | | 0.63 | % |
| Commercial real estate mortgage—owner-occupied | 0.09 | % | | 0.07 | % | | 0.05 | % | | 0.17 | % | | 0.07 | % |
| Commercial real estate construction—owner-occupied | 0.93 | % | | — | % | | — | % | | — | % | | — | % |
| Total commercial | 0.26 | % | | 0.44 | % | | 0.57 | % | | 0.96 | % | | 0.56 | % |
| Commercial investor real estate mortgage | 1.11 | % | | (0.04) | % | | (0.01) | % | | (0.03) | % | | (0.06) | % |
| Commercial investor real estate construction | — | % | | (0.01) | % | | — | % | | — | % | | (0.01) | % |
| Total investor real estate | 0.82 | % | | (0.03) | % | | (0.01) | % | | (0.02) | % | | (0.05) | % |
| Residential first mortgage | — | % | | 0.08 | % | | — | % | | — | % | | — | % |
| Home equity—lines of credit | (0.06) | % | | (0.11) | % | | (0.11) | % | | 0.06 | % | | 0.10 | % |
| Home equity—closed-end | — | % | | 0.03 | % | | (0.01) | % | | — | % | | (0.02) | % |
| | | | | | | | | |
| Indirect—vehicles | 0.32 | % | | 0.26 | % | | 0.30 | % | | 0.85 | % | | 0.94 | % |
| Indirect—other consumer | 3.28 | % | | 2.95 | % | | 2.23 | % | | 2.35 | % | | 2.83 | % |
| Consumer credit card | 3.19 | % | | 3.02 | % | | 3.73 | % | | 4.41 | % | | 4.16 | % |
| Other consumer | 4.02 | % | | 3.69 | % | | 4.12 | % | | 5.15 | % | | 5.73 | % |
| Total consumer | 0.52 | % | | 0.54 | % | | 0.51 | % | | 0.68 | % | | 0.79 | % |
| Total | 0.40 | % | | 0.43 | % | | 0.50 | % | | 0.80 | % | | 0.59 | % |
| Non-accrual loans, excluding loans held for sale | $ | 738 | | | $ | 745 | | | $ | 767 | | | $ | 614 | | | $ | 638 | |
| Non-performing loans held for sale | 8 | | | 6 | | | 5 | | | 10 | | | 3 | |
| Non-accrual loans, including loans held for sale | 746 | | | 751 | | | 772 | | | 624 | | | 641 | |
| Foreclosed properties | 21 | | | 25 | | | 26 | | | 43 | | | 54 | |
| | | | | | | | | |
| Non-performing assets (NPAs) | $ | 767 | | | $ | 776 | | | $ | 798 | | | $ | 667 | | | $ | 695 | |
Loans past due > 90 days (3) | $ | 154 | | | $ | 164 | | | $ | 158 | | | $ | 245 | | | $ | 209 | |
| | | | | | | | | |
| | | | | | | | | |
Criticized loans- business (4) | $ | 3,756 | | | $ | 3,800 | | | $ | 3,734 | | | $ | 4,225 | | | $ | 2,524 | |
Credit Ratios(2): | | | | | | | | | |
| ACL/Loans, net | 2.44 | % | | 2.69 | % | | 2.74 | % | | 2.68 | % | | 1.89 | % |
| ALL/Loans, net | 2.33 | % | | 2.54 | % | | 2.58 | % | | 2.51 | % | | 1.77 | % |
| Allowance for credit losses to non-performing loans, excluding loans held for sale | 280 | % | | 308 | % | | 316 | % | | 395 | % | | 261 | % |
| Allowance for loan losses to non-performing loans, excluding loans held for sale | 268 | % | | 291 | % | | 297 | % | | 370 | % | | 244 | % |
| Non-accrual loans, excluding loans held for sale/Loans, net | 0.87 | % | | 0.87 | % | | 0.87 | % | | 0.68 | % | | 0.72 | % |
| NPAs (ex. 90+ past due)/Loans, foreclosed properties, non-marketable investments and non-performing loans held for sale | 0.90 | % | | 0.91 | % | | 0.90 | % | | 0.74 | % | | 0.79 | % |
NPAs (inc. 90+ past due)/Loans, foreclosed properties, non-marketable investments and non-performing loans held for sale (2) | 1.09 | % | | 1.10 | % | | 1.08 | % | | 0.91 | % | | 0.96 | % |
(1)Regions adopted the CECL accounting guidance on January 1, 2020 and recorded the cumulative effect of the change in accounting guidance as a reduction to retained earnings and an increase to deferred tax assets.
(2)Amounts have been calculated using whole dollar values.
(3)Excludes guaranteed residential first mortgages that are 90+ days past due and still accruing. Refer to the footnotes on page 13 for amounts related to these loans.
(4)Business represents the combined total of commercial and investor real estate loans.
ACL/ Loans excluding PPP, net (non-GAAP)
Regions believes this Allowance for Credit Losses (ACL) ratio provides investors with meaningful additional information about credit loss allowance levels when the SBA's Paycheck Protection Program (PPP) loans, which are fully backed by the U.S. government, are excluded from total loans and the related allowance for credit losses is excluded from the total allowance for credit losses.
| | | | | | | | | | | | | | | | | | | | | | | | | | | | | |
| As of |
| ($ amounts in millions) | 3/31/2021 | | 12/31/2020 | | 9/30/2020 | | 6/30/2020 | | 3/31/2020 |
| Total Loans | $ | 84,755 | | | $ | 85,266 | | | $ | 88,359 | | | $ | 90,548 | | | $ | 88,098 | |
| Less: SBA PPP Loans | 4,317 | | | 3,624 | | | 4,594 | | | 4,498 | | | — | |
| Loans excluding PPP, net (non-GAAP) | $ | 80,438 | | | $ | 81,642 | | | $ | 83,765 | | | $ | 86,050 | | | $ | 88,098 | |
| ACL at period end | $ | 2,068 | | | $ | 2,293 | | | $ | 2,425 | | | $ | 2,425 | | | $ | 1,665 | |
| Less: SBA PPP Loans' ACL | 3 | | | 1 | | | — | | | — | | | — | |
| ACL excluding PPP Loans' ACL (non-GAAP) | $ | 2,065 | | | $ | 2,292 | | | $ | 2,425 | | | $ | 2,425 | | | $ | 1,665 | |
| ACL/Loans excluding PPP, net (non-GAAP) | 2.57 | % | | 2.81 | % | | 2.90 | % | | 2.82 | % | | 1.89 | % |
Regions Financial Corporation and Subsidiaries
Financial Supplement to First Quarter 2021 Earnings Release
Non-Accrual Loans (excludes loans held for sale)
| | | | | | | | | | | | | | | | | | | | | | | | | | | | | | | | | | | | | | | | | | | | | | | | | | | | | | | | | | | | |
| | As of | |
| ($ amounts in millions) | 3/31/2021 | | 12/31/2020 | | 9/30/2020 | | 6/30/2020 | | 3/31/2020 | |
| Commercial and industrial | $ | 426 | | | 0.98 | % | | $ | 418 | | | 0.97 | % | | $ | 459 | | | 1.02 | % | | $ | 445 | | | 0.93 | % | | $ | 496 | | | 1.09 | % | |
| Commercial real estate mortgage—owner-occupied | 93 | | | 1.73 | % | | 97 | | | 1.80 | % | | 85 | | | 1.56 | % | | 74 | | | 1.35 | % | | 58 | | | 1.05 | % | |
| Commercial real estate construction—owner-occupied | 9 | | | 3.24 | % | | 9 | | | 3.01 | % | | 12 | | | 3.69 | % | | 10 | | | 3.09 | % | | 11 | | | 3.49 | % | |
| Total commercial | 528 | | | 1.08 | % | | 524 | | | 1.08 | % | | 556 | | | 1.09 | % | | 529 | | | 0.99 | % | | 565 | | | 1.10 | % | |
| Commercial investor real estate mortgage | 100 | | | 1.86 | % | | 114 | | | 2.11 | % | | 114 | | | 2.04 | % | | 1 | | | 0.02 | % | | 1 | | | 0.03 | % | |
| Commercial investor real estate construction | — | | | — | % | | — | | | — | % | | 4 | | | 0.19 | % | | — | | | — | % | | — | | | — | % | |
| Total investor real estate | 100 | | | 1.39 | % | | 114 | | | 1.57 | % | | 118 | | | 1.56 | % | | 1 | | | 0.01 | % | | 1 | | | 0.02 | % | |
| Residential first mortgage | 53 | | | 0.32 | % | | 53 | | | 0.32 | % | | 36 | | | 0.22 | % | | 32 | | | 0.21 | % | | 27 | | | 0.18 | % | |
| Home equity—lines of credit | 48 | | | 1.12 | % | | 46 | | | 1.01 | % | | 47 | | | 0.98 | % | | 46 | | | 0.92 | % | | 40 | | | 0.77 | % | |
| Home equity—closed-end | 9 | | | 0.31 | % | | 8 | | | 0.29 | % | | 9 | | | 0.31 | % | | 6 | | | 0.22 | % | | 5 | | | 0.17 | % | |
| Indirect- vehicles | — | | | — | % | | — | | | — | % | | 1 | | | 0.08 | % | | — | | | — | % | | — | | | — | % | |
| Total consumer | 110 | | | 0.38 | % | | 107 | | | 0.36 | % | | 93 | | | 0.31 | % | | 84 | | | 0.28 | % | | 72 | | | 0.24 | % | |
| Total non-accrual loans | $ | 738 | | | 0.87 | % | | $ | 745 | | | 0.87 | % | | $ | 767 | | | 0.87 | % | | $ | 614 | | | 0.68 | % | | $ | 638 | | | 0.72 | % | |
Early and Late Stage Delinquencies
| | | | | | | | | | | | | | | | | | | | | | | | | | | | | | | | | | | | | | | | | | | | | | | | | | | | | | | | | | | | |
Accruing 30-89 Days Past Due Loans | As of | |
| ($ amounts in millions) | 3/31/2021 | | 12/31/2020 | | 9/30/2020 | | 6/30/2020 | | 3/31/2020 | |
| Commercial and industrial | $ | 42 | | | 0.10 | % | | $ | 59 | | | 0.14 | % | | $ | 50 | | | 0.11 | % | | $ | 81 | | | 0.17 | % | | $ | 58 | | | 0.13 | % | |
| Commercial real estate mortgage—owner-occupied | 9 | | | 0.16 | % | | 5 | | | 0.09 | % | | 21 | | | 0.39 | % | | 11 | | | 0.20 | % | | 12 | | | 0.22 | % | |
| Commercial real estate construction—owner-occupied | 1 | | | 0.27 | % | | 1 | | | 0.30 | % | | — | | | 0.01 | % | | 1 | | | 0.15 | % | | — | | | 0.01 | % | |
| Total commercial | 52 | | | 0.11 | % | | 65 | | | 0.13 | % | | 71 | | | 0.14 | % | | 93 | | | 0.17 | % | | 70 | | | 0.14 | % | |
| Commercial investor real estate mortgage | 2 | | | 0.04 | % | | 3 | | | 0.06 | % | | 15 | | | 0.26 | % | | 1 | | | 0.02 | % | | 2 | | | 0.04 | % | |
| Commercial investor real estate construction | 1 | | | 0.03 | % | | — | | | — | % | | — | | | — | % | | — | | | 0.01 | % | | — | | | 0.01 | % | |
| Total investor real estate | 3 | | | 0.04 | % | | 3 | | | 0.04 | % | | 15 | | | 0.19 | % | | 1 | | | 0.02 | % | | 2 | | | 0.03 | % | |
Residential first mortgage—non-guaranteed (1) | 62 | | | 0.39 | % | | 80 | | | 0.51 | % | | 79 | | | 0.51 | % | | 105 | | | 0.71 | % | | 88 | | | 0.62 | % | |
| Home equity—lines of credit | 22 | | | 0.50 | % | | 35 | | | 0.78 | % | | 26 | | | 0.53 | % | | 32 | | | 0.64 | % | | 43 | | | 0.83 | % | |
| Home equity—closed-end | 12 | | | 0.47 | % | | 17 | | | 0.60 | % | | 17 | | | 0.61 | % | | 25 | | | 0.85 | % | | 16 | | | 0.53 | % | |
| Indirect—vehicles | 11 | | | 1.48 | % | | 19 | | | 2.08 | % | | 22 | | | 1.96 | % | | 27 | | | 2.04 | % | | 33 | | | 2.15 | % | |
| Indirect—other consumer | 14 | | | 0.65 | % | | 20 | | | 0.82 | % | | 19 | | | 0.69 | % | | 16 | | | 0.51 | % | | 24 | | | 0.75 | % | |
| Consumer credit card | 12 | | | 1.09 | % | | 14 | | | 1.15 | % | | 13 | | | 1.12 | % | | 13 | | | 1.09 | % | | 18 | | | 1.37 | % | |
| Other consumer | 10 | | | 1.01 | % | | 15 | | | 1.43 | % | | 14 | | | 1.34 | % | | 14 | | | 1.32 | % | | 16 | | | 1.34 | % | |
Total consumer (1) | 143 | | | 0.51 | % | | 200 | | | 0.70 | % | | 190 | | | 0.65 | % | | 232 | | | 0.79 | % | | 238 | | | 0.81 | % | |
Total accruing 30-89 days past due loans (1) | $ | 198 | | | 0.24 | % | | $ | 268 | | | 0.32 | % | | $ | 276 | | | 0.31 | % | | $ | 326 | | | 0.36 | % | | $ | 310 | | | 0.35 | % | |
| | | | | | | | | | | | | | | | | | | | |
| Accruing 90+ Days Past Due Loans | As of | |
| ($ amounts in millions) | 3/31/2021 | | 12/31/2020 | | 9/30/2020 | | 6/30/2020 | | 3/31/2020 | |
| Commercial and industrial | $ | 8 | | | 0.02 | % | | $ | 7 | | | 0.02 | % | | $ | 10 | | | 0.02 | % | | $ | 11 | | | 0.02 | % | | $ | 9 | | | 0.02 | % | |
| Commercial real estate mortgage—owner-occupied | 1 | | | 0.02 | % | | 1 | | | 0.01 | % | | — | | | 0.01 | % | | 3 | | | 0.05 | % | | 1 | | | 0.01 | % | |
| | | | | | | | | | | | | | | | | | | | |
| Total commercial | 9 | | | 0.02 | % | | 8 | | | 0.02 | % | | 10 | | | 0.02 | % | | 14 | | | 0.03 | % | | 10 | | | 0.02 | % | |
| Commercial investor real estate mortgage | — | | | — | % | | — | | | — | % | | 1 | | | 0.01 | % | | — | | | — | % | | — | | | — | % | |
| Total investor real estate | — | | | — | % | | — | | | — | % | | 1 | | | 0.01 | % | | — | | | — | % | | — | | | — | % | |
Residential first mortgage—non-guaranteed (2) | 87 | | | 0.55 | % | | 99 | | | 0.62 | % | | 86 | | | 0.56 | % | | 75 | | | 0.50 | % | | 69 | | | 0.49 | % | |
| Home equity—lines of credit | 19 | | | 0.45 | % | | 19 | | | 0.41 | % | | 25 | | | 0.53 | % | | 26 | | | 0.53 | % | | 26 | | | 0.50 | % | |
| Home equity—closed-end | 14 | | | 0.52 | % | | 13 | | | 0.49 | % | | 12 | | | 0.41 | % | | 12 | | | 0.42 | % | | 11 | | | 0.36 | % | |
| Indirect—vehicles | 3 | | | 0.41 | % | | 4 | | | 0.41 | % | | 5 | | | 0.42 | % | | 8 | | | 0.55 | % | | 6 | | | 0.38 | % | |
| Indirect—other consumer | 4 | | | 0.16 | % | | 5 | | | 0.19 | % | | 3 | | | 0.11 | % | | 3 | | | 0.10 | % | | 4 | | | 0.12 | % | |
| Consumer credit card | 14 | | | 1.25 | % | | 14 | | | 1.19 | % | | 13 | | | 1.08 | % | | 17 | | | 1.38 | % | | 19 | | | 1.49 | % | |
| Other consumer | 4 | | | 0.39 | % | | 2 | | | 0.25 | % | | 3 | | | 0.27 | % | | 5 | | | 0.49 | % | | 5 | | | 0.44 | % | |
Total consumer (2) | 145 | | | 0.52 | % | | 156 | | | 0.54 | % | | 147 | | | 0.50 | % | | 146 | | | 0.49 | % | | 140 | | | 0.47 | % | |
Total accruing 90+ days past due loans (2) | $ | 154 | | | 0.18 | % | | $ | 164 | | | 0.19 | % | | $ | 158 | | | 0.18 | % | | $ | 160 | | | 0.18 | % | | $ | 150 | | | 0.17 | % | |
| | | | | | | | | | | | | | | | | | | | |
Total delinquencies (1) (2) | $ | 352 | | | 0.42 | % | | $ | 432 | | | 0.51 | % | | $ | 434 | | | 0.49 | % | | $ | 486 | | | 0.54 | % | | $ | 460 | | | 0.52 | % | |
(1)Excludes loans that are 100% guaranteed by FHA and guaranteed loans sold to GNMA where Regions has the right but not the obligation to repurchase. Total 30-89 days past due guaranteed loans excluded were $58 million at 3/31/2021, $65 million at 12/31/2020, $57 million at 9/30/2020, $56 million at 6/30/2020, and $37 million at 3/31/2020.
(2)Excludes loans that are 100% guaranteed by FHA and all guaranteed loans sold to GNMA where Regions has the right but not the obligation to repurchase. Total 90 days or more past due guaranteed loans excluded were $51 million at 3/31/2021, $57 million at 12/31/2020, $47 million at 9/30/2020, $55 million at 6/30/2020, and $59 million at 3/31/2020.
Regions Financial Corporation and Subsidiaries
Financial Supplement to First Quarter 2021 Earnings Release
Troubled Debt Restructurings
| | | | | | | | | | | | | | | | | | | | | | | | | | | | | | |
| | As of | |
| ($ amounts in millions) | 3/31/2021 | | 12/31/2020 | | 9/30/2020 | | 6/30/2020 | | 3/31/2020 | |
| Current: | | | | | | | | | | |
| Commercial | $ | 75 | | | $ | 76 | | | $ | 73 | | | $ | 47 | | | $ | 51 | | |
| Investor real estate | 11 | | | 44 | | | 45 | | | 6 | | | 14 | | |
| Residential first mortgage | 197 | | | 174 | | | 162 | | | 158 | | | 156 | | |
| Home equity—lines of credit | 33 | | | 34 | | | 36 | | | 37 | | | 38 | | |
| Home equity—closed-end | 68 | | | 73 | | | 79 | | | 83 | | | 92 | | |
| Consumer credit card | 1 | | | 1 | | | 1 | | | 1 | | | 1 | | |
| Other consumer | 4 | | | 3 | | | 3 | | | 3 | | | 3 | | |
| Total current | 389 | | | 405 | | | 399 | | | 335 | | | 355 | | |
| Accruing 30-89 DPD: | | | | | | | | | | |
| Commercial | 2 | | | 1 | | | 1 | | | 2 | | | 5 | | |
| Investor real estate | 1 | | | — | | | — | | | — | | | — | | |
| Residential first mortgage | 11 | | | 14 | | | 16 | | | 20 | | | 25 | | |
| Home equity—lines of credit | — | | | 1 | | | 1 | | | 1 | | | 2 | | |
| Home equity—closed-end | 3 | | | 5 | | | 4 | | | 7 | | | 6 | | |
| Other consumer | — | | | 1 | | | — | | | — | | | 1 | | |
| Total accruing 30-89 DPD | 17 | | | 22 | | | 22 | | | 30 | | | 39 | | |
| Total accruing and <90 DPD | 406 | | | 427 | | | 421 | | | 365 | | | 394 | | |
| Non-accrual or 90+ DPD: | | | | | | | | | | |
| Commercial | 125 | | | 124 | | | 178 | | | 214 | | | 159 | | |
| Investor real estate | — | | | — | | | — | | | — | | | 1 | | |
| Residential first mortgage | 36 | | | 42 | | | 36 | | | 37 | | | 37 | | |
| Home equity—lines of credit | 3 | | | 2 | | | 2 | | | 3 | | | 2 | | |
| Home equity—closed-end | 7 | | | 7 | | | 8 | | | 7 | | | 6 | | |
| Total non-accrual or 90+DPD | 171 | | | 175 | | | 224 | | | 261 | | | 205 | | |
| Total TDRs - Loans | $ | 577 | | | $ | 602 | | | $ | 645 | | | $ | 626 | | | $ | 599 | | |
| TDRs - Held For Sale | 1 | | | 1 | | | — | | | — | | | — | | |
| Total TDRs | $ | 578 | | | $ | 603 | | | $ | 645 | | | $ | 626 | | | $ | 599 | | |
| | | | | | | | | | |
| | | | | | | | | | |
| Total TDRs - Loans by Portfolio | | | | | | | | | | |
| As of | |
| ($ amounts in millions) | 3/31/2021 | | 12/31/2020 | | 9/30/2020 | | 6/30/2020 | | 3/31/2020 | |
| Total commercial TDRs | $ | 202 | | | $ | 201 | | | $ | 252 | | | $ | 263 | | | $ | 215 | | |
| Total investor real estate TDRs | 12 | | | 44 | | | 45 | | | 6 | | | 15 | | |
| Total consumer TDRs | 363 | | | 357 | | | 348 | | | 357 | | | 369 | | |
| Total TDRs - Loans | $ | 577 | | | $ | 602 | | | $ | 645 | | | $ | 626 | | | $ | 599 | | |
Regions Financial Corporation and Subsidiaries
Financial Supplement to First Quarter 2021 Earnings Release
Consolidated Balance Sheets (unaudited) | | | | | | | | | | | | | | | | | | | | | | | | | | | | | |
| As of |
| ($ amounts in millions) | 3/31/2021 | | 12/31/2020 | | 9/30/2020 | | 6/30/2020 | | 3/31/2020 |
| Assets: | | | | | | | | | |
| Cash and due from banks | $ | 1,918 | | | $ | 1,558 | | | $ | 1,972 | | | $ | 1,619 | | | $ | 2,101 | |
| Interest-bearing deposits in other banks | 23,002 | | | 16,398 | | | 11,501 | | | 11,579 | | | 3,154 | |
| | | | | | | | | |
| | | | | | | | | |
| Debt securities held to maturity | 1,059 | | | 1,122 | | | 1,190 | | | 1,255 | | | 1,296 | |
| Debt securities available for sale | 27,092 | | | 27,154 | | | 27,007 | | | 23,898 | | | 23,775 | |
| Loans held for sale | 1,487 | | | 1,905 | | | 1,187 | | | 1,152 | | | 566 | |
| Loans, net of unearned income | 84,755 | | | 85,266 | | | 88,359 | | | 90,548 | | | 88,098 | |
Allowance for loan losses | (1,976) | | | (2,167) | | | (2,276) | | | (2,276) | | | (1,560) | |
| Net loans | 82,779 | | | 83,099 | | | 86,083 | | | 88,272 | | | 86,538 | |
| Other earning assets | 1,262 | | | 1,217 | | | 1,267 | | | 1,238 | | | 1,722 | |
| Premises and equipment, net | 1,852 | | | 1,897 | | | 1,896 | | | 1,929 | | | 1,935 | |
| Interest receivable | 336 | | | 346 | | | 347 | | | 343 | | | 349 | |
| Goodwill | 5,181 | | | 5,190 | | | 5,187 | | | 5,193 | | | 4,845 | |
| Residential mortgage servicing rights at fair value (MSRs) | 401 | | | 296 | | | 267 | | | 249 | | | 254 | |
| Other identifiable intangible assets, net | 114 | | | 122 | | | 129 | | | 137 | | | 98 | |
| Other assets | 6,848 | | | 7,085 | | | 7,147 | | | 7,206 | | | 6,909 | |
| Total assets | $ | 153,331 | | | $ | 147,389 | | | $ | 145,180 | | | $ | 144,070 | | | $ | 133,542 | |
| Liabilities and Equity: | | | | | | | | | |
| Deposits: | | | | | | | | | |
| Non-interest-bearing | $ | 55,925 | | | $ | 51,289 | | | $ | 49,754 | | | $ | 47,964 | | | $ | 37,133 | |
| Interest-bearing | 73,677 | | | 71,190 | | | 68,691 | | | 68,815 | | | 62,897 | |
| Total deposits | 129,602 | | | 122,479 | | | 118,445 | | | 116,779 | | | 100,030 | |
| Borrowed funds: | | | | | | | | | |
| | | | | | | | | |
| | | | | | | | | |
| | | | | | | | | |
| Short-term borrowings | — | | | — | | | — | | | — | | | 3,150 | |
| Long-term borrowings | 2,916 | | | 3,569 | | | 4,919 | | | 6,408 | | | 10,105 | |
| Total borrowed funds | 2,916 | | | 3,569 | | | 4,919 | | | 6,408 | | | 13,255 | |
| Other liabilities | 2,951 | | | 3,230 | | | 3,912 | | | 3,255 | | | 2,925 | |
| Total liabilities | 135,469 | | | 129,278 | | | 127,276 | | | 126,442 | | | 116,210 | |
| Equity: | | | | | | | | | |
| Preferred stock, non-cumulative perpetual | 1,656 | | | 1,656 | | | 1,656 | | | 1,656 | | | 1,310 | |
| | | | | | | | | |
| Common stock | 10 | | | 10 | | | 10 | | | 10 | | | 10 | |
| Additional paid-in capital | 12,740 | | | 12,731 | | | 12,714 | | | 12,703 | | | 12,695 | |
| Retained earnings | 4,235 | | | 3,770 | | | 3,330 | | | 2,978 | | | 3,364 | |
| Treasury stock, at cost | (1,371) | | | (1,371) | | | (1,371) | | | (1,371) | | | (1,371) | |
| Accumulated other comprehensive income, net | 592 | | | 1,315 | | | 1,565 | | | 1,626 | | | 1,324 | |
| Total shareholders’ equity | 17,862 | | | 18,111 | | | 17,904 | | | 17,602 | | | 17,332 | |
Noncontrolling interest | — | | | — | | | — | | | 26 | | | — | |
Total equity | 17,862 | | | 18,111 | | | 17,904 | | | 17,628 | | | 17,332 | |
Total liabilities and equity | $ | 153,331 | | | $ | 147,389 | | | $ | 145,180 | | | $ | 144,070 | | | $ | 133,542 | |
Regions Financial Corporation and Subsidiaries
Financial Supplement to First Quarter 2021 Earnings Release
End of Period Loans
| | | | | | | | | | | | | | | | | | | | | | | | | | | | | | | | | | | | | | | | | | | | | | | | | | | | | |
| As of |
| | | | | | | | | | | 3/31/2021 | | 3/31/2021 |
| ($ amounts in millions) | 3/31/2021 | | 12/31/2020 | | 9/30/2020 | | 6/30/2020 | | 3/31/2020 | | vs. 12/31/2020 | | vs. 3/31/2020 |
| Commercial and industrial | $ | 43,241 | | | $ | 42,870 | | | $ | 45,199 | | | $ | 47,670 | | | $ | 45,388 | | | $ | 371 | | | 0.9 | % | | $ | (2,147) | | | (4.7) | % |
| Commercial real estate mortgage—owner-occupied | 5,335 | | | 5,405 | | | 5,451 | | | 5,491 | | | 5,550 | | | (70) | | | (1.3) | % | | (215) | | | (3.9) | % |
| Commercial real estate construction—owner-occupied | 293 | | | 300 | | | 305 | | | 314 | | | 309 | | | (7) | | | (2.3) | % | | (16) | | | (5.2) | % |
| Total commercial | 48,869 | | | 48,575 | | | 50,955 | | | 53,475 | | | 51,247 | | | 294 | | | 0.6 | % | | (2,378) | | | (4.6) | % |
| | | | | | | | | | | | | | | | | |
| | | | | | | | | | | | | | | | | |
| Commercial investor real estate mortgage | 5,405 | | | 5,394 | | | 5,598 | | | 5,221 | | | 5,079 | | | 11 | | | 0.2 | % | | 326 | | | 6.4 | % |
| Commercial investor real estate construction | 1,817 | | | 1,869 | | | 1,984 | | | 1,908 | | | 1,784 | | | (52) | | | (2.8) | % | | 33 | | | 1.8 | % |
| Total investor real estate | 7,222 | | | 7,263 | | | 7,582 | | | 7,129 | | | 6,863 | | | (41) | | | (0.6) | % | | 359 | | | 5.2 | % |
| Total business | 56,091 | | | 55,838 | | | 58,537 | | | 60,604 | | | 58,110 | | | 253 | | | 0.5 | % | | (2,019) | | | (3.5) | % |
| | | | | | | | | | | | | | | | | |
| | | | | | | | | | | | | | | | | |
| Residential first mortgage | 16,643 | | | 16,575 | | | 16,195 | | | 15,382 | | | 14,535 | | | 68 | | | 0.4 | % | | 2,108 | | | 14.5 | % |
Home equity—lines of credit (1) | 4,286 | | | 4,539 | | | 4,753 | | | 4,953 | | | 5,201 | | | (253) | | | (5.6) | % | | (915) | | | (17.6) | % |
Home equity—closed-end (2) | 2,631 | | | 2,713 | | | 2,839 | | | 2,937 | | | 3,000 | | | (82) | | | (3.0) | % | | (369) | | | (12.3) | % |
| Indirect—vehicles | 768 | | | 934 | | | 1,120 | | | 1,331 | | | 1,557 | | | (166) | | | (17.8) | % | | (789) | | | (50.7) | % |
| Indirect—other consumer | 2,262 | | | 2,431 | | | 2,663 | | | 3,022 | | | 3,202 | | | (169) | | | (7.0) | % | | (940) | | | (29.4) | % |
| Consumer credit card | 1,111 | | | 1,213 | | | 1,189 | | | 1,213 | | | 1,303 | | | (102) | | | (8.4) | % | | (192) | | | (14.7) | % |
| Other consumer | 963 | | | 1,023 | | | 1,063 | | | 1,106 | | | 1,190 | | | (60) | | | (5.9) | % | | (227) | | | (19.1) | % |
| Total consumer | 28,664 | | | 29,428 | | | 29,822 | | | 29,944 | | | 29,988 | | | (764) | | | (2.6) | % | | (1,324) | | | (4.4) | % |
| Total Loans | $ | 84,755 | | | $ | 85,266 | | | $ | 88,359 | | | $ | 90,548 | | | $ | 88,098 | | | $ | (511) | | | (0.6) | % | | $ | (3,343) | | | (3.8) | % |
_______(1) The balance of Regions' home equity lines of credit consists of $2,371 million of first lien and $1,915 million of second lien at 3/31/2021.
(2) The balance of Regions' closed-end home equity loans consists of $2,423 million of first lien and $208 million of second lien at 3/31/2021.
Adjusted Ending Balances of Loans (non-GAAP)
Regions believes adjusting ending loan balances for the impact of commercial loans transferred to held for sale, SBA PPP loans, the indirect-other consumer exit portfolio and the indirect-vehicles exit portfolio, provides a meaningful calculation of loan growth rates and presents them on the same basis as that applied by management.
| | | | | | | | | | | | | | | | | | | | | | | | | | | | | | | | | | | | | | | | | | | | | | | | | | | | | |
| As of |
| | | | | | | | | | | 3/31/2021 | | 3/31/2021 |
| ($ amounts in millions) | 3/31/2021 | | 12/31/2020 | | 9/30/2020 | | 6/30/2020 | | 3/31/2020 | | vs. 12/31/2020 | | vs. 3/31/2020 |
| Commercial and industrial | $ | 43,241 | | | $ | 42,870 | | | $ | 45,199 | | | $ | 47,670 | | | $ | 45,388 | | | $ | 371 | | | 0.9 | % | | $ | (2,147) | | | (4.7) | % |
| Less: Commercial loans transferred to held for sale | — | | | — | | | 239 | | | 239 | | | — | | | — | | | NM | | — | | | NM |
| Less: SBA PPP Loans | 4,317 | | | 3,624 | | | 4,594 | | | 4,498 | | | — | | | 693 | | | 19.1 | % | | 4,317 | | | NM |
| Adjusted commercial and industrial loans (non-GAAP) | $ | 38,924 | | | $ | 39,246 | | | $ | 40,366 | | | $ | 42,933 | | | $ | 45,388 | | | $ | (322) | | | (0.8) | % | | $ | (6,464) | | | (14.2) | % |
| Total commercial loans | $ | 48,869 | | | $ | 48,575 | | | $ | 50,955 | | | $ | 53,475 | | | $ | 51,247 | | | $ | 294 | | | 0.6 | % | | $ | (2,378) | | | (4.6) | % |
| Less: Commercial loans transferred to held for sale | — | | | — | | | 239 | | | 239 | | | — | | | — | | | NM | | — | | | NM |
| Less: SBA PPP Loans | 4,317 | | | 3,624 | | | 4,594 | | | 4,498 | | | — | | | 693 | | | 19.1 | % | | 4,317 | | | NM |
| Adjusted total commercial loans (non-GAAP) | $ | 44,552 | | | $ | 44,951 | | | $ | 46,122 | | | $ | 48,738 | | | $ | 51,247 | | | $ | (399) | | | (0.9) | % | | $ | (6,695) | | | (13.1) | % |
| | | | | | | | | | | | | | | | | |
| Total business loans | 56,091 | | | $ | 55,838 | | | $ | 58,537 | | | $ | 60,604 | | | $ | 58,110 | | | $ | 253 | | | 0.5 | % | | $ | (2,019) | | | (3.5) | % |
| Less: Commercial loans transferred to held for sale | — | | | — | | | 239 | | | 239 | | | — | | | — | | | NM | | — | | | NM |
| Less: SBA PPP Loans | 4,317 | | | 3,624 | | | 4,594 | | | 4,498 | | | — | | | 693 | | | 19.1 | % | | 4,317 | | | NM |
| Adjusted total business loans (non-GAAP) | $ | 51,774 | | | $ | 52,214 | | | $ | 53,704 | | | $ | 55,867 | | | $ | 58,110 | | | $ | (440) | | | (0.8) | % | | $ | (6,336) | | | (10.9) | % |
| Total consumer loans | $ | 28,664 | | | $ | 29,428 | | | $ | 29,822 | | | $ | 29,944 | | | $ | 29,988 | | | $ | (764) | | | (2.6) | % | | $ | (1,324) | | | (4.4) | % |
Less: Indirect—other consumer exit portfolio (1) | 971 | | | 1,101 | | | 1,240 | | | 1,406 | | | 1,591 | | | (130) | | | (11.8) | % | | (620) | | | (39.0) | % |
| Less: Indirect—vehicles | 768 | | | 934 | | | 1,120 | | | 1,331 | | | 1,557 | | | (166) | | | (17.8) | % | | (789) | | | (50.7) | % |
| Adjusted total consumer loans (non-GAAP) | $ | 26,925 | | | $ | 27,393 | | | $ | 27,462 | | | $ | 27,207 | | | $ | 26,840 | | | $ | (468) | | | (1.7) | % | | $ | 85 | | | 0.3 | % |
| Total loans | $ | 84,755 | | | $ | 85,266 | | | $ | 88,359 | | | $ | 90,548 | | | $ | 88,098 | | | $ | (511) | | | (0.6) | % | | $ | (3,343) | | | (3.8) | % |
| | | | | | | | | | | | | | | | | |
| | | | | | | | | | | | | | | | | |
| Less: Commercial loans transferred to held for sale | — | | | — | | | 239 | | | 239 | | | — | | | — | | | NM | | — | | | NM |
| Less: SBA PPP Loans | 4,317 | | | 3,624 | | | 4,594 | | | 4,498 | | | — | | | 693 | | | 19.1 | % | | 4,317 | | | NM |
Less: Indirect—other consumer exit portfolio (1) | 971 | | | 1,101 | | | 1,240 | | | 1,406 | | | 1,591 | | | (130) | | | (11.8) | % | | (620) | | | (39.0) | % |
| Less: Indirect—vehicles | 768 | | | 934 | | | 1,120 | | | 1,331 | | | 1,557 | | | (166) | | | (17.8) | % | | (789) | | | (50.7) | % |
| Adjusted ending total loans (non-GAAP) | $ | 78,699 | | | $ | 79,607 | | | $ | 81,166 | | | $ | 83,074 | | | $ | 84,950 | | | $ | (908) | | | (1.1) | % | | $ | (6,251) | | | (7.4) | % |
_______
(1)In the fourth quarter of 2019, Regions decided not to renew a third party relationship.
Regions Financial Corporation and Subsidiaries
Financial Supplement to First Quarter 2021 Earnings Release
End of Period Loans (continued)
| | | | | | | | | | | | | | | | | | | | | | | | | | | | | |
| As of |
| End of Period Loans by Percentage | 3/31/2021 | | 12/31/2020 | | 9/30/2020 | | 6/30/2020 | | 3/31/2020 |
| Commercial and industrial | 51.0 | % | | 50.3 | % | | 51.2 | % | | 52.6 | % | | 51.5 | % |
| Commercial real estate mortgage—owner-occupied | 6.3 | % | | 6.3 | % | | 6.2 | % | | 6.1 | % | | 6.3 | % |
| Commercial real estate construction—owner-occupied | 0.3 | % | | 0.4 | % | | 0.3 | % | | 0.3 | % | | 0.4 | % |
| Total commercial | 57.6 | % | | 57.0 | % | | 57.7 | % | | 59.0 | % | | 58.2 | % |
| Commercial investor real estate mortgage | 6.4 | % | | 6.3 | % | | 6.3 | % | | 5.8 | % | | 5.8 | % |
| Commercial investor real estate construction | 2.1 | % | | 2.2 | % | | 2.2 | % | | 2.1 | % | | 2.0 | % |
| Total investor real estate | 8.5 | % | | 8.5 | % | | 8.5 | % | | 7.9 | % | | 7.8 | % |
| Total business | 66.1 | % | | 65.5 | % | | 66.2 | % | | 66.9 | % | | 66.0 | % |
| Residential first mortgage | 19.6 | % | | 19.4 | % | | 18.3 | % | | 17.0 | % | | 16.5 | % |
| Home equity—lines of credit | 5.1 | % | | 5.3 | % | | 5.4 | % | | 5.5 | % | | 5.9 | % |
| Home equity—closed-end | 3.1 | % | | 3.2 | % | | 3.2 | % | | 3.2 | % | | 3.4 | % |
| Indirect—vehicles | 0.9 | % | | 1.1 | % | | 1.3 | % | | 1.5 | % | | 1.8 | % |
| Indirect—other consumer | 2.7 | % | | 2.9 | % | | 3.0 | % | | 3.3 | % | | 3.6 | % |
| Consumer credit card | 1.3 | % | | 1.4 | % | | 1.3 | % | | 1.3 | % | | 1.5 | % |
| Other consumer | 1.2 | % | | 1.2 | % | | 1.3 | % | | 1.3 | % | | 1.3 | % |
| Total consumer | 33.9 | % | | 34.5 | % | | 33.8 | % | | 33.1 | % | | 34.0 | % |
| Total Loans | 100.0 | % | | 100.0 | % | | 100.0 | % | | 100.0 | % | | 100.0 | % |
| | | | | | | | | |
| | | | | | | | | |
Regions Financial Corporation and Subsidiaries
Financial Supplement to First Quarter 2021 Earnings Release
Average Balances of Loans
| | | | | | | | | | | | | | | | | | | | | | | | | | | | | | | | | | | | | | | | | | | | | | | | | | | | | |
| | Average Balances |
| ($ amounts in millions) | 1Q21 | | 4Q20 | | 3Q20 | | 2Q20 | | 1Q20 | | 1Q21 vs. 4Q20 | | 1Q21 vs. 1Q20 |
| Commercial and industrial | $ | 42,816 | | | $ | 43,889 | | | $ | 46,405 | | | $ | 49,296 | | | $ | 40,519 | | | $ | (1,073) | | | (2.4) | % | | $ | 2,297 | | | 5.7 | % |
| Commercial real estate mortgage—owner-occupied | 5,375 | | | 5,405 | | | 5,498 | | | 5,492 | | | 5,509 | | | (30) | | | (0.6) | % | | (134) | | | (2.4) | % |
| Commercial real estate construction—owner-occupied | 303 | | | 303 | | | 318 | | | 312 | | | 323 | | | — | | | — | % | | (20) | | | (6.2) | % |
| Total commercial | 48,494 | | | 49,597 | | | 52,221 | | | 55,100 | | | 46,351 | | | (1,103) | | | (2.2) | % | | 2,143 | | | 4.6 | % |
| | | | | | | | | | | | | | | | | |
| | | | | | | | | | | | | | | | | |
| Commercial investor real estate mortgage | 5,375 | | | 5,549 | | | 5,324 | | | 5,150 | | | 4,975 | | | (174) | | | (3.1) | % | | 400 | | | 8.0 | % |
| Commercial investor real estate construction | 1,847 | | | 1,899 | | | 1,974 | | | 1,869 | | | 1,673 | | | (52) | | | (2.7) | % | | 174 | | | 10.4 | % |
| Total investor real estate | 7,222 | | | 7,448 | | | 7,298 | | | 7,019 | | | 6,648 | | | (226) | | | (3.0) | % | | 574 | | | 8.6 | % |
| Total business | 55,716 | | | 57,045 | | | 59,519 | | | 62,119 | | | 52,999 | | | (1,329) | | | (2.3) | % | | 2,717 | | | 5.1 | % |
| | | | | | | | | | | | | | | | | |
| | | | | | | | | | | | | | | | | |
| Residential first mortgage | 16,606 | | | 16,433 | | | 15,786 | | | 14,884 | | | 14,469 | | | 173 | | | 1.1 | % | | 2,137 | | | 14.8 | % |
| Home equity—lines of credit | 4,416 | | | 4,646 | | | 4,842 | | | 5,072 | | | 5,237 | | | (230) | | | (5.0) | % | | (821) | | | (15.7) | % |
| Home equity—closed-end | 2,669 | | | 2,765 | | | 2,885 | | | 2,970 | | | 3,038 | | | (96) | | | (3.5) | % | | (369) | | | (12.1) | % |
| Indirect—vehicles | 850 | | | 1,023 | | | 1,223 | | | 1,441 | | | 1,679 | | | (173) | | | (16.9) | % | | (829) | | | (49.4) | % |
| Indirect—other consumer | 2,352 | | | 2,514 | | | 2,835 | | | 3,111 | | | 3,263 | | | (162) | | | (6.4) | % | | (911) | | | (27.9) | % |
| Consumer credit card | 1,151 | | | 1,190 | | | 1,194 | | | 1,230 | | | 1,348 | | | (39) | | | (3.3) | % | | (197) | | | (14.6) | % |
| Other consumer | 995 | | | 1,048 | | | 1,086 | | | 1,137 | | | 1,216 | | | (53) | | | (5.1) | % | | (221) | | | (18.2) | % |
| Total consumer | 29,039 | | | 29,619 | | | 29,851 | | | 29,845 | | | 30,250 | | | (580) | | | (2.0) | % | | (1,211) | | | (4.0) | % |
| Total loans | $ | 84,755 | | | $ | 86,664 | | | $ | 89,370 | | | $ | 91,964 | | | $ | 83,249 | | | $ | (1,909) | | | (2.2) | % | | $ | 1,506 | | | 1.8 | % |
Adjusted Average Balances of Loans (non-GAAP)
Regions believes adjusting total average loans for the impact of commercial loans transferred to held for sale, SBA PPP loans, the indirect-other consumer exit portfolio and the indirect- vehicles exit portfolio, provides a meaningful calculation of loan growth rates and presents them on the same basis as that applied by management.
| | | | | | | | | | | | | | | | | | | | | | | | | | | | | | | | | | | | | | | | | | | | | | | | | | | | | |
| | Average Balances |
| ($ amounts in millions) | 1Q21 | | 4Q20 | | 3Q20 | | 2Q20 | | 1Q20 | | 1Q21 vs. 4Q20 | | 1Q21 vs. 1Q20 |
| Commercial and industrial | $ | 42,816 | | | $ | 43,889 | | | $ | 46,405 | | | $ | 49,296 | | | $ | 40,519 | | | $ | (1,073) | | | (2.4) | % | | $ | 2,297 | | | 5.7 | % |
Less: Commercial loans transferred to held for sale(1) | — | | | 237 | | | 239 | | | 239 | | | — | | | (237) | | | (100.0) | % | | — | | | NM |
| Less: SBA PPP Loans | 3,798 | | | 4,143 | | | 4,558 | | | 3,213 | | | — | | | (345) | | | (8.3) | % | | 3,798 | | | NM |
| Adjusted commercial and industrial loans (non-GAAP) | $ | 39,018 | | | $ | 39,509 | | | $ | 41,608 | | | $ | 45,844 | | | $ | 40,519 | | | $ | (491) | | | (1.2) | % | | $ | (1,501) | | | (3.7) | % |
| Total commercial loans | $ | 48,494 | | | $ | 49,597 | | | $ | 52,221 | | | $ | 55,100 | | | $ | 46,351 | | | $ | (1,103) | | | (2.2) | % | | $ | 2,143 | | | 4.6 | % |
Less: Commercial loans transferred to held for sale(1) | — | | | 237 | | | 239 | | | 239 | | | — | | | (237) | | | (100.0) | % | | — | | | NM |
| Less: SBA PPP Loans | 3,798 | | | 4,143 | | | 4,558 | | | 3,213 | | | — | | | (345) | | | (8.3) | % | | 3,798 | | | NM |
| Adjusted total commercial loans (non-GAAP) | $ | 44,696 | | | $ | 45,217 | | | $ | 47,424 | | | $ | 51,648 | | | $ | 46,351 | | | $ | (521) | | | (1.2) | % | | $ | (1,655) | | | (3.6) | % |
| | | | | | | | | | | | | | | | | |
| Total business loans | $ | 55,716 | | | $ | 57,045 | | | $ | 59,519 | | | $ | 62,119 | | | $ | 52,999 | | | $ | (1,329) | | | (2.3) | % | | $ | 2,717 | | | 5.1 | % |
Less: Commercial loans transferred to held for sale(1) | — | | | 237 | | | 239 | | | 239 | | | — | | | (237) | | | (100.0) | % | | — | | | NM |
| Less: SBA PPP Loans | 3,798 | | | 4,143 | | | 4,558 | | | 3,213 | | | — | | | (345) | | | (8.3) | % | | 3,798 | | | NM |
| Adjusted total business loans (non-GAAP) | $ | 51,918 | | | $ | 52,665 | | | $ | 54,722 | | | $ | 58,667 | | | $ | 52,999 | | | $ | (747) | | | (1.4) | % | | $ | (1,081) | | | (2.0) | % |
| Total consumer loans | $ | 29,039 | | | $ | 29,619 | | | $ | 29,851 | | | $ | 29,845 | | | $ | 30,250 | | | $ | (580) | | | (2.0) | % | | $ | (1,211) | | | (4.0) | % |
Less: Indirect—other consumer exit portfolio (2) | 1,034 | | | 1,164 | | | 1,318 | | | 1,493 | | | 1,696 | | | (130) | | | (11.2) | % | | (662) | | | (39.0) | % |
| Less: Indirect—vehicles | 850 | | | 1,023 | | | 1,223 | | | 1,441 | | | 1,679 | | | (173) | | | (16.9) | % | | (829) | | | (49.4) | % |
| Adjusted total consumer loans (non-GAAP) | $ | 27,155 | | | $ | 27,432 | | | $ | 27,310 | | | $ | 26,911 | | | $ | 26,875 | | | $ | (277) | | | (1.0) | % | | $ | 280 | | | 1.0 | % |
| Total loans | $ | 84,755 | | | $ | 86,664 | | | $ | 89,370 | | | $ | 91,964 | | | $ | 83,249 | | | $ | (1,909) | | | (2.2) | % | | $ | 1,506 | | | 1.8 | % |
| | | | | | | | | | | | | | | | | |
| | | | | | | | | | | | | | | | | |
Less: Commercial loans transferred to held for sale(1) | — | | | 237 | | | 239 | | | 239 | | | — | | | (237) | | | (100.0) | % | | — | | | NM |
| Less: SBA PPP Loans | 3,798 | | | 4,143 | | | 4,558 | | | 3,213 | | | — | | | (345) | | | (8.3) | % | | 3,798 | | | NM |
Less: Indirect—other consumer exit portfolio (2) | 1,034 | | | 1,164 | | | 1,318 | | | 1,493 | | | 1,696 | | | (130) | | | (11.2) | % | | (662) | | | (39.0) | % |
| Less: Indirect—vehicles | 850 | | | 1,023 | | | 1,223 | | | 1,441 | | | 1,679 | | | (173) | | | (16.9) | % | | (829) | | | (49.4) | % |
| Adjusted total loans (non-GAAP) | $ | 79,073 | | | $ | 80,097 | | | $ | 82,032 | | | $ | 85,578 | | | $ | 79,874 | | | $ | (1,024) | | | (1.3) | % | | $ | (801) | | | (1.0) | % |
(1)In the fourth quarter of 2020, Regions made the decision to sell a certain portfolio of $239 million of commercial and industrial loans, which were reclassified to held for sale as of December 31, 2020.
(2)In the fourth quarter of 2019, Regions decided not to renew a third party relationship.
Regions Financial Corporation and Subsidiaries
Financial Supplement to First Quarter 2021 Earnings Release
End of Period Deposits | | | | | | | | | | | | | | | | | | | | | | | | | | | | | | | | | | | | | | | | | | | | | | | | | | | | | |
| | As of |
| | | | | | | | | | | | 3/31/2021 | | 3/31/2021 |
| ($ amounts in millions) | 3/31/2021 | | 12/31/2020 | | 9/30/2020 | | 6/30/2020 | | 3/31/2020 | | vs. 12/31/2020 | | vs. 3/31/2020 |
| | | | | | | | | | | | | | | | | |
| Interest-free deposits | $ | 55,925 | | | $ | 51,289 | | | $ | 49,754 | | | $ | 47,964 | | | $ | 37,133 | | | $ | 4,636 | | | 9.0 | % | | $ | 18,792 | | | 50.6 | % |
| Interest-bearing checking | 24,757 | | | 24,484 | | | 22,294 | | | 22,407 | | | 19,992 | | | 273 | | | 1.1 | % | | $ | 4,765 | | | 23.8 | % |
| Savings | 13,500 | | | 11,635 | | | 11,159 | | | 10,698 | | | 9,199 | | | 1,865 | | | 16.0 | % | | $ | 4,301 | | | 46.8 | % |
| Money market—domestic | 30,448 | | | 29,719 | | | 29,387 | | | 29,263 | | | 26,328 | | | 729 | | | 2.5 | % | | $ | 4,120 | | | 15.6 | % |
| | | | | | | | | | | | | | | | | |
| Low-cost deposits | 124,630 | | | 117,127 | | | 112,594 | | | 110,332 | | | 92,652 | | | 7,503 | | | 6.4 | % | | $ | 31,978 | | | 34.5 | % |
| Time deposits | 4,970 | | | 5,341 | | | 5,840 | | | 6,428 | | | 7,122 | | | (371) | | | (6.9) | % | | $ | (2,152) | | | (30.2) | % |
| Total Customer Deposits | 129,600 | | | 122,468 | | | 118,434 | | | 116,760 | | | 99,774 | | | 7,132 | | | 5.8 | % | | 29,826 | | | 29.9 | % |
| Corporate treasury time deposits | 2 | | | 11 | | | 11 | | | 19 | | | 256 | | | (9) | | | (81.8) | % | | (254) | | | (99.2) | % |
| | | | | | | | | | | | | | | | | |
| Total Deposits | $ | 129,602 | | | $ | 122,479 | | | $ | 118,445 | | | $ | 116,779 | | | $ | 100,030 | | | $ | 7,123 | | | 5.8 | % | | $ | 29,572 | | | 29.6 | % |
| | | | | | | | | | | | | | | | | |
| | | | | | | | | | | | | | | | | |
| | | | | | | | | | | | | | | | | |
| | | | | | | | | | | | | | | | | |
| | As of |
| | | | | | | | | | | | 3/31/2021 | | 3/31/2021 |
| ($ amounts in millions) | 3/31/2021 | | 12/31/2020 | | 9/30/2020 | | 6/30/2020 | | 3/31/2020 | | vs. 12/31/2020 | | vs. 3/31/2020 |
| Consumer Bank Segment | $ | 77,381 | | | $ | 71,652 | | | $ | 69,265 | | | $ | 68,616 | | | $ | 61,238 | | | $ | 5,729 | | | 8.0 | % | | $ | 16,143 | | | 26.4 | % |
| Corporate Bank Segment | 42,211 | | | 40,745 | | | 39,799 | | | 38,848 | | | 29,862 | | | 1,466 | | | 3.6 | % | | 12,349 | | | 41.4 | % |
| Wealth Management Segment | 9,537 | | | 9,718 | | | 8,982 | | | 8,888 | | | 8,372 | | | (181) | | | (1.9) | % | | 1,165 | | | 13.9 | % |
Other (1) | 473 | | | 364 | | | 399 | | | 427 | | | 558 | | | 109 | | | 29.9 | % | | (85) | | | (15.2) | % |
| Total Deposits | $ | 129,602 | | | $ | 122,479 | | | $ | 118,445 | | | $ | 116,779 | | | $ | 100,030 | | | $ | 7,123 | | | 5.8 | % | | $ | 29,572 | | | 29.6 | % |
| | | | | | | | | | | | | | | | | |
| | As of |
| | | | | | | | | | | | 3/31/2021 | | 3/31/2021 |
| ($ amounts in millions) | 3/31/2021 | | 12/31/2020 | | 9/30/2020 | | 6/30/2020 | | 3/31/2020 | | vs. 12/31/2020 | | vs. 3/31/2020 |
| Wealth Management - Private Wealth | $ | 8,589 | | | $ | 8,462 | | | $ | 7,726 | | | $ | 7,816 | | | $ | 7,168 | | | $ | 127 | | | 1.5 | % | | $ | 1,421 | | | 19.8 | % |
| Wealth Management - Institutional Services | 948 | | | 1,256 | | | 1,256 | | | 1,072 | | | 1,204 | | | (308) | | | (24.5) | % | | (256) | | | (21.3) | % |
| Total Wealth Management Segment Deposits | $ | 9,537 | | | $ | 9,718 | | | $ | 8,982 | | | $ | 8,888 | | | $ | 8,372 | | | $ | (181) | | | (1.9) | % | | $ | 1,165 | | | 13.9 | % |
| | | | | | | | | | | | | | | | | |
| | | | As of |
| End of Period Deposits by Percentage | | | | 3/31/2021 | | 12/31/2020 | | 9/30/2020 | | 6/30/2020 | | 3/31/2020 |
| Interest-free deposits | | | | 43.2 | % | | 41.9 | % | | 42.0 | % | | 41.1 | % | | 37.1 | % |
| Interest-bearing checking | | | | 19.1 | % | | 20.0 | % | | 18.8 | % | | 19.2 | % | | 20.0 | % |
| Savings | | | | 10.4 | % | | 9.5 | % | | 9.4 | % | | 9.2 | % | | 9.2 | % |
| Money market—domestic | | | | 23.5 | % | | 24.3 | % | | 24.8 | % | | 25.1 | % | | 26.3 | % |
| | | | | | | | | | | | |
| Low-cost deposits | | | | 96.2 | % | | 95.7 | % | | 95.0 | % | | 94.6 | % | | 92.6 | % |
| Time deposits | | | | 3.8 | % | | 4.3 | % | | 5.0 | % | | 5.5 | % | | 7.1 | % |
| Total Customer Deposits | | | | 100.0 | % | | 100.0 | % | | 100.0 | % | | 100.0 | % | | 99.7 | % |
| | | | | | | | | | | | |
| Corporate treasury time deposits | | | | — | % | | — | % | | — | % | | — | % | | 0.3 | % |
| | | | | | | | | | | | |
| Total Deposits | | | | 100.0 | % | | 100.0 | % | | 100.0 | % | | 100.0 | % | | 100.0 | % |
(1)Other deposits represent non-customer balances primarily consisting of wholesale funding (for example, Eurodollar trade deposits, selected deposits and brokered time deposits).
Regions Financial Corporation and Subsidiaries
Financial Supplement to First Quarter 2021 Earnings Release
Average Balances of Deposits
| | | | | | | | | | | | | | | | | | | | | | | | | | | | | | | | | | | | | | | | | | | | | | | | | | | | | |
| Average Balances |
| ($ amounts in millions) | 1Q21 | | 4Q20 | | 3Q20 | | 2Q20 | | 1Q20 | | 1Q21 vs. 4Q20 | | 1Q21 vs. 1Q20 |
| | | | | | | | | | | | | | | | | |
| Interest-free deposits | $ | 51,839 | | | $ | 50,532 | | | $ | 48,314 | | | $ | 44,382 | | | $ | 34,205 | | | 1,307 | | | 2.6 | % | | 17,634 | | | 51.6 | % |
| Interest-bearing checking | 24,171 | | | 22,940 | | | 22,098 | | | 21,755 | | | 19,273 | | | 1,231 | | | 5.4 | % | | 4,898 | | | 25.4 | % |
| Savings | 12,340 | | | 11,374 | | | 10,935 | | | 10,152 | | | 8,822 | | | 966 | | | 8.5 | % | | 3,518 | | | 39.9 | % |
| Money market—domestic | 29,425 | | | 29,312 | | | 29,146 | | | 27,870 | | | 25,151 | | | 113 | | | 0.4 | % | | 4,274 | | | 17.0 | % |
| | | | | | | | | | | | | | | | | |
| Low-cost deposits | 117,775 | | | 114,158 | | | 110,493 | | | 104,159 | | | 87,451 | | | 3,617 | | | 3.2 | % | | 30,324 | | | 34.7 | % |
| Time deposits | 5,158 | | | 5,598 | | | 6,150 | | | 6,690 | | | 7,302 | | | (440) | | | (7.9) | % | | (2,144) | | | (29.4) | % |
| Total Customer Deposits | 122,933 | | | 119,756 | | | 116,643 | | | 110,849 | | | 94,753 | | | 3,177 | | | 2.7 | % | | 28,180 | | | 29.7 | % |
| Corporate treasury time deposits | 4 | | | 11 | | | 13 | | | 72 | | | 280 | | | (7) | | | (63.6) | % | | (276) | | | (98.6) | % |
| Corporate treasury other deposits | — | | | — | | | — | | | — | | | 639 | | | — | | | NM | | (639) | | | (100.0) | % |
| Total Deposits | $ | 122,937 | | | $ | 119,767 | | | $ | 116,656 | | | $ | 110,921 | | | $ | 95,672 | | | $ | 3,170 | | | 2.6 | % | | 27,265 | | | 28.5 | % |
| | | | | | | | | | | | | | | | | | | | | | | | | | | | | | | | | | | | | | | | | | | | | | | | | | | | | |
| | Average Balances |
| ($ amounts in millions) | 1Q21 | | 4Q20 | | 3Q20 | | 2Q20 | | 1Q20 | | 1Q21 vs. 4Q20 | | 1Q21 vs. 1Q20 |
| Consumer Bank Segment | $ | 72,949 | | | $ | 69,912 | | | $ | 68,842 | | | $ | 65,722 | | | $ | 59,711 | | | 3,037 | | | 4.3 | % | | 13,238 | | | 22.2 | % |
| Corporate Bank Segment | 40,285 | | | 40,581 | | | 38,755 | | | 36,409 | | | 26,618 | | | (296) | | | (0.7) | % | | 13,667 | | | 51.3 | % |
| Wealth Management Segment | 9,281 | | | 8,884 | | | 8,658 | | | 8,382 | | | 8,073 | | | 397 | | | 4.5 | % | | 1,208 | | | 15.0 | % |
Other (1) | 422 | | | 390 | | | 401 | | | 408 | | | 1,270 | | | 32 | | | 8.2 | % | | (848) | | | (66.8) | % |
| Total Deposits | $ | 122,937 | | | $ | 119,767 | | | $ | 116,656 | | | $ | 110,921 | | | $ | 95,672 | | | $ | 3,170 | | | 2.6 | % | | $ | 27,265 | | | 28.5 | % |
| | | | | | | | | | | | | | | | | | | | | | | | | | | | | | | | | | | | | | | | | | | | | | | | | | | | | |
| | Average Balances |
| ($ amounts in millions) | 1Q21 | | 4Q20 | | 3Q20 | | 2Q20 | | 1Q20 | | 1Q21 vs. 4Q20 | | 1Q21 vs. 1Q20 |
| Wealth Management - Private Wealth | $ | 8,442 | | | $ | 8,106 | | | $ | 7,723 | | | $ | 7,395 | | | $ | 7,062 | | | 336 | | | 4.1 | % | | 1,380 | | | 19.5 | % |
| Wealth Management - Institutional Services | 839 | | | 778 | | | 935 | | | 987 | | | 1,011 | | | 61 | | | 7.8 | % | | (172) | | | (17.0) | % |
| Total Wealth Management Segment Deposits | $ | 9,281 | | | $ | 8,884 | | | $ | 8,658 | | | $ | 8,382 | | | $ | 8,073 | | | $ | 397 | | | 4.5 | % | | $ | 1,208 | | | 15.0 | % |
________
(1)Other deposits represent non-customer balances primarily consisting of wholesale funding (for example, Eurodollar trade deposits, selected deposits and brokered time deposits).
Regions Financial Corporation and Subsidiaries
Financial Supplement to First Quarter 2021 Earnings Release
Reconciliation to GAAP Financial Measures
Tangible Common Ratios
The following tables provide the calculation of the end of period “tangible common shareholders’ equity” and "tangible common book value per share" ratios, and a reconciliation of shareholders’ equity (GAAP) to tangible common shareholders’ equity (non-GAAP). Since analysts and banking regulators may assess Regions’ capital adequacy using tangible common shareholders' equity, we believe that it is useful to provide investors the ability to assess Regions’ capital adequacy on this same basis.
| | | | | | | | | | | | | | | | | | | | | | | | | | | | | | | | |
| | | As of and for Quarter Ended |
| ($ amounts in millions, except per share data) | | 3/31/2021 | | 12/31/2020 | | 9/30/2020 | | 6/30/2020 | | 3/31/2020 |
| Tangible Common Ratios | | | | | | | | | | |
| Shareholders’ equity (GAAP) | | $ | 17,862 | | | $ | 18,111 | | | $ | 17,904 | | | $ | 17,602 | | | $ | 17,332 | |
| Less: | | | | | | | | | | |
| Preferred stock (GAAP) | | 1,656 | | | 1,656 | | | 1,656 | | | 1,656 | | | 1,310 | |
| Intangible assets (GAAP) | | 5,295 | | | 5,312 | | | 5,316 | | | 5,330 | | | 4,943 | |
| Deferred tax liability related to intangibles (GAAP) | | (96) | | | (106) | | | (105) | | | (103) | | | (92) | |
| Tangible common shareholders’ equity (non-GAAP) | A | $ | 11,007 | | | $ | 11,249 | | | $ | 11,037 | | | $ | 10,719 | | | $ | 11,171 | |
| Total assets (GAAP) | | $ | 153,331 | | | $ | 147,389 | | | $ | 145,180 | | | $ | 144,070 | | | $ | 133,542 | |
| Less: | | | | | | | | | | |
| Intangible assets (GAAP) | | 5,295 | | | 5,312 | | | 5,316 | | | 5,330 | | | 4,943 | |
| Deferred tax liability related to intangibles (GAAP) | | (96) | | | (106) | | | (105) | | | (103) | | | (92) | |
| Tangible assets (non-GAAP) | B | $ | 148,132 | | | $ | 142,183 | | | $ | 139,969 | | | $ | 138,843 | | | $ | 128,691 | |
| Shares outstanding—end of quarter | C | 961 | | | 960 | | | 960 | | | 960 | | | 957 | |
Tangible common shareholders’ equity to tangible assets (non-GAAP)(1) | A/B | 7.43 | % | | 7.91 | % | | 7.88 | % | | 7.72 | % | | 8.68 | % |
Tangible common book value per share (non-GAAP)(1) | A/C | $ | 11.46 | | | $ | 11.71 | | | $ | 11.49 | | | $ | 11.16 | | | $ | 11.67 | |
_________
(1)Amounts have been calculated using whole dollar values.
Regions Financial Corporation and Subsidiaries
Financial Supplement to First Quarter 2021 Earnings Release
Forward-Looking Statements
This release may include forward-looking statements as defined in the Private Securities Litigation Reform Act of 1995. Forward-looking statements are not based on historical information, but rather are related to future operations, strategies, financial results or other developments. Forward-looking statements are based on management’s current expectations as well as certain assumptions and estimates made by, and information available to, management at the time the statements are made. Those statements are based on general assumptions and are subject to various risks, and because they also relate to the future they are likewise subject to inherent uncertainties and other factors that may cause actual results to differ materially from the views, beliefs and projections expressed in such statements. Therefore, we caution you against relying on any of these forward-looking statements. These risks, uncertainties and other factors include, but are not limited to, those described below:
•Current and future economic and market conditions in the United States generally or in the communities we serve (in particular the Southeastern United States), including the effects of possible declines in property values, increases in unemployment rates, financial market disruptions and potential reductions of economic growth, which may adversely affect our lending and other businesses and our financial results and conditions.
•Possible changes in trade, monetary and fiscal policies of, and other activities undertaken by, governments, agencies, central banks and similar organizations, which could have a material adverse effect on our earnings.
•Possible changes in market interest rates or capital markets could adversely affect our revenue and expense, the value of assets and obligations, and the availability and cost of capital and liquidity.
•The impact of pandemics, including the ongoing COVID-19 pandemic, on our businesses, operations, and financial results and conditions.The duration and severity of the ongoing COVID-19 pandemic, which has disrupted the global economy, has and could continue to adversely affect our capital and liquidity position, impair the ability of borrowers to repay outstanding loans and increase our allowance for credit losses, impair collateral values, and result in lost revenue or additional expenses. The pandemic could also cause an outflow of deposits, result in goodwill impairment charges and the impairment of other financial and nonfinancial assets, and increase our cost of capital.
•Any impairment of our goodwill or other intangibles, any repricing of assets, or any adjustment of valuation allowances on our deferred tax assets due to changes in law, adverse changes in the economic environment, declining operations of the reporting unit or other factors.
•The effect of changes in tax laws, including the effect of any future interpretations of or amendments to Tax Reform, which may impact our earnings, capital ratios and our ability to return capital to shareholders.
•Possible changes in the creditworthiness of customers and the possible impairment of the collectability of loans and leases, including operating leases.
•Changes in the speed of loan prepayments, loan origination and sale volumes, charge-offs, credit loss provisions or actual credit losses where our allowance for credit losses may not be adequate to cover our eventual losses.
•Possible acceleration of prepayments on mortgage-backed securities due to low interest rates, and the related acceleration of premium amortization on those securities.
•Loss of customer checking and savings account deposits as customers pursue other, higher-yield investments, which could increase our funding costs.
•Possible changes in consumer and business spending and saving habits and the related effect on our ability to increase assets and to attract deposits, which could adversely affect our net income.
•Our ability to effectively compete with other traditional and non-traditional financial services companies, including fintechs, some of whom possess greater financial resources than we do or are subject to different regulatory standards than we are.
•Our inability to develop and gain acceptance from current and prospective customers for new products and services and the enhancement of existing products and services to meet customers’ needs and respond to emerging technological trends in a timely manner could have a negative impact on our revenue.
•Our inability to keep pace with technological changes, including those related to the offering of digital banking and financial services, could result in losing business to competitors.
•Changes in laws and regulations affecting our businesses, including legislation and regulations relating to bank products and services, as well as changes in the enforcement and interpretation of such laws and regulations by applicable governmental and self-regulatory agencies, including as a result of the recent change in U.S. presidential administration and control of the U.S. Congress, which could require us to change certain business practices, increase compliance risk, reduce our revenue, impose additional costs on us, or otherwise negatively affect our businesses.
•Our capital actions, including dividend payments, common stock repurchases, or redemptions of preferred stock or other regulatory capital instruments, must not cause us to fall below minimum capital ratio requirements, with applicable buffers taken into account, and must comply with other requirements and restrictions under law or imposed by our regulators, which may impact our ability to return capital to shareholders.
•Our ability to comply with stress testing and capital planning requirements (as part of the CCAR process or otherwise) may continue to require a significant investment of our managerial resources due to the importance of such tests and requirements.
•Our ability to comply with applicable capital and liquidity requirements (including, among other things, the Basel III capital standards), including our ability to generate capital internally or raise capital on favorable terms, and if we fail to meet requirements, our financial condition and market perceptions of us could be negatively impacted.
•The effects of any developments, changes or actions relating to any litigation or regulatory proceedings brought against us or any of our subsidiaries.
•The costs, including possibly incurring fines, penalties, or other negative effects (including reputational harm) of any adverse judicial, administrative, or arbitral rulings or proceedings, regulatory enforcement actions, or other legal actions to which we or any of our subsidiaries are a party, and which may adversely affect our results.
•Our ability to manage fluctuations in the value of assets and liabilities and off-balance sheet exposure so as to maintain sufficient capital and liquidity to support our business.
•Our ability to execute on our strategic and operational plans, including our ability to fully realize the financial and nonfinancial benefits relating to our strategic initiatives.
•The risks and uncertainties related to our acquisition or divestiture of businesses.
Regions Financial Corporation and Subsidiaries
Financial Supplement to First Quarter 2021 Earnings Release
•The success of our marketing efforts in attracting and retaining customers.
•Our ability to recruit and retain talented and experienced personnel to assist in the development, management and operation of our products and services may be affected by changes in laws and regulations in effect from time to time.
•Fraud or misconduct by our customers, employees or business partners.
•Any inaccurate or incomplete information provided to us by our customers or counterparties.
•Inability of our framework to manage risks associated with our business such as credit risk and operational risk, including third-party vendors and other service providers, which could, among other things, result in a breach of operating or security systems as a result of a cyber attack or similar act or failure to deliver our services effectively.
•Dependence on key suppliers or vendors to obtain equipment and other supplies for our business on acceptable terms.
•The inability of our internal controls and procedures to prevent, detect or mitigate any material errors or fraudulent acts.
•The effects of geopolitical instability, including wars, conflicts, civil unrest, and terrorist attacks and the potential impact, directly or indirectly, on our businesses.
•The effects of man-made and natural disasters, including fires, floods, droughts, tornadoes, hurricanes, and environmental damage (specifically in the Southeastern United States), which may negatively affect our operations and/or our loan portfolios and increase our cost of conducting business. The severity and impact of future earthquakes, fires, hurricanes, tornadoes, droughts, floods and other weather-related events are difficult to predict and may be exacerbated by global climate change.
•Changes in commodity market prices and conditions could adversely affect the cash flows of our borrowers operating in industries that are impacted by changes in commodity prices (including businesses indirectly impacted by commodities prices such as businesses that transport commodities or manufacture equipment used in the production of commodities), which could impair their ability to service any loans outstanding to them and/or reduce demand for loans in those industries.
•Our ability to identify and address cyber-security risks such as data security breaches, malware, ransomware,“denial of service” attacks, “hacking” and identity theft, including account take-overs, a failure of which could disrupt our business and result in the disclosure of and/or misuse or misappropriation of confidential or proprietary information, disruption or damage to our systems, increased costs, losses, or adverse effects to our reputation.
•Our ability to achieve our expense management initiatives.
•Market replacement of LIBOR and the related effect on our LIBOR-based financial products and contracts, including, but not limited to, derivative products, debt obligations, deposits, investments, and loans.
•Possible downgrades in our credit ratings or outlook could, among other negative impacts, increase the costs of funding from capital markets.
•The effects of a possible downgrade in the U.S. government’s sovereign credit rating or outlook, which could result in risks to us and general economic conditions that we are not able to predict.
•The effects of problems encountered by other financial institutions that adversely affect us or the banking industry generally could require us to change certain business practices, reduce our revenue, impose additional costs on us, or otherwise negatively affect our businesses.
•The effects of the failure of any component of our business infrastructure provided by a third party could disrupt our businesses, result in the disclosure of and/or misuse of confidential information or proprietary information, increase our costs, negatively affect our reputation, and cause losses.
•Our ability to receive dividends from our subsidiaries could affect our liquidity and ability to pay dividends to shareholders.
•Changes in accounting policies or procedures as may be required by the FASB or other regulatory agencies could materially affect our financial statements and how we report those results, and expectations and preliminary analyses relating to how such changes will affect our financial results could prove incorrect.
•Other risks identified from time to time in reports that we file with the SEC.
•Fluctuations in the price of our common stock and inability to complete stock repurchases in the time frame and/or on the terms anticipated.
•The effects of any damage to our reputation resulting from developments related to any of the items identified above.
The foregoing list of factors is not exhaustive. For discussion of these and other factors that may cause actual results to differ from expectations, look under the captions “Forward-Looking Statements” and “Risk Factors” of Regions’ Annual Report on Form 10-K for the year ended December 31, 2020 as filed with the SEC.
Further, statements about the potential effects of the COVID-19 pandemic on our businesses and financial results and conditions may constitute forward-looking statements and are subject to the risk that the actual effects may differ, possibly materially, from what is reflected in those forward-looking statements due to factors and future developments that are uncertain, unpredictable and in many cases beyond our control, including the scope and duration of the pandemic (including any second wave or resurgences), actions taken by governmental authorities in response to the pandemic, and the direct and indirect impact of the pandemic on our customers, third parties and us.
The words "future," “anticipates,” "assumes," “intends,” “plans,” “seeks,” “believes,” "predicts," "potential," "objectives," “estimates,” “expects,” “targets,” “projects,” “outlook,” “forecast,” "would," “will,” “may,” “might,” “could,” “should,” “can,” and similar terms and expressions often signify forward-looking statements. You should not place undue reliance on any forward-looking statements, which speak only as of the date made. Factors or events that could cause our actual results to differ may emerge from time to time, and it is not possible to predict all of them. We assume no obligation and do not intend to update or revise any forward-looking statements that are made from time to time, either as a result of future developments, new information or otherwise, except as may be required by law.
Regions’ Investor Relations contact is Dana Nolan at (205) 264-7040; Regions’ Media contact is Jeremy King at (205) 264-4551.