Exhibit 99.1

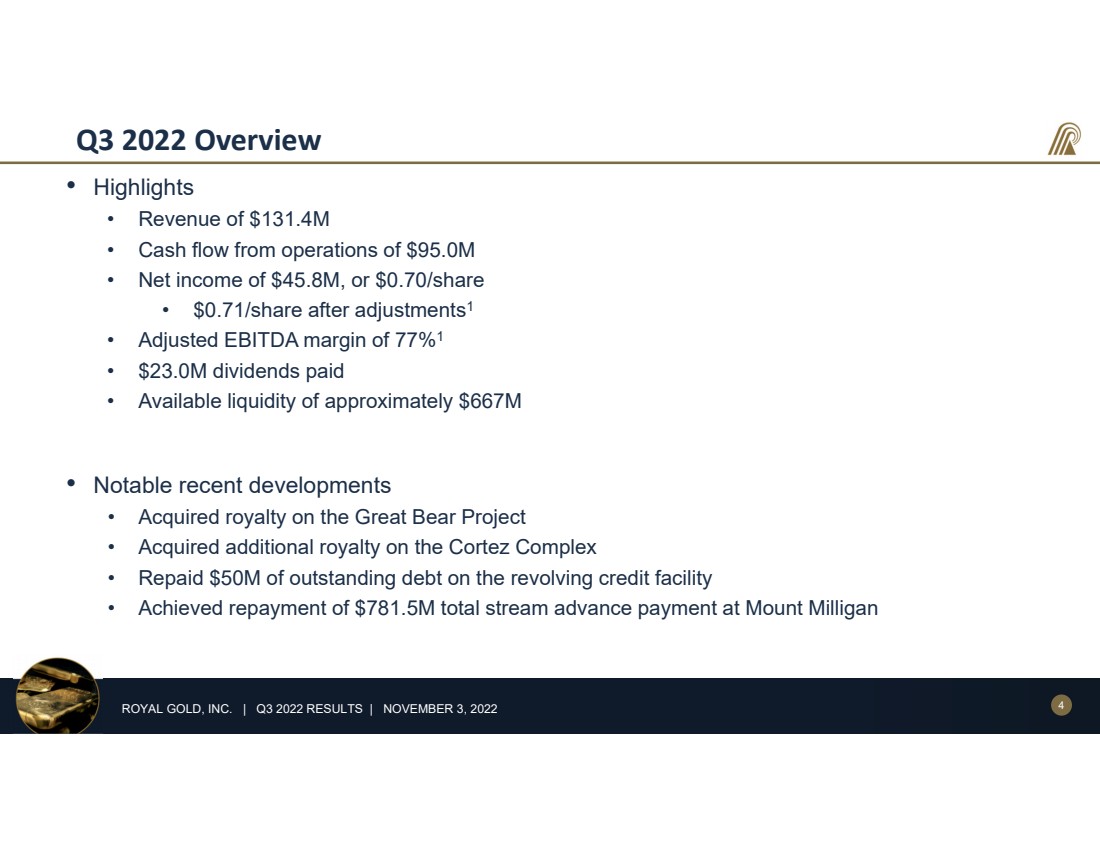
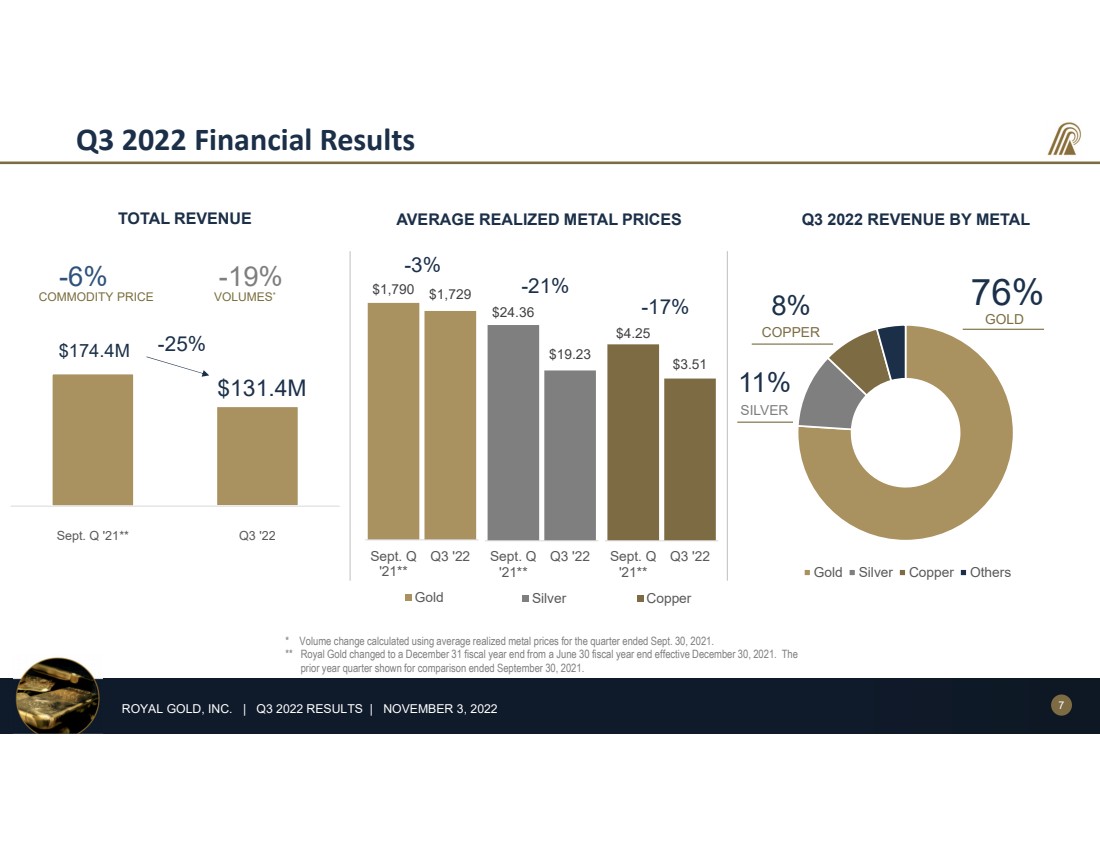
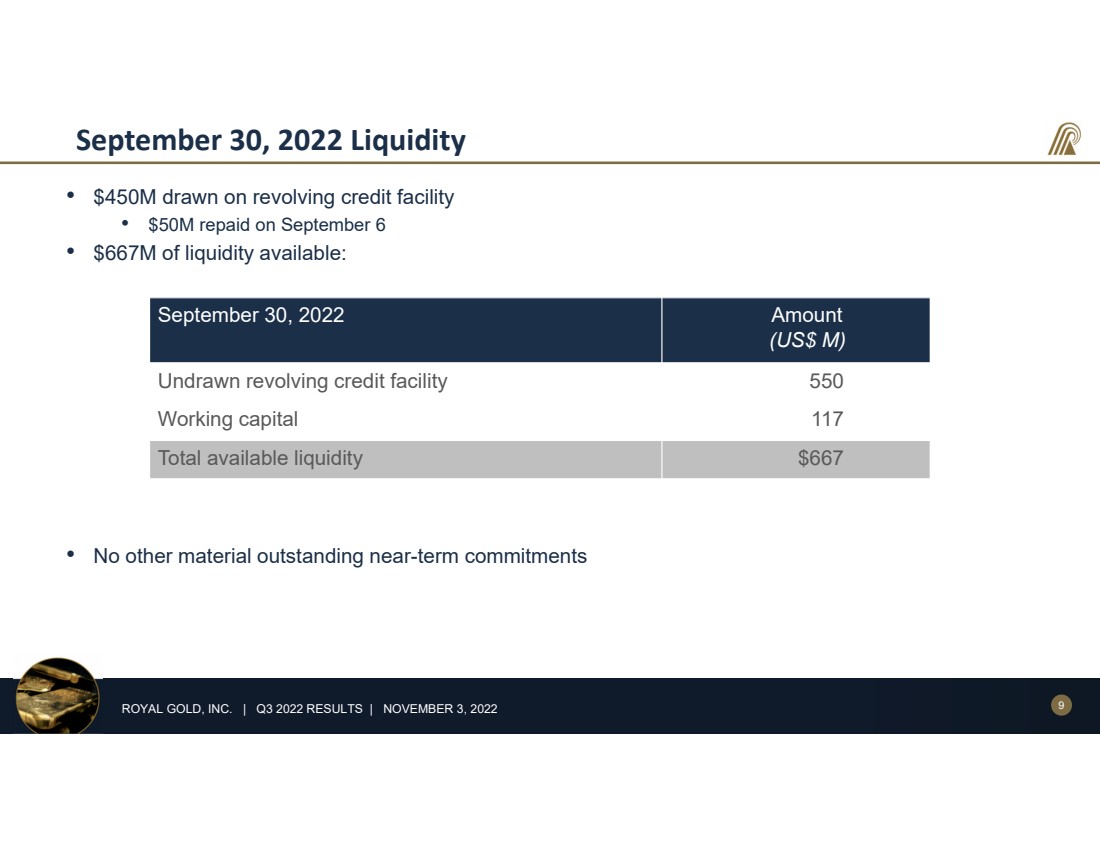
Royal Gold Reports Solid Operating and Financial Results for the Third Quarter of 2022 DENVER, COLORADO. NOVEMBER 2, 2022: ROYAL GOLD, INC. (NASDAQ: RGLD) (together with its subsidiaries, “Royal Gold,” the “Company,” “we,” “us,” or “our”) reports net income of $45.8 million, or $0.70 per share, for the quarter ended September 30, 2022, (“third quarter”), on revenue of $131.4 million and operating cash flow of $95.0 million. Adjusted net income1 was $47.1 million, or $0.71 per share. “Royal Gold’s portfolio continued to perform well and we delivered another quarter of sound operating and financial results,” commented Bill Heissenbuttel, President and CEO of Royal Gold. “The strengths of our unique business model remain clear as we maintained our high margins despite persistent inflationary pressures seen across the wider economy.” “We acted decisively during the quarter and added scale, duration and optionality to the portfolio with the acquisition of the world-class Great Bear and Cortez Complex royalties. Our solid balance sheet and access to liquidity provided the cash to finance these acquisitions without equity dilution, and with our strong cash flow during the quarter we have already repaid $50 million of the $500 million draw on the revolving credit facility used to fund the Cortez Complex royalty acquisition.” “We also reached a significant milestone at Mount Milligan during the quarter with the full return of our $781.5 million advance stream deposit. Shortly afterwards Centerra released the updated Mount Milligan life of mine plan, which shows an additional four years of mine life through 2033 and the potential for exploration success to extend this life further.” Recent Portfolio Developments Principal Property Updates Mount Milligan Advance Stream Deposit Repaid and Mine Life Extended to 2033 Stream deliveries during the quarter from the Mount Milligan mine in British | Third Quarter 2022 Highlights: ● Revenue of $131.4 million, operating cash flow of $95.0 million, and earnings of $45.8 million ● Revenue split: 76% gold, 11% silver, 8% copper ● Production volume of 76,000 GEOs2 ● Maintained 77% adjusted EBITDA margin1 ● Repaid $50 million of debt, ending the period with liquidity of approximately $667 million ● Paid quarterly dividend of $0.35 per share, a 17% increase over the prior year ● Acquired royalty on the world-class Cortez Complex in Nevada ● Acquired royalty on the emerging Great Bear Project in Ontario ● Achieved full repayment of Mount Milligan advance stream deposit Post Quarter Events: ● Updated Mount Milligan life of mine plan extends life to 2033 |
Columbia provided for complete repayment of the $781.5 million advance deposit made under the metal stream agreement from 2010 through 2012. Mount Milligan began commercial production in early 2014 and was Royal Gold’s first stream acquisition.
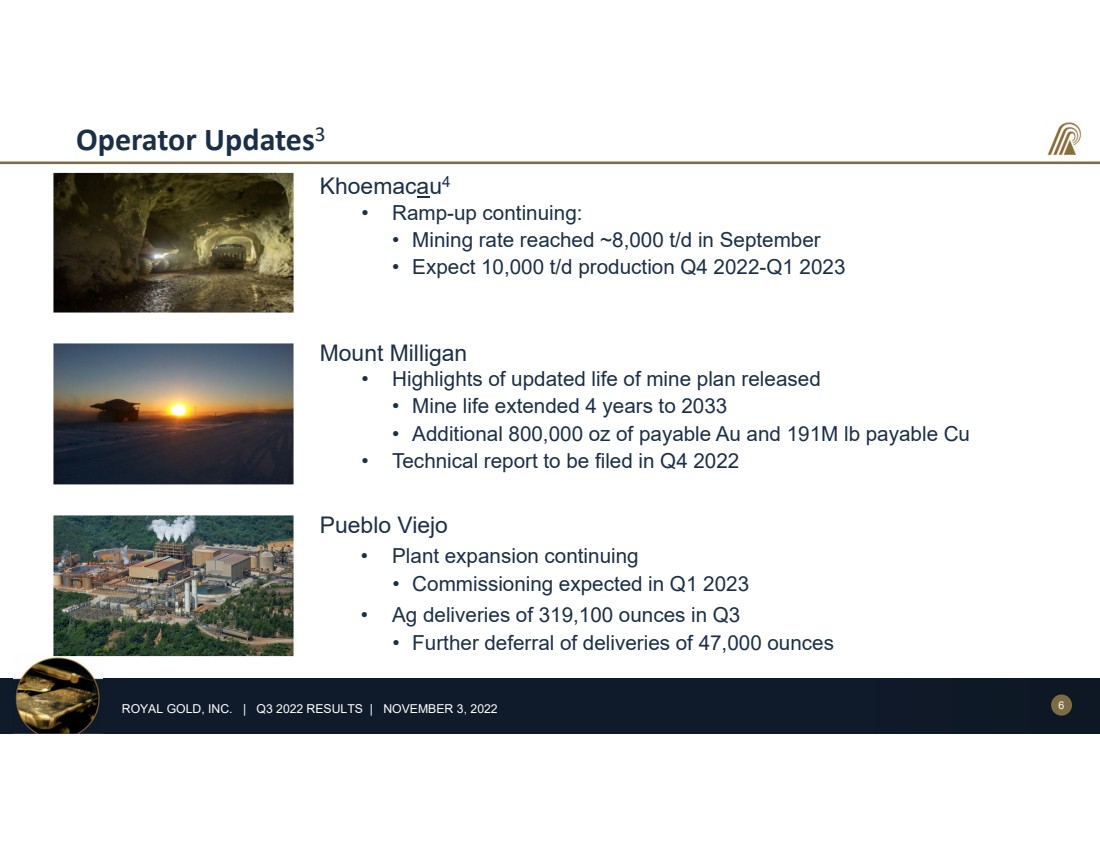
After the end of the quarter on October 4, Centerra Gold Inc. (“Centerra”) published the highlights of an updated life of mine plan for Mount Milligan. According to Centerra, the mine life is expected to be extended by over four years to 2033. Centerra expects total payable gold and copper to increase more than 800,000 ounces and 191 million pounds, respectively, from 2022 onwards when compared to the previous plan, with average annual production of 175,000 ounces of gold and 68 million pounds of copper.
The highlights of the updated Mount Milligan plan also include updated reserve estimates primarily as a result of the reclassification of resources to reserves. As of December 31, 2021, gold and copper reserves increased by 64% and 36%, respectively, while measured and indicated resources for gold and copper decreased by 33% and 24%,
1 Adjusted net income, adjusted net income per share and adjusted EBITDA margin are non-GAAP financial measures. See Schedule A of this press release for additional information, including a detailed description of adjustments to net income.
2 See Schedule A of this press release for additional information about gold equivalent ounces, or GEOs.
1
respectively. Centerra also indicated the potential for future resource growth due to exploration success in areas proximal to the open pit and covered by the stream agreement.
Centerra expects to file a new technical report detailing the life of mine plan within 45 days of October 4.
Production Ramp-Up Continues at Khoemacau
According to Khoemacau Copper Mining (Pty.) Limited (“KCM”), the ramp-up continued at the Khoemacau Project (“Khoemacau”) in Botswana and average monthly underground production increased consistently during the third quarter from approximately 7,300 tonnes per day in June to approximately 8,000 tonnes per day in September. Production has reached the target mining rate of 10,000 tonnes per day for short periods during the ramp up period but has not yet been consistently sustained at this level. KCM expects to reach the target mining rate on a sustained basis toward the end of the December quarter and into the first quarter of 2023.
KCM continues to expect that at full production Khoemacau will produce 155,000 to 165,000 tonnes of high-grade copper and silver concentrate a year, containing approximately 60,000 to 65,000 tonnes of payable copper and 1.8 to 2.0 million ounces of payable silver per year, over an approximate 20-year mine life from Zone 5.
Plant Expansion and Mine Life Extension Project Continues, with Continued Deferral of Silver Ounces in the Third Quarter at Pueblo Viejo
During the third quarter, Barrick Gold Corporation (“Barrick”) reported continued progress on the plant expansion and mine life extension project at Pueblo Viejo in the Dominican Republic to increase throughput and allow the mine to maintain minimum average annual gold production of approximately 800,000 ounces after 2022 and beyond 2040 (100% basis).
With respect to the plant expansion, on August 8, 2022, Barrick reported that as of June 30, 2022, overall construction was 56% complete and it expects the expansion to be substantially completed by the end of 2022 with commissioning in the first quarter of 2023. With respect to the mine life extension, Barrick disclosed that social, environmental and technical studies for additional tailings capacity continued to advance, and that a preferred site for a tailings storage facility (“TSF”) had been put forward for further evaluation. Barrick reported that the final location and construction of the additional TSF would be subject to the completion of an Environmental and Social Impact Assessment (“ESIA”) in accordance with Dominican Republic legislation and international standards, which would then be submitted to the Government of the Dominican Republic for evaluation and final decision. Further according to Barrick, basic engineering of the additional TSF is expected to be completed in the fourth quarter of 2022.
Silver stream deliveries were approximately 319,100 ounces for the third quarter compared to 396,500 ounces for the prior year quarter. During the third quarter an additional 47,000 ounces of silver deliveries were deferred. The deferred ounces are the result of a mechanism in the stream agreement that allows for the deferral of deliveries in a period if Barrick’s share of silver production is insufficient to cover its stream delivery obligations. The stream agreement terms include a fixed 70% silver recovery rate. If actual recovery rates fall below the contractual 70% recovery rate, ounces may be deferred with deferred ounces to be delivered in future periods as silver recovery allows. As of September 30, 2022, approximately 530,000 ounces remain deferred, and the timing for the delivery of the entire deferred amount is uncertain.
Portfolio Additions
Additional Royalty Interest on World-Class Producing Cortez Complex in Nevada
On August 2, the Company announced that it acquired a sliding-scale gross royalty (the “Cortez Complex Royalty”) on an area including the Cortez mine operational area and the Fourmile development project in Nevada (the “Cortez Complex”) for $525 million in cash consideration from a wholly owned subsidiary of Rio Tinto European Holdings Limited. The area within the Cortez Complex is owned or controlled by Nevada Gold Mines LLC (“NGM”), a joint venture between Barrick (61.5% owner and operator) and Newmont Corporation (“Newmont”) (38.5% owner), with the exception of the Fourmile project which is 100% owned and operated by Barrick.
The Cortez Complex Royalty is a life of mine sliding scale gross royalty payable at a rate of 0% at a gold price less than $400 per ounce, increasing to 3% at a gold price above $900 per ounce, and is payable on 40% of all production from the Cortez Complex. Based on information available, the Cortez Complex Royalty would not cover the existing deposits within the Robertson property. At current gold prices the Cortez Complex Royalty is an effective 1.2% gross royalty on the Cortez Complex and is not subject to any stepdowns or caps. Deductions from the Cortez Complex Royalty payments are limited to third-party royalties that existed prior to the creation of the royalty in 2008, which include the existing Crossroads and Pipeline royalties owned by Royal Gold.
The Cortez Complex Royalty is payable after cumulative production from the Cortez Complex of 15 million gold equivalent ounces from January 1, 2008 onwards. This production threshold was reached late in the third quarter and approximately 3,300 ounces of production were attributable to the Cortez Complex Royalty in the quarter resulting in 35 ounces to Royal Gold’s account. Royal Gold expects all production from the Cortez Complex in the fourth quarter of 2022 to be subject to the Cortez Complex Royalty. Royalty payments will be made quarterly within 45 days of the end of each calendar quarter.
2
Royalty on the Emerging Great Bear Gold Project in Ontario
On September 9, the Company announced that it had completed the previously announced acquisition of all of the issued and outstanding shares of Great Bear Royalties Corporation (“GBR”) for approximately $151.7 million in cash consideration. GBR’s sole material asset is a 2.0% net smelter return royalty that covers the entirety of the Great Bear Project in the Red Lake district of Ontario, Canada, owned and operated by Kinross Gold Corporation (“Kinross”). The royalty includes all metals produced from contiguous mineral rights covering 9,140 hectares. Royalty payments will be made quarterly with applicable deductions.
As part of the acquisition and in exchange for information and access to the project provided by Kinross, Royal Gold granted an option to Kinross to purchase a 25% interest in the royalty (0.5% of the 2.0% royalty rate) for an amount equal to 25% of Royal Gold’s purchase price for the acquisition of GBR, adjusted for inflation, at any time from the transaction closing date until the earlier of a construction decision for the Great Bear Project and 10 years after the transaction closing date. The royalty is not subject to any other stepdowns or caps that could reduce the royalty rate in the future.
Other Property Updates
Select notable updates as reported by the operators of other portfolio assets in the third quarter include:
Producing Properties
Rainy River (6.5% gold stream, 60% silver stream): New Gold Inc. (“New Gold”) announced on September 15 that mining of the open pit is back on track and underground production from the Intrepid Zone has commenced with the first stope blasted on September 13 at its Rainy River mine in Ontario. New Gold reported it expects Rainy River to meet its updated annual gold equivalent guidance of 230,000 to 250,000 ounces for 2022.
King of the Hills (1.5% NSR royalty): Red 5 Limited (“Red 5”) reported that ramp-up of the King of the Hills (“KOTH”) Gold Project in Western Australia continued after first gold was poured on June 5, 2022. Red 5 has indicated a 16-year mine life at KOTH and expects commercial production to be achieved in the quarter ended December 31, 2022.
Ruby Hill (3% NSR royalty on gold): i-80 Gold Corp. announced on August 16 that initial drilling to test the 426 Zone, part of the Ruby Deeps deposit, intersected multiple zones of high-grade mineralization at the Ruby Hill Property in Eureka County, Nevada.
Development Properties
Granite Creek (3.0% NSR and 2.94% NSR royalties): i-80 Gold Corp. (“i-80”) announced on July 5 that it began shipping ore from operations at the Granite Creek Mine in Nevada to the Twin Creeks processing facility owned by Nevada Gold Mines LLC. i-80 reported that it does not expect to report ounces from Granite Creek until the fourth quarter of 2022.
Bellevue (2% NSR royalty): Bellevue Gold Limited (“Bellevue”) announced reaching the first development ore on July 29, a major milestone in the construction of its Bellevue Gold Project in Western Australia. Bellevue expects that production of development ore will steadily ramp up during the preproduction period with stoping ore anticipated in the quarter ended March 2023.
Mara Rosa (1.0% NSR royalty and 1.75% NSR royalty on gold): On August 10, Hochschild Mining PLC (“Hochschild”) announced that the environmental authority of the State of Goiás, the State Secretariat for the Environment and Sustainable Development, granted the key permit to enable Hochschild to start construction of the processing plant and mine pre-stripping at the Mara Rosa Project in Brazil. Hochschild reported that first production is on track for the first half of 2024.
Back River (1.95% GSR royalty): On September 7, Sabina Gold & Silver Corp. (“Sabina”) announced a formal construction decision for the Goose property, an area of the Back River Project, in Nunavut. According to Sabina, all pre-development activities are now complete and full construction is expected to commence in early 2023 with first gold expected in the first quarter of 2025.
Third Quarter 2022 Overview
In the third quarter, the Company recorded net income and comprehensive income attributable to Royal Gold stockholders (“net income”) of $45.8 million, or $0.70 per basic and diluted share, as compared to net income of $70.2 million, or $1.07 per basic and diluted share, for the quarter ended September 30, 2021. The decrease in net income was primarily attributable to a decrease in revenue.
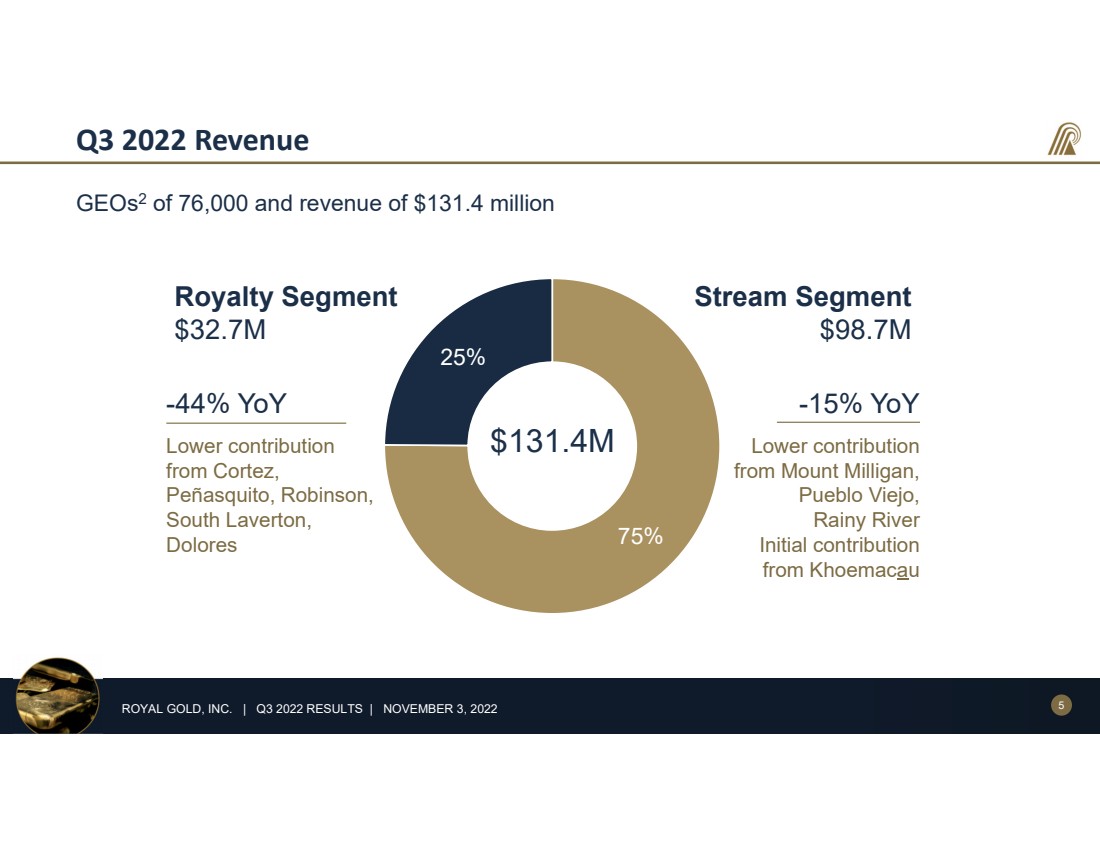
During the third quarter the Company recognized total revenue of $131.4 million, comprised of stream revenue of $98.7 million and royalty revenue of $32.7 million at an average gold price of $1,729 per ounce, an average silver price of $19.23 per ounce and an average copper price of $3.51 per pound. This is compared to total revenue of $174.4 million for the three months ended September 30, 2021, comprised of stream revenue of $115.9 million and royalty revenue of $58.5 million, at an average gold price of $1,790 per ounce, an average silver price of $24.36 per ounce and an average copper price of $4.25 per pound.
3
The decrease in total revenue resulted primarily from lower gold sales at Mount Milligan and Pueblo Viejo and lower gold production at Cortez and Peñasquito, and lower average gold, silver and copper prices. The decrease was partially offset by higher silver sales at Khoemacau, which shipped its first concentrate during the prior year quarter.
Cost of sales, which excludes depreciation, depletion and amortization, decreased to $23.2 million for the third quarter, from $27.2 million for the three months ended September 30, 2021. The decrease, when compared to the prior period, was primarily due to a decrease in gold and silver sales at Pueblo Viejo and lower gold sales at Mount Milligan, offset by higher silver sales at Khoemacau. Stream deliveries from Khoemacau began in the prior year comparable quarter. Cost of sales is specific to our stream agreements and is the result of our purchase of gold, silver and copper for a cash payment. The cash payment for gold from Mount Milligan is the lesser of $435 per ounce or the prevailing market price of gold when purchased, while the cash payment for our other streams is a set contractual percentage of the gold, silver or copper (Mount Milligan) spot price near the date of metal delivery.
General and administrative costs increased to $7.6 million for the third quarter, from $7.1 million for the three months ended September 30, 2021. The increase was primarily due to an increase in employee-related costs including non-cash compensation expense.
Depreciation, depletion and amortization decreased to $37.8 million for the third quarter, from $50.6 million for the three months ended September 30, 2021. The decrease was primarily due to lower gold production at Cortez and lower gold sales at Mount Milligan as well as lower depletion rates at Mount Milligan compared to the prior period. The gold and copper depletion rates on the Mount Milligan stream as of September 30, 2022 decreased to $416 per ounce of gold and $1.06 per pound of copper as a result of the increase to proven and probable reserves in the updated Mount Milligan life of mine plan. The decrease was partially offset by additional depletion from Khoemacau which produced first deliveries in the prior year comparable quarter.
Interest and other expense increased to $8.8 million for the third quarter, from $1.9 million for the three months ended September 30, 2021. The increase was primarily due to higher interest expense as a result of the $500 million draw on the revolving credit facility and foreign exchange losses related to the GBR acquisition.
For the third quarter the Company recorded an income tax expense of $11.0 million, compared with income tax expense of $16.0 million for the three months ended September 30, 2021. The income tax expense resulted in an effective tax rate of 19.3% in the current period, compared with 18.5% for the three months ended September 30, 2021.
Net cash provided by operating activities totaled $95.0 million for the third quarter, compared to $129.9 million for the prior year period. The decrease was primarily due to a decrease in cash proceeds received from the Company’s stream and royalty interests in the third quarter.
Net cash used in investing activities totaled $678.6 million for the third quarter, compared to $272.7 million for the prior year period. The increase was primarily due to higher acquisitions of stream and royalty interests compared to the prior year period.
Net cash provided by financing activities totaled $425.3 million for the third quarter, compared to net cash used in financing activities of $163.0 million for the prior year period. The change was primarily due to a net draw of $450 million on the Company’s revolving credit facility in the third quarter compared to a net repayment of $100.0 million during the prior year period.
At September 30, 2022, the Company had current assets of $181.8 million compared to current liabilities of $64.5 million, which resulted in working capital of $117.3 million and a current ratio of approximately 3 to 1. This compares to current assets of $216.0 million and current liabilities of $61.4 million at December 31, 2021, resulting in working capital of $154.6 million and a current ratio of approximately 4 to 1. The decrease in working capital was primarily due to a decrease in available cash as a result of the Cortez Complex Royalty and GBR acquisitions.
During the third quarter, liquidity needs were met from $95.0 million in net cash provided by operating activities and available cash resources.
Other Corporate Updates
Repayment of $50 Million of Revolving Credit Facility Balance Leaving $550 Million Available
As previously announced, on July 25, 2022, the Company drew $500 million on its revolving credit facility to fund the acquisition of the Cortez Complex Royalty. In keeping with Royal Gold’s capital allocation strategy to repay outstanding debt as cash flow allows, the Company repaid $50 million of the credit facility balance on September 6, 2022, leaving an outstanding balance of $450 million and $550 million available under the credit facility at quarter end.
Outlook
4
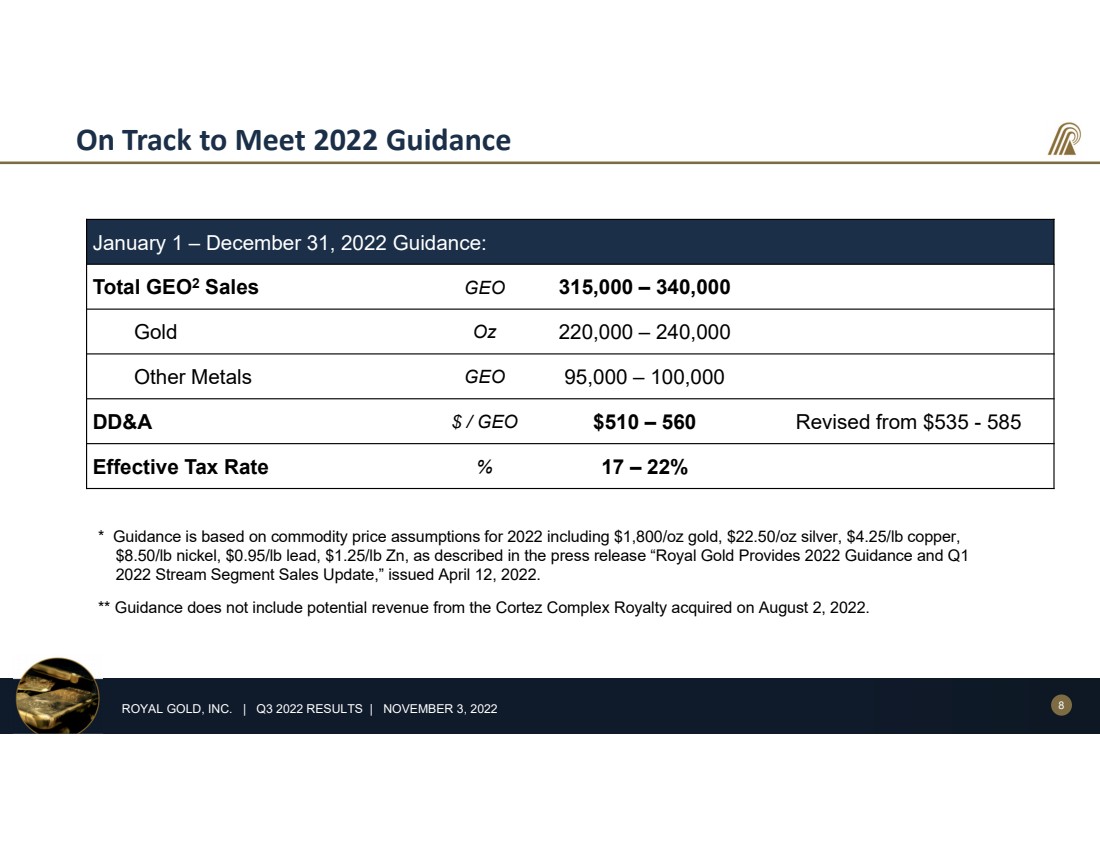
Total sales for 2022 are expected to come in around the midpoint of the previously issued range of 315,000 to 340,000 GEOs. Gold sales are expected to be towards the high end of the previously issued guidance range of 220,000 to 240,000 ounces, and other metals sales are expected to be at the lower end of the previously issued guidance range of 95,000 to 100,000 GEOs.
Due to lower gold and copper depletion rates at Mount Milligan, depreciation, depletion and amortization expense guidance for 2022 is reduced to $510 to $560 per GEO from the original range of $535 to $585 per GEO.
There is no change to the previously issued guidance for effective tax rate of 17% to 22% for 2022.
While the first full quarter of royalty revenue is expected from the Cortez Complex Royalty in the fourth quarter of 2022, the 2022 guidance ranges provided do not include any contribution from this royalty.
With respect to additional financing commitments, Royal Gold’s only remaining near term commitment is the potential payment of up to $6.8 million to a subsidiary of Ero Copper Corporation for the achievement of success-based targets related to regional exploration and mineral resource targets under the NX Gold stream, which may occur at any time prior to the end of 2024.
Property Highlights
A breakdown of revenue for the Company’s stream and royalty portfolio can be found on Table 1 for the three and nine month periods ended September 30, 2021 and 2022. Historical production reported by operators of the Company’s principal stream and royalty properties can be found on Table 2. Calendar year 2022 operator production estimates for the Company’s principal stream and royalty properties compared to actual production reported by the operators at these properties through September 30, 2022 can be found on Table 3. Stream segment purchases and sales for the three and nine month periods ended September 30, 2021 and 2022 and inventories for the quarters ended September 30, 2022 and December 31, 2021 can be found on Table 4. Highlights at certain of the Company’s principal producing and development properties during the quarter ended September 30, 2022, compared to the quarter ended September 30, 2021, are detailed in the Quarterly Report on Form 10-Q.
5
CORPORATE PROFILE |
Royal Gold is a precious metals stream and royalty company engaged in the acquisition and management of precious metal streams, royalties and similar production-based interests. As of September 30, 2022, the Company owned interests on 186 properties on five continents, including interests on 41 producing mines and 20 development stage projects. Royal Gold is publicly traded on the Nasdaq Global Select Market under the symbol “RGLD.” The Company’s website is located at www.royalgold.com.
For further information, please contact: |
| Third Quarter 2022 Call Information: | |
| | | |
Alistair Baker | | Dial-In | 844-200-6205 (U.S.); toll free |
Vice President Investor Relations and Business Development | | Numbers: | 833-950-0062 (Canada); toll free 646-904-5544 (International) |
(720) 554-6995 | | Access Code: | 183500 |
| | | |
Note: Management’s conference call reviewing the third quarter results will be held on Thursday, November 2, 2022, at 12:00 pm Eastern Time (10:00 am Mountain Time). The call will be webcast and archived on the Company’s website for a limited time. | | Webcast URL: | www.royalgold.com under Investors, Events & Presentations |
| | | |
| | | |
Additional Investor Information: Royal Gold routinely posts important information, including information about upcoming investor presentations and press releases, on its website under the Investors tab. Investors and other interested parties are encouraged to enroll at www.royalgold.com to receive automatic email alerts for new postings.
Forward-Looking Statements: This press release includes “forward-looking statements” within the meaning of U.S. federal securities laws. Forward-looking statements are any statements other than statements of historical fact. Forward-looking statements are not guarantees of future performance, and actual results may differ materially from these statements. Forward-looking statements are often identified by words like “will,” “may,” “could,” “should,” “would,” “believe,” “estimate,” “expect,” “anticipate,” “plan,” “forecast,” “potential,” “intend,” “continue,” “project,” or negatives of these words or similar expressions. Forward-looking statements include, among others, statements about the following: the strengths of our business model; our expected financial performance and outlook, including sales volume, revenue, expenses or tax rates; operators’ expected operating and financial performance, including production, deliveries, mine plans, environmental and feasibility studies, technical reports, mine facilities, mineral resources and reserves, and development; liquidity; the benefits of acquisitions, including, among others optionality and anticipated future production; fourth quarter 2022 production at Cortez being subject to the Cortez Complex Royalty; the Cortez Complex Royalty not covering the existing deposits within the Robertson property; the timing of royalty payments and metal deliveries, including deferred amounts at Pueblo Viejo; financing commitments; and the usefulness and importance of non-GAAP financial measures.
Factors that could cause actual results to differ materially from these forward-looking statements include, among others, the following: a lower-price environment for gold, silver, copper, nickel or other metals; operating activities or financial performance of properties on which we hold stream or royalty interests, including inaccuracies in operators’ disclosures, variations between actual and forecasted performance, operators’ ability to complete projects on schedule and as planned, operators’ changes to mine plans and reserves and resources (including updated mineral reserve and resource information as of December 31, 2021), liquidity needs, mining and environmental hazards, labor disputes, distribution and supply chain disruptions, permitting and licensing issues, contractual issues involving our stream or royalty agreements, or operational disruptions due to public health crises; risks associated with doing business in foreign countries; increased competition for stream and royalty interests; environmental risks, including those caused by climate change; potential cyber-attacks, including ransomware; our ability to identify, finance, value and complete acquisitions; effects of global and regional economic and market conditions, including as a result of government policies, war, natural disasters, and public health issues; changes in laws or regulations governing us, operators or operating properties; changes in management and key employees; the risk of litigation related to acquisitions; the diversion of management time from ongoing business operations due to acquisition-related issues; the volatility in commodity price for gold; public health crises, such as pandemics and epidemics, and any related government policies and actions; scrutiny and increased regulation of non-GAAP financial measures; and other factors described in our reports filed with the Securities and Exchange Commission, including Item 1A. Risk Factors of our Form 10-K for the Transition Period ended December 31, 2021. Most of these factors are beyond our ability to predict or control. Other unpredictable or unknown factors not discussed in this release could also have material adverse effects on forward looking statements.
Forward-looking statements speak only as of the date on which they are made. We disclaim any obligation to update any forward-looking statements, except as required by law. Readers are cautioned not to put undue reliance on forward-looking statements.
6
Statement Regarding Third-Party Information: Certain information provided in this press release, including production estimates, has been provided to us by the operators of the relevant properties or is publicly available information filed by these operators with applicable securities regulatory bodies, including the Securities and Exchange Commission. Royal Gold has not verified, and is not in a position to verify, and expressly disclaims any responsibility for the accuracy, completeness or fairness of any such third-party information and refers the reader to the public reports filed by the operators for information regarding those properties.
Information in this press release concerning the Khoemacau Copper Project was provided to the Company by Cupric Canyon Capital L.P., the privately held owner and developer of Khoemacau. Such information may not have been prepared in accordance with applicable laws, stock exchange rules or international standards governing preparation and public disclosure of technical data and information relating to mineral properties. Royal Gold has not verified, and is not in a position to verify, and expressly disclaims any responsibility for the accuracy, completeness or fairness of this third-party information, and investors are cautioned not to rely upon this information.
7
TABLE 1
Third Quarter 2022 and September Quarter 2021
Revenue by Stream and Royalty Interests
(In thousands)
| | | | | Three Months Ended | | | Nine Months Ended | |||||||
| | | | | September 30, | | | September 30, | |||||||
Stream/Royalty | Metal(s) | | Current Stream/Royalty Interest1 | | | 2022 |
|
| 2021 |
| | 2022 |
|
| 2021 |
Stream: | | | | | | | | | | | | | | | |
Canada | | | | | | | | | | | | | | | |
Mount Milligan | Gold, copper | | 35% of payable gold and 18.75% of payable copper | | $ | 41,553 | | $ | 53,455 | | $ | 129,596 | | $ | 131,061 |
Rainy River | Gold, silver | | 6.5% of gold produced and 60% of silver produced | | | 5,308 | | | 10,575 | | | 23,342 | | | 27,619 |
Latin America | | | | | | | | | | | | | | | |
Pueblo Viejo | Gold, silver | | 7.5% of Barrick's interest in payable gold and 75% of Barrick's interest in payable silver | | $ | 21,156 | | $ | 27,198 | | $ | 64,232 | | $ | 83,957 |
Andacollo | Gold | | 100% of payable gold | | | 12,170 | | | 11,601 | | | 39,565 | | | 52,491 |
NX Gold | Gold | | 25% of gold produced | | | 5,288 | | | 4,412 | | | 13,494 | | | 4,412 |
Africa | | | | | | | | | | | | | | | |
Wassa | Gold | | 10.5% of payable gold | | $ | 7,390 | | $ | 8,033 | | $ | 22,840 | | $ | 23,935 |
Khoemacau | Silver | | 100% of payable silver | | | 5,050 | | | 107 | | | 12,641 | | | 107 |
Prestea and Bogoso | Gold | | 5.5% of payable gold | | | 817 | | | 540 | | | 3,152 | | | 2,106 |
Total stream revenue | | | | | $ | 98,732 | | $ | 115,921 | | $ | 308,863 | | $ | 325,688 |
Royalty: | | | | | | | | | | | | | | | |
Canada | | | | | | | | | | | | | | | |
Voisey's Bay | Copper, nickel, cobalt | | 2.7% NVR | | $ | 2,679 | | $ | 3,406 | | | 10,502 | | | 13,702 |
Red Chris | Gold, copper | | 1.0% NSR | | | - | | | - | | | 3,432 | | | - |
Canadian Malartic | Gold | | 1.0%-1.5% sliding-scale NSR | | | 1,018 | | | 1,628 | | | 3,678 | | | 6,030 |
Williams | Gold | | 0.97% NSR | | | 236 | | | 571 | | | 697 | | | 2,028 |
LaRonde Zone 5 | Gold | | 2.0% NSR | | | 706 | | | 630 | | | 1,845 | | | 1,669 |
Other-Canada | Various | | Various | | | 187 | | | 167 | | | 1,223 | | | 1,187 |
United States | | | | | | | | | | | | | | | |
Cortez2 | Gold | | GSR1, GSR2, GSR3, NVR1, NVR1C | | $ | 4,562 | | $ | 17,126 | | $ | 29,413 | | $ | 39,475 |
Robinson | Gold, copper | | 3.0% NSR | | | 1,875 | | | 4,592 | | | 8,301 | | | 10,262 |
Marigold | Gold | | 2.0% NSR | | | 1,762 | | | 1,776 | | | 4,622 | | | 6,263 |
Goldstrike | Gold | | 0.9% NSR | | | 604 | | | 810 | | | 2,383 | | | 2,224 |
Wharf | Gold | | 0.0%-2.0% sliding-scale GSR | | | 577 | | | 974 | | | 1,857 | | | 2,527 |
Leeville | Gold | | 1.8% NSR | | | 1,104 | | | 1,156 | | | 3,041 | | | 2,091 |
Other-United States | Various | | Various | | | 929 | | | 646 | | | 2,999 | | | 2,061 |
Latin America | | | | | | | | | | | | | | | |
Peñasquito | Gold, silver, lead, zinc | | 2.0% NSR | | $ | 9,010 | | $ | 12,212 | | $ | 31,768 | | $ | 38,739 |
Dolores | Gold, silver | | 3.25% NSR (gold), 2.0% NSR (silver) | | | 2,085 | | | 3,215 | | | 7,147 | | | 8,149 |
El Limon | Gold | | 3.0% NSR | | | 1,169 | | | 1,100 | | | 4,411 | | | 3,456 |
Other-Latin America | Various | | Various | | | 472 | | | 526 | | | 1,073 | | | 525 |
Africa | | | | | | | | | | | | | | | |
Taparko | Gold | | 2.0% GSR, 0.75% GSR (milling royalty) | | $ | - | | $ | 602 | | $ | 430 | | $ | 1,909 |
Australia | | | | | | | | | | | | | | | |
South Laverton | Gold | | 1.5% NSR, 4.0% NPI | | $ | 1,675 | | $ | 4,313 | | $ | 4,694 | | $ | 7,811 |
Gwalia Deeps | Gold | | 1.5% NSR | | | 706 | | | 1,218 | | | 3,227 | | | 3,524 |
Meekatharra | Gold | | 0.45% or 1.5% NSR | | | 750 | | | 961 | | | 2,298 | | | 2,663 |
Other-Australia | Various | | Various | | | 315 | | | 425 | | | 1,314 | | | 1,528 |
Europe | | | | | | | | | | | | | | | |
Las Cruces | Copper | | 1.5% NSR (copper) | | $ | 276 | | $ | 456 | | $ | 1,008 | | $ | 1,536 |
Total royalty revenue | | | | | $ | 32,697 | | $ | 58,510 | | $ | 131,363 | | $ | 159,359 |
Total revenue | | | | | $ | 131,429 | | $ | 174,431 | | $ | 440,226 | | $ | 485,047 |
| 1 | Refer to Part I, Item 2, of the Company’s Transition Report on Form 10-K for a full description of the Company’s stream and royalty interests. |
| 2 | Cortez revenue for the three and nine months ended September 30, 2022, includes approximately $61 from approximately 3,300 ounces of gold production attributable to the Cortez Complex Royalty in the third quarter of 2022. |
8
TABLE 2
Operators’ Historical Production for Principal Properties
| | | | | | | | | | | | | | | | | | | | | | | | | | |
| | | | | | | | Reported Production For The Quarter Ended2 | ||||||||||||||||||
Property | | Operator | | Current Stream/ Royalty Interest1 | | Metal(s) | | Sep. 30, 2022 | | Jun. 30, 2022 | | Mar. 31, 2022 | | Dec. 31, 2021 | | Sep. 30, 2021 | ||||||||||
Stream: | | | | | | | | | | | | | | | | | | | | | | | | | | |
Mount Milligan | | Centerra | | 35% of payable gold | | Gold | | 18,200 | | oz | | 15,500 | | oz | | 13,900 | | oz | | 16,700 | | oz | | 19,300 | | oz |
| | | | 18.75% of payable copper | | Copper | | 2.7 | | Mlb | | 4.0 | | Mlb | | 3.6 | | Mlb | | 2.7 | | Mlb | | 4.4 | | Mlb |
Pueblo Viejo | | Barrick (60%) | | 7.5% of Barrick's interest in payable gold | | Gold | | 8,600 | | oz | | 7,100 | | oz | | 8,600 | | oz | | 9,200 | | oz | | 9,800 | | oz |
| | | | 75% of Barrick's interest in payable silver3 | | Silver | | 307,100 | | oz | | 274,500 | | oz | | 316,000 | | oz | | 396,500 | | oz | | 386,500 | | oz |
Andacollo | | Teck | | 100% of payable gold | | Gold | | 6,800 | | oz | | 6,300 | | oz | | 8,400 | | oz | | 9,100 | | oz | | 6,500 | | oz |
Wassa | | Chifeng Jilong Gold | | 10.5% of payable gold | | Gold | | 4,200 | | oz | | 4,400 | | oz | | 3,900 | | oz | | 4,300 | | oz | | 4,500 | | oz |
Khoemacau | | Khoemacau Copper Mining | | 100% of payable silver | | Silver | | 255,900 | | oz | | 221,800 | | oz | | 102,700 | | oz | | 214,600 | | oz | | 4,500 | | oz |
Royalty: | | | | | | | | | | | | | | | | | | | | | | | | | | |
Peñasquito | | Newmont Corporation | | 2.0% NSR | | Gold | | 144,300 | | oz | | 130,600 | | oz | | 133,400 | | oz | | 179,100 | | oz | | 170,300 | | oz |
| | | | | | Silver | | 6.8 | | Moz | | 8.1 | | Moz | | 7.7 | | Moz | | 8.3 | | Moz | | 7.8 | | Moz |
| | | | | | Lead | | 29.6 | | Mlb | | 35.0 | | Mlb | | 41.9 | | Mlb | | 39.4 | | Mlb | | 42.0 | | Mlb |
| | | | | | Zinc | | 84.6 | | Mlb | | 84.9 | | Mlb | | 120.1 | | Mlb | | 114.0 | | Mlb | | 98.3 | | Mlb |
Cortez4 | | Nevada Gold Mines LLC | | GSR1, GSR2, GSR3, NVR15, NVR1C5 | | Gold | | 36,600 | | oz | | 52,000 | | oz | | 102,000 | | oz | | 120,000 | | oz | | 106,300 | | oz |
| | | | | | | | | | | | | | | | | | | | | | | | | | |
| 1 | Refer to Part I, Item 2, of the Company’s Transition Report on Form 10-K for a full description of the Company’s stream and royalty interests. |
| 2 | Reported production relates to the amount of metal sales subject to the Company’s stream and royalty interests for the stated periods and may differ from the operators’ public reporting. |
| 3 | The Pueblo Viejo silver stream is determined based on a fixed metallurgical recovery of 70% of silver in mill feed. |
| 4 | Production excludes approximately 3,300 ounces of gold attributable to the Cortez Complex Royalty, which commenced in the third quarter of 2022. |
| 5 | Production includes applicable royalty deductions. |
9
TABLE 3
Operator’s Estimated and Actual Production
| | Calendar Year 2022 Operator's Production | | Calendar Year 2022 Operator's Production | ||||||||
| | Estimate(1) | | Actual(2) | ||||||||
Stream/Royalty | | Gold (oz) | | Silver (oz) | | Base Metals (lb) | | Gold (oz) | | Silver (oz) | | Base Metals (lb) |
Stream: |
| | | | | | | | | | | |
Andacollo(3) | | 36,000 |
| |
| |
| 17,800 |
| |
| |
Mount Milligan(4) |
| 190,000 - 210,000 |
| |
| |
| 81,800 |
| |
| |
Copper |
| |
| | | 70 - 80 M |
| |
| |
| 37.9 M |
Pueblo Viejo(5) |
| 400,000 - 440,000 | | N/A | | | | 330,000 | | N/A | | |
Wassa(6) | | 155,000 - 170,000 | | | | | | 125,600 | | | | |
Khoemacau(7) | | | | N/A | | | | | | N/A | | |
Royalty: | | |
| |
| |
| |
| |
| |
Cortez(8) | | 280,000 | | | | | | 190,600 | | | | |
Peñasquito(9) | | 475,000 |
| 29 M |
| | | 440,000 | | 23.3 M |
| |
Lead |
|
|
|
|
| 150 M | | | | |
| 112 M |
Zinc |
|
|
|
|
| 350 M | | | | |
| 297 M |
|
| | | | | | | | | | | |
| 1 | Production estimates received from the operators are for calendar 2022. There can be no assurance that production estimates received from the operators will be achieved. Please also refer to our cautionary language regarding forward-looking statements, as well as the Risk Factors identified in Part I, Item 1A, of the Company’s Transition Report for information regarding factors that could affect actual results. |
| 2 | Actual production figures shown are from the operators and cover the period January 1, 2022 through September 30, 2022, unless otherwise noted in footnotes to this table. Such amounts may differ from Royal Gold’s reported revenue and production and are not reduced to show the production attributable to the Company’s interests. |
| 3 | The actual production figure shown for Andacollo is contained gold in concentrate. |
| 4 | The estimated production figures shown for Mount Milligan are payable gold and copper in concentrate. The actual production figure is for the period January 1, 2022 through June 30, 2022. |
| 5 | The estimated and actual production figures shown for Pueblo Viejo are payable gold in doré and represent the 60% interest in Pueblo Viejo held by Barrick Gold Corporation (“Barrick”). Barrick did not provide estimated or actual silver production. |
| 6 | The estimated and actual production figures shown for Wassa are payable gold in doré poured in the period. |
| 7 | The estimated production figure for Khoemacau is not available through the ramp-up period. |
| 8 | The estimated and actual production figures for Cortez represent the areas subject to the Company’s royalty interests excluding the production from the Cortez Complex Royalty. |
| 9 | The estimated and actual gold and silver production figures shown for Peñasquito are payable gold and silver in concentrate and doré. The estimated and actual lead and zinc production figures shown are payable lead and zinc in concentrate. |
10
TABLE 4
Stream Summary
| | | Three Months Ended | | Three Months Ended | | | As of | | As of | ||||
| | | September 30, 2022 | | September 30, 2021 | | | September 30, 2022 | | December 31, 2021 | ||||
Gold Stream |
| | Purchases (oz) |
| Sales (oz) |
| Purchases (oz) |
| Sales (oz) |
| | Inventory (oz) |
| Inventory (oz) |
Mount Milligan | | | 18,400 | | 18,200 | | 10,800 | | 19,300 | | | 8,700 | | 4,100 |
Pueblo Viejo | | | 8,900 | | 8,600 | | 9,200 | | 9,800 | | | 8,900 | | 8,600 |
Wassa | | | 4,800 | | 4,200 | | 4,300 | | 4,500 | | | 2,000 | | 1,600 |
Andacollo | | | 3,200 | | 6,800 | | 6,400 | | 6,500 | | | — | | 2,200 |
Other | | | 7,100 | | 5,900 | | 7,500 | | 6,300 | | | 3,100 | | 2,200 |
Total | | | 42,400 | | 43,700 | | 38,200 | | 46,400 | | | 22,700 | | 18,700 |
| | | | | | | | | | | | | | |
| | | Three Months Ended | | Three Months Ended | | | As of | | As of | ||||
| | | September 30, 2022 | | September 30, 2021 | | | September 30, 2022 | | December 31, 2021 | ||||
Silver Stream |
| | Purchases (oz) |
| Sales (oz) |
| Purchases (oz) |
| Sales (oz) |
| | Inventory (oz) |
| Inventory (oz) |
Pueblo Viejo | | | 319,100 | | 307,100 | | 396,500 | | 386,500 | | | 319,100 | | 316,000 |
Khoemacau | | | 290,700 | | 255,900 | | 105,800 | | 4,500 | | | 114,400 | | 42,000 |
Other | | | 64,300 | | 51,100 | | 109,700 | | 165,400 | | | 29,600 | | 34,300 |
Total | | | 674,100 | | 614,100 | | 612,000 | | 556,400 | | | 463,100 | | 392,300 |
| | | | | | | | | | | | | | |
| | | Three Months Ended | | Three Months Ended | | | As of | | As of | ||||
| | | September 30, 2022 | | September 30, 2021 | | | September 30, 2022 | | December 31, 2021 | ||||
Copper Stream |
| | Purchases (Mlb) |
| Sales (Mlb) |
| Purchases (Mlb) |
| Sales (Mlb) |
| | Inventory (Mlb) |
| Inventory (Mlb) |
Mount Milligan | | | 4.5 | | 2.7 | | 2.6 | | 4.4 | | | 1.8 | | 0.9 |
| | | | | | | | | | | | | | |
| | | Nine Months Ended | | Nine Months Ended | ||||
| | | September 30, 2022 | | September 30, 2021 | ||||
Gold Stream |
| | Purchases (oz) |
| Sales (oz) |
| Purchases (oz) |
| Sales (oz) |
Mount Milligan | | | 52,200 | | 47,600 | | 43,800 | | 44,700 |
Pueblo Viejo | | | 24,600 | | 24,300 | | 30,100 | | 31,400 |
Andacollo | | | 19,300 | | 21,500 | | 28,400 | | 29,000 |
Wassa | | | 12,800 | | 12,500 | | 12,300 | | 13,200 |
Other | | | 20,500 | | 19,600 | | 15,800 | | 14,500 |
Total | | | 129,400 | | 125,500 | | 130,400 | | 132,800 |
| | | | | | | | | |
| | | Nine Months Ended | | Nine Months Ended | ||||
| | | September 30, 2022 | | September 30, 2021 | ||||
Silver Stream |
| | Purchases (oz) |
| Sales (oz) |
| Purchases (oz) |
| Sales (oz) |
Pueblo Viejo | | | 900,700 | | 897,600 | | 1,030,500 | | 1,052,100 |
Khoemacau | | | 652,800 | | 580,400 | | 105,800 | | 4,500 |
Other | | | 170,600 | | 175,300 | | 280,500 | | 303,700 |
Total | | | 1,724,100 | | 1,653,300 | | 1,416,800 | | 1,360,300 |
| | | | | | | | | |
| | | Nine Months Ended | | Nine Months Ended | ||||
| | | September 30, 2022 | | September 30, 2021 | ||||
Copper Stream |
| | Purchases (Mlb) |
| Sales (Mlb) |
| Purchases (Mlb) |
| Sales (Mlb) |
Mount Milligan | | | 11.2 | | 10.3 | | 11.2 | | 12.2 |
| | | | | | | | | |
11
ROYAL GOLD, INC.
Consolidated Balance Sheets
(Unaudited, in thousands except share data)
|
| | September 30, 2022 | | | December 31, 2021 | ||
ASSETS | | | | | | | | |
Cash and equivalents | | | $ | 122,238 | | | $ | 143,551 |
Royalty receivables | | | | 28,476 | | | | 54,088 |
Income tax receivable | | | | 15,056 | | | | 4,915 |
Stream inventory | | | | 13,691 | | | | 11,607 |
Prepaid expenses and other | | | | 2,322 | | | | 1,835 |
Total current assets | | | | 181,783 | | | | 215,996 |
Stream and royalty interests, net | | | | 3,084,380 | | | | 2,443,752 |
Other assets | | | | 110,630 | | | | 97,284 |
Total assets | | | $ | 3,376,793 | | | $ | 2,757,032 |
LIABILITIES | | | | | | | | |
Accounts payable | | | $ | 7,332 | | | $ | 6,475 |
Dividends payable | | | | 22,985 | | | | 22,966 |
Income tax payable | | | | 21,716 | | | | 19,070 |
Other current liabilities | | | | 12,443 | | | | 12,917 |
Total current liabilities | | | | 64,476 | | | | 61,428 |
Debt | | | | 446,327 | | | | — |
Deferred tax liabilities | | | | 140,197 | | | | 87,705 |
Other liabilities | | | | 5,854 | | | | 6,688 |
Total liabilities | | | | 656,854 | | | | 155,821 |
Commitments and contingencies | | | | | | | | |
EQUITY | | | | | | | | |
Preferred stock, $.01 par value, 10,000,000 shares authorized; and 0 shares issued | | | | — | | | | — |
Common stock, $.01 par value, 200,000,000 shares authorized; and 65,592,597 and 65,564,364 shares outstanding, respectively | | | | 656 | | | | 656 |
Additional paid-in capital | | | | 2,211,353 | | | | 2,206,159 |
Accumulated earnings | | | | 495,570 | | | | 381,929 |
Total Royal Gold stockholders’ equity | | | | 2,707,579 | | | | 2,588,744 |
Non-controlling interests | | | | 12,360 | | | | 12,467 |
Total equity | | | | 2,719,939 | | | | 2,601,211 |
Total liabilities and equity | | | $ | 3,376,793 | | | $ | 2,757,032 |
12
ROYAL GOLD, INC.
Consolidated Statements of Operations and Comprehensive Income
(Unaudited, in thousands except for per share data)
| | For The Three Months Ended | | For The Nine Months Ended | |||||||||||||
| | | September 30, 2022 | | | | September 30, 2021 | | September 30, 2022 | | | | September 30, 2021 | ||||
Revenue | | | $ | 131,429 | | | | $ | 174,431 | | $ | 440,226 | | | | $ | 485,047 |
Costs and expenses | | | | | | | | | | | | | | | | | |
Cost of sales (excludes depreciation, depletion and amortization) | | | | 23,221 | | | | | 27,230 | | | 69,670 | | | | | 73,367 |
General and administrative | | | | 7,554 | | | | | 7,129 | | | 25,797 | | | | | 21,272 |
Production taxes | | | | 1,119 | | | | | 2,054 | | | 4,765 | | | | | 6,042 |
Depreciation, depletion and amortization | | | | 37,761 | | | | | 50,611 | | | 129,739 | | | | | 139,935 |
Total costs and expenses | | | | 69,655 | | | | | 87,024 | | | 229,971 | | | | | 240,616 |
Operating income | | | | 61,774 | | | | | 87,407 | | | 210,255 | | | | | 244,431 |
Fair value changes in equity securities | | | | 356 | | | | | 176 | | | (1,221) | | | | | 4,035 |
Interest and other income | | | | 3,571 | | | | | 819 | | | 5,665 | | | | | 2,227 |
Interest and other expense | | | | (8,814) | | | | | (1,908) | | | (11,110) | | | | | (4,873) |
Income before income taxes | | | | 56,887 | | | | | 86,494 | | | 203,589 | | | | | 245,820 |
Income tax expense | | | | (10,954) | | | | | (16,028) | | | (20,347) | | | | | (39,242) |
Net income and comprehensive income | | | | 45,933 | | | | | 70,466 | | | 183,242 | | | | | 206,578 |
Net income and comprehensive income attributable to non-controlling interests | | | | (141) | | | | | (290) | | | (633) | | | | | (699) |
Net income and comprehensive income attributable to Royal Gold common stockholders | | | $ | 45,792 | | | | $ | 70,176 | | $ | 182,609 | | | | $ | 205,879 |
Net income per share attributable to Royal Gold common stockholders: | | | | | | | | | | | | | | | | | |
Basic earnings per share | | | $ | 0.70 | | | | $ | 1.07 | | $ | 2.78 | | | | $ | 3.14 |
Basic weighted average shares outstanding | | | | 65,579,834 | | | | | 65,556,608 | | | 65,571,737 | | | | | 65,552,586 |
Diluted earnings per share | | | $ | 0.70 | | | | $ | 1.07 | | $ | 2.78 | | | | $ | 3.13 |
Diluted weighted average shares outstanding | | | | 65,660,152 | | | | | 65,627,845 | | | 65,661,197 | | | | | 65,628,827 |
Cash dividends declared per common share | | | $ | 0.35 | | | | $ | 0.30 | | $ | 1.05 | | | | $ | 0.90 |
13
ROYAL GOLD, INC.
Consolidated Statements of Cash Flows
(Unaudited, in thousands)
| | Three Months Ended | | Nine Months Ended | ||||||||
|
| September 30, 2022 |
| September 30, 2021 | | September 30, 2022 |
| September 30, 2021 | ||||
Cash flows from operating activities: | | | | | | | | | | | | |
Net income and comprehensive income | | $ | 45,933 | | $ | 70,466 | | $ | 183,242 | | $ | 206,578 |
Adjustments to reconcile net income and comprehensive income to net cash provided by operating activities: | | | | | | | | | | | | |
Depreciation, depletion and amortization | | | 37,761 | | | 50,611 | | | 129,739 | | | 139,935 |
Non-cash employee stock compensation expense | | | 2,090 | | | 1,503 | | | 6,632 | | | 4,340 |
Fair value changes in equity securities | | | (356) | | | (176) | | | 1,221 | | | (4,035) |
Deferred tax (benefit) expense | | | 10,357 | | | (396) | | | (17,757) | | | 8,465 |
Other | | | 243 | | | 845 | | | 734 | | | 1,418 |
Changes in assets and liabilities: | | | | | | | | | | | | |
Royalty receivables | | | 8,392 | | | (5,718) | | | 25,612 | | | (8,643) |
Stream inventory | | | (519) | | | 5,463 | | | (2,083) | | | 1,678 |
Income tax receivable | | | (7,344) | | | 439 | | | (10,141) | | | 4,858 |
Prepaid expenses and other assets | | | (1,714) | | | (1,026) | | | (3,073) | | | (1,608) |
Accounts payable | | | 266 | | | (927) | | | 857 | | | 2,859 |
Income tax payable | | | (2,330) | | | 9,454 | | | 2,646 | | | 615 |
Uncertain tax positions | | | — | | | (20) | | | — | | | (12,378) |
Other liabilities | | | 2,210 | | | (633) | | | (1,310) | | | (1,111) |
Net cash provided by operating activities | | $ | 94,989 | | $ | 129,885 | | $ | 316,319 | | $ | 342,971 |
Cash flows from investing activities: | | | | | | | | | | | | |
Acquisition of stream and royalty interests | | | (677,988) | | | (265,000) | | | (715,829) | | | (384,315) |
Khoemacau subordinated debt facility | | | — | | | (7,000) | | | — | | | (25,000) |
Proceeds from sale of equity securities | | | — | | | — | | | — | | | 8,651 |
Other | | | (640) | | | (733) | | | (676) | | | (910) |
Net cash used in investing activities | | $ | (678,628) | | $ | (272,733) | | $ | (716,505) | | $ | (401,574) |
Cash flows from financing activities: | | | | | | | | | | | | |
Repayment of debt | | | (50,000) | | | — | | | (50,000) | | | (200,000) |
Borrowings from revolving credit facility | | | 500,000 | | | 100,000 | | | 500,000 | | | 100,000 |
Net payments from issuance of common stock | | | (1,546) | | | (909) | | | (1,438) | | | (959) |
Common stock dividends | | | (22,985) | | | (19,682) | | | (68,938) | | | (59,046) |
Other | | | (210) | | | (2,269) | | | (751) | | | (3,043) |
Net cash provided by (used in) financing activities | | $ | 425,259 | | $ | 77,140 | | $ | 378,873 | | $ | (163,048) |
Net decrease in cash and equivalents | | | (158,380) | | | (65,708) | | | (21,313) | | | (221,651) |
Cash and equivalents at beginning of period | | | 280,617 | | | 225,916 | | | 143,551 | | | 381,859 |
Cash and equivalents at end of period | | $ | 122,238 | | $ | 160,208 | | $ | 122,238 | | $ | 160,208 |
14
Schedule A – Non-GAAP Financial Measures and Certain Other Measures
Overview of non-GAAP financial measures:
Non-GAAP financial measures are intended to provide additional information only and do not have any standard meaning prescribed by U.S. generally accepted accounting principles (“GAAP”). These measures should not be considered in isolation or as a substitute for measures prepared in accordance with GAAP. In addition, because the presentation of these non-GAAP financial measures varies among companies, these non-GAAP financial measures may not be comparable to similarly titled measures used by other companies.
We have provided below reconciliations of our non-GAAP financial measures to the comparable GAAP measures. We believe these non-GAAP financial measures provide useful information to investors for analysis of our business. We use these non-GAAP financial measures to compare period-over-period performance on a consistent basis and when planning and forecasting for future periods. We believe these non-GAAP financial measures are used by professional research analysts and others in the valuation, comparison and investment recommendations of companies in our industry. Many investors use the published research reports of these professional research analysts and others in making investment decisions. The adjustments made to calculate our non-GAAP financial measures are subjective and involve significant management judgement. Non-GAAP financial measures used by management in this report or elsewhere include the following:
| 1. | Adjusted earnings before interest, taxes, depreciation, depletion and amortization, or adjusted EBITDA, is a non-GAAP financial measure that is calculated by the Company as net income adjusted for certain items that impact the comparability of results from period to period, as set forth in the reconciliation below. We consider adjusted EBITDA to be useful because the measure reflects our operating performance before the effects of certain non-cash items and other items that we believe are not indicative of our core operations. |
| 2. | Net debt (or net cash) is a non-GAAP financial measure that is calculated by the Company as debt (excluding debt issuance costs) as of a date minus cash and equivalents for that same date. Net debt (or net cash) to trailing twelve months (TTM) adjusted EBITDA is a non-GAAP financial measure that is calculated by the Company as net debt (or net cash) as of a date divided by the TTM adjusted EBITDA (as defined above) ending on that date. We believe that these measures are important to monitor leverage and evaluate the balance sheet. Cash and equivalents are subtracted from the GAAP measure because they could be used to reduce our debt obligations. A limitation associated with using net debt (or net cash) is that it subtracts cash and equivalents and therefore may imply that there is less Company debt than the most comparable GAAP measure indicates. We believe that investors may find these measures useful to monitor leverage and evaluate the balance sheet. |
| 3. | Adjusted net income and adjusted net income per share are non-GAAP financial measures that are calculated by the Company as net income and net income per share adjusted for certain items that impact the comparability of results from period to period, as set forth in the reconciliations below. We consider these non-GAAP financial measures to be useful because they allow for period-to-period comparisons of our operating results excluding items that we believe are not indicative of our fundamental ongoing operations. The tax effect of adjustments is computed by applying the statutory tax rate in the applicable jurisdictions to the income or expense items that are adjusted in the period presented. If a valuation allowance exists, the rate applied is zero. |
| 4. | Free cash flow is a non-GAAP financial measure that is calculated by the Company as net cash provided by operating activities for a period minus acquisition of stream and royalty interests for that same period. We believe that free cash flow represents an additional way of viewing liquidity as it is adjusted for contractual investments made during such period. Free cash flow does not represent the residual cash flow available for discretionary expenditures. We believe it is important to view free cash flow as a complement to our consolidated statements of cash flows. |
| 5. | Cash general and administrative expense, or cash G&A, is a non-GAAP financial measure that is calculated by the Company as general and administrative expenses for a period minus non-cash employee stock compensation expense for the same period. We believe that cash G&A is useful as an indicator of overhead efficiency without regard to non-cash expenses associated with employee stock compensation. |
Reconciliation of non-GAAP financial measures to U.S. GAAP measures
Adjusted EBITDA, net cash, and net cash to TTM adjusted EBITDA:
| | Three Months Ended | ||||
| | September 30, | ||||
(amounts in thousands) | | 2022 | | 2021 | ||
Net income and comprehensive income | | $ | 45,933 | | $ | 70,466 |
Depreciation, depletion and amortization | | | 37,761 | | | 50,611 |
Non-cash employee stock compensation | | | 2,090 | | | 1,503 |
Fair value changes in equity securities | | | (356) | | | (176) |
Interest and other, net | | | 5,243 | | | 1,089 |
Income tax expense | | | 10,954 | | | 16,028 |
Non-controlling interests in operating income of consolidated subsidiaries | | | (141) | | | (290) |
Adjusted EBITDA | | $ | 101,484 | | $ | 139,231 |
15
| | Three Months Ended | ||||||||||
| | September 30, | | June 30, | | March 31, | | December 31, | ||||
(amounts in thousands) | | 2022 | | 2022 | | 2022 | | 2021 | ||||
Net income and comprehensive income | | $ | 45,933 | | $ | 71,345 | | $ | 65,962 | | $ | 68,362 |
Depreciation, depletion and amortization | | | 37,761 | | | 43,989 | | | 47,988 | | | 49,074 |
Non-cash employee stock compensation | | | 2,090 | | | 2,418 | | | 2,124 | | | 1,715 |
Fair value changes in equity securities | | | (356) | | | 2,191 | | | (613) | | | 1,526 |
Interest and other, net | | | 5,243 | | | 280 | | | (77) | | | 88 |
Income tax expense (benefit) | | | 10,954 | | | (5,911) | | | 15,304 | | | 13,980 |
Non-controlling interests in operating income of consolidated subsidiaries | | | (141) | | | (205) | | | (287) | | | (199) |
Adjusted EBITDA | | $ | 101,484 | | $ | 114,107 | | $ | 130,401 | | $ | 134,546 |
| | | | | | | | | | | | |
TTM adjusted EBITDA | | $ | 480,538 | | | | | | | | | |
| | | | | | | | | | | | |
Debt | | $ | 446,327 | | | | | | | | | |
Debt issuance costs | | | 3,673 | | | | | | | | | |
Cash and equivalents | | | (122,238) | | | | | | | | | |
Net (cash) debt | | $ | 327,762 | | | | | | | | | |
| | | | | | | | | | | | |
TTM adjusted EBITDA | | $ | 480,538 | | | | | | | | | |
Net debt to TTM adjusted EBITDA | | | 0.68x | | | | | | | | | |
Cash G&A:
| | Three Months Ended | ||||
| | September 30, | ||||
(amounts in thousands) |
| 2022 | | 2021 | ||
General and administrative expense | | $ | 7,554 | | $ | 7,129 |
Non-cash employee stock compensation | | | (2,090) | | | (1,503) |
Cash G&A | | $ | 5,464 | | $ | 5,626 |
| | Three Months Ended | ||||||||||
| | September 30, | | June 30, | | March 31, | | December 31, | ||||
(amounts in thousands) |
| 2022 | | 2022 | | 2022 | | 2021 | ||||
General and administrative expense | | $ | 7,554 | | $ | 9,312 | | $ | 8,931 | | $ | 8,034 |
Non-cash employee stock compensation | | | (2,090) | | | (2,418) | | | (2,124) | | | (1,715) |
Cash G&A | | $ | 5,464 | | $ | 6,894 | | $ | 6,807 | | $ | 6,319 |
| | | | | | | | | | | | |
TTM cash G&A | | $ | 25,484 | | | | | | | | | |
Adjusted net income and adjusted net income per share:
| | Three Months Ended | | Nine Months Ended | ||||||||
| | September 30, | | September 30, | ||||||||
(amounts in thousands, except per share data) | | 2022 | | 2021 | | 2022 | | 2021 | ||||
Net income and comprehensive income attributable to Royal Gold common stockholders | | $ | 45,792 | | $ | 70,176 | | $ | 182,609 | | $ | 205,879 |
Fair value changes in equity securities | | | (356) | | | (176) | | | 1,221 | | | (4,035) |
Discrete tax benefits | | | — | | | — | | | (18,755) | | | (8,886) |
Great Bear Royalty acquisition foreign currency loss | | | 2,147 | | | — | | | 2,147 | | | — |
Tax effect of adjustments | | | (475) | | | 47 | | | (893) | | | 984 |
Adjusted net income and comprehensive income attributable to Royal Gold common stockholders | | | 47,108 | | | 70,047 | | $ | 166,329 | | $ | 193,942 |
| | | | | | | | | | | | |
Net income attributable to Royal Gold common stockholders per diluted share | | $ | 0.70 | | $ | 1.07 | | | 2.78 | | | 3.13 |
Fair value changes in equity securities | | | (0.01) | | | — | | | 0.02 | | | (0.06) |
Discrete tax benefits | | | — | | | — | | | (0.29) | | | (0.14) |
Great Bear Royalty acquisition foreign currency loss | | | 0.03 | | | — | | | 0.03 | | | — |
Tax effect of adjustments | | | (0.01) | | | — | | | (0.01) | | | 0.01 |
Adjusted net income attributable to Royal Gold common stockholders per diluted share | | $ | 0.71 | | $ | 1.07 | | $ | 2.53 | | $ | 2.94 |
16
Free cash flow:
| | Three Months Ended | | Nine Months Ended | ||||||||
| | September 30, | | September 30, | ||||||||
(amounts in thousands) | | 2022 | | 2021 | | 2022 | | 2021 | ||||
Net cash provided by operating activities | | $ | 94,989 | | $ | 129,885 | | $ | 316,319 | | $ | 342,971 |
Acquisition of stream and royalty interests | | | (677,988) | | | (265,000) | | | (715,829) | | | (384,315) |
Free cash flow | | $ | (582,999) | | $ | (135,115) | | $ | (399,510) | | $ | (41,344) |
| | | | | | | | | | | | |
Net cash used in investing activities | | $ | (678,628) | | $ | (272,733) | | $ | (716,505) | | $ | (401,574) |
Net cash provided by (used in) financing activities | | $ | 425,259 | | $ | 77,140 | | $ | 378,873 | | $ | (163,048) |
Other measures
We use certain other measures in managing and evaluating our business. We believe these measures may provide useful information to investors for analysis of our business. We use these measures to compare period-over-period performance and liquidity on a consistent basis and when planning and forecasting for future periods. We believe these measures are used by professional research analysts and others in the valuation, comparison, and investment recommendations of companies in our industry. Many investors use the published research reports of these professional research analysts and others in making investment decisions. Other measures used by management in this report and elsewhere include the following:
| 1. | Gold equivalent ounces, or GEOs, is calculated by the Company as revenue (in total or by reportable segment) for a period divided by the average gold price for that same period. |
| 2. | Depreciation, depletion, and amortization, or DD&A, per GEO is calculated by the Company as depreciation, depletion, and amortization for a period divided by GEOs (as defined above) for that same period. |
| 3. | Working capital is calculated by the Company as current assets as of a date minus current liabilities as of that same date. Liquidity is calculated by the Company as working capital plus available capacity under the Company’s revolving credit facility. |
| 4. | Dividend payout ratio is calculated by the Company as dividends paid during a period divided by net cash provided by operating activities for that same period. |
| 5. | Operating margin is calculated by the Company as operating income for a period divided by revenue for that same period. |
| 6. | Adjusted EBITDA margin is a non-GAAP financial measure and is calculated by the Company as adjusted EBITDA (as discussed above) for a period divided by revenue for that same period. This measure can be reconciled to a GAAP measure calculated as net income and comprehensive net income for a period divided by revenue for that same period. We consider adjusted EBITDA margin to be useful because the measure reflects our operating performance before the effects of certain non-cash items and other items that we believe are not indicative of our core operations. |
17