Exhibit 99.1

B. Riley Financial Reports Fourth Quarter and Full Year 2021 Results
Q4 2021 Net income of $62.2 million, $2.08 diluted EPS
Q4 2021 Total revenues of $422.1 million, total adjusted EBITDA of $138.0 million
Q4 2021 Operating revenues of $353.3 million, operating adjusted EBITDA of $106.1 million
Strong earnings driven by investment banking,
in addition to wealth management, principal investments, and brands
Declares regular quarterly dividend of $1.00 per common share
LOS ANGELES, February 23, 2022 – B. Riley Financial, Inc. (NASDAQ: RILY), a diversified financial services company, today announced results for the three- and twelve-month period ended December 31, 2021.
Fourth Quarter 2021 Financial Highlights
| ● | Net income of $62.2 million, $2.08 diluted EPS |
| ● | Total revenues of $422.1 million |
| ● | Total adjusted EBITDA (1) of $138.0 million |
| ● | Operating revenues (2) of $353.3 million |
| ● | Operating adjusted EBITDA (3) of $106.1 million |
Full Year 2021 Financial Highlights
| ● | Net income of $437.6 million, $15.09 diluted EPS |
| ● | Total revenues of $1,740.6 million |
| ● | Total adjusted EBITDA (1) of $762.5 million |
| ● | Operating revenues (2) of $1,353.9 million |
| ● | Operating adjusted EBITDA (3) of $422.0 million |
| ● | Strengthened wealth management, asset management and M&A capabilities |
| ● | Significantly lowered cost of debt |
| ● | Declared dividends of $10.00 per common share for FY 2021 |
Bryant Riley, Chairman and Co-Chief Executive Officer of B. Riley Financial, said: “We are pleased to report another strong quarter and full year of results thanks to our talented and ambitious team. By adding to our wealth management, asset management and M&A businesses through acquisition and hiring exceptional talent in all areas, we continue to provide unique capabilities to our clients and partners. In 2021, we strengthened our balance sheet and reduced our cost of capital, allowing us the flexibility to invest across the platform and return capital to shareholders with share buybacks and dividend payments. Over the past four quarters, B. Riley has declared $10.00 in common dividends thanks to the strong cash flow of our episodic and recurring businesses.”
Tom Kelleher, Co-Chief Executive Officer of B. Riley Financial, added: “Operating revenue for the full year 2021 increased 70% to $1.4 billion compared to $799 million for the full year 2020. Our efforts to cross-sell throughout the platform is gaining traction and creating opportunities. Furthermore, we have continued to expand our platform as we recently welcomed the addition of FocalPoint Securities, which will enhance our firm’s investment banking efforts, with a specific emphasis on M&A advisory and financial sponsors. We also completed the purchase of a portfolio of loan receivables from Badcock Home Furniture which we believe will add an attractive and consistent income stream.”
| www.brileyfin.com | NASDAQ: RILY | 1 |

Mr. Riley continued: “Over the past couple of months capital markets have slowed significantly. While we have been a large beneficiary of these markets we also recognize the strength and differentiation of our business model if they are to continue to soften. When we took the business public in 2014 our business was highly correlated to two cyclical businesses, brokerage and liquidation. Since that time, we have taken aggressive steps to diversify the cash flow profile of our company by adding several non-correlated companies such as our communications, brands and financial consulting businesses in addition to our recent accounts receivables portfolio. In addition, the credit and current income portion of our investment portfolio provides approximately $85 million of interest and dividend income. Combined, our non-cyclical businesses and assets provide enough cash flow to cover the vast majority of our annual operating expenses, interest and dividend. Clearly, we expect strong profits from B. Riley Securities this year and every year. As a reminder, that business has generated a majority of our capital markets operating segment income in each of the last three years. However, we believe our diversification is a competitive advantage and will enable us to invest when others may need to contract.”
Declaration of Common Dividend
B. Riley has declared a regular quarterly cash dividend of $1.00 per common share which is payable on or about March 23 to common stockholders of record as of March 9. Including this $1.00 regular dividend, the Company will have paid $10.00 in common dividends to shareholders related to the FY 2021 period.
Share Repurchases
Under the prior share repurchase plan, effective as of October 27, 2020, the Company repurchased approximately 495,000 of its common shares for an aggregate amount of approximately $12.6 million through December 31, 2021. During the fourth quarter of 2021, B. Riley’s Board of Directors approved a new annual share repurchase program for up to $50 million.
Financial Summary
| Three Months Ended | Twelve Months Ended | |||||||||||||||
| December 31, | December 31, | |||||||||||||||
| (Dollars in thousands, except for share data) | 2021 | 2020 | 2021 | 2020 | ||||||||||||
| Net income available to common shareholders | $ | 62,182 | $ | 170,114 | $ | 437,597 | $ | 200,438 | ||||||||
| Basic income per common share | $ | 2.26 | $ | 6.72 | $ | 15.99 | $ | 7.83 | ||||||||
| Diluted income per common share | $ | 2.08 | $ | 6.55 | $ | 15.09 | $ | 7.56 | ||||||||
For the fourth quarter, net income available to common shareholders was $62.2 million, or $2.08 diluted earnings per share (EPS). For the full year, net income available to common shareholders was $437.6 million, or $15.09 diluted EPS.
| www.brileyfin.com | NASDAQ: RILY | 2 |
| Three Months Ended | Twelve Months Ended | |||||||||||||||
| December 31, | December 31, | |||||||||||||||
| (Dollars in thousands) | 2021 | 2020 | 2021 | 2020 | ||||||||||||
| Operating Revenues (2) | $ | 353,252 | $ | 270,046 | $ | 1,353,885 | $ | 798,703 | ||||||||
| Investment Gains (4) | 68,858 | 140,160 | 386,676 | 104,018 | ||||||||||||
| Total Revenues | $ | 422,110 | $ | 410,206 | $ | 1,740,561 | $ | 902,721 | ||||||||
| Operating Adjusted EBITDA (3) | $ | 106,097 | $ | 126,787 | $ | 422,029 | $ | 311,673 | ||||||||
| Investment Adjusted EBITDA (5) | 31,928 | 133,699 | 340,465 | 95,145 | ||||||||||||
| Total Adjusted EBITDA (1) | $ | 138,025 | $ | 260,486 | $ | 762,494 | $ | 406,818 | ||||||||
For the three months ended December 31, 2021:
| ● | Total revenues increased 3% to $422.1 million from $410.2 million for the prior year period. |
| ● | Total adjusted EBITDA (1) of $138.0 million compared to $260.5 million for the prior year period. |
| ● | Operating revenues (2) increased 31% to $353.3 million from $270.0 million for the prior year period. |
| ● | Operating adjusted EBITDA (3) of $106.1 million compared to $126.8 million for the prior year period. |
| ● | Quarterly investment gains (4) were $68.9 million which reflect certain strategic investments held by the Company. |
For the full year:
| ● | Total revenues increased 93% to $1.7 billion from $902.7 million for the prior year period. |
| ● | Total adjusted EBITDA (1) increased 87% to $762.5 million from $406.8 million for the prior year period. |
| ● | Operating revenues (2) increased 70% to $1.4 billion from $798.7 million for the prior year period. |
| ● | Operating adjusted EBITDA (3) increased 35% to $422.0 million from $311.7 million for the prior year period. |
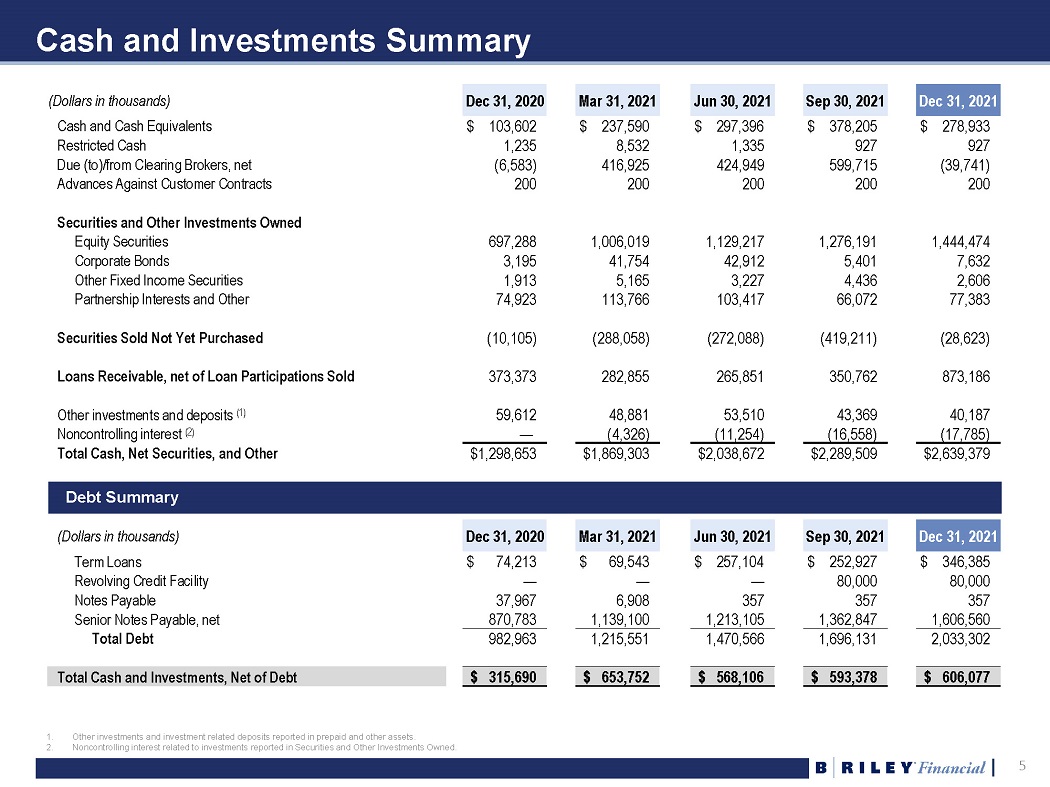
As of December 31, 2021 cash and investments (6) totaled approximately $2.6 billion including cash and cash equivalents of $278.9 million. Total cash and investments, (6) net of debt, was approximately $606 million.
| www.brileyfin.com | NASDAQ: RILY | 3 |
Segment Financial Summary and Highlights
| Operating Revenues (2) | Investment Gains (4) | Total Segment Revenue | ||||||||||||||||||||||
| Three Months Ended December 31, |
Three Months Ended December 31, |
Three Months Ended December 31, |
||||||||||||||||||||||
| (Dollars in thousands) | 2021 | 2020 | 2021 | 2020 | 2021 | 2020 | ||||||||||||||||||
| Capital Markets | $ | 176,935 | $ | 180,214 | $ | 67,718 | $ | 139,750 | $ | 244,653 | $ | 319,964 | ||||||||||||
| Wealth Management | 103,803 | 20,851 | 1,140 | 410 | 104,943 | 21,261 | ||||||||||||||||||
| Auction and Liquidation | 5,718 | 15,667 | - | - | 5,718 | 15,667 | ||||||||||||||||||
| Financial Consulting | 27,877 | 26,480 | - | - | 27,877 | 26,480 | ||||||||||||||||||
| Principal Investments | 33,872 | 21,383 | - | - | 33,872 | 21,383 | ||||||||||||||||||
| Brands | 5,047 | 5,451 | - | - | 5,047 | 5,451 | ||||||||||||||||||
| Segment Operating Income (Loss) (7) |
Investment Income (5) | Total Segment Income (Loss) | ||||||||||||||||||||||
| Three Months Ended December 31, |
Three Months Ended December 31, |
Three Months Ended December 31, |
||||||||||||||||||||||
| (Dollars in thousands) | 2021 | 2020 | 2021 | 2020 | 2021 | 2020 | ||||||||||||||||||
| Capital Markets | $ | 87,203 | $ | 101,253 | $ | 30,788 | $ | 133,289 | $ | 117,991 | $ | 234,542 | ||||||||||||
| Wealth Management | 4,916 | 1,250 | 1,140 | 410 | 6,056 | 1,660 | ||||||||||||||||||
| Auction and Liquidation | (2,706 | ) | 7,460 | - | - | (2,706 | ) | 7,460 | ||||||||||||||||
| Financial Consulting | 6,628 | 6,873 | - | - | 6,628 | 6,873 | ||||||||||||||||||
| Principal Investments | 5,846 | 7,300 | - | - | 5,846 | 7,300 | ||||||||||||||||||
| Brands | 3,605 | 4,054 | - | - | 3,605 | 4,054 | ||||||||||||||||||
For the three months ended December 31, 2021:
Capital Markets segment revenues decreased 24% to $244.7 million for the fourth quarter. Excluding investment gains (4) of $67.7 million, segment operating revenues (2) decreased 2% year-over-year to $176.9 million, and segment operating income (7) decreased 14% to $87.2 million for the quarter. Performance was primarily driven by investment banking and fees generated from several significant debt and equity capital markets transactions completed during the quarter.
Wealth Management segment revenues and segment income increased to $104.9 million and $6.1 million, respectively, reflecting the addition of National Holdings which was acquired in February 2021. Combined wealth management assets under management were over $32 billion as of December 31, 2021.
Auction and Liquidation segment revenues totaled $5.7 million. Results for this segment vary from quarter-to-quarter and year-to-year due to the episodic impact of large retail liquidation engagements.
Financial Consulting segment revenues increased to $27.9 million from $26.5 million in prior year period. Segment income decreased to $6.6 million, down from $6.9 million for the prior year period.
Principal Investments segment companies, magicJack, United Online, and Marconi Wireless, acquired during the quarter, continued to perform above expectations, contributing recurring cash flow to the Company.
Brands generated quarterly segment revenues of $5.0 million related to the licensing of brand trademarks.
| www.brileyfin.com | NASDAQ: RILY | 4 |
| Operating Revenues (2) | Investment Gains (4) | Total Segment Revenue | ||||||||||||||||||||||
| Twelve Months Ended December 31, |
Twelve Months Ended December 31, |
Twelve Months Ended December 31, |
||||||||||||||||||||||
| (Dollars in thousands) | 2021 | 2020 | 2021 | 2020 | 2021 | 2020 | ||||||||||||||||||
| Capital Markets | $ | 698,040 | $ | 442,376 | $ | 379,053 | $ | 103,214 | $ | 1,077,093 | $ | 545,590 | ||||||||||||
| Wealth Management | 374,361 | 72,345 | 7,623 | 804 | 381,984 | 73,149 | ||||||||||||||||||
| Auction and Liquidation | 73,517 | 88,764 | - | - | 73,517 | 88,764 | ||||||||||||||||||
| Financial Consulting | 94,312 | 91,622 | - | - | 94,312 | 91,622 | ||||||||||||||||||
| Principal Investments | 93,347 | 87,138 | - | - | 93,347 | 87,138 | ||||||||||||||||||
| Brands | 20,308 | 16,458 | - | - | 20,308 | 16,458 | ||||||||||||||||||
| Segment Operating Income (Loss) (7) |
Investment Income (5) | Total Segment Income (Loss) | ||||||||||||||||||||||
| Twelve Months Ended December 31, |
Twelve Months Ended December 31, |
Twelve Months Ended December 31, |
||||||||||||||||||||||
| (Dollars in thousands) | 2021 | 2020 | 2021 | 2020 | 2021 | 2020 | ||||||||||||||||||
| Capital Markets | $ | 344,029 | $ | 206,533 | $ | 332,842 | $ | 94,341 | $ | 676,871 | $ | 300,874 | ||||||||||||
| Wealth Management | 8,311 | 2,097 | 7,623 | 804 | 15,934 | 2,901 | ||||||||||||||||||
| Auction and Liquidation | 8,054 | 25,769 | - | - | 8,054 | 25,769 | ||||||||||||||||||
| Financial Consulting | 16,894 | 22,543 | - | - | 16,894 | 22,543 | ||||||||||||||||||
| Principal Investments | 27,158 | 33,360 | - | - | 27,158 | 33,360 | ||||||||||||||||||
| Brands | 14,385 | (1,789 | ) | - | - | 14,385 | (1,789 | ) | ||||||||||||||||
For the full year:
Capital Markets operating revenues (2) increased to $698.0 million with segment operating income (7) of $344.0 million, compared to operating revenues (2) of $442.4 million and segment operating income (7) of $206.5 million in the prior year period.
Wealth Management annual revenues increased to $382.0 million from $73.1 million in prior year period. Segment income increased to $15.9 million, up from $2.9 million for the prior year period. The increases are primarily from the addition of National Holdings.
Auction and Liquidation generated annual revenues of $73.5 million and segment income of $8.1 million related to retail liquidation and store closing projects completed during 2021.
Financial Consulting annual revenues increased to $94.3 million from $91.6 million in prior year period. Segment income decreased to $16.9 million, down from $22.5 million for the prior year period.
Principal Investments companies continued to outperform initial investment estimates and provide steady cash flow for the B. Riley platform. For the full year, magicJack, United Online and Marconi Wireless contributed revenues of $93.3 million and segment income of $27.2 million.
Brands contributed licensing revenue of $20.3 million in 2021.
| www.brileyfin.com | NASDAQ: RILY | 5 |
Supplemental Financial Data
Additional metrics related to operating results and investments can be found in the Fourth Quarter and Full Year 2021 Financial Supplement on B. Riley’s investor relations website.
Conference Call Details
Management will host an investor call to discuss its fourth quarter and full year results today, Wednesday, February 23, 2022 at 4:30 p.m. Eastern time (1:30 p.m. Pacific time). Investors may access the live broadcast and archived recording via the Company’s investor relations website at ir.brileyfin.com.
| Date and Time: | Wednesday, February 23, 2022 at 4:30 p.m. Eastern time (1:30 p.m. Pacific time) |
| Dial In: | 1-877-300-8521 (toll-free) or 1-412-317-6026 (international) |
| Audio Webcast: | https://ir.brileyfin.com/events-and-presentations |
Replay (expires Wednesday, March 2, 2022)
| Dial In: | 1-844-512-2921; 10164067 (pin) |
| Replay Link: | https://ir.brileyfin.com/events-and-presentations |
About B. Riley Financial
B. Riley Financial provides collaborative solutions tailored to fit the capital raising and business advisory needs of its clients and partners. B. Riley operates through several subsidiaries that offer a diverse range of complementary end-to-end capabilities spanning investment banking and institutional brokerage, private wealth and investment management, financial consulting, corporate restructuring, operations management, risk and compliance, due diligence, forensic accounting, litigation support, appraisal and valuation, auction, and liquidation services. For more information, please visit www.brileyfin.com.
Footnotes (See “Note Regarding Use of Non-GAAP Financial Measures” for further discussion of these non-GAAP terms.)
| (1) | Adjusted EBITDA includes earnings before interest, taxes, depreciation, amortization, restructuring costs, share-based payments, gain on extinguishment of loans, impairment of tradenames, and transaction related and other costs. For a definition of adjusted EBITDA and a reconciliation to GAAP financial measures, please see the Appendix hereto. |
| (2) | Operating revenue is defined as the sum of revenues from services and fees, interest income - loans and securities lending, and sale of goods. |
| (3) | Operating adjusted EBITDA is defined as adjusted EBITDA excluding trading income (losses) and fair value adjustments on loans and other investment related expenses. |
| (4) | Investment gains (loss) is defined as trading income and fair value adjustments on loans. |
| (5) | Investment adjusted EBITDA and investment income (loss) are defined as trading income (losses) and fair value adjustments on loans, less other investment related expenses. |
| (6) | Total cash and investments is defined as the sum of cash and cash equivalents, restricted cash, due from clearing brokers net of due to clearing brokers, securities and other investments owned, at fair value net of (i) securities sold not yet purchased and (ii) noncontrolling interest related to investments, advances against customer contracts, loans receivable, at fair value net of loan participations sold, and other investments reported in prepaid and other assets. |
| (7) | Segment operating income (loss) is defined as segment income (loss) excluding trading income (losses) and fair value adjustments on loans and other investment related expenses. |
| www.brileyfin.com | NASDAQ: RILY | 6 |
Note Regarding Use of Non-GAAP Financial Measures
Certain of the information set forth herein, including operating revenues, adjusted EBITDA, operating adjusted EBITDA, and investment adjusted EBITDA, may be considered non-GAAP financial measures. B. Riley Financial believes this information is useful to investors because it provides a basis for measuring the Company’s available capital resources, the operating performance of its business and its revenues and cash flow, (i) excluding in the case of operating revenues, trading income (losses) and fair value adjustments on loans, (ii) excluding in the case of adjusted EBITDA, net interest expense, provisions for or benefit from income taxes, depreciation, amortization, fair value adjustment, restructuring costs, gain on extinguishment of loans, impairment of trade names, stock-based compensation and transaction and other expenses, (iii) excluding in the case of operating adjusted EBITDA, the aforementioned adjustments for adjusted EBITDA as well as trading income (losses) and fair value adjustments on loans, and other investment related expenses, (iv) including in the case of investment adjusted EBITDA, trading income (losses) and fair value adjustments on loans, net of other investment related expenses, and (v) including in the case of total cash and investments, net of debt, total cash, net securities and investments, and other minus total debt, that would normally be included in the most directly comparable measures calculated and presented in accordance with Generally Accepted Accounting Principles (“GAAP”). In addition, the Company’s management uses these non-GAAP financial measures along with the most directly comparable GAAP financial measures in evaluating the Company’s operating performance, management compensation, capital resources, and cash flow. Non-GAAP financial measures should not be considered in isolation from, or as a substitute for, financial information presented in compliance with GAAP, and non-financial measures as reported by the Company may not be comparable to similarly titled amounts reported by other companies.
Forward-Looking Statements
Statements in this press release that are not descriptions of historical facts are forward-looking statements that are based on management’s current expectations and assumptions and are subject to risks and uncertainties. If such risks or uncertainties materialize or such assumptions prove incorrect, our business, operating results, financial condition, and stock price could be materially negatively affected. You should not place undue reliance on such forward-looking statements, which are based on the information currently available to us and speak only as of the date of this press release. Such forward-looking statements include, but are not limited to, statements regarding our excitement and the expected growth of our business segments. Factors that could cause such actual results to differ materially from those contemplated or implied by such forward-looking statements include, without limitation, the risks associated with the unpredictable and ongoing impact of the COVID-19 pandemic and other risks described from time to time in B. Riley Financial, Inc.’s periodic filings with the SEC, including, without limitation, the risks described in B. Riley Financial, Inc.’s Annual Report on Form 10-K for the year ended December 31, 2020 and in our Quarterly Reports on Form 10-Q for the quarters ended March 31, 2021, June 30, 2021, and September 30, 2021 under the captions “Risk Factors” and “Management’s Discussion and Analysis of Financial Condition and Results of Operations” (as applicable). Additional information will be set forth in our Annual Report on Form 10-K for the year ended December 31, 2021. These factors should be considered carefully, and readers are cautioned not to place undue reliance on such forward-looking statements. All information is current as of the date this press release is issued, and B. Riley Financial, Inc. undertakes no duty to update this information.
Contacts
| Investors | Media |
| Mike Frank | Jo Anne McCusker / Scott Cianciulli |
| [email protected] | [email protected] |
| (212) 409-2424 | (212) 739-6753 |
| www.brileyfin.com | NASDAQ: RILY | 7 |
B. RILEY FINANCIAL, INC.
Consolidated Balance Sheets
(Dollars in thousands, except par value)
| December 31, | December 31, | |||||||
| 2021 | 2020 | |||||||
| (Unaudited) | ||||||||
| Assets | ||||||||
| Assets: | ||||||||
| Cash and cash equivalents | $ | 278,933 | $ | 103,602 | ||||
| Restricted cash | 927 | 1,235 | ||||||
| Due from clearing brokers | 29,657 | 7,089 | ||||||
| Securities and other investments owned, at fair value | 1,532,095 | 777,319 | ||||||
| Securities borrowed | 2,090,966 | 765,457 | ||||||
| Accounts receivable, net | 49,673 | 40,806 | ||||||
| Due from related parties | 2,074 | 986 | ||||||
| Loans receivable, at fair value (includes $167,744 and $295,809 from related parties as of December 31, 2021 and 2020, respectively) | 873,186 | 390,689 | ||||||
| Prepaid expenses and other assets | 463,502 | 93,174 | ||||||
| Operating lease right-of-use assets | 56,969 | 48,799 | ||||||
| Property and equipment, net | 12,870 | 11,685 | ||||||
| Goodwill | 250,568 | 227,046 | ||||||
| Other intangible assets, net | 207,651 | 190,745 | ||||||
| Deferred tax assets, net | 2,848 | 4,098 | ||||||
| Total assets | $ | 5,851,919 | $ | 2,662,730 | ||||
| Liabilities and Equity | ||||||||
| Liabilities: | ||||||||
| Accounts payable | $ | 6,326 | $ | 2,722 | ||||
| Accrued expenses and other liabilities | 343,750 | 173,178 | ||||||
| Deferred revenue | 69,507 | 68,651 | ||||||
| Deferred tax liabilities, net | 93,055 | 34,248 | ||||||
| Due to related parties and partners | — | 327 | ||||||
| Due to clearing brokers | 69,398 | 13,672 | ||||||
| Securities sold not yet purchased | 28,623 | 10,105 | ||||||
| Securities loaned | 2,088,685 | 759,810 | ||||||
| Operating lease liabilities | 69,072 | 60,778 | ||||||
| Notes payable | 357 | 37,967 | ||||||
| Loan participations sold | — | 17,316 | ||||||
| Revolving credit facility | 80,000 | — | ||||||
| Term loans | 346,385 | 74,213 | ||||||
| Senior notes payable, net | 1,606,560 | 870,783 | ||||||
| Total liabilities | 4,801,718 | 2,123,770 | ||||||
| Commitments and contingencies | ||||||||
| Redeemable noncontrolling interests in equity of subsidiaries | 345,000 | — | ||||||
| B. Riley Financial, Inc. stockholders' equity: | ||||||||
| Preferred stock, $0.0001 par value; 1,000,000 shares authorized; 4,512 and 3,971 shares issued and outstanding as of December 31, 2021 and 2020, respectively; liquidation preference of $112,790 and $99,260 as of December 31, 2021 and 2020, respectively. | — | — | ||||||
| Common stock, $0.0001 par value; 100,000,000 shares authorized; 27,591,028 and 25,777,796 shares issued and outstanding as of December 31, 2021 and 2020, respectively. | 3 | 3 | ||||||
| Additional paid-in capital | 413,486 | 310,326 | ||||||
| Retained earnings | 248,862 | 203,080 | ||||||
| Accumulated other comprehensive loss | (1,080 | ) | (823 | ) | ||||
| Total B. Riley Financial, Inc. stockholders' equity | 661,271 | 512,586 | ||||||
| Noncontrolling interests | 43,930 | 26,374 | ||||||
| Total equity | 705,201 | 538,960 | ||||||
| Total liabilities and equity | $ | 5,851,919 | $ | 2,662,730 | ||||
| www.brileyfin.com | NASDAQ: RILY | 8 |
B. RILEY FINANCIAL, INC.
Consolidated Statements of Income
(Dollars in thousands, except share data)
| Three Months Ended | Twelve Months Ended | |||||||||||||||
| December 31, | December 31, | |||||||||||||||
| 2021 | 2020 | 2021 | 2020 | |||||||||||||
| (Unaudited) | (Unaudited) | (Unaudited) | ||||||||||||||
| Revenues: | ||||||||||||||||
| Services and fees | $ | 315,848 | $ | 237,270 | $ | 1,172,957 | $ | 667,069 | ||||||||
| Trading income and fair value adjustments on loans | 68,858 | 140,160 | 386,676 | 104,018 | ||||||||||||
| Interest income - Loans and securities lending | 33,443 | 30,116 | 122,723 | 102,499 | ||||||||||||
| Sale of goods | 3,961 | 2,660 | 58,205 | 29,135 | ||||||||||||
| Total revenues | 422,110 | 410,206 | 1,740,561 | 902,721 | ||||||||||||
| Operating expenses: | ||||||||||||||||
| Direct cost of services | 12,955 | 9,250 | 54,390 | 60,451 | ||||||||||||
| Cost of goods sold | 5,559 | 1,018 | 26,953 | 12,460 | ||||||||||||
| Selling, general and administrative expenses | 270,712 | 137,088 | 906,196 | 428,537 | ||||||||||||
| Restructuring charge | — | — | — | 1,557 | ||||||||||||
| Impairment of tradenames | — | — | — | 12,500 | ||||||||||||
| Interest expense - Securities lending and loan participations sold | 12,362 | 11,782 | 52,631 | 42,451 | ||||||||||||
| Total operating expenses | 301,588 | 159,138 | 1,040,170 | 557,956 | ||||||||||||
| Operating income | 120,522 | 251,068 | 700,391 | 344,765 | ||||||||||||
| Other income (expense): | ||||||||||||||||
| Interest income | 54 | 27 | 229 | 564 | ||||||||||||
| (Loss) gain on extinguishment of loans and other | (4,471 | ) | — | 3,796 | — | |||||||||||
| Income (loss) from equity investments | 1,629 | (478 | ) | 2,801 | (623 | ) | ||||||||||
| Interest expense | (26,441 | ) | (16,712 | ) | (92,455 | ) | (65,249 | ) | ||||||||
| Income before income taxes | 91,293 | 233,905 | 614,762 | 279,457 | ||||||||||||
| Provision for income taxes | (23,847 | ) | (62,060 | ) | (163,960 | ) | (75,440 | ) | ||||||||
| Net income | 67,446 | 171,845 | 450,802 | 204,017 | ||||||||||||
| Net income (loss) attributable to noncontrolling interests | 3,274 | 251 | 5,748 | (1,131 | ) | |||||||||||
| Net income attributable to B. Riley Financial, Inc. | 64,172 | 171,594 | 445,054 | 205,148 | ||||||||||||
| Preferred stock dividends | 1,990 | 1,480 | 7,457 | 4,710 | ||||||||||||
| Net income available to common shareholders | $ | 62,182 | $ | 170,114 | $ | 437,597 | $ | 200,438 | ||||||||
| Basic income per common share | $ | 2.26 | $ | 6.72 | $ | 15.99 | $ | 7.83 | ||||||||
| Diluted income per common share | $ | 2.08 | $ | 6.55 | $ | 15.09 | $ | 7.56 | ||||||||
| Weighted average basic common shares outstanding | 27,569,188 | 25,331,918 | 27,366,292 | 25,607,278 | ||||||||||||
| Weighted average diluted common shares outstanding | 29,840,704 | 25,966,501 | 29,005,602 | 26,508,397 | ||||||||||||
| www.brileyfin.com | NASDAQ: RILY | 9 |
B. RILEY FINANCIAL, INC.
Segment Financial Information
(Unaudited)
(Dollars in thousands)
| Three Months Ended | Twelve Months Ended | |||||||||||||||
| December 31, | December 31, | |||||||||||||||
| 2021 | 2020 | 2021 | 2020 | |||||||||||||
| Capital Markets segment: | ||||||||||||||||
| Revenues - Services and fees | $ | 143,492 | $ | 150,098 | $ | 575,317 | $ | 339,877 | ||||||||
| Trading income and fair value adjustments on loans | 67,718 | 139,750 | 379,053 | 103,214 | ||||||||||||
| Interest income - Loans and securities lending | 33,443 | 30,116 | 122,723 | 102,499 | ||||||||||||
| Total revenues | 244,653 | 319,964 | 1,077,093 | 545,590 | ||||||||||||
| Selling, general and administrative expenses | (113,690 | ) | (73,118 | ) | (345,455 | ) | (198,962 | ) | ||||||||
| Restructuring charge | — | — | — | (917 | ) | |||||||||||
| Interest expense - Securities lending and loan participations sold | (12,362 | ) | (11,782 | ) | (52,631 | ) | (42,451 | ) | ||||||||
| Depreciation and amortization | (610 | ) | (522 | ) | (2,136 | ) | (2,386 | ) | ||||||||
| Segment income | 117,991 | 234,542 | 676,871 | 300,874 | ||||||||||||
| Wealth Management segment: | ||||||||||||||||
| Revenues - Services and fees | 103,803 | 20,851 | 374,361 | 72,345 | ||||||||||||
| Trading income and fair value adjustments on loans | 1,140 | 410 | 7,623 | 804 | ||||||||||||
| Total revenues | 104,943 | 21,261 | 381,984 | 73,149 | ||||||||||||
| Selling, general and administrative expenses | (96,799 | ) | (19,142 | ) | (357,130 | ) | (68,368 | ) | ||||||||
| Depreciation and amortization | (2,088 | ) | (459 | ) | (8,920 | ) | (1,880 | ) | ||||||||
| Segment income | 6,056 | 1,660 | 15,934 | 2,901 | ||||||||||||
| Auction and Liquidation segment: | ||||||||||||||||
| Revenues - Services and fees | 4,532 | 13,761 | 20,169 | 63,101 | ||||||||||||
| Revenues - Sale of goods | 1,186 | 1,906 | 53,348 | 25,663 | ||||||||||||
| Total revenues | 5,718 | 15,667 | 73,517 | 88,764 | ||||||||||||
| Direct cost of services | (2,977 | ) | (4,324 | ) | (30,719 | ) | (40,730 | ) | ||||||||
| Cost of goods sold | (1,097 | ) | (406 | ) | (20,675 | ) | (9,766 | ) | ||||||||
| Selling, general and administrative expenses | (4,350 | ) | (3,477 | ) | (14,069 | ) | (12,357 | ) | ||||||||
| Restructuring charge | — | — | — | (140 | ) | |||||||||||
| Depreciation and amortization | — | — | — | (2 | ) | |||||||||||
| Segment (loss) income | (2,706 | ) | 7,460 | 8,054 | 25,769 | |||||||||||
| Financial Consulting segment: | ||||||||||||||||
| Revenues - Services and fees | 27,877 | 26,480 | 94,312 | 91,622 | ||||||||||||
| Selling, general and administrative expenses | (21,166 | ) | (19,476 | ) | (77,062 | ) | (68,232 | ) | ||||||||
| Restructuring charge | — | — | — | (500 | ) | |||||||||||
| Depreciation and amortization | (83 | ) | (131 | ) | (356 | ) | (347 | ) | ||||||||
| Segment income | 6,628 | 6,873 | 16,894 | 22,543 | ||||||||||||
| Principal Investments - Communications segment: | ||||||||||||||||
| Revenues - Services and fees | 31,096 | 20,629 | 88,490 | 83,666 | ||||||||||||
| Revenues - Sale of goods | 2,776 | 754 | 4,857 | 3,472 | ||||||||||||
| Total revenues | 33,872 | 21,383 | 93,347 | 87,138 | ||||||||||||
| Direct cost of services | (9,978 | ) | (4,926 | ) | (23,671 | ) | (19,721 | ) | ||||||||
| Cost of goods sold | (4,462 | ) | (612 | ) | (6,278 | ) | (2,694 | ) | ||||||||
| Selling, general and administrative expenses | (10,397 | ) | (6,000 | ) | (25,493 | ) | (20,352 | ) | ||||||||
| Depreciation and amortization | (3,189 | ) | (2,545 | ) | (10,747 | ) | (11,011 | ) | ||||||||
| Segment income | 5,846 | 7,300 | 27,158 | 33,360 | ||||||||||||
| Brands segment: | ||||||||||||||||
| Revenues - Services and fees | 5,047 | 5,451 | 20,308 | 16,458 | ||||||||||||
| Selling, general and administrative expenses | (840 | ) | (682 | ) | (3,178 | ) | (2,889 | ) | ||||||||
| Depreciation and amortization | (602 | ) | (715 | ) | (2,745 | ) | (2,858 | ) | ||||||||
| Impairment of tradenames | — | — | — | (12,500 | ) | |||||||||||
| Segment income (loss) | 3,605 | 4,054 | 14,385 | (1,789 | ) | |||||||||||
| Consolidated operating income from reportable segments | 137,420 | 261,889 | 759,296 | 383,658 | ||||||||||||
| Corporate and other expenses | (16,898 | ) | (10,821 | ) | (58,905 | ) | (38,893 | ) | ||||||||
| Interest income | 54 | 27 | 229 | 564 | ||||||||||||
| (Loss) gain on extinguishment of loans and other | (4,471 | ) | — | 3,796 | — | |||||||||||
| Income (loss) on equity investments | 1,629 | (478 | ) | 2,801 | (623 | ) | ||||||||||
| Interest expense | (26,441 | ) | (16,712 | ) | (92,455 | ) | (65,249 | ) | ||||||||
| Income before income taxes | 91,293 | 233,905 | 614,762 | 279,457 | ||||||||||||
| Provision for income taxes | (23,847 | ) | (62,060 | ) | (163,960 | ) | (75,440 | ) | ||||||||
| Net income | 67,446 | 171,845 | 450,802 | 204,017 | ||||||||||||
| Net income (loss) income attributable to noncontrolling interests | 3,274 | 251 | 5,748 | (1,131 | ) | |||||||||||
| Net income attributable to B. Riley Financial, Inc. | 64,172 | 171,594 | 445,054 | 205,148 | ||||||||||||
| Preferred stock dividends | 1,990 | 1,480 | 7,457 | 4,710 | ||||||||||||
| Net income available to common shareholders | $ | 62,182 | $ | 170,114 | $ | 437,597 | $ | 200,438 | ||||||||
| www.brileyfin.com | NASDAQ: RILY | 10 |
B. RILEY FINANCIAL, INC.
Adjusted EBITDA and Operating Adjusted EBITDA Reconciliation
(Unaudited)
(Dollars in thousands)
| Three Months Ended | Twelve Months Ended | |||||||||||||||
| December 31, | December 31, | |||||||||||||||
| 2021 | 2020 | 2021 | 2020 | |||||||||||||
| Net income attributable to B. Riley Financial, Inc. | $ | 64,172 | $ | 171,594 | $ | 445,054 | $ | 205,148 | ||||||||
| Adjustments: | ||||||||||||||||
| Provision for income taxes | 23,847 | 62,060 | 163,960 | 75,440 | ||||||||||||
| Interest expense | 26,441 | 16,712 | 92,455 | 65,249 | ||||||||||||
| Interest income | (54 | ) | (27 | ) | (229 | ) | (564 | ) | ||||||||
| Share based payments | 12,503 | 4,321 | 36,011 | 18,588 | ||||||||||||
| Depreciation and amortization | 6,805 | 4,604 | 25,871 | 19,369 | ||||||||||||
| Restructuring costs | — | — | — | 1,557 | ||||||||||||
| Gain on extinguishment of loans | — | — | (6,509 | ) | — | |||||||||||
| Impairment of tradenames | — | — | — | 12,500 | ||||||||||||
| Transactions related costs and other | 4,311 | 1,222 | 5,881 | 9,531 | ||||||||||||
| Total EBITDA adjustments | 73,853 | 88,892 | 317,440 | 201,670 | ||||||||||||
| Adjusted EBITDA | $ | 138,025 | $ | 260,486 | $ | 762,494 | $ | 406,818 | ||||||||
| Operating EBITDA Adjustments: | ||||||||||||||||
| Trading income and fair value adjustments on loans | (68,858 | ) | (140,160 | ) | (386,676 | ) | (104,018 | ) | ||||||||
| Other investment related expenses | 36,930 | 6,461 | 46,211 | 8,873 | ||||||||||||
| Total Operating EBITDA Adjustments | (31,928 | ) | (133,699 | ) | (340,465 | ) | (95,145 | ) | ||||||||
| Operating Adjusted EBITDA | $ | 106,097 | $ | 126,787 | $ | 422,029 | $ | 311,673 | ||||||||
| www.brileyfin.com | NASDAQ: RILY | 11 |
B. RILEY FINANCIAL, INC.
Adjusted Net Income Reconciliation
(Unaudited)
(Dollars in thousands, except share data)
| Three Months Ended | Twelve Months Ended | |||||||||||||||
| December 31, | December 31, | |||||||||||||||
| 2021 | 2020 | 2021 | 2020 | |||||||||||||
| Net income attributable to B. Riley Financial, Inc. | $ | 64,172 | $ | 171,594 | $ | 445,054 | $ | 205,148 | ||||||||
| Adjustments: | ||||||||||||||||
| Share based payments | 12,503 | 4,321 | 36,011 | 18,588 | ||||||||||||
| Amortization of intangible assets | 5,830 | 3,769 | 22,006 | 15,736 | ||||||||||||
| Restructuring costs | — | — | — | 1,557 | ||||||||||||
| Gain on extinguishment of loans | — | — | (6,509 | ) | — | |||||||||||
| Impairment of tradenames | — | — | — | 12,500 | ||||||||||||
| Transactions related costs and other | 4,311 | 1,222 | 5,881 | 9,531 | ||||||||||||
| Income tax effect of adjusting entries | (6,135 | ) | (2,473 | ) | (15,722 | ) | (15,929 | ) | ||||||||
| Adjusted net income attributable to B. Riley Financial, Inc. | $ | 80,681 | $ | 178,433 | $ | 486,721 | $ | 247,131 | ||||||||
| Adjusted income per common share: | ||||||||||||||||
| Adjusted basic income per share | $ | 2.93 | $ | 7.04 | $ | 17.79 | $ | 9.65 | ||||||||
| Adjusted diluted income per share | $ | 2.70 | $ | 6.87 | $ | 16.78 | $ | 9.32 | ||||||||
| Shares used to calculate adjusted basic net income per share | 27,569,188 | 25,331,918 | 27,366,292 | 25,607,278 | ||||||||||||
| Shares used to calculate adjusted diluted net income per share | 29,840,704 | 25,966,501 | 29,005,602 | 26,508,397 | ||||||||||||
# # #
Source: B. Riley Financial, Inc.
| www.brileyfin.com | NASDAQ: RILY | 12 |