| October 28, 2020 | FOR IMMEDIATE RELEASE | |||||||
| Media Contact: Steve Hollister, 727.567.2824 | ||||||||
| Investor Contact: Kristina Waugh, 727.567.7654 | ||||||||
| raymondjames.com/news-and-media/press-releases | ||||||||
RAYMOND JAMES FINANCIAL REPORTS FOURTH QUARTER
AND FISCAL YEAR 2020 RESULTS
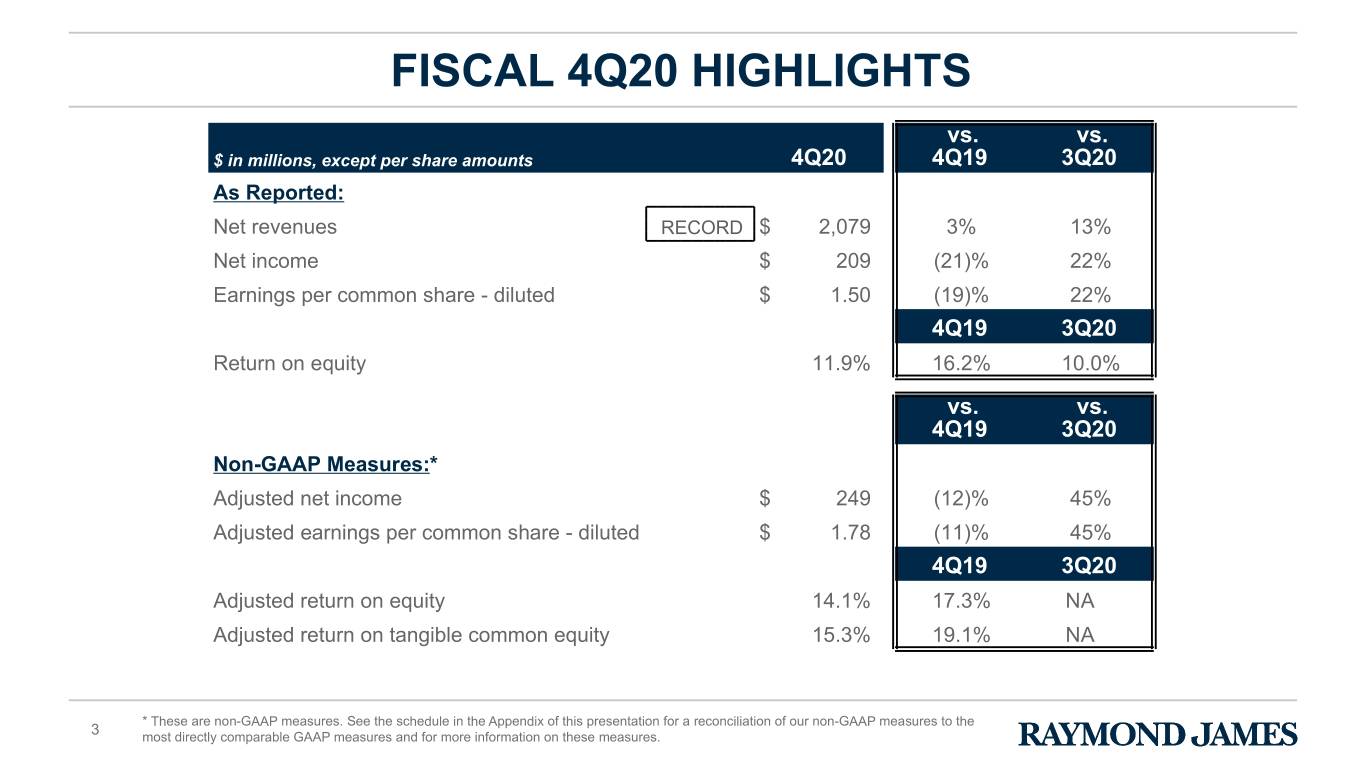
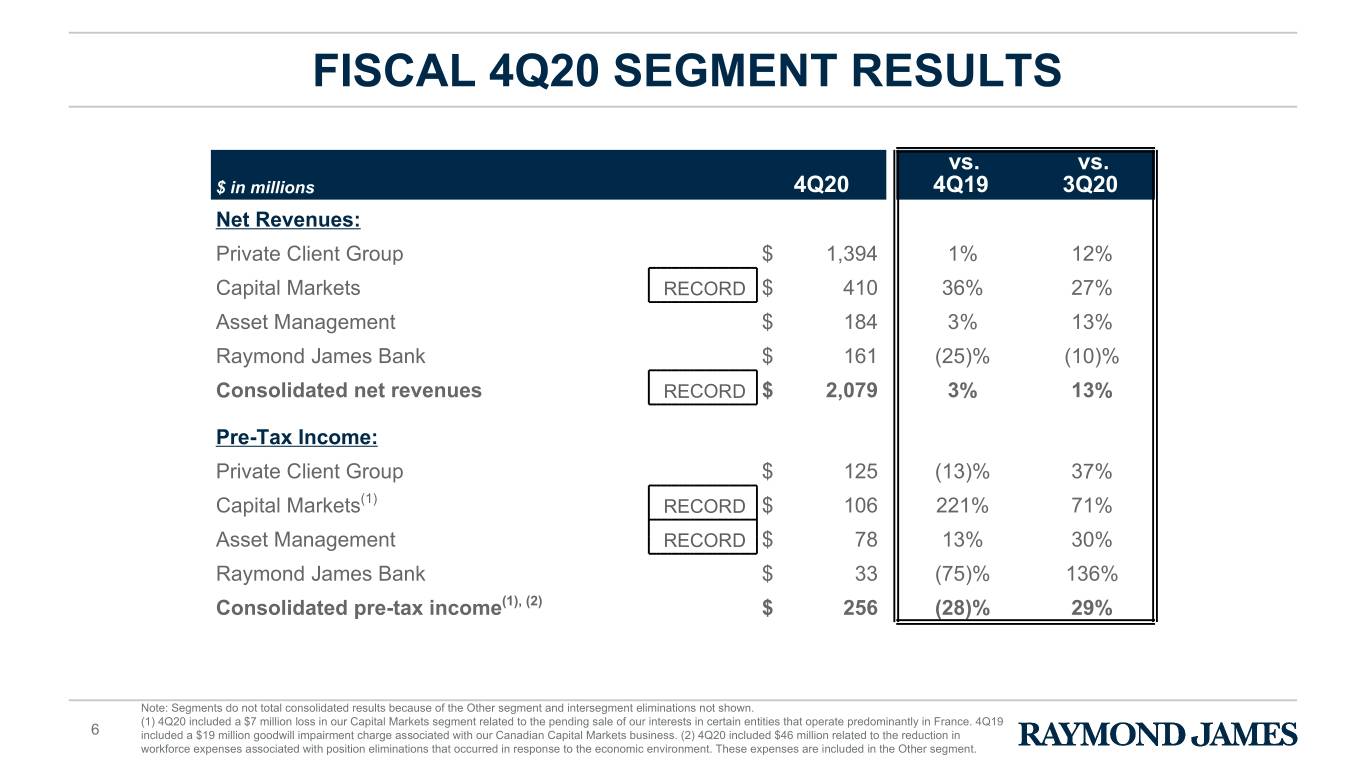
•Record quarterly net revenues of $2.08 billion, up 3% over prior year’s fiscal fourth quarter and 13% over the preceding quarter
•Quarterly net income of $209 million, or $1.50 per diluted share, and adjusted quarterly net income of $249 million(1), or $1.78 per diluted share(1)
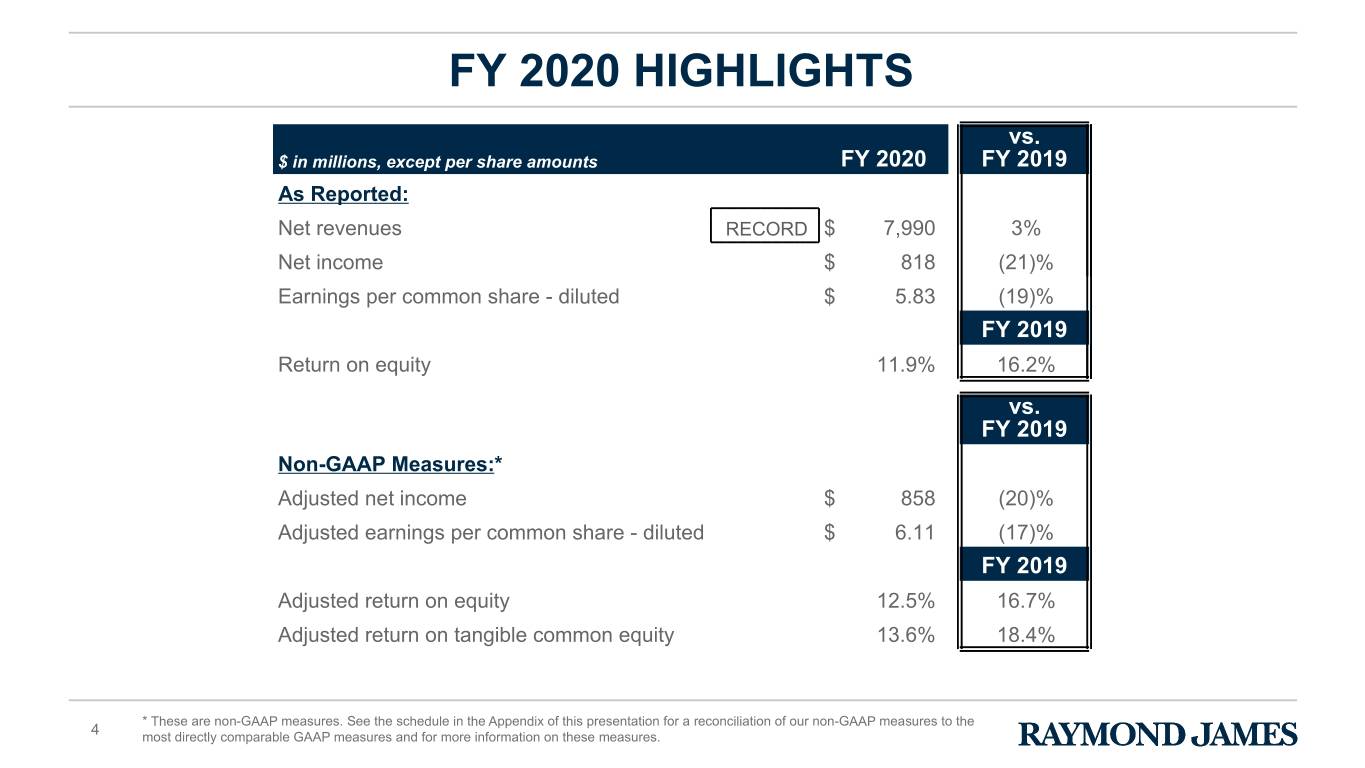
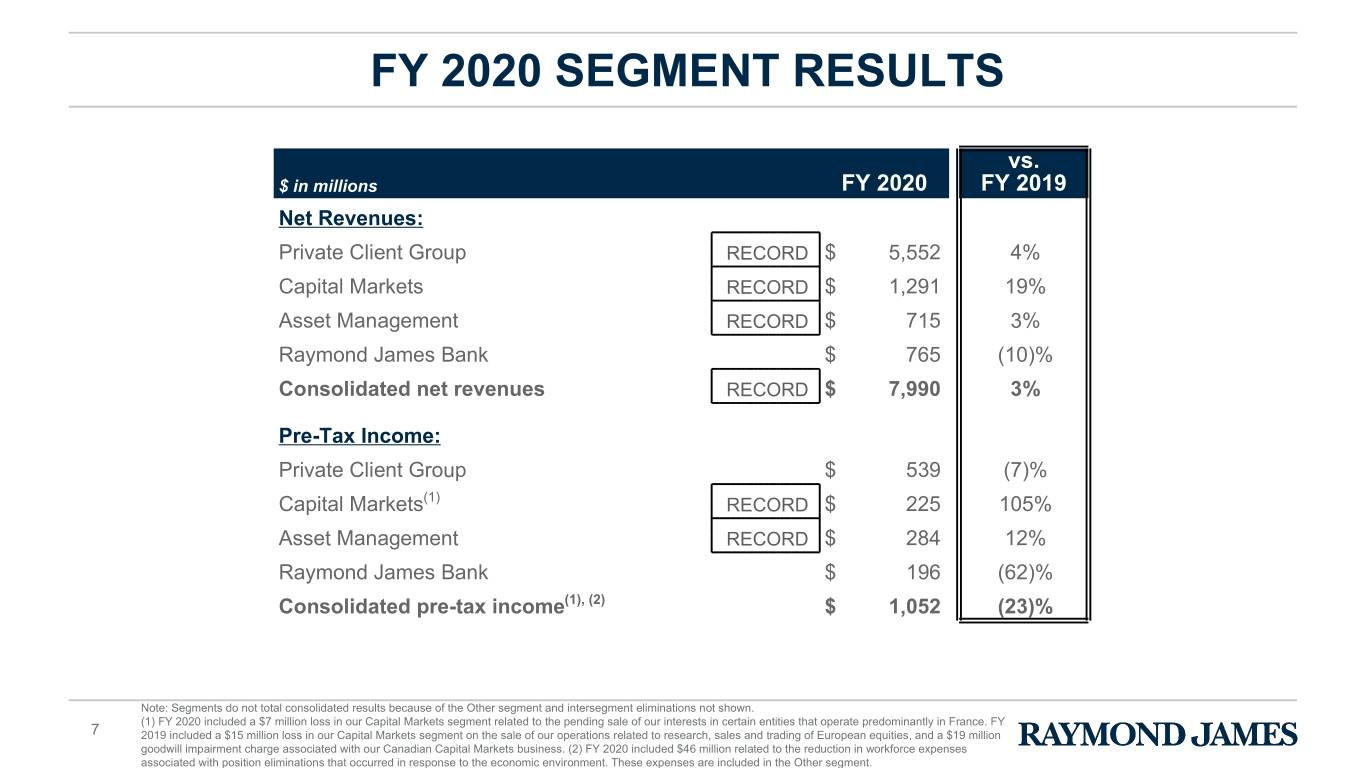
•Record annual net revenues of $7.99 billion, annual net income of $818 million, and adjusted annual net income of $858 million(1)
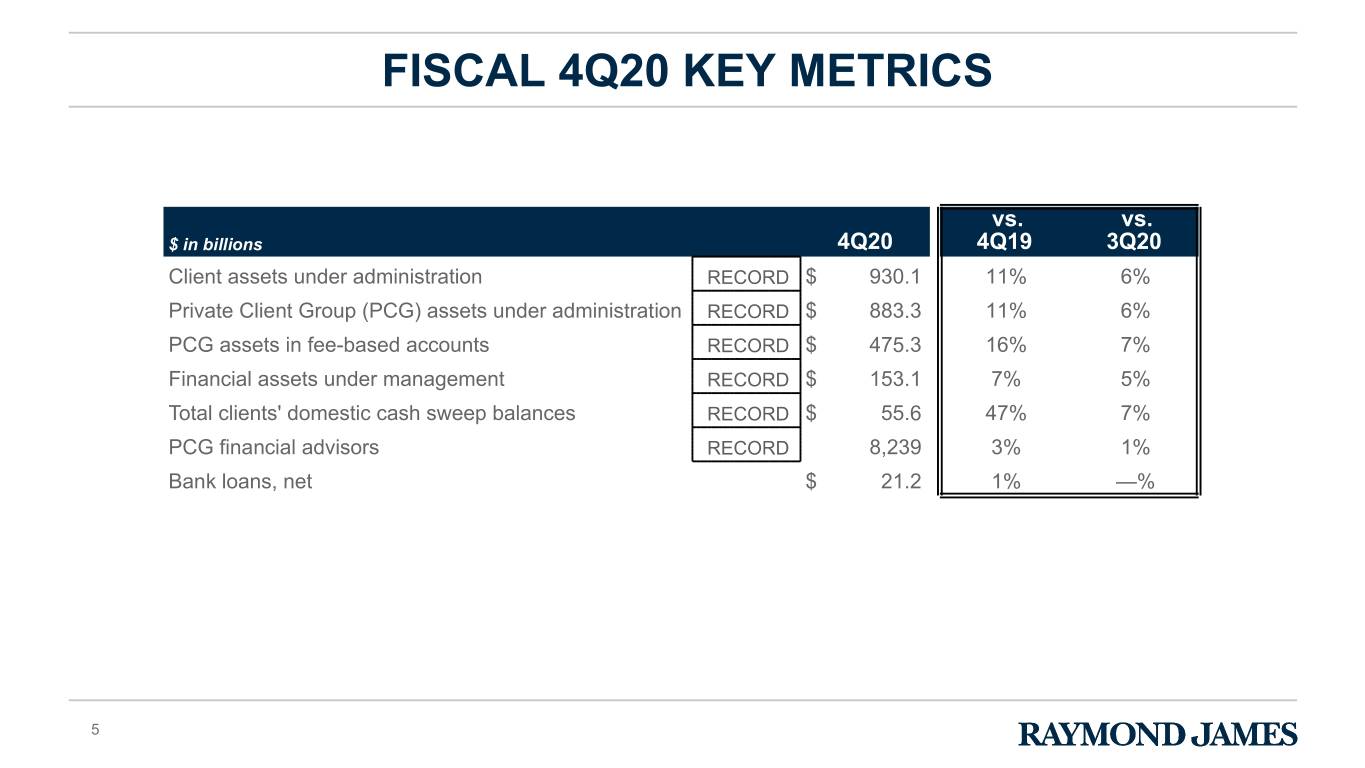
•Quarter-end records for client assets under administration of $930.1 billion and financial assets under management of $153.1 billion
•Record 8,239 Private Client Group financial advisors, net increases of 228 over September 2019 and 84 over June 2020
•Annualized return on equity for the quarter of 11.9% and annualized adjusted return on tangible common equity of 15.3%(1)
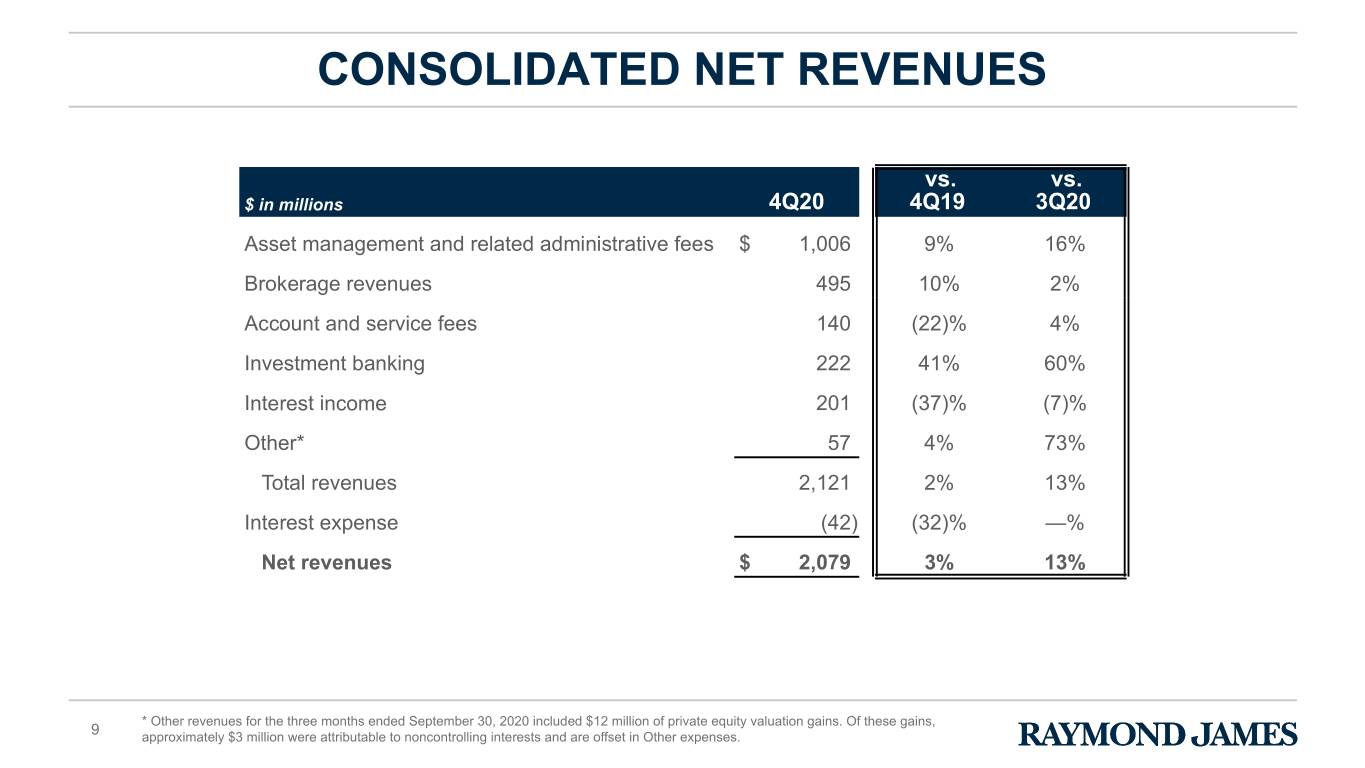
ST. PETERSBURG, Fla – Raymond James Financial, Inc. (NYSE: RJF) today reported net revenues of $2.08 billion and net income of $209 million, or $1.50 per diluted share, for the fiscal fourth quarter ended September 30, 2020. Quarterly net revenues grew 3% over the year-ago period and 13% over the preceding quarter, primarily driven by higher asset management and related administrative fees, investment banking revenues, and brokerage revenues, which were partially offset by the negative impact of lower short-term interest rates.
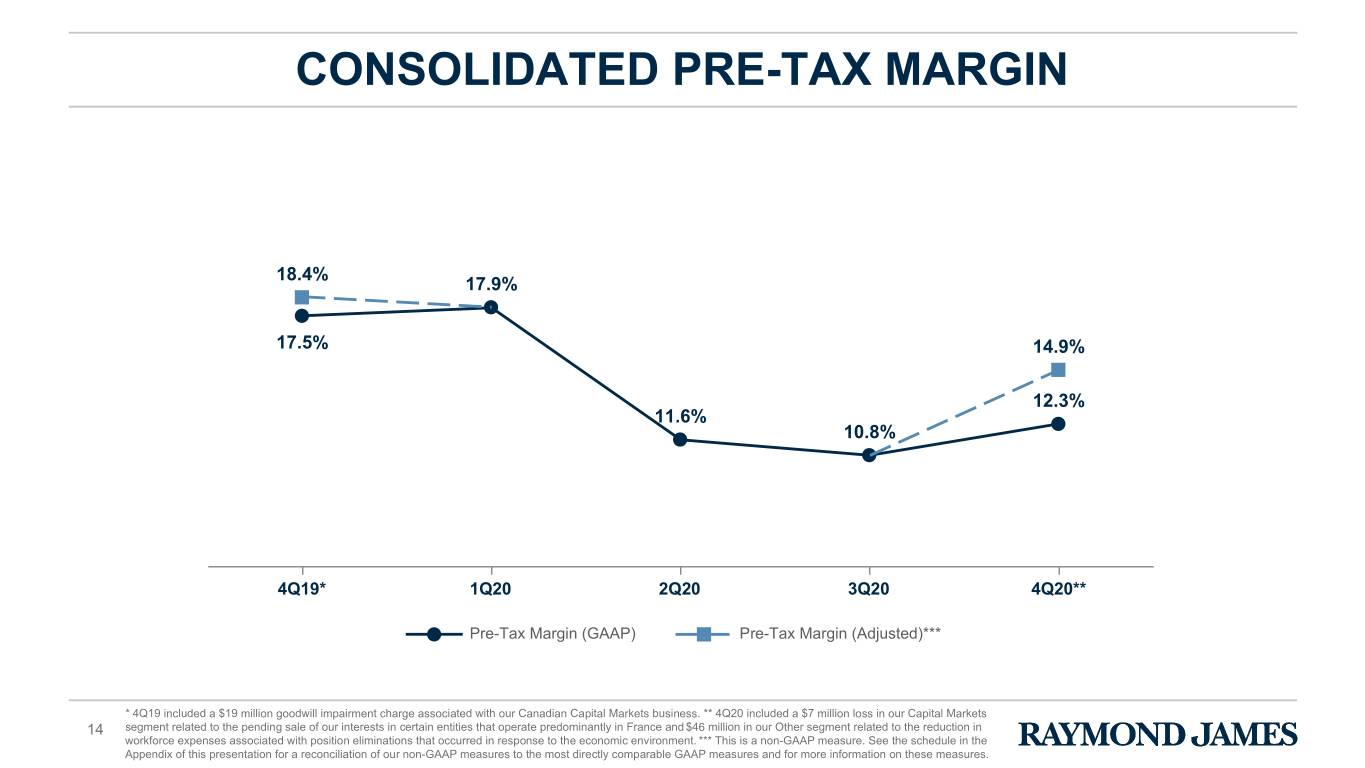
Higher quarterly net revenues drove a 22% sequential increase in quarterly net income during the quarter. However, quarterly net income declined 21% compared to the prior year’s fiscal fourth quarter largely due to reduction in workforce expenses(2), a higher bank loan loss provision and the negative impact of lower short-term interest rates. Excluding $46 million associated with reduction in workforce expenses(2) and a $7 million loss associated with the pending disposition of certain operations in France(3), adjusted quarterly net income was $249 million(1), or $1.78 per diluted share(1). The effective tax rate of 18.4% in the quarter was lower than the year-ago period primarily due to non-taxable gains in the corporate-owned life insurance portfolio.
Compared to fiscal year 2019, fiscal year 2020 net revenues of $7.99 billion increased 3%, net income of $818 million decreased 21%, and adjusted net income of $858 million(1) decreased 20%. Return on equity for the fiscal year was 11.9% and adjusted return on tangible common equity was 13.6%(1).
“While this fiscal year brought challenges we couldn’t have predicted, I’m incredibly proud of our associates’ and advisors’ unwavering commitment to continue providing excellent service to clients. Our client-first values facilitated record annual revenues for the firm in fiscal year 2020, which included record revenues in the Private Client Group, Capital Markets and Asset Management segments, reinforcing the value of having diverse and complementary businesses,” said Chairman and CEO Paul Reilly. “We are well positioned entering fiscal 2021, with strong capital ratios and quarter-end records for client assets and the number of Private Client Group financial advisors. Moreover, financial advisor recruiting activity remains robust across all of our affiliation options and our investment banking pipelines are strong. However, given the high degree of economic uncertainty associated with the ongoing COVID-19 pandemic and the continued headwinds from near-zero short-term interest rates, we remain focused on improving operational efficiency while continuing to invest in service delivery and enhanced capabilities for our advisors and their clients.”
Please refer to the footnotes at the end of this press release for additional information.
1
Segment Results
Private Client Group
•Quarterly net revenues of $1.39 billion, up 1% over the prior year’s fiscal fourth quarter and 12% over the preceding quarter
•Quarterly pre-tax income of $125 million, down 13% compared to the prior year’s fiscal fourth quarter and up 37% over the preceding quarter
•Record annual net revenues of $5.55 billion and annual pre-tax income of $539 million, up 4% and down 7%, respectively, compared to fiscal 2019
•Record quarter-end Private Client Group assets under administration of $883.3 billion, up 11% over September 2019 and 6% over June 2020
•Record quarter-end Private Client Group assets in fee-based accounts of $475.3 billion, up 16% over September 2019 and 7% over June 2020
•Record 8,239 Private Client Group financial advisors, net increases of 228 over September 2019 and 84 over June 2020
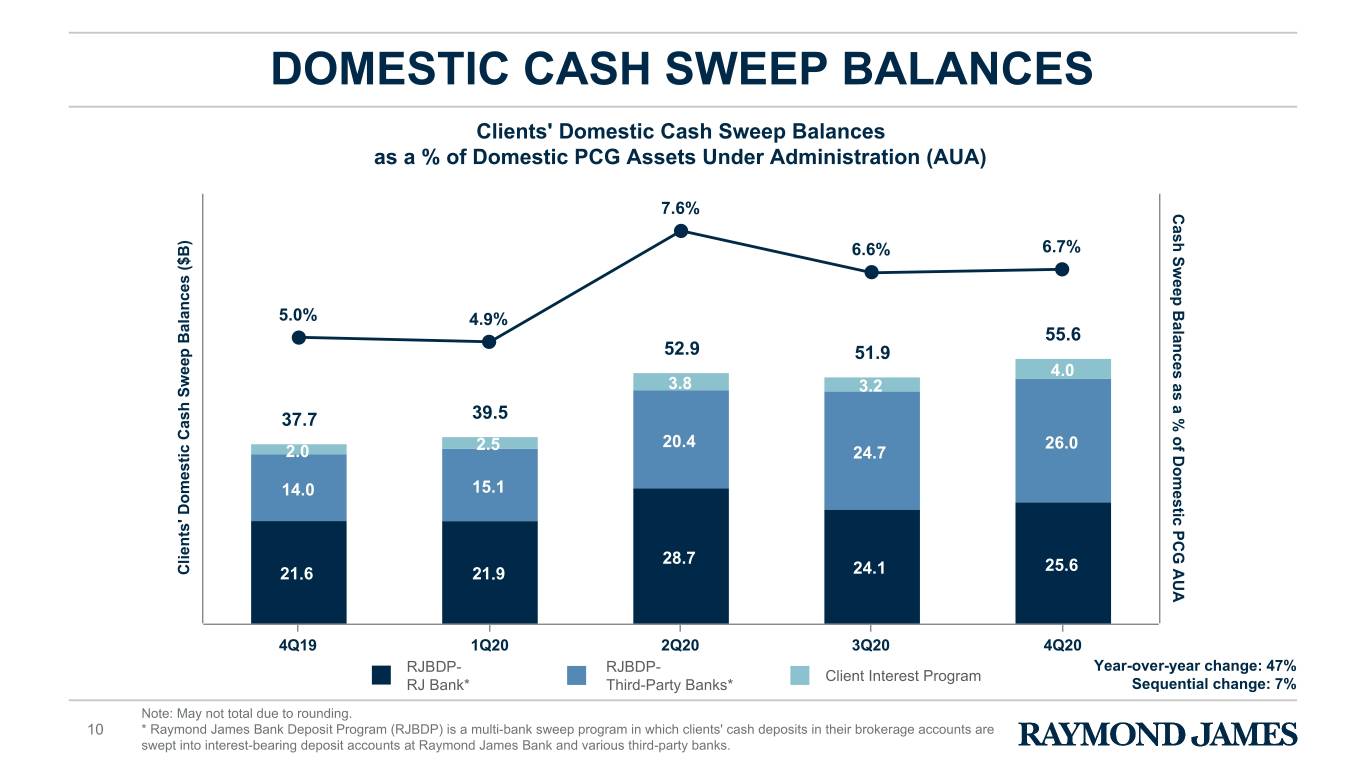
•Record clients’ domestic cash sweep balances of $55.6 billion, up 47% over September 2019 and 7% over June 2020
Quarterly net revenues grew 1% over the prior-year period and 12% over the preceding quarter, predominantly driven by higher asset management and related administrative fees, reflecting higher assets in fee-based accounts. While higher revenues helped pre-tax income increase 37% over the preceding quarter, pre-tax income decreased 13% compared to the prior-year quarter largely due to the negative impact of lower short-term interest rates.
“Our client-focused culture and robust technology capabilities continue to drive our consistent success in retaining and recruiting financial advisors across all affiliation options. While there were disruptions during the onset of the COVID-19 crisis in recruiting and onboarding advisors, we finished the fiscal year with a record 8,239 financial advisors, representing a solid net increase of 228 during the year,” said Reilly. “As we enter fiscal 2021, financial advisor recruiting activity remains strong across our employee, independent contractor and independent RIA affiliation options.”
Capital Markets
•Record quarterly net revenues of $410 million, up 36% over the prior year’s fiscal fourth quarter and 27% over the preceding quarter
•Record quarterly pre-tax income of $106 million, up 221% over the prior year’s fiscal fourth quarter and 71% over the preceding quarter
•Record annual net revenues of $1.29 billion and record annual pre-tax income of $225 million, up 19% and 105%, respectively, over fiscal 2019
•Record quarterly investment banking revenues of $209 million, up 39% over the prior year’s fiscal fourth quarter and 58% over the preceding quarter
•Record annual brokerage revenues of $571 million and record annual investment banking revenues of $608 million, up 38% and 8%, respectively, over fiscal 2019
Fixed income brokerage revenues continued to benefit from a high level of client activity, particularly with depository clients. Record investment banking revenues were driven by broad-based strength in equity underwriting, M&A and debt underwriting.
“Reflecting our robust platforms in Fixed Income and Global Equities and Investment Banking, the Capital Markets segment generated record results in fiscal 2020, which was attributable to record brokerage revenues and record investment banking revenues,” said Reilly. “Investment banking activity levels remain strong, although closings may be affected if economic conditions deteriorate.”
Please refer to the footnotes at the end of this press release for additional information.
2
Asset Management
•Quarterly net revenues of $184 million, up 3% over the prior year’s fiscal fourth quarter and 13% over the preceding quarter
•Record quarterly pre-tax income of $78 million, up 13% over the prior year’s fiscal fourth quarter and 30% over the preceding quarter
•Record annual net revenues of $715 million and record annual pre-tax income of $284 million, up 3% and 12%, respectively, over fiscal 2019
•Record quarter-end financial assets under management of $153.1 billion, up 7% over September 2019 and 5% over June 2020
Record quarterly pre-tax income was primarily attributable to growth of financial assets under management, as equity market appreciation and net inflows into fee-based accounts in the Private Client Group more than offset net outflows for Carillon Tower Advisers.
Raymond James Bank
•Quarterly net revenues of $161 million, down 25% compared to the prior year’s fiscal fourth quarter and 10% compared to the preceding quarter
•Quarterly pre-tax income of $33 million, down 75% compared to the prior year’s fiscal fourth quarter and up 136% over the preceding quarter
•Annual net revenues of $765 million and annual pre-tax income of $196 million, down 10% and 62%, respectively, compared to fiscal 2019
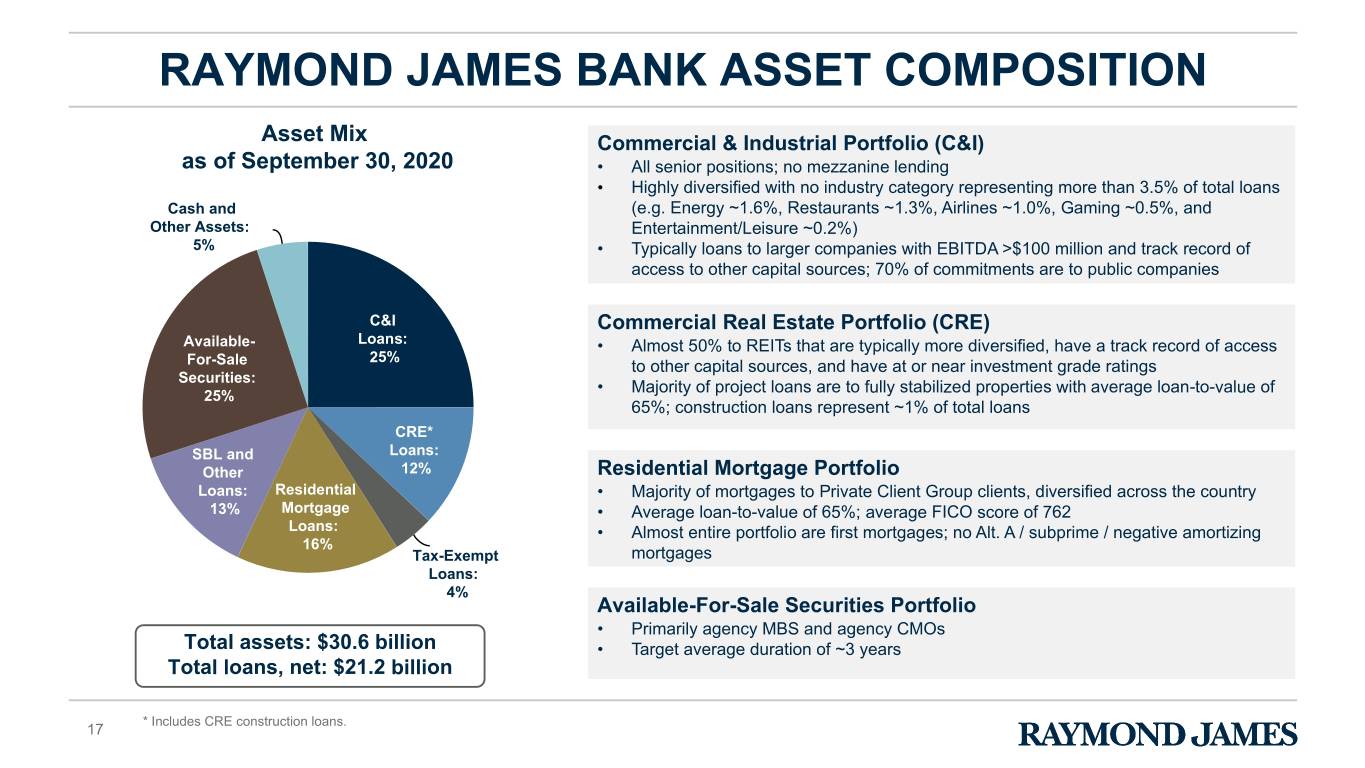
•Net loans of $21.2 billion, up 1% over September 2019 and essentially unchanged from June 2020
•Available-for-sale securities portfolio ended the quarter at $7.7 billion, up $4.6 billion over September 2019 and $2 billion over June 2020
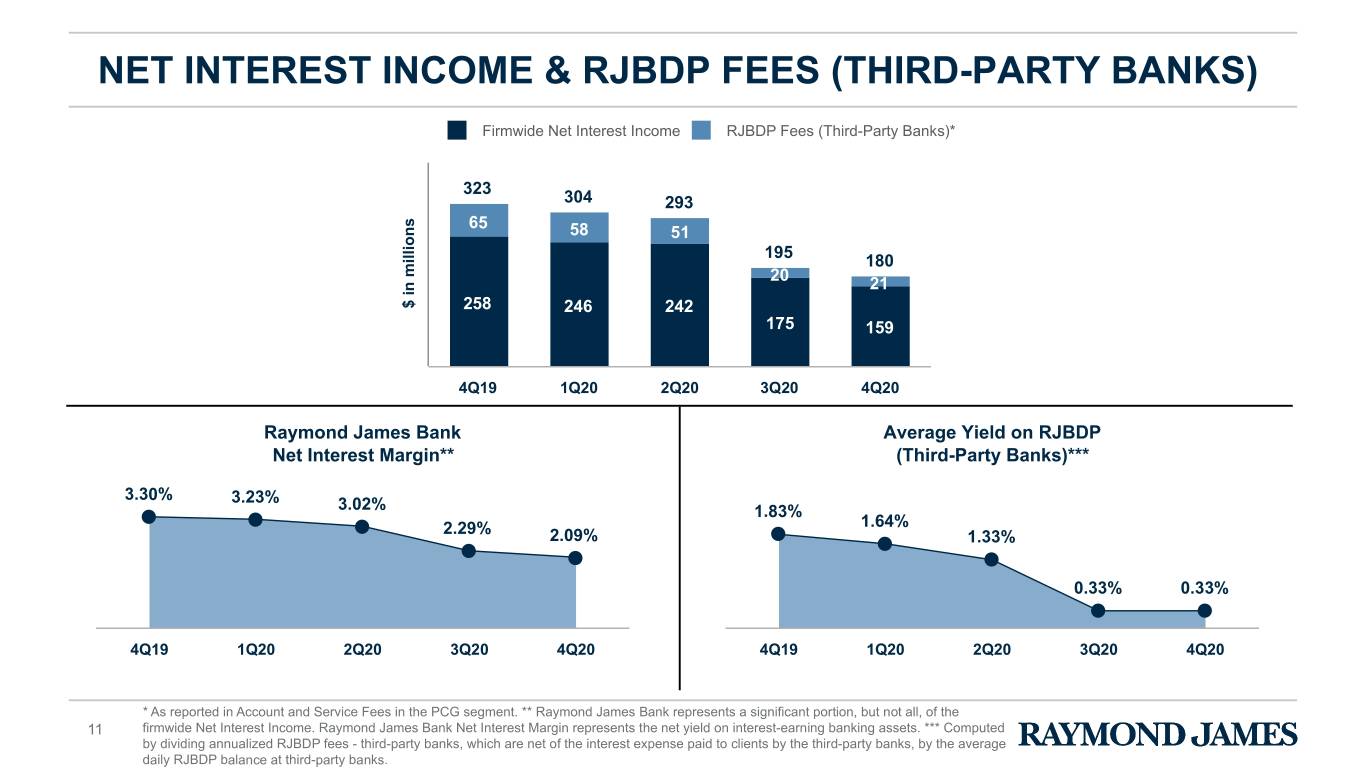
•Net interest margin (NIM) of 2.09% for the quarter, down 121 basis points compared to the prior year’s fiscal fourth quarter and 20 basis points compared to the preceding quarter
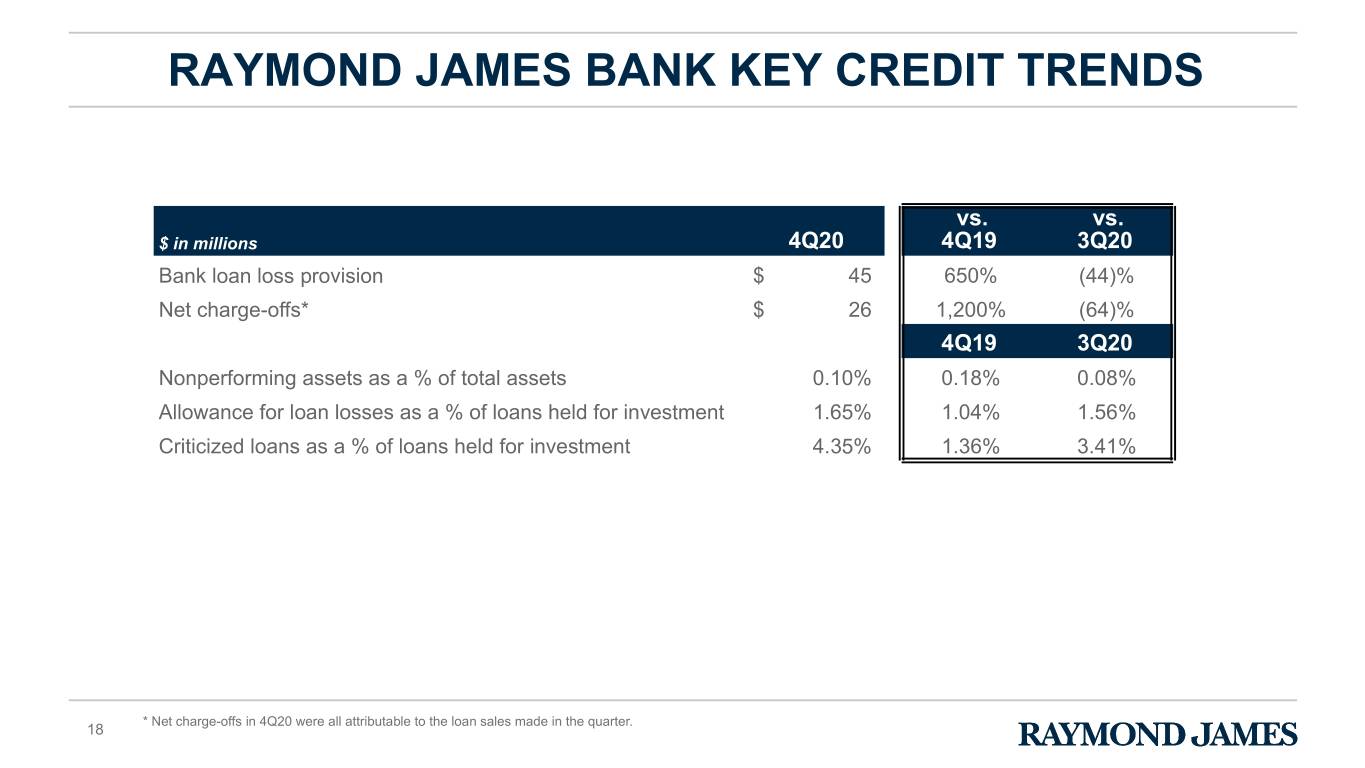
Quarterly net revenues declined 25% compared to the prior year’s fiscal fourth quarter and 10% compared to the preceding quarter, primarily due to lower net interest income. The Bank’s NIM declined 20 basis points during the quarter to 2.09%, due to the decline in LIBOR and growth of agency-backed securities. Nonperforming assets remained low and net charge-offs of $26 million were all related to the proactive sales in the quarter of $340 million of corporate loans in sectors most directly impacted by the COVID-19 pandemic. The quarterly loan loss provision of $45 million resulted in the allowance for loan losses as a percent of total loans increasing to 1.65%.
Other
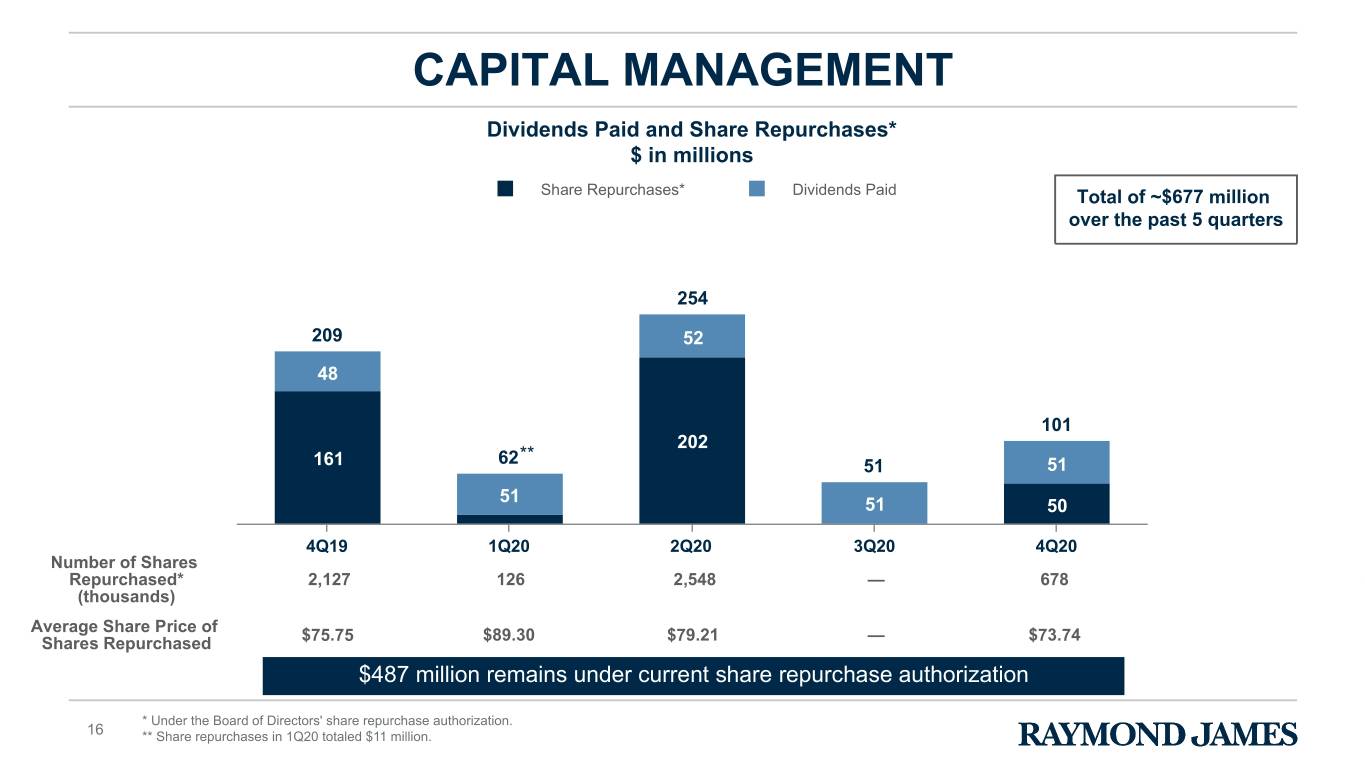
In the fiscal fourth quarter, the firm repurchased approximately 678,000 shares for $50 million, an average price of approximately $73.75 per share. Including these purchases, in fiscal 2020 the firm repurchased approximately 3.35 million shares for $263 million, an average price of approximately $78.50 per share. Under the Board’s previously announced share repurchase authorization, $487 million remained available as of October 27, 2020. At the end of the quarter, the total capital ratio was 25.4% and the tier 1 leverage ratio was 14.2%, both well above the regulatory requirements.
A conference call to discuss the results will take place tomorrow morning, Thursday, October 29, at 8:15 a.m. ET. The live audio webcast, and the presentation which management will review on the call, will be available at www.raymondjames.com/investor-relations/financial-information/quarterly-earnings. For a listen-only connection to the conference call, please dial: 800-747-0367 (conference code: 21971188). An audio replay of the call will be available at the same location until December 30, 2020.
Please refer to the footnotes at the end of this press release for additional information.
3
About Raymond James Financial, Inc.
Raymond James Financial, Inc. (NYSE: RJF) is a leading diversified financial services company providing private client group, capital markets, asset management, banking and other services to individuals, corporations and municipalities. The company has approximately 8,200 financial advisors. Total client assets are $930 billion. Public since 1983, the firm is listed on the New York Stock Exchange under the symbol RJF. Additional information is available at www.raymondjames.com.
Forward-Looking Statements
Certain statements made in this press release may constitute “forward-looking statements” under the Private Securities Litigation Reform Act of 1995. Forward-looking statements include information concerning future strategic objectives, business prospects, anticipated savings, financial results (including expenses, earnings, liquidity, cash flow and capital expenditures), industry or market conditions, demand for and pricing of our products, acquisitions and divestitures, anticipated results of litigation, regulatory developments, and general economic conditions. In addition, words such as “believes,” “expects,” “anticipates,” “intends,” “plans,” “estimates,” “projects,” “forecasts,” and future or conditional verbs such as “will,” “may,” “could,” “should,” and “would,” as well as any other statement that necessarily depends on future events, are intended to identify forward-looking statements. Forward-looking statements are not guarantees, and they involve risks, uncertainties and assumptions. Although we make such statements based on assumptions that we believe to be reasonable, there can be no assurance that actual results will not differ materially from those expressed in the forward-looking statements. We caution investors not to rely unduly on any forward-looking statements and urge you to carefully consider the risks described in our filings with the Securities and Exchange Commission (the “SEC”) from time to time, including our most recent Annual Report on Form 10-K and subsequent Quarterly Reports on Form 10-Q, which are available at www.raymondjames.com and the SEC’s website at www.sec.gov. We expressly disclaim any obligation to update any forward-looking statement in the event it later turns out to be inaccurate, whether as a result of new information, future events, or otherwise.
Please refer to the footnotes at the end of this press release for additional information.
4
| RAYMOND JAMES FINANCIAL, INC. Fiscal Fourth Quarter of 2020 | Selected Financial Highlights (Unaudited) | |||||||
Summary results of operations
| Three months ended | % change from | |||||||||||||||||||||||||||||||
| $ in millions, except per share amounts | September 30, 2020 | September 30, 2019 | June 30, 2020 | September 30, 2019 | June 30, 2020 | |||||||||||||||||||||||||||
| Net revenues | $ | 2,079 | $ | 2,023 | $ | 1,834 | 3% | 13% | ||||||||||||||||||||||||
| Pre-tax income | $ | 256 | $ | 354 | $ | 198 | (28)% | 29% | ||||||||||||||||||||||||
| Net income | $ | 209 | $ | 265 | $ | 172 | (21)% | 22% | ||||||||||||||||||||||||
Earnings per common share: (4) | ||||||||||||||||||||||||||||||||
| Basic | $ | 1.53 | $ | 1.90 | $ | 1.25 | (19)% | 22% | ||||||||||||||||||||||||
| Diluted | $ | 1.50 | $ | 1.86 | $ | 1.23 | (19)% | 22% | ||||||||||||||||||||||||
Non-GAAP measures: (1) | ||||||||||||||||||||||||||||||||
Adjusted pre-tax income | $ | 309 | $ | 373 | NA | (17)% | 56% | |||||||||||||||||||||||||
Adjusted net income | $ | 249 | $ | 284 | NA | (12)% | 45% | |||||||||||||||||||||||||
Adjusted earnings per common share - basic (4) | $ | 1.82 | $ | 2.04 | NA | (11)% | 46% | |||||||||||||||||||||||||
Adjusted earnings per common share - diluted (4) | $ | 1.78 | $ | 2.00 | NA | (11)% | 45% | |||||||||||||||||||||||||
| Twelve months ended | ||||||||||||||||||||
| $ in millions, except per share amounts | September 30, 2020 | September 30, 2019 | % change | |||||||||||||||||
| Net revenues | $ | 7,990 | $ | 7,740 | 3% | |||||||||||||||
| Pre-tax income | $ | 1,052 | $ | 1,375 | (23)% | |||||||||||||||
| Net income | $ | 818 | $ | 1,034 | (21)% | |||||||||||||||
Earnings per common share: (4) | ||||||||||||||||||||
| Basic | $ | 5.94 | $ | 7.32 | (19)% | |||||||||||||||
| Diluted | $ | 5.83 | $ | 7.17 | (19)% | |||||||||||||||
Non-GAAP measures: (1) | ||||||||||||||||||||
| Adjusted pre-tax income | $ | 1,105 | $ | 1,409 | (22)% | |||||||||||||||
| Adjusted net income | $ | 858 | $ | 1,068 | (20)% | |||||||||||||||
Adjusted earnings per common share - basic (4) | $ | 6.23 | $ | 7.56 | (18)% | |||||||||||||||
Adjusted earnings per common share - diluted (4) | $ | 6.11 | $ | 7.40 | (17)% | |||||||||||||||
Please refer to the footnotes at the end of this press release for additional information.
5
RAYMOND JAMES FINANCIAL, INC.
Fiscal Fourth Quarter of 2020
| Consolidated Statements of Income (Unaudited) | ||||||||||||||||||||||||||||||||
| Three months ended | % change from | |||||||||||||||||||||||||||||||
| in millions, except per share amounts | September 30, 2020 | September 30, 2019 | June 30, 2020 | September 30, 2019 | June 30, 2020 | |||||||||||||||||||||||||||
| Revenues: | ||||||||||||||||||||||||||||||||
| Asset management and related administrative fees | $ | 1,006 | $ | 924 | $ | 867 | 9% | 16% | ||||||||||||||||||||||||
| Brokerage revenues: | ||||||||||||||||||||||||||||||||
| Securities commissions | 352 | 355 | 343 | (1)% | 3% | |||||||||||||||||||||||||||
| Principal transactions | 143 | 95 | 143 | 51% | — | |||||||||||||||||||||||||||
| Total brokerage revenues | 495 | 450 | 486 | 10% | 2% | |||||||||||||||||||||||||||
| Account and service fees | 140 | 179 | 134 | (22)% | 4% | |||||||||||||||||||||||||||
| Investment banking | 222 | 157 | 139 | 41% | 60% | |||||||||||||||||||||||||||
| Interest income | 201 | 320 | 217 | (37)% | (7)% | |||||||||||||||||||||||||||
Other (5) | 57 | 55 | 33 | 4% | 73% | |||||||||||||||||||||||||||
| Total revenues | 2,121 | 2,085 | 1,876 | 2% | 13% | |||||||||||||||||||||||||||
| Interest expense | (42) | (62) | (42) | (32)% | — | |||||||||||||||||||||||||||
| Net revenues | 2,079 | 2,023 | 1,834 | 3% | 13% | |||||||||||||||||||||||||||
| Non-interest expenses: | ||||||||||||||||||||||||||||||||
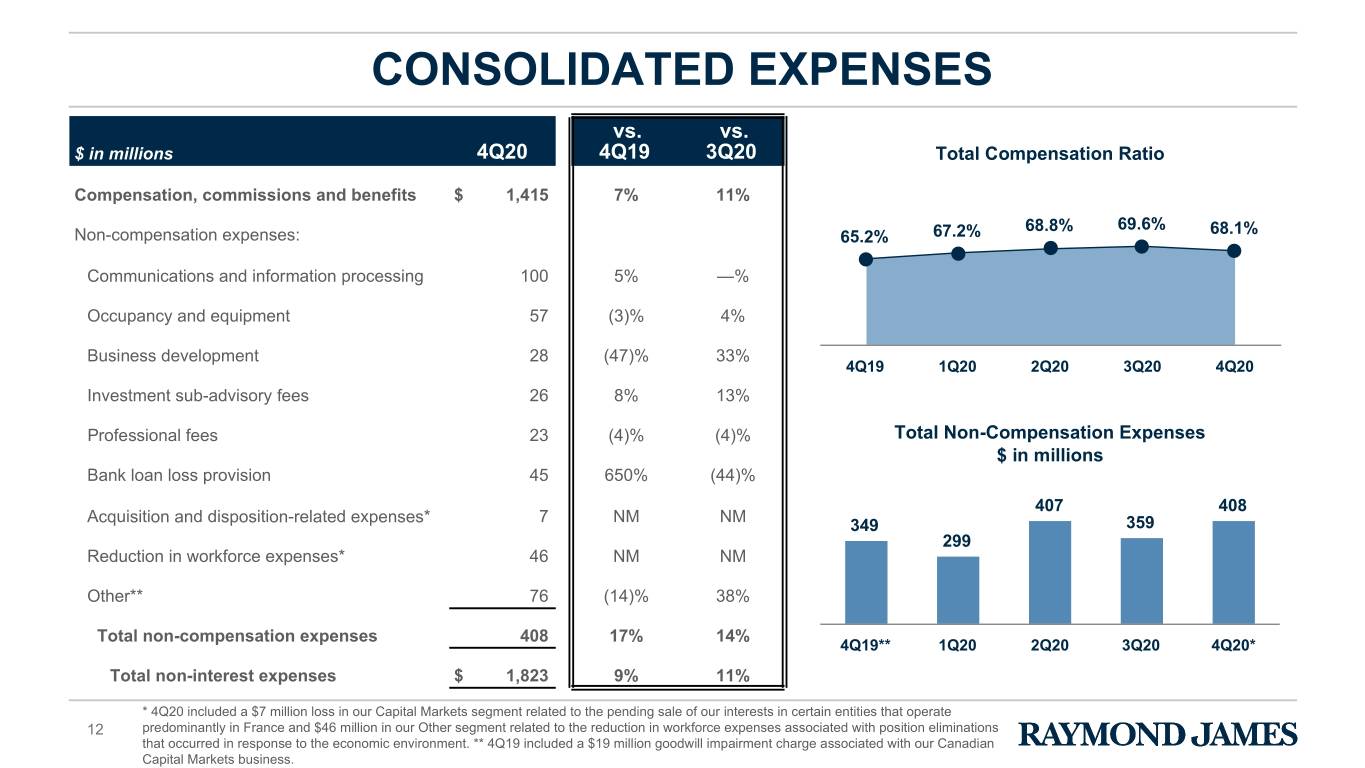
| Compensation, commissions and benefits | 1,415 | 1,320 | 1,277 | 7% | 11% | |||||||||||||||||||||||||||
| Non-compensation expenses: | ||||||||||||||||||||||||||||||||
| Communications and information processing | 100 | 95 | 100 | 5% | — | |||||||||||||||||||||||||||
| Occupancy and equipment | 57 | 59 | 55 | (3)% | 4% | |||||||||||||||||||||||||||
| Business development | 28 | 53 | 21 | (47)% | 33% | |||||||||||||||||||||||||||
| Investment sub-advisory fees | 26 | 24 | 23 | 8% | 13% | |||||||||||||||||||||||||||
| Professional fees | 23 | 24 | 24 | (4)% | (4)% | |||||||||||||||||||||||||||
| Bank loan loss provision | 45 | 6 | 81 | 650% | (44)% | |||||||||||||||||||||||||||
Acquisition and disposition-related expenses (3) | 7 | — | — | NM | NM | |||||||||||||||||||||||||||
Reduction in workforce expenses (2) | 46 | — | — | NM | NM | |||||||||||||||||||||||||||
Other (5) (6) | 76 | 88 | 55 | (14)% | 38% | |||||||||||||||||||||||||||
| Total non-compensation expenses | 408 | 349 | 359 | 17% | 14% | |||||||||||||||||||||||||||
| Total non-interest expenses | 1,823 | 1,669 | 1,636 | 9% | 11% | |||||||||||||||||||||||||||
Pre-tax income | 256 | 354 | 198 | (28)% | 29% | |||||||||||||||||||||||||||
| Provision for income taxes | 47 | 89 | 26 | (47)% | 81% | |||||||||||||||||||||||||||
| Net income | $ | 209 | $ | 265 | $ | 172 | (21)% | 22% | ||||||||||||||||||||||||
Earnings per common share – basic (4) | $ | 1.53 | $ | 1.90 | $ | 1.25 | (19)% | 22% | ||||||||||||||||||||||||
Earnings per common share – diluted (4) | $ | 1.50 | $ | 1.86 | $ | 1.23 | (19)% | 22% | ||||||||||||||||||||||||
Weighted-average common shares outstanding – basic | 136.9 | 138.6 | 137.1 | (1)% | — | |||||||||||||||||||||||||||
Weighted-average common and common equivalent shares outstanding – diluted | 139.6 | 141.8 | 139.4 | (2)% | — | |||||||||||||||||||||||||||
Please refer to the footnotes at the end of this press release for additional information.
6
RAYMOND JAMES FINANCIAL, INC.
Fiscal Fourth Quarter of 2020
| Consolidated Statements of Income (Unaudited) | ||||||||||||||||||||
| Twelve months ended | ||||||||||||||||||||
| in millions, except per share amounts | September 30, 2020 | September 30, 2019 | % change | |||||||||||||||||
| Revenues: | ||||||||||||||||||||
| Asset management and related administrative fees | $ | 3,834 | $ | 3,451 | 11% | |||||||||||||||
| Brokerage revenues: | ||||||||||||||||||||
| Securities commissions | 1,468 | 1,450 | 1% | |||||||||||||||||
| Principal transactions | 488 | 357 | 37% | |||||||||||||||||
| Total brokerage revenues | 1,956 | 1,807 | 8% | |||||||||||||||||
| Account and service fees | 624 | 738 | (15)% | |||||||||||||||||
| Investment banking | 650 | 596 | 9% | |||||||||||||||||
| Interest income | 1,000 | 1,281 | (22)% | |||||||||||||||||
Other (5) | 104 | 150 | (31)% | |||||||||||||||||
| Total revenues | 8,168 | 8,023 | 2% | |||||||||||||||||
| Interest expense | (178) | (283) | (37)% | |||||||||||||||||
| Net revenues | 7,990 | 7,740 | 3% | |||||||||||||||||
| Non-interest expenses: | ||||||||||||||||||||
| Compensation, commissions and benefits | 5,465 | 5,087 | 7% | |||||||||||||||||
| Non-compensation expenses: | ||||||||||||||||||||
| Communications and information processing | 393 | 373 | 5% | |||||||||||||||||
| Occupancy and equipment | 225 | 218 | 3% | |||||||||||||||||
| Business development | 134 | 194 | (31)% | |||||||||||||||||
| Investment sub-advisory fees | 101 | 94 | 7% | |||||||||||||||||
| Professional fees | 91 | 85 | 7% | |||||||||||||||||
| Bank loan loss provision | 233 | 22 | 959% | |||||||||||||||||
Acquisition and disposition-related expenses (3) | 7 | 15 | (53)% | |||||||||||||||||
Reduction in workforce expenses (2) | 46 | — | NM | |||||||||||||||||
Other (5) (6) | 243 | 277 | (12)% | |||||||||||||||||
| Total non-compensation expenses | 1,473 | 1,278 | 15% | |||||||||||||||||
| Total non-interest expenses | 6,938 | 6,365 | 9% | |||||||||||||||||
Pre-tax income | 1,052 | 1,375 | (23)% | |||||||||||||||||
| Provision for income taxes | 234 | 341 | (31)% | |||||||||||||||||
| Net income | $ | 818 | $ | 1,034 | (21)% | |||||||||||||||
Earnings per common share – basic (4) | $ | 5.94 | $ | 7.32 | (19)% | |||||||||||||||
Earnings per common share – diluted (4) | $ | 5.83 | $ | 7.17 | (19)% | |||||||||||||||
Weighted-average common shares outstanding – basic | 137.6 | 141.0 | (2)% | |||||||||||||||||
Weighted-average common and common equivalent shares outstanding – diluted | 140.2 | 144.0 | (3)% | |||||||||||||||||
Please refer to the footnotes at the end of this press release for additional information.
7
| RAYMOND JAMES FINANCIAL, INC. | Consolidated Selected Key Metrics | |||||||
| Fiscal Fourth Quarter of 2020 | (Unaudited) | |||||||
| As of | % change from | ||||||||||||||||||||||||||||||||||
$ in millions, except per share amounts | September 30, 2020 | September 30, 2019 | June 30, 2020 | September 30, 2019 | June 30, 2020 | ||||||||||||||||||||||||||||||
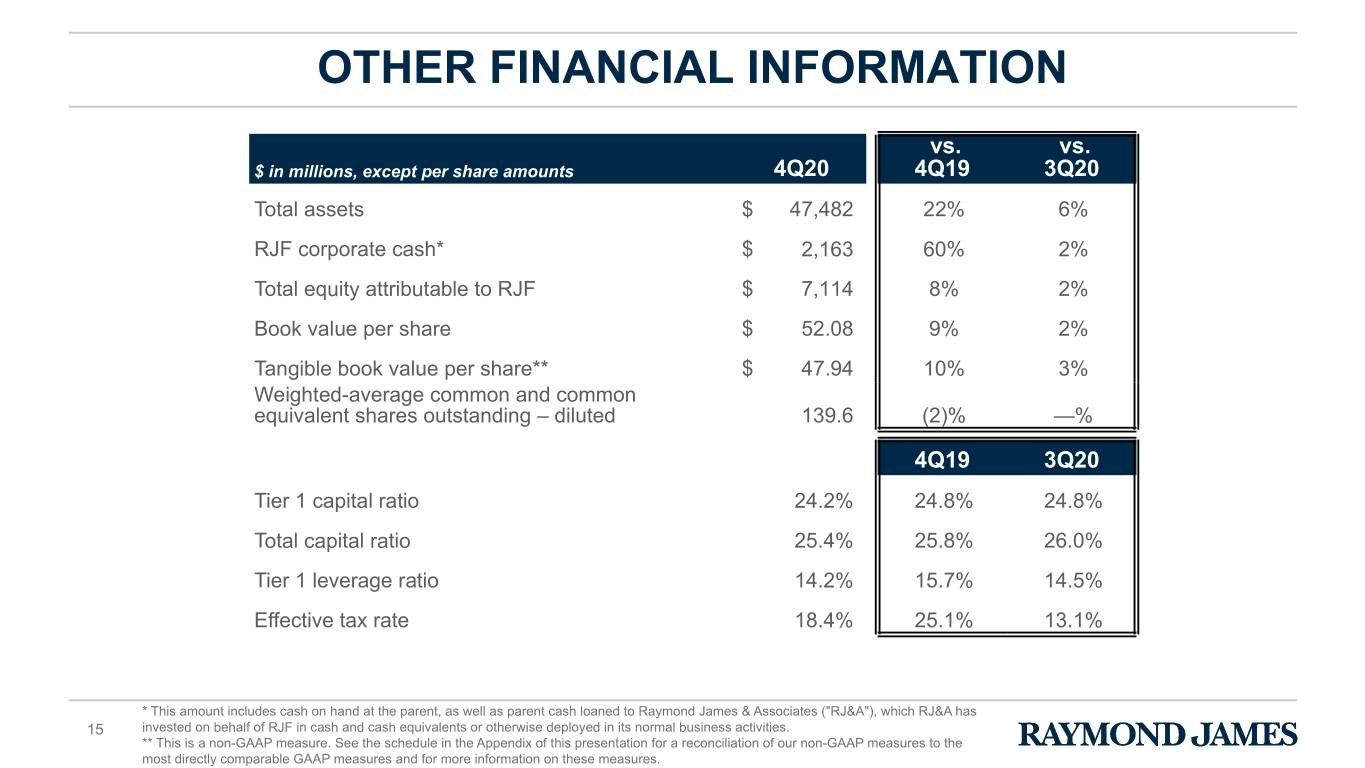
| Total assets | $ | 47,482 | $ | 38,830 | $ | 44,682 | 22% | 6% | |||||||||||||||||||||||||||
| Total equity attributable to Raymond James Financial, Inc. | $ | 7,114 | $ | 6,581 | $ | 6,965 | 8% | 2% | |||||||||||||||||||||||||||
Book value per share (7) | $ | 52.08 | $ | 47.76 | $ | 50.84 | 9% | 2% | |||||||||||||||||||||||||||
Tangible book value per share (1) (7) | $ | 47.94 | $ | 43.53 | $ | 46.69 | 10% | 3% | |||||||||||||||||||||||||||
Capital ratios: | |||||||||||||||||||||||||||||||||||
| Tier 1 capital | 24.2 | % | (8) | 24.8 | % | 24.8 | % | ||||||||||||||||||||||||||||
| Total capital | 25.4 | % | (8) | 25.8 | % | 26.0 | % | ||||||||||||||||||||||||||||
| Tier 1 leverage | 14.2 | % | (8) | 15.7 | % | 14.5 | % | ||||||||||||||||||||||||||||
| Three months ended | Twelve months ended | ||||||||||||||||||||||||||||||||||
| September 30, 2020 | September 30, 2019 | June 30, 2020 | September 30, 2020 | September 30, 2019 | |||||||||||||||||||||||||||||||
Return on equity (9) | 11.9 | % | 16.2 | % | 10.0 | % | 11.9 | % | 16.2 | % | |||||||||||||||||||||||||
Adjusted return on equity (1) (9) | 14.1 | % | 17.3 | % | NA | 12.5 | % | 16.7 | % | ||||||||||||||||||||||||||
Return on tangible common equity (1) (9) | 12.9 | % | 17.8 | % | 10.9 | % | 13.0 | % | 17.8 | % | |||||||||||||||||||||||||
Adjusted return on tangible common equity (1) (9) | 15.3 | % | 19.1 | % | NA | 13.6 | % | 18.4 | % | ||||||||||||||||||||||||||
Pre-tax margin (10) | 12.3 | % | 17.5 | % | 10.8 | % | 13.2 | % | 17.8 | % | |||||||||||||||||||||||||
Adjusted pre-tax margin (1) (10) | 14.9 | % | 18.4 | % | NA | 13.8 | % | 18.2 | % | ||||||||||||||||||||||||||
Total compensation ratio (11) | 68.1 | % | 65.2 | % | 69.6 | % | 68.4 | % | 65.7 | % | |||||||||||||||||||||||||
| Effective tax rate | 18.4 | % | 25.1 | % | 13.1 | % | 22.2 | % | 24.8 | % | |||||||||||||||||||||||||
Client asset metrics ($ in billions) | As of | % change from | |||||||||||||||||||||||||||||||||
| September 30, 2020 | September 30, 2019 | June 30, 2020 | September 30, 2019 | June 30, 2020 | |||||||||||||||||||||||||||||||
Client assets under administration | $ | 930.1 | $ | 838.3 | $ | 876.9 | 11% | 6% | |||||||||||||||||||||||||||
Private Client Group assets under administration | $ | 883.3 | $ | 798.4 | $ | 833.1 | 11% | 6% | |||||||||||||||||||||||||||
Private Client Group assets in fee-based accounts | $ | 475.3 | $ | 409.1 | $ | 443.0 | 16% | 7% | |||||||||||||||||||||||||||
Financial assets under management | $ | 153.1 | $ | 143.1 | $ | 145.4 | 7% | 5% | |||||||||||||||||||||||||||
Clients’ domestic cash sweep balances ($ in millions) | As of | % change from | |||||||||||||||||||||||||||||||||
| September 30, 2020 | September 30, 2019 | June 30, 2020 | September 30, 2019 | June 30, 2020 | |||||||||||||||||||||||||||||||
Raymond James Bank Deposit Program (“RJBDP”): (12) | |||||||||||||||||||||||||||||||||||
| Raymond James Bank | $ | 25,599 | $ | 21,649 | $ | 24,101 | 18% | 6% | |||||||||||||||||||||||||||
| Third-party banks | 25,998 | 14,043 | 24,661 | 85% | 5% | ||||||||||||||||||||||||||||||
| Subtotal RJBDP | 51,597 | 35,692 | 48,762 | 45% | 6% | ||||||||||||||||||||||||||||||
| Client Interest Program | 3,999 | 2,022 | 3,157 | 98% | 27% | ||||||||||||||||||||||||||||||
Total clients’ domestic cash sweep balances | $ | 55,596 | $ | 37,714 | $ | 51,919 | 47% | 7% | |||||||||||||||||||||||||||
| Three months ended | Twelve months ended | ||||||||||||||||||||||||||||||||||
| September 30, 2020 | September 30, 2019 | June 30, 2020 | September 30, 2020 | September 30, 2019 | |||||||||||||||||||||||||||||||
Average yield on RJBDP - third-party banks (13) | 0.33 | % | 1.83 | % | 0.33 | % | 0.77 | % | 1.88 | % | |||||||||||||||||||||||||
| Private Client Group financial advisors | As of | % change from | |||||||||||||||||||||||||||||||||
| September 30, 2020 | September 30, 2019 | June 30, 2020 | September 30, 2019 | June 30, 2020 | |||||||||||||||||||||||||||||||
| Employees | 3,404 | 3,301 | 3,379 | 3% | 1% | ||||||||||||||||||||||||||||||
| Independent contractors | 4,835 | 4,710 | 4,776 | 3% | 1% | ||||||||||||||||||||||||||||||
| Total advisors | 8,239 | 8,011 | 8,155 | 3% | 1% | ||||||||||||||||||||||||||||||
Please refer to the footnotes at the end of this press release for additional information.
8
| RAYMOND JAMES FINANCIAL, INC. | Segment Results | |||||||
| Fiscal Fourth Quarter of 2020 | (Unaudited) | |||||||
| Three months ended | % change from | |||||||||||||||||||||||||||||||
| $ in millions | September 30, 2020 | September 30, 2019 | June 30, 2020 | September 30, 2019 | June 30, 2020 | |||||||||||||||||||||||||||
| Net revenues: | ||||||||||||||||||||||||||||||||
| Private Client Group | $ | 1,394 | $ | 1,381 | $ | 1,249 | 1% | 12% | ||||||||||||||||||||||||
| Capital Markets | 410 | 302 | 323 | 36% | 27% | |||||||||||||||||||||||||||
| Asset Management | 184 | 178 | 163 | 3% | 13% | |||||||||||||||||||||||||||
| Raymond James Bank | 161 | 216 | 178 | (25)% | (10)% | |||||||||||||||||||||||||||
Other (5) (14) | (10) | 7 | (20) | NM | 50% | |||||||||||||||||||||||||||
| Intersegment eliminations | (60) | (61) | (59) | NM | NM | |||||||||||||||||||||||||||
Total net revenues | $ | 2,079 | $ | 2,023 | $ | 1,834 | 3% | 13% | ||||||||||||||||||||||||
Pre-tax income/(loss): | ||||||||||||||||||||||||||||||||
| Private Client Group | $ | 125 | $ | 143 | $ | 91 | (13)% | 37% | ||||||||||||||||||||||||
Capital Markets (3) (6) | 106 | 33 | 62 | 221% | 71% | |||||||||||||||||||||||||||
| Asset Management | 78 | 69 | 60 | 13% | 30% | |||||||||||||||||||||||||||
| Raymond James Bank | 33 | 131 | 14 | (75)% | 136% | |||||||||||||||||||||||||||
Other (2) (5) (14) | (86) | (22) | (29) | (291)% | (197)% | |||||||||||||||||||||||||||
Pre-tax income | $ | 256 | $ | 354 | $ | 198 | (28)% | 29% | ||||||||||||||||||||||||
| Twelve months ended | ||||||||||||||||||||
| $ in millions | September 30, 2020 | September 30, 2019 | % change | |||||||||||||||||
| Net revenues: | ||||||||||||||||||||
| Private Client Group | $ | 5,552 | $ | 5,359 | 4% | |||||||||||||||
| Capital Markets | 1,291 | 1,083 | 19% | |||||||||||||||||
| Asset Management | 715 | 691 | 3% | |||||||||||||||||
| Raymond James Bank | 765 | 846 | (10)% | |||||||||||||||||
Other (5) (14) | (82) | 5 | NM | |||||||||||||||||
| Intersegment eliminations | (251) | (244) | NM | |||||||||||||||||
| Total net revenues | $ | 7,990 | $ | 7,740 | 3% | |||||||||||||||
| Pre-tax income/(loss): | ||||||||||||||||||||
| Private Client Group | $ | 539 | $ | 579 | (7)% | |||||||||||||||
Capital Markets (3) (6) | 225 | 110 | 105% | |||||||||||||||||
| Asset Management | 284 | 253 | 12% | |||||||||||||||||
| Raymond James Bank | 196 | 515 | (62)% | |||||||||||||||||
Other (2) (5) (14) | (192) | (82) | (134)% | |||||||||||||||||
| Pre-tax income | $ | 1,052 | $ | 1,375 | (23)% | |||||||||||||||
Please refer to the footnotes at the end of this press release for additional information.
9
| RAYMOND JAMES FINANCIAL, INC. | Segment Results | |||||||
| Fiscal Fourth Quarter of 2020 | (Unaudited) | |||||||
| Private Client Group | ||||||||||||||||||||||||||||||||
| Three months ended | % change from | |||||||||||||||||||||||||||||||
| $ in millions | September 30, 2020 | September 30, 2019 | June 30, 2020 | September 30, 2019 | June 30, 2020 | |||||||||||||||||||||||||||
| Revenues: | ||||||||||||||||||||||||||||||||
| Asset management and related administrative fees | $ | 832 | $ | 757 | $ | 715 | 10% | 16% | ||||||||||||||||||||||||
| Brokerage revenues: | ||||||||||||||||||||||||||||||||
| Mutual and other fund products | 129 | 150 | 131 | (14)% | (2)% | |||||||||||||||||||||||||||
| Insurance and annuity products | 109 | 104 | 88 | 5% | 24% | |||||||||||||||||||||||||||
| Equities, ETFs and fixed income products | 95 | 87 | 100 | 9% | (5)% | |||||||||||||||||||||||||||
| Total brokerage revenues | 333 | 341 | 319 | (2)% | 4% | |||||||||||||||||||||||||||
| Account and service fees: | ||||||||||||||||||||||||||||||||
| Mutual fund and annuity service fees | 88 | 84 | 82 | 5% | 7% | |||||||||||||||||||||||||||
RJBDP fees: (12) | ||||||||||||||||||||||||||||||||
Third-party banks | 21 | 65 | 20 | (68)% | 5% | |||||||||||||||||||||||||||
Raymond James Bank | 42 | 46 | 43 | (9)% | (2)% | |||||||||||||||||||||||||||
| Client account and other fees | 33 | 30 | 32 | 10% | 3% | |||||||||||||||||||||||||||
| Total account and service fees | 184 | 225 | 177 | (18)% | 4% | |||||||||||||||||||||||||||
| Investment banking | 12 | 7 | 7 | 71% | 71% | |||||||||||||||||||||||||||
| Interest income | 30 | 55 | 31 | (45)% | (3)% | |||||||||||||||||||||||||||
| All other | 7 | 7 | 4 | — | 75% | |||||||||||||||||||||||||||
| Total revenues | 1,398 | 1,392 | 1,253 | — | 12% | |||||||||||||||||||||||||||
| Interest expense | (4) | (11) | (4) | (64)% | — | |||||||||||||||||||||||||||
| Net revenues | 1,394 | 1,381 | 1,249 | 1% | 12% | |||||||||||||||||||||||||||
| Non-interest expenses: | ||||||||||||||||||||||||||||||||
| Financial advisor compensation and benefits | 873 | 832 | 783 | 5% | 11% | |||||||||||||||||||||||||||
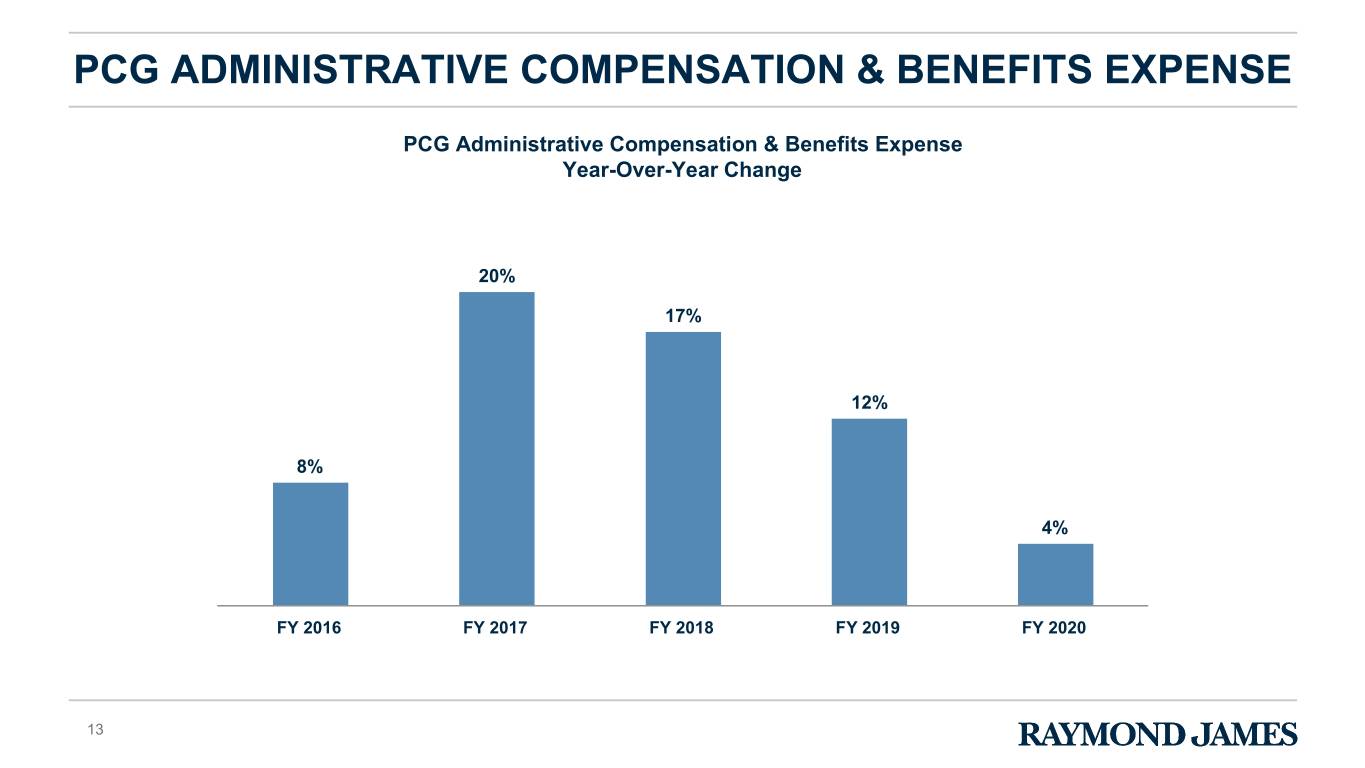
| Administrative compensation and benefits | 244 | 233 | 235 | 5% | 4% | |||||||||||||||||||||||||||
| Total compensation, commissions and benefits | 1,117 | 1,065 | 1,018 | 5% | 10% | |||||||||||||||||||||||||||
| Non-compensation expenses | 152 | 173 | 140 | (12)% | 9% | |||||||||||||||||||||||||||
| Total non-interest expenses | 1,269 | 1,238 | 1,158 | 3% | 10% | |||||||||||||||||||||||||||
| Pre-tax income | $ | 125 | $ | 143 | $ | 91 | (13)% | 37% | ||||||||||||||||||||||||
Please refer to the footnotes at the end of this press release for additional information.
10
| RAYMOND JAMES FINANCIAL, INC. | Segment Results | |||||||
| Fiscal Fourth Quarter of 2020 | (Unaudited) | |||||||
| Private Client Group | ||||||||||||||||||||
| Twelve months ended | ||||||||||||||||||||
| $ in millions | September 30, 2020 | September 30, 2019 | % change | |||||||||||||||||
| Revenues: | ||||||||||||||||||||
| Asset management and related administrative fees | $ | 3,162 | $ | 2,820 | 12% | |||||||||||||||
| Brokerage revenues: | ||||||||||||||||||||
| Mutual and other fund products | 567 | 599 | (5)% | |||||||||||||||||
| Insurance and annuity products | 397 | 412 | (4)% | |||||||||||||||||
| Equities, ETFs and fixed income products | 419 | 378 | 11% | |||||||||||||||||
| Total brokerage revenues | 1,383 | 1,389 | — | |||||||||||||||||
| Account and service fees: | ||||||||||||||||||||
| Mutual fund and annuity service fees | 348 | 334 | 4% | |||||||||||||||||
RJBDP fees: (12) | ||||||||||||||||||||
| Third-party banks | 150 | 280 | (46)% | |||||||||||||||||
| Raymond James Bank | 180 | 173 | 4% | |||||||||||||||||
| Client account and other fees | 129 | 122 | 6% | |||||||||||||||||
| Total account and service fees | 807 | 909 | (11)% | |||||||||||||||||
| Investment banking | 41 | 32 | 28% | |||||||||||||||||
| Interest income | 155 | 225 | (31)% | |||||||||||||||||
| All other | 27 | 26 | 4% | |||||||||||||||||
| Total revenues | 5,575 | 5,401 | 3% | |||||||||||||||||
| Interest expense | (23) | (42) | (45)% | |||||||||||||||||
| Net revenues | 5,552 | 5,359 | 4% | |||||||||||||||||
| Non-interest expenses: | ||||||||||||||||||||
| Financial advisor compensation and benefits | 3,428 | 3,190 | 7% | |||||||||||||||||
| Administrative compensation and benefits | 971 | 933 | 4% | |||||||||||||||||
| Total compensation, commissions and benefits | 4,399 | 4,123 | 7% | |||||||||||||||||
| Non-compensation expenses | 614 | 657 | (7)% | |||||||||||||||||
| Total non-interest expenses | 5,013 | 4,780 | 5% | |||||||||||||||||
| Pre-tax income | $ | 539 | $ | 579 | (7)% | |||||||||||||||
Please refer to the footnotes at the end of this press release for additional information.
11
| RAYMOND JAMES FINANCIAL, INC. | Segment Results | |||||||
| Fiscal Fourth Quarter of 2020 | (Unaudited) | |||||||
| Capital Markets | ||||||||||||||||||||||||||||||||
| Three months ended | % change from | |||||||||||||||||||||||||||||||
| $ in millions | September 30, 2020 | September 30, 2019 | June 30, 2020 | September 30, 2019 | June 30, 2020 | |||||||||||||||||||||||||||
| Revenues: | ||||||||||||||||||||||||||||||||
| Brokerage revenues: | ||||||||||||||||||||||||||||||||
| Fixed income | $ | 125 | $ | 82 | $ | 125 | 52% | — | ||||||||||||||||||||||||
| Equity | 35 | 26 | 41 | 35% | (15)% | |||||||||||||||||||||||||||
| Total brokerage revenues | 160 | 108 | 166 | 48% | (4)% | |||||||||||||||||||||||||||
| Investment banking: | ||||||||||||||||||||||||||||||||
| Merger & acquisition and advisory | 98 | 93 | 60 | 5% | 63% | |||||||||||||||||||||||||||
| Equity underwriting | 68 | 28 | 35 | 143% | 94% | |||||||||||||||||||||||||||
| Debt underwriting | 43 | 29 | 37 | 48% | 16% | |||||||||||||||||||||||||||
| Total investment banking | 209 | 150 | 132 | 39% | 58% | |||||||||||||||||||||||||||
| Interest income | 3 | 9 | 4 | (67)% | (25)% | |||||||||||||||||||||||||||
| Tax credit fund revenues | 33 | 37 | 20 | (11)% | 65% | |||||||||||||||||||||||||||
| All other | 7 | 6 | 3 | 17% | 133% | |||||||||||||||||||||||||||
| Total revenues | 412 | 310 | 325 | 33% | 27% | |||||||||||||||||||||||||||
| Interest expense | (2) | (8) | (2) | (75)% | — | |||||||||||||||||||||||||||
| Net revenues | 410 | 302 | 323 | 36% | 27% | |||||||||||||||||||||||||||
| Non-interest expenses: | ||||||||||||||||||||||||||||||||
Compensation, commissions and benefits | 229 | 179 | 195 | 28% | 17% | |||||||||||||||||||||||||||
Non-compensation expenses (3) (6) | 75 | 90 | 66 | (17)% | 14% | |||||||||||||||||||||||||||
| Total non-interest expenses | 304 | 269 | 261 | 13% | 16% | |||||||||||||||||||||||||||
Pre-tax income | $ | 106 | $ | 33 | $ | 62 | 221% | 71% | ||||||||||||||||||||||||
Please refer to the footnotes at the end of this press release for additional information.
12
| RAYMOND JAMES FINANCIAL, INC. | Segment Results | |||||||
| Fiscal Fourth Quarter of 2020 | (Unaudited) | |||||||
| Capital Markets | ||||||||||||||||||||
| Twelve months ended | ||||||||||||||||||||
| $ in millions | September 30, 2020 | September 30, 2019 | % change | |||||||||||||||||
| Revenues: | ||||||||||||||||||||
| Brokerage revenues: | ||||||||||||||||||||
| Fixed income | $ | 421 | $ | 283 | 49% | |||||||||||||||
| Equity | 150 | 131 | 15% | |||||||||||||||||
| Total brokerage revenues | 571 | 414 | 38% | |||||||||||||||||
| Investment banking: | ||||||||||||||||||||
| Merger & acquisition and advisory | 290 | 379 | (23)% | |||||||||||||||||
| Equity underwriting | 185 | 100 | 85% | |||||||||||||||||
| Debt underwriting | 133 | 85 | 56% | |||||||||||||||||
| Total investment banking | 608 | 564 | 8% | |||||||||||||||||
| Interest income | 25 | 38 | (34)% | |||||||||||||||||
| Tax credit fund revenues | 83 | 86 | (3)% | |||||||||||||||||
| All other | 20 | 15 | 33% | |||||||||||||||||
| Total revenues | 1,307 | 1,117 | 17% | |||||||||||||||||
| Interest expense | (16) | (34) | (53)% | |||||||||||||||||
| Net revenues | 1,291 | 1,083 | 19% | |||||||||||||||||
| Non-interest expenses: | ||||||||||||||||||||
| Compensation, commissions and benefits | 774 | 665 | 16% | |||||||||||||||||
Non-compensation expenses (3) (6) | 292 | 308 | (5)% | |||||||||||||||||
| Total non-interest expenses | 1,066 | 973 | 10% | |||||||||||||||||
| Pre-tax income | $ | 225 | $ | 110 | 105% | |||||||||||||||
Please refer to the footnotes at the end of this press release for additional information.
13
| RAYMOND JAMES FINANCIAL, INC. | Segment Results | |||||||
| Fiscal Fourth Quarter of 2020 | (Unaudited) | |||||||
| Asset Management | ||||||||||||||||||||||||||||||||
| Three months ended | % change from | |||||||||||||||||||||||||||||||
| $ in millions | September 30, 2020 | September 30, 2019 | June 30, 2020 | September 30, 2019 | June 30, 2020 | |||||||||||||||||||||||||||
| Revenues: | ||||||||||||||||||||||||||||||||
Asset management and related administrative fees: | ||||||||||||||||||||||||||||||||
| Managed programs | $ | 123 | $ | 121 | $ | 109 | 2% | 13% | ||||||||||||||||||||||||
| Administration and other | 55 | 49 | 48 | 12% | 15% | |||||||||||||||||||||||||||
Total asset management and related administrative fees | 178 | 170 | 157 | 5% | 13% | |||||||||||||||||||||||||||
| Account and service fees | 4 | 4 | 3 | — | 33% | |||||||||||||||||||||||||||
| All other | 2 | 4 | 3 | (50)% | (33)% | |||||||||||||||||||||||||||
| Net revenues | 184 | 178 | 163 | 3% | 13% | |||||||||||||||||||||||||||
| Non-interest expenses: | ||||||||||||||||||||||||||||||||
Compensation, commissions and benefits | 43 | 44 | 44 | (2)% | (2)% | |||||||||||||||||||||||||||
| Non-compensation expenses | 63 | 65 | 59 | (3)% | 7% | |||||||||||||||||||||||||||
| Total non-interest expenses | 106 | 109 | 103 | (3)% | 3% | |||||||||||||||||||||||||||
Pre-tax income | $ | 78 | $ | 69 | $ | 60 | 13% | 30% | ||||||||||||||||||||||||
| Twelve months ended | ||||||||||||||||||||
| $ in millions | September 30, 2020 | September 30, 2019 | % change | |||||||||||||||||
| Revenues: | ||||||||||||||||||||
| Asset management and related administrative fees: | ||||||||||||||||||||
| Managed programs | $ | 481 | $ | 467 | 3% | |||||||||||||||
| Administration and other | 207 | 178 | 16% | |||||||||||||||||
| Total asset management and related administrative fees | 688 | 645 | 7% | |||||||||||||||||
| Account and service fees | 16 | 31 | (48)% | |||||||||||||||||
| All other | 11 | 15 | (27)% | |||||||||||||||||
| Net revenues | 715 | 691 | 3% | |||||||||||||||||
| Non-interest expenses: | ||||||||||||||||||||
| Compensation, commissions and benefits | 177 | 179 | (1)% | |||||||||||||||||
| Non-compensation expenses | 254 | 259 | (2)% | |||||||||||||||||
| Total non-interest expenses | 431 | 438 | (2)% | |||||||||||||||||
| Pre-tax income | $ | 284 | $ | 253 | 12% | |||||||||||||||
Please refer to the footnotes at the end of this press release for additional information.
14
| RAYMOND JAMES FINANCIAL, INC. | Segment Results | |||||||
| Fiscal Fourth Quarter of 2020 | (Unaudited) | |||||||
| Raymond James Bank | ||||||||||||||||||||||||||||||||
| Three months ended | % change from | |||||||||||||||||||||||||||||||
| $ in millions | September 30, 2020 | September 30, 2019 | June 30, 2020 | September 30, 2019 | June 30, 2020 | |||||||||||||||||||||||||||
| Revenues: | ||||||||||||||||||||||||||||||||
| Interest income | $ | 165 | $ | 243 | $ | 181 | (32)% | (9)% | ||||||||||||||||||||||||
| Interest expense | (11) | (33) | (12) | (67)% | (8)% | |||||||||||||||||||||||||||
| Net interest income | 154 | 210 | 169 | (27)% | (9)% | |||||||||||||||||||||||||||
| All other | 7 | 6 | 9 | 17% | (22)% | |||||||||||||||||||||||||||
| Net revenues | 161 | 216 | 178 | (25)% | (10)% | |||||||||||||||||||||||||||
| Non-interest expenses: | ||||||||||||||||||||||||||||||||
| Compensation and benefits | 13 | 13 | 13 | — | — | |||||||||||||||||||||||||||
| Non-compensation expenses: | ||||||||||||||||||||||||||||||||
| Loan loss provision | 45 | 6 | 81 | 650% | (44)% | |||||||||||||||||||||||||||
RJBDP fees to Private Client Group (12) | 42 | 46 | 43 | (9)% | (2)% | |||||||||||||||||||||||||||
| All other | 28 | 20 | 27 | 40% | 4% | |||||||||||||||||||||||||||
| Total non-compensation expenses | 115 | 72 | 151 | 60% | (24)% | |||||||||||||||||||||||||||
| Total non-interest expenses | 128 | 85 | 164 | 51% | (22)% | |||||||||||||||||||||||||||
| Pre-tax income | $ | 33 | $ | 131 | $ | 14 | (75)% | 136% | ||||||||||||||||||||||||
| Twelve months ended | ||||||||||||||||||||
| $ in millions | September 30, 2020 | September 30, 2019 | % change | |||||||||||||||||
| Revenues: | ||||||||||||||||||||
| Interest income | $ | 800 | $ | 975 | (18)% | |||||||||||||||
| Interest expense | (62) | (155) | (60)% | |||||||||||||||||
| Net interest income | 738 | 820 | (10)% | |||||||||||||||||
| All other | 27 | 26 | 4% | |||||||||||||||||
| Net revenues | 765 | 846 | (10)% | |||||||||||||||||
| Non-interest expenses: | ||||||||||||||||||||
| Compensation and benefits | 51 | 49 | 4% | |||||||||||||||||
| Non-compensation expenses: | ||||||||||||||||||||
| Loan loss provision | 233 | 22 | 959% | |||||||||||||||||
RJBDP fees to Private Client Group (12) | 180 | 173 | 4% | |||||||||||||||||
| All other | 105 | 87 | 21% | |||||||||||||||||
| Total non-compensation expenses | 518 | 282 | 84% | |||||||||||||||||
| Total non-interest expenses | 569 | 331 | 72% | |||||||||||||||||
| Pre-tax income | $ | 196 | $ | 515 | (62)% | |||||||||||||||
Please refer to the footnotes at the end of this press release for additional information.
15
| RAYMOND JAMES FINANCIAL, INC. | Segment Results | |||||||
| Fiscal Fourth Quarter of 2020 | (Unaudited) | |||||||
| Other | ||||||||||||||||||||||||||||||||
| Three months ended | % change from | |||||||||||||||||||||||||||||||
| $ in millions | September 30, 2020 | September 30, 2019 | June 30, 2020 | September 30, 2019 | June 30, 2020 | |||||||||||||||||||||||||||
| Revenues: | ||||||||||||||||||||||||||||||||
| Interest income | $ | 3 | $ | 21 | $ | 3 | (86)% | — | ||||||||||||||||||||||||
Gains on private equity investments (5) | 12 | 6 | 1 | 100% | 1,100% | |||||||||||||||||||||||||||
| All other | — | (2) | 2 | 100% | (100)% | |||||||||||||||||||||||||||
| Total revenues | 15 | 25 | 6 | (40)% | 150% | |||||||||||||||||||||||||||
| Interest expense | (25) | (18) | (26) | 39% | (4)% | |||||||||||||||||||||||||||
| Net revenues | (10) | 7 | (20) | NM | 50% | |||||||||||||||||||||||||||
| Non-interest expenses: | ||||||||||||||||||||||||||||||||
Compensation and all other (5) | 30 | 29 | 9 | 3% | 233% | |||||||||||||||||||||||||||
Reduction in workforce expenses (2) | 46 | — | — | NM | NM | |||||||||||||||||||||||||||
| Total non-interest expenses | 76 | 29 | 9 | 162% | 744% | |||||||||||||||||||||||||||
Pre-tax loss | $ | (86) | $ | (22) | $ | (29) | (291)% | (197)% | ||||||||||||||||||||||||
| Twelve months ended | ||||||||||||||||||||
| $ in millions | September 30, 2020 | September 30, 2019 | % change | |||||||||||||||||
| Revenues: | ||||||||||||||||||||
| Interest income | $ | 30 | $ | 63 | (52)% | |||||||||||||||
Gains/(losses) on private equity investments (5) | (28) | 14 | NM | |||||||||||||||||
| All other | 4 | 3 | 33% | |||||||||||||||||
| Total revenues | 6 | 80 | (93)% | |||||||||||||||||
| Interest expense | (88) | (75) | 17% | |||||||||||||||||
| Net revenues | (82) | 5 | NM | |||||||||||||||||
| Non-interest expenses: | ||||||||||||||||||||
Compensation and all other (5) | 64 | 87 | (26)% | |||||||||||||||||
Reduction in workforce expenses (2) | 46 | — | NM | |||||||||||||||||
| Total non-interest expenses | 110 | 87 | 26% | |||||||||||||||||
Pre-tax loss | $ | (192) | $ | (82) | (134)% | |||||||||||||||
Please refer to the footnotes at the end of this press release for additional information.
16
| RAYMOND JAMES FINANCIAL, INC. | Raymond James Bank Selected Key Metrics | |||||||
| Fiscal Fourth Quarter of 2020 | (Unaudited) | |||||||
| As of | % change from | |||||||||||||||||||||||||||||||
$ in millions | September 30, 2020 | September 30, 2019 | June 30, 2020 | September 30, 2019 | June 30, 2020 | |||||||||||||||||||||||||||
Total assets | $ | 30,610 | $ | 25,705 | $ | 29,066 | 19% | 5% | ||||||||||||||||||||||||
Total equity | $ | 2,315 | $ | 2,248 | $ | 2,279 | 3% | 2% | ||||||||||||||||||||||||
Bank loans, net | $ | 21,195 | $ | 20,891 | $ | 21,223 | 1% | — | ||||||||||||||||||||||||
| Allowance for loan losses | $ | 354 | $ | 218 | $ | 334 | 62% | 6% | ||||||||||||||||||||||||
Allowance for loan losses as a % of loans held for investment | 1.65 | % | 1.04 | % | 1.56 | % | ||||||||||||||||||||||||||
| Total nonperforming assets | $ | 32 | $ | 46 | $ | 23 | (30)% | 39% | ||||||||||||||||||||||||
| Nonperforming assets as a % of total assets | 0.10 | % | 0.18 | % | 0.08 | % | ||||||||||||||||||||||||||
| Total criticized loans | $ | 933 | $ | 285 | $ | 733 | 227% | 27% | ||||||||||||||||||||||||
Criticized loans as a % of loans held for investment | 4.35 | % | 1.36 | % | 3.41 | % | ||||||||||||||||||||||||||
| Capital ratios: | ||||||||||||||||||||||||||||||||
| Tier 1 capital | 13.0 | % | (8) | 13.2 | % | 12.8 | % | |||||||||||||||||||||||||
| Total capital | 14.3 | % | (8) | 14.5 | % | 14.1 | % | |||||||||||||||||||||||||
| Tier 1 leverage | 7.7 | % | (8) | 8.8 | % | 7.6 | % | |||||||||||||||||||||||||
| Three months ended | % change from | |||||||||||||||||||||||||||||||
| $ in millions | September 30, 2020 | September 30, 2019 | June 30, 2020 | September 30, 2019 | June 30, 2020 | |||||||||||||||||||||||||||
| Bank loan loss provision | $ | 45 | $ | 6 | $ | 81 | 650% | (44)% | ||||||||||||||||||||||||
| Net charge-offs: | ||||||||||||||||||||||||||||||||
| Charge-offs related to loan sales | $ | 26 | $ | — | $ | 61 | NM | (57)% | ||||||||||||||||||||||||
| All other | — | 2 | 11 | (100)% | (100)% | |||||||||||||||||||||||||||
| Total net charge-offs | $ | 26 | $ | 2 | $ | 72 | 1,200% | (64)% | ||||||||||||||||||||||||
| Twelve months ended | ||||||||||||||||||||||||||||||||
| $ in millions | September 30, 2020 | September 30, 2019 | % change | |||||||||||||||||||||||||||||
| Bank loan loss provision | $ | 233 | $ | 22 | 959% | |||||||||||||||||||||||||||
| Net charge-offs: | ||||||||||||||||||||||||||||||||
| Charge-offs related to loan sales | $ | 87 | $ | 2 | 4,250% | |||||||||||||||||||||||||||
| All other | 11 | 4 | 175% | |||||||||||||||||||||||||||||
| Total net charge-offs | $ | 98 | $ | 6 | 1,533% | |||||||||||||||||||||||||||
Please refer to the footnotes at the end of this press release for additional information.
17
| RAYMOND JAMES FINANCIAL, INC. | Raymond James Bank Selected Key Metrics | |||||||
| Fiscal Fourth Quarter of 2020 | (Unaudited) | |||||||
Raymond James Bank Net Interest Analysis
| Three months ended | ||||||||||||||||||||||||||||||||||||||||||||||||||||||||||||||
| September 30, 2020 | September 30, 2019 | June 30, 2020 | ||||||||||||||||||||||||||||||||||||||||||||||||||||||||||||
| $ in millions | Average balance | Interest inc./exp. | Average yield/ cost | Average balance | Interest inc./exp. | Average yield/ cost | Average balance | Interest inc./exp. | Average yield/ cost | |||||||||||||||||||||||||||||||||||||||||||||||||||||
| Interest-earning assets: | ||||||||||||||||||||||||||||||||||||||||||||||||||||||||||||||
Cash | $ | 1,691 | $ | 1 | 0.13 | % | $ | 1,262 | $ | 7 | 2.16 | % | $ | 2,990 | $ | — | 0.11 | % | ||||||||||||||||||||||||||||||||||||||||||||
Available-for-sale securities | 6,024 | 23 | 1.52 | % | 2,995 | 18 | 2.37 | % | 4,437 | 23 | 2.01 | % | ||||||||||||||||||||||||||||||||||||||||||||||||||
| Bank loans, net of unearned income and deferred expenses: | ||||||||||||||||||||||||||||||||||||||||||||||||||||||||||||||
| Loans held for investment: | ||||||||||||||||||||||||||||||||||||||||||||||||||||||||||||||
| Commercial and industrial loans | 7,428 | 49 | 2.57 | % | 8,082 | 92 | 4.47 | % | 7,994 | 59 | 2.93 | % | ||||||||||||||||||||||||||||||||||||||||||||||||||
Commercial real estate construction loans | 212 | 2 | 3.33 | % | 268 | 3 | 5.36 | % | 212 | 2 | 3.60 | % | ||||||||||||||||||||||||||||||||||||||||||||||||||
| Commercial real estate loans | 3,636 | 22 | 2.36 | % | 3,507 | 39 | 4.32 | % | 3,773 | 25 | 2.66 | % | ||||||||||||||||||||||||||||||||||||||||||||||||||
Tax-exempt loans (15) | 1,274 | 8 | 3.35 | % | 1,281 | 9 | 3.40 | % | 1,272 | 9 | 3.34 | % | ||||||||||||||||||||||||||||||||||||||||||||||||||
| Residential mortgage loans | 5,026 | 36 | 2.87 | % | 4,364 | 35 | 3.26 | % | 4,983 | 37 | 2.97 | % | ||||||||||||||||||||||||||||||||||||||||||||||||||
| Securities-based loans and other | 3,852 | 23 | 2.38 | % | 3,261 | 36 | 4.35 | % | 3,576 | 24 | 2.59 | % | ||||||||||||||||||||||||||||||||||||||||||||||||||
| Loans held for sale | 105 | 1 | 3.44 | % | 155 | 2 | 4.33 | % | 111 | 1 | 3.22 | % | ||||||||||||||||||||||||||||||||||||||||||||||||||
Total bank loans, net | 21,533 | 141 | 2.63 | % | 20,918 | 216 | 4.12 | % | 21,921 | 157 | 2.87 | % | ||||||||||||||||||||||||||||||||||||||||||||||||||
Federal Home Loan Bank stock, Federal Reserve Bank stock and other | 231 | — | 1.22 | % | 198 | 2 | 3.38 | % | 217 | 1 | 1.50 | % | ||||||||||||||||||||||||||||||||||||||||||||||||||
| Total interest-earning assets | 29,479 | 165 | 2.25 | % | 25,373 | 243 | 3.81 | % | 29,565 | 181 | 2.45 | % | ||||||||||||||||||||||||||||||||||||||||||||||||||
| Total interest-bearing liabilities | 27,056 | 11 | 0.17 | % | 23,087 | 33 | 0.56 | % | 27,233 | 12 | 0.17 | % | ||||||||||||||||||||||||||||||||||||||||||||||||||
| Excess of interest-earning assets over interest-bearing liabilities/net interest income | $ | 2,423 | $ | 154 | $ | 2,286 | $ | 210 | $ | 2,332 | $ | 169 | ||||||||||||||||||||||||||||||||||||||||||||||||||
| Net interest margin (net yield on interest-earning assets) | 2.09 | % | 3.30 | % | 2.29 | % | ||||||||||||||||||||||||||||||||||||||||||||||||||||||||
| Twelve months ended | |||||||||||||||||||||||||||||||||||||||||
| September 30, 2020 | September 30, 2019 | ||||||||||||||||||||||||||||||||||||||||
| $ in millions | Average balance | Interest inc./exp. | Average yield/cost | Average balance | Interest inc./exp. | Average yield/ cost | |||||||||||||||||||||||||||||||||||
| Interest-earning assets: | |||||||||||||||||||||||||||||||||||||||||
Cash | $ | 1,981 | $ | 11 | 0.55 | % | $ | 1,239 | $ | 28 | 2.29 | % | |||||||||||||||||||||||||||||
Available-for-sale securities | 4,250 | 83 | 1.94 | % | 2,872 | 69 | 2.39 | % | |||||||||||||||||||||||||||||||||
Bank loans, net of unearned income and deferred expenses: | |||||||||||||||||||||||||||||||||||||||||
Loans held for investment: | |||||||||||||||||||||||||||||||||||||||||
| Commercial and industrial loans | 7,885 | 275 | 3.43 | % | 8,070 | 378 | 4.62 | % | |||||||||||||||||||||||||||||||||
| Commercial real estate construction loans | 209 | 9 | 4.10 | % | 221 | 12 | 5.51 | % | |||||||||||||||||||||||||||||||||
| Commercial real estate loans | 3,688 | 120 | 3.21 | % | 3,451 | 159 | 4.53 | % | |||||||||||||||||||||||||||||||||
Tax-exempt loans (15) | 1,246 | 33 | 3.35 | % | 1,284 | 35 | 3.36 | % | |||||||||||||||||||||||||||||||||
| Residential mortgage loans | 4,874 | 148 | 3.04 | % | 4,091 | 135 | 3.30 | % | |||||||||||||||||||||||||||||||||
| Securities-based loans and other | 3,559 | 112 | 3.10 | % | 3,139 | 145 | 4.57 | % | |||||||||||||||||||||||||||||||||
| Loans held for sale | 130 | 5 | 3.70 | % | 151 | 7 | 4.73 | % | |||||||||||||||||||||||||||||||||
Total bank loans, net | 21,591 | 702 | 3.25 | % | 20,407 | 871 | 4.26 | % | |||||||||||||||||||||||||||||||||
Federal Home Loan Bank stock, Federal Reserve Bank stock and other | 223 | 4 | 2.04 | % | 172 | 7 | 4.01 | % | |||||||||||||||||||||||||||||||||
| Total interest-earning assets | 28,045 | 800 | 2.85 | % | 24,690 | 975 | 3.95 | % | |||||||||||||||||||||||||||||||||
| Total interest-bearing liabilities | 25,701 | 62 | 0.24 | % | 22,505 | 155 | 0.69 | % | |||||||||||||||||||||||||||||||||
| Excess of interest-earning assets over interest-bearing liabilities/net interest income | $ | 2,344 | $ | 738 | $ | 2,185 | $ | 820 | |||||||||||||||||||||||||||||||||
| Net interest margin (net yield on interest-earning assets) | 2.63 | % | 3.32 | % | |||||||||||||||||||||||||||||||||||||
Please refer to the footnotes at the end of this press release for additional information.
18
| RAYMOND JAMES FINANCIAL, INC. | Non-GAAP Financial Measures | ||||
| Fiscal Fourth Quarter of 2020 | (Unaudited) | ||||
Reconciliation of GAAP measures to non-GAAP financial measures
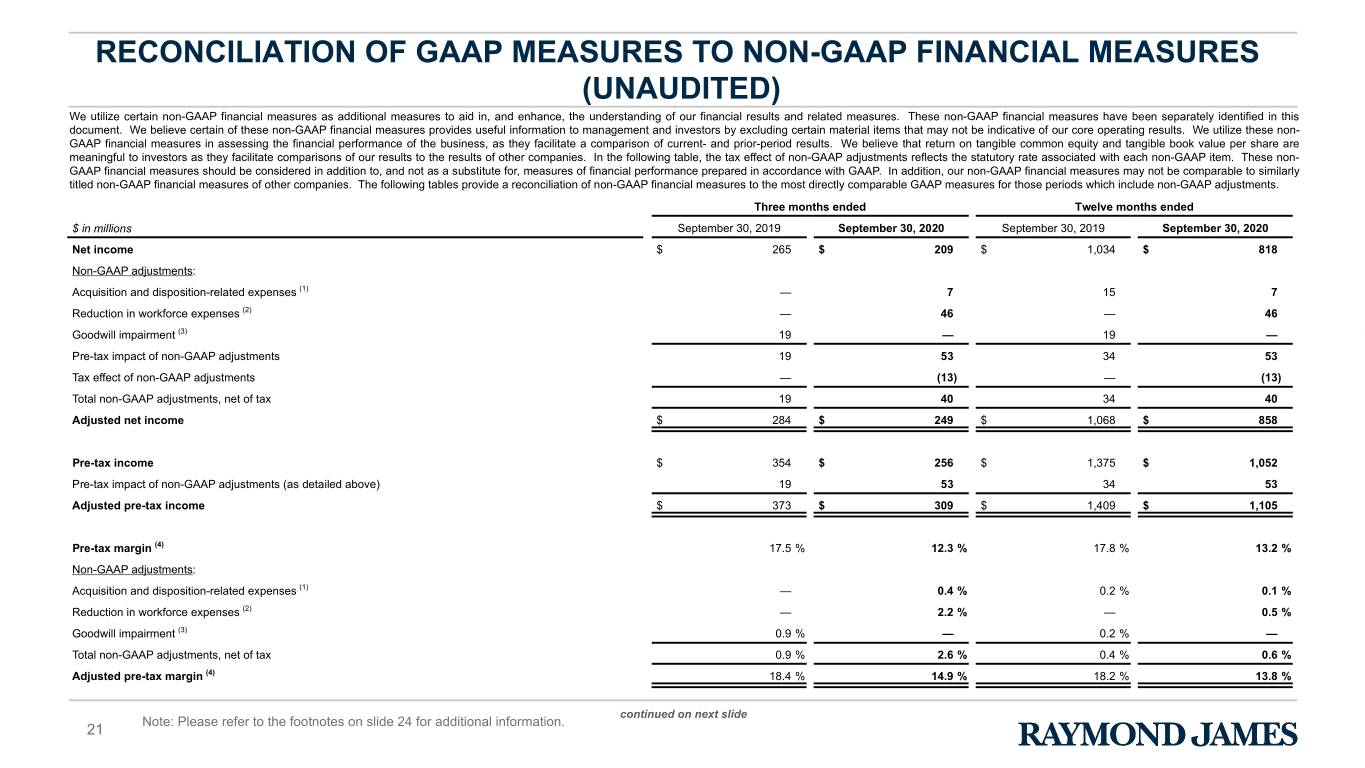
We utilize certain non-GAAP financial measures as additional measures to aid in, and enhance, the understanding of our financial results and related measures. These non-GAAP financial measures have been separately identified in this document. We believe certain of these non-GAAP financial measures provides useful information to management and investors by excluding certain material items that may not be indicative of our core operating results. We utilize these non-GAAP financial measures in assessing the financial performance of the business, as they facilitate a comparison of current- and prior-period results. We believe that return on tangible common equity and tangible book value per share are meaningful to investors as they facilitate comparisons of our results to the results of other companies. In the following table, the tax effect of non-GAAP adjustments reflects the statutory rate associated with each non-GAAP item. These non-GAAP financial measures should be considered in addition to, and not as a substitute for, measures of financial performance prepared in accordance with GAAP. In addition, our non-GAAP financial measures may not be comparable to similarly titled non-GAAP financial measures of other companies. The following tables provide a reconciliation of non-GAAP financial measures to the most directly comparable GAAP measures for those periods which include non-GAAP adjustments.
| Three months ended | Twelve months ended | |||||||||||||||||||||||||
| $ in millions, except per share amounts | September 30, 2020 | September 30, 2019 | September 30, 2020 | September 30, 2019 | ||||||||||||||||||||||
Net income | $ | 209 | $ | 265 | $ | 818 | $ | 1,034 | ||||||||||||||||||
Non-GAAP adjustments: | ||||||||||||||||||||||||||
Acquisition and disposition-related expenses (3) | 7 | — | 7 | 15 | ||||||||||||||||||||||
Reduction in workforce expenses (2) | 46 | — | 46 | — | ||||||||||||||||||||||
Goodwill impairment (6) | — | 19 | — | 19 | ||||||||||||||||||||||
| Pre-tax impact of non-GAAP adjustments | 53 | 19 | 53 | 34 | ||||||||||||||||||||||
Tax effect of non-GAAP adjustments | (13) | — | (13) | — | ||||||||||||||||||||||
Total non-GAAP adjustments, net of tax | 40 | 19 | 40 | 34 | ||||||||||||||||||||||
Adjusted net income | $ | 249 | $ | 284 | $ | 858 | $ | 1,068 | ||||||||||||||||||
Pre-tax income | $ | 256 | $ | 354 | $ | 1,052 | $ | 1,375 | ||||||||||||||||||
Pre-tax impact of non-GAAP adjustments (as detailed above) | 53 | 19 | 53 | 34 | ||||||||||||||||||||||
Adjusted pre-tax income | $ | 309 | $ | 373 | $ | 1,105 | $ | 1,409 | ||||||||||||||||||
Pre-tax margin (10) | 12.3 | % | 17.5 | % | 13.2 | % | 17.8 | % | ||||||||||||||||||
Non-GAAP adjustments: | ||||||||||||||||||||||||||
Acquisition and disposition-related expenses (3) | 0.4 | % | — | 0.1 | % | 0.2 | % | |||||||||||||||||||
Reduction in workforce expenses (2) | 2.2 | % | — | 0.5 | % | — | ||||||||||||||||||||
Goodwill impairment (6) | — | 0.9 | % | — | 0.2 | % | ||||||||||||||||||||
Total non-GAAP adjustments, net of tax | 2.6 | % | 0.9 | % | 0.6 | % | 0.4 | % | ||||||||||||||||||
Adjusted pre-tax margin (10) | 14.9 | % | 18.4 | % | 13.8 | % | 18.2 | % | ||||||||||||||||||
Earnings per common share: (4) | ||||||||||||||||||||||||||
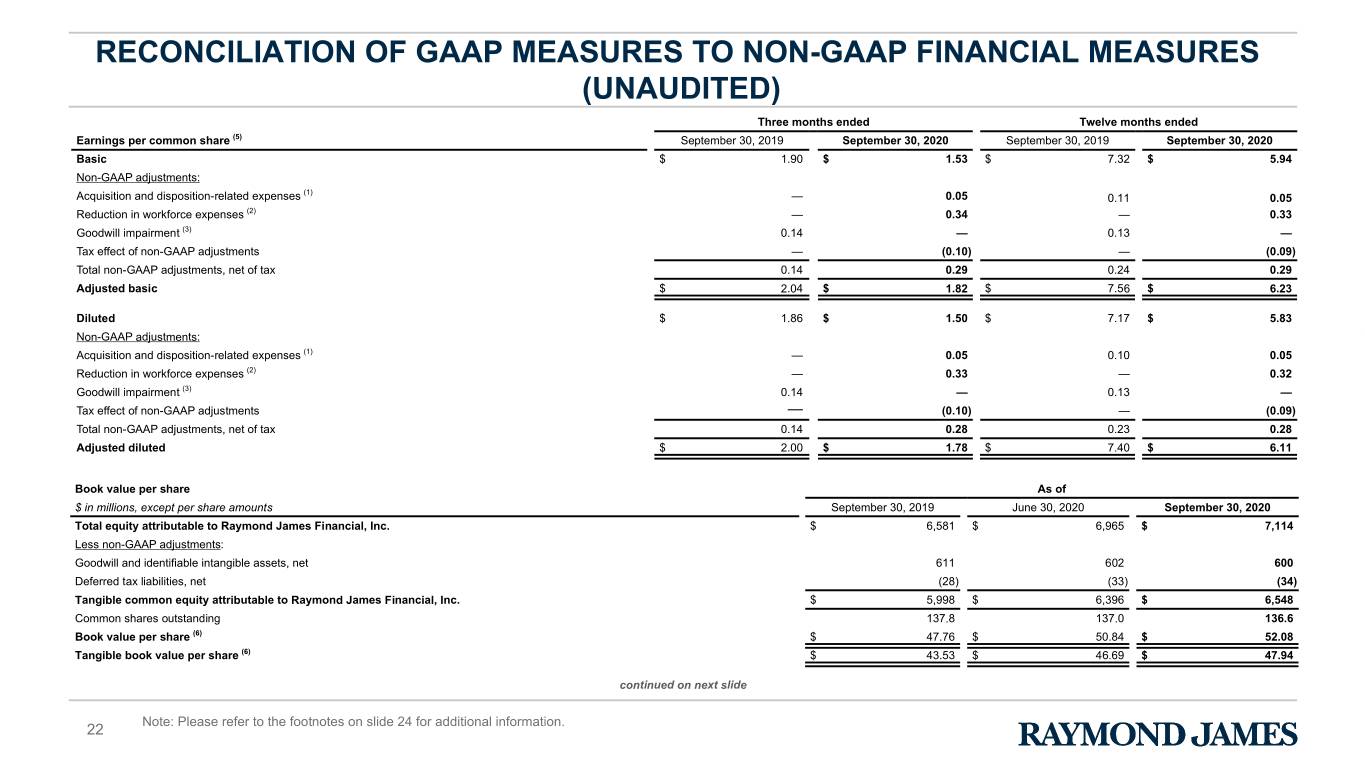
| Basic | $ | 1.53 | $ | 1.90 | $ | 5.94 | $ | 7.32 | ||||||||||||||||||
Non-GAAP adjustments: | ||||||||||||||||||||||||||
Acquisition and disposition-related expenses (3) | 0.05 | — | 0.05 | 0.11 | ||||||||||||||||||||||
Reduction in workforce expenses (2) | 0.34 | — | 0.33 | — | ||||||||||||||||||||||
Goodwill impairment (6) | — | 0.14 | — | 0.13 | ||||||||||||||||||||||
| Tax effect of non-GAAP adjustments | (0.10) | — | (0.09) | — | ||||||||||||||||||||||
| Total non-GAAP adjustments, net of tax | 0.29 | 0.14 | 0.29 | 0.24 | ||||||||||||||||||||||
| Adjusted basic | $ | 1.82 | $ | 2.04 | $ | 6.23 | $ | 7.56 | ||||||||||||||||||
| Diluted | $ | 1.50 | $ | 1.86 | $ | 5.83 | $ | 7.17 | ||||||||||||||||||
Non-GAAP adjustments: | ||||||||||||||||||||||||||
Acquisition and disposition-related expenses (3) | 0.05 | — | 0.05 | 0.10 | ||||||||||||||||||||||
Reduction in workforce expenses (2) | 0.33 | — | 0.32 | — | ||||||||||||||||||||||
Goodwill impairment (6) | — | 0.14 | — | 0.13 | ||||||||||||||||||||||
| Tax effect of non-GAAP adjustments | (0.10) | — | (0.09) | — | ||||||||||||||||||||||
| Total non-GAAP adjustments, net of tax | 0.28 | 0.14 | 0.28 | 0.23 | ||||||||||||||||||||||
| Adjusted diluted | $ | 1.78 | $ | 2.00 | $ | 6.11 | $ | 7.40 | ||||||||||||||||||
Please refer to the footnotes at the end of this press release for additional information.
19
| RAYMOND JAMES FINANCIAL, INC. | Non-GAAP Financial Measures | ||||
| Fiscal Fourth Quarter of 2020 | (Unaudited) | ||||
Reconciliation of GAAP measures to non-GAAP financial measures (Unaudited)
(Continued from previous page)
| Book value per share | As of | |||||||||||||||||||
| $ in millions, except per share amounts | September 30, 2020 | September 30, 2019 | June 30, 2020 | |||||||||||||||||
Total equity attributable to Raymond James Financial, Inc. | $ | 7,114 | $ | 6,581 | $ | 6,965 | ||||||||||||||
Less non-GAAP adjustments: | ||||||||||||||||||||
Goodwill and identifiable intangible assets, net | 600 | 611 | 602 | |||||||||||||||||
| Deferred tax liabilities, net | (34) | (28) | (33) | |||||||||||||||||
| Tangible common equity attributable to Raymond James Financial, Inc. | $ | 6,548 | $ | 5,998 | $ | 6,396 | ||||||||||||||
| Common shares outstanding | 136.6 | 137.8 | 137.0 | |||||||||||||||||
Book value per share (7) | $ | 52.08 | $ | 47.76 | $ | 50.84 | ||||||||||||||
Tangible book value per share (7) | $ | 47.94 | $ | 43.53 | $ | 46.69 | ||||||||||||||
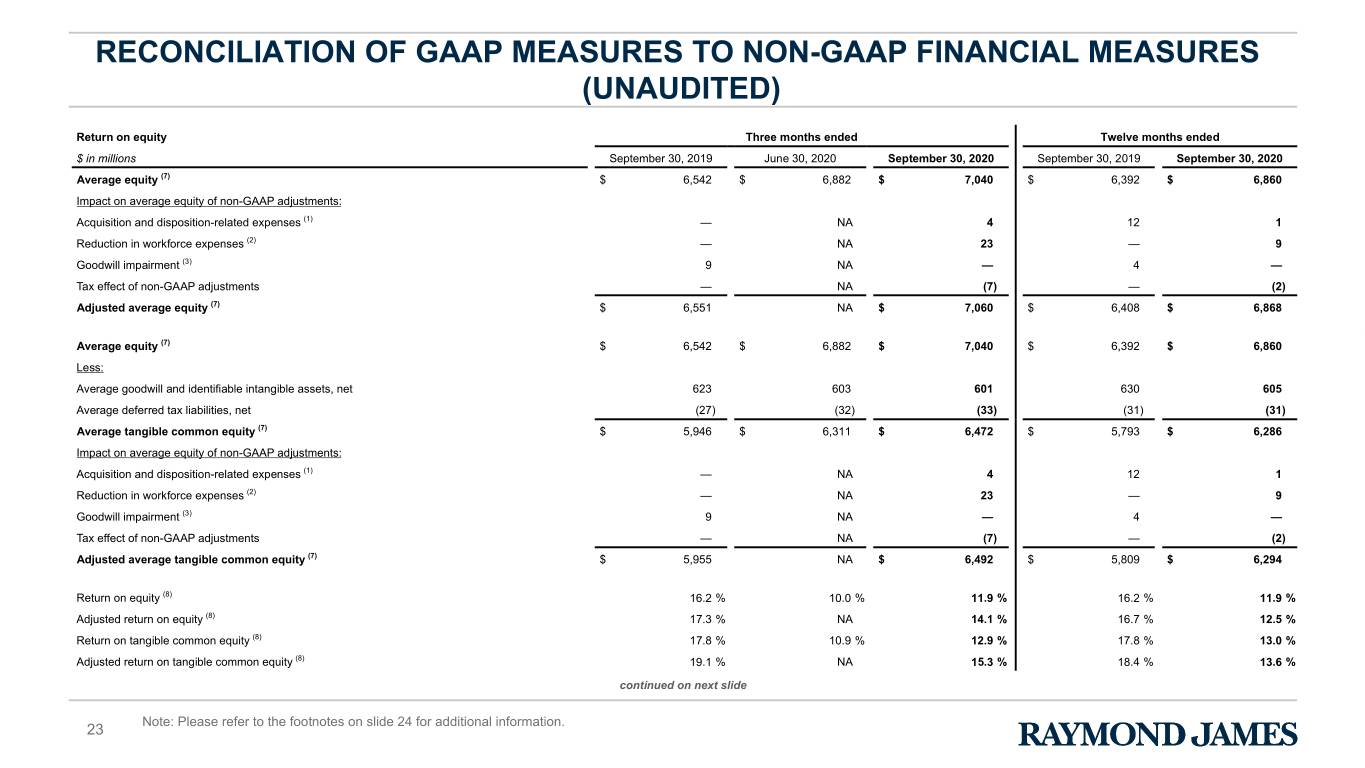
| Return on equity | Three months ended | Twelve months ended | |||||||||||||||||||||||||||||||||
| $ in millions | September 30, 2020 | September 30, 2019 | June 30, 2020 | September 30, 2020 | September 30, 2019 | ||||||||||||||||||||||||||||||
Average equity (16) | $ | 7,040 | $ | 6,542 | $ | 6,882 | $ | 6,860 | $ | 6,392 | |||||||||||||||||||||||||
Impact on average equity of non-GAAP adjustments: | |||||||||||||||||||||||||||||||||||
Acquisition and disposition-related expenses (3) | 4 | — | NA | 1 | 12 | ||||||||||||||||||||||||||||||
Reduction in workforce expenses (2) | 23 | — | NA | 9 | — | ||||||||||||||||||||||||||||||
Goodwill impairment (6) | — | 9 | NA | — | 4 | ||||||||||||||||||||||||||||||
| Tax effect of non-GAAP adjustments | (7) | — | NA | (2) | — | ||||||||||||||||||||||||||||||
Adjusted average equity (16) | $ | 7,060 | $ | 6,551 | NA | $ | 6,868 | $ | 6,408 | ||||||||||||||||||||||||||
Average equity (16) | $ | 7,040 | $ | 6,542 | $ | 6,882 | $ | 6,860 | $ | 6,392 | |||||||||||||||||||||||||
Less: | |||||||||||||||||||||||||||||||||||
| Average goodwill and identifiable intangible assets, net | 601 | 623 | 603 | 605 | 630 | ||||||||||||||||||||||||||||||
| Average deferred tax liabilities, net | (33) | (27) | (32) | (31) | (31) | ||||||||||||||||||||||||||||||
Average tangible common equity (16) | $ | 6,472 | $ | 5,946 | $ | 6,311 | $ | 6,286 | $ | 5,793 | |||||||||||||||||||||||||
Impact on average equity of non-GAAP adjustments: | |||||||||||||||||||||||||||||||||||
Acquisition and disposition-related expenses (3) | 4 | — | NA | 1 | 12 | ||||||||||||||||||||||||||||||
Reduction in workforce expenses (2) | 23 | — | NA | 9 | — | ||||||||||||||||||||||||||||||
Goodwill impairment (6) | — | 9 | NA | — | 4 | ||||||||||||||||||||||||||||||
| Tax effect of non-GAAP adjustments | (7) | — | NA | (2) | — | ||||||||||||||||||||||||||||||
Adjusted average tangible common equity (16) | $ | 6,492 | $ | 5,955 | NA | $ | 6,294 | $ | 5,809 | ||||||||||||||||||||||||||
Return on equity (9) | 11.9 | % | 16.2 | % | 10.0 | % | 11.9 | % | 16.2 | % | |||||||||||||||||||||||||
Adjusted return on equity (9) | 14.1 | % | 17.3 | % | NA | 12.5 | % | 16.7 | % | ||||||||||||||||||||||||||
Return on tangible common equity (9) | 12.9 | % | 17.8 | % | 10.9 | % | 13.0 | % | 17.8 | % | |||||||||||||||||||||||||
Adjusted return on tangible common equity (9) | 15.3 | % | 19.1 | % | NA | 13.6 | % | 18.4 | % | ||||||||||||||||||||||||||
Please refer to the footnotes at the end of this press release for additional information.
20
RAYMOND JAMES FINANCIAL, INC.
Fiscal Fourth Quarter of 2020
Footnotes
1.These are non-GAAP financial measures. See the schedules on the previous pages of this document for a reconciliation of our non-GAAP financial measures to the most directly comparable GAAP measures and for more information on these measures. There were no non-GAAP adjustments to earnings for the three months ended June 30, 2020; therefore, percent changes for earnings-related non-GAAP financial measures are calculated based on non-GAAP results for the three months ended September 30, 2020 as compared to GAAP results for the three months ended June 30, 2020.
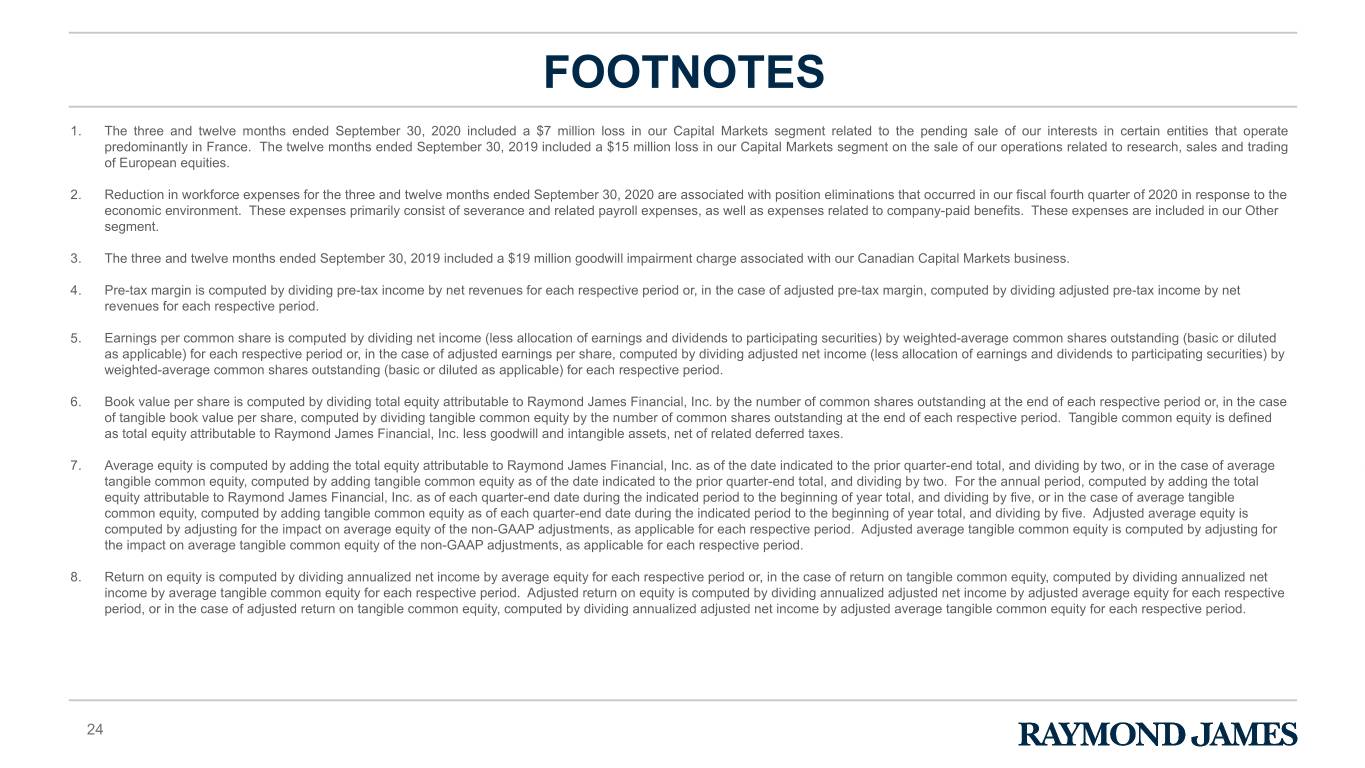
2.Reduction in workforce expenses for the three and twelve months ended September 30, 2020 are associated with position eliminations that occurred in our fiscal fourth quarter of 2020 in response to the economic environment. These expenses primarily consist of severance and related payroll expenses, as well as expenses related to company-paid benefits. These expenses are included in our Other segment.
3.The three and twelve months ended September 30, 2020 included a $7 million loss in our Capital Markets segment related to the pending sale of our interests in certain entities that operate predominantly in France. The twelve months ended September 30, 2019 included a $15 million loss in our Capital Markets segment on the sale of our operations related to research, sales and trading of European equities.
4.Earnings per common share is computed by dividing net income (less allocation of earnings and dividends to participating securities) by weighted-average common shares outstanding (basic or diluted as applicable) for each respective period or, in the case of adjusted earnings per share, computed by dividing adjusted net income (less allocation of earnings and dividends to participating securities) by weighted-average common shares outstanding (basic or diluted as applicable) for each respective period.
5.Other revenues included $12 million of private equity valuation gains and $28 million of private equity valuation losses for the three and twelve months ended September 30, 2020, respectively, which are included in our Other segment. Of these amounts, $3 million of the gains for the three months ended September 30, 2020 and $20 million of the losses for the twelve months ended September 30, 2020 were attributable to noncontrolling interests and are offset in Other expenses.
6.The three and twelve months ended September 30, 2019 included a $19 million goodwill impairment charge associated with our Canadian Capital Markets business.
7.Book value per share is computed by dividing total equity attributable to Raymond James Financial, Inc. by the number of common shares outstanding at the end of each respective period or, in the case of tangible book value per share, computed by dividing tangible common equity by the number of common shares outstanding at the end of each respective period. Tangible common equity is defined as total equity attributable to Raymond James Financial, Inc. less goodwill and intangible assets, net of related deferred taxes.
8.Estimated.
9.Return on equity is computed by dividing annualized net income by average equity for each respective period or, in the case of return on tangible common equity, computed by dividing annualized net income by average tangible common equity for each respective period. Adjusted return on equity is computed by dividing annualized adjusted net income by adjusted average equity for each respective period, or in the case of adjusted return on tangible common equity, computed by dividing annualized adjusted net income by adjusted average tangible common equity for each respective period.
10.Pre-tax margin is computed by dividing pre-tax income by net revenues for each respective period or, in the case of adjusted pre-tax margin, computed by dividing adjusted pre-tax income by net revenues for each respective period.
11.Total compensation ratio is computed by dividing compensation, commissions and benefits expense by net revenues for each respective period.
12.We earn fees from RJBDP, a multi-bank sweep program in which clients’ cash deposits in their brokerage accounts are swept into interest-bearing deposit accounts at Raymond James Bank and various third-party banks. Fees earned by Private Client Group on Raymond James Bank deposits are eliminated in consolidation.
13.Average yield on RJBDP - third-party banks is computed by dividing annualized RJBDP fees - third-party banks, which are net of the interest expense paid to clients by the third-party banks, by the average daily RJBDP balances at third-party banks.
14.The Other segment includes the results of our private equity investments, interest income on certain corporate cash balances, and certain corporate overhead costs of Raymond James Financial, Inc., including the interest costs on our public debt.
15.The average yield is presented on a tax-equivalent basis for each respective period.
16.Average equity is computed by adding the total equity attributable to Raymond James Financial, Inc. as of the date indicated to the prior quarter-end total, and dividing by two, or in the case of average tangible common equity, computed by adding tangible common equity as of the date indicated to the prior quarter-end total, and dividing by two. For the annual period, computed by adding the total equity attributable to Raymond James Financial, Inc. as of each quarter-end date during the indicated period to the beginning of year total, and dividing by five, or in the case of average tangible common equity, computed by adding tangible common equity as of each quarter-end date during the indicated period to the beginning of year total, and dividing by five. Adjusted average equity is computed by adjusting for the impact on average equity of the non-GAAP adjustments, as applicable for each respective period. Adjusted average tangible common equity is computed by adjusting for the impact on average tangible common equity of the non-GAAP adjustments, as applicable for each respective period.
21