
Exhibit 99.2 A6A6A6 272727 Analyst Day F5F4F1 October 22, 2025 F2F8FD
1F75B5 FFC734 BUILDING CONNECTED COMMUNITIES
A6A6A6 Forward-Looking Statements Certain statements contained herein
that are not statements of historical or current fact constitute “forward-looking statements” within the meaning of Section 27A of the Securities Act of 1933 and 21E of the Securities Exchange Act of 1934. These statements may be
identified by the use of words such as “seek” “continue,” “estimate,” “predict,” “potential,” “targeting,” “could,” “might,” “may,”
“will,” “expect,” “should,” “anticipate,” “intend,” “project,” “outlook,” “believe,” “plan”, “forecast” and similar 272727
expressions or their negative. These forward-looking statements include, among others, statements regarding the Company’s expected revenue, net income, Adjusted EBITDA, Adjusted EBITDA Margin, Cash Flow from Operations, and Net Leverage Ratio
for the fiscal year ended September 30, 2025, the Company’s fiscal year 2026 outlook and the Company’s business strategy. These and other forward-looking statements are based on management’s current views and assumptions and
involve risks and uncertainties that could significantly affect expected results. Important factors could cause actual results to differ materially from those expressed in the forward-looking statements, including, among others: the preliminary
financial information remaining subject to changes and finalization based upon management’s ongoing review of results for the fiscal year ended September 30, 2025 and the completion of all year-end closing procedures; the Company’s
ability to successfully F5F4F1 manage and integrate acquisitions; failure to realize the expected economic benefits of acquisitions, including future levels of revenues being lower than expected and costs being higher than expected; failure or
inability to implement growth strategies in a timely manner; declines in public infrastructure construction and reductions in government funding, including the funding by transportation authorities and other state and local agencies; risks related
to the Company’s operating strategy; competition for projects in our local markets; risks associated with the Company’s capital-intensive business; government requirements and initiatives, including those related to funding for public or
infrastructure construction, land usage and environmental, health and safety matters; unfavorable economic conditions and restrictive financing markets; the Company’s ability to obtain sufficient bonding capacity to undertake certain projects;
the Company’s ability to accurately estimate the overall F2F8FD risks, requirements or costs when it bids on or negotiate contracts that are ultimately awarded to the Company; the cancellation of a significant number of contracts or the
Company’s disqualification from bidding for new contracts; risks related to adverse weather conditions; the Company’s substantial indebtedness and the restrictions imposed on the Company by the terms thereof; the Company’s ability
to maintain favorable relationships with third parties that supply the Company with equipment and essential supplies; the Company’s ability to retain key personnel and maintain satisfactory labor relations; property damage, results of
litigation and other claims and insurance coverage issues; risks related to the Company’s information technology systems and infrastructure; the Company’s ability to maintain effective internal control 1F75B5 over financial reporting;
and the other risks, uncertainties and factors set forth in the Company’s most recent Annual Report on Form 10-K, its subsequent Quarterly Reports on Form 10-Q, its Current Reports on Form 8-K and other reports the Company files with the
Securities and Exchange Commission. Forward-looking statements speak only as of the date they are made. The Company assumes no obligation to update forward-looking statements to reflect actual results, subsequent events, or circumstances or other
changes affecting such statements, except to the extent required by applicable law. The Company's independent registered public accounting firm has not audited, reviewed, compiled or performed any procedures with respect to the preliminary financial
information for the year ended September 30, 2025 presented herein or its audit of the Company's financial statements for the year ended September 30, 2025. FFC734 The Company's actual results may differ from these estimates as a result of the
Company's year-end closing procedures, review adjustments and other developments that may arise between now and the time the Company's financial results for the year ended September 30, 2025 are finalized. Page 2
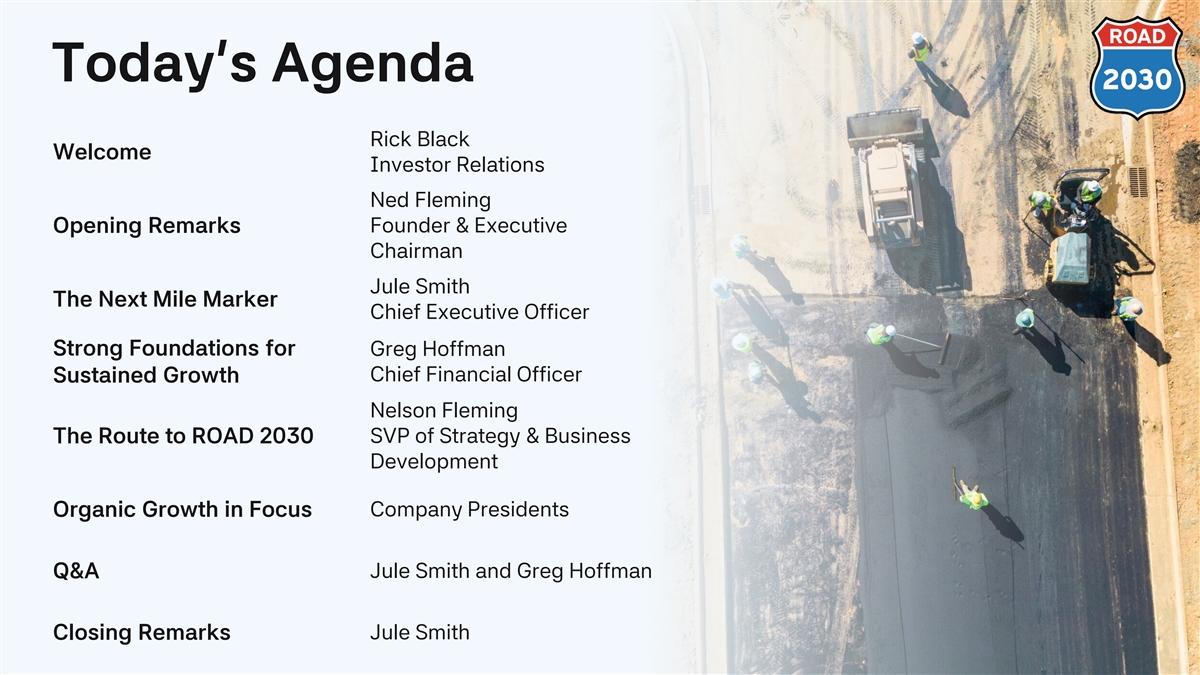
A6A6A6 Today’s Agenda Rick Black Welcome Investor Relations 272727
Ned Fleming Opening Remarks Founder & Executive Chairman F5F4F1 Jule Smith The Next Mile Marker Chief Executive Officer Strong Foundations for Greg Hoffman F2F8FD Chief Financial Officer Sustained Growth Nelson Fleming SVP of Strategy &
Business The Route to ROAD 2030 Development 1F75B5 Company Presidents Organic Growth in Focus Jule Smith and Greg Hoffman Q&A FFC734 Closing Remarks Jule Smith
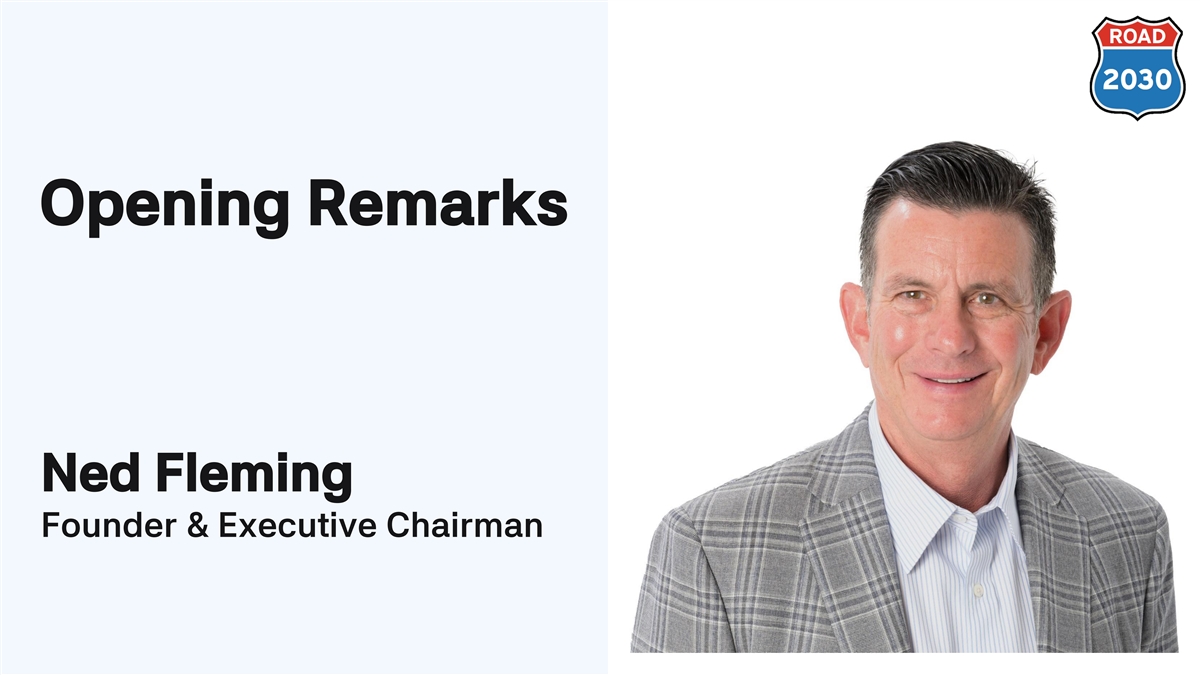
A6A6A6 272727 Opening Remarks F5F4F1 F2F8FD 1F75B5 Ned Fleming Founder
& Executive Chairman FFC734
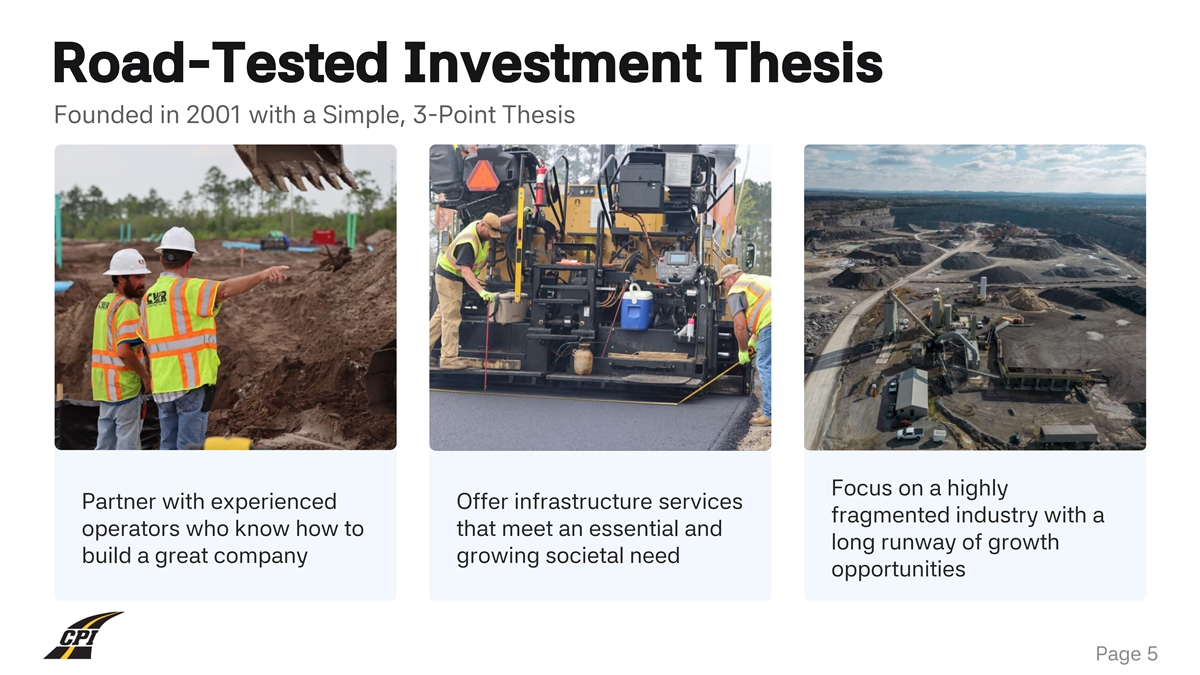
A6A6A6 Road-Tested Investment Thesis Founded in 2001 with a Simple,
3-Point Thesis 272727 F5F4F1 F2F8FD 1F75B5 Focus on a highly Partner with experienced Offer infrastructure services fragmented industry with a operators who know how to that meet an essential and long runway of growth “Long” instead of
build a great company growing societal need opportunities FFC734 “endless”? Page 5
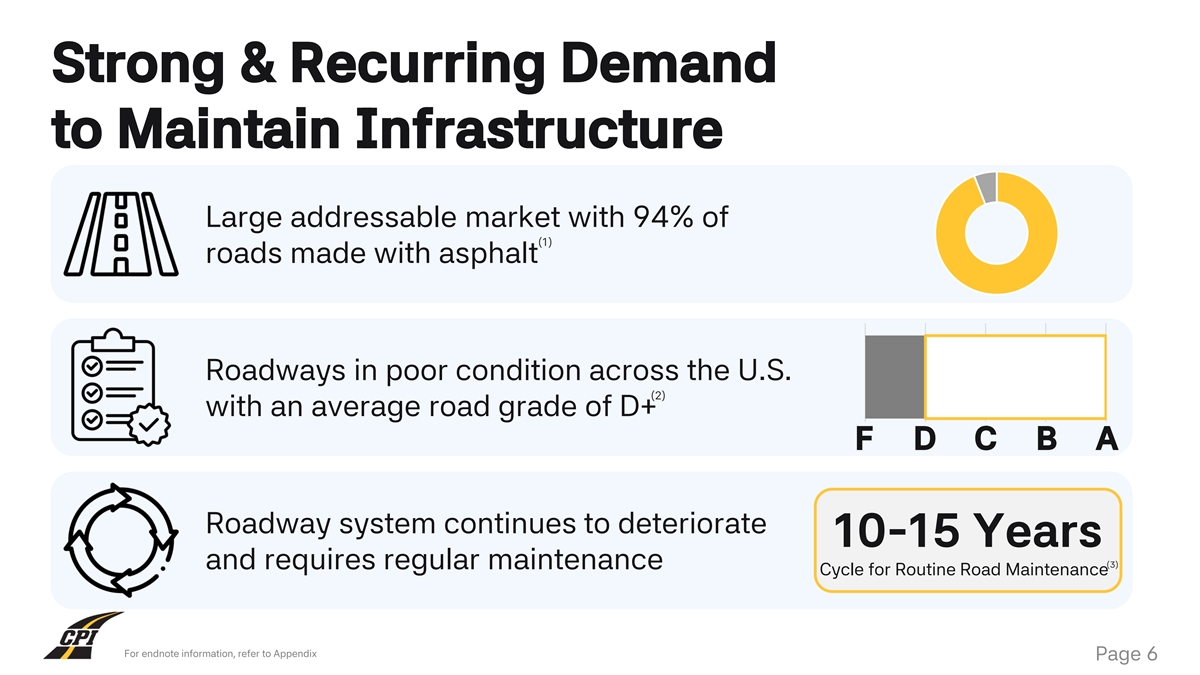
A6A6A6 Strong & Recurring Demand to Maintain Infrastructure 272727
94% Roads in the U.S. Made Large addressable market with 94% of with Asphalt (3) (1) roads made with asphalt F5F4F1 D F2F8FD Roadways in poor condition across the U.S. (1) Average Road Grade (2) with an average road grade of D+ 0 1 2 3 4 F D C B A
1F75B5 Roadway system continues to deteriorate 10-15 Years (3) and requires regular maintenance Cycle for Routine Road Maintenance FFC734 For endnote information, refer to Appendix Page 6
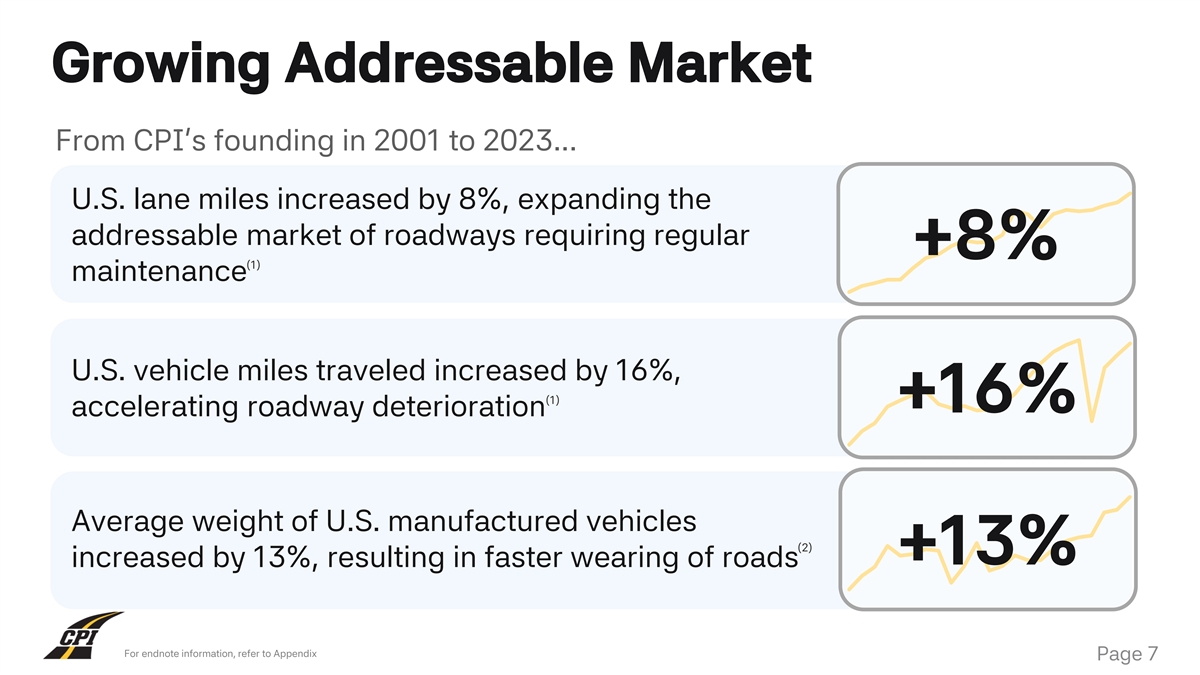
A6A6A6 Growing Addressable Market From CPI’s founding in 2001 to
2023... 272727 U.S. lane miles increased by 8%, expanding the addressable market of roadways requiring regular +8% (1) F5F4F1 maintenance F2F8FD U.S. vehicle miles traveled increased by 16%, (1) +16% accelerating roadway deterioration 1F75B5 Average
weight of U.S. manufactured vehicles (2) +13% increased by 13%, resulting in faster wearing of roads FFC734 For endnote information, refer to Appendix Page 7 (1) U.S. Department of Transportation - Federal Highway Administration (2) The 2024 EPA
Automotive Trends Report
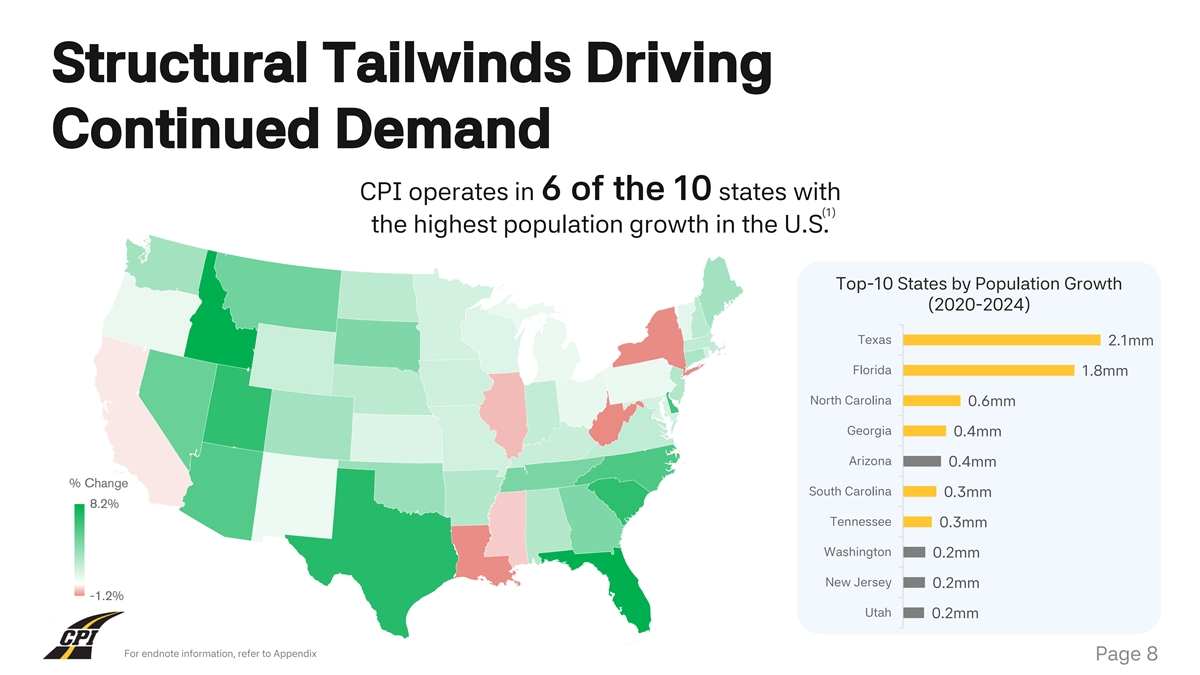
A6A6A6 Structural Tailwinds Driving Continued Demand 272727 CPI operates
in 6 of the 10 states with (1) the highest population growth in the U.S. F5F4F1 Top-10 States by Population Growth (2020-2024) Texas 2.1mm Florida 1.8mm F2F8FD North Carolina 0.6mm Georgia 0.4mm Arizona 0.4mm 1F75B5 South Carolina 0.3mm Tennessee
0.3mm Washington 0.2mm FFC734 New Jersey 0.2mm Utah 0.2mm Powered by Bing © GeoNames, Microsoft, TomTom For endnote information, refer to Appendix Page 8
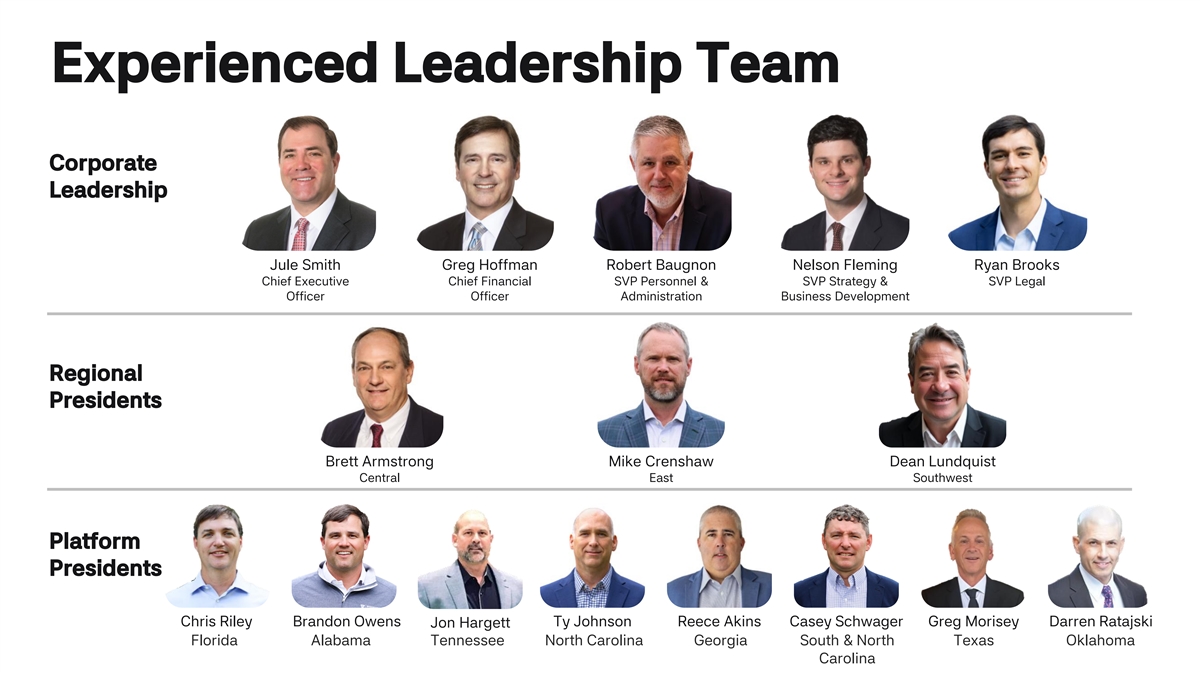
A6A6A6 Experienced Leadership Team Corporate 272727 Leadership Jule
Smith Greg Hoffman Robert Baugnon Nelson Fleming Ryan Brooks F5F4F1 Chief Executive Chief Financial SVP Personnel & SVP Strategy & SVP Legal Officer Officer Administration Business Development F2F8FD Regional Presidents Brett Armstrong Mike
Crenshaw Dean Lundquist 1F75B5 Central East Southwest Platform Presidents FFC734 Chris Riley Brandon Owens Ty Johnson Reece Akins Casey Schwager Greg Morisey Darren Ratajski Jon Hargett Florida Alabama Tennessee North Carolina Georgia South &
North Texas Oklahoma Page 9 Carolina
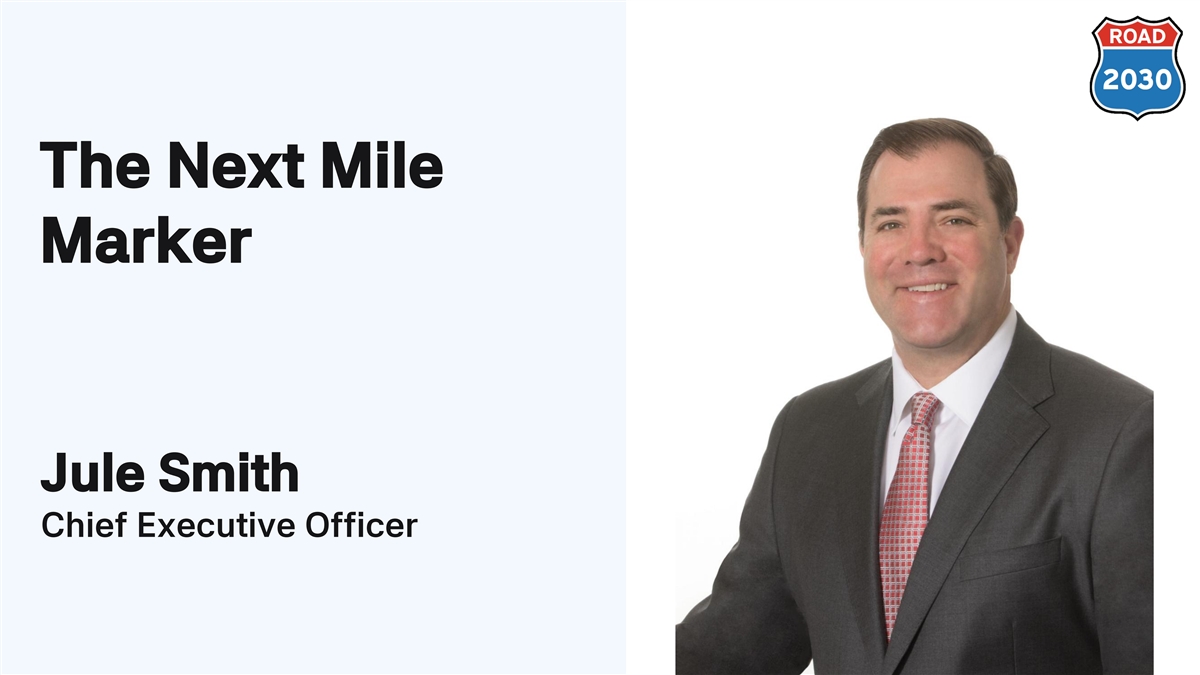
A6A6A6 272727 The Next Mile Marker F5F4F1 F2F8FD 1F75B5 Jule Smith
Chief Executive Officer FFC734
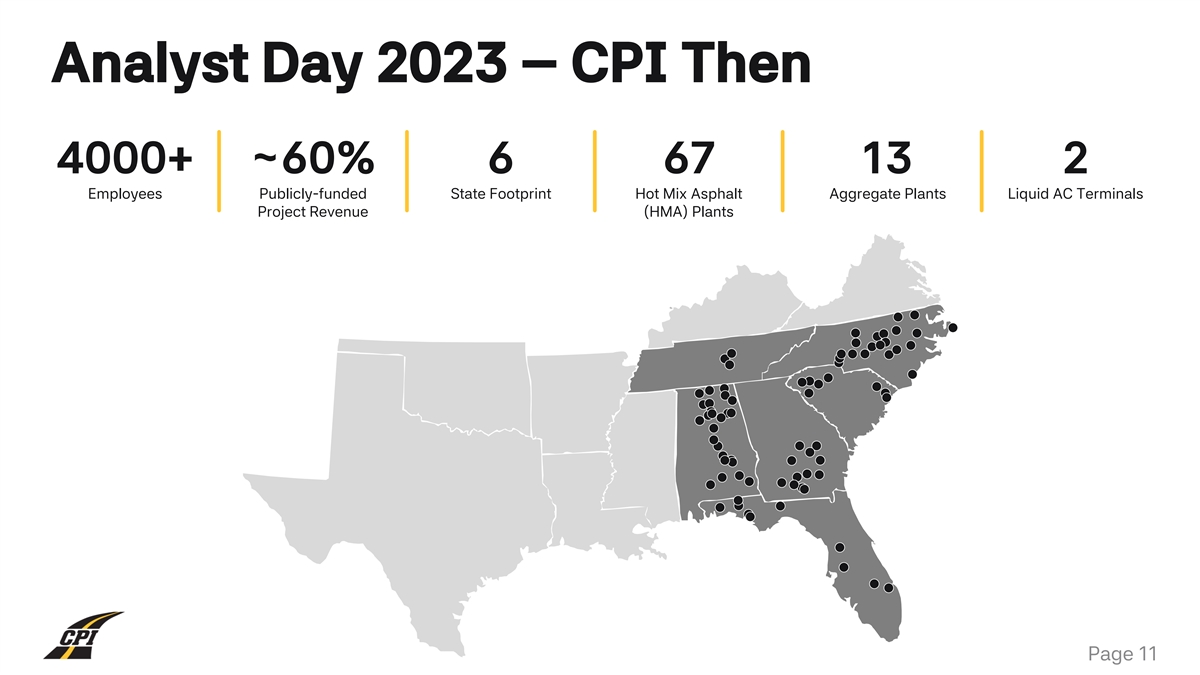
A6A6A6 Analyst Day 2023 – CPI Then 4000+ ~60% 6 67 13 2 272727
Employees Publicly-funded State Footprint Hot Mix Asphalt Aggregate Plants Liquid AC Terminals Project Revenue (HMA) Plants F5F4F1 F2F8FD 1F75B5 FFC734 Page 11
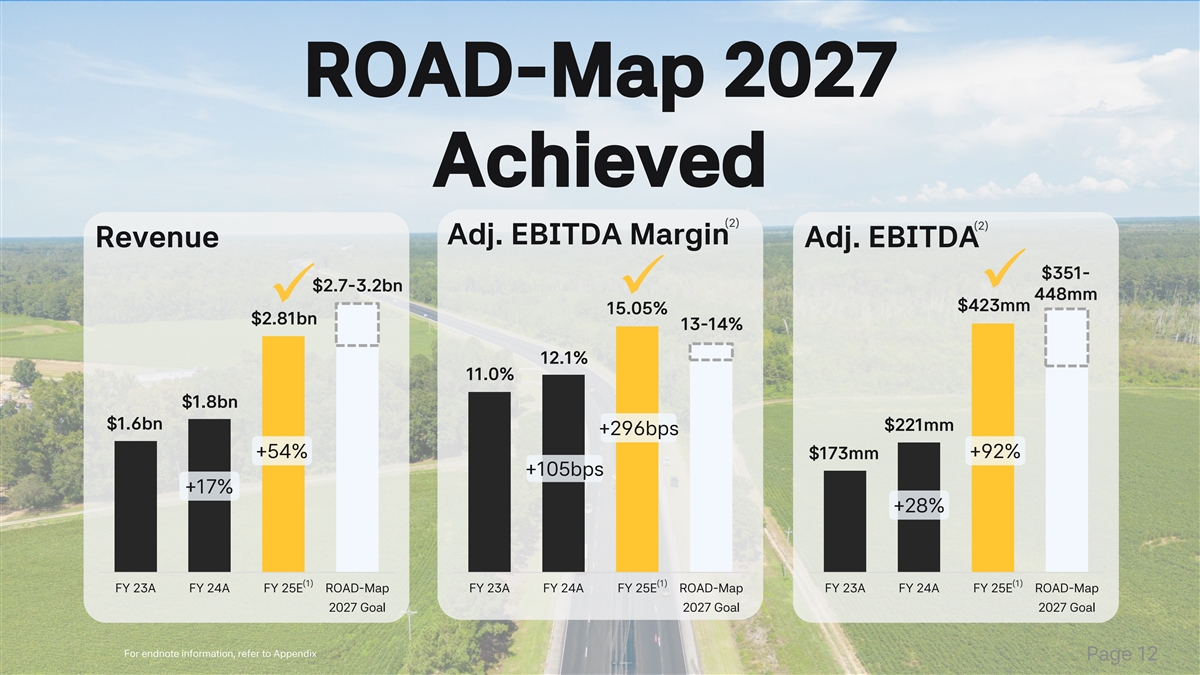
A6A6A6 ROAD-Map 2027 272727 Achieved (2) (2) Adj. EBITDA Margin Revenue
Adj. EBITDA F5F4F1 $351- $2.7-3.2bn ✓ . 448mm ✓ . ✓ . $423mm 15.05% $2.81bn 13-14% 12.1% F2F8FD 11.0% $1.8bn $1.6bn $221mm +296bps +54% +92% $173mm +105bps 1F75B5 +17% +28% FFC734 (1) (1) (1) FY 23A FY 24A FY 25E ROAD-Map FY 23A
FY 24A FY 25E ROAD-Map FY 23A FY 24A FY 25E ROAD-Map 2027 Goal 2027 Goal 2027 Goal For endnote information, refer to Appendix Page 12

A6A6A6 272727 F5F4F1 F2F8FD 1F75B5 FFC734
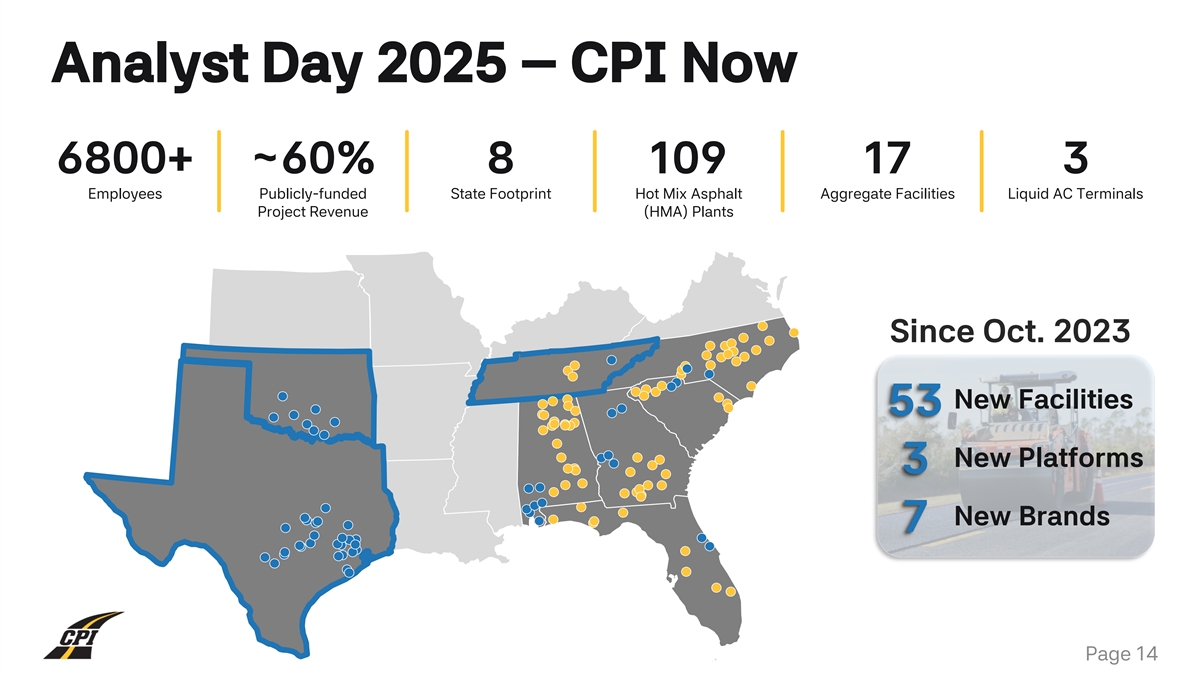
See “Facility Count Recon” File A6A6A6 Analyst Day 2025
– CPI Now 6800+ ~60% 8 109 17 3 272727 Employees Publicly-funded State Footprint Hot Mix Asphalt Aggregate Facilities Liquid AC Terminals Project Revenue (HMA) Plants F5F4F1 Since Oct. 2023 F2F8FD New Facilities 53 New Platforms 3 1F75B5 New
Brands 7 FFC734 Page 14 Atmore – double check numbers
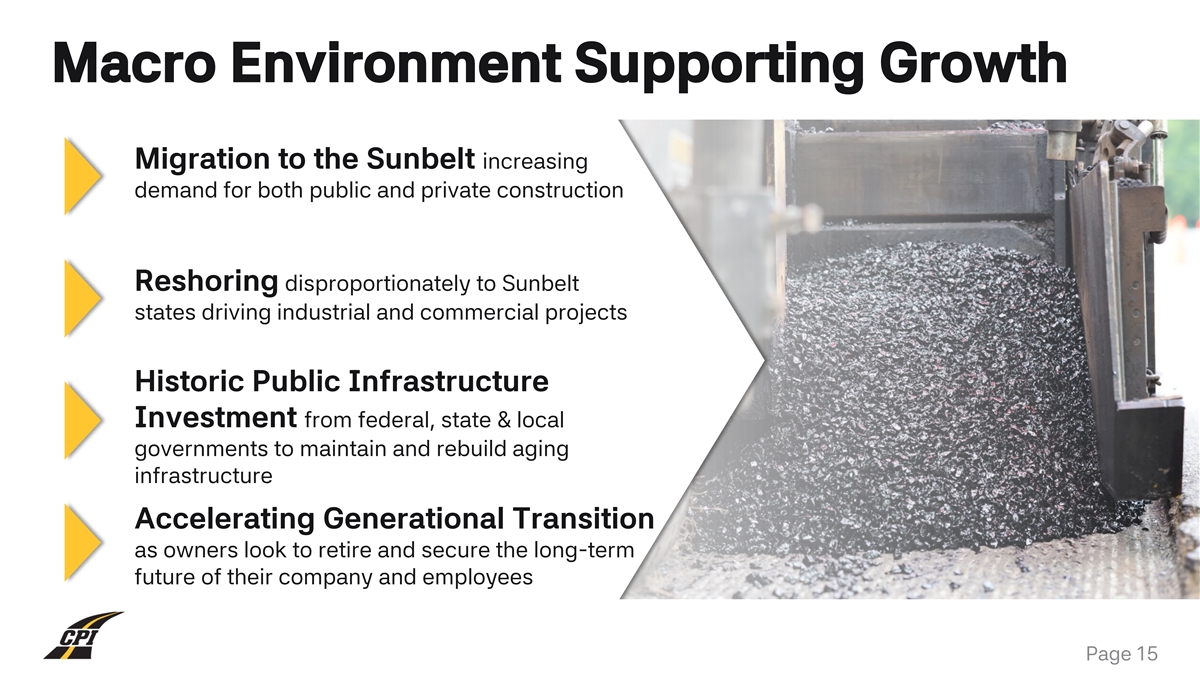
A6A6A6 Macro Environment Supporting Growth Migration to the Sunbelt
increasing 272727 demand for both public and private construction F5F4F1 Reshoring disproportionately to Sunbelt states driving industrial and commercial projects F2F8FD Historic Public Infrastructure Investment from federal, state & local
governments to maintain and rebuild aging 1F75B5 infrastructure Accelerating Generational Transition as owners look to retire and secure the long-term FFC734 future of their company and employees Page 15
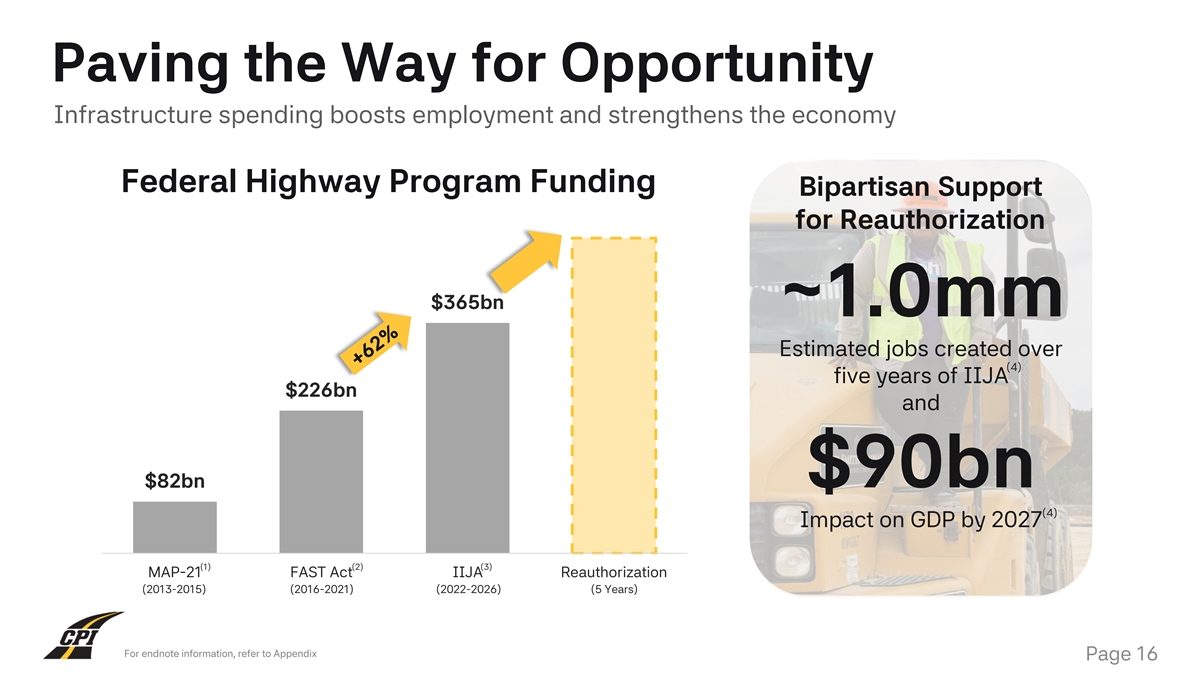
A6A6A6 Paving the Way for Opportunity Infrastructure spending boosts
employment and strengthens the economy 272727 Federal Highway Program Funding Bipartisan Support for Reauthorization F5F4F1 $365bn ~1.0mm Estimated jobs created over (4) F2F8FD five years of IIJA $226bn and 1F75B5 $82bn $90bn (4) Impact on GDP by
2027 (1) (2) (3) MAP-21 FAST Act IIJA Reauthorization FFC734 (2013-2015) (2016-2021) (2022-2026) (5 Years) For endnote information, refer to Appendix Page 16
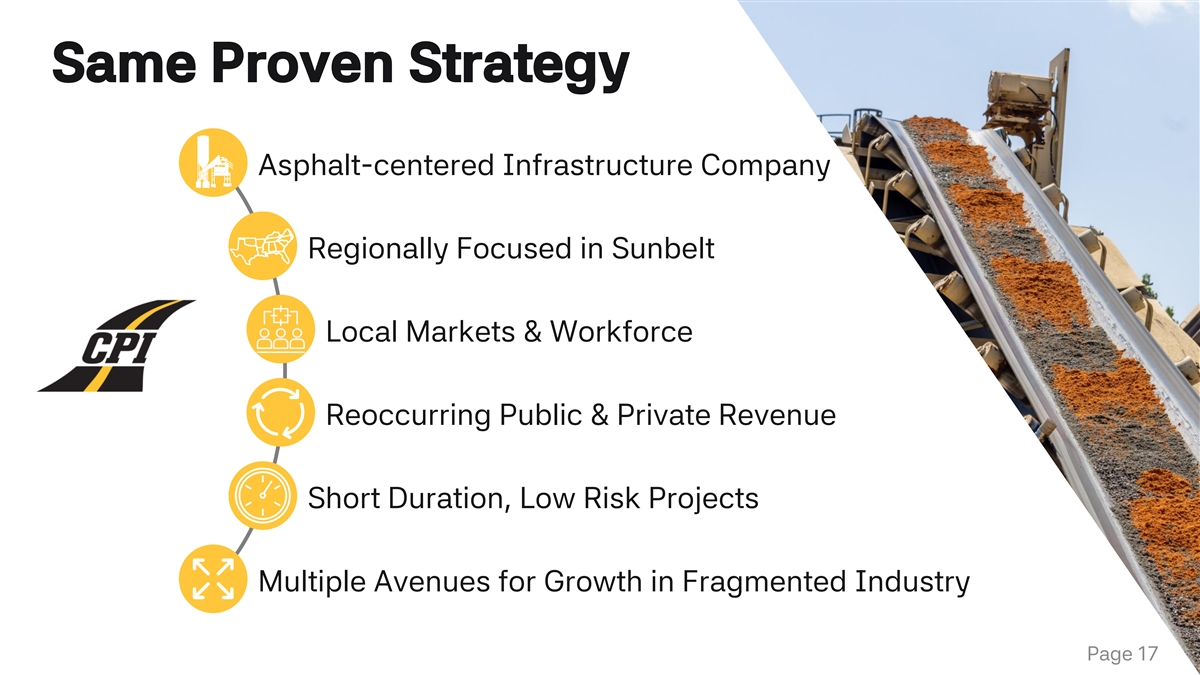
A6A6A6 Same Proven Strategy Asphalt-centered Infrastructure Company
272727 Regionally Focused in Sunbelt F5F4F1 Local Markets & Workforce F2F8FD Reoccurring Public & Private Revenue 1F75B5 Short Duration, Low Risk Projects FFC734 Multiple Avenues for Growth in Fragmented Industry Page 17
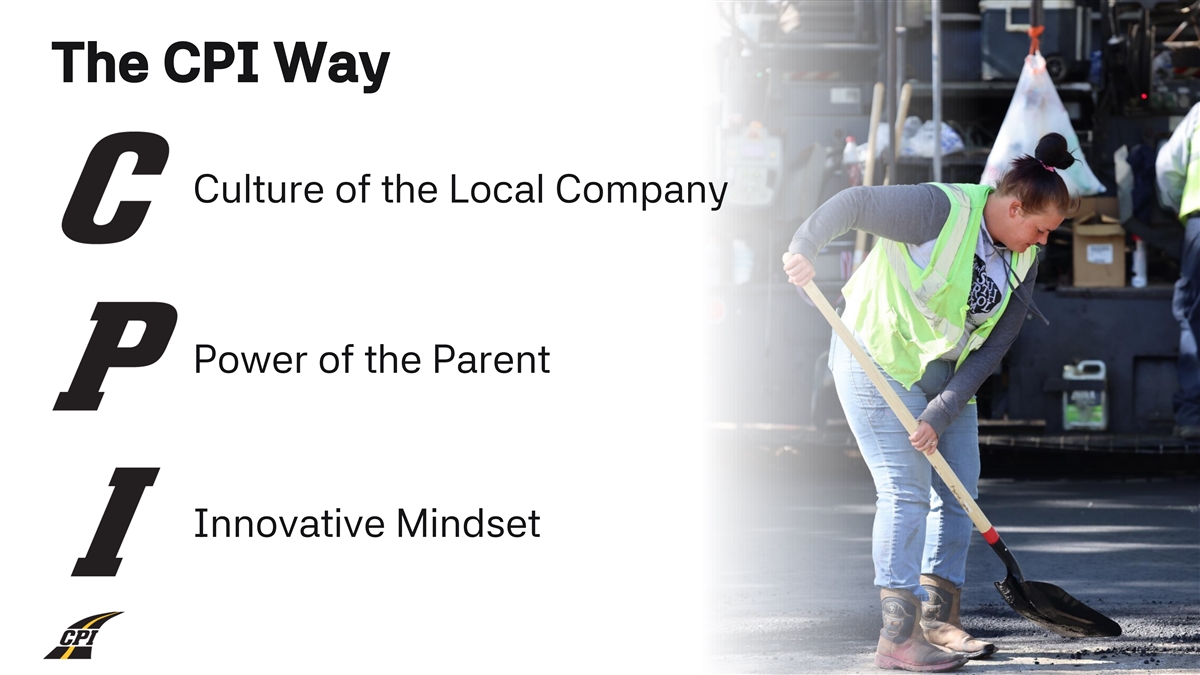
A6A6A6 The CPI Way 272727 Culture of the Local Company F5F4F1 Power of
the Parent F2F8FD 1F75B5 Innovative Mindset FFC734 Page 18
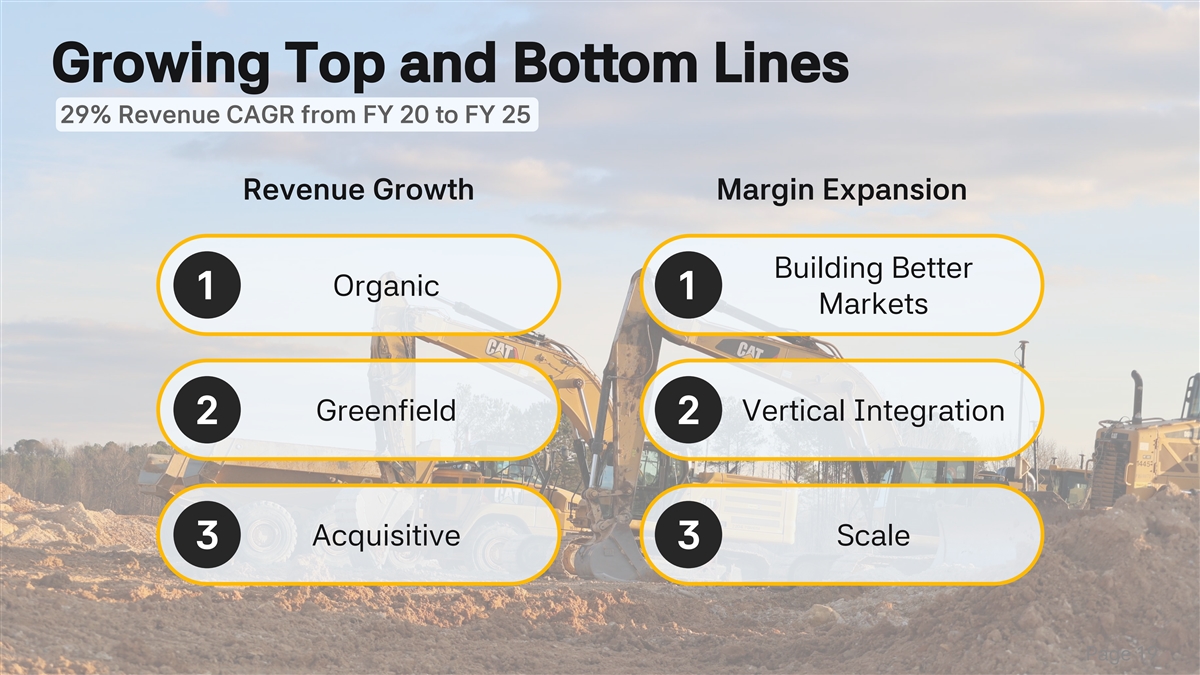
A6A6A6 Growing Top and Bottom Lines 29% Revenue CAGR from FY 20 to FY
25 272727 Revenue Growth Margin Expansion Building Better F5F4F1 Organic 1 1 1 1 Markets F2F8FD Greenfield Vertical Integration 2 2 2 2 1F75B5 Acquisitive Scale 3 3 3 3 FFC734 Page 19
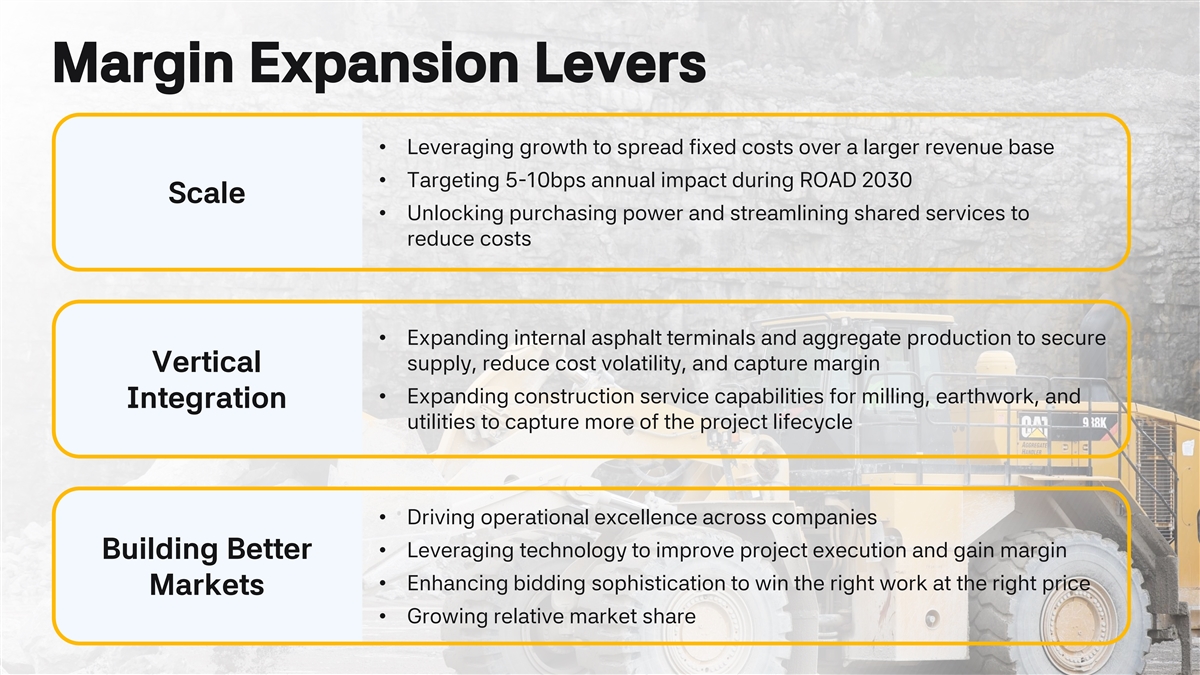
A6A6A6 Margin Expansion Levers • Leveraging growth to spread
fixed costs over a larger revenue base 272727 • Targeting 5-10bps annual impact during ROAD 2030 Scale • Unlocking purchasing power and streamlining shared services to reduce costs F5F4F1 • Expanding internal asphalt terminals and
aggregate production to secure supply, reduce cost volatility, and capture margin Vertical F2F8FD • Expanding construction service capabilities for milling, earthwork, and Integration utilities to capture more of the project lifecycle 1F75B5
• Driving operational excellence across companies • Leveraging technology to improve project execution and gain margin Building Better FFC734 • Enhancing bidding sophistication to win the right work at the right price Markets
• Growing relative market share Page 20
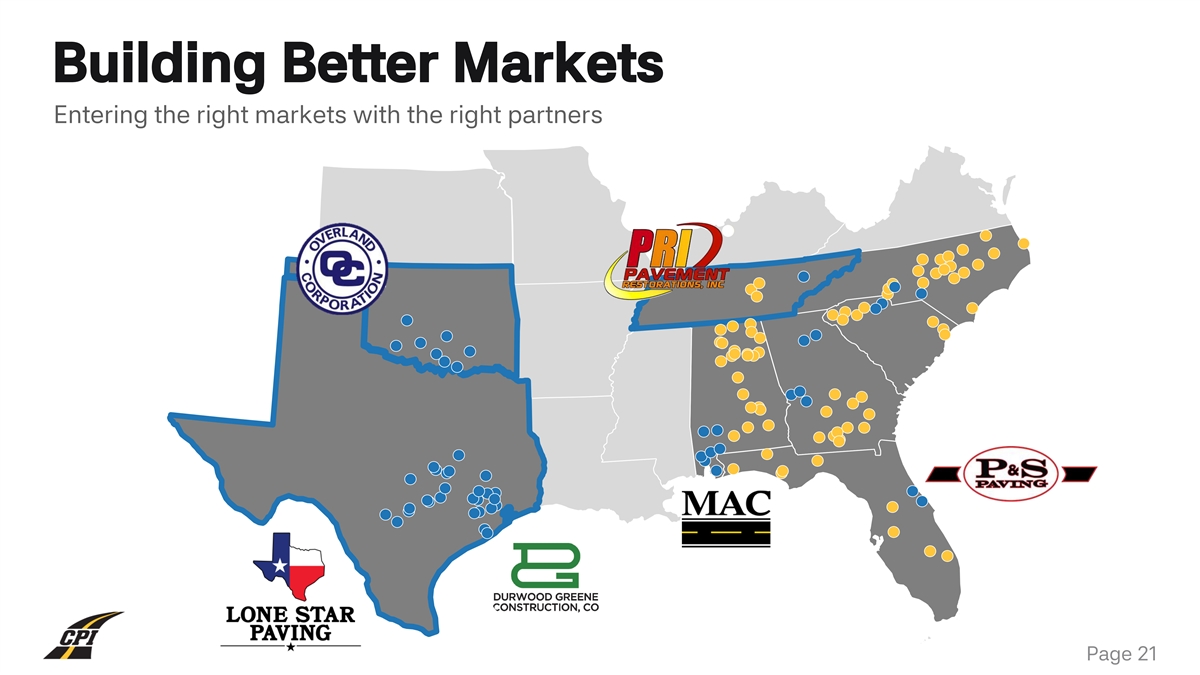
A6A6A6 Building Better Markets Entering the right markets with the
right partners 272727 F5F4F1 F2F8FD 1F75B5 FFC734 Page 21
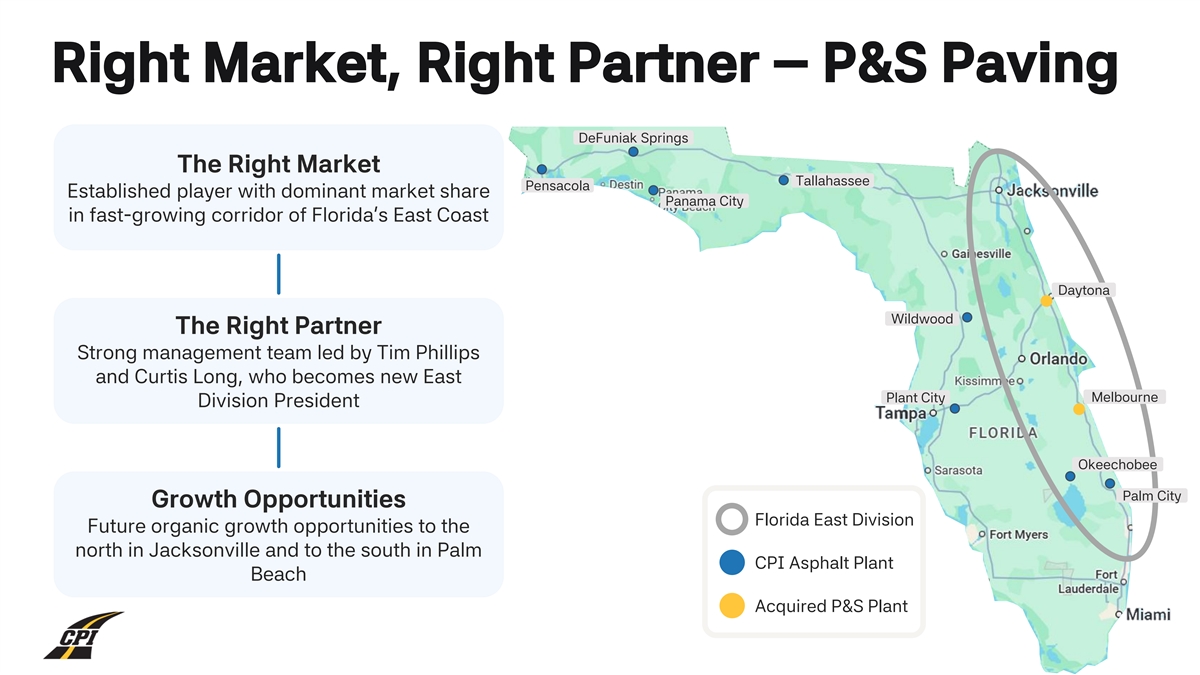
A6A6A6 Right Market, Right Partner – P&S Paving DeFuniak
Springs The Right Market 272727 Tallahassee Pensacola Established player with dominant market share Panama City in fast-growing corridor of Florida’s East Coast F5F4F1 Daytona Wildwood The Right Partner Strong management team led by Tim
Phillips F2F8FD and Curtis Long, who becomes new East Plant City Melbourne Division President Okeechobee 1F75B5 Palm City Growth Opportunities Florida East Division Future organic growth opportunities to the north in Jacksonville and to the south in
Palm CPI Asphalt Plant FFC734 Beach Acquired P&S Plant Page 22
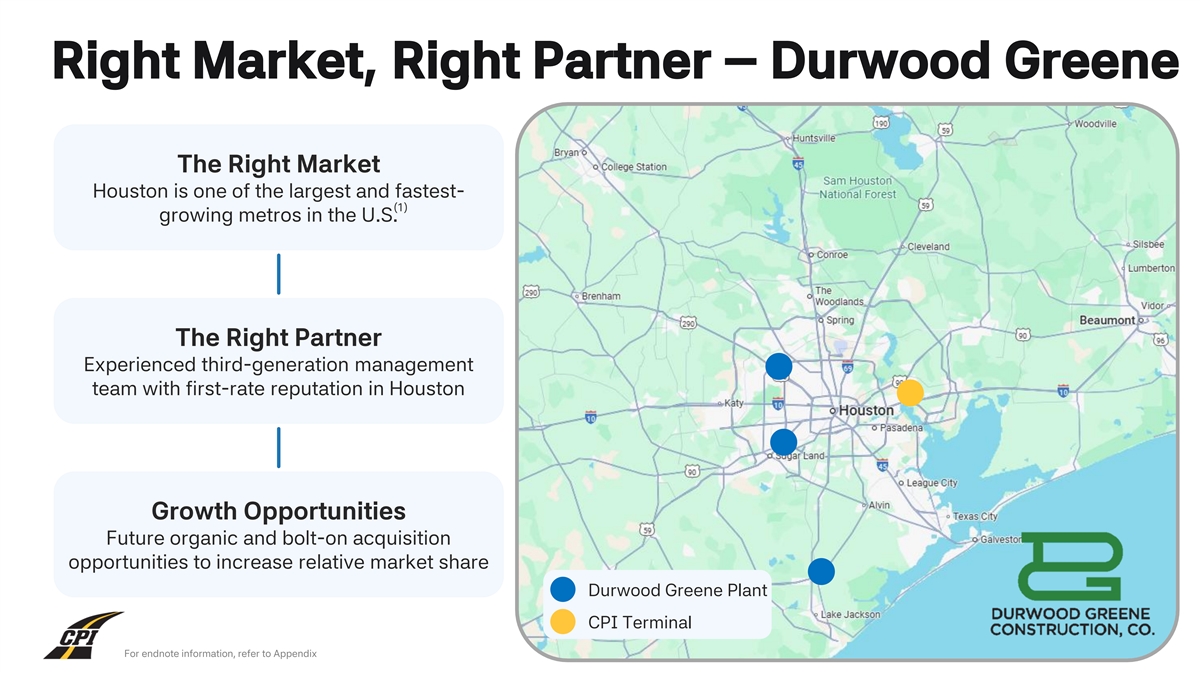
Right Market, Right Partner – Durwood Greene A6A6A6 The Right
Market 272727 Houston is one of the largest and fastest- (1) growing metros in the U.S. F5F4F1 The Right Partner Experienced third-generation management F2F8FD team with first-rate reputation in Houston 1F75B5 Growth Opportunities Future organic and
bolt-on acquisition opportunities to increase relative market share FFC734 Acqui Dre urd woo DG d Plan Gretene Plant LSP Ter CPI min Ter al minal For endnote information, refer to Appendix Page 23
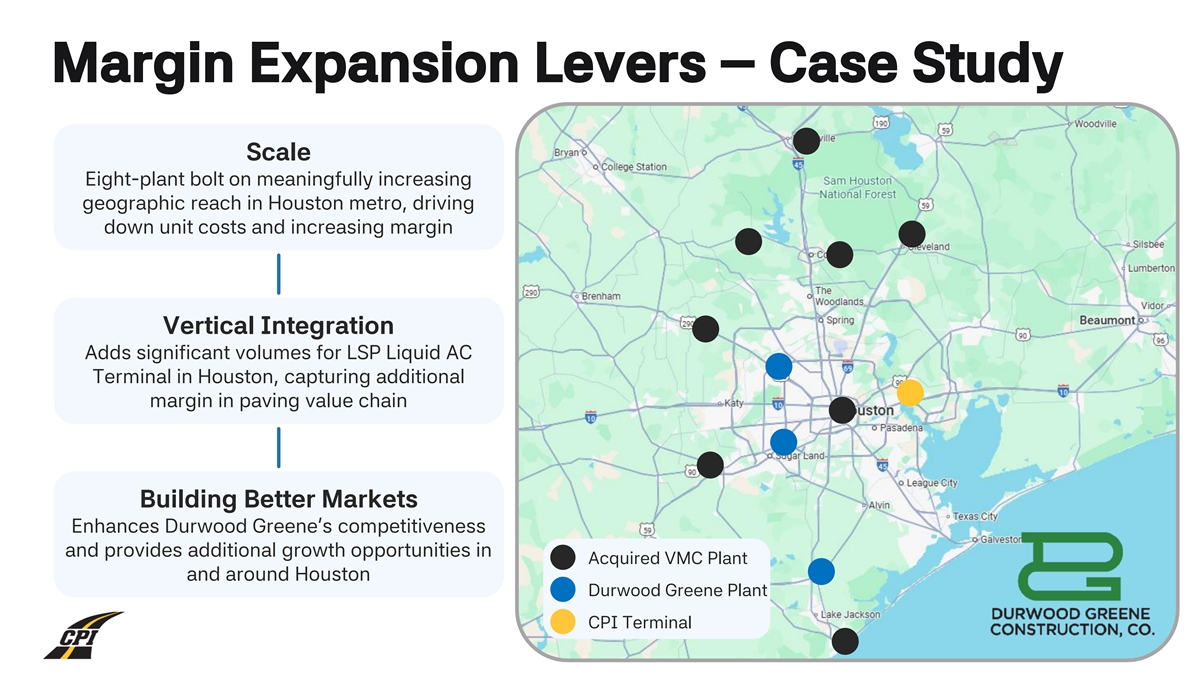
A6A6A6 Margin Expansion Levers – Case Study Scale 272727
Eight-plant bolt on meaningfully increasing geographic reach in Houston metro, driving down unit costs and increasing margin F5F4F1 Vertical Integration Adds significant volumes for LSP Liquid AC F2F8FD Terminal in Houston, capturing additional
margin in paving value chain 1F75B5 Building Better Markets Enhances Durwood Greene’s competitiveness and provides additional growth opportunities in Acquired VMC Plant FFC734 and around Houston Durwood Greene Plant CPI Terminal Page
24
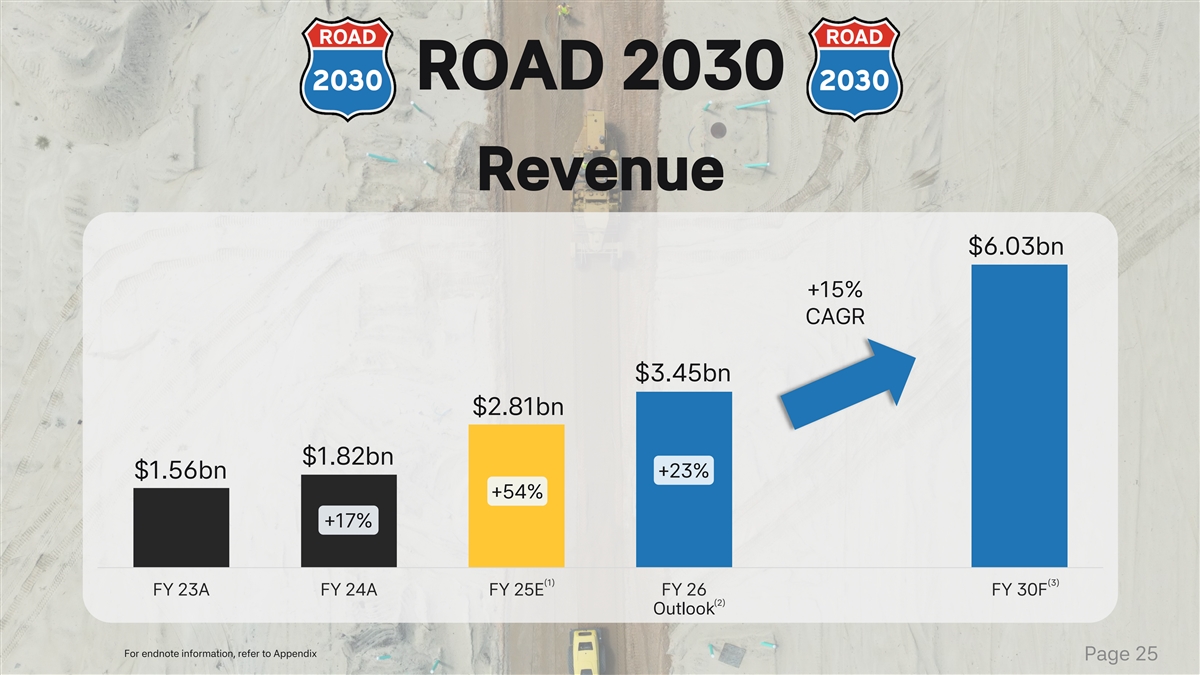
A6A6A6 ROAD 2030 272727 Revenue $6.03bn F5F4F1 +15% CAGR F2F8FD $3.45bn
$2.81bn $1.82bn +23% 1F75B5 $1.56bn +54% +17% FFC734 (1) (3) FY 23A FY 24A FY 25E FY 26 FY 30F (2) Outlook For endnote information, refer to Appendix Page 25 Page 25
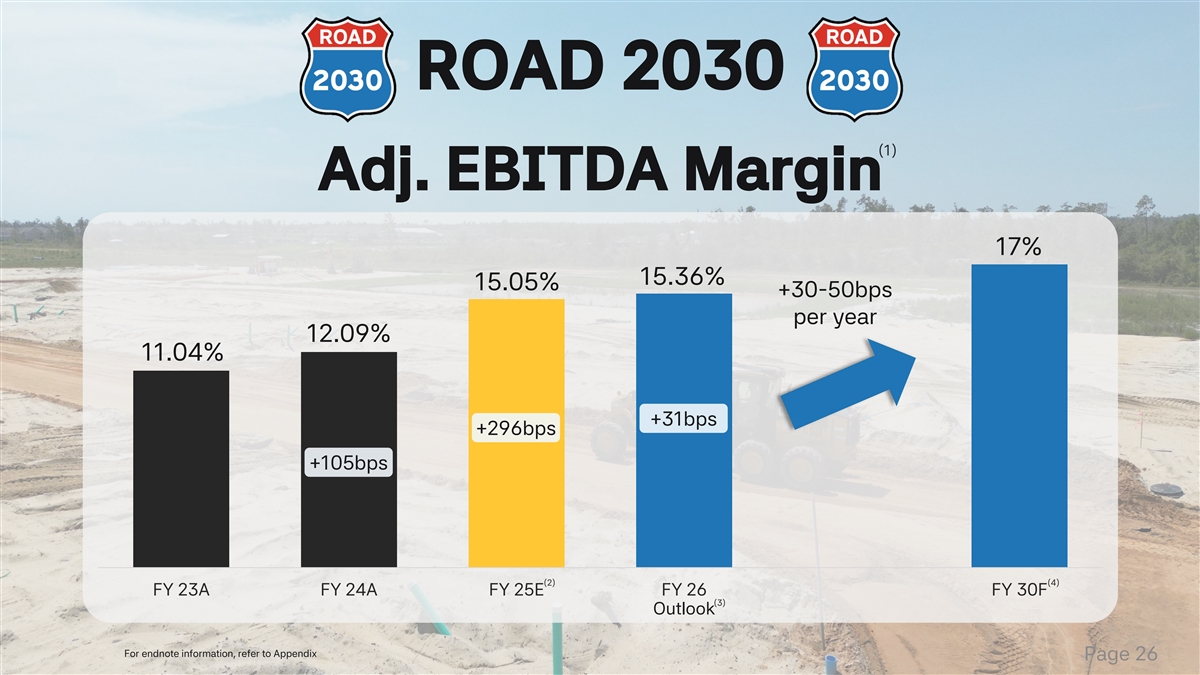
A6A6A6 ROAD 2030 (1) 272727 Adj. EBITDA Margin 17% F5F4F1 15.36% 15.05%
+30-50bps per year 12.09% 11.04% F2F8FD +31bps +296bps +105bps 1F75B5 FFC734 (2) (4) FY 23A FY 24A FY 25E FY 26 FY 30F (3) Outlook For endnote information, refer to Appendix Page 26
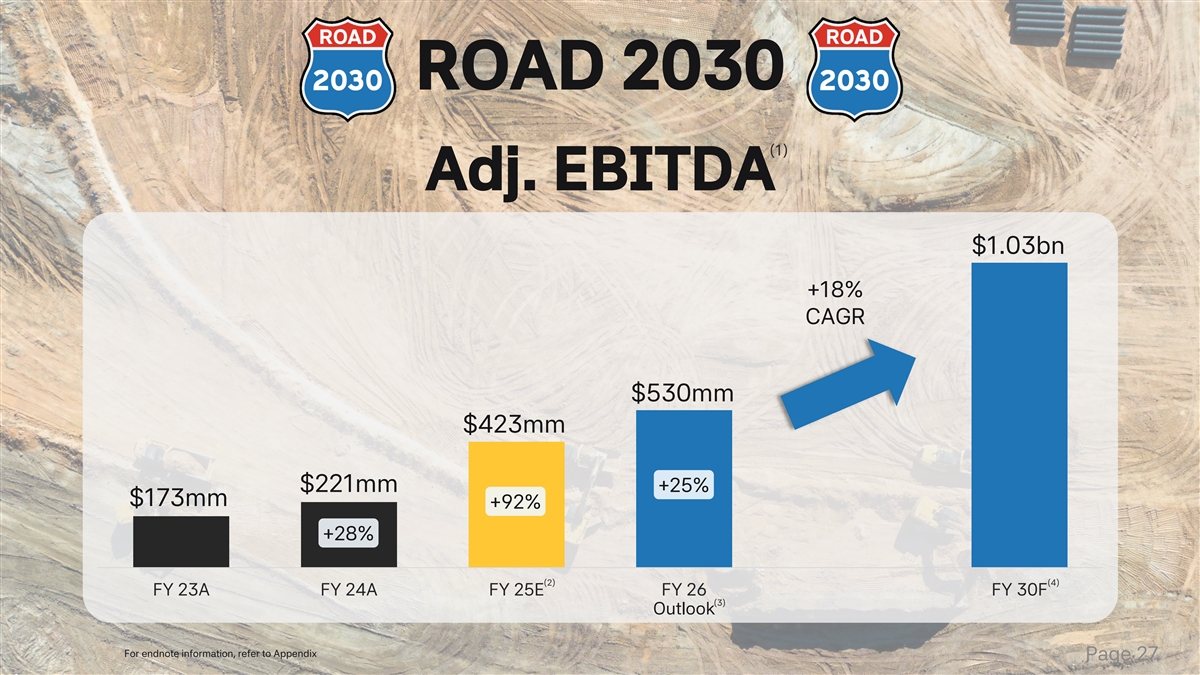
A6A6A6 ROAD 2030 (1) 272727 Adj. EBITDA $1.03bn F5F4F1 +18% CAGR F2F8FD
$530mm $423mm 1F75B5 $221mm +25% $173mm +92% +28% FFC734 (2) (4) FY 23A FY 24A FY 25E FY 26 FY 30F (3) Outlook For endnote information, refer to Appendix Page 27
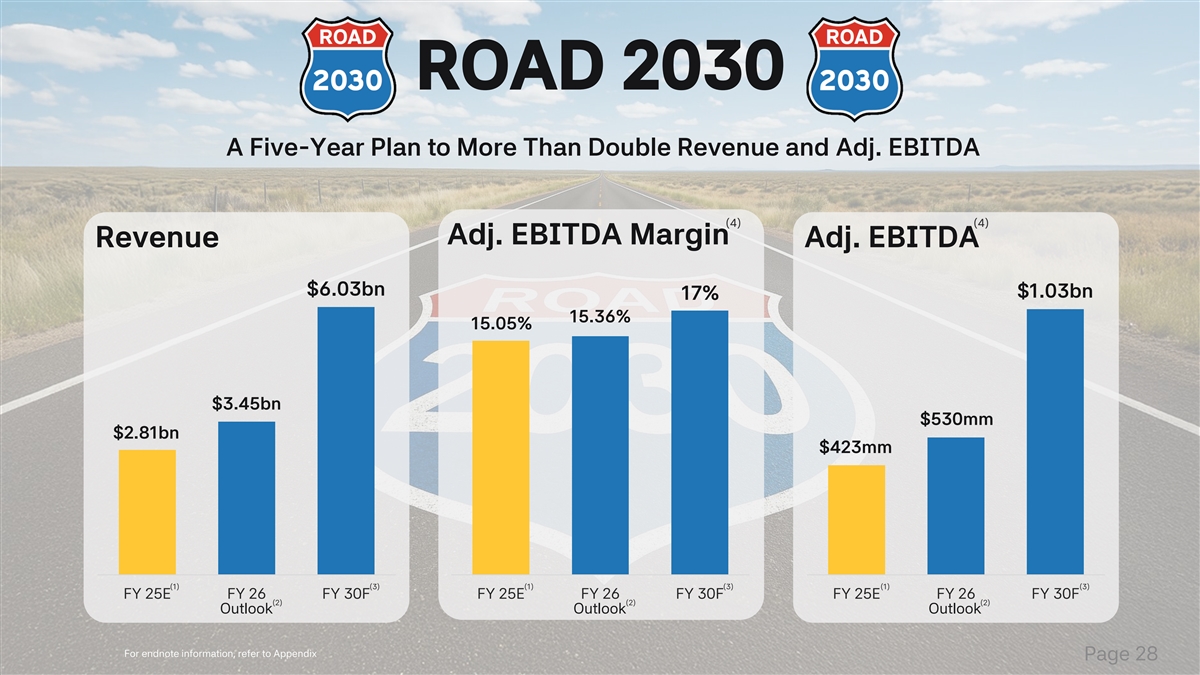
A6A6A6 ROAD 2030 A Five-Year Plan to More Than Double Revenue and Adj.
EBITDA 272727 (4) (4) Adj. EBITDA Margin Revenue Adj. EBITDA F5F4F1 $6.03bn $1.03bn 17% 15.36% 15.05% F2F8FD $3.45bn $530mm $2.81bn $423mm 1F75B5 FFC734 (1) (3) (1) (3) (1) (3) FY 25E FY 26 FY 30F FY 25E FY 26 FY 30F FY 25E FY 26 FY 30F (2) (2) (2)
Outlook Outlook Outlook For endnote information, refer to Appendix Page 28
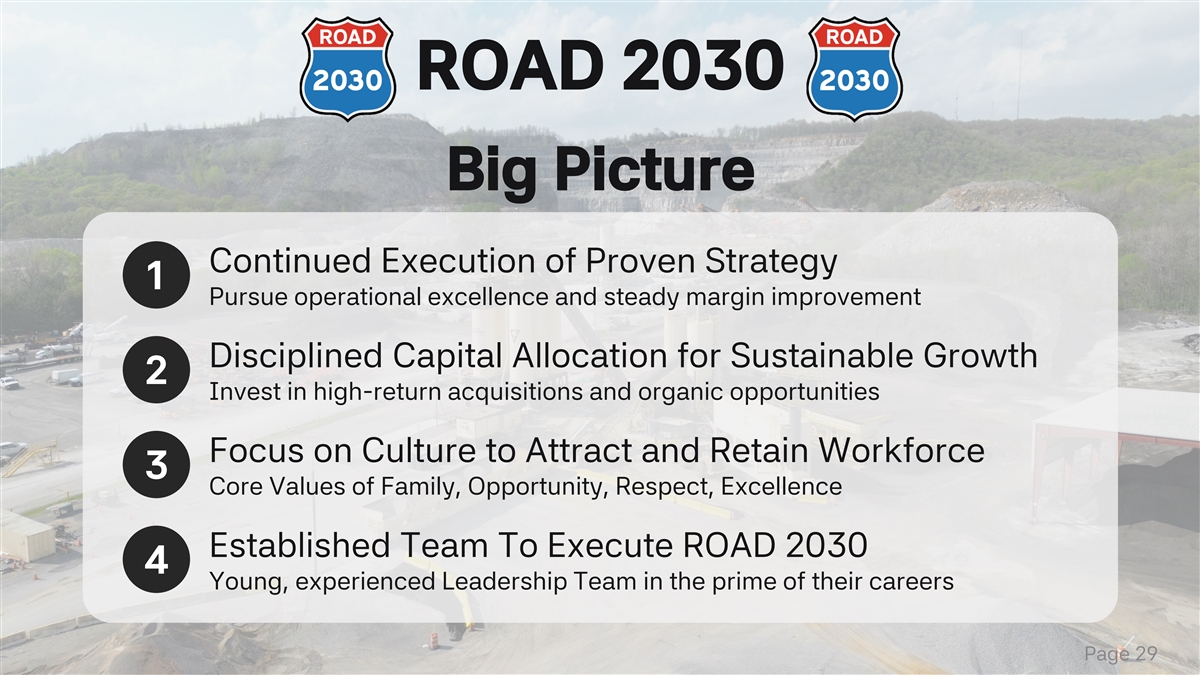
A6A6A6 ROAD 2030 272727 Big Picture Continued Execution of Proven
Strategy F5F4F1 1 Pursue operational excellence and steady margin improvement Disciplined Capital Allocation for Sustainable Growth F2F8FD 2 Invest in high-return acquisitions and organic opportunities Focus on Culture to Attract and Retain
Workforce 1F75B5 3 Core Values of Family, Opportunity, Respect, Excellence Established Team To Execute ROAD 2030 4 FFC734 Young, experienced Leadership Team in the prime of their careers Page 29
A6A6A6 Strong 272727 Foundations for Check crop on picture F5F4F1
Sustained Growth F2F8FD Greg Hoffman 1F75B5 Chief Financial Officer FFC734
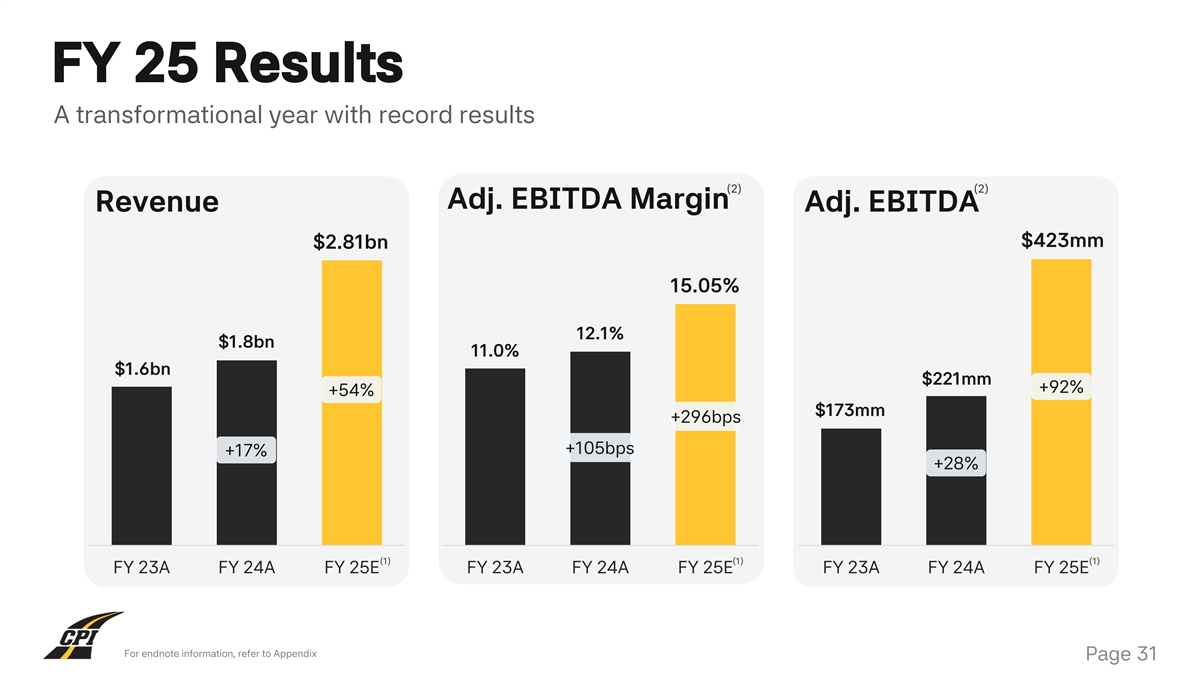
A6A6A6 FY 25 Results A transformational year with record results 272727
(2) (2) Adj. EBITDA Margin Revenue Adj. EBITDA $423mm $2.81bn F5F4F1 15.05% 12.1% $1.8bn 11.0% $1.6bn F2F8FD $221mm +92% +54% $173mm +296bps +105bps +17% +28% 1F75B5 (1) (1) (1) FY 23A FY 24A FY 25E FY 23A FY 24A FY 25E FY 23A FY 24A FY 25E FFC734
For endnote information, refer to Appendix Page 31
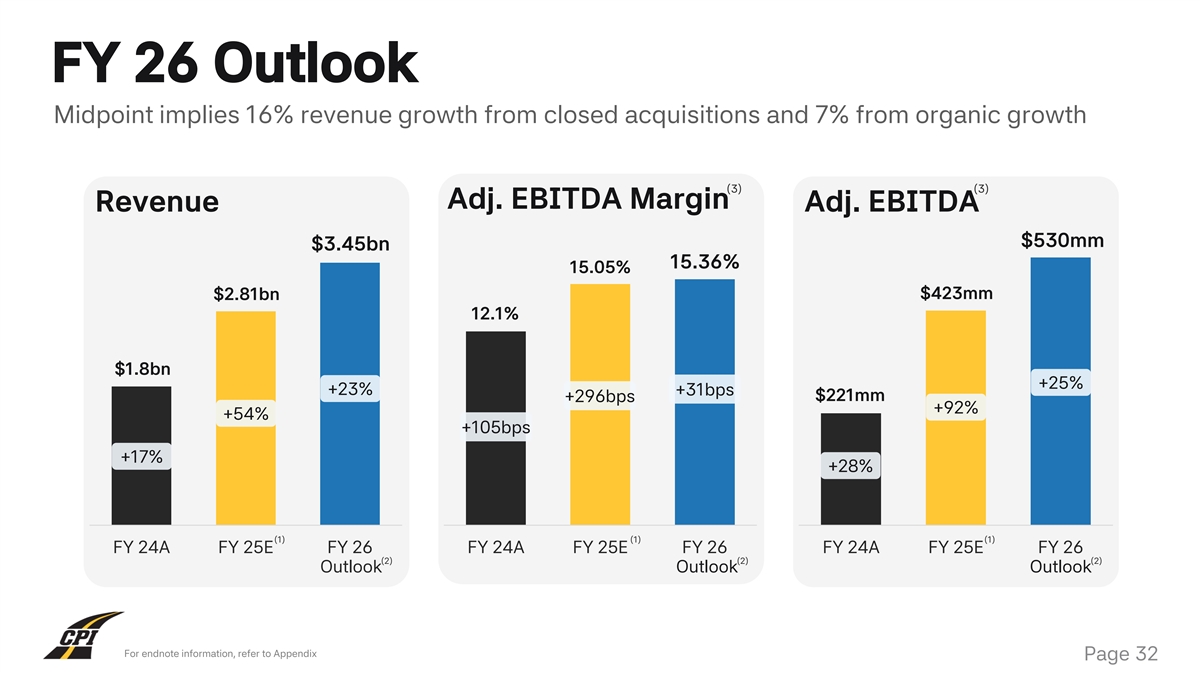
A6A6A6 FY 26 Outlook Midpoint implies 16% revenue growth from closed
acquisitions and 7% from organic growth 272727 (3) (3) Adj. EBITDA Margin Revenue Adj. EBITDA $530mm $3.45bn 15.36% 15.05% F5F4F1 $423mm $2.81bn 12.1% $1.8bn F2F8FD +25% +23% +31bps $221mm +296bps +92% +54% +105bps +17% +28% 1F75B5 (1) (1) (1) FY
24A FY 25E FY 26 FY 24A FY 25E FY 26 FY 24A FY 25E FY 26 (2) (2) (2) Outlook Outlook Outlook FFC734 For endnote information, refer to Appendix Page 32
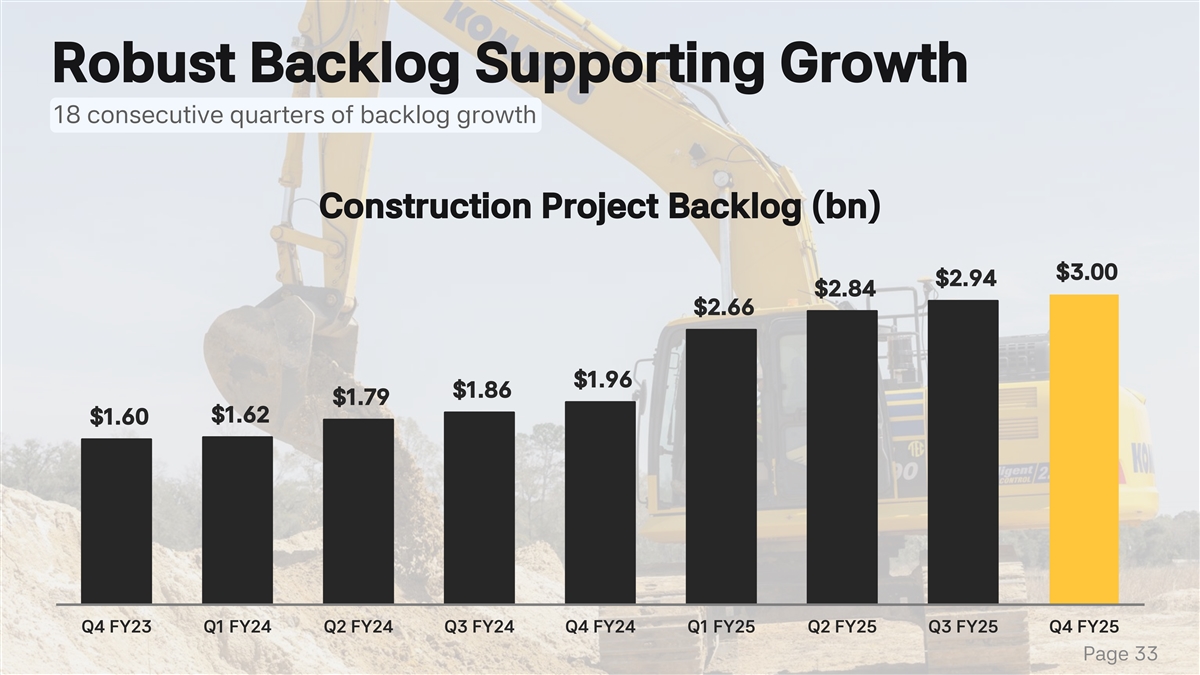
A6A6A6 Robust Backlog Supporting Growth 18 consecutive quarters of
backlog growth 272727 Construction Project Backlog (bn) F5F4F1 $3.00 $2.94 $2.84 $2.66 F2F8FD $1.96 $1.86 $1.79 $1.62 $1.60 1F75B5 FFC734 Q4 FY23 Q1 FY24 Q2 FY24 Q3 FY24 Q4 FY24 Q1 FY25 Q2 FY25 Q3 FY25 Q4 FY25 Page 33
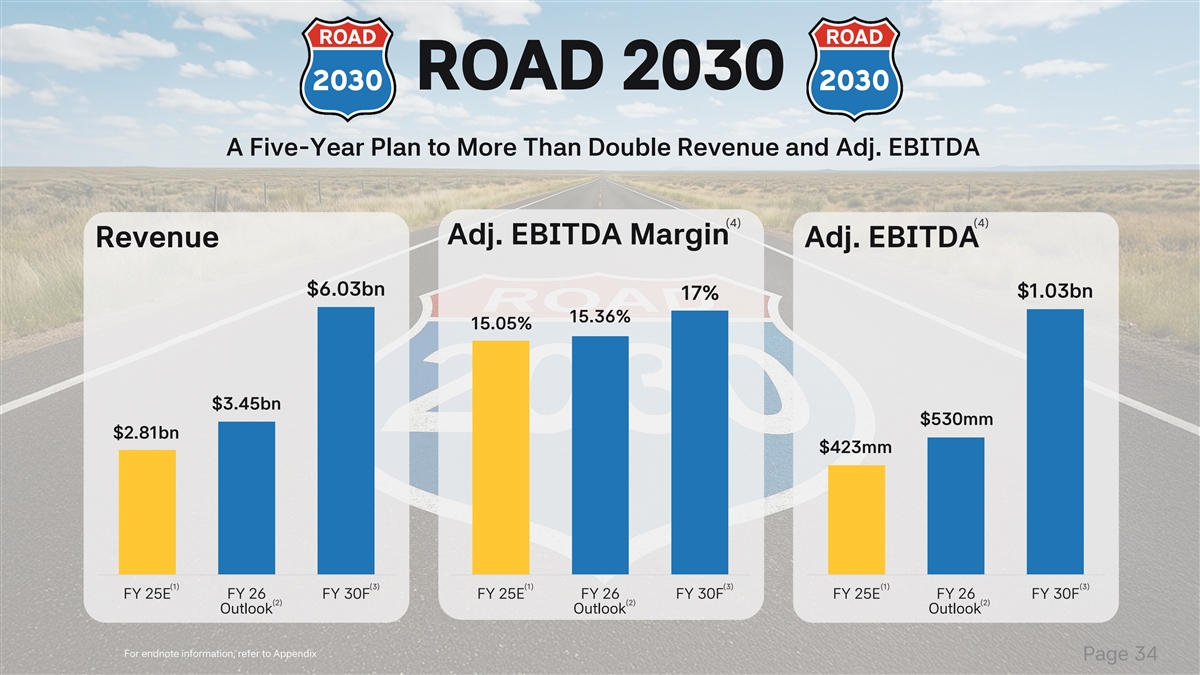
A6A6A6 ROAD 2030 A Five-Year Plan to More Than Double Revenue and Adj.
EBITDA 272727 (4) (4) Adj. EBITDA Margin Revenue Adj. EBITDA F5F4F1 $6.03bn $1.03bn 17% 15.36% 15.05% F2F8FD $3.45bn $530mm $2.81bn $423mm 1F75B5 FFC734 (1) (3) (1) (3) (1) (3) FY 25E FY 26 FY 30F FY 25E FY 26 FY 30F FY 25E FY 26 FY 30F (2) (2) (2)
Outlook Outlook Outlook For endnote information, refer to Appendix Page 34
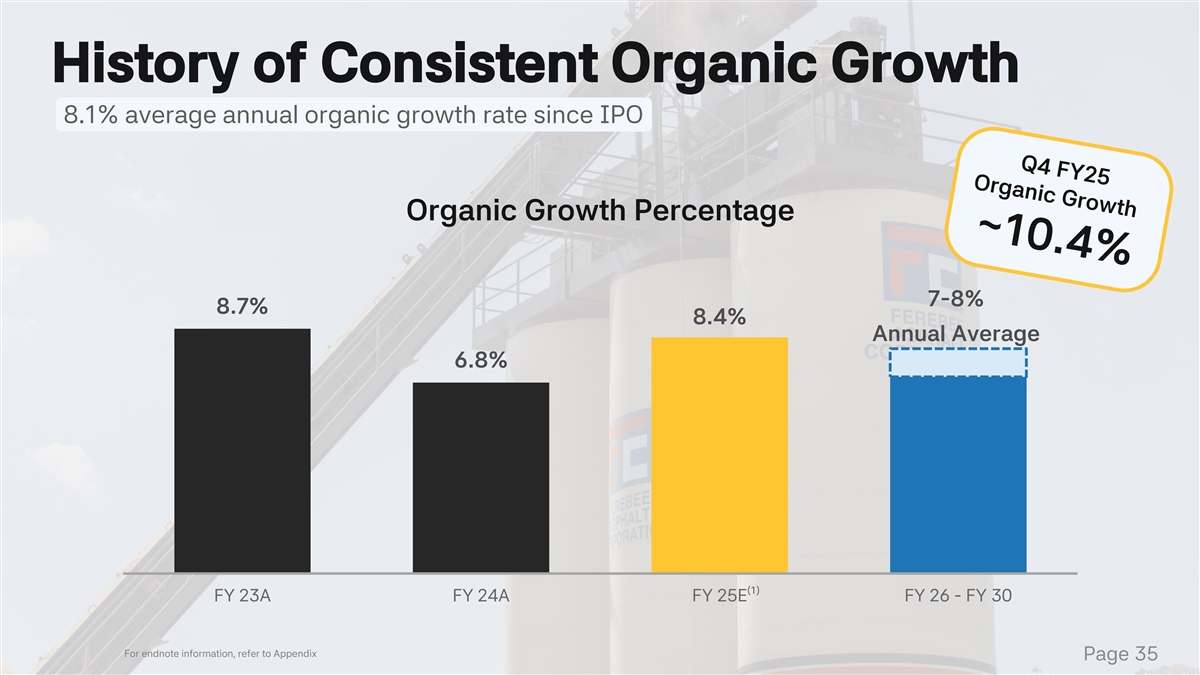
A6A6A6 History of Consistent Organic Growth 8.1% average annual organic
growth rate since IPO 272727 Organic Growth Percentage F5F4F1 7-8% 8.7% 8.4% Annual Average 6.8% F2F8FD 1F75B5 FFC734 (1) FY 23A FY 24A FY 25E FY 26 - FY 30 For endnote information, refer to Appendix Page 35
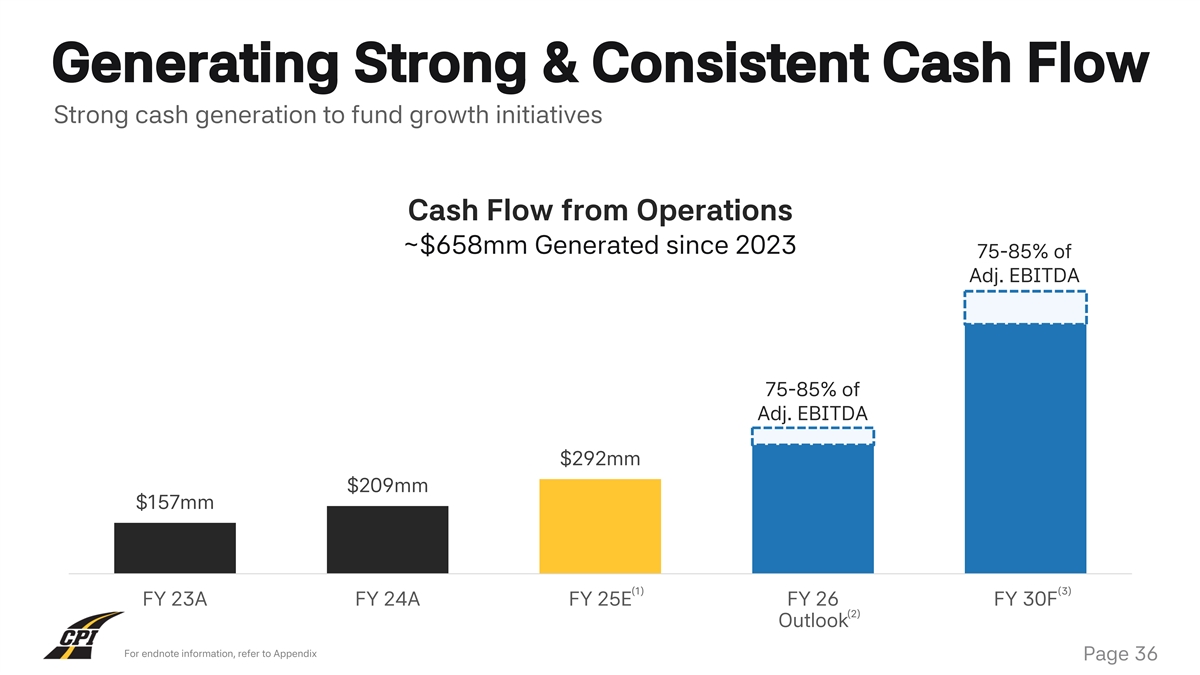
A6A6A6 Generating Strong & Consistent Cash Flow Strong cash
generation to fund growth initiatives 272727 Cash Flow from Operations ~$658mm Generated since 2023 75-85% of F5F4F1 Adj. EBITDA F2F8FD 75-85% of Adj. EBITDA $292mm 1F75B5 $209mm $157mm FFC734 (1) (3) FY 23A FY 24A FY 25E FY 26 FY 30F (2) Outlook
For endnote information, refer to Appendix Page 36
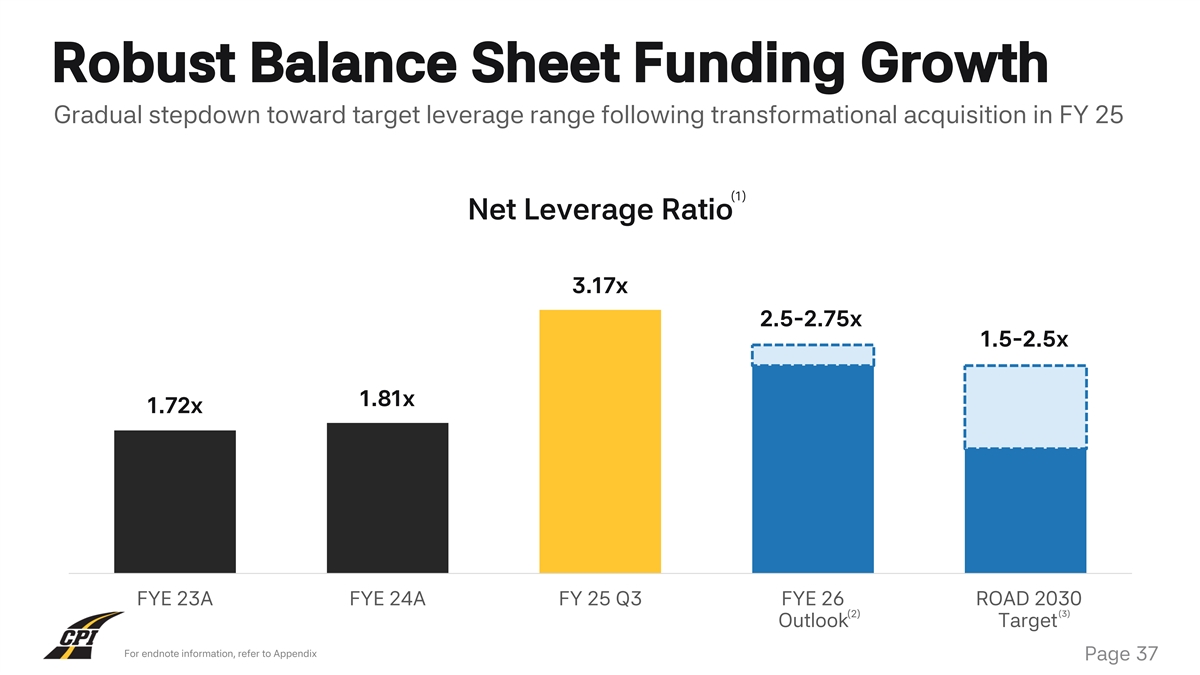
A6A6A6 Robust Balance Sheet Funding Growth Gradual stepdown toward
target leverage range following transformational acquisition in FY 25 272727 (1) Net Leverage Ratio F5F4F1 3.17x 2.5-2.75x 1.5-2.5x F2F8FD 1.81x 1.72x 1F75B5 FFC734 FYE 23A FYE 24A FY 25 Q3 FYE 26 ROAD 203 FYE 30F 0 (2) (3) Outlook Target For
endnote information, refer to Appendix Page 37
A6A6A6 272727 F5F4F1 Break F2F8FD 1F75B5 FFC734 Page 38

A6A6A6 The Route to 272727 ROAD 2030 F5F4F1 F2F8FD Nelson Fleming SVP
of Strategy & Business 1F75B5 Development FFC734
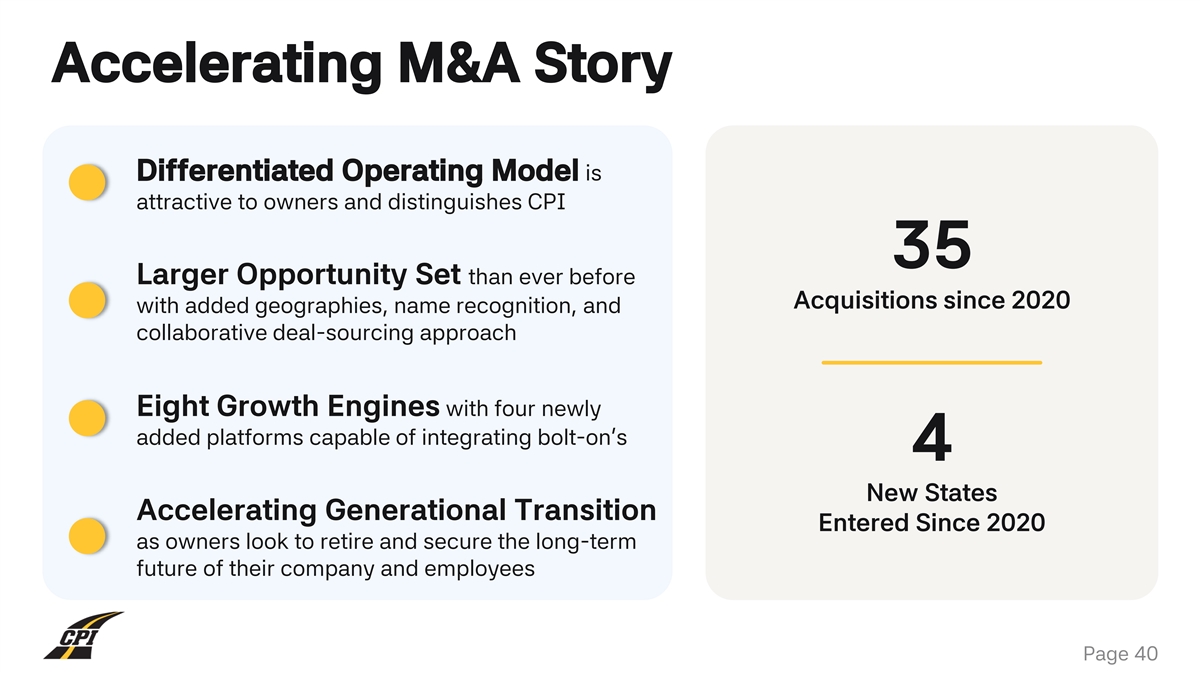
A6A6A6 Accelerating M&A Story 272727 Differentiated Operating Model
is attractive to owners and distinguishes CPI 35 F5F4F1 Larger Opportunity Set than ever before Acquisitions since 2020 with added geographies, name recognition, and collaborative deal-sourcing approach F2F8FD Eight Growth Engines with four newly
added platforms capable of integrating bolt-on’s 4 1F75B5 New States Accelerating Generational Transition Entered Since 2020 as owners look to retire and secure the long-term future of their company and employees FFC734 Page 40
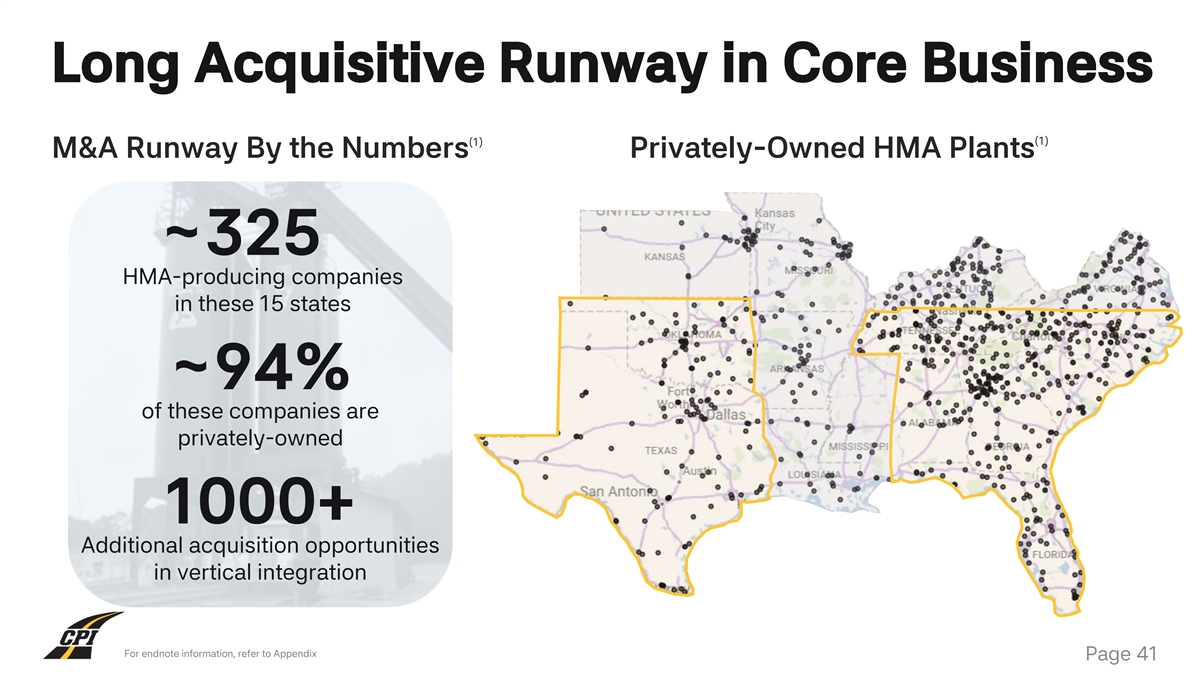
A6A6A6 Long Acquisitive Runway in Core Business (1) (1) M&A Runway
By the Numbers Privately-Owned HMA Plants 272727 ~325 1292 | Total Plants in All F5F4F1 HMA-producing companies States Shown in these 15 states 843 | Privately owned plants F2F8FD 303 | privately owned ~94% producer companies of these companies are
322 | total producer privately-owned companies 1F75B5 1000+ Additional acquisition opportunities FFC734 in vertical integration Make each point separate For endnote information, refer to Appendix Page 41 1) # that are private In CPI and adjacent
states... 2) # of private companies In CPI and adjacent states... Verbally mention 1000+ services integration companies ~94% of HMA-producer companies are privately-owned totaling ~300 HMA companies in these 15 states
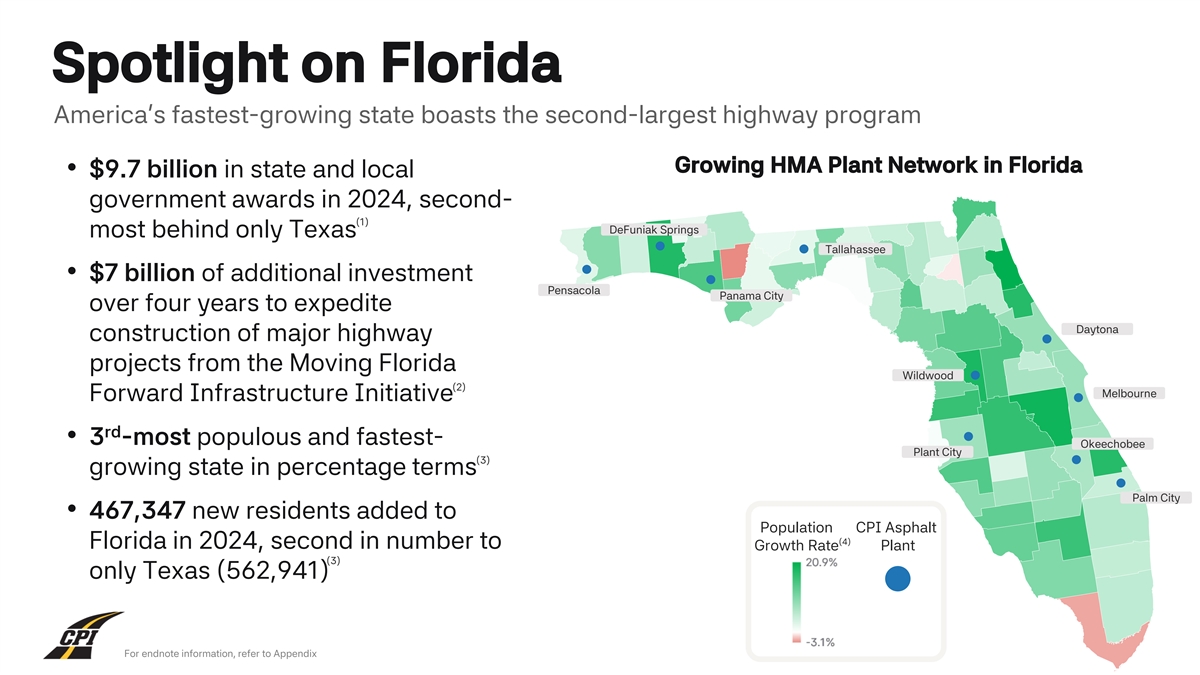
A6A6A6 Spotlight on Florida America’s fastest-growing state
boasts the second-largest highway program Growing HMA Plant Network in Florida • $9.7 billion in state and local 272727 • $9.9 billion in state and local government awards in 2024, second- government awards in 2024, third- (1) DeFuniak
Springs most behind only Texas most behind only Texas and California Tallahassee F5F4F1 • $7 billion of additional investment • $7 billion of additional investment to Pensacola Panama City over four years to expedite expedite
construction of major Daytona construction of major highway highway projects from the Moving projects from the Moving Florida Florida Forward Infrastructure F2F8FD Wildwood (2) Melbourne Forward Infrastructure Initiative Initiative rd rd • 3
-most populous and fastest- Okeechobee • 3 most populous and fastest- Plant City (3) growing state in percentage terms 1F75B5 growing state in percentage terms Palm City • 467,347 new residents added to • 467,347 new residents
added to Population CPI Asphalt (4) Florida in 2024, second in number to Growth Rate Plant Florida in 2024, second in number to (3) only Texas (562,941) FFC734 only Texas (562,941) For endnote information, refer to Appendix Page 42
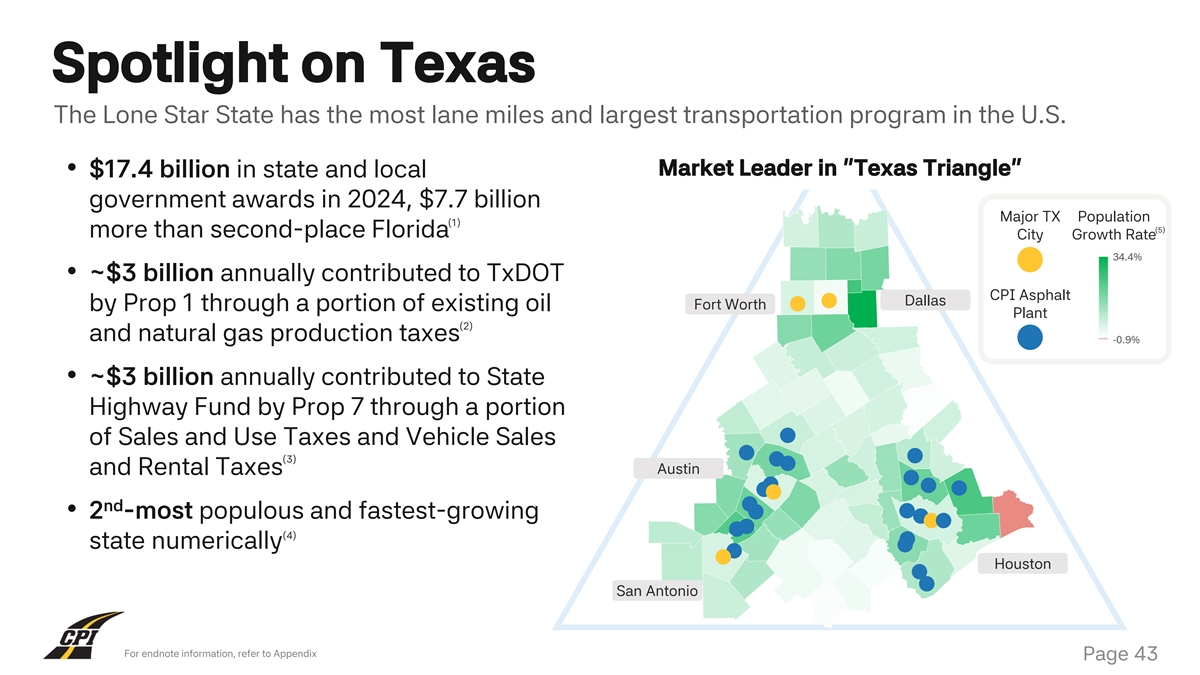
A6A6A6 Spotlight on Texas The Lone Star State has the most lane miles
and largest transportation program in the U.S. Market Leader in “Texas Triangle” • $17.4 billion in state and local 272727 government awards in 2024, $7.7 billion Major TX Population (1) (5) more than second-place Florida City
Growth Rate F5F4F1 • ~$3 billion annually contributed to TxDOT CPI Asphalt Dallas Fort Worth by Prop 1 through a portion of existing oil Plant (2) and natural gas production taxes F2F8FD • ~$3 billion annually contributed to State
Highway Fund by Prop 7 through a portion of Sales and Use Taxes and Vehicle Sales (3) Austin and Rental Taxes 1F75B5 nd • 2 -most populous and fastest-growing (4) state numerically Houston FFC734 San Antonio Powered by Bing © GeoNames,
TomTom For endnote information, refer to Appendix Page 43
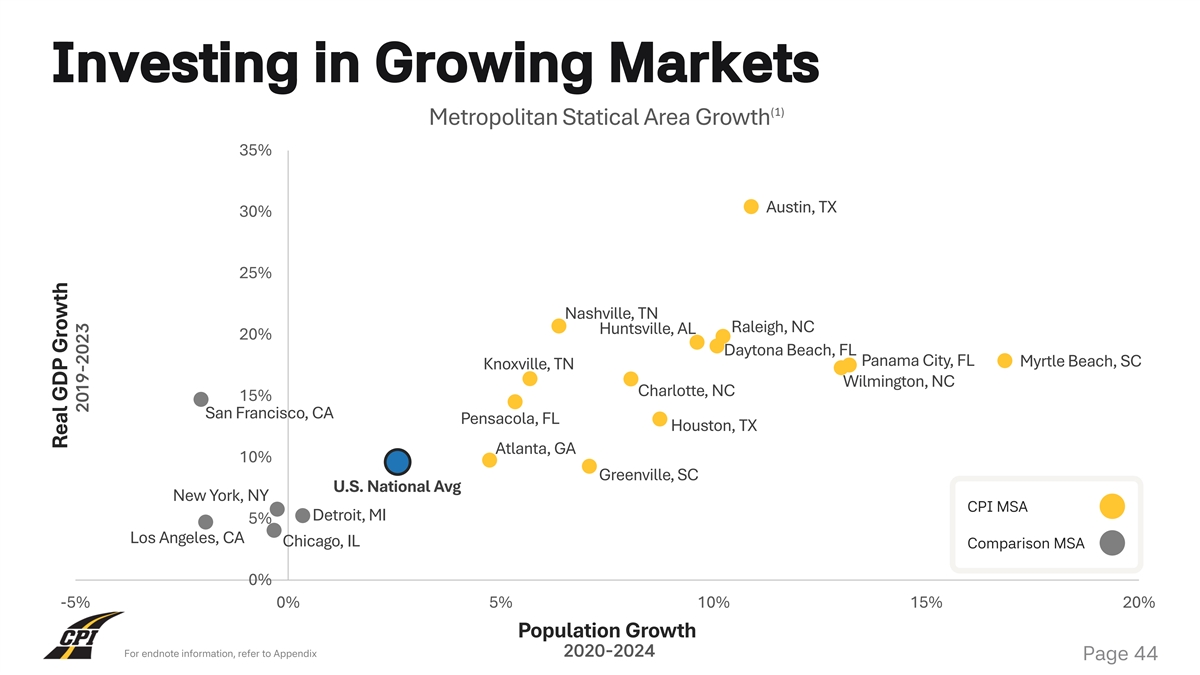
A6A6A6 Investing in Growing Markets (1) Metropolitan Statical Area
Growth 35% 272727 Austin, TX 30% F5F4F1 25% Nashville, TN Raleigh, NC Huntsville, AL 20% Daytona Beach, FL Panama City, FL Myrtle Beach, SC Knoxville, TN F2F8FD Wilmington, NC Charlotte, NC 15% San Francisco, CA Pensacola, FL Houston, TX Atlanta, GA
10% 1F75B5 Greenville, SC U.S. National Avg New York, NY CPI MSA Detroit, MI 5% Los Angeles, CA Chicago, IL Comparison MSA FFC734 0% -5% 0% 5% 10% 15% 20% Population Growth For endnote information, refer to Appendix 2020-2024 Page 44 Real GDP Growth
2019-2023
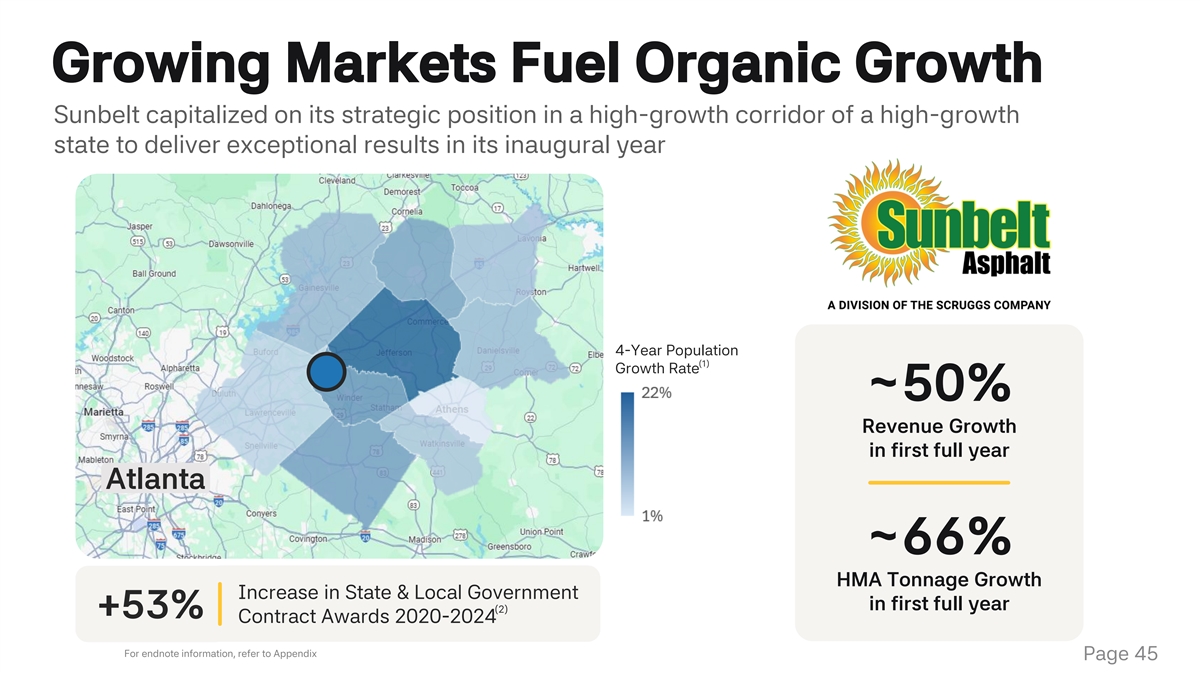
A6A6A6 Growing Markets Fuel Organic Growth Sunbelt capitalized on its
strategic position in a high-growth corridor of a high-growth state to deliver exceptional results in its inaugural year 272727 Well-Positioned in Atlanta’s Growth Corridor +12% F5F4F1 +7% 79% +9% 2024 GDOT Highway and Pavement Portion 4-Year
Population (1) Growth Rate of Total Awards F2F8FD ~50% Revenue Growth 599% +8% +22% in first full year Georgia Net Migration 1F75B5 Atlanta Increase 2020-2024 +15% +1% +5% ~66% 7% FFC734 HMA Tonnage Growth Growth in Surrounding +6% Increase in State
& Local Government in first full year counties from 2020- (2) +53% Contract Awards 2020-2024 2024 +13% For endnote information, refer to Appendix Page 45
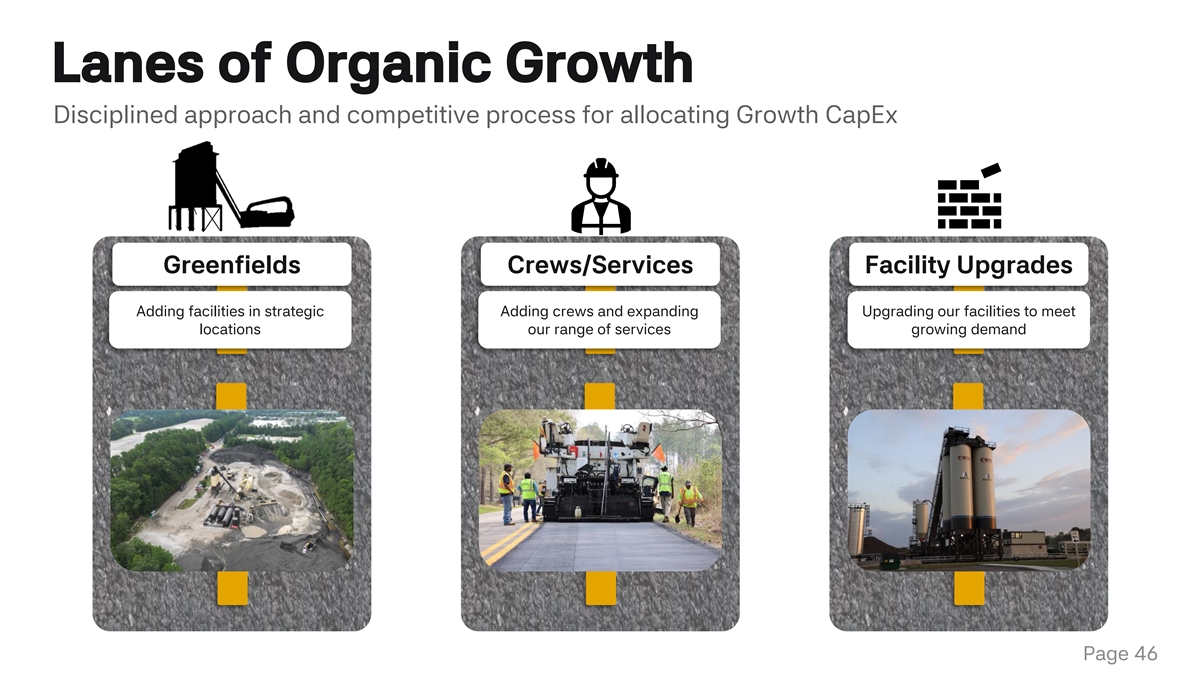
A6A6A6 Lanes of Organic Growth Disciplined approach and competitive
process for allocating Growth CapEx 272727 Greenfields Crews/Services Facility Upgrades F5F4F1 Adding facilities in strategic Adding crews and expanding Upgrading our facilities to meet locations our range of services growing demand F2F8FD 1F75B5
Crop this to zoom in> FFC734 Page 46

A6A6A6 Organic Growth in Focus 272727 F5F4F1 F2F8FD 1F75B5 Casey
Schwager Darren Ratajski Brandon Owens Greg Morisey Ty Johnson President President President President President FFC734
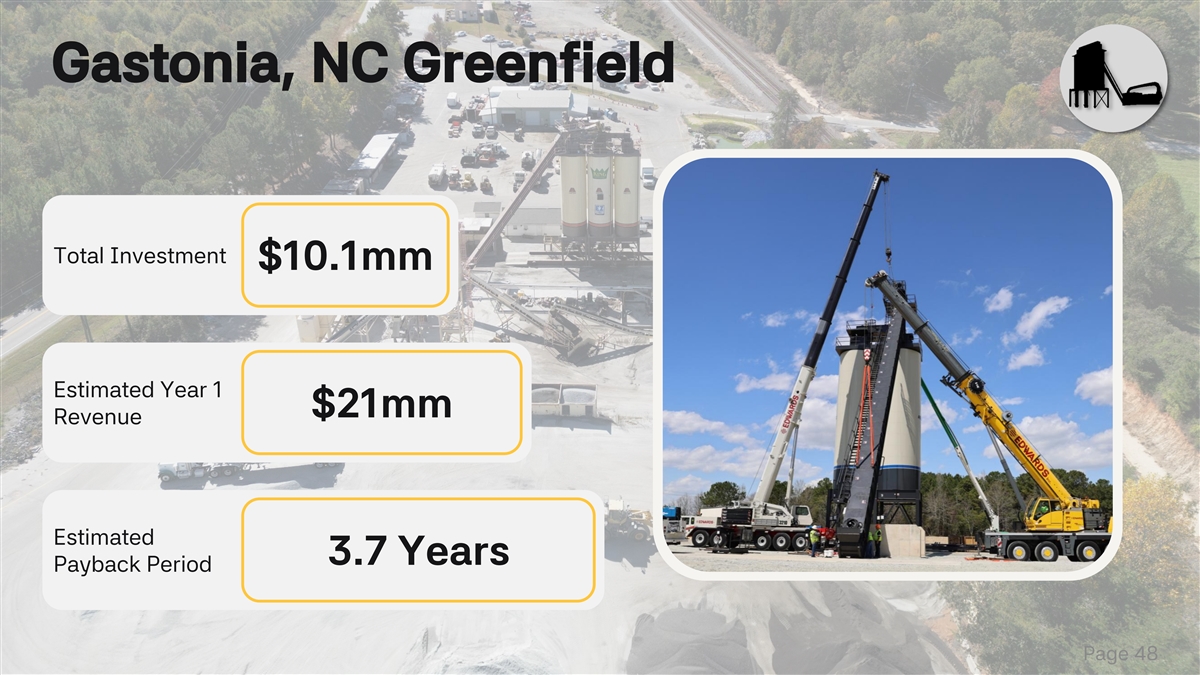
A6A6A6 Gastonia, NC Greenfield 272727 Total Investment $10.1mm F5F4F1
F2F8FD Estimated Year 1 $21mm Revenue 1F75B5 Estimated 3.7 Years Payback Period FFC734 Page 48
Switch to OVC crew – JV to ask Darren th th about a 4 /5 crew
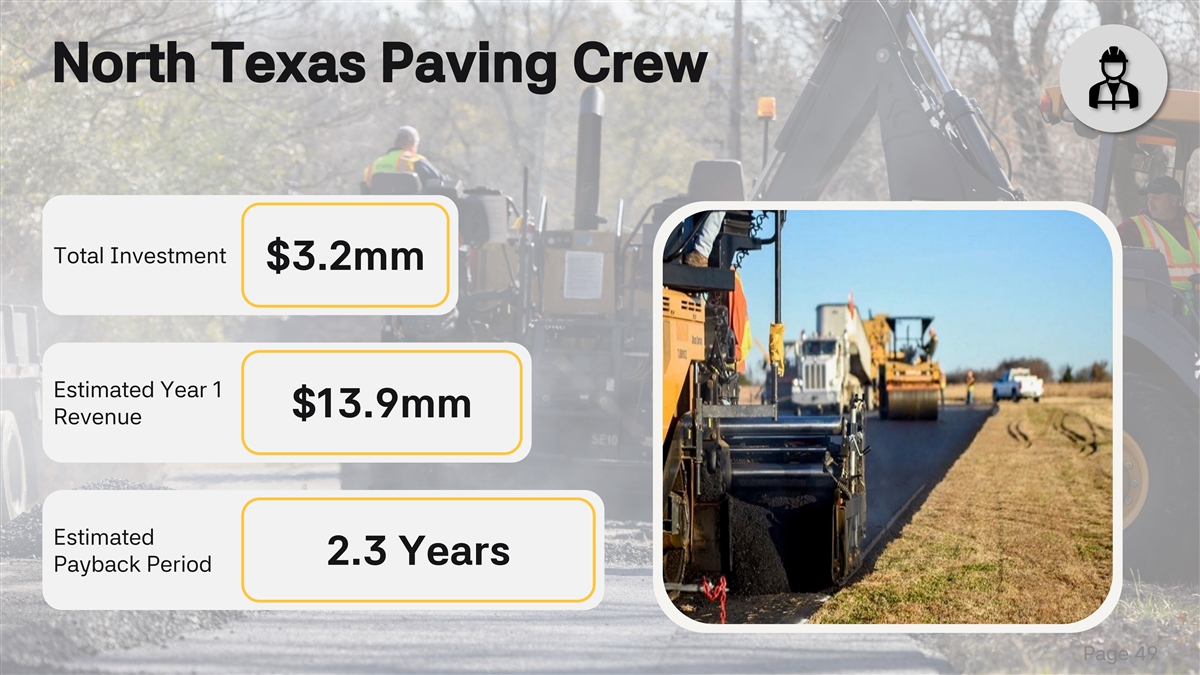
– investment? This year or last? Highlight Sanger Greenfield? th Added one on June 8 2025 – already had assets in house Adding one this week (10/6/25) – have not put in – already have the people and A6A6A6 North Texas Paving
Crew the trucks – MTV (1mm), pavers (750k), 3 rollers (200k q) – 2.5mm $5.4mm revenue; 400-450k per head (12 people) – Texas based crew – they 272727 live just outside forth worth Total Investment $3.2mm F5F4F1 F2F8FD
Estimated Year 1 $13.9mm Revenue 1F75B5 Estimated 2.3 Years Payback Period FFC734 Page 49
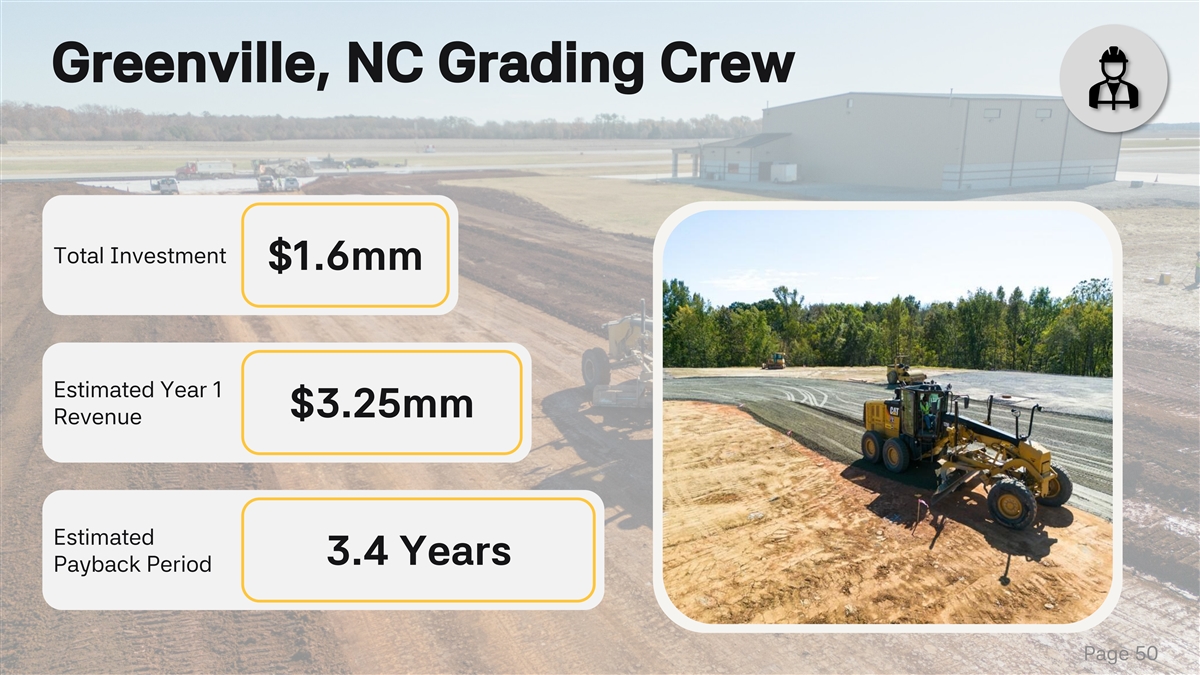
A6A6A6 Greenville, NC Grading Crew #An additional grading crew will
compliment Fred Smith Company’s growth in the Eastern Division. This added crew will increase production, competitiveness, and revenue in years to come.# 272727 Total Investment $1.6mm F5F4F1 F2F8FD Estimated Year 1 $3.25mm Revenue 1F75B5
Estimated 3.4 Years Payback Period FFC734 Page 50
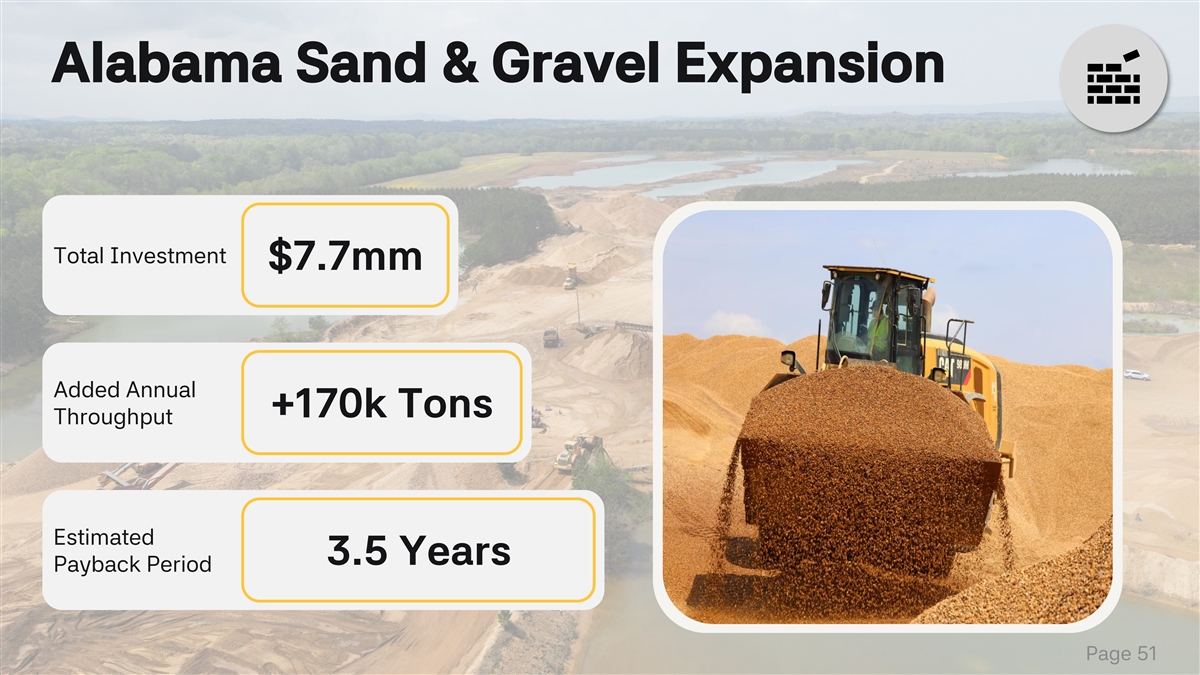
A6A6A6 Alabama Sand & Gravel Expansion 272727 Total Investment
$7.7mm F5F4F1 F2F8FD Added Annual +170k Tons Throughput 1F75B5 Estimated 3.5 Years Payback Period FFC734 Reserves Added +15 Years Page 51
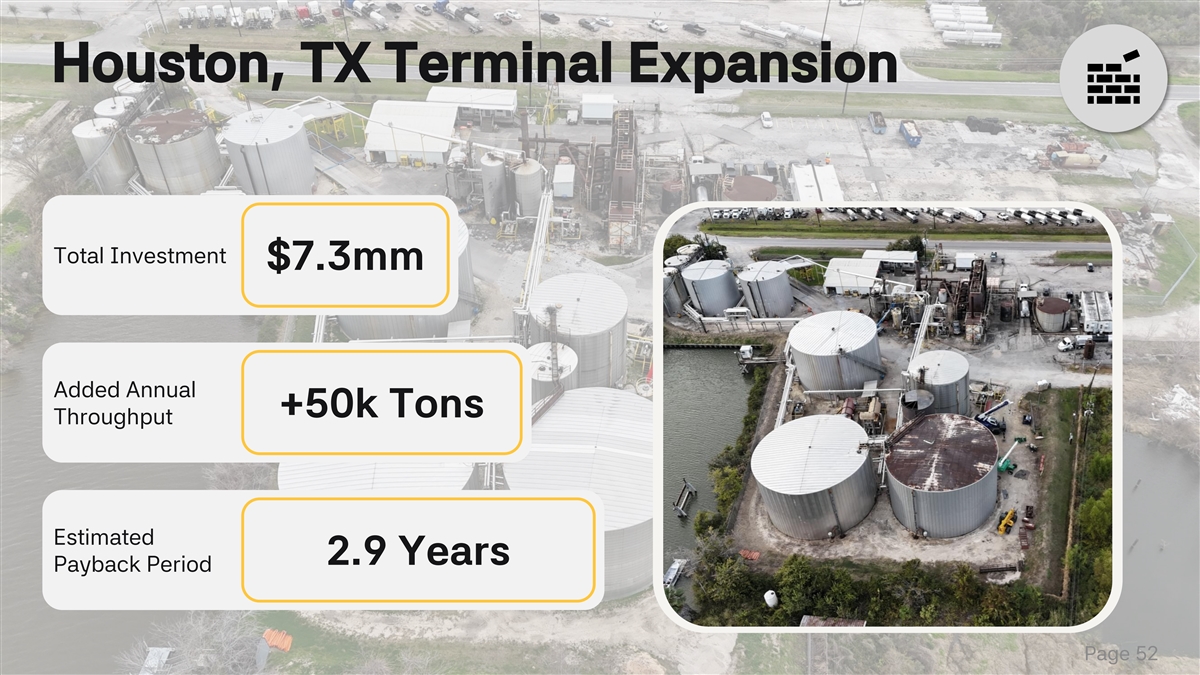
A6A6A6 Houston, TX Terminal Expansion 272727 Total Investment $7.3mm
F5F4F1 F2F8FD Added Annual +50k Tons Throughput 1F75B5 Estimated 2.9 Years Payback Period FFC734 Page 52

A6A6A6 Q&A and Closing Remarks 272727 F5F4F1 F2F8FD 1F75B5 Jule
Smith Greg Hoffman FFC734 Chief Executive Officer Chief Financial Officer

A6A6A6 272727 Appendix F5F4F1 F2F8FD 1F75B5 FFC734
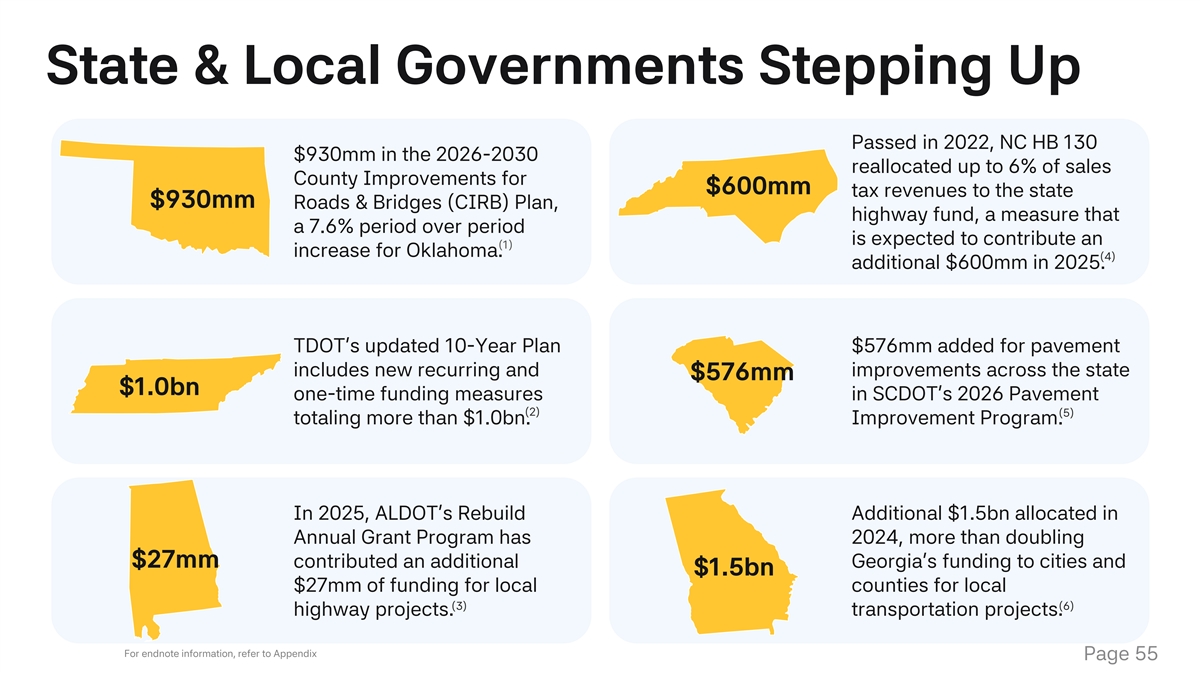
A6A6A6 State & Local Governments Stepping Up Passed in 2022, NC HB
130 $930mm in the 2026-2030 reallocated up to 6% of sales 272727 County Improvements for $600mm tax revenues to the state $930mm Roads & Bridges (CIRB) Plan, highway fund, a measure that a 7.6% period over period is expected to contribute an (1)
increase for Oklahoma. (4) additional $600mm in 2025. F5F4F1 TDOT’s updated 10-Year Plan $576mm added for pavement includes new recurring and improvements across the state F2F8FD $576mm $1.0bn one-time funding measures in SCDOT’s 2026
Pavement (2) (5) totaling more than $1.0bn. Improvement Program. 1F75B5 In 2025, ALDOT’s Rebuild Additional $1.5bn allocated in Annual Grant Program has 2024, more than doubling $27mm contributed an additional Georgia’s funding to cities
and $1.5bn FFC734 $27mm of funding for local counties for local (3) (6) highway projects. transportation projects. For endnote information, refer to Appendix Page 55
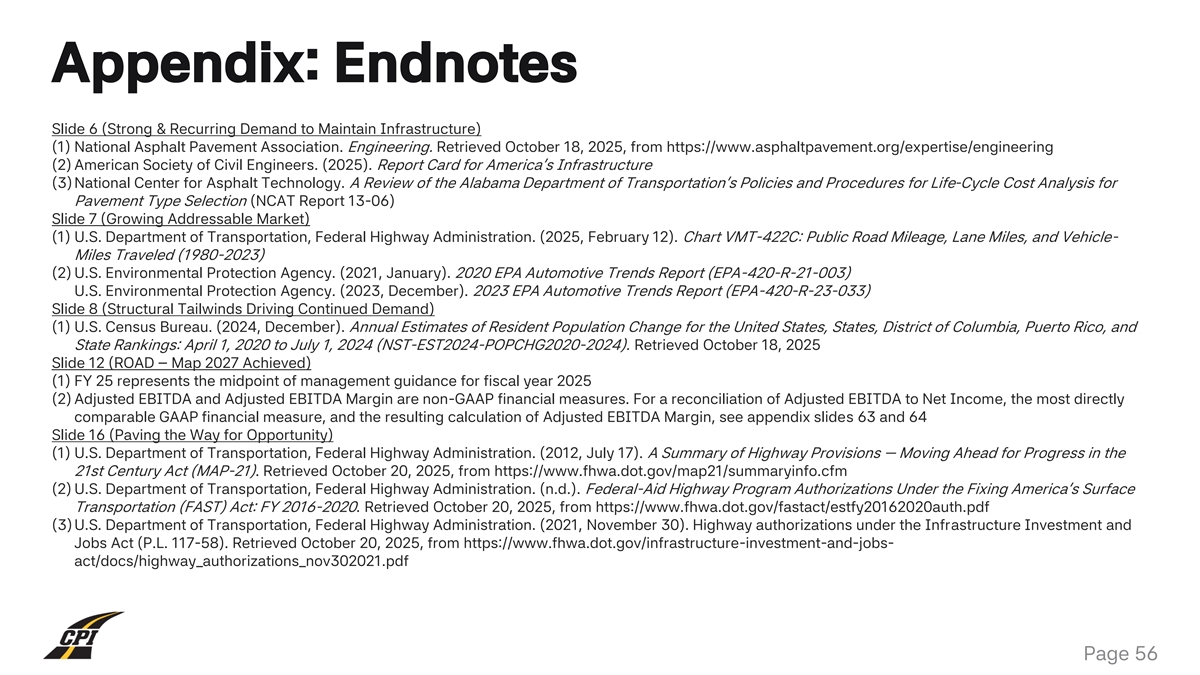
A6A6A6 Appendix: Endnotes Slide 6 (Strong & Recurring Demand to
Maintain Infrastructure) (1) National Asphalt Pavement Association. Engineering. Retrieved October 18, 2025, from https://www.asphaltpavement.org/expertise/engineering (2) American Society of Civil Engineers. (2025). Report Card for America’s
Infrastructure 272727 (3) National Center for Asphalt Technology. A Review of the Alabama Department of Transportation’s Policies and Procedures for Life-Cycle Cost Analysis for Pavement Type Selection (NCAT Report 13-06) Slide 7 (Growing
Addressable Market) (1) U.S. Department of Transportation, Federal Highway Administration. (2025, February 12). Chart VMT-422C: Public Road Mileage, Lane Miles, and Vehicle- Miles Traveled (1980-2023) F5F4F1 (2) U.S. Environmental Protection Agency.
(2021, January). 2020 EPA Automotive Trends Report (EPA-420-R-21-003) U.S. Environmental Protection Agency. (2023, December). 2023 EPA Automotive Trends Report (EPA-420-R-23-033) Slide 8 (Structural Tailwinds Driving Continued Demand) (1) U.S.
Census Bureau. (2024, December). Annual Estimates of Resident Population Change for the United States, States, District of Columbia, Puerto Rico, and State Rankings: April 1, 2020 to July 1, 2024 (NST-EST2024-POPCHG2020-2024). Retrieved October 18,
2025 Slide 12 (ROAD – Map 2027 Achieved) F2F8FD (1) FY 25 represents the midpoint of management guidance for fiscal year 2025 (2) Adjusted EBITDA and Adjusted EBITDA Margin are non-GAAP financial measures. For a reconciliation of Adjusted
EBITDA to Net Income, the most directly comparable GAAP financial measure, and the resulting calculation of Adjusted EBITDA Margin, see appendix slides 63 and 64 Slide 16 (Paving the Way for Opportunity) (1) U.S. Department of Transportation,
Federal Highway Administration. (2012, July 17). A Summary of Highway Provisions — Moving Ahead for Progress in the 21st Century Act (MAP-21). Retrieved October 20, 2025, from https://www.fhwa.dot.gov/map21/summaryinfo.cfm 1F75B5 (2) U.S.
Department of Transportation, Federal Highway Administration. (n.d.). Federal-Aid Highway Program Authorizations Under the Fixing America’s Surface Transportation (FAST) Act: FY 2016-2020. Retrieved October 20, 2025, from
https://www.fhwa.dot.gov/fastact/estfy20162020auth.pdf (3) U.S. Department of Transportation, Federal Highway Administration. (2021, November 30). Highway authorizations under the Infrastructure Investment and Jobs Act (P.L. 117-58). Retrieved
October 20, 2025, from https://www.fhwa.dot.gov/infrastructure-investment-and-jobs- act/docs/highway_authorizations_nov302021.pdf FFC734 Page 56
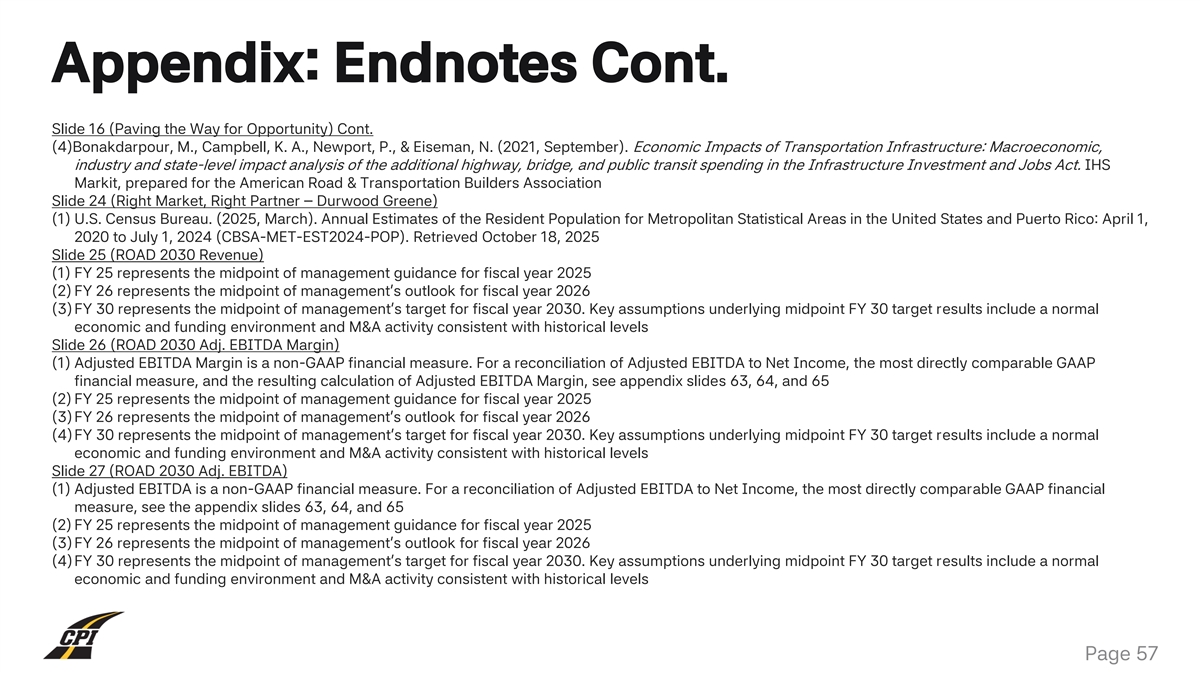
A6A6A6 Appendix: Endnotes Cont. Slide 16 (Paving the Way for
Opportunity) Cont. (4)Bonakdarpour, M., Campbell, K. A., Newport, P., & Eiseman, N. (2021, September). Economic Impacts of Transportation Infrastructure: Macroeconomic, industry and state-level impact analysis of the additional highway, bridge,
and public transit spending in the Infrastructure Investment and Jobs Act. IHS 272727 Markit, prepared for the American Road & Transportation Builders Association Slide 24 (Right Market, Right Partner – Durwood Greene) (1) U.S. Census
Bureau. (2025, March). Annual Estimates of the Resident Population for Metropolitan Statistical Areas in the United States and Puerto Rico: April 1, 2020 to July 1, 2024 (CBSA-MET-EST2024-POP). Retrieved October 18, 2025 Slide 25 (ROAD 2030 Revenue)
F5F4F1 (1) FY 25 represents the midpoint of management guidance for fiscal year 2025 (2) FY 26 represents the midpoint of management’s outlook for fiscal year 2026 (3) FY 30 represents the midpoint of management’s target for fiscal year
2030. Key assumptions underlying midpoint FY 30 target results include a normal economic and funding environment and M&A activity consistent with historical levels Slide 26 (ROAD 2030 Adj. EBITDA Margin) (1) Adjusted EBITDA Margin is a non-GAAP
financial measure. For a reconciliation of Adjusted EBITDA to Net Income, the most directly comparable GAAP F2F8FD financial measure, and the resulting calculation of Adjusted EBITDA Margin, see appendix slides 63, 64, and 65 (2) FY 25 represents
the midpoint of management guidance for fiscal year 2025 (3) FY 26 represents the midpoint of management’s outlook for fiscal year 2026 (4)FY 30 represents the midpoint of management’s target for fiscal year 2030. Key assumptions
underlying midpoint FY 30 target results include a normal economic and funding environment and M&A activity consistent with historical levels Slide 27 (ROAD 2030 Adj. EBITDA) 1F75B5 (1) Adjusted EBITDA is a non-GAAP financial measure. For a
reconciliation of Adjusted EBITDA to Net Income, the most directly comparable GAAP financial measure, see the appendix slides 63, 64, and 65 (2) FY 25 represents the midpoint of management guidance for fiscal year 2025 (3) FY 26 represents the
midpoint of management’s outlook for fiscal year 2026 (4)FY 30 represents the midpoint of management’s target for fiscal year 2030. Key assumptions underlying midpoint FY 30 target results include a normal FFC734 economic and funding
environment and M&A activity consistent with historical levels Page 57
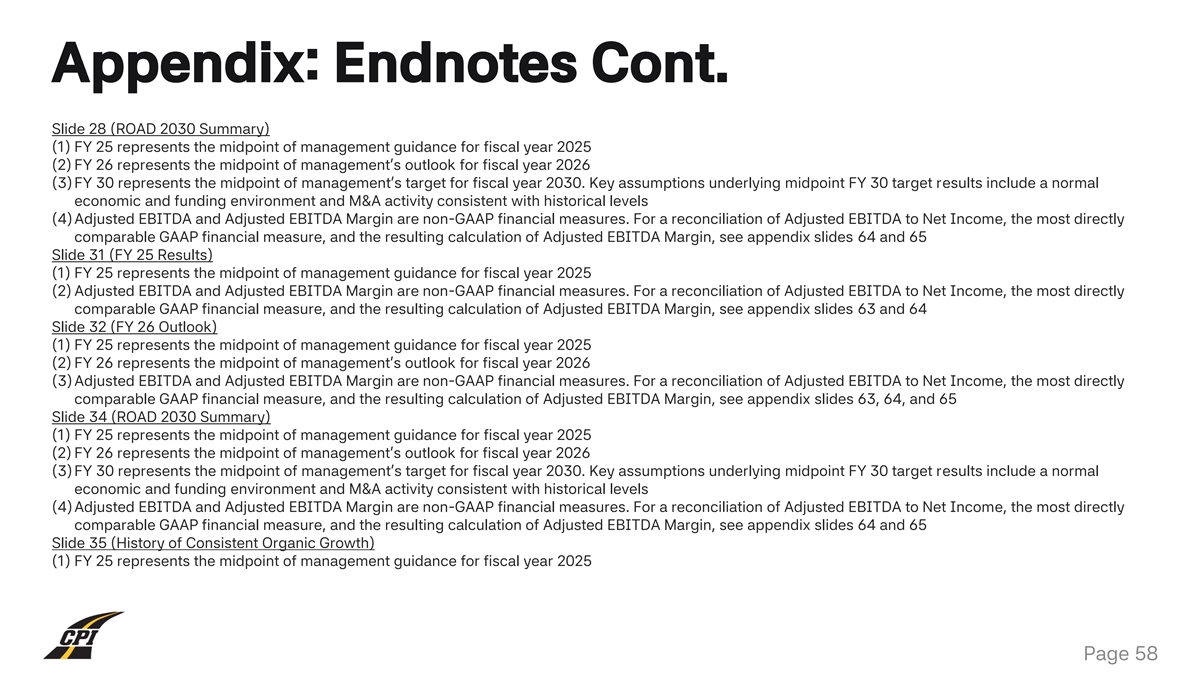
A6A6A6 Appendix: Endnotes Cont. Slide 28 (ROAD 2030 Summary) (1) FY 25
represents the midpoint of management guidance for fiscal year 2025 (2) FY 26 represents the midpoint of management’s outlook for fiscal year 2026 272727 (3) FY 30 represents the midpoint of management’s target for fiscal year 2030. Key
assumptions underlying midpoint FY 30 target results include a normal economic and funding environment and M&A activity consistent with historical levels (4)Adjusted EBITDA and Adjusted EBITDA Margin are non-GAAP financial measures. For a
reconciliation of Adjusted EBITDA to Net Income, the most directly comparable GAAP financial measure, and the resulting calculation of Adjusted EBITDA Margin, see appendix slides 64 and 65 Slide 31 (FY 25 Results) F5F4F1 (1) FY 25 represents the
midpoint of management guidance for fiscal year 2025 (2) Adjusted EBITDA and Adjusted EBITDA Margin are non-GAAP financial measures. For a reconciliation of Adjusted EBITDA to Net Income, the most directly comparable GAAP financial measure, and the
resulting calculation of Adjusted EBITDA Margin, see appendix slides 63 and 64 Slide 32 (FY 26 Outlook) (1) FY 25 represents the midpoint of management guidance for fiscal year 2025 (2) FY 26 represents the midpoint of management’s outlook for
fiscal year 2026 F2F8FD (3) Adjusted EBITDA and Adjusted EBITDA Margin are non-GAAP financial measures. For a reconciliation of Adjusted EBITDA to Net Income, the most directly comparable GAAP financial measure, and the resulting calculation of
Adjusted EBITDA Margin, see appendix slides 63, 64, and 65 Slide 34 (ROAD 2030 Summary) (1) FY 25 represents the midpoint of management guidance for fiscal year 2025 (2) FY 26 represents the midpoint of management’s outlook for fiscal year
2026 (3) FY 30 represents the midpoint of management’s target for fiscal year 2030. Key assumptions underlying midpoint FY 30 target results include a normal 1F75B5 economic and funding environment and M&A activity consistent with
historical levels (4)Adjusted EBITDA and Adjusted EBITDA Margin are non-GAAP financial measures. For a reconciliation of Adjusted EBITDA to Net Income, the most directly comparable GAAP financial measure, and the resulting calculation of Adjusted
EBITDA Margin, see appendix slides 64 and 65 Slide 35 (History of Consistent Organic Growth) (1) FY 25 represents the midpoint of management guidance for fiscal year 2025 FFC734 Page 58
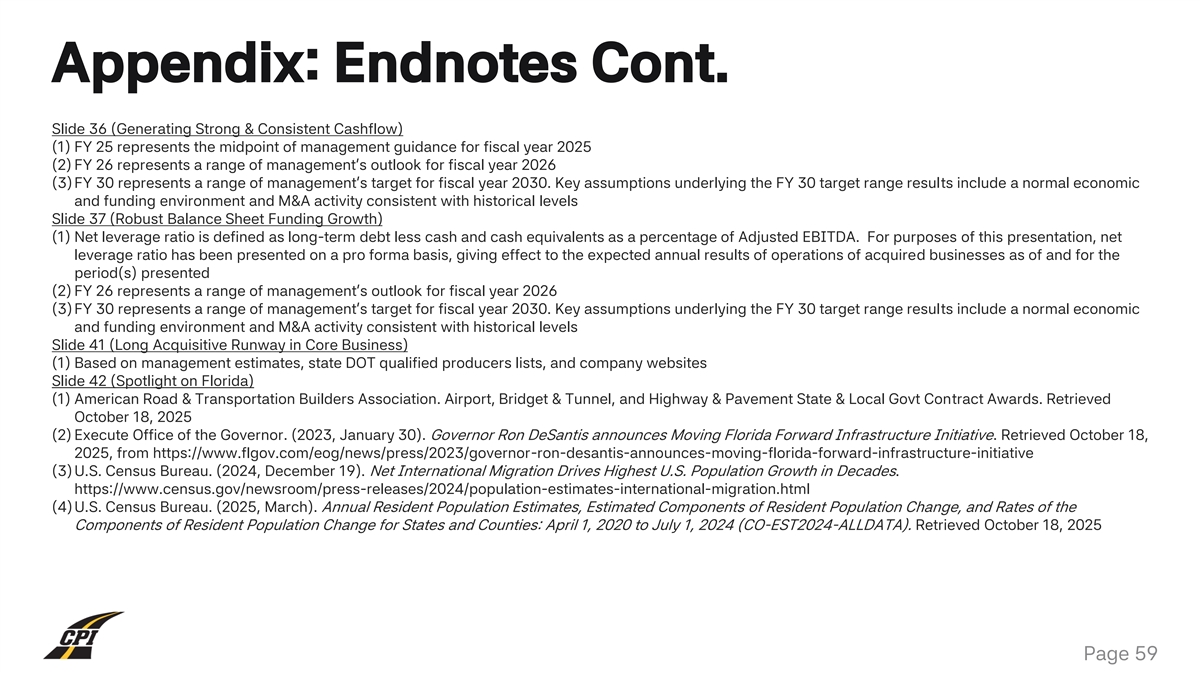
A6A6A6 Appendix: Endnotes Cont. Slide 36 (Generating Strong &
Consistent Cashflow) (1) FY 25 represents the midpoint of management guidance for fiscal year 2025 (2) FY 26 represents a range of management’s outlook for fiscal year 2026 272727 (3) FY 30 represents a range of management’s target for
fiscal year 2030. Key assumptions underlying the FY 30 target range results include a normal economic and funding environment and M&A activity consistent with historical levels Slide 37 (Robust Balance Sheet Funding Growth) (1) Net leverage
ratio is defined as long-term debt less cash and cash equivalents as a percentage of Adjusted EBITDA. For purposes of this presentation, net leverage ratio has been presented on a pro forma basis, giving effect to the expected annual results of
operations of acquired businesses as of and for the F5F4F1 period(s) presented (2) FY 26 represents a range of management’s outlook for fiscal year 2026 (3) FY 30 represents a range of management’s target for fiscal year 2030. Key
assumptions underlying the FY 30 target range results include a normal economic and funding environment and M&A activity consistent with historical levels Slide 41 (Long Acquisitive Runway in Core Business) (1) Based on management estimates,
state DOT qualified producers lists, and company websites F2F8FD Slide 42 (Spotlight on Florida) (1) American Road & Transportation Builders Association. Airport, Bridget & Tunnel, and Highway & Pavement State & Local Govt Contract
Awards. Retrieved October 18, 2025 (2) Execute Office of the Governor. (2023, January 30). Governor Ron DeSantis announces Moving Florida Forward Infrastructure Initiative. Retrieved October 18, 2025, from
https://www.flgov.com/eog/news/press/2023/governor-ron-desantis-announces-moving-florida-forward-infrastructure-initiative (3) U.S. Census Bureau. (2024, December 19). Net International Migration Drives Highest U.S. Population Growth in Decades.
1F75B5 https://www.census.gov/newsroom/press-releases/2024/population-estimates-international-migration.html (4)U.S. Census Bureau. (2025, March). Annual Resident Population Estimates, Estimated Components of Resident Population Change, and Rates of
the Components of Resident Population Change for States and Counties: April 1, 2020 to July 1, 2024 (CO-EST2024-ALLDATA). Retrieved October 18, 2025 FFC734 Page 59
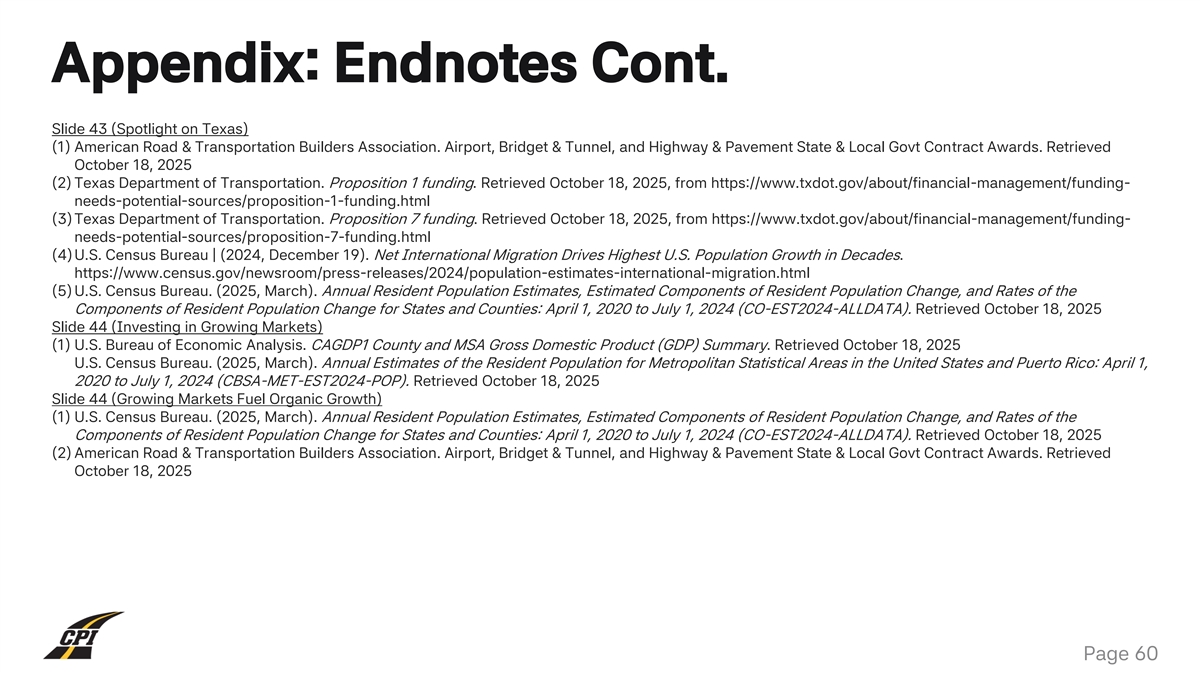
A6A6A6 Appendix: Endnotes Cont. Slide 43 (Spotlight on Texas) (1)
American Road & Transportation Builders Association. Airport, Bridget & Tunnel, and Highway & Pavement State & Local Govt Contract Awards. Retrieved October 18, 2025 272727 (2) Texas Department of Transportation. Proposition 1
funding. Retrieved October 18, 2025, from https://www.txdot.gov/about/financial-management/funding- needs-potential-sources/proposition-1-funding.html (3) Texas Department of Transportation. Proposition 7 funding. Retrieved October 18, 2025, from
https://www.txdot.gov/about/financial-management/funding- needs-potential-sources/proposition-7-funding.html (4)U.S. Census Bureau | (2024, December 19). Net International Migration Drives Highest U.S. Population Growth in Decades. F5F4F1
https://www.census.gov/newsroom/press-releases/2024/population-estimates-international-migration.html (5) U.S. Census Bureau. (2025, March). Annual Resident Population Estimates, Estimated Components of Resident Population Change, and Rates of the
Components of Resident Population Change for States and Counties: April 1, 2020 to July 1, 2024 (CO-EST2024-ALLDATA). Retrieved October 18, 2025 Slide 44 (Investing in Growing Markets) (1) U.S. Bureau of Economic Analysis. CAGDP1 County and MSA
Gross Domestic Product (GDP) Summary. Retrieved October 18, 2025 U.S. Census Bureau. (2025, March). Annual Estimates of the Resident Population for Metropolitan Statistical Areas in the United States and Puerto Rico: April 1, F2F8FD 2020 to July 1,
2024 (CBSA-MET-EST2024-POP). Retrieved October 18, 2025 Slide 44 (Growing Markets Fuel Organic Growth) (1) U.S. Census Bureau. (2025, March). Annual Resident Population Estimates, Estimated Components of Resident Population Change, and Rates of the
Components of Resident Population Change for States and Counties: April 1, 2020 to July 1, 2024 (CO-EST2024-ALLDATA). Retrieved October 18, 2025 (2) American Road & Transportation Builders Association. Airport, Bridget & Tunnel, and Highway
& Pavement State & Local Govt Contract Awards. Retrieved October 18, 2025 1F75B5 FFC734 Page 60
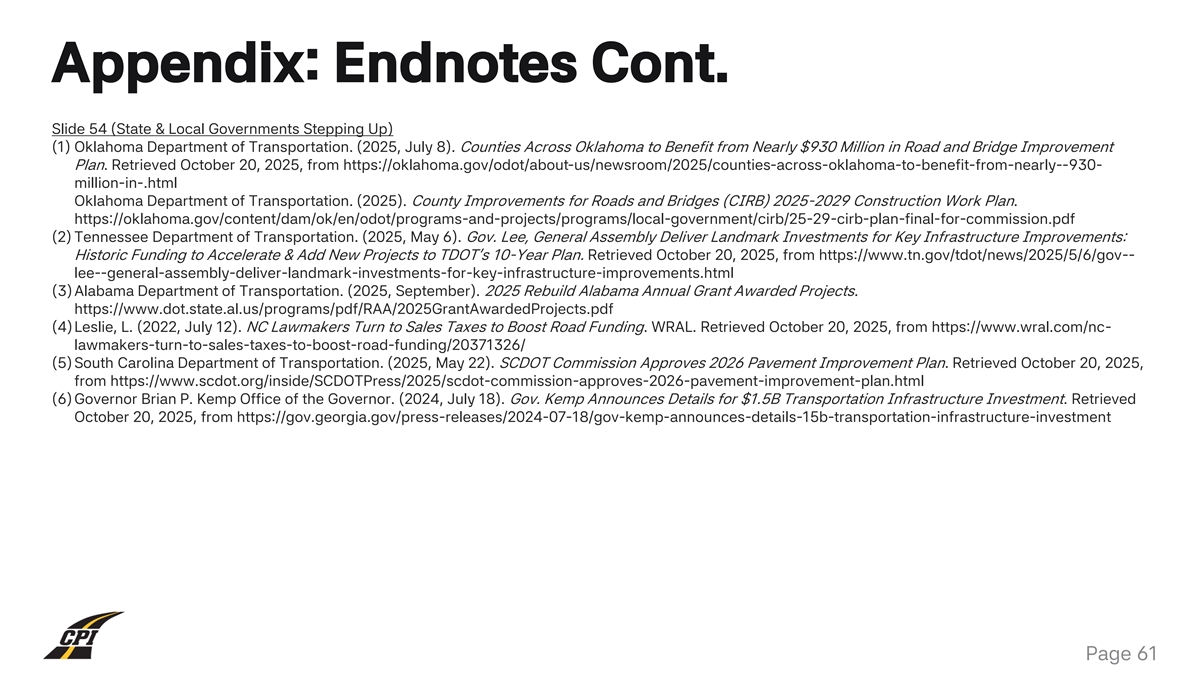
A6A6A6 Appendix: Endnotes Cont. Slide 54 (State & Local Governments
Stepping Up) (1) Oklahoma Department of Transportation. (2025, July 8). Counties Across Oklahoma to Benefit from Nearly $930 Million in Road and Bridge Improvement Plan. Retrieved October 20, 2025, from
https://oklahoma.gov/odot/about-us/newsroom/2025/counties-across-oklahoma-to-benefit-from-nearly--930- 272727 million-in-.html Oklahoma Department of Transportation. (2025). County Improvements for Roads and Bridges (CIRB) 2025-2029 Construction
Work Plan. https://oklahoma.gov/content/dam/ok/en/odot/programs-and-projects/programs/local-government/cirb/25-29-cirb-plan-final-for-commission.pdf (2) Tennessee Department of Transportation. (2025, May 6). Gov. Lee, General Assembly Deliver
Landmark Investments for Key Infrastructure Improvements: Historic Funding to Accelerate & Add New Projects to TDOT’s 10-Year Plan. Retrieved October 20, 2025, from https://www.tn.gov/tdot/news/2025/5/6/gov-- F5F4F1
lee--general-assembly-deliver-landmark-investments-for-key-infrastructure-improvements.html (3) Alabama Department of Transportation. (2025, September). 2025 Rebuild Alabama Annual Grant Awarded Projects.
https://www.dot.state.al.us/programs/pdf/RAA/2025GrantAwardedProjects.pdf (4)Leslie, L. (2022, July 12). NC Lawmakers Turn to Sales Taxes to Boost Road Funding. WRAL. Retrieved October 20, 2025, from https://www.wral.com/nc-
lawmakers-turn-to-sales-taxes-to-boost-road-funding/20371326/ (5) South Carolina Department of Transportation. (2025, May 22). SCDOT Commission Approves 2026 Pavement Improvement Plan. Retrieved October 20, 2025, F2F8FD from
https://www.scdot.org/inside/SCDOTPress/2025/scdot-commission-approves-2026-pavement-improvement-plan.html (6) Governor Brian P. Kemp Office of the Governor. (2024, July 18). Gov. Kemp Announces Details for $1.5B Transportation Infrastructure
Investment. Retrieved October 20, 2025, from https://gov.georgia.gov/press-releases/2024-07-18/gov-kemp-announces-details-15b-transportation-infrastructure-investment 1F75B5 FFC734 Page 61
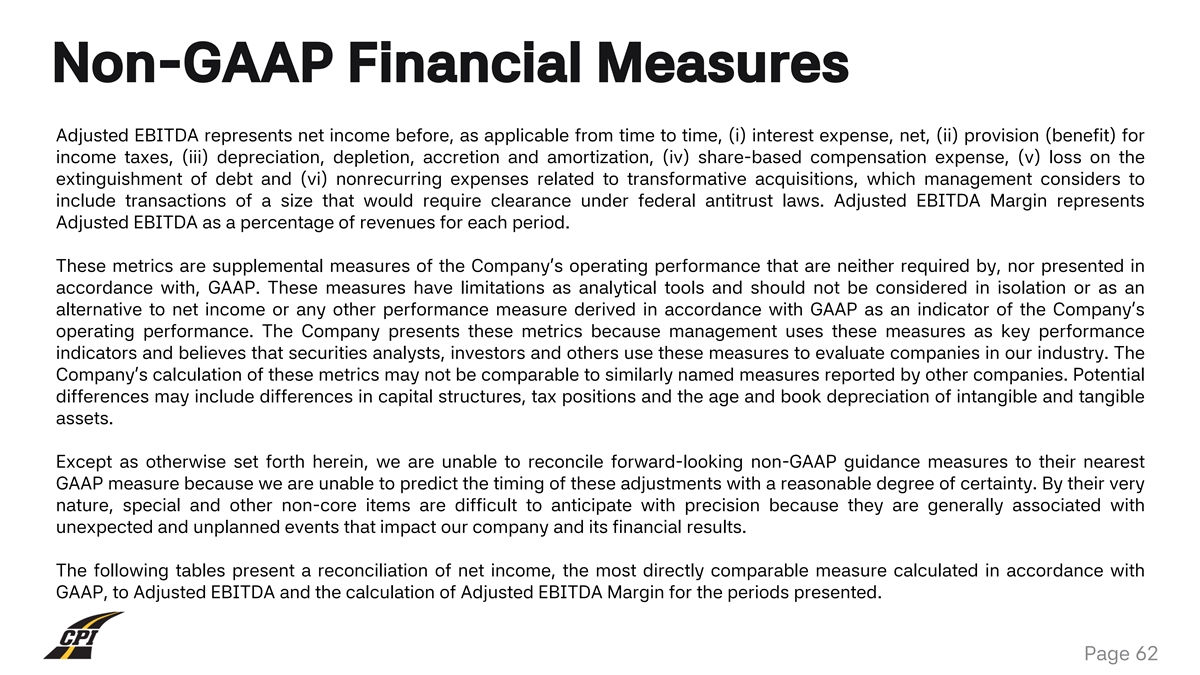
A6A6A6 Non-GAAP Financial Measures Adjusted EBITDA represents net
income before, as applicable from time to time, (i) interest expense, net, (ii) provision (benefit) for income taxes, (iii) depreciation, depletion, accretion and amortization, (iv) share-based compensation expense, (v) loss on the 272727
extinguishment of debt and (vi) nonrecurring expenses related to transformative acquisitions, which management considers to include transactions of a size that would require clearance under federal antitrust laws. Adjusted EBITDA Margin represents
Adjusted EBITDA as a percentage of revenues for each period. These metrics are supplemental measures of the Company’s operating performance that are neither required by, nor presented in F5F4F1 accordance with, GAAP. These measures have
limitations as analytical tools and should not be considered in isolation or as an alternative to net income or any other performance measure derived in accordance with GAAP as an indicator of the Company’s operating performance. The Company
presents these metrics because management uses these measures as key performance indicators and believes that securities analysts, investors and others use these measures to evaluate companies in our industry. The F2F8FD Company’s calculation
of these metrics may not be comparable to similarly named measures reported by other companies. Potential differences may include differences in capital structures, tax positions and the age and book depreciation of intangible and tangible assets.
Except as otherwise set forth herein, we are unable to reconcile forward-looking non-GAAP guidance measures to their nearest 1F75B5 GAAP measure because we are unable to predict the timing of these adjustments with a reasonable degree of certainty.
By their very nature, special and other non-core items are difficult to anticipate with precision because they are generally associated with unexpected and unplanned events that impact our company and its financial results. The following tables
present a reconciliation of net income, the most directly comparable measure calculated in accordance with FFC734 GAAP, to Adjusted EBITDA and the calculation of Adjusted EBITDA Margin for the periods presented. Page 62
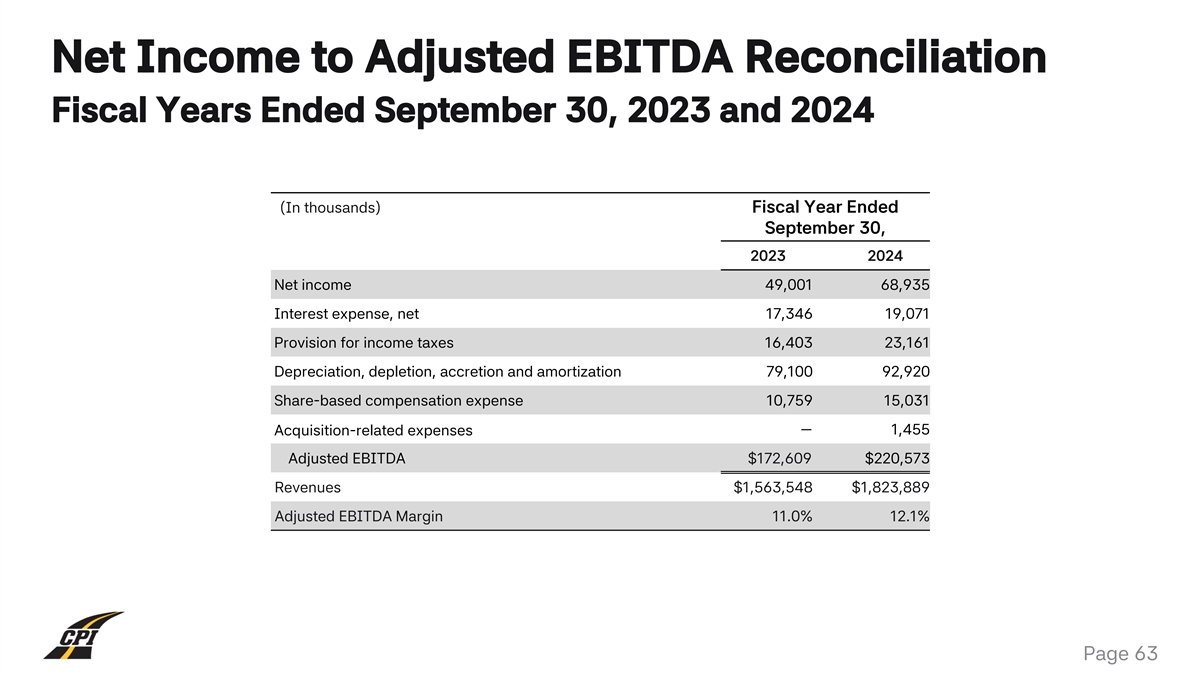
Net Income to Adjusted EBITDA Reconciliation A6A6A6 Fiscal Years Ended
September 30, 2023 and 2024 272727 (In thousands) Fiscal Year Ended September 30, 2023 2024 F5F4F1 Net income 49,001 68,935 Interest expense, net 17,346 19,071 Provision for income taxes 16,403 23,161 Depreciation, depletion, accretion and
amortization 79,100 92,920 F2F8FD Share-based compensation expense 10,759 15,031 Acquisition-related expenses — 1,455 Adjusted EBITDA $172,609 $220,573 1F75B5 Revenues $1,563,548 $1,823,889 Adjusted EBITDA Margin 11.0% 12.1% FFC734 Page
63
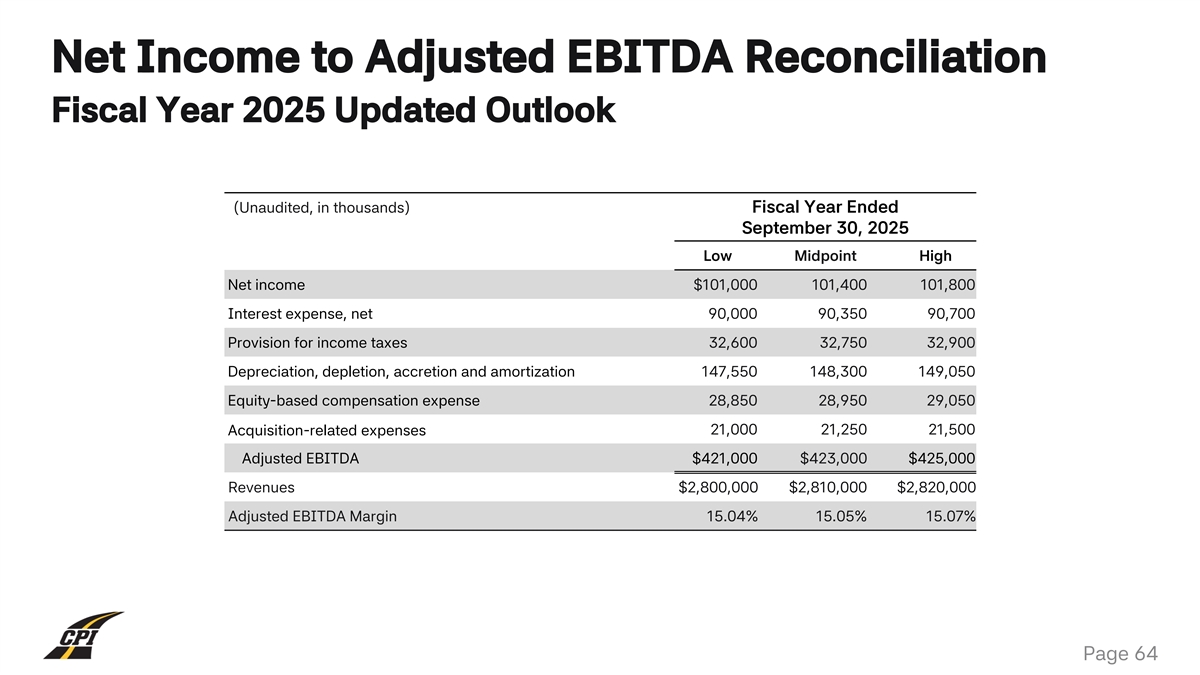
Net Income to Adjusted EBITDA Reconciliation A6A6A6 Fiscal Year 2025
Updated Outlook 272727 (Unaudited, in thousands) Fiscal Year Ended September 30, 2025 Low Midpoint High F5F4F1 Net income $101,000 101,400 101,800 Interest expense, net 90,000 90,350 90,700 Provision for income taxes 32,600 32,750 32,900
Depreciation, depletion, accretion and amortization 147,550 148,300 149,050 F2F8FD Equity-based compensation expense 28,850 28,950 29,050 Acquisition-related expenses 21,000 21,250 21,500 Adjusted EBITDA $421,000 $423,000 $425,000 1F75B5 Revenues
$2,800,000 $2,810,000 $2,820,000 Adjusted EBITDA Margin 15.04% 15.05% 15.07% FFC734 Page 64
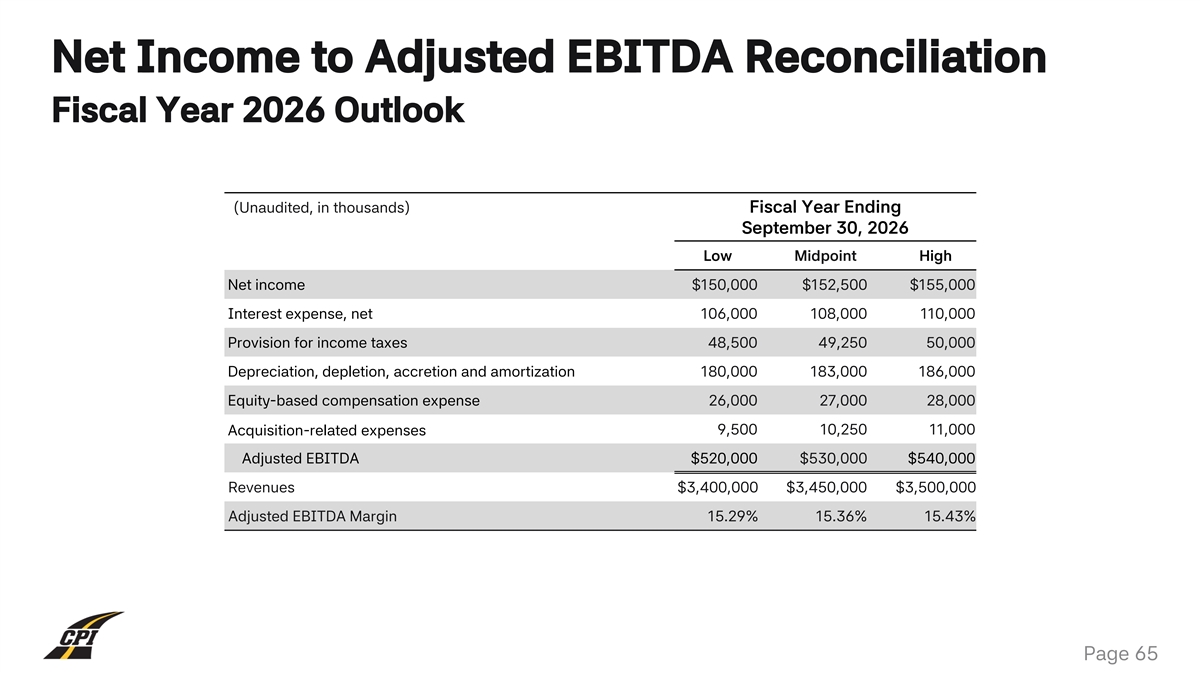
Net Income to Adjusted EBITDA Reconciliation A6A6A6 Fiscal Year 2026
Outlook 272727 (Unaudited, in thousands) Fiscal Year Ending September 30, 2026 Low Midpoint High F5F4F1 Net income $150,000 $152,500 $155,000 Interest expense, net 106,000 108,000 110,000 Provision for income taxes 48,500 49,250 50,000 Depreciation,
depletion, accretion and amortization 180,000 183,000 186,000 F2F8FD Equity-based compensation expense 26,000 27,000 28,000 Acquisition-related expenses 9,500 10,250 11,000 Adjusted EBITDA $520,000 $530,000 $540,000 1F75B5 Revenues $3,400,000
$3,450,000 $3,500,000 Adjusted EBITDA Margin 15.29% 15.36% 15.43% FFC734 Page 65