| Exhibit 99.1 | |||||||||||||||||||||||||||||
| Fellow Shareholders, | October 30, 2025 | ||||||||||||||||||||||||||||
We delivered strong Q3 results, achieving positive operating income ahead of schedule and for the first time since 2021. Platform revenue grew 17% YoY, driven by strength in streaming services distribution and video advertising activities. We deepened integrations with third‑party ad demand and measurement platforms, grew Roku‑billed subscriptions, and enhanced our Home Screen and the overall Roku Experience. We also repurchased $50 million of our common stock under the $400 million stock repurchase program and are increasing our full year outlook. All of this reinforces our commitment to delivering long-term shareholder value by growing free cash flow per share. Looking ahead, we are confident in our ability to deliver double-digit Platform revenue growth while increasing operating margins in 2026 and beyond.
Q3 2025 Key Results
•Total net revenue was $1.211 billion, up 14% year over year (YoY)
•Platform revenue was $1.065 billion, up 17% YoY
•Gross profit was $525 million, up 9% YoY
•Streaming Hours were 36.5 billion, up 4.5 billion hours YoY
•The Roku Channel remained the #2 app on our platform by engagement in the U.S.
| Summary Financials ($ in millions) | Q3 24 | Q4 24 | Q1 25 | Q2 25 | Q3 25 | YoY % | |||||||||||||||||||||||||||||
| *Platform revenue | $ | 908.2 | $ | 1,035.3 | $ | 880.8 | $ | 975.5 | $ | 1,064.6 | 17% | ||||||||||||||||||||||||
| Devices revenue | 154.0 | 165.7 | 139.9 | 135.6 | 146.0 | (5)% | |||||||||||||||||||||||||||||
| Total net revenue | 1,062.2 | 1,201.0 | 1,020.7 | 1,111.0 | 1,210.6 | 14% | |||||||||||||||||||||||||||||
| Platform gross profit | 491.8 | 559.9 | 464.3 | 497.7 | 547.8 | 11% | |||||||||||||||||||||||||||||
| Devices gross profit (loss) | (11.7) | (47.4) | (19.3) | 0.0 | (22.9) | (95)% | |||||||||||||||||||||||||||||
| Total gross profit | 480.1 | 512.6 | 445.0 | 497.7 | 524.9 | 9% | |||||||||||||||||||||||||||||
| Platform gross margin % | 54.2 | % | 54.1 | % | 52.7 | % | 51.0 | % | 51.5 | % | (2.7) | pts | |||||||||||||||||||||||
| Devices gross margin % | (7.6) | % | (28.6) | % | (13.8) | % | 0.0 | % | (15.7) | % | (8.1) | pts | |||||||||||||||||||||||
| Total gross margin % | 45.2 | % | 42.7 | % | 43.6 | % | 44.8 | % | 43.4 | % | (1.8) | pts | |||||||||||||||||||||||
| Research and development | 178.8 | 185.4 | 184.6 | 178.0 | 182.2 | 2% | |||||||||||||||||||||||||||||
| Sales and marketing | 237.0 | 271.9 | 223.7 | 243.3 | 242.1 | 2% | |||||||||||||||||||||||||||||
| General and administrative | 100.0 | 94.4 | 94.5 | 99.7 | 91.1 | (9)% | |||||||||||||||||||||||||||||
| Total operating expenses | 515.8 | 551.7 | 502.8 | 521.0 | 515.4 | 0% | |||||||||||||||||||||||||||||
| Income (loss) from operations | (35.8) | (39.1) | (57.7) | (23.3) | 9.5 | 126% | |||||||||||||||||||||||||||||
| Net income (loss) | (9.0) | (35.5) | (27.4) | 10.5 | 24.8 | 375% | |||||||||||||||||||||||||||||
*Adjusted EBITDA A | 98.2 | 77.5 | 56.0 | 78.2 | 116.9 | 19% | |||||||||||||||||||||||||||||
| Adjusted EBITDA margin % | 9.2 | % | 6.5 | % | 5.5 | % | 7.0 | % | 9.7 | % | 0.4 | pts | |||||||||||||||||||||||
| Cash flow from operations (TTM) | 155.1 | 218.0 | 310.1 | 396.4 | 455.4 | 194% | |||||||||||||||||||||||||||||
*Free cash flow (TTM) A | 157.3 | 203.2 | 298.4 | 392.0 | 443.0 | 182% | |||||||||||||||||||||||||||||
| Outlook ($ in millions) | Q4 2025E | FY 2025E | A Refer to the reconciliations at the end of this Letter. | ||||||||||||||||||||||||||||||||
| Total net revenue | $1,350 | $4,690 | B Reconciling items between net income and non-GAAP Adjusted EBITDA consist of: stock-based compensation of approx. $95M for Q4 and $360M for 2025, depreciation and amortization of approx. $20M for Q4 and $75M for 2025, and other income of approx. $10M for Q4 and $90M for 2025. | ||||||||||||||||||||||||||||||||
| Total gross profit | $575 | $2,040 | |||||||||||||||||||||||||||||||||
| Net income | $40 | $50 | |||||||||||||||||||||||||||||||||
Adjusted EBITDA B | $145 | $395 | |||||||||||||||||||||||||||||||||
* Key Performance Metric (KPM)
Roku Q3 2025 Shareholder Letter | ||
Platform
Platform revenue was $1.065 billion, up 17% YoY, and slightly above our outlook, driven by strength in video advertising and streaming services distribution activities. Platform gross margin was 51.5%, which was 50 basis points above our outlook.
Advertising Activities
Video advertising on our platform grew faster YoY than the U.S. OTT and digital ad markets1. By expanding integrations with third‑party demand‑side platforms (DSPs), we are increasing ad demand and meeting enterprise and other clients where they choose to transact. The share of Roku video impressions executed programmatically continues to rise. We’re also seeing strong momentum in Roku Ads Manager, our self‑serve platform through which we service small and medium-sized businesses (SMBs) and performance marketers. The growth of Ads Manager is largely incremental and further diversifies demand. Our fastest‑growing advertiser cohort is digital growth marketers focused on performance across DTC e‑commerce, mobile apps, and gaming.
We continued to expand our partner integrations. In September, we integrated measurement platform AppsFlyer across the Roku platform, including Ads Manager, UI ad placements, and in‑stream video on The Roku Channel. This integration gives advertisers a holistic view of campaign outcomes across CTV and mobile, covering app installs, in‑app activity, and long‑term customer value. We also expanded our integration with FreeWheel, a CTV ad‑tech platform. The enhanced partnership increases transparency, demand signals, and buyer access to Roku’s premium CTV supply, improving yield and efficiency through the FreeWheel Advertiser Suite.
Whether advertisers buy through Roku or a partner, we deliver results. For example, SimpliSafe, a home security provider, was missing a growing segment of consumers. SimpliSafe deployed a multi‑pronged campaign with Roku that combined in‑stream video ads, Pause Ads, and home screen + Brand Showcase ads, to drive incremental reach and action. Results showed that over 76% of the target audience was unreachable on traditional TV, 36% was hard to reach on AVOD, and Roku delivered a Cost Per Lead (CPL) 37% more efficient than the brand’s overall streaming CPL during the same period. As the market shifts toward outcomes and measurement, Roku continues to build solutions with and for our clients.
Streaming Services Distribution Activities
Streaming services distribution activities this quarter were driven by Premium Subscriptions and our recent acquisition of Frndly TV. Our ongoing improvements to content discovery are helping our viewers find great entertainment, while fueling growth in Roku-billed subscriptions, particularly within Premium Subscriptions.
Our Sports Experience, which aggregates and organizes sports programming from across our platform, continues to help our viewers find when and where their favorite team is playing. We’ve recently made it easier for sports fans to keep up with games and set reminders for upcoming matchups that are sent right to the user’s phone. Given the popularity of the Sports Experience in the U.S., we launched it in Mexico. During NFL kickoff week, we highlighted the NFL Zone in our Home Screen menu, and visits to the Zone more than tripled YoY, helping to drive sign-ups for subscription services carrying games.
1 3Q25 SMI (Standard Media Index) data; OTT: over-the-top
Roku Q3 2025 Shareholder Letter | ||
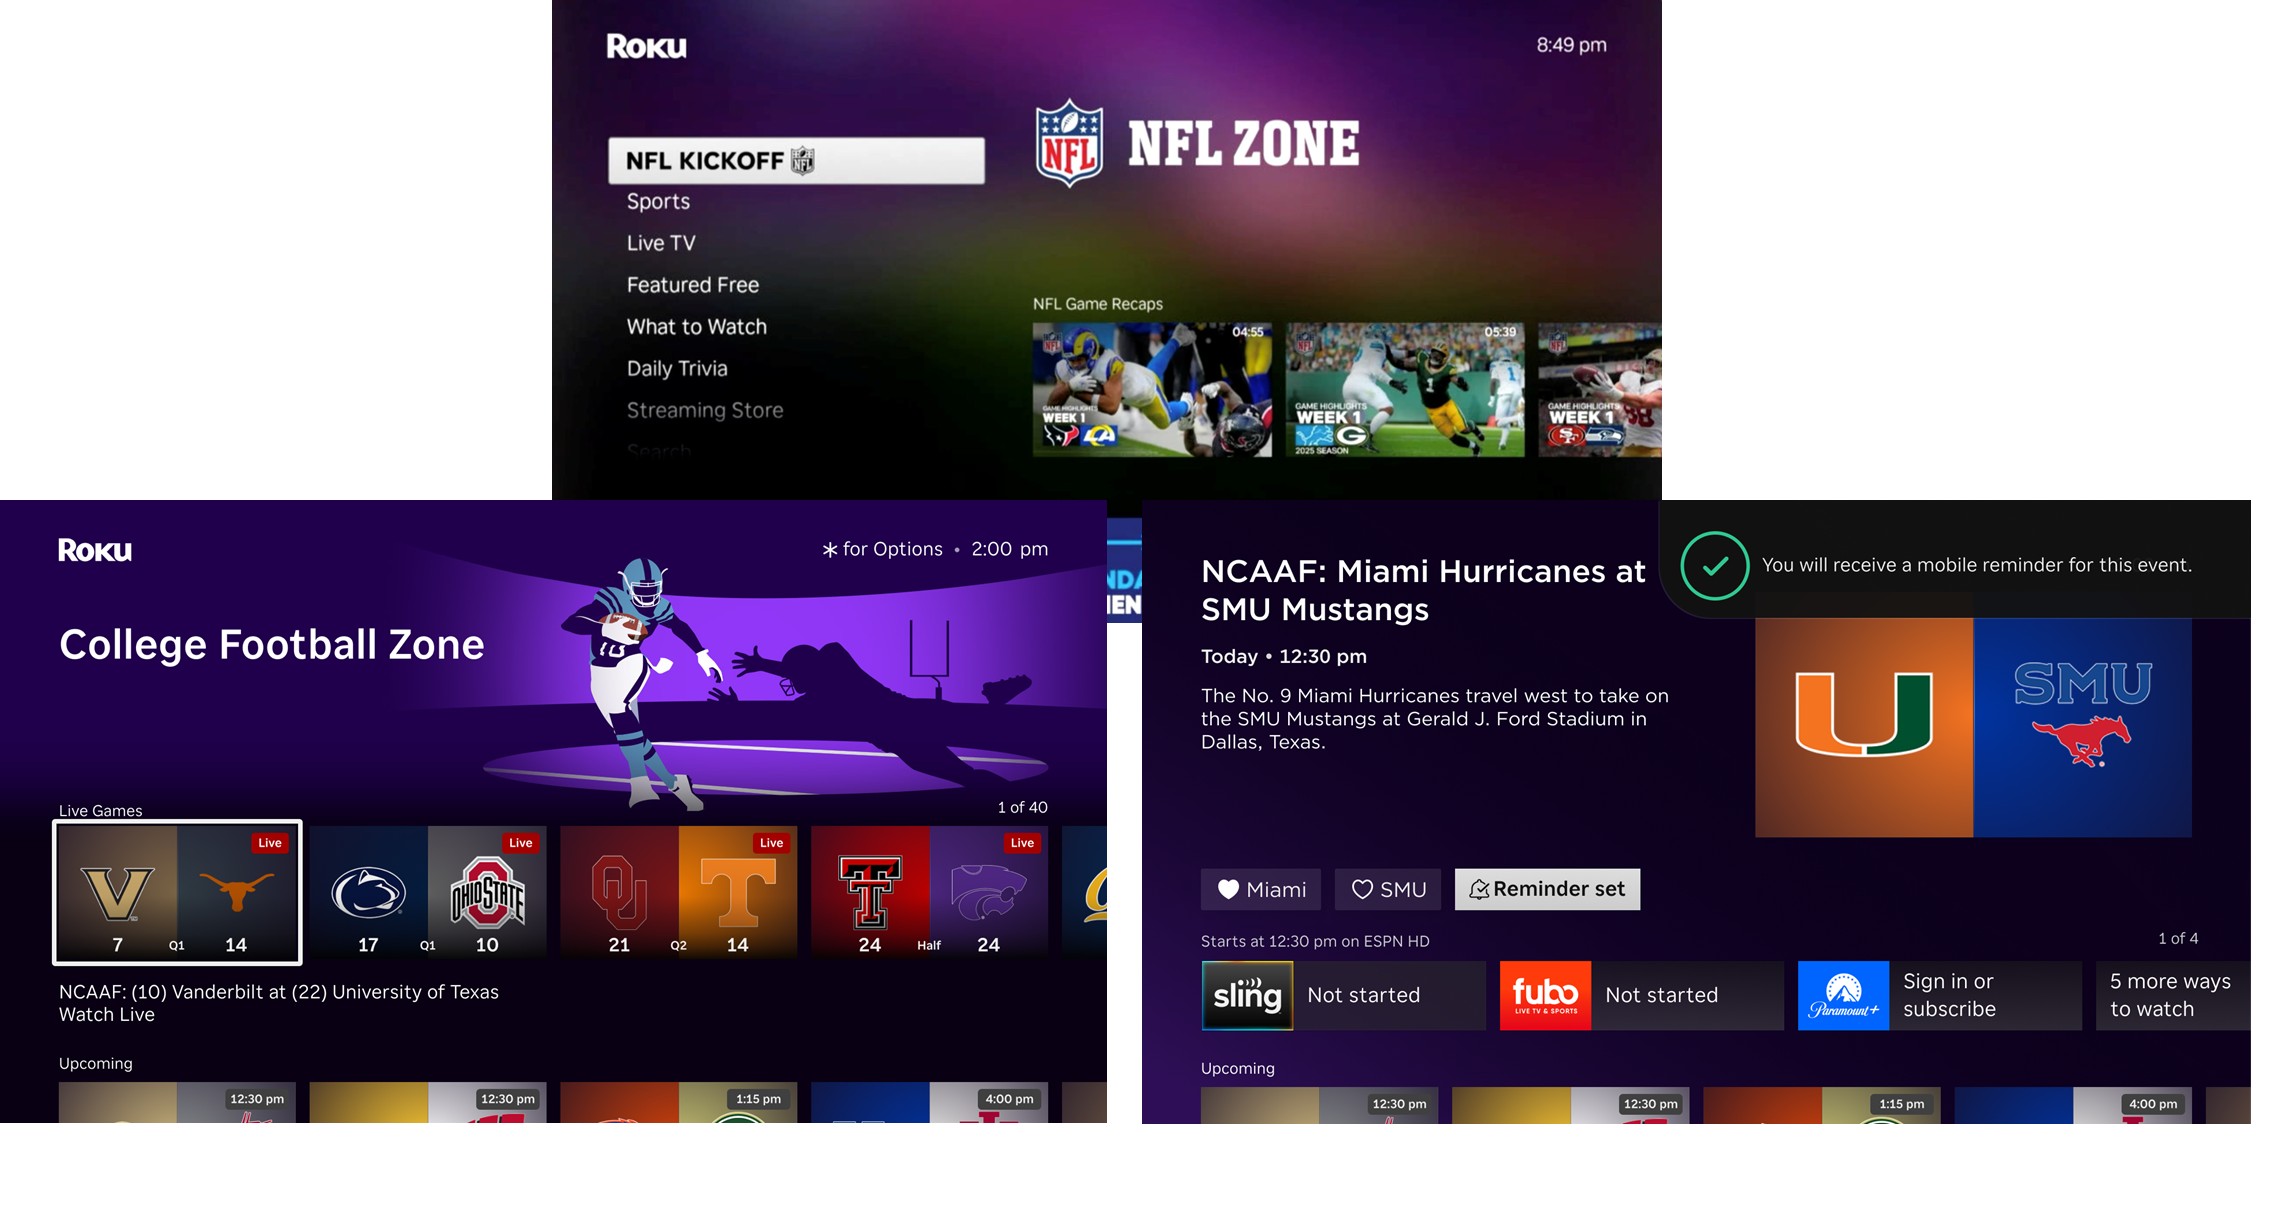
The NFL Zone, live scores for college games, and game reminders
help viewers stay informed and find their favorite teams.
We continue to innovate across search, recommendation, and Roku Voice. For example, we are leveraging AI to transform Roku Voice from a simple command tool into an intelligent entertainment guide. Viewers can now ask conversational, entertainment-based questions and receive contextual answers directly on the TV screen, making content discovery more engaging.
Search remains one of our most popular features, and this quarter, we expanded its reach and functionality. We introduced search as a discovery assistant within our What to Watch destination, added a new “Trending in Search” carousel to the Search landing page, and extended search into both the Live TV Zone and Live TV Channel Guide. Within the Live TV Channel Guide, our new Center Stage row highlights marquee live events such as the Grammys, boosting visibility, subscription sign-ups, and engagement.
On our content details page, we introduced AI-generated “Why to Watch” summaries. We also display where a show or movie is available based on the user’s active subscriptions, which helped to reduce active cancellation rates in Q3. Looking ahead, we are focused on further enhancing our subscriptions capabilities to boost discovery, conversion, and retention.
We recently launched Howdy, our new owned-and-operated SVOD service, offering high-quality movies and TV series, always ad free for only $2.99 per month. With nearly 10,000 hours of fan favorites as diverse as “The Notebook,” “Nurse Jackie,” and “Kids in the Hall,” Howdy fills a white space and is designed to complement viewers’ other streaming services. We see a significant untapped opportunity for a low-cost, ad-free streaming service, and we are leveraging the power of our platform to drive cost-efficient sign-ups and engagement, similar to our success building The Roku Channel.
Roku Q3 2025 Shareholder Letter | ||
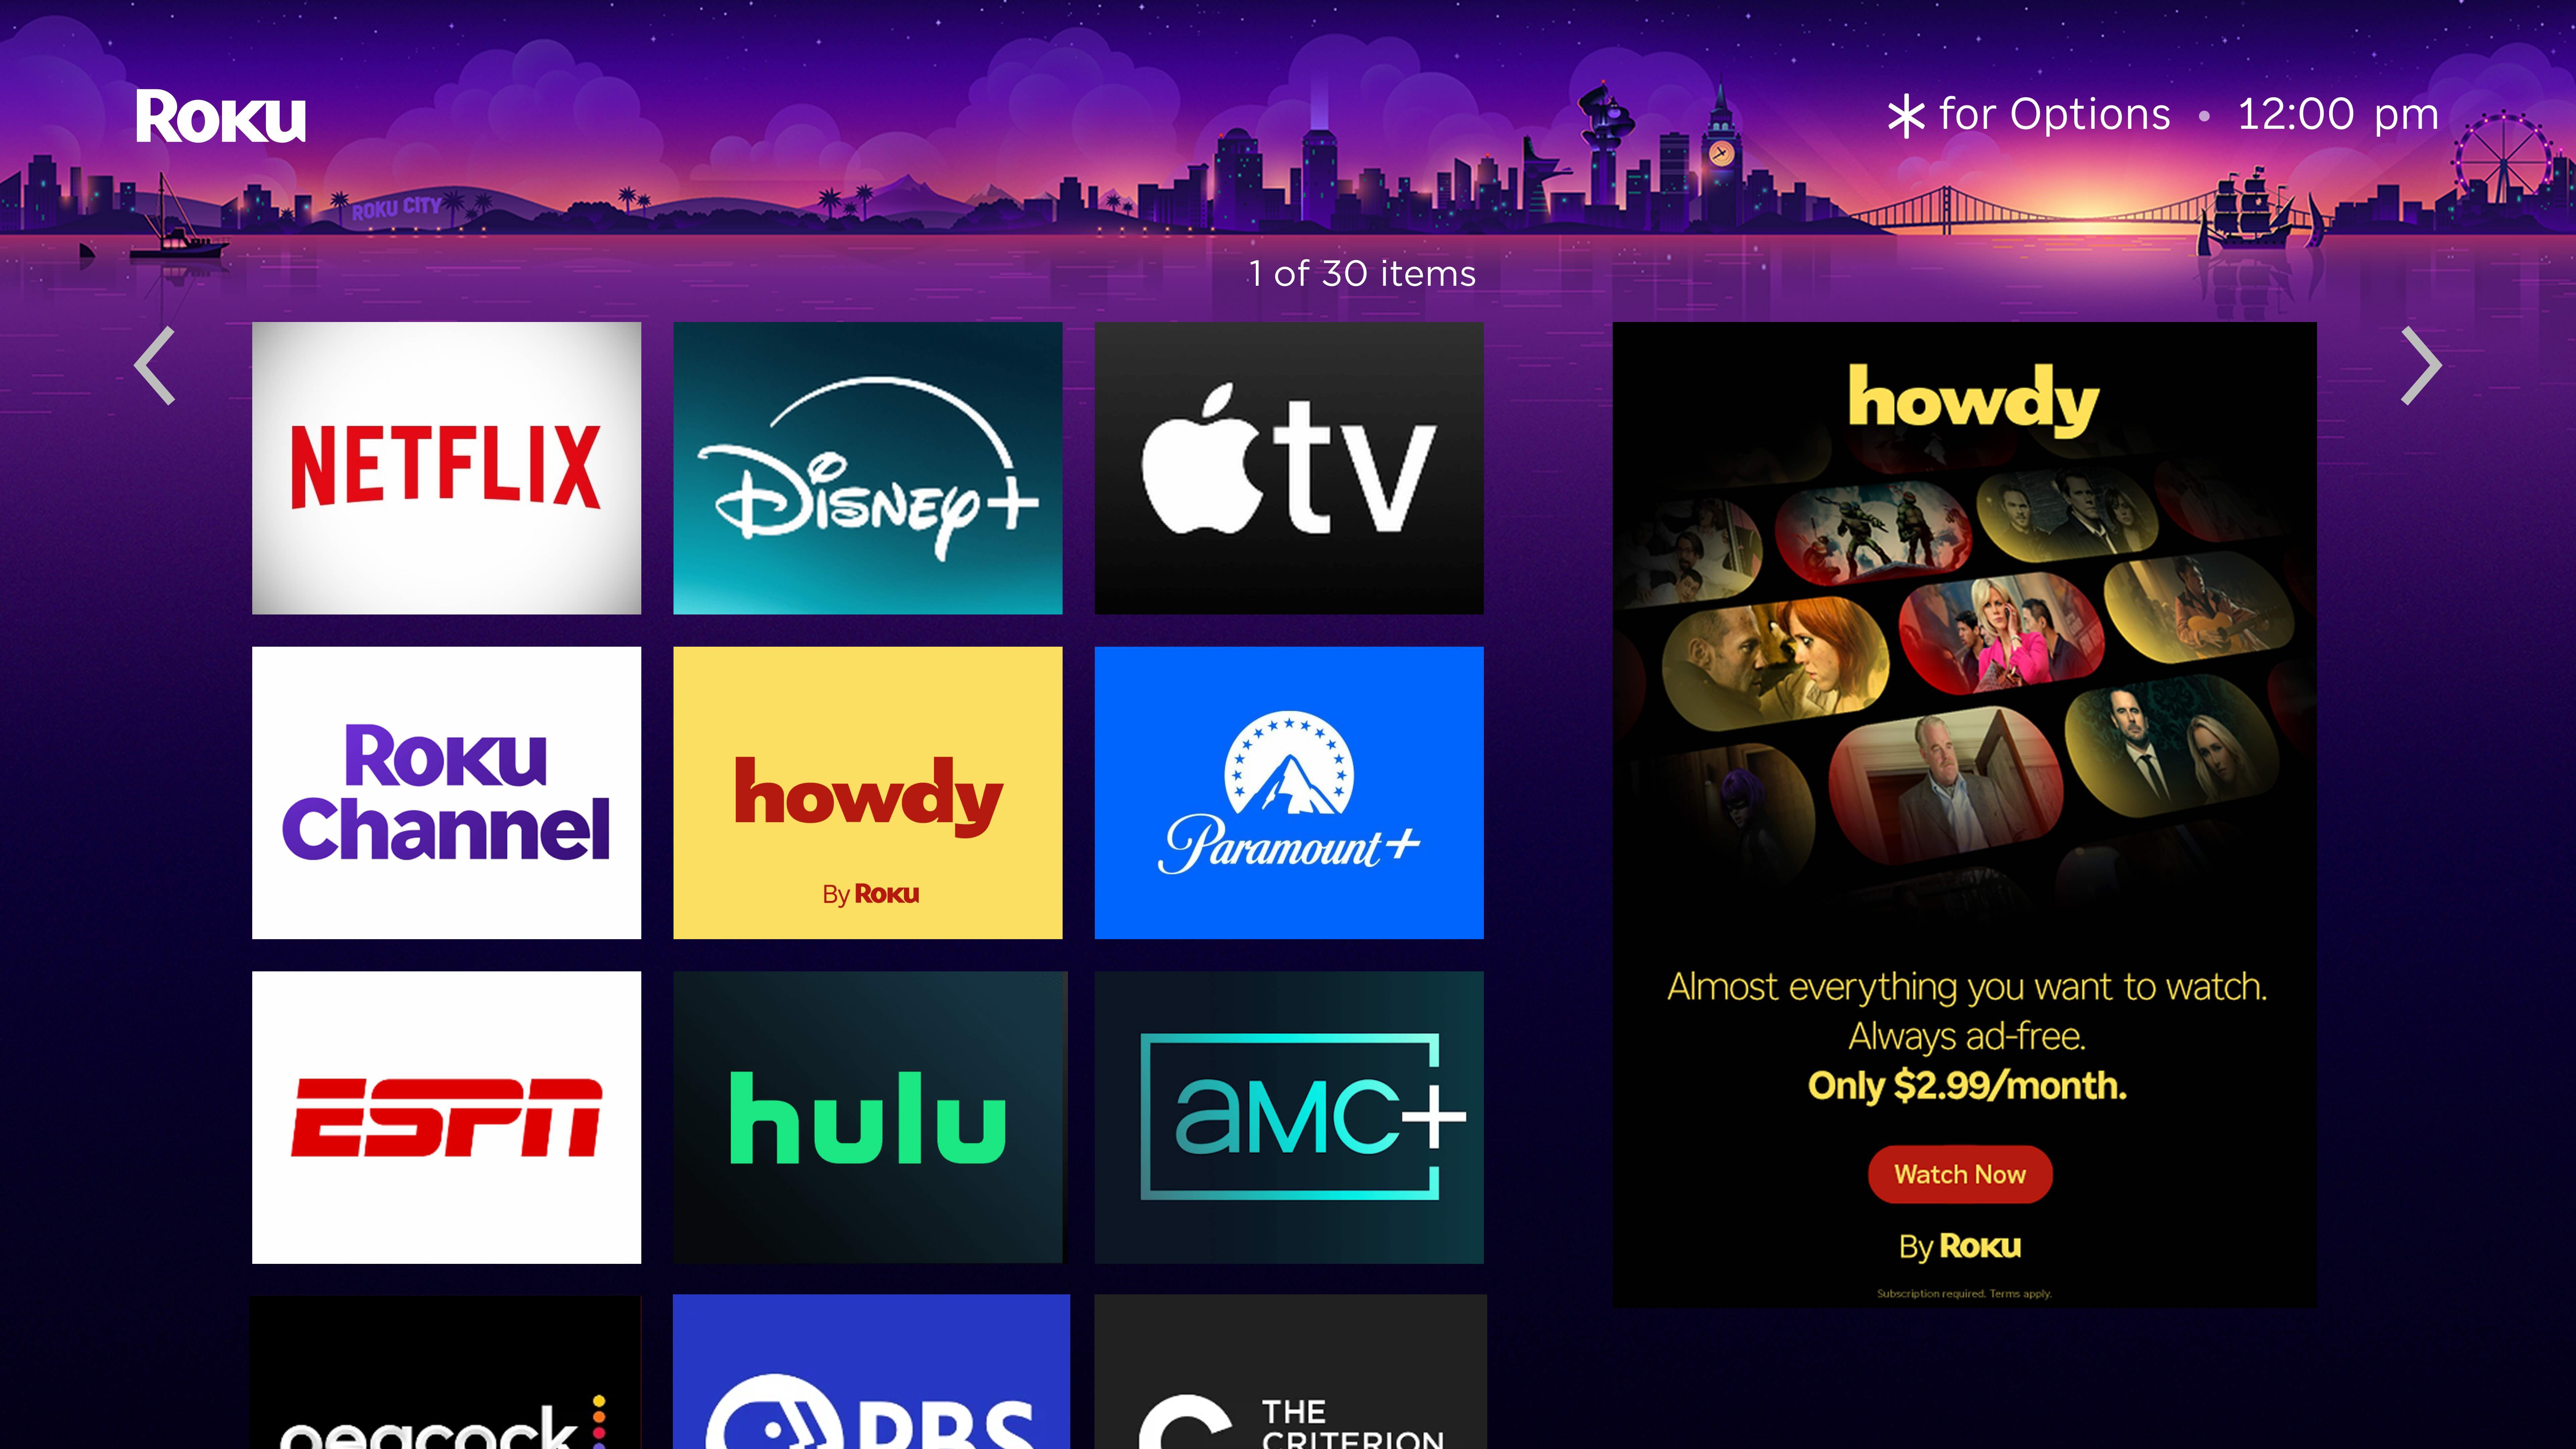
Leveraging the power of our platform to surface
Howdy’s ad-free, high-quality entertainment to our viewers.
The Roku Channel
The Roku Channel remained the #2 app on our platform by engagement in the U.S. and was the #3 app by reach globally. According to Nielsen’s The GaugeTM report, The Roku Channel in September accounted for 6.2% of all U.S. TV streaming time and remains the most‑viewed FAST2 service in the country. It was also voted “Best Free Streaming Service” in a recent Cord Cutters News survey. We are driving this growth by continuously improving content recommendations and leveraging the Roku Experience to surface the right titles for viewers. In Q3, nearly 90% of The Roku Channel’s engagement originated from Roku Experience entry points, most notably our Home Screen content row, underscoring the strength of our platform.
The Roku Channel’s growth is also fueled by a large and diverse content offering, particularly within FAST. We expanded our lineup with new content from A&E, including a channel featuring “The First 48,” one of our most successful new channel launches. We also launched channels for “Shark Tank” and “NYPD Blue,” and added “Law & Order,” which was the first-ever FAST channel dedicated to a series in the Dick Wolf Universe. These channels serve existing fans and attract new viewers with highly bingeable programming formats.
Roku Originals continue to engage audiences and create organic ad opportunities. Upon its August debut, “Solo Traveling with Tracee Ellis Ross” became our most‑watched unscripted original. It recently received a Critic's Choice nomination and has been renewed for a second season. The series also integrated Ross’ haircare brand, Pattern Beauty, and included Roku shoppable ads, enabling viewers to learn more about the products directly on the TV screen.
Devices
2 FAST: free ad-supported linear streaming TV, does not include on-demand content
Roku Q3 2025 Shareholder Letter | ||
The monetization of our platform is built upon our significant scale, which we continue to grow by distributing the Roku OS through the sale of streaming devices. In Q3, Devices revenue was $146 million, down 5% YoY, and gross profit was ($23) million, representing gross margin of (16%), which was inline with our outlook. We maintained our leadership as the #1 selling TV OS in the U.S., Canada, and Mexico. In the U.S., our share of TV units sold continues to exceed that of the #2 and #3 selling TV operating systems combined3, and our streaming devices are in more than half of broadband households, reinforcing Roku’s strong brand affinity and retail distribution.
We work with our TV OEM partners to continuously enhance the experience we can offer viewers. We recently announced the Philips Roku TV featuring Philips’ exclusive Ambilight technology, available with the Roku TV OS for the first time in the U.S. Ambilight uses intelligent LED lighting built into the back of the TV to project colors onto the wall in real time, matching the action on screen for a more immersive and dynamic viewing experience.

Philips’ exclusive Ambilight technology expands your entertainment beyond the screen.
In September, we introduced the Aurzen Roku TV Smart Projector D1R Cube, designed for both indoor and outdoor use. With a single Roku remote, auto focus, and auto keystone, it delivers flexible screen sizing for entertainment anywhere. The D1R Cube has already received positive reviews, with Tom’s Guide saying, “If you’re a fan of the Roku ecosystem and are in the market for a budget portable projector for casual barbeques or camping trips, it’s a solid new entry and the perfect place for Roku to shine.” Recently, we also announced a Vankyo Roku TV Smart Projector, which is now available at Walmart stores across the country.
3 Source: Circana, LLC, Retail Tracking Service, US, CA, and MX, Smart TV by Software Service, Unit Sales, July - September 2025
Roku Q3 2025 Shareholder Letter | ||
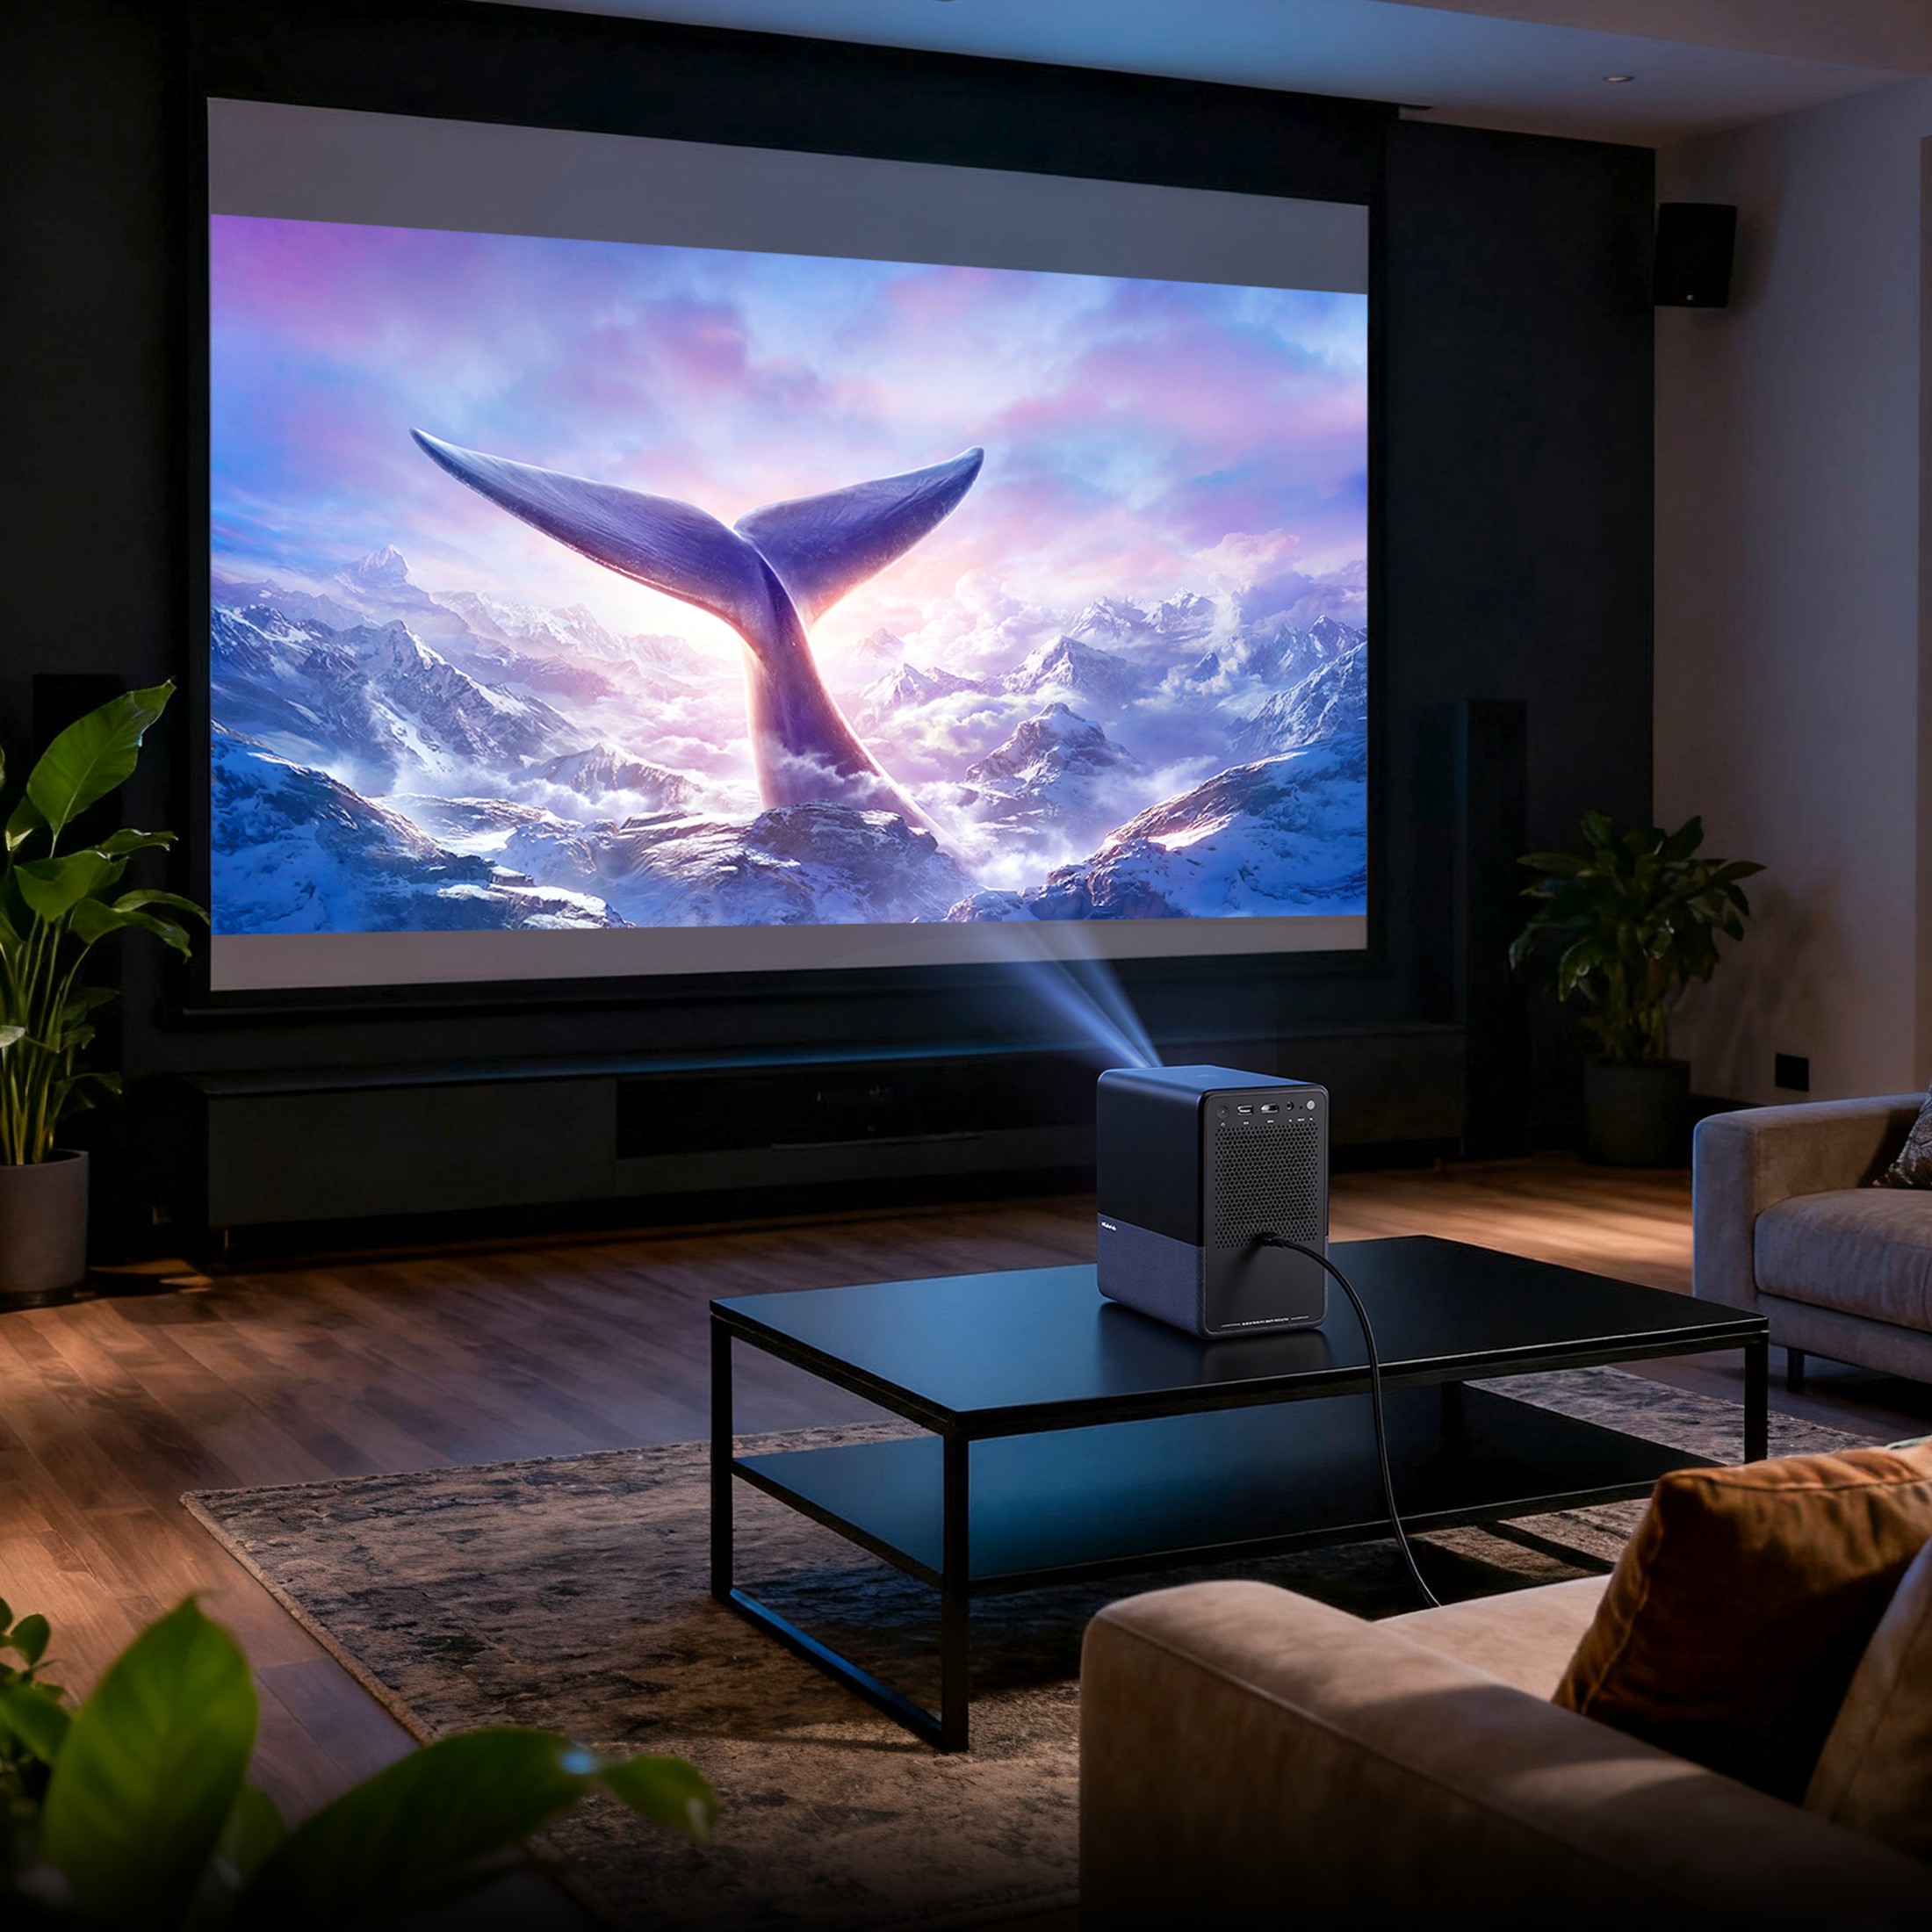
The Vankyo Roku TV Smart Projector
Outlook
For the fourth quarter, we expect total net revenue of approximately $1.35 billion, representing 12% YoY growth. Within that, Platform revenue is projected to grow 15% YoY with an estimated gross margin of approximately 52%. Excluding political advertising and our acquisition of Frndly TV, the Q4 YoY Platform revenue growth rate is expected to step up slightly from Q3. Devices revenue is anticipated to be roughly inline with the prior year quarter, while gross margin is projected to be in the negative high 20% range, primarily due to seasonality and inline with Q4 2024. Altogether, these trends are expected to result in total gross profit of approximately $575 million and Adjusted EBITDA of roughly $145 million for the quarter.
For the full year, we are raising our outlook for Platform revenue to $4.11 billion and Adjusted EBITDA to $395 million, reflecting our ongoing execution against our monetization initiatives. Platform revenue growth of nearly 17% and gross margin of approximately 52% highlight strength across both advertising and streaming services distribution activities. Devices revenue and gross profit are expected to be roughly inline with 2024 levels.
Looking ahead, we remain confident in our strategy and our long-term growth. We see significant opportunity to drive double-digit growth in Platform revenue in 2026 and beyond while increasing profitability – which will lead to increasing free cash flow per share and long-term shareholder value.
Happy Streaming™!
Anthony Wood, Founder and CEO, and Dan Jedda, CFO and COO
Roku Q3 2025 Shareholder Letter | ||
Conference Call Webcast – October 30, 2025 at 2 p.m. PT
The Company will host a webcast of its conference call to discuss the Q3 2025 results at 2 p.m. Pacific Time / 5 p.m. Eastern Time on October 30, 2025. Participants may access the live webcast in listen-only mode on the Roku investor relations website at www.roku.com/investor. An archived webcast of the conference call will also be available at www.roku.com/investor after the call.
About Roku, Inc.
Roku pioneered streaming on TV. We connect users to the content they love, enable content publishers to build and monetize large audiences, and provide advertisers with unique capabilities to engage consumers. Roku-made TVs, Roku TV™ models, Roku streaming players, and TV-related audio devices are available in various countries around the world through direct retail sales and/or licensing arrangements with TV OEM brands. Roku Smart Home products are sold exclusively in the United States. Roku also operates The Roku Channel, the home of free and premium entertainment with exclusive access to Roku Originals, and the #2 app on our platform in the U.S. by streaming hours. The Roku Channel is available in the United States, Canada, Mexico, and the United Kingdom. Roku is headquartered in San Jose, Calif., U.S.A.
Roku, Roku TV, the Roku logo, FRNDLY TV, “HAPPY STREAMING” and other trade names, trademarks or service marks of Roku appearing in this shareholder letter are the property of Roku or its affiliates. Trade names, trademarks and service marks of other companies appearing in this shareholder letter are the property of their respective holders.
Investor Relations Conrad Grodd | Media Kelli Raftery | ||||
Roku Q3 2025 Shareholder Letter | ||
Use of Non-GAAP Measures
In addition to financial information prepared in accordance with generally accepted accounting principles in the United States (GAAP), this shareholder letter includes certain non-GAAP financial measures. These non-GAAP measures include Adjusted EBITDA and Free Cash Flow (FCF). In order for our investors to be better able to compare our current results with those of previous periods, we have included a reconciliation of GAAP to non-GAAP financial measures in the tables at the end of this letter. The Adjusted EBITDA reconciliation excludes total other income, net, stock-based compensation expense, depreciation and amortization, restructuring charges, and income tax (benefit) expense from the net income (loss) of the period, and the FCF reconciliation excludes capital expenditures and effects of exchange rates from the cash flow from operations of the period, in each case where applicable. We believe these non-GAAP financial measures are useful as a supplement in evaluating our ongoing operational performance and enhancing an overall understanding of our past financial performance. However, these non-GAAP financial measures have limitations, and should not be considered in isolation or as a substitute for our GAAP financial information.
Forward-Looking Statements
This shareholder letter contains “forward-looking” statements within the meaning of the federal securities laws. Statements contained herein that are not historical facts are considered forward-looking statements and can be identified by terms such as “anticipate,” “believe,” “continue,” “could,” “estimate,” “expect,” “may,” "plan,” “seek,” “should,” “will,” “would” or similar expressions and the negatives of those terms. Such forward-looking statements are based on our current beliefs, assumptions and information available to us and involve known and unknown risks, uncertainties and other factors that may cause our actual results to be materially different from any future results expressed or implied by the forward-looking statements. These statements include those related to the growth of our scale; our ability to leverage the Roku Experience to drive growth; our focus on enhancing our subscription capabilities; the growth and performance of The Roku Channel; our innovation efforts; our initiatives to grow Platform revenue, Adjusted EBITDA, and Free Cash Flow; the impact of the timing of inbound TV units; our ability to expand our performance and measurement capabilities through strategic partnerships and innovative products; our advertising initiatives, including Ads Manager and the deepening of our integrations with third-party DSPs; our expectations regarding the growth in the portion of video impressions executed programmatically; our confidence in our strategy and long-term growth; our focus on our strategic priorities and initiatives; our financial outlook for the fourth quarter of 2025 and full year 2025 and our qualitative color on our business in 2025 and beyond; the impact of our monetization initiatives, including our path to increasing profitability; and our overall business trajectory. Important risks and factors related to such statements are contained in the reports we have filed with the Securities and Exchange Commission, including our most recent Annual Report on Form 10-K and Quarterly Report on Form 10-Q. Except as required by law, we assume no obligation to update these forward-looking statements as the result of new information, future events or otherwise.
Roku Q3 2025 Shareholder Letter | ||
ROKU, INC.
CONDENSED CONSOLIDATED STATEMENTS OF OPERATIONS
(in thousands, except per share data)
(unaudited)
| Three Months Ended | Nine Months Ended | ||||||||||||||||||||||
| September 30, 2025 | September 30, 2024 | September 30, 2025 | September 30, 2024 | ||||||||||||||||||||
| Net revenue: | |||||||||||||||||||||||
| Platform | $ | 1,064,644 | $ | 908,175 | $ | 2,920,932 | $ | 2,487,443 | |||||||||||||||
| Devices | 145,994 | 154,028 | 421,416 | 424,408 | |||||||||||||||||||
| Total net revenue | 1,210,638 | 1,062,203 | 3,342,348 | 2,911,851 | |||||||||||||||||||
| Cost of revenue: | |||||||||||||||||||||||
Platform (1) | 516,869 | 416,396 | 1,411,170 | 1,161,416 | |||||||||||||||||||
Devices (1) | 168,870 | 165,732 | 463,576 | 457,369 | |||||||||||||||||||
| Total cost of revenue | 685,739 | 582,128 | 1,874,746 | 1,618,785 | |||||||||||||||||||
| Gross profit (loss): | |||||||||||||||||||||||
| Platform | 547,775 | 491,779 | 1,509,762 | 1,326,027 | |||||||||||||||||||
| Devices | (22,876) | (11,704) | (42,160) | (32,961) | |||||||||||||||||||
| Total gross profit | 524,899 | 480,075 | 1,467,602 | 1,293,066 | |||||||||||||||||||
| Operating expenses: | |||||||||||||||||||||||
Research and development (1) | 182,235 | 178,798 | 544,831 | 534,738 | |||||||||||||||||||
Sales and marketing (1) | 242,077 | 237,047 | 709,026 | 660,827 | |||||||||||||||||||
General and administrative (1) | 91,121 | 99,993 | 285,342 | 276,543 | |||||||||||||||||||
| Total operating expenses | 515,433 | 515,838 | 1,539,199 | 1,472,108 | |||||||||||||||||||
| Income (loss) from operations | 9,466 | (35,763) | (71,597) | (179,042) | |||||||||||||||||||
| Other income, net: | |||||||||||||||||||||||
| Interest expense | (455) | — | (1,348) | — | |||||||||||||||||||
| Other income, net | 29,019 | 30,880 | 75,134 | 84,955 | |||||||||||||||||||
| Total other income, net | 28,564 | 30,880 | 73,786 | 84,955 | |||||||||||||||||||
| Income (loss) before income taxes | 38,030 | (4,883) | 2,189 | (94,087) | |||||||||||||||||||
| Income tax expense (benefit) | 13,218 | 4,147 | (5,695) | (249) | |||||||||||||||||||
| Net income (loss) | $ | 24,812 | $ | (9,030) | $ | 7,884 | $ | (93,838) | |||||||||||||||
| Net income (loss) per share — basic | $ | 0.17 | $ | (0.06) | $ | 0.05 | $ | (0.65) | |||||||||||||||
| Net income (loss) per share — diluted | $ | 0.16 | $ | (0.06) | $ | 0.05 | $ | (0.65) | |||||||||||||||
| Weighted-average common shares outstanding — basic | 147,466 | 144,862 | 146,855 | 144,319 | |||||||||||||||||||
| Weighted-average common shares outstanding — diluted | 151,580 | 144,862 | 150,449 | 144,319 | |||||||||||||||||||
(1) Stock-based compensation was allocated as follows:
| Cost of revenue, platform | $ | 247 | $ | 366 | $ | 972 | $ | 1,062 | |||||||||||||||
| Cost of revenue, devices | 75 | 163 | 183 | 1,201 | |||||||||||||||||||
| Research and development | 34,496 | 38,502 | 103,315 | 109,457 | |||||||||||||||||||
| Sales and marketing | 31,921 | 36,401 | 97,193 | 100,353 | |||||||||||||||||||
| General and administrative | 21,292 | 24,664 | 66,502 | 71,051 | |||||||||||||||||||
| Total stock-based compensation | $ | 88,031 | $ | 100,096 | $ | 268,165 | $ | 283,124 | |||||||||||||||
Roku Q3 2025 Shareholder Letter | ||
ROKU, INC.
CONDENSED CONSOLIDATED BALANCE SHEETS
(in thousands, except par value data)
(unaudited)
| As of | |||||||||||
| September 30, 2025 | December 31, 2024 | ||||||||||
| Assets | |||||||||||
| Current assets: | |||||||||||
| Cash and cash equivalents | $ | 1,575,491 | $ | 2,160,236 | |||||||
| Short-term investments | 726,875 | — | |||||||||
Accounts receivable, net of allowances of $60,345 and $72,657 as of September 30, 2025 and December 31, 2024, respectively | 745,405 | 812,510 | |||||||||
| Inventories | 140,682 | 158,271 | |||||||||
| Prepaid expenses and other current assets | 140,239 | 103,146 | |||||||||
| Total current assets | 3,328,692 | 3,234,163 | |||||||||
| Property and equipment, net | 182,809 | 213,690 | |||||||||
| Operating lease right-of-use assets | 272,877 | 304,505 | |||||||||
| Content assets, net | 175,126 | 237,321 | |||||||||
| Intangible assets, net | 56,540 | 27,501 | |||||||||
| Goodwill | 309,406 | 161,519 | |||||||||
| Other non-current assets | 71,835 | 125,234 | |||||||||
| Total Assets | $ | 4,397,285 | $ | 4,303,933 | |||||||
| Liabilities and Stockholders’ Equity | |||||||||||
| Current liabilities: | |||||||||||
| Accounts payable | $ | 159,455 | $ | 273,985 | |||||||
| Accrued liabilities | 933,717 | 852,799 | |||||||||
| Deferred revenue, current portion | 122,309 | 105,718 | |||||||||
| Total current liabilities | 1,215,481 | 1,232,502 | |||||||||
| Deferred revenue, non-current portion | 28,046 | 25,050 | |||||||||
| Operating lease liability, non-current portion | 457,405 | 512,706 | |||||||||
| Other long-term liabilities | 71,267 | 40,938 | |||||||||
| Total Liabilities | 1,772,199 | 1,811,196 | |||||||||
| Stockholders’ Equity: | |||||||||||
| Common stock, $0.0001 par value | 15 | 15 | |||||||||
| Additional paid-in capital | 4,092,846 | 3,921,432 | |||||||||
| Accumulated other comprehensive income (loss) | 1,314 | (1,737) | |||||||||
| Accumulated deficit | (1,469,089) | (1,426,973) | |||||||||
| Total stockholders’ equity | 2,625,086 | 2,492,737 | |||||||||
| Total Liabilities and Stockholders’ Equity | $ | 4,397,285 | $ | 4,303,933 | |||||||
Roku Q3 2025 Shareholder Letter | ||
ROKU, INC.
CONDENSED CONSOLIDATED STATEMENTS OF CASH FLOWS
(in thousands)
(unaudited)
| Nine Months Ended | |||||||||||
| September 30, 2025 | September 30, 2024 | ||||||||||
| Cash flows from operating activities: | |||||||||||
| Net income (loss) | $ | 7,884 | $ | (93,838) | |||||||
| Adjustments to reconcile net income (loss) to net cash provided by operating activities: | |||||||||||
| Depreciation and amortization | 51,514 | 47,629 | |||||||||
| Stock-based compensation expense | 268,165 | 283,124 | |||||||||
| Amortization of right-of-use assets | 36,231 | 35,674 | |||||||||
| Amortization and write-off of content assets | 153,608 | 158,892 | |||||||||
| Foreign currency remeasurement losses | 196 | 674 | |||||||||
| Change in fair value of strategic investment in convertible promissory notes | 324 | (6,978) | |||||||||
| Change in fair value of contingent consideration | 1,394 | — | |||||||||
| Impairment of assets | 2,870 | 29,118 | |||||||||
| Provision for doubtful accounts | 2,252 | 2,081 | |||||||||
| Other items, net | (1,952) | (2,224) | |||||||||
| Changes in operating assets and liabilities: | |||||||||||
| Accounts receivable | 71,033 | 83,828 | |||||||||
| Inventories | 17,589 | (99,084) | |||||||||
| Prepaid expenses and other current assets | (1,041) | (40,952) | |||||||||
| Content assets and liabilities, net | (123,461) | (141,345) | |||||||||
| Other non-current assets | 6,859 | (19,996) | |||||||||
| Accounts payable | (120,826) | (57,937) | |||||||||
| Accrued liabilities | 75,615 | 14,044 | |||||||||
| Operating lease liabilities | (60,338) | (45,766) | |||||||||
| Other long-term liabilities | (7,456) | 1,866 | |||||||||
| Deferred revenue | (4,392) | (10,057) | |||||||||
| Net cash provided by operating activities | 376,068 | 138,753 | |||||||||
| Cash flows from investing activities: | |||||||||||
| Purchases of property and equipment | (4,189) | (2,603) | |||||||||
| Purchase of business, net of cash acquired | (95,090) | — | |||||||||
| Purchases of strategic investments | (7,000) | (20,000) | |||||||||
| Purchases of short-term investments | (725,000) | — | |||||||||
| Repayment of convertible promissory note | 10,000 | — | |||||||||
| Net cash used in investing activities | (821,279) | (22,603) | |||||||||
| Cash flows from financing activities: | |||||||||||
| Issuance costs related to credit agreement | — | (1,829) | |||||||||
| Proceeds from equity issued under incentive plans | 18,320 | 8,981 | |||||||||
| Taxes paid related to net share settlement of equity awards | (115,071) | (63,884) | |||||||||
| Repurchases of common stock | (50,000) | — | |||||||||
| Net cash used in financing activities | (146,751) | (56,732) | |||||||||
| Net increase (decrease) in cash, cash equivalents and restricted cash | (591,962) | 59,418 | |||||||||
| Effect of exchange rate changes on cash, cash equivalents and restricted cash | 6,814 | 2,774 | |||||||||
| Cash, cash equivalents and restricted cash—beginning of period | 2,160,639 | 2,066,604 | |||||||||
| Cash, cash equivalents and restricted cash—end of period | $ | 1,575,491 | $ | 2,128,796 | |||||||
Roku Q3 2025 Shareholder Letter | ||
| Nine Months Ended | |||||||||||
| September 30, 2025 | September 30, 2024 | ||||||||||
| Cash, cash equivalents and restricted cash at end of period: | |||||||||||
| Cash and cash equivalents | $ | 1,575,491 | $ | 2,126,974 | |||||||
| Restricted cash, current | — | 1,822 | |||||||||
| Cash, cash equivalents and restricted cash—end of period | $ | 1,575,491 | $ | 2,128,796 | |||||||
| Supplemental disclosures of cash flow information: | |||||||||||
| Cash paid for interest | $ | 693 | $ | 106 | |||||||
| Cash paid for income taxes | $ | 12,523 | $ | 13,235 | |||||||
| Supplemental disclosures of non-cash investing and financing activities: | |||||||||||
| Non-cash contingent consideration for business combination | $ | 65,815 | $ | — | |||||||
| Unpaid portion of property and equipment purchases | $ | 71 | $ | 169 | |||||||
Roku Q3 2025 Shareholder Letter | ||
ROKU, INC.
NON-GAAP INFORMATION
(in thousands)
(unaudited)
Reconciliation of Net Income (Loss) to Adjusted EBITDA:
| Three Months Ended | Nine Months Ended | ||||||||||||||||||||||
| September 30, 2025 | September 30, 2024 | September 30, 2025 | September 30, 2024 | ||||||||||||||||||||
| Net income (loss) | $ | 24,812 | $ | (9,030) | $ | 7,884 | $ | (93,838) | |||||||||||||||
| Total other income, net | (28,564) | (30,880) | (73,786) | (84,955) | |||||||||||||||||||
| Stock-based compensation | 88,031 | 100,096 | 268,165 | 283,124 | |||||||||||||||||||
| Depreciation and amortization | 19,441 | 15,349 | 51,514 | 47,629 | |||||||||||||||||||
Restructuring charges (1) | — | 18,521 | 3,064 | 30,999 | |||||||||||||||||||
| Income tax expense (benefit) | 13,218 | 4,147 | (5,695) | (249) | |||||||||||||||||||
| Adjusted EBITDA | $ | 116,938 | $ | 98,203 | $ | 251,146 | $ | 182,710 | |||||||||||||||
(1) The restructuring charges for the nine months ended September 30, 2025 primarily include asset impairment charges of $2.9 million. Restructuring charges for the three and nine months ended September 30, 2024 primarily include asset impairment charges of $17.6 million and $29.1 million, respectively.
Free Cash Flow (TTM):
| Q3 24 | Q4 24 | Q1 25 | Q2 25 | Q3 25 | |||||||||||||||||||||||||
| Net cash provided by operating activities | $ | 155,080 | $ | 218,045 | $ | 310,094 | $ | 396,421 | $ | 455,360 | |||||||||||||||||||
| Less: Purchases of property and equipment | (6,123) | (5,061) | (6,320) | (6,567) | (6,647) | ||||||||||||||||||||||||
| Add/(Less): Effect of exchange rate changes on cash, cash equivalents and restricted cash | 8,392 | (9,746) | (5,328) | 2,133 | (5,706) | ||||||||||||||||||||||||
| Free Cash Flow (TTM) | $ | 157,349 | $ | 203,238 | $ | 298,446 | $ | 391,987 | $ | 443,007 | |||||||||||||||||||
Roku Q3 2025 Shareholder Letter | ||