
Forward-Looking Statements Forward-looking statements in this presentation regarding the Company’s future performance, long term outlook, strategic plan and initiatives, operations, free cash flow, use of capital, projected financials, including EBITDA growth, revenue, off-premise sales growth costs and expenses, and all other statements that are not historical facts, are made under the safe harbor provisions of the Private Securities Litigation Reform Act of 1995. These statements are based on assumptions believed by us to be reasonable and speak only as of the date on which such statements are made. Without limiting the generality of the foregoing, words such as “should,” “will,” “expect,” “complete,” “continue,” “trajectory,” “increase,” “planned,” “improving,” “development,” “expanding,” “growth” or “potential,” or the negative or other variations thereof or comparable terminology are intended to identify forward-looking statements. Except as required by law, we undertake no obligation to update such statements to reflect events or circumstances arising after such date, and we caution investors not to place undue reliance on any such forward-looking statements. Forward-looking statements involve risks and uncertainties that could cause actual results to differ materially from those described in the statements based on a number of factors, including but not limited to the following: the effectiveness of the Company’s strategic initiatives, including alternate labor models, service and operational improvement initiatives, the ability to train and retain the Company’s workforce for service execution including the complexities related to growth of multiple channels within the restaurants; the effectiveness of the Company’s marketing strategies and promotions; menu changes, including the anticipated sales growth, costs and timing of the Donatos expansion; the implementation and rollout of new technology solutions in the restaurants and timing thereof; the ability to increase off-premise sales; the ability to achieve anticipated revenue and cost savings from these and other initiatives; the Company’s franchise strategy; competition in the casual dining market and discounting by competitors; the cost and availability of key food products, distribution, labor, and energy; general economic conditions; the cost and availability of capital or credit facility borrowings; the adequacy of cash flows or available debt resources to fund operations and growth opportunities; limitations on our ability to execute stock repurchases at all or at the times or in the amounts we currently anticipate or to otherwise achieve anticipated benefits of a share repurchase program; our ability to attract and retain qualified managers and Team Members; the impact of our adoption of a shareholder rights plan; federal, state and local regulation of our business; and other risk factors described in our annual report on Form 10-K, our quarterly reports on Form 10-Q, and our periodic reports on Form 8-K (including all amendments to those reports (collectively, our “Reports”) filed with the U.S. Securities and Exchange Commission. Investors are directed to consult our Reports for further information.

Paul Murphy President and CEO Red Robin Joined Noodles & Company as Executive Chairman in 2017 Led successful brand turnaround, delivering 4 consecutive quarters of comparable restaurant sales growth and EBITDA growth of ~28% in 2018 compared to 2016 Joined Del Taco Restaurants as CEO in 2009 Executed a brand repositioning in 2012 which resulted in 17 consecutive quarters of company-operated comparable restaurant sales growth Took the company public in 2015 and grew EBITDA by ~33% in 2016 compared to 2012 Deep operational experience Held several senior operational positions at Einstein Noah Restaurant Group before assuming the CEO role Proven track record leading change and creating substantial shareholder value

The enormous potential for Red Robin to be one of the top performing Brands in Casual Dining! Personal research and diligence The strong emotional connective tissue of guests to Red Robin Majority had a positive story or memory of a Red Robin experience While there were brand drift/service model missteps, guests commented that they would reengage with Red Robin if these issues were addressed Identified operational issues were fixable and brand issues researchable Loved the “Americana” feel of Red Robin Strong alignment with Red Robin values After 90 days, even more excited about greater upside potential The People – the passion of a team that wants to be successful/win, especially at the restaurant level, General Managers and above restaurant Catalysts for Growth – menu enhancement, off-premise & restaurant development Completed brand positioning work which provides actionable insights Why Red Robin?

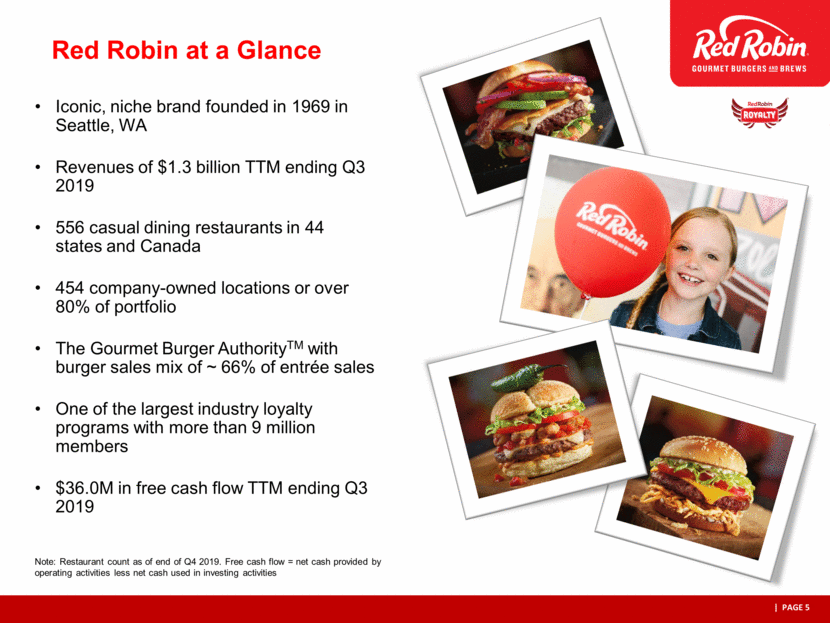
Iconic, niche brand founded in 1969 in Seattle, WA Revenues of $1.3 billion TTM ending Q3 2019 556 casual dining restaurants in 44 states and Canada 454 company-owned locations or over 80% of portfolio The Gourmet Burger AuthorityTM with burger sales mix of ~ 66% of entrée sales One of the largest industry loyalty programs with more than 9 million members $36.0M in free cash flow TTM ending Q3 2019 Note: Restaurant count as of end of Q4 2019. Free cash flow = net cash provided by operating activities less net cash used in investing activities Red Robin at a Glance
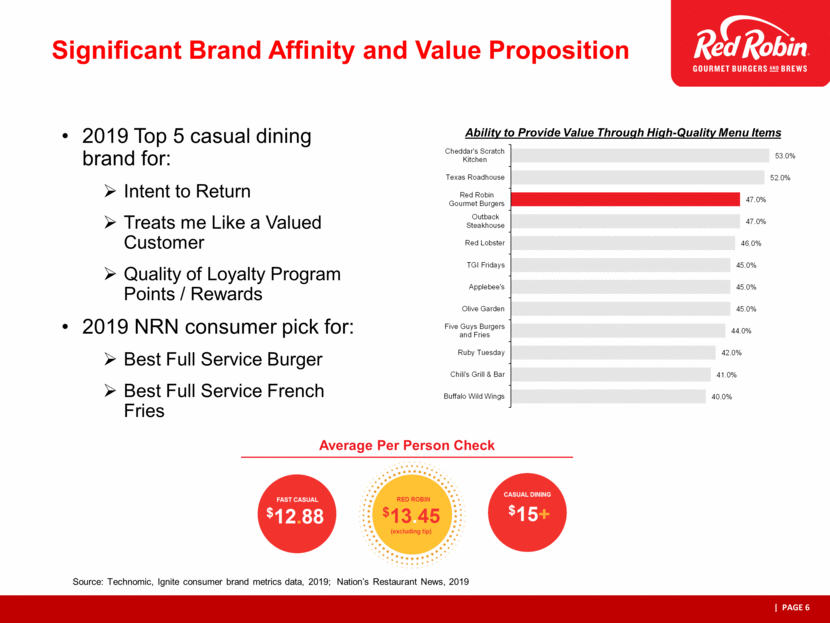
Ability to Provide Value Through High-Quality Menu Items Source: Technomic, Ignite consumer brand metrics data, 2019; Nation’s Restaurant News, 2019 2019 Top 5 casual dining brand for: Intent to Return Treats me Like a Valued Customer Quality of Loyalty Program Points / Rewards 2019 NRN consumer pick for: Best Full Service Burger Best Full Service French Fries Average Per Person Check Significant Brand Affinity and Value Proposition 53.0% 52.0% 47.0% 47.0% 46.0% 45.0% 45.0% 45.0% 44.0% 42.0% 41.0% 40.0% Cheddar's Scratch Kitchen Texas Roadhouse Red Robin Gourmet Burgers Outback Steakhouse Red Lobster TGI Fridays Applebee's Olive Garden Five Guys Burgers and Fries Ruby Tuesday Chili's Grill & Bar Buffalo Wild Wings
Performance improvements throughout 2019 New CEO Diagnoses of our opportunities Research and guest led Facts, no opinions Opportunities were clear Brand drift Service model missteps Mixed messaging Financial underperformance Aligned 2019 Operations priority initiatives to address areas to deliver higher guest satisfaction, affinity and frequency Crystalized our brand positioning Implemented a new service model test Launched a new omni-channel creative campaign strategy Suspended refranchising program, with potential consideration in the future 2019: A Year of Foundational Change
Note: Comparable restaurants calculated at constant currency rates. Period traffic / PPA is US corporate units only. SSS Results Summary 2019 PPA Improving As We Unwind Discounting Topline improvement continued with Q4 2019 SSS growth of 1.3% Enterprise Sales Trends Improving -7.0% -5.0% -3.0% -1.0% 1.0% 3.0% 5.0% Q1-17 Q2-17 Q3-17 Q4-17 Q1-18 Q2-18 Q3-18 Q4-18 Q1-19 Q2-19 Q3-19 Q4-19 Sales Traffic PPA

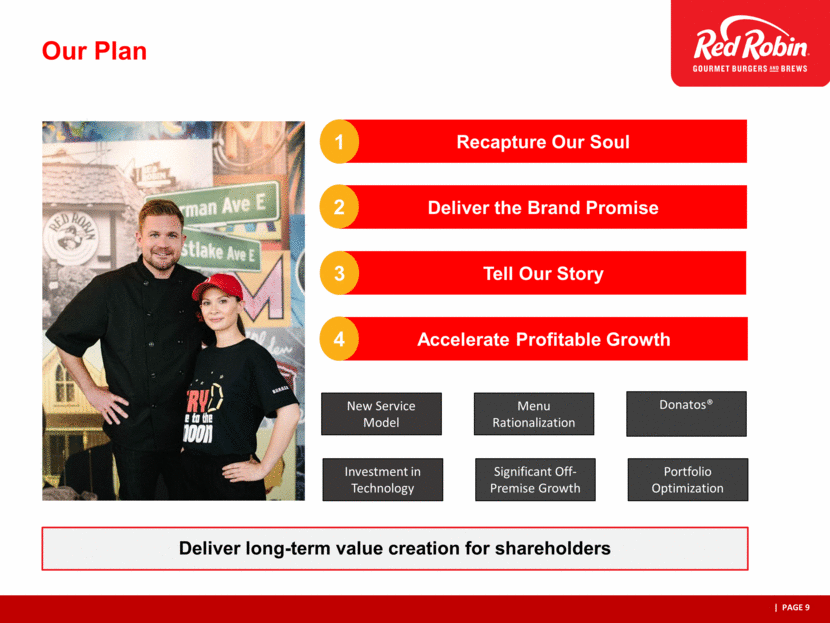
Our Plan Tell Our Story Deliver the Brand Promise Recapture Our Soul Accelerate Profitable Growth New Service Model Menu Rationalization Donatos® Investment in Technology Significant Off-Premise Growth Portfolio Optimization 4 3 2 1 Deliver long-term value creation for shareholders
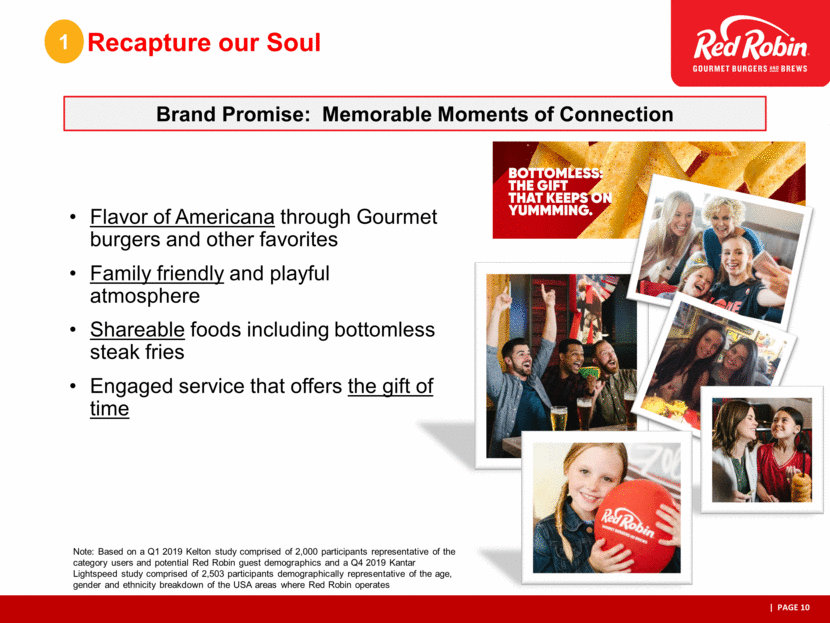
Recapture our Soul Flavor of Americana through Gourmet burgers and other favorites Family friendly and playful atmosphere Shareable foods including bottomless steak fries Engaged service that offers the gift of time Brand Promise: Memorable Moments of Connection 1 Note: Based on a Q1 2019 Kelton study comprised of 2,000 participants representative of the category users and potential Red Robin guest demographics and a Q4 2019 Kantar Lightspeed study comprised of 2,503 participants demographically representative of the age, gender and ethnicity breakdown of the USA areas where Red Robin operates
New service model Menu rationalization Leverage technology Staffing, retention and GM tenure in restaurant 2 Deliver the Promise

Foundational Initiatives in Place to Improve Execution with New Service Model Q4 2018 Q1 2019 Q2 2019 Q3 2019 Q4 2019 Q1 2020 Q2 2020 Headsets Menu Rationalization (ongoing) Sticky Media SAMs (server POS handhelds) New Service Model 1 2 3 4 5 Implementation of core initiatives to help simplify and improve execution 2

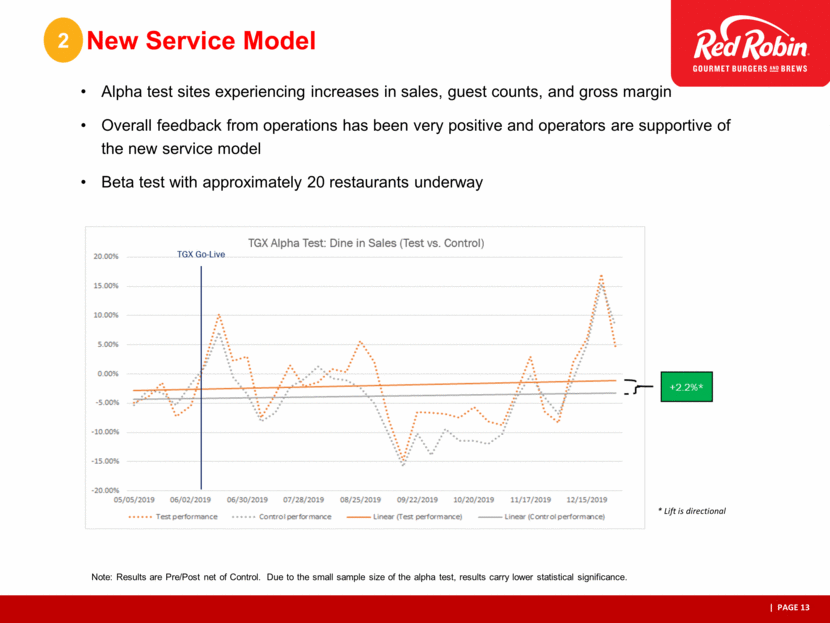
CLASSIFIED – INTERNAL USE ONLY PAGE 13 CATEGORY New Service Model 2 Note: Results are Pre/Post net of Control. Due to the small sample size of the alpha test, results carry lower statistical significance. * Lift is directional Alpha test sites experiencing increases in sales, guest counts, and gross margin Overall feedback from operations has been very positive and operators are supportive of the new service model Beta test with approximately 20 restaurants underway
CATEGORY Brand and Insights-Driven Menu Rationalization Core product quality improvements Improve the “gift of time” Insights-driven product innovation Menu design enhancements Opportunity to grow beverage sales 2 Brand and insights-driven research will drive menu evolution

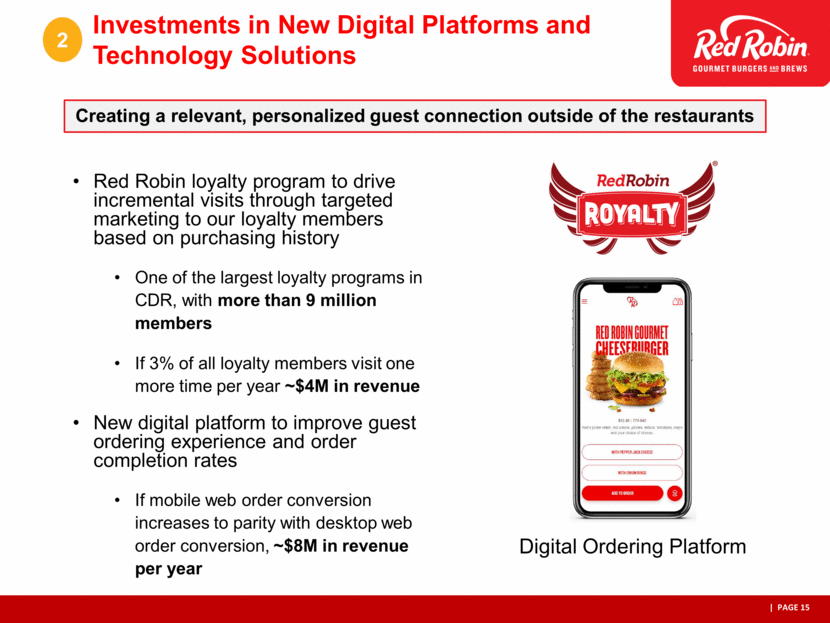
Investments in New Digital Platforms and Technology Solutions Red Robin loyalty program to drive incremental visits through targeted marketing to our loyalty members based on purchasing history One of the largest loyalty programs in CDR, with more than 9 million members If 3% of all loyalty members visit one more time per year ~$4M in revenue New digital platform to improve guest ordering experience and order completion rates If mobile web order conversion increases to parity with desktop web order conversion, ~$8M in revenue per year 2 Digital Ordering Platform Creating a relevant, personalized guest connection outside of the restaurants
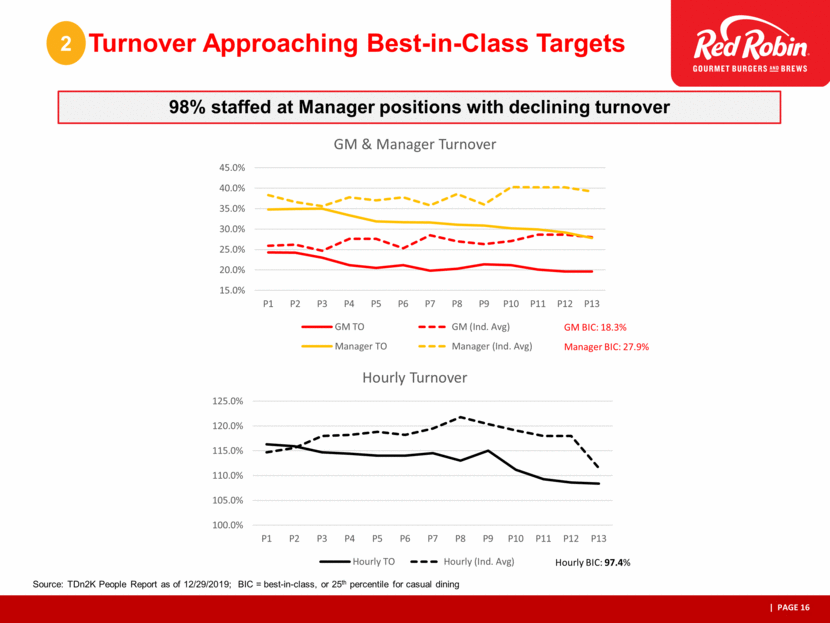
Turnover Approaching Best-in-Class Targets 2 Hourly BIC: 97.4% GM BIC: 18.3% Manager BIC: 27.9% Source: TDn2K People Report as of 12/29/2019; BIC = best-in-class, or 25th percentile for casual dining 98% staffed at Manager positions with declining turnover 15.0% 20.0% 25.0% 30.0% 35.0% 40.0% 45.0% P1 P2 P3 P4 P5 P6 P7 P8 P9 P10 P11 P12 P13 GM & Manager Turnover GM TO GM (Ind. Avg) Manager TO Manager (Ind. Avg) 100.0% 105.0% 110.0% 115.0% 120.0% 125.0% P1 P2 P3 P4 P5 P6 P7 P8 P9 P10 P11 P12 P13 Hourly Turnover Hourly TO Hourly (Ind. Avg)
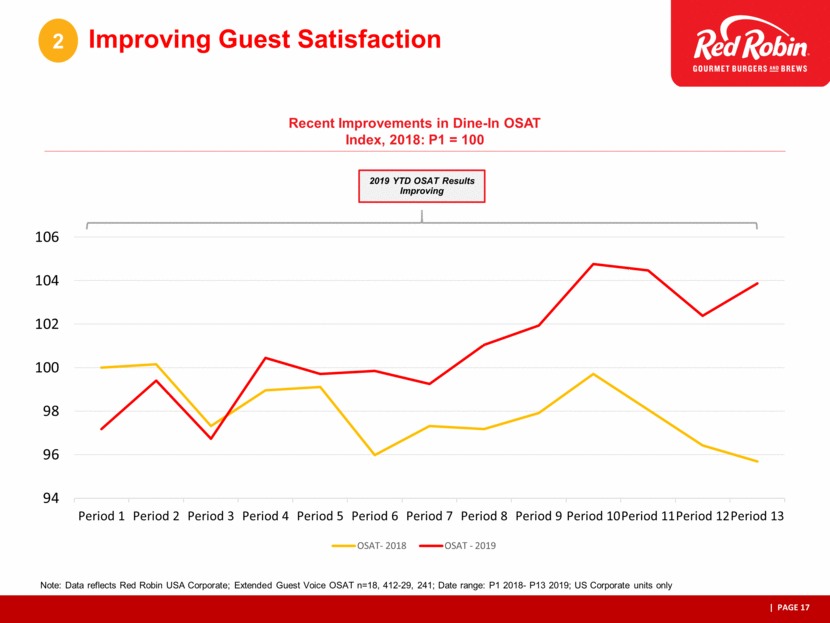
Improving Guest Satisfaction 2 Recent Improvements in Dine-In OSAT Index, 2018: P1 = 100 2019 YTD OSAT Results Improving Note: Data reflects Red Robin USA Corporate; Extended Guest Voice OSAT n=18, 412-29, 241; Date range: P1 2018- P13 2019; US Corporate units only 94 96 98 100 102 104 106 Period 1 Period 2 Period 3 Period 4 Period 5 Period 6 Period 7 Period 8 Period 9 Period 10 Period 11 Period 12 Period 13 OSAT- 2018 OSAT - 2019
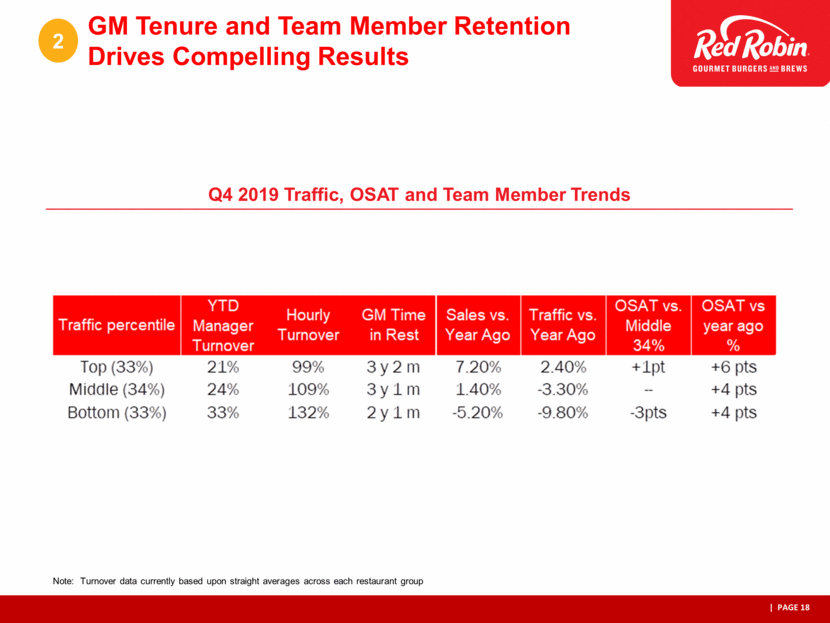
Q4 2019 Traffic, OSAT and Team Member Trends Note: Turnover data currently based upon straight averages across each restaurant group GM Tenure and Team Member Retention Drives Compelling Results 2
Tell Our Story National TV / Cinema / Digital Video Display Outdoor / Direct Mail In-Restaurant Direct Publisher Social Pattye to gr % of spend New omni-channel creative strategy and targeted marketing reinforcing Emotional Connection and Brand Equities, driving guest engagement 3

“All the Fulls” New Creative Campaign (Video) 3 click the link to see the “All the Fulls” new creative campaign video https://www.youtube.com/watch?v=foRLuVNMtYA

Tell Our Story Pattye to gr % of spend Omni-channel messaging brand driven, not price driven Contemporized for our guests Driving compelling results Consumer Insights research effectively revealed memorable moments of connection drive guest activation 30 second spot was one of the top five strongest performers of Red Robin ads ever tested, with scores well above industry benchmarks During our Q4 media flight, Red Robin scored as one of the top two brands for Search Engagement Volume (SEV) for all casual dining and midscale restaurant brands tracked Social engagement doubled year over year with increased positive sentiment; consequently, we are allocating more resources to social and digital channels 3 Source: Kelton Global, ABX, and EDO

Accelerate Profitable Growth Growing off-premise business Catering Third Party Last Mile Menu enhancement (Donatos®) Frequency Appetizer Delivery New restaurant prototype to drive profitable development 4

Growing Off-Premise Business Off-Premise Sales as a % of Total Food and Beverage Sales 2019 off-premise sales grew 28% to $163 million in 2019 Significant runway to grow catering business, currently ~1.5% sales, well below the industry average for casual dining 3 major 3rd party delivery players rolled out as of 2H 2019, currently over 5% sales Launching last mile delivery in early 2020 where guests order directly from Red Robin but delivery is outsourced; favorable economics vs. third party marketplace and delivery, retention of guest data and guests’ ability to utilize loyalty program Improved online ordering and completion rates with new digital platform underway Initiatives in process to improve to-go and delivery execution in restaurant 4 5.7% 8.3% 9.9% 12.4% 0.0% 2.0% 4.0% 6.0% 8.0% 10.0% 12.0% 14.0% 2016 2017 2018 2019

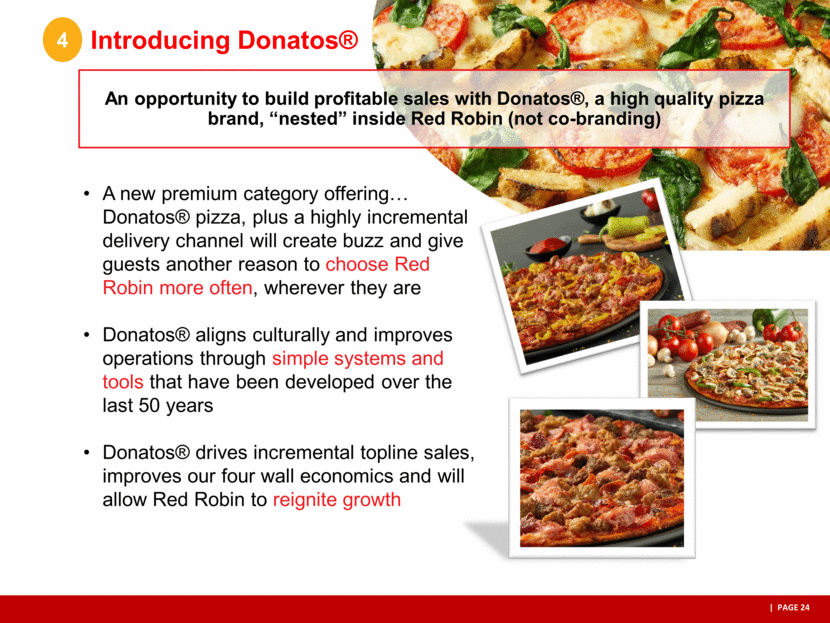
Introducing Donatos® 4 An opportunity to build profitable sales with Donatos®, a high quality pizza brand, “nested” inside Red Robin (not co-branding) A new premium category offering Donatos® pizza, plus a highly incremental delivery channel will create buzz and give guests another reason to choose Red Robin more often, wherever they are Donatos® aligns culturally and improves operations through simple systems and tools that have been developed over the last 50 years Donatos® drives incremental topline sales, improves our four wall economics and will allow Red Robin to reignite growth
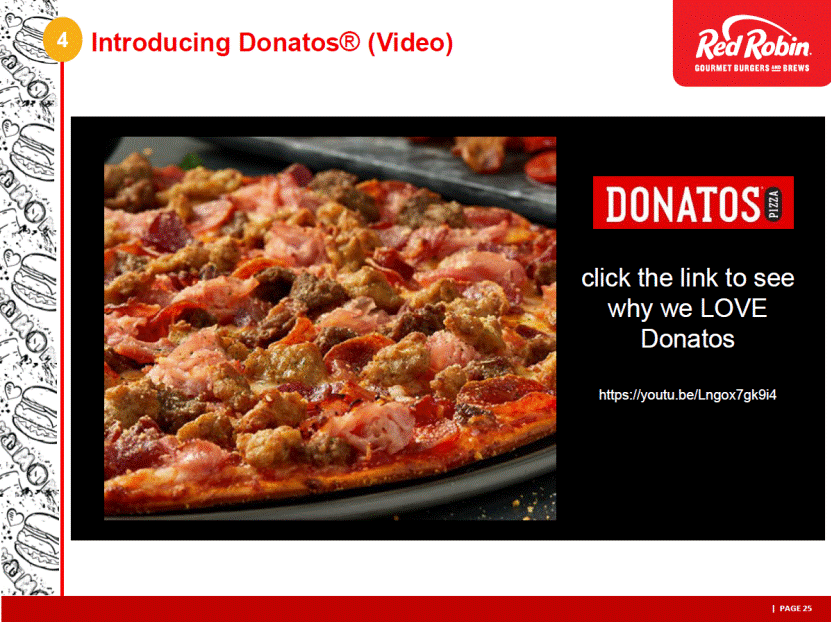
Introducing Donatos® (Video) 4 click the link to see why we LOVE Donatos https://youtu.be/Lngox7gk9i4
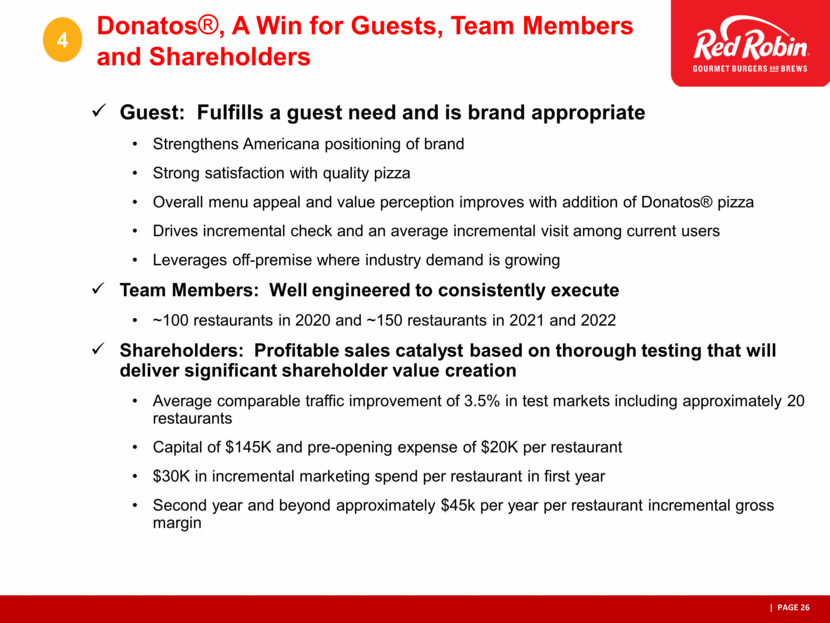
Donatos®, A Win for Guests, Team Members and Shareholders 4 Guest: Fulfills a guest need and is brand appropriate Strengthens Americana positioning of brand Strong satisfaction with quality pizza Overall menu appeal and value perception improves with addition of Donatos® pizza Drives incremental check and an average incremental visit among current users Leverages off-premise where industry demand is growing Team Members: Well engineered to consistently execute ~100 restaurants in 2020 and ~150 restaurants in 2021 and 2022 Shareholders: Profitable sales catalyst based on thorough testing that will deliver significant shareholder value creation Average comparable traffic improvement of 3.5% in test markets including approximately 20 restaurants Capital of $145K and pre-opening expense of $20K per restaurant $30K in incremental marketing spend per restaurant in first year Second year and beyond approximately $45k per year per restaurant incremental gross margin
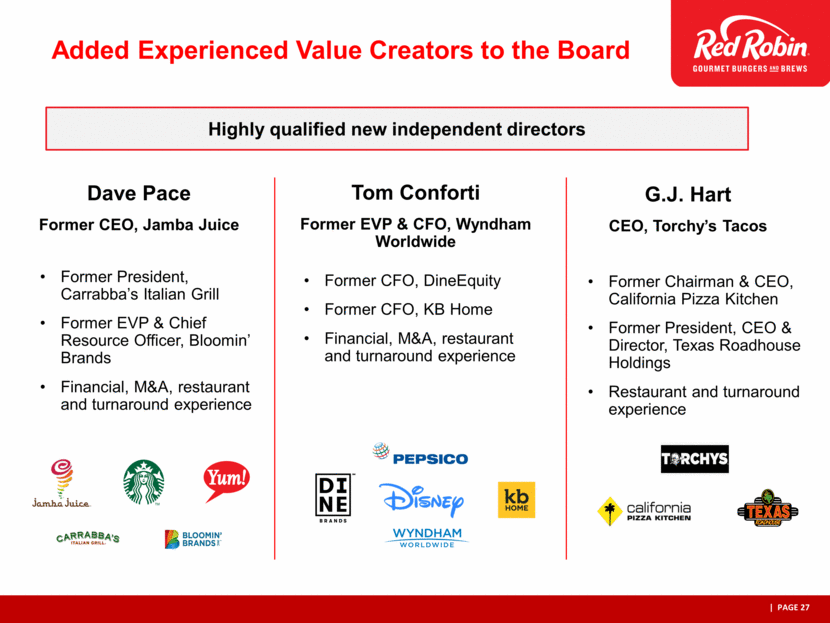
Pattye to gr % of spend Former President, Carrabba’s Italian Grill Former EVP & Chief Resource Officer, Bloomin’ Brands Financial, M&A, restaurant and turnaround experience Dave Pace Former CEO, Jamba Juice Former CFO, DineEquity Former CFO, KB Home Financial, M&A, restaurant and turnaround experience Tom Conforti Former EVP & CFO, Wyndham Worldwide Former Chairman & CEO, California Pizza Kitchen Former President, CEO & Director, Texas Roadhouse Holdings Restaurant and turnaround experience G.J. Hart CEO, Torchy’s Tacos Highly qualified new independent directors Added Experienced Value Creators to the Board
Pattye to gr % of spend 3 new independent Directors added in the past year 8 of 9 Directors are independent 3 years average director tenure 6 current and former CEOs / CFOs 2 female Directors CEO / CFO Restaurant / Retail Experience Investor Perspective Financial / M&A Turnaround Dave Pace Paul MurphyTom Conforti Cammie DunawayG.J. HartKalen Holmes Glenn KaufmanSteve LumpkinStuart OranStrong Independent Board with Diverse Skill Set

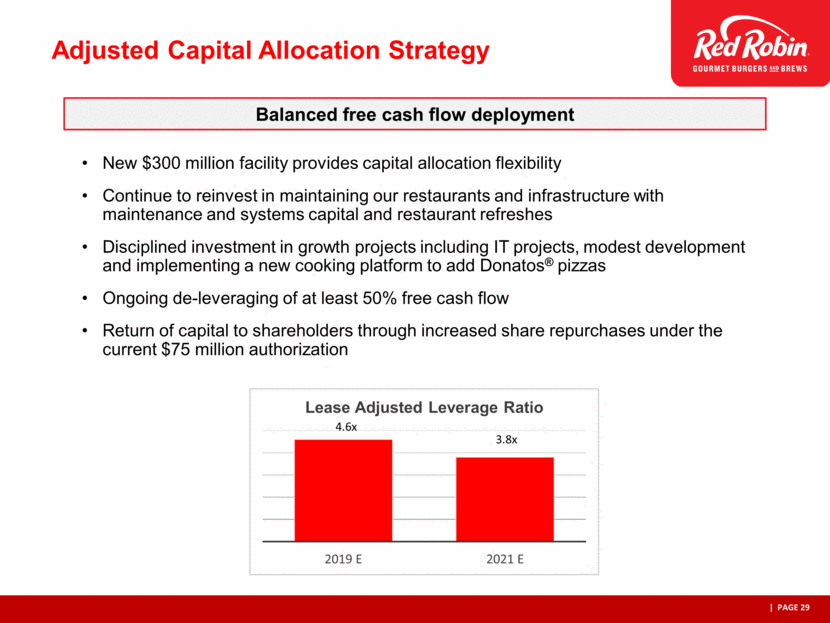
New $300 million facility provides capital allocation flexibility Continue to reinvest in maintaining our restaurants and infrastructure with maintenance and systems capital and restaurant refreshes Disciplined investment in growth projects including IT projects, modest development and implementing a new cooking platform to add Donatos® pizzas Ongoing de-leveraging of at least 50% free cash flow Return of capital to shareholders through increased share repurchases under the current $75 million authorization Balanced free cash flow deployment Adjusted Capital Allocation Strategy 2019 E 2021 E Lease Adjusted Leverage Ratio 4.6x 3.8x
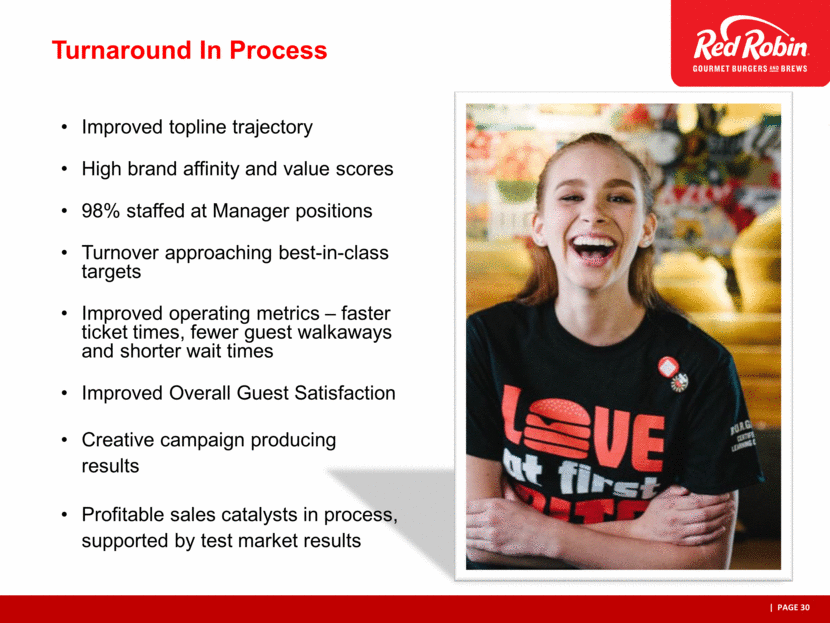
Improved topline trajectory High brand affinity and value scores 98% staffed at Manager positions Turnover approaching best-in-class targets Improved operating metrics – faster ticket times, fewer guest walkaways and shorter wait times Improved Overall Guest Satisfaction Creative campaign producing results Profitable sales catalysts in process, supported by test market results Turnaround In Process
Incremental restaurant-level operating profit offset by pre-opening expenses, marketing and project (G&A) expenses associated with Donatos® expansion and other growth initiatives 2020 Outlook Note: Free cash flow = net cash provided by operating activities less net cash used in investing activities. We anticipate our yearly tax credits to remain consistent, which is the primary beneficial driver of our Effective Tax Rate (“ETR”). The remaining component of the ETR will primarily be a function of Net Income. Cash taxes are expected to be $3M to $11M per year, sequentially increasing from 2020 to 2023 with higher levels of taxable income Near-Term Outlook Low Single Digit SSS Growth Restaurant Margin Expansion Flat to Slightly Positive Adjusted EBITDA Free Cash Flow $35MM+ De-leverage and Share Repurchases
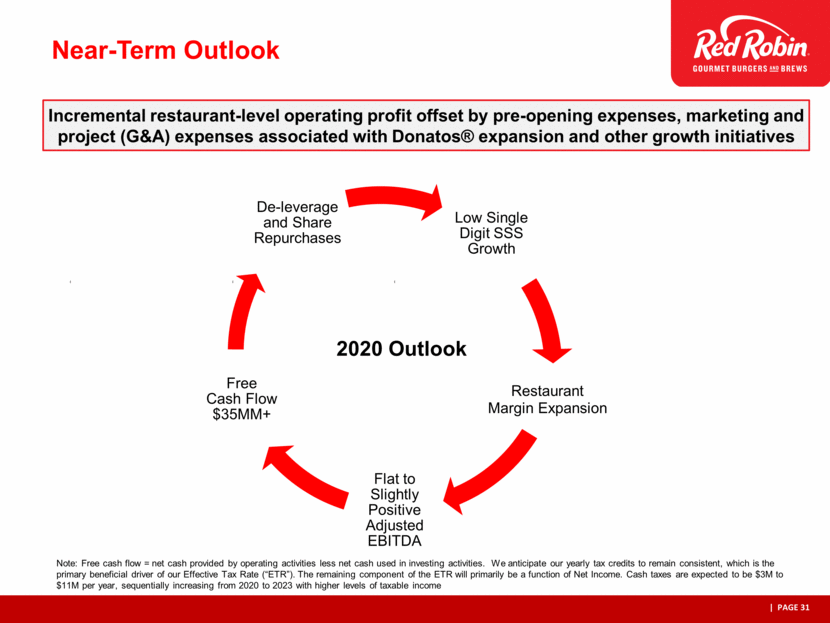
2020 set strong foundation for achieving long-term outlook and target Adjusted EBITDA of $150M by 2023, with margin expansion driven by G&A discipline sales leverage and other factors 2021 to 2023 Outlook Note: Free cash flow = net cash provided by operating activities less net cash used in investing activities. We anticipate our yearly tax credits to remain consistent, which is the primary beneficial driver of our Effective Tax Rate (“ETR”). The remaining component of the ETR will primarily be a function of Net Income. Cash taxes are expected to be $3M to $11M per year, sequentially increasing from 2020 to 2023 with higher levels of taxable income. Modest development is expected to be offset by restaurant closures. Long-Term Outlook Mid Single Digits Revenue Growth Margin Expansion 30-70 bps 10-15% Adjusted EBITDA Growth Free Cash Flow $45MM+ De-leverage and Share Repurchases
Laser focused on maximizing value for all shareholders Opportunities are clearly identified Plan in place to transform the business to accelerate our turnaround and drive growth Early indicators are positive We are confident in our future Our Shareholder Value Proposition
Red Robin Gourmet Burgers Appendix ICR Conference January 2020
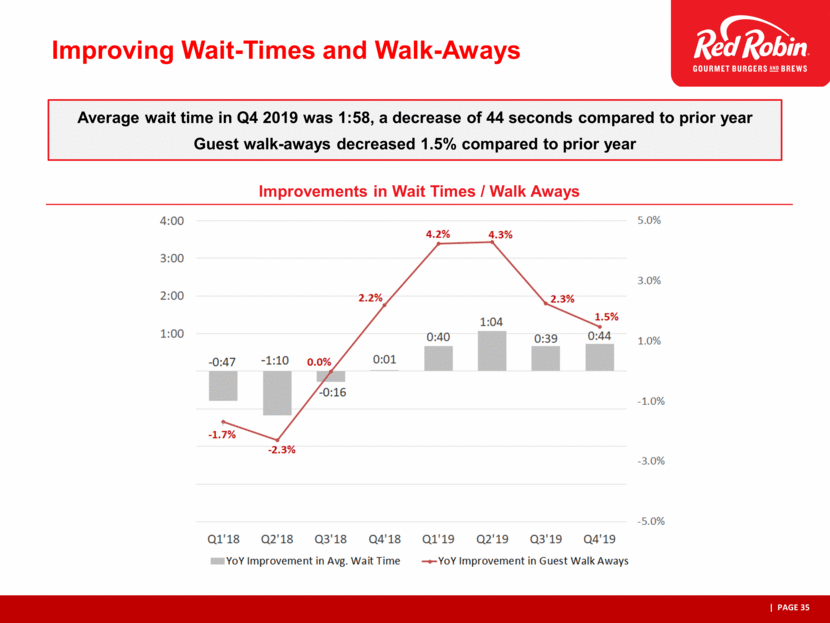
Improvements in Wait Times / Walk Aways Average wait time in Q4 2019 was 1:58, a decrease of 44 seconds compared to prior year Guest walk-aways decreased 1.5% compared to prior year Improving Wait-Times and Walk-Aways
Improvements in Total Ticket Times In Q4 2019, total ticket times averaged 11:51, a 48-second decrease compared to Q4 2018 Improving Ticket Times

60% fixed contracts; 37% variable contracts; 3% not contracted % of Total COGS in 2020 Variable vs Fixed Pricing Ground Beef 14.6% Variable (market driven) Steak Fries 11.5% 100% fixed through 10/21 Poultry 9.1% 50% fixed though 11/20 Produce 7.8% 80% fixed through 10/21 Bread 6.1% 100% fixed through 6/20 Cheese 4.9% 90% fixed through 1/23 Meat 3.8% Variable (market driven) Seafood 3.4% Cod 100% fixed through 6/20; Shrimp and Salmon 100% fixed through 12/20 Fry oil 1.9% 100% fixed through 6/20 2020 Commodity Expectation
