 |  |
FOR RELEASE ON: August 3, 2020
CONTACT: Robert Barry, VP - Investor Relations
608-361-7530
Regal Beloit Corporation Announces Second Quarter 2020 Financial Results
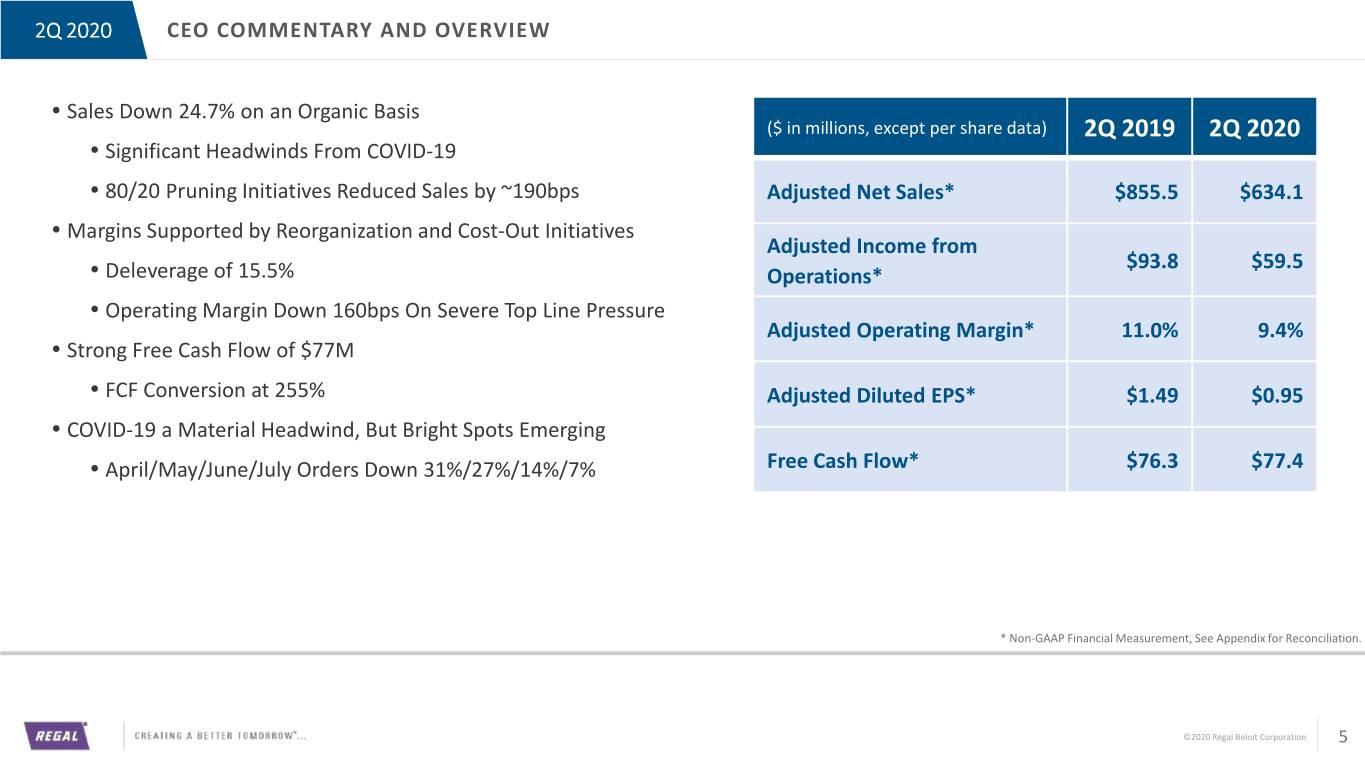
• | Adjusted Income from Operations Deleveraged at 15.5% of Net Sales |
• | Generated $77 million of Free Cash Flow, Conversion at 255% of Adjusted Net Income |
• | COVID-19 Impacts Weighed Heavily On Sales and Manufacturing Operations |
• | Order Rates Year-Over-Year Improved Significantly in June (14%) and July (7%) versus April (31%) |
BELOIT, WI - Regal Beloit Corporation (NYSE: RBC), a global leader in the engineering and manufacturing of high-efficiency electric motors and power transmission products, reported second quarter 2020 diluted earnings per share of $0.69 compared to $1.55 a year ago. Second quarter 2020 adjusted diluted earnings per share* were $0.95 compared to $1.49 a year ago.
Key financial results for the second quarter 2020 included:
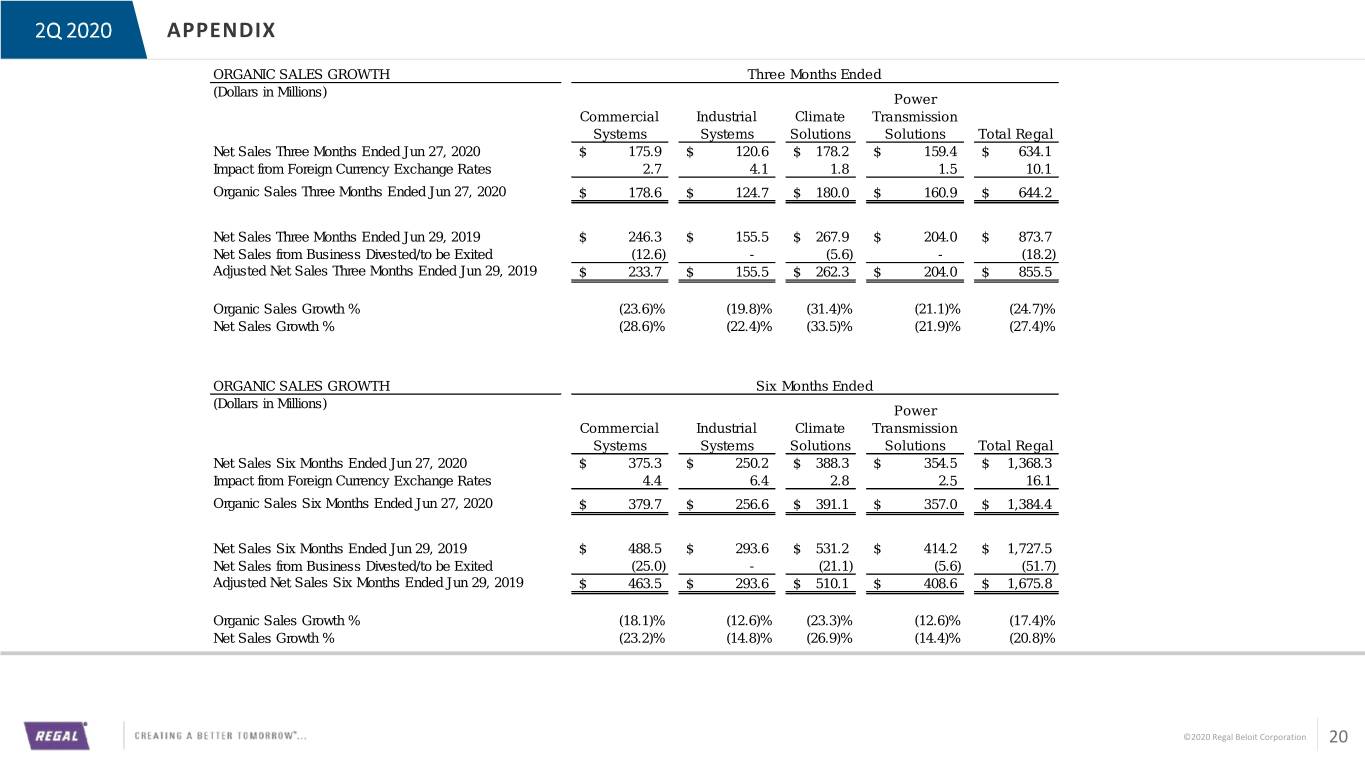
• | Total net sales of $634.1 decreased 27.4% from the prior year. Excluding the negative impacts of 1.2% from foreign currency and 1.5% from businesses to be divested/exited, sales declined 24.7% on an organic basis. |
• | Income from operations was $45.9 million or 7.2% of net sales. Adjusted income from operations declined $34.3 million from a year ago, to $59.5 million. Adjusted operating margin of 9.4% was down 160 basis points versus the prior year’s 11.0%. |
• | Adjusted income from operations deleveraged at 15.5%. |
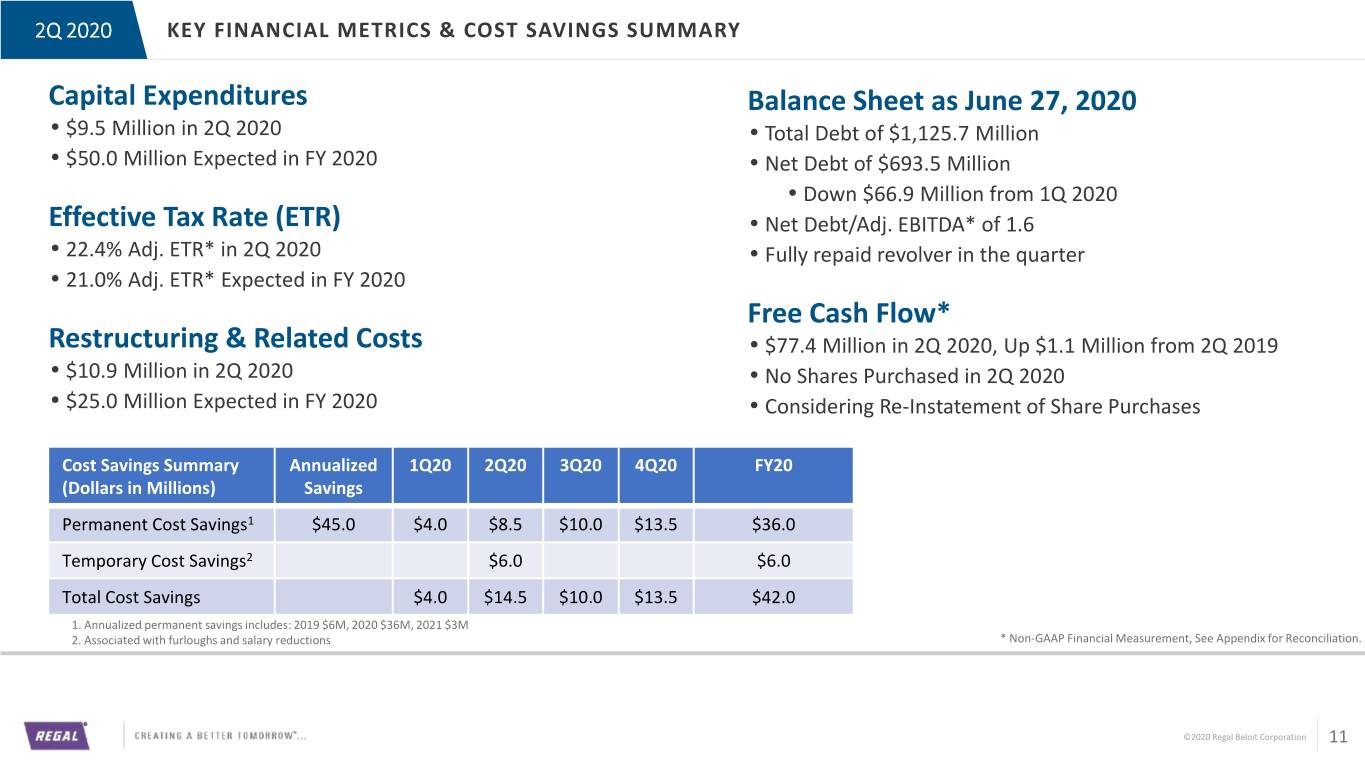
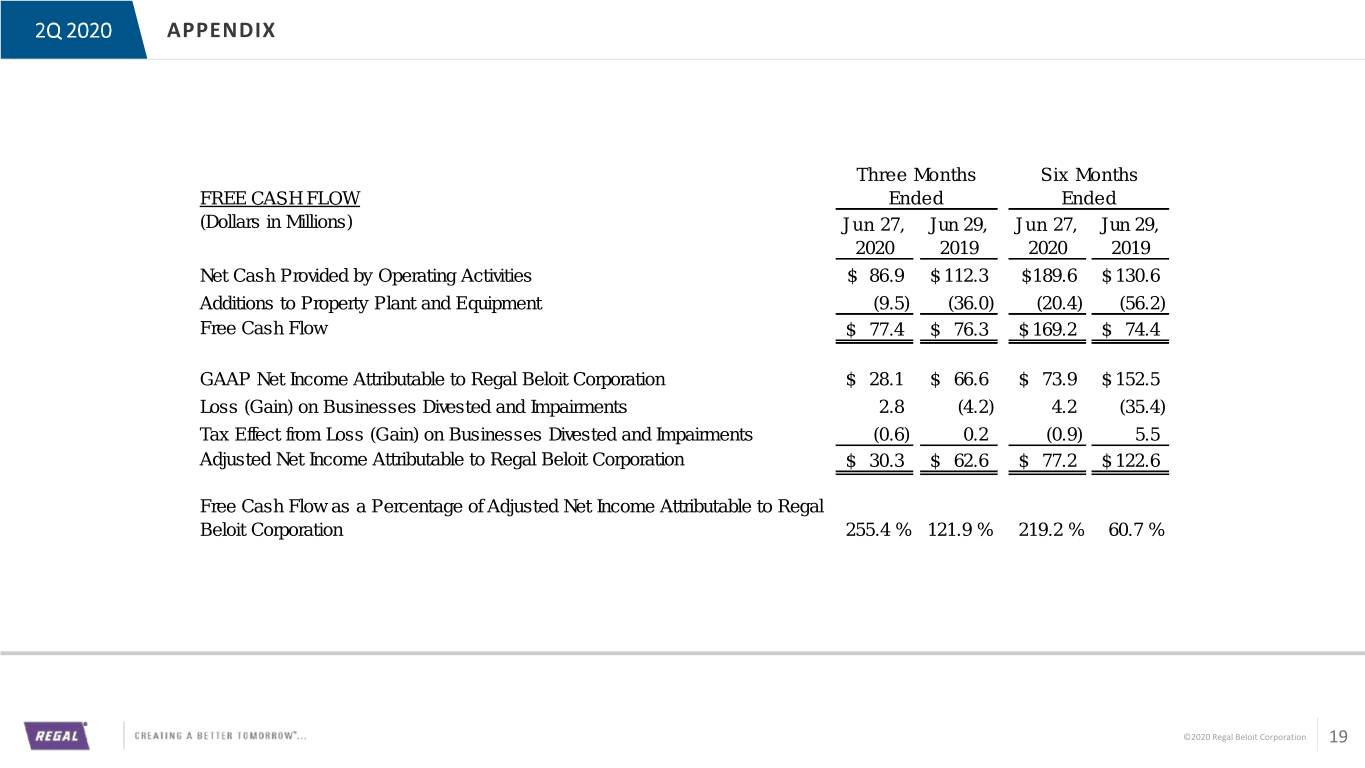
• | Net cash provided by operating activities was $86.9 million and capital expenditures totaled $9.5 million, resulting in free cash flow of $77.4 million, which is 255.4% of adjusted net income. |
• | No shares were purchased in the second quarter, and the Company is currently evaluating when to resume its share buyback program. |
Second quarter 2020 segment results versus the prior year second quarter:
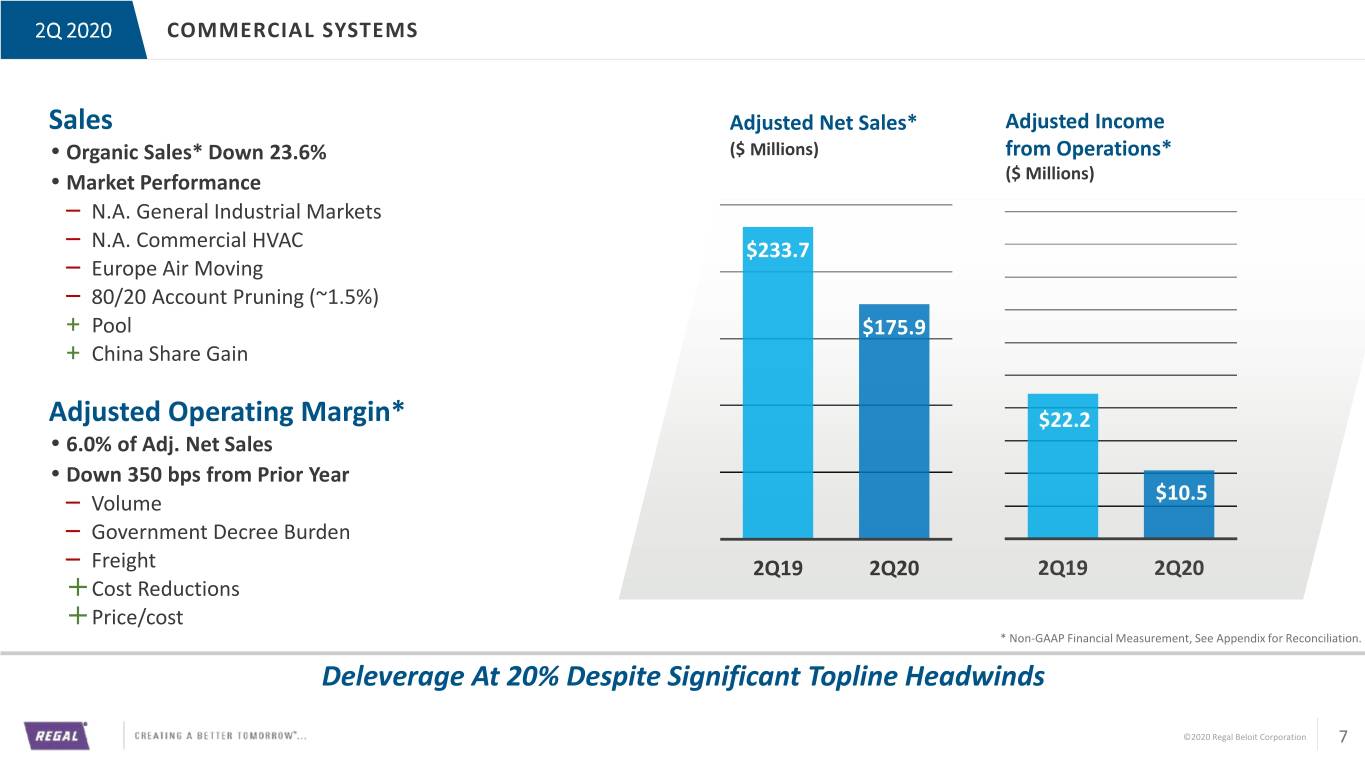
• | Commercial Systems segment net sales were $175.9 million, a decrease of 28.6%. Businesses divested/to be exited had a negative 3.8% impact, and foreign currency had a negative 1.2% impact. The result was a negative organic sales growth rate of 23.6%, driven largely by COVID-related pressures on the N.A. general industrial and commercial HVAC end markets, and on the Europe air moving end market, combined with proactive account pruning efforts. Partially offsetting these headwinds were share gains in the China motors business. During the quarter, production recovery at the Company’s China factories, combined with strong end user demand, drove improved performance in pool pumps, which also saw June orders rise nearly 50%. Operating margin was 3.5%. After net adjustments of $4.3 million, adjusted operating margin was 6.0% of adjusted net sales. |
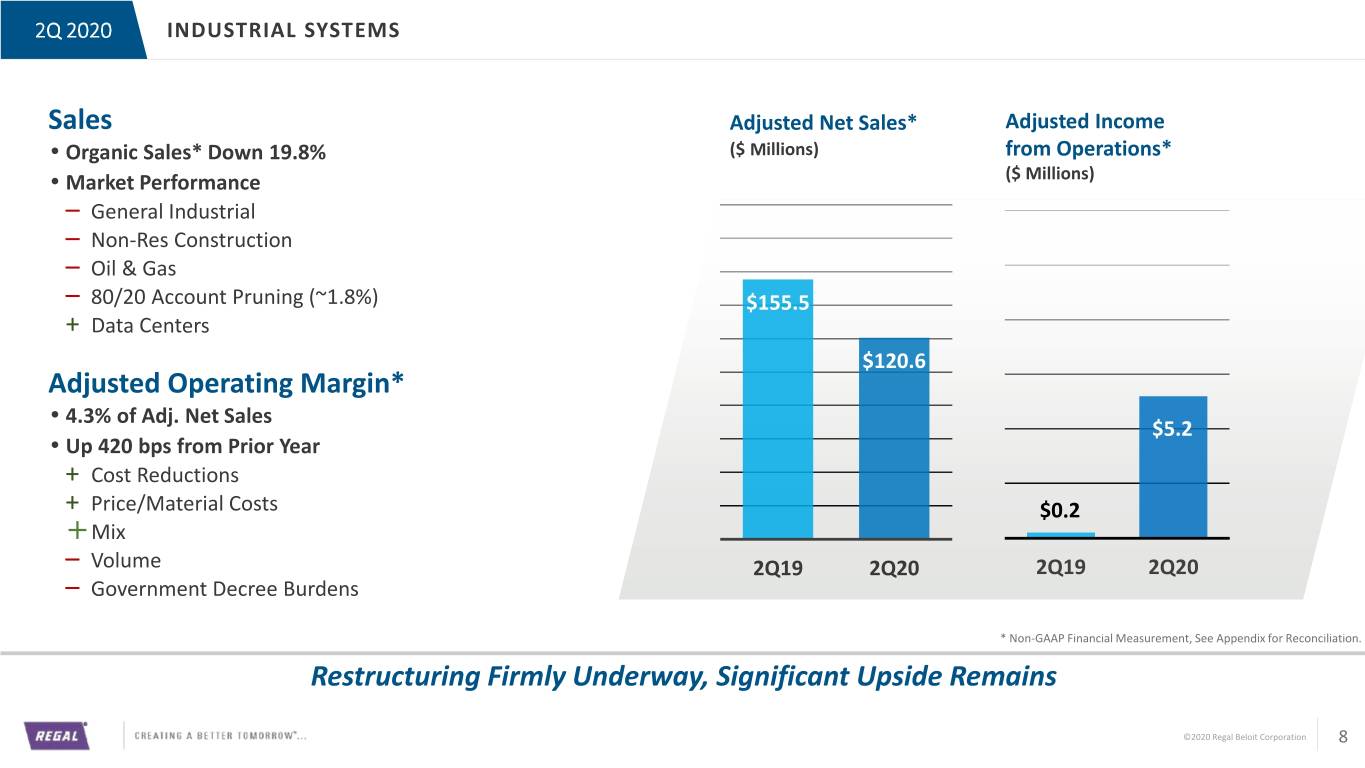
• | Industrial Systems segment net sales were $120.6 million, a decrease of 22.4%. Foreign currency had a negative 2.6% impact. The result was a negative organic sales growth rate of 19.8%, driven by COVID-related headwinds across the business, but especially impacting sales into the N.A. general industrial, oil & gas, and non-residential construction end markets, combined with proactive account pruning. Partially offsetting these headwinds, the Company realized share gains in the data center market. Operating margin was 2.7%. After net adjustments of $2.0 million, adjusted operating margin was 4.3% of adjusted net sales. |
*This earnings release includes non-GAAP financial measures. Descriptions of why we believe these non-GAAP measures are useful and reconciliations of these non-GAAP financial measures to the most directly comparable GAAP measures are included with this earnings release.
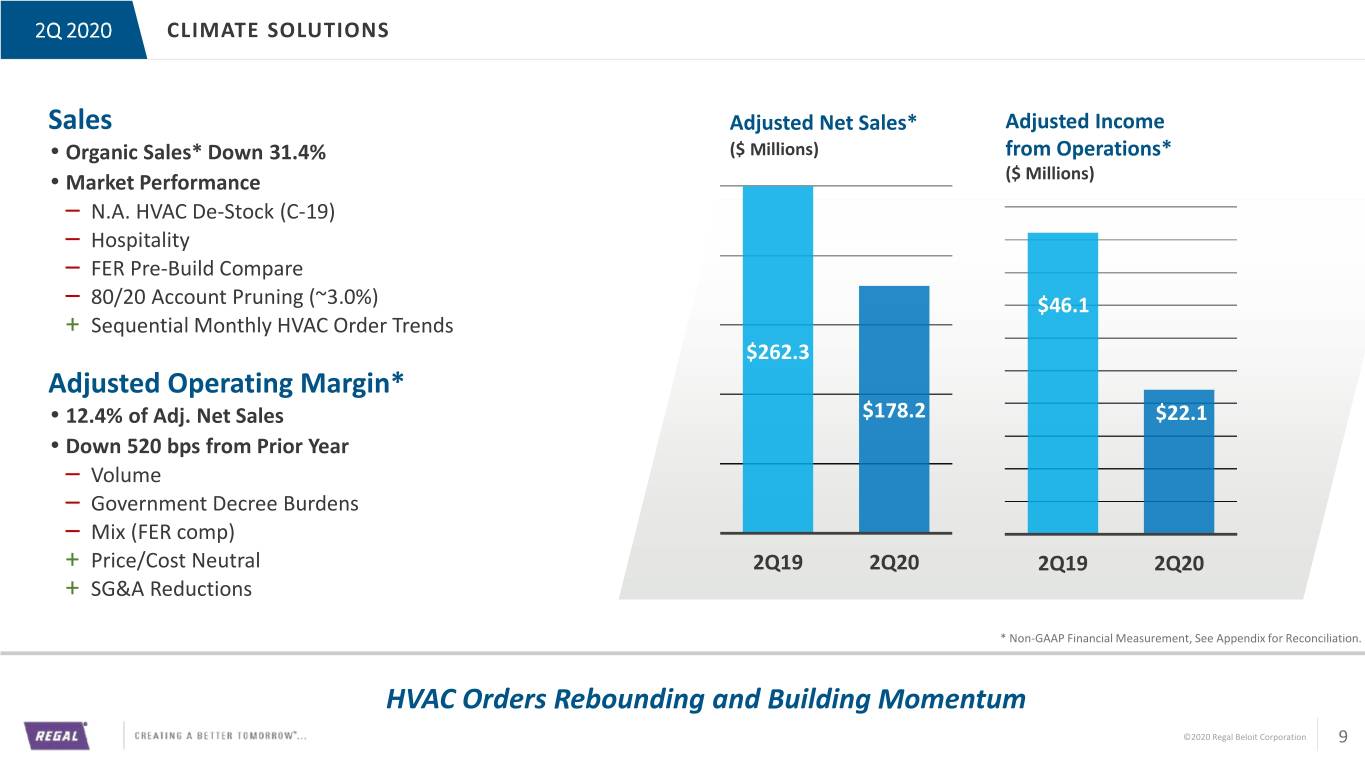
• | Climate Solutions segment net sales were $178.2 million, a decrease of 33.5%. Businesses divested/to be exited had a negative 1.4% impact, and foreign currency had a negative 0.7% impact. The result was a negative organic sales growth rate of 31.4%, driven mainly by headwinds related to the COVID-19 pandemic, in particular de-stocking in the N.A. residential HVAC channel during much of the quarter, weak demand in hospitality end markets in Europe, and to a lesser extent ongoing proactive account pruning efforts. Operating margin was 11.2%. After net adjustments of $2.1 million, adjusted operating margin was 12.4% of adjusted net sales. |
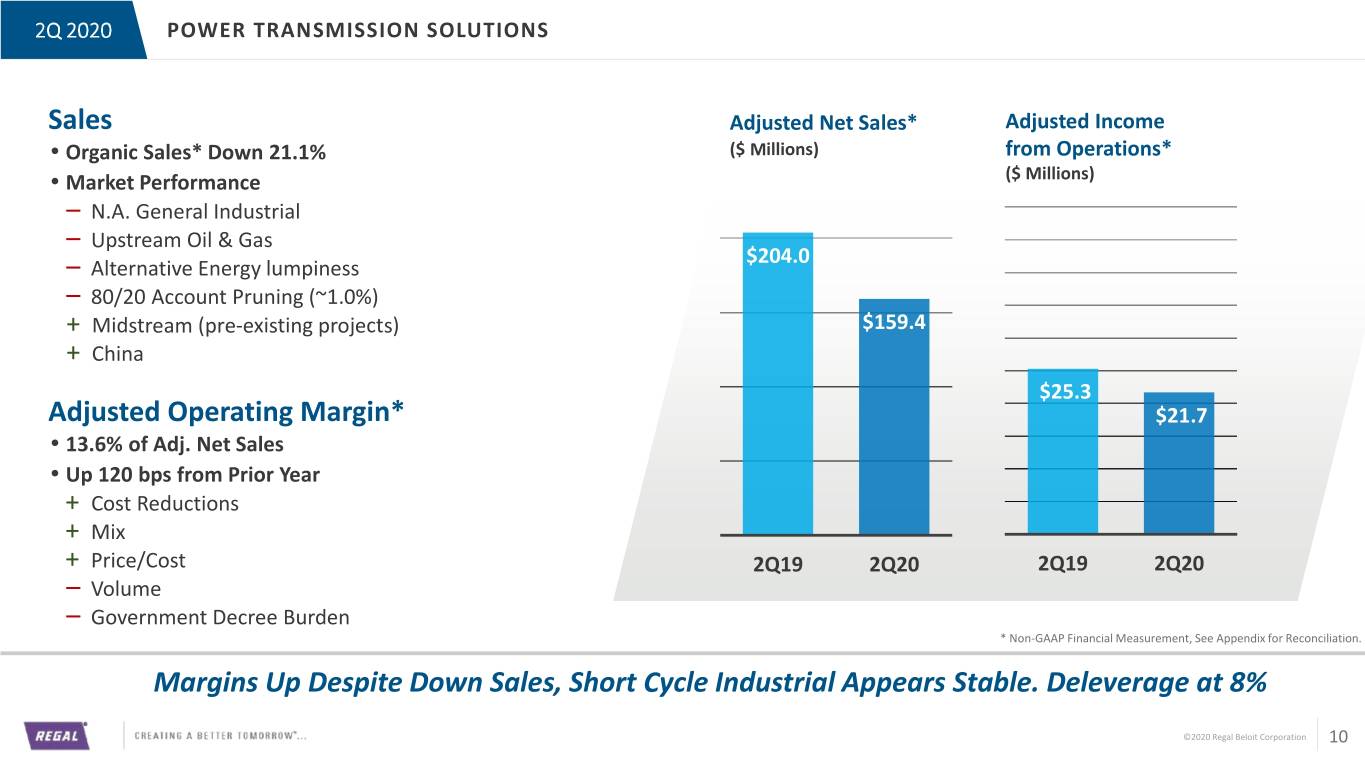
• | Power Transmission Solutions segment net sales were $159.4 million, a decrease of 21.9%. Foreign currency had a negative 0.7% impact, and businesses divested/to be exited had a negative 0.1% impact. The result was a negative organic sales growth rate of 21.1% driven by significant COVID-related declines in U.S. general industrial and upstream oil & gas end markets, in addition to ongoing proactive account pruning activities. On the positive side, and partially offsetting these headwinds, were tailwinds in U.S. midstream oil & gas (tied to pre-existing projects), China general industrial, and N.A. agriculture end markets. Operating margin was 10.4%. After net adjustments of $5.2 million, adjusted operating margin was 13.6% of adjusted net sales. |
Summarizing Regal’s second quarter 2020 performance, CEO Louis Pinkham commented, “Regal associates faced unprecedented personal and professional challenges in the quarter tied to COVID-19, including weak demand in many of our end markets, and disruptions to some of our principal manufacturing operations. However, a lot of hard work by our associates, executed with a sense of urgency, enabled our Company to achieve excellent deleverage, and very strong free cash flow. I am impressed by our associates’ constant focus on balancing safety with a need to service our customers with Regal’s essential products during this uniquely challenging period.”
Mr. Pinkham went on to comment, “As I look across our segments, all faced severe, COVID-related end market headwinds that weighed on second quarter sales and, except for PTS, significant disruptions to key manufacturing operations. But despite these obstacles, both PTS and Industrial posted meaningful year-over-year operating profit and margin gains, while Commercial held its deleverage to 20%, and some of our businesses managed to realize market share gains. Climate performance was disappointing, but we believe it was largely due to COVID-related pressures outside our control, leaving us optimistic that much-improved order rates in June and July will translate into materially higher margins for this segment in the second half of 2020.”
COVID-19 Update
COVID-19 evolved during the first quarter of 2020 into a global pandemic, resulting in a severe global health crisis that drove a dramatic slowdown in global economic and social activity. COVID-19 started to impact Regal’s business in China early in the first quarter, and as the virus spread and the quarter progressed, the virus increasingly impacted the Company’s business on a global scale.
Impacts from COVID-19 on Regal’s business became more severe during the first half of the second quarter - both in terms of weakening demand in most of the Company’s end markets, which are weighted to North America, and regarding its impact on the Company’s manufacturing operations, particularly in Mexico and India. Fortunately, as the second quarter progressed, pressure on Regal’s order rates started to abate, and previously disrupted supply chains and manufacturing capabilities also improved. At present, the Company’s global manufacturing operations are largely operational, with plants running at somewhat reduced rates approximating 90% of full capacity, on average, in India and Mexico. The Company is hopeful that recent improvements will be sustainable, but acknowledges that in many regions confirmed cases of COVID-19 are on the rise.
In the face of this global crisis, management’s first priority has been the health and safety of Regal associates. Regal implemented a host of measures to help its associates stay safe - measures that have been enhanced and refined as impacts from the virus grew, and as the Company’s knowledge about how to enhance their effectiveness improved. Today, Regal believes that many of its COVID-19-related safety practices are best in class and in some cases have been recognized by local and regional governments as such.
As part of Regal’s ongoing response to the impacts of COVID-19, the Company has taken additional cost actions, on top of the substantial restructuring, supply chain, and 80/20 reorganization efforts that were already underway prior to the start of the COVID-19 pandemic, and also beyond actions announced when it reported first quarter
results. These additional actions included a firmwide reduction in force, and a voluntary early retirement program. Together, these additional actions impacted roughly 4% of the Company’s workforce. Regal will consider making further changes to its cost structure as the implications of COVID-19 continue to evolve.
Framework for Third Quarter
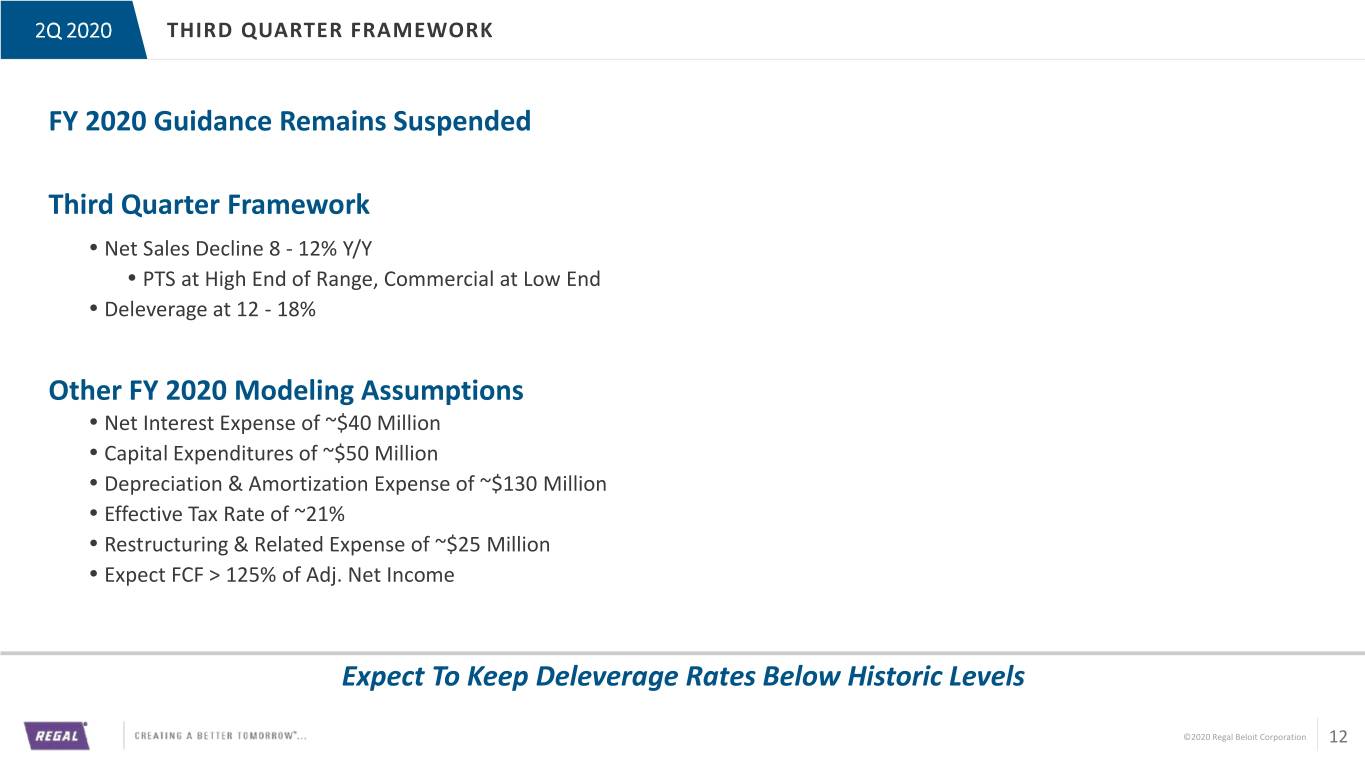
For the third quarter of 2020, the Company expects its net sales to decline between 8% and 12% compared to the prior year, and for deleverage on net sales to fall in a range of 12-18%. This framework reflects the Company’s cost initiatives, current backlog, July results, and estimated demand levels over the next two months, and does not take into consideration any significant changes in the global spread of, and government reactions to COVID-19.
In light of continued uncertainty created by the COVID-19 pandemic, in particular as it relates to the demand environment for the Company’s products, combined with the inherently short-cycle nature of its business, which results in limited backlog, the Company feels it is not currently in a position to provide useful forward looking commentary beyond the third quarter.
Conference Call
Regal will hold a conference call to discuss this earnings release at 9:00 AM CDT (10:00 AM EDT) on Tuesday, August 4, 2020. To listen to the live audio and view the presentation during the call, please visit Regal’s Investors website: https://investors.regalbeloit.com. To listen by phone or to ask the presenters a question, dial 1.888.317.6003 (U.S. callers) or +1.412.317.6061 (international callers) and enter 6531425# when prompted.
A webcast replay will be available at the link above, and a telephone replay will be available at 1.877.344.7529 (U.S. callers) or +1.412.317.0088 (international callers), using a replay access code of 10146106#. Both will be accessible for three months after the earnings call.
About the Company
Regal Beloit Corporation (NYSE: RBC) is a global leader in the engineering and manufacturing of electric motors and controls, power generation and power transmission products serving customers throughout the world. We create a better tomorrow by developing and responsibly producing energy-efficient products and systems.
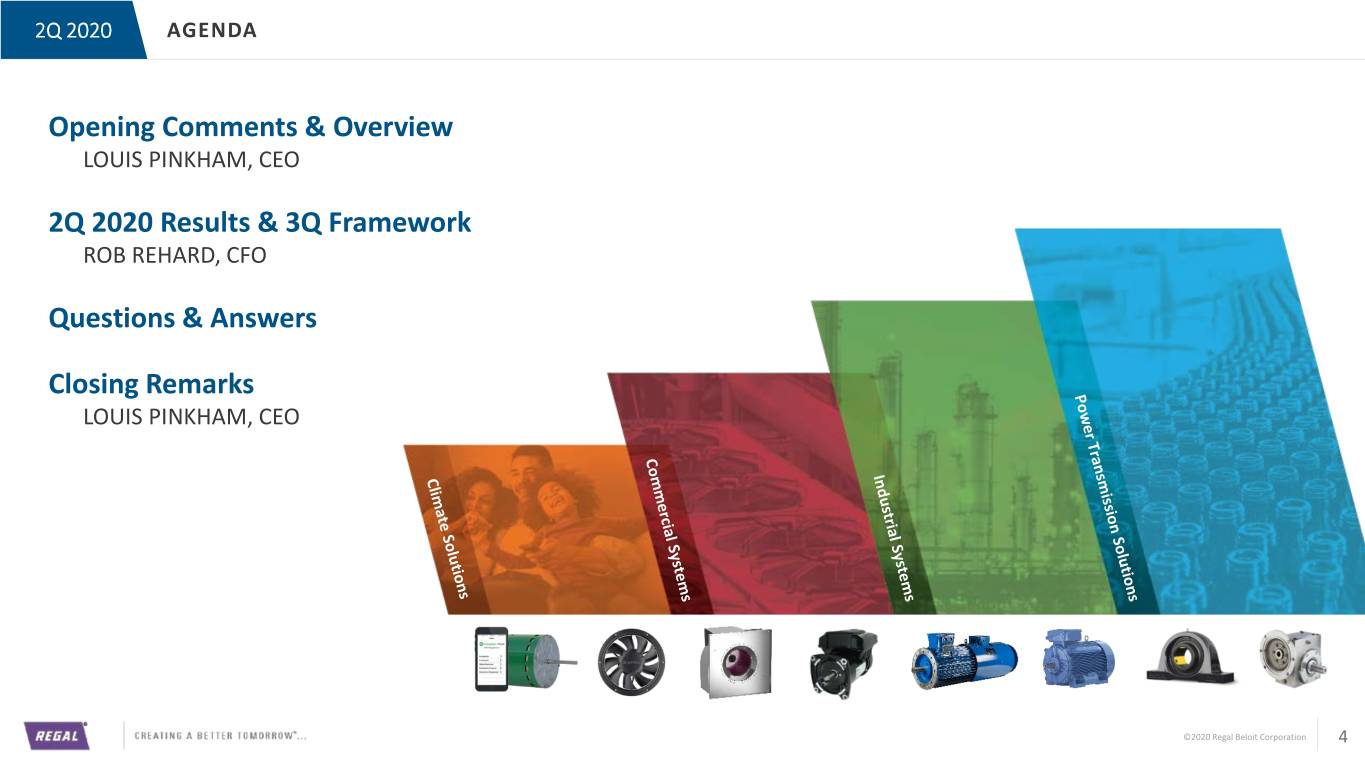
The Company is comprised of four operating segments: Commercial Systems, Industrial Systems, Climate Solutions and Power Transmission Solutions. Regal is headquartered in Beloit, Wisconsin and has manufacturing, sales and service facilities worldwide. For more information, visit RegalBeloit.com.
CAUTIONARY STATEMENT
The following is a cautionary statement made under the Private Securities Litigation Reform Act of 1995: With the exception of historical facts, the statements contained in this release may be forward-looking statements. Forward-looking statements represent our management’s judgment regarding future events. In many cases, you can identify forward-looking statements by terminology such as “may,” “will,” “expect,” “intend,” “estimate,” “forecast,” “anticipate,” “believe,” “should,” “project” or “plan” or the negative of these terms or other similar words. These forward-looking statements are not guarantees of future performance and are subject to risks, uncertainties, assumptions and other factors, some of which are beyond our control, which could cause actual results to differ materially from those expressed or implied by such forward-looking statements, including but not limited to: the continued financial and operational impacts of and uncertainties relating to the COVID-19 pandemic on us and our customers and suppliers and the geographies in which we operate; uncertainties regarding our ability to execute our restructuring plans within expected costs and timing; actions taken by our competitors and our ability to effectively compete in the increasingly competitive global electric motor, drives and controls, power generation and power transmission industries; our ability to develop new products based on technological innovation, such as the Internet of Things, and marketplace acceptance of new and existing products, including products related to technology not yet adopted or utilized in certain geographic locations in which we do business; fluctuations in commodity prices and raw material costs; our dependence on significant customers; risks associated with global manufacturing, including risks associated with public health crises; issues and costs arising from the integration of acquired companies and businesses and the timing and impact of purchase accounting adjustments; our overall debt levels
and our ability to repay principal and interest on our outstanding debt; prolonged declines in one or more markets we serve, such as heating, ventilation, air conditioning, refrigeration, power generation, oil and gas, unit material handling or water heating; economic changes in global markets where we do business, such as reduced demand for the products we sell, currency exchange rates, inflation rates, interest rates, recession, government policies, including policy changes affecting taxation, trade, tariffs, immigration, customs, border actions and the like, and other external factors that we cannot control; product liability and other litigation, or claims by end users, government agencies or others that our products or our customers’ applications failed to perform as anticipated, particularly in high volume applications or where such failures are alleged to be the cause of property or casualty claims; unanticipated liabilities of acquired businesses; unanticipated adverse effects or liabilities from business exits or divestitures; unanticipated costs or expenses we may incur related to product warranty issues; our dependence on key suppliers and the potential effects of supply disruptions; infringement of our intellectual property by third parties, challenges to our intellectual property, and claims of infringement by us of third party technologies; effects on earnings of any significant impairment of goodwill or intangible assets; losses from failures, breaches, attacks or disclosures involving our information technology infrastructure and data; cyclical downturns affecting the global market for capital goods; and other risks and uncertainties including but not limited to those described in “Item 1A-Risk Factors” of the Company’s Annual Report on Form 10-K filed with the U.S. Securities and Exchange Commission on February 26, 2020 and from time to time in other filed reports. All subsequent written and oral forward-looking statements attributable to us or to persons acting on our behalf are expressly qualified in their entirety by the applicable cautionary statements. The forward-looking statements included in this release are made only as of their respective dates, and we undertake no obligation to update these statements to reflect subsequent events or circumstances.
NON-GAAP MEASURES AND OTHER DEFINITIONS
Unaudited
(Dollars in Millions, Except per Share Data)
We prepare financial statements in accordance with accounting principles generally accepted in the United States of America (“GAAP”). We also periodically disclose certain financial measures in our quarterly earnings releases, on investor conference calls, and in investor presentations and similar events that may be considered “non-GAAP” financial measures. This additional information is not meant to be considered in isolation or as a substitute for our results of operations prepared and presented in accordance with GAAP.
In this earnings release, we disclose the following non-GAAP financial measures, and we reconcile these measures in the tables below to the most directly comparable GAAP financial measures: adjusted diluted earnings per share (both historical and projected), adjusted income from operations, adjusted operating margin, adjusted net sales, net debt, adjusted EBITDA, adjusted operating leverage, adjusted net income attributable to Regal Beloit Corporation, free cash flow, free cash flow as a percentage of adjusted net income attributable to Regal Beloit Corporation, adjusted income before taxes, adjusted provision for income taxes, adjusted effective tax rate, net sales from ongoing business, adjusted income from operations of ongoing business, ongoing business adjusted operating margin and adjusted diluted earnings per share for ongoing business. We believe that these non-GAAP financial measures are useful measures for providing investors with additional information regarding our results of operations and for helping investors understand and compare our operating results across accounting periods and compared to our peers. Our management primarily uses adjusted income from operations, adjusted operating income, adjusted operating margin, and adjusted operating leverage to help us manage and evaluate our business and make operating decisions, while adjusted diluted earnings per share, net debt, adjusted EBITDA, adjusted net sales, adjusted net income attributable to Regal Beloit Corporation, free cash flow, free cash flow as a percentage of adjusted net income attributable to Regal Beloit Corporation, adjusted income before taxes, adjusted provision for income taxes, adjusted effective tax rate, net sales from ongoing business, adjusted income from operations of ongoing business, ongoing business adjusted operating margin and adjusted diluted earnings per share for ongoing business are primarily used to help us evaluate our business and forecast our future results. Accordingly, we believe disclosing and reconciling each of these measures helps investors evaluate our business in the same manner as management.
In addition to these non-GAAP measures, we also use the term “organic sales” to refer to GAAP sales from existing operations excluding any sales from acquired businesses recorded prior to the first anniversary of the acquisition (“net sales from business acquired") and excluding any sales from business divested/to be exited (“net sales from business divested/to be exited“) recorded prior to the first anniversary of the exit and excluding the impact of foreign currency translation. The impact of foreign currency translation is determined by translating the respective period’s organic sales using the currency exchange rates that were in effect during the prior year periods. We use the term “organic sales growth” to refer to the increase in our sales between periods that is attributable to organic sales. For further clarification, we may use the term “acquisition growth” to refer to the increase in our sales between periods that is attributable to acquisition sales.
CONDENSED CONSOLIDATED STATEMENTS OF INCOME | ||||||||||||||||
Unaudited | ||||||||||||||||
(Dollars in Millions, Except per Share Data) | ||||||||||||||||
Three Months Ended | Six Months Ended | |||||||||||||||
Jun 27, 2020 | Jun 29, 2019 | Jun 27, 2020 | Jun 29, 2019 | |||||||||||||
Net Sales | $ | 634.1 | $ | 873.7 | $ | 1,368.3 | $ | 1,727.5 | ||||||||
Cost of Sales | 463.8 | 639.7 | 994.7 | 1,258.9 | ||||||||||||
Gross Profit | 170.3 | 234.0 | 373.6 | 468.6 | ||||||||||||
Operating Expenses | 121.6 | 138.0 | 253.4 | 242.0 | ||||||||||||
Asset Impairments | 2.8 | — | 4.3 | 10.0 | ||||||||||||
Total Operating Expenses | 124.4 | 138.0 | 257.7 | 252.0 | ||||||||||||
Income from Operations | 45.9 | 96.0 | 115.9 | 216.6 | ||||||||||||
Other (Income) Expenses, net | (1.1 | ) | 0.2 | (2.2 | ) | 0.3 | ||||||||||
Interest Expense | 10.6 | 13.4 | 22.2 | 27.0 | ||||||||||||
Interest Income | 1.4 | 1.4 | 2.5 | 2.5 | ||||||||||||
Income before Taxes | 37.8 | 83.8 | 98.4 | 191.8 | ||||||||||||
Provision for Income Taxes | 8.5 | 16.4 | 22.4 | 37.6 | ||||||||||||
Net Income | 29.3 | 67.4 | 76.0 | 154.2 | ||||||||||||
Less: Net Income Attributable to Noncontrolling Interests | 1.2 | 0.8 | 2.1 | 1.7 | ||||||||||||
Net Income Attributable to Regal Beloit Corporation | $ | 28.1 | $ | 66.6 | $ | 73.9 | $ | 152.5 | ||||||||
Earnings Per Share Attributable to Regal Beloit Corporation: | ||||||||||||||||
Basic | $ | 0.69 | $ | 1.56 | $ | 1.82 | $ | 3.57 | ||||||||
Assuming Dilution | $ | 0.69 | $ | 1.55 | $ | 1.81 | $ | 3.54 | ||||||||
Cash Dividends Declared Per Share | $ | 0.30 | $ | 0.30 | $ | 0.60 | $ | 0.58 | ||||||||
Weighted Average Number of Shares Outstanding: | ||||||||||||||||
Basic | 40.5 | 42.6 | 40.6 | 42.7 | ||||||||||||
Assuming Dilution | 40.7 | 43.0 | 40.7 | 43.0 | ||||||||||||
CONDENSED CONSOLIDATED BALANCE SHEETS | ||||||||
Unaudited | ||||||||
(Dollars in Millions) | ||||||||
Jun 27, 2020 | Dec 28, 2019 | |||||||
ASSETS | ||||||||
Current Assets: | ||||||||
Cash and Cash Equivalents | $ | 432.2 | $ | 331.4 | ||||
Trade Receivables, less Allowances of $13.3 Million in 2020 and $9.7 Million in 2019 | 427.2 | 461.4 | ||||||
Inventories | 679.7 | 678.4 | ||||||
Prepaid Expenses and Other Current Assets | 136.6 | 136.5 | ||||||
Total Current Assets | 1,675.7 | 1,607.7 | ||||||
Net Property, Plant, Equipment and Noncurrent Assets | 2,732.4 | 2,823.0 | ||||||
Total Assets | $ | 4,408.1 | $ | 4,430.7 | ||||
LIABILITIES AND EQUITY | ||||||||
Current Liabilities: | ||||||||
Accounts Payable | $ | 342.6 | $ | 337.0 | ||||
Other Accrued Expenses | 235.2 | 222.9 | ||||||
Current Maturities of Debt | 0.6 | 0.6 | ||||||
Total Current Liabilities | 578.4 | 560.5 | ||||||
Long-Term Debt | 1,125.1 | 1,136.9 | ||||||
Other Noncurrent Liabilities | 357.6 | 352.9 | ||||||
Equity: | ||||||||
Total Regal Beloit Corporation Shareholders' Equity | 2,319.1 | 2,351.1 | ||||||
Noncontrolling Interests | 27.9 | 29.3 | ||||||
Total Equity | 2,347.0 | 2,380.4 | ||||||
Total Liabilities and Equity | $ | 4,408.1 | $ | 4,430.7 | ||||
CONDENSED CONSOLIDATED STATEMENTS OF CASH FLOW | ||||||||||||||||
Unaudited | ||||||||||||||||
(Dollars in Millions) | ||||||||||||||||
Three Months Ended | Six Months Ended | |||||||||||||||
Jun 27, 2020 | Jun 29, 2019 | Jun 27, 2020 | Jun 29, 2019 | |||||||||||||
CASH FLOWS FROM OPERATING ACTIVITIES: | ||||||||||||||||
Net Income | $ | 29.3 | $ | 67.4 | 76.0 | 154.2 | ||||||||||
Adjustments to Reconcile Net Income and Changes in Assets and Liabilities (Net of Acquisitions and Divestitures) to Net Cash Provided by Operating Activities: | ||||||||||||||||
Depreciation and Amortization | 33.3 | 32.2 | 65.9 | 66.5 | ||||||||||||
Loss on Disposal of Assets | 0.7 | 0.3 | 1.4 | 0.4 | ||||||||||||
Loss (Gain) on Businesses Divested and Assets to be Exited | 2.8 | (4.2 | ) | 4.2 | (35.4 | ) | ||||||||||
Share-Based Compensation Expense | 2.8 | 3.1 | 5.5 | 7.4 | ||||||||||||
Change in Operating Assets and Liabilities | 18.0 | 13.5 | 36.6 | (62.5 | ) | |||||||||||
Net Cash Provided by Operating Activities | 86.9 | 112.3 | 189.6 | 130.6 | ||||||||||||
CASH FLOWS FROM INVESTING ACTIVITIES: | ||||||||||||||||
Additions to Property, Plant and Equipment | (9.5 | ) | (36.0 | ) | (20.4 | ) | (56.2 | ) | ||||||||
Proceeds Received from Sales of Property, Plant and Equipment | 2.6 | 1.7 | 5.3 | 1.7 | ||||||||||||
Proceeds Received from Disposal of Businesses | — | 18.8 | 0.3 | 138.2 | ||||||||||||
Net Cash (Used in) Provided by Investing Activities | (6.9 | ) | (15.5 | ) | (14.8 | ) | 83.7 | |||||||||
CASH FLOWS FROM FINANCING ACTIVITIES: | ||||||||||||||||
Net Borrowings (Repayments) Under Revolving Credit Facility | (239.5 | ) | 9.2 | (12.4 | ) | (60.4 | ) | |||||||||
Net Repayments of Short-Term Borrowings | — | (1.6 | ) | — | — | |||||||||||
Proceeds from Long-Term Debt | 0.1 | — | 0.1 | — | ||||||||||||
Repayments of Long-Term Debt | (0.1 | ) | (0.1 | ) | (0.2 | ) | (24.2 | ) | ||||||||
Dividends Paid to Shareholders | (12.1 | ) | (12.0 | ) | (24.3 | ) | (24.0 | ) | ||||||||
Proceeds from the Exercise of Stock Options | 0.2 | — | 0.2 | — | ||||||||||||
Repurchase of Common Stock | — | (55.9 | ) | (25.0 | ) | (55.9 | ) | |||||||||
Distributions to Noncontrolling Interest | (2.7 | ) | — | (2.7 | ) | (0.3 | ) | |||||||||
Shares Surrendered for Taxes | (1.4 | ) | (5.9 | ) | (2.5 | ) | (7.5 | ) | ||||||||
Net Cash Used in Financing Activities | (255.5 | ) | (66.3 | ) | (66.8 | ) | (172.3 | ) | ||||||||
EFFECT OF EXCHANGE RATES ON CASH AND CASH EQUIVALENTS | 3.2 | (3.5 | ) | (7.2 | ) | 0.7 | ||||||||||
Net Increase (Decrease) in Cash and Cash Equivalents | (172.3 | ) | 27.0 | 100.8 | 42.7 | |||||||||||
Cash and Cash Equivalents at Beginning of Period | 604.5 | 264.3 | 331.4 | 248.6 | ||||||||||||
Cash and Cash Equivalents at End of Period | $ | 432.2 | $ | 291.3 | $ | 432.2 | $ | 291.3 | ||||||||
SEGMENT INFORMATION | ||||||||||||||||||||||||||||||||||||||||
Unaudited | ||||||||||||||||||||||||||||||||||||||||
(Dollars in Millions) | ||||||||||||||||||||||||||||||||||||||||
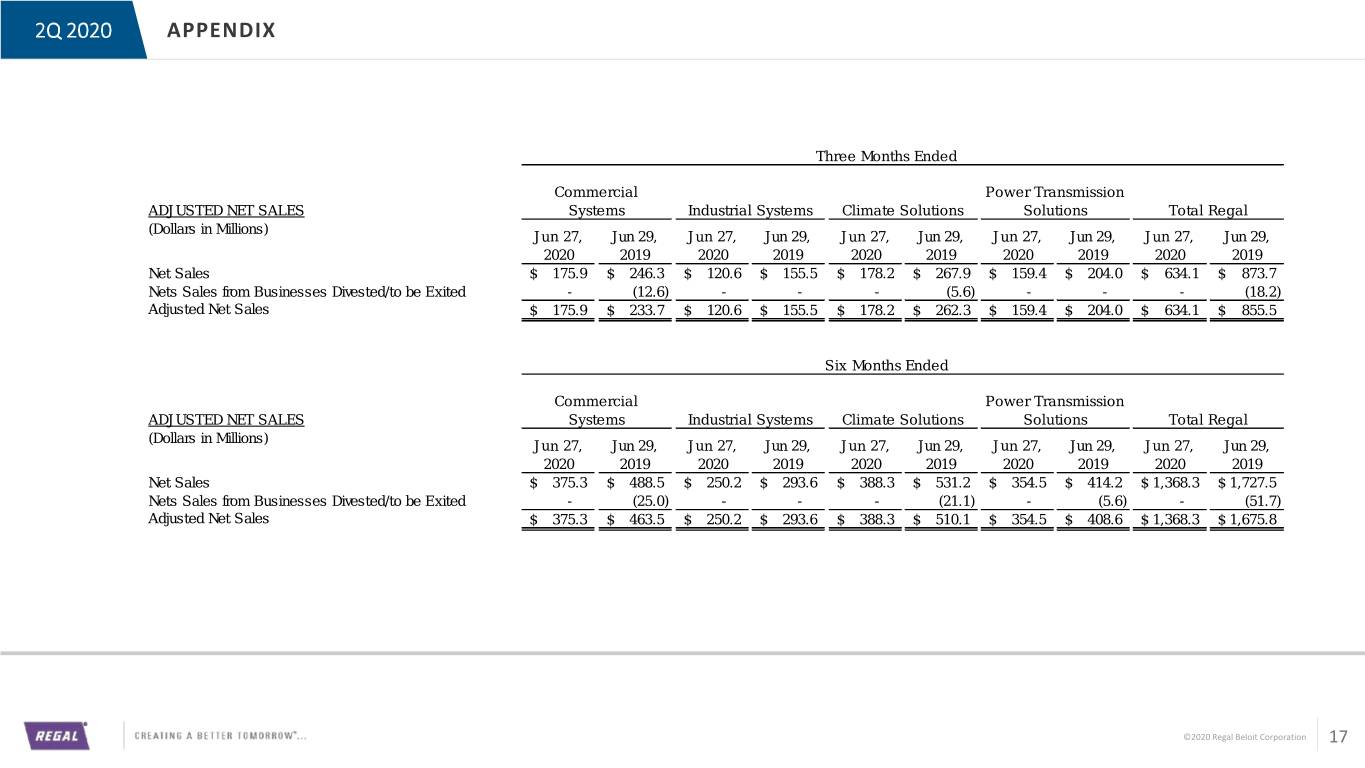
Three Months Ended | ||||||||||||||||||||||||||||||||||||||||
Commercial Systems | Industrial Systems | Climate Solutions | Power Transmission Solutions | Total Regal | ||||||||||||||||||||||||||||||||||||
Jun 27, 2020 | Jun 29, 2019 | Jun 27, 2020 | Jun 29, 2019 | Jun 27, 2020 | Jun 29, 2019 | Jun 27, 2020 | Jun 29, 2019 | Jun 27, 2020 | Jun 29, 2019 | |||||||||||||||||||||||||||||||
Net Sales | $ | 175.9 | $ | 246.3 | $ | 120.6 | $ | 155.5 | $ | 178.2 | $ | 267.9 | $ | 159.4 | $ | 204.0 | $ | 634.1 | $ | 873.7 | ||||||||||||||||||||
Net Sales from Businesses Divested/to be Exited | — | (12.6 | ) | — | — | — | (5.6 | ) | — | — | — | (18.2 | ) | |||||||||||||||||||||||||||
Adjusted Net Sales* | $ | 175.9 | $ | 233.7 | $ | 120.6 | $ | 155.5 | $ | 178.2 | $ | 262.3 | $ | 159.4 | $ | 204.0 | $ | 634.1 | $ | 855.5 | ||||||||||||||||||||
GAAP Operating Margin | 3.5 | % | 8.4 | % | 2.7 | % | (0.8 | )% | 11.2 | % | 19.3 | % | 10.4 | % | 12.2 | % | 7.2 | % | 11.0 | % | ||||||||||||||||||||
Adjusted Operating Margin* | 6.0 | % | 9.5 | % | 4.3 | % | 0.1 | % | 12.4 | % | 17.6 | % | 13.6 | % | 12.4 | % | 9.4 | % | 11.0 | % | ||||||||||||||||||||
Components of Net Sales: | ||||||||||||||||||||||||||||||||||||||||
Organic Sales Growth* | (23.6 | )% | (4.8 | )% | (19.8 | )% | (8.4 | )% | (31.4 | )% | 2.3 | % | (21.1 | )% | (0.8 | )% | (24.7 | )% | (2.5 | )% | ||||||||||||||||||||
Businesses Divested/to be Exited | (3.8 | )% | (9.1 | )% | — | % | (0.9 | )% | (1.4 | )% | (5.0 | )% | (0.1 | )% | (2.6 | )% | (1.5 | )% | (5.0 | )% | ||||||||||||||||||||
Foreign Currency Impact | (1.2 | )% | (1.8 | )% | (2.6 | )% | (2.8 | )% | (0.7 | )% | (0.7 | )% | (0.7 | )% | (1.0 | )% | (1.2 | )% | (1.5 | )% | ||||||||||||||||||||
SEGMENT INFORMATION | ||||||||||||||||||||||||||||||||||||||||
Unaudited | ||||||||||||||||||||||||||||||||||||||||
(Dollars in Millions) | ||||||||||||||||||||||||||||||||||||||||
Six Months Ended | ||||||||||||||||||||||||||||||||||||||||
Commercial Systems | Industrial Systems | Climate Solutions | Power Transmission Solutions | Total Regal | ||||||||||||||||||||||||||||||||||||
Jun 27, 2020 | Jun 29, 2019 | Jun 27, 2020 | Jun 29, 2019 | Jun 27, 2020 | Jun 29, 2019 | Jun 27, 2020 | Jun 29, 2019 | Jun 27, 2020 | Jun 29, 2019 | |||||||||||||||||||||||||||||||
Net Sales | $ | 375.3 | $ | 488.5 | $ | 250.2 | $ | 293.6 | $ | 388.3 | $ | 531.2 | $ | 354.5 | $ | 414.2 | $ | 1,368.3 | $ | 1,727.5 | ||||||||||||||||||||
Net Sales from Businesses Divested/to be Exited | — | (25.0 | ) | — | — | — | (21.1 | ) | — | (5.6 | ) | — | (51.7 | ) | ||||||||||||||||||||||||||
Adjusted Net Sales* | $ | 375.3 | $ | 463.5 | $ | 250.2 | $ | 293.6 | $ | 388.3 | $ | 510.1 | $ | 354.5 | $ | 408.6 | $ | 1,368.3 | $ | 1,675.8 | ||||||||||||||||||||
GAAP Operating Margin | 5.0 | % | 16.1 | % | 1.1 | % | (1.9 | )% | 12.7 | % | 17.1 | % | 12.7 | % | 12.8 | % | 8.5 | % | 12.5 | % | ||||||||||||||||||||
Adjusted Operating Margin* | 6.9 | % | 9.8 | % | 2.5 | % | (0.6 | )% | 13.9 | % | 16.7 | % | 14.8 | % | 13.4 | % | 10.1 | % | 10.9 | % | ||||||||||||||||||||
Components of Net Sales: | ||||||||||||||||||||||||||||||||||||||||
Organic Sales Growth | (18.1 | )% | (3.9 | )% | (12.6 | )% | (10.2 | )% | (23.3 | )% | 3.0 | % | (12.6 | )% | 1.2 | % | (17.4 | )% | (1.9 | )% | ||||||||||||||||||||
Acquisitions | — | % | 6.9 | % | — | % | — | % | — | % | — | % | — | % | — | % | — | % | 1.9 | % | ||||||||||||||||||||
Businesses Divested/to be Exited | (4.2 | )% | (11.2 | )% | — | % | (0.8 | )% | (3.1 | )% | (3.2 | )% | (1.2 | )% | (1.0 | )% | (2.4 | )% | (4.4 | )% | ||||||||||||||||||||
Foreign Currency Impact | (0.9 | )% | (1.6 | )% | (2.2 | )% | (3.1 | )% | (0.5 | )% | (0.9 | )% | (0.6 | )% | (1.2 | )% | (1.0 | )% | (1.6 | )% | ||||||||||||||||||||
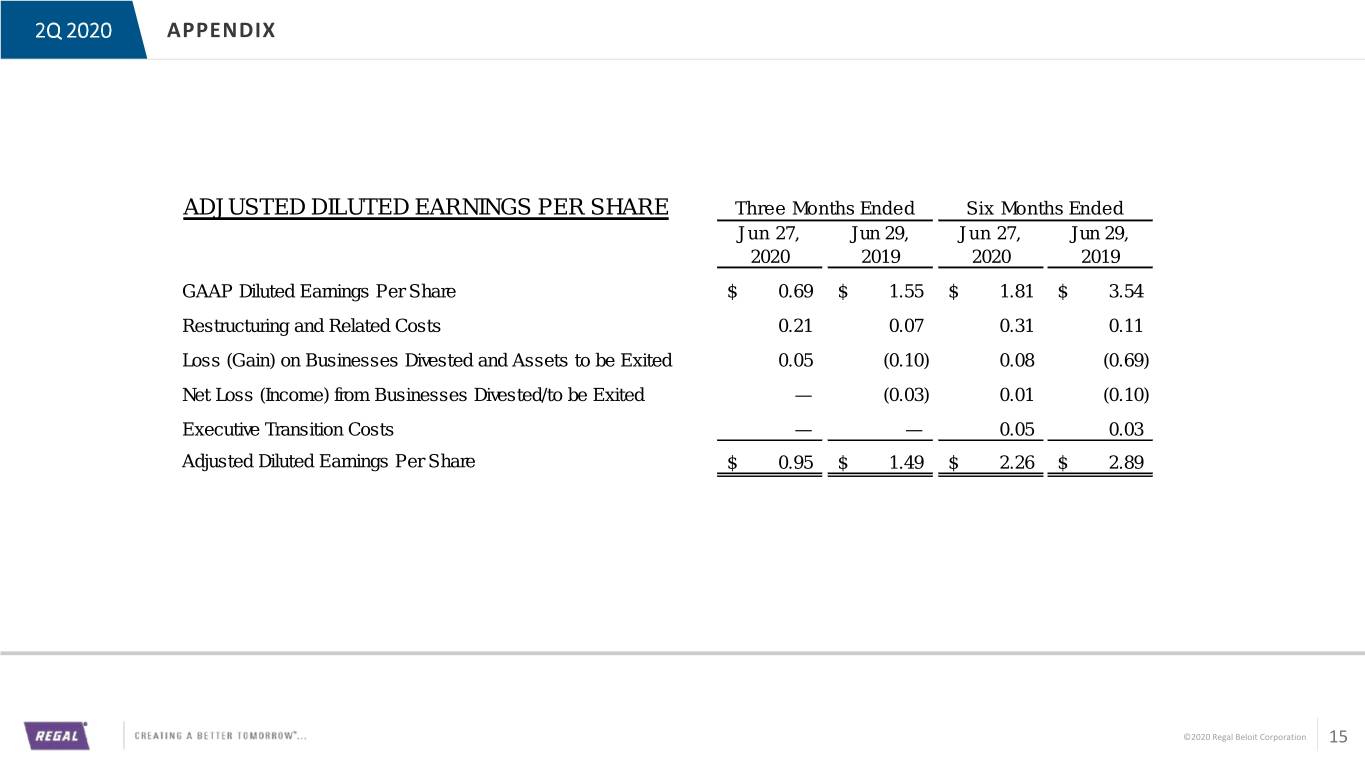
ADJUSTED DILUTED EARNINGS PER SHARE | Three Months Ended | Six Months Ended | ||||||||||||||
Jun 27, 2020 | Jun 29, 2019 | Jun 27, 2020 | Jun 29, 2019 | |||||||||||||
GAAP Diluted Earnings Per Share | $ | 0.69 | $ | 1.55 | $ | 1.81 | $ | 3.54 | ||||||||
Restructuring and Related Costs | 0.21 | 0.07 | 0.31 | 0.11 | ||||||||||||
Loss (Gain) on Businesses Divested and Assets to be Exited | 0.05 | (0.10 | ) | 0.08 | (0.69 | ) | ||||||||||
Net Loss (Income) from Businesses Divested/to be Exited | — | (0.03 | ) | 0.01 | (0.10 | ) | ||||||||||
Executive Transition Costs | — | — | 0.05 | 0.03 | ||||||||||||
Adjusted Diluted Earnings Per Share | $ | 0.95 | $ | 1.49 | $ | 2.26 | $ | 2.89 | ||||||||
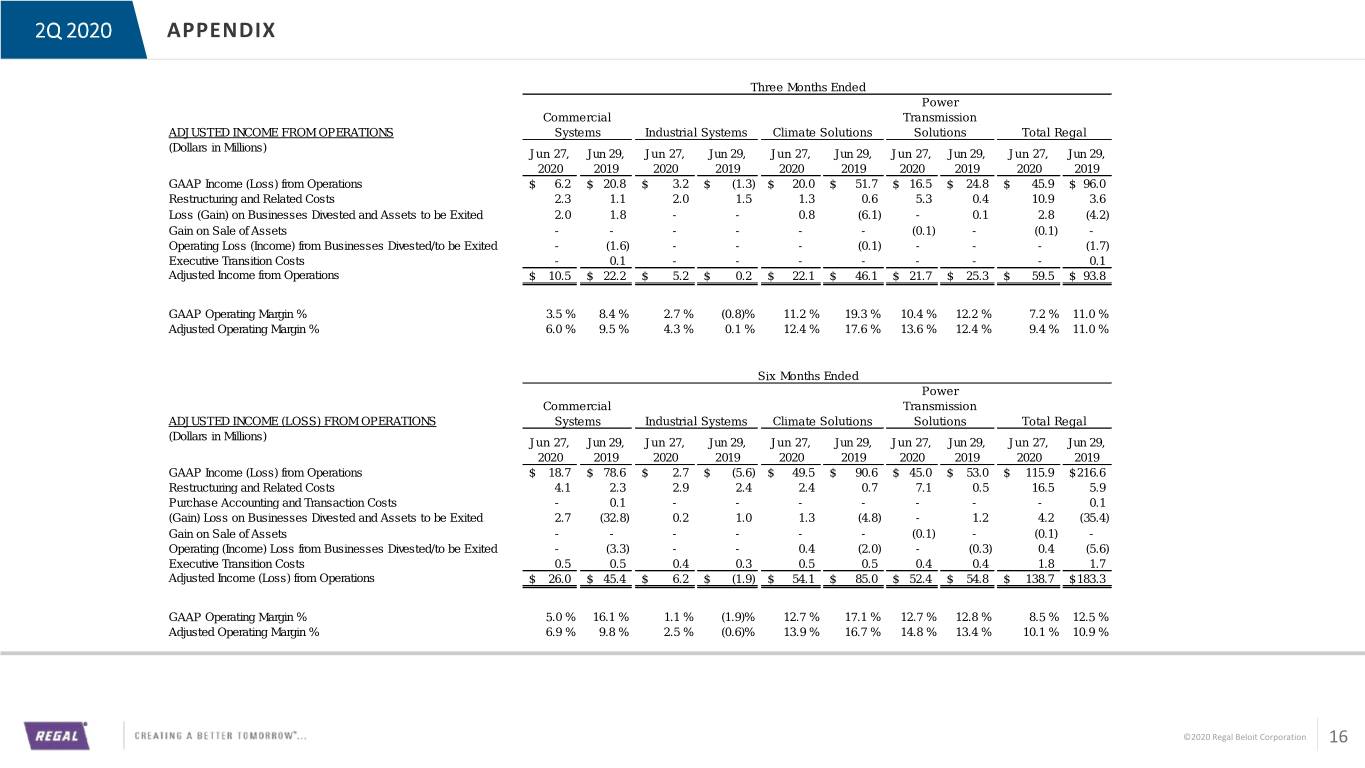
ADJUSTED INCOME FROM OPERATIONS | ||||||||||||||||||||||||||||||||||||||||
Three Months Ended | ||||||||||||||||||||||||||||||||||||||||
Commercial Systems | Industrial Systems | Climate Solutions | Power Transmission Solutions | Total Regal | ||||||||||||||||||||||||||||||||||||
Jun 27, 2020 | Jun 29, 2019 | Jun 27, 2020 | Jun 29, 2019 | Jun 27, 2020 | Jun 29, 2019 | Jun 27, 2020 | Jun 29, 2019 | Jun 27, 2020 | Jun 29, 2019 | |||||||||||||||||||||||||||||||
GAAP Income (Loss) from Operations | $ | 6.2 | $ | 20.8 | $ | 3.2 | $ | (1.3 | ) | $ | 20.0 | $ | 51.7 | $ | 16.5 | $ | 24.8 | $ | 45.9 | $ | 96.0 | |||||||||||||||||||
Restructuring and Related Costs | 2.3 | 1.1 | 2.0 | 1.5 | 1.3 | 0.6 | 5.3 | 0.4 | 10.9 | 3.6 | ||||||||||||||||||||||||||||||
Loss (Gain) on Businesses Divested and Assets to be Exited | 2.0 | 1.8 | — | — | 0.8 | (6.1 | ) | — | 0.1 | 2.8 | (4.2 | ) | ||||||||||||||||||||||||||||
Gain on Sale of Assets | — | — | — | — | — | — | (0.1 | ) | — | (0.1 | ) | — | ||||||||||||||||||||||||||||
Operating Loss (Income) from Businesses Divested/to be Exited | — | (1.6 | ) | — | — | — | (0.1 | ) | — | — | — | (1.7 | ) | |||||||||||||||||||||||||||
Executive Transition Costs | — | 0.1 | — | — | — | — | — | — | — | 0.1 | ||||||||||||||||||||||||||||||
Adjusted Income from Operations | $ | 10.5 | $ | 22.2 | $ | 5.2 | $ | 0.2 | $ | 22.1 | $ | 46.1 | $ | 21.7 | $ | 25.3 | $ | 59.5 | $ | 93.8 | ||||||||||||||||||||
GAAP Operating Margin % | 3.5% | 8.4% | 2.7% | (0.8)% | 11.2% | 19.3% | 10.4% | 12.2% | 7.2% | 11.0% | ||||||||||||||||||||||||||||||
Adjusted Operating Margin % | 6.0% | 9.5% | 4.3% | 0.1% | 12.4% | 17.6% | 13.6% | 12.4% | 9.4% | 11.0% | ||||||||||||||||||||||||||||||
ADJUSTED INCOME (LOSS) FROM OPERATIONS | ||||||||||||||||||||||||||||||||||||||||
Six Months Ended | ||||||||||||||||||||||||||||||||||||||||
Commercial Systems | Industrial Systems | Climate Solutions | Power Transmission Solutions | Total Regal | ||||||||||||||||||||||||||||||||||||
Jun 27, 2020 | Jun 29, 2019 | Jun 27, 2020 | Jun 29, 2019 | Jun 27, 2020 | Jun 29, 2019 | Jun 27, 2020 | Jun 29, 2019 | Jun 27, 2020 | Jun 29, 2019 | |||||||||||||||||||||||||||||||
GAAP Income (Loss) from Operations | $ | 18.7 | $ | 78.6 | $ | 2.7 | $ | (5.6 | ) | $ | 49.5 | $ | 90.6 | $ | 45.0 | $ | 53.0 | $ | 115.9 | $ | 216.6 | |||||||||||||||||||
Restructuring and Related Costs | 4.1 | 2.3 | 2.9 | 2.4 | 2.4 | 0.7 | 7.1 | 0.5 | 16.5 | 5.9 | ||||||||||||||||||||||||||||||
Purchase Accounting and Transaction Costs | — | 0.1 | — | — | — | — | — | — | — | 0.1 | ||||||||||||||||||||||||||||||
(Gain) Loss on Businesses Divested and Assets to be Exited | 2.7 | (32.8 | ) | 0.2 | 1.0 | 1.3 | (4.8 | ) | — | 1.2 | 4.2 | (35.4 | ) | |||||||||||||||||||||||||||
Gain on Sale of Assets | — | — | — | — | — | — | (0.1 | ) | — | (0.1 | ) | — | ||||||||||||||||||||||||||||
Operating (Income) Loss from Businesses Divested/to be Exited | — | (3.3 | ) | — | — | 0.4 | (2.0 | ) | — | (0.3 | ) | 0.4 | (5.6 | ) | ||||||||||||||||||||||||||
Executive Transition Costs | 0.5 | 0.5 | 0.4 | 0.3 | 0.5 | 0.5 | 0.4 | 0.4 | 1.8 | 1.7 | ||||||||||||||||||||||||||||||
Adjusted Income (Loss) from Operations | $ | 26.0 | $ | 45.4 | $ | 6.2 | $ | (1.9 | ) | $ | 54.1 | $ | 85.0 | $ | 52.4 | $ | 54.8 | $ | 138.7 | $ | 183.3 | |||||||||||||||||||
GAAP Operating Margin % | 5.0% | 16.1% | 1.1% | (1.9)% | 12.7% | 17.1% | 12.7% | 12.8% | 8.5% | 12.5% | ||||||||||||||||||||||||||||||
Adjusted Operating Margin % | 6.9% | 9.8% | 2.5% | (0.6)% | 13.9% | 16.7% | 14.8% | 13.4% | 10.1% | 10.9% | ||||||||||||||||||||||||||||||
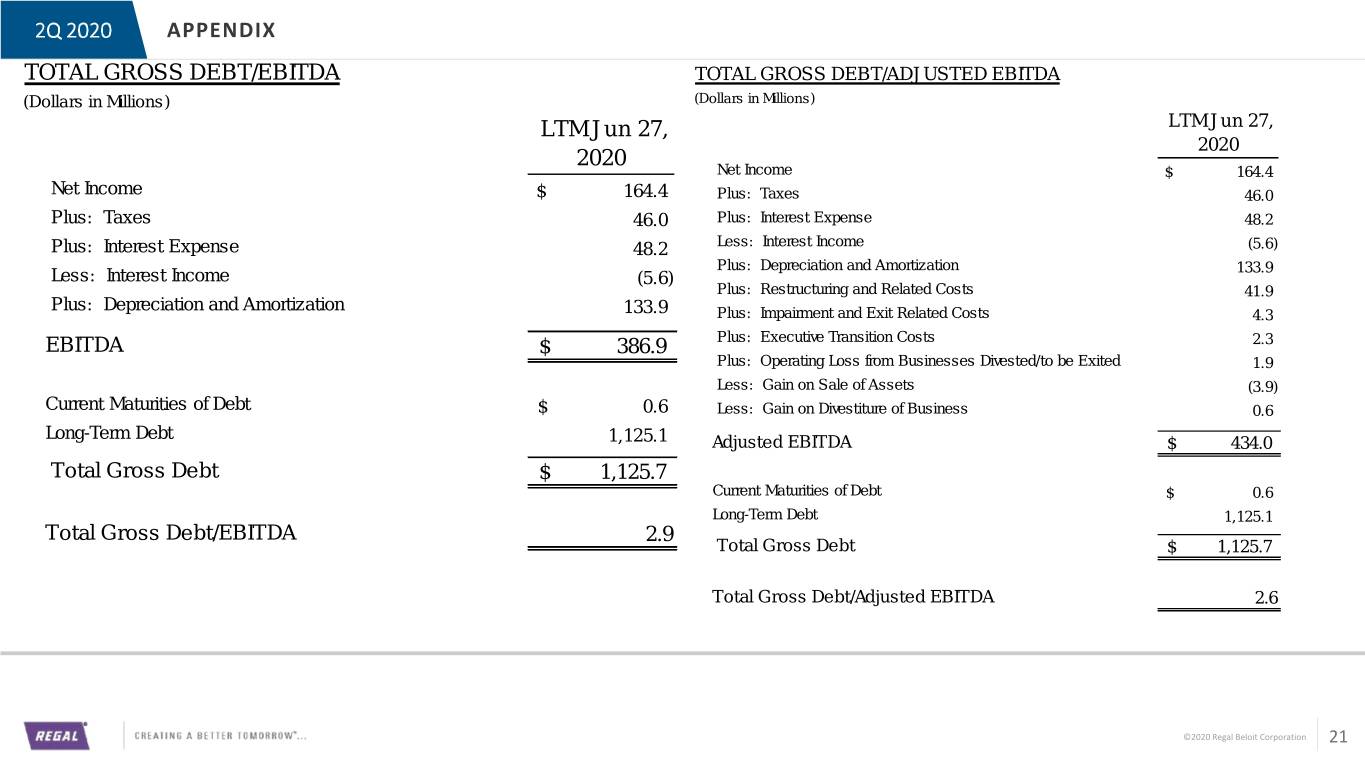
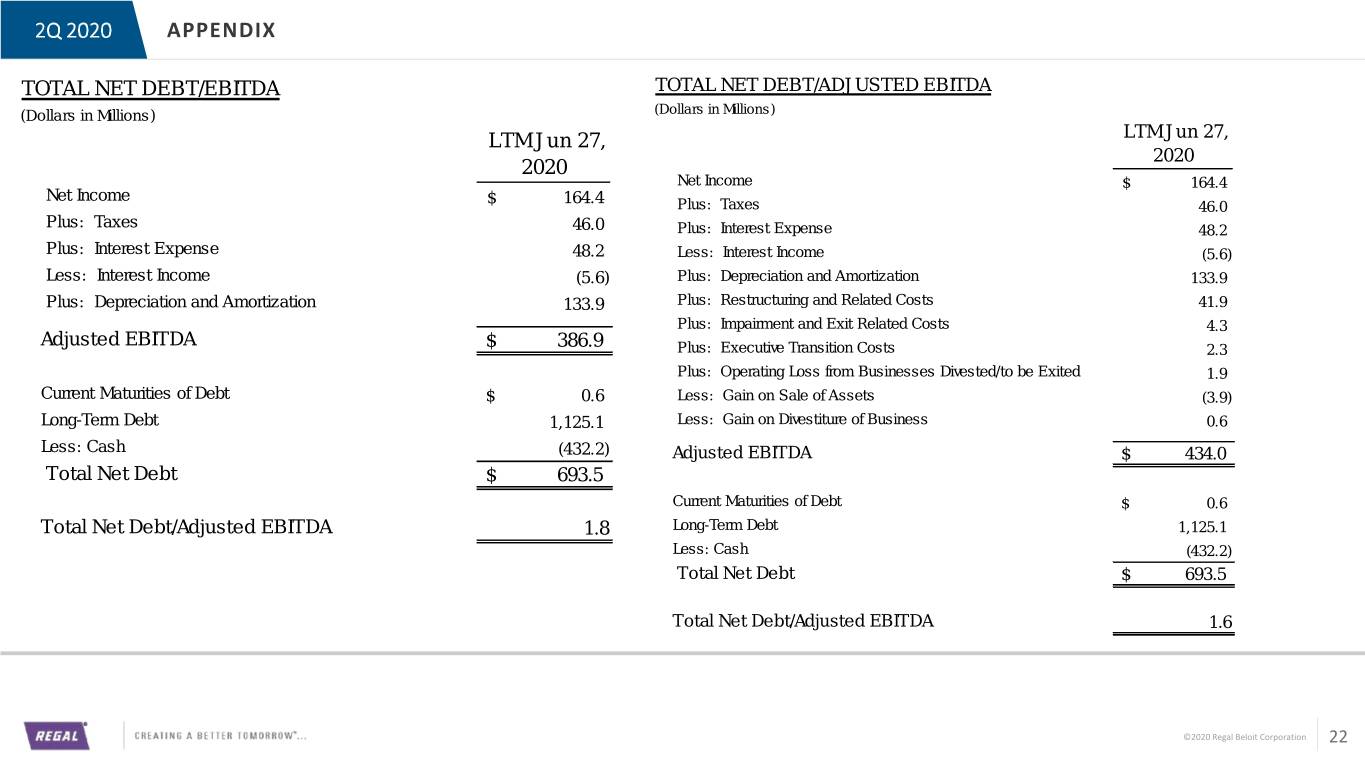
DEBT TO EBITDA | Last Twelve Months | |||||||||
Jun 27, 2020 | Dec 28, 2019 | |||||||||
Net Income | $ | 164.4 | $ | 242.6 | ||||||
Interest Expense | 48.2 | 53.0 | ||||||||
Interest Income | (5.6 | ) | (5.6 | ) | ||||||
Taxes | 46.0 | 61.2 | ||||||||
Depreciation and Amortization | 133.9 | 134.5 | ||||||||
EBITDA | $ | 386.9 | $ | 485.7 | ||||||
Restructuring and Related Costs | 41.9 | 31.3 | ||||||||
Purchase Accounting and Transactions Costs | — | 0.1 | ||||||||
Impairment and Exit Related Costs | 4.3 | 10.0 | ||||||||
Executive Transition Costs | 2.3 | 2.2 | ||||||||
Operating Loss (Income) from Businesses Divested/to be Exited | 1.9 | (4.1 | ) | |||||||
Gain on Sale of Assets | (3.9 | ) | (3.8 | ) | ||||||
Loss (Gain) on Divestiture of Businesses | 0.6 | (44.7 | ) | |||||||
Adjusted EBITDA | $ | 434.0 | $ | 476.7 | ||||||
Current Maturities of Long-Term Debt | $ | 0.6 | $ | 0.6 | ||||||
Long-Term Debt | 1,125.1 | 1,136.9 | ||||||||
Total Gross Debt | $ | 1,125.7 | $ | 1,137.5 | ||||||
Cash | (432.2 | ) | (331.4 | ) | ||||||
Net Debt | $ | 693.5 | $ | 806.1 | ||||||
Gross Debt/EBITDA | 2.9 | 2.3 | ||||||||
Gross Debt/Adjusted EBITDA | 2.6 | 2.4 | ||||||||
Net Debt/EBITDA | 1.8 | 1.7 | ||||||||
Net Debt/Adjusted EBITDA | 1.6 | 1.7 | ||||||||
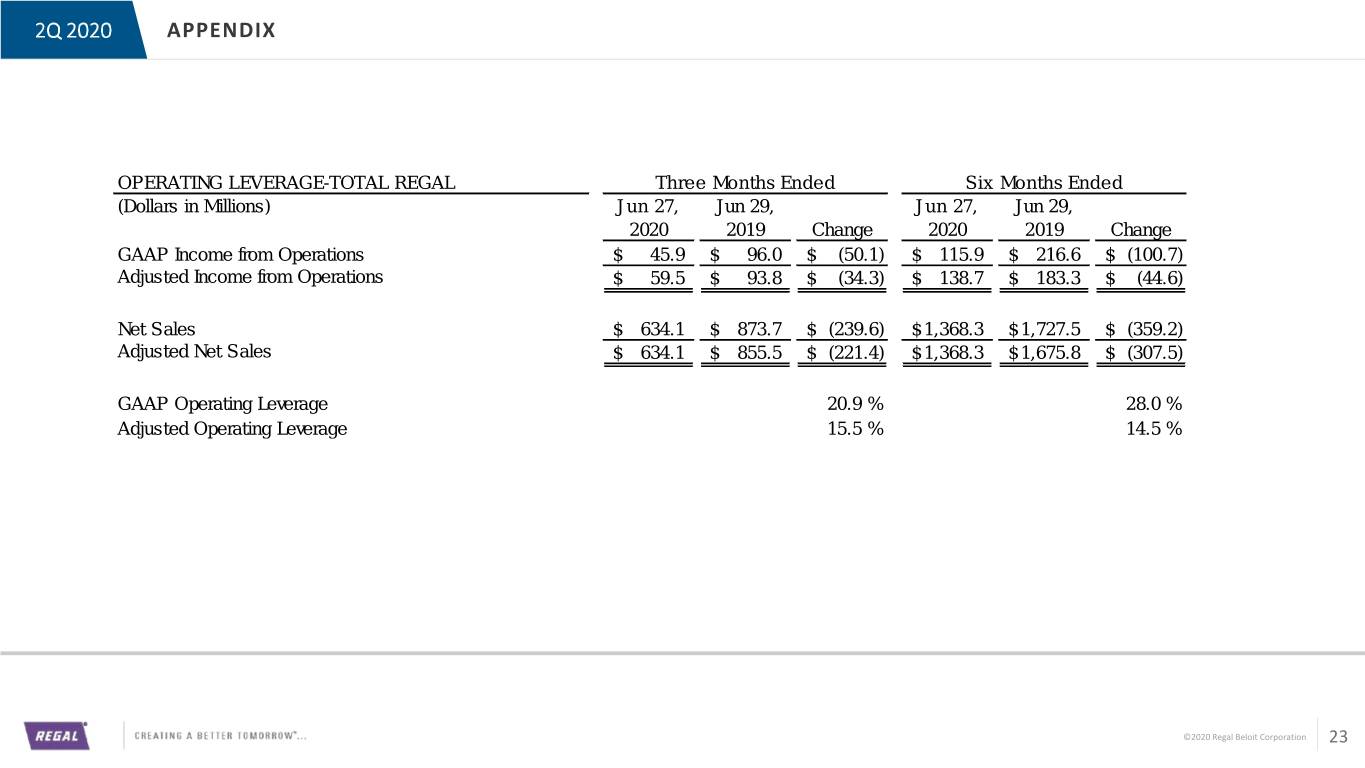
OPERATING LEVERAGE - TOTAL REGAL | Three Months Ended | Six Months Ended | ||||||||||||||||||||||
(Dollars in Millions) | Jun 27, 2020 | Jun 29, 2019 | Change | Jun 27, 2020 | Jun 29, 2019 | Change | ||||||||||||||||||
GAAP Income from Operations | $ | 45.9 | $ | 96.0 | $ | (50.1 | ) | $ | 115.9 | $ | 216.6 | $ | (100.7 | ) | ||||||||||
Adjusted Income from Operations | $ | 59.5 | $ | 93.8 | $ | (34.3 | ) | $ | 138.7 | $ | 183.3 | $ | (44.6 | ) | ||||||||||
Net Sales | $ | 634.1 | $ | 873.7 | $ | (239.6 | ) | $ | 1,368.3 | $ | 1,727.5 | $ | (359.2 | ) | ||||||||||
Adjusted Net Sales | $ | 634.1 | $ | 855.5 | $ | (221.4 | ) | $ | 1,368.3 | $ | 1,675.8 | $ | (307.5 | ) | ||||||||||
GAAP Operating Leverage | 20.9 | % | 28.0 | % | ||||||||||||||||||||
Adjusted Operating Leverage | 15.5 | % | 14.5 | % | ||||||||||||||||||||
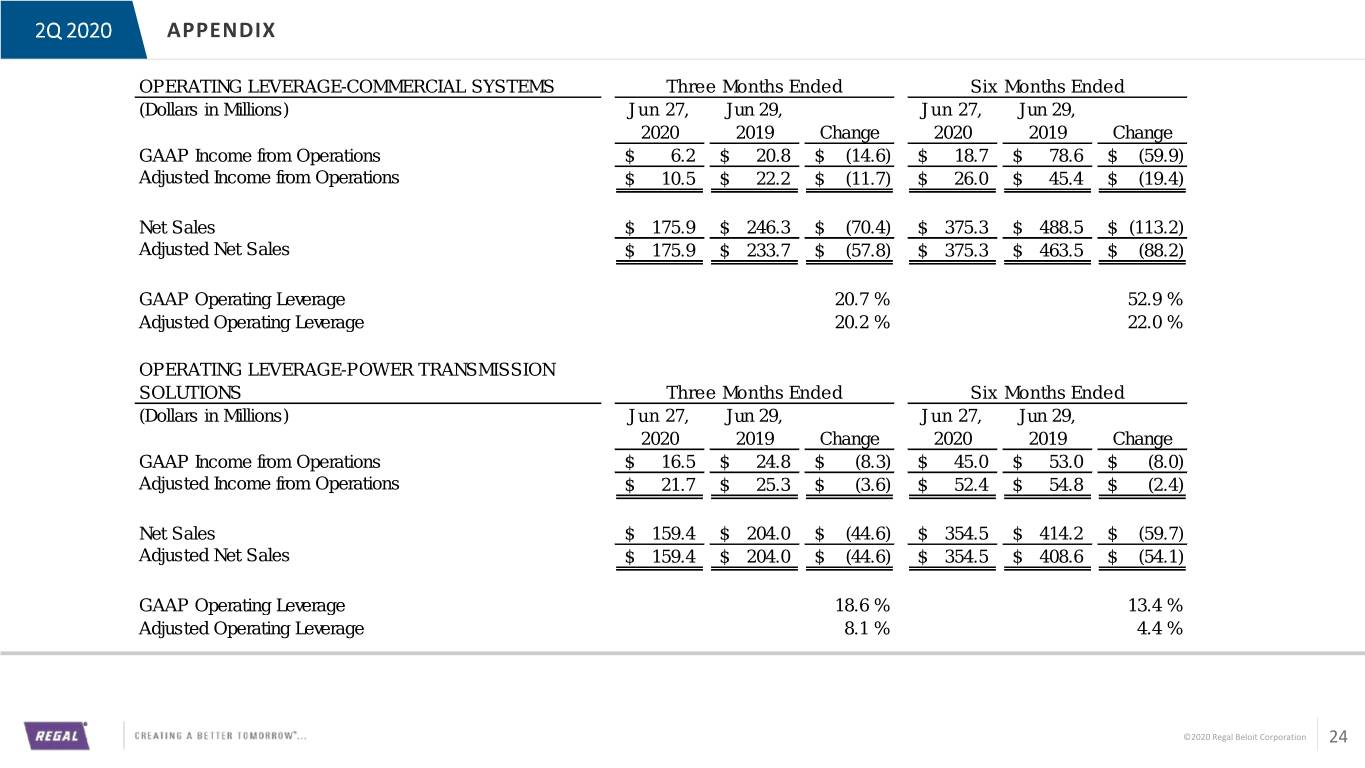
OPERATING LEVERAGE - COMMERCIAL SYSTEMS | Three Months Ended | Six Months Ended | ||||||||||||||||||||||
(Dollars in Millions) | Jun 27, 2020 | Jun 29, 2019 | Change | Jun 27, 2020 | Jun 29, 2019 | Change | ||||||||||||||||||
GAAP Income from Operations | $ | 6.2 | $ | 20.8 | $ | (14.6 | ) | $ | 18.7 | $ | 78.6 | $ | (59.9 | ) | ||||||||||
Adjusted Income from Operations | $ | 10.5 | $ | 22.2 | $ | (11.7 | ) | $ | 26.0 | $ | 45.4 | $ | (19.4 | ) | ||||||||||
Net Sales | $ | 175.9 | $ | 246.3 | $ | (70.4 | ) | $ | 375.3 | $ | 488.5 | $ | (113.2 | ) | ||||||||||
Adjusted Net Sales | $ | 175.9 | $ | 233.7 | $ | (57.8 | ) | $ | 375.3 | $ | 463.5 | $ | (88.2 | ) | ||||||||||
GAAP Operating Leverage | 20.7 | % | 52.9 | % | ||||||||||||||||||||
Adjusted Operating Leverage | 20.2 | % | 22.0 | % | ||||||||||||||||||||
FREE CASH FLOW | Three Months Ended | Six Months Ended | ||||||||||||||
Jun 27, 2020 | Jun 29, 2019 | Jun 27, 2020 | Jun 29, 2019 | |||||||||||||
Net Cash Provided by Operating Activities | $ | 86.9 | $ | 112.3 | $ | 189.6 | $ | 130.6 | ||||||||
Additions to Property Plant and Equipment | (9.5 | ) | (36.0 | ) | (20.4 | ) | (56.2 | ) | ||||||||
Free Cash Flow | $ | 77.4 | $ | 76.3 | $ | 169.2 | $ | 74.4 | ||||||||
GAAP Net Income Attributable to Regal Beloit Corporation | $ | 28.1 | $ | 66.6 | $ | 73.9 | $ | 152.5 | ||||||||
Loss (Gain) on Businesses Divested and Impairments | 2.8 | (4.2 | ) | 4.2 | (35.4 | ) | ||||||||||
Tax Effect from Loss (Gain) on Businesses Divested and Impairments | (0.6 | ) | 0.2 | (0.9 | ) | 5.5 | ||||||||||
Adjusted Net Income Attributable to Regal Beloit Corporation1 | $ | 30.3 | $ | 62.6 | $ | 77.2 | $ | 122.6 | ||||||||
Free Cash Flow as a Percentage of Adjusted Net Income Attributable to Regal Beloit Corporation | 255.4 | % | 121.9 | % | 219.2 | % | 60.7 | % | ||||||||
1 The Net Income Attributable to Regal Beloit Corporation is adjusted for the gains and losses on divested businesses and goodwill and asset impairments related to the businesses to be exited and used in the Free Cash Flow Calculation. | ||||||||||||||||
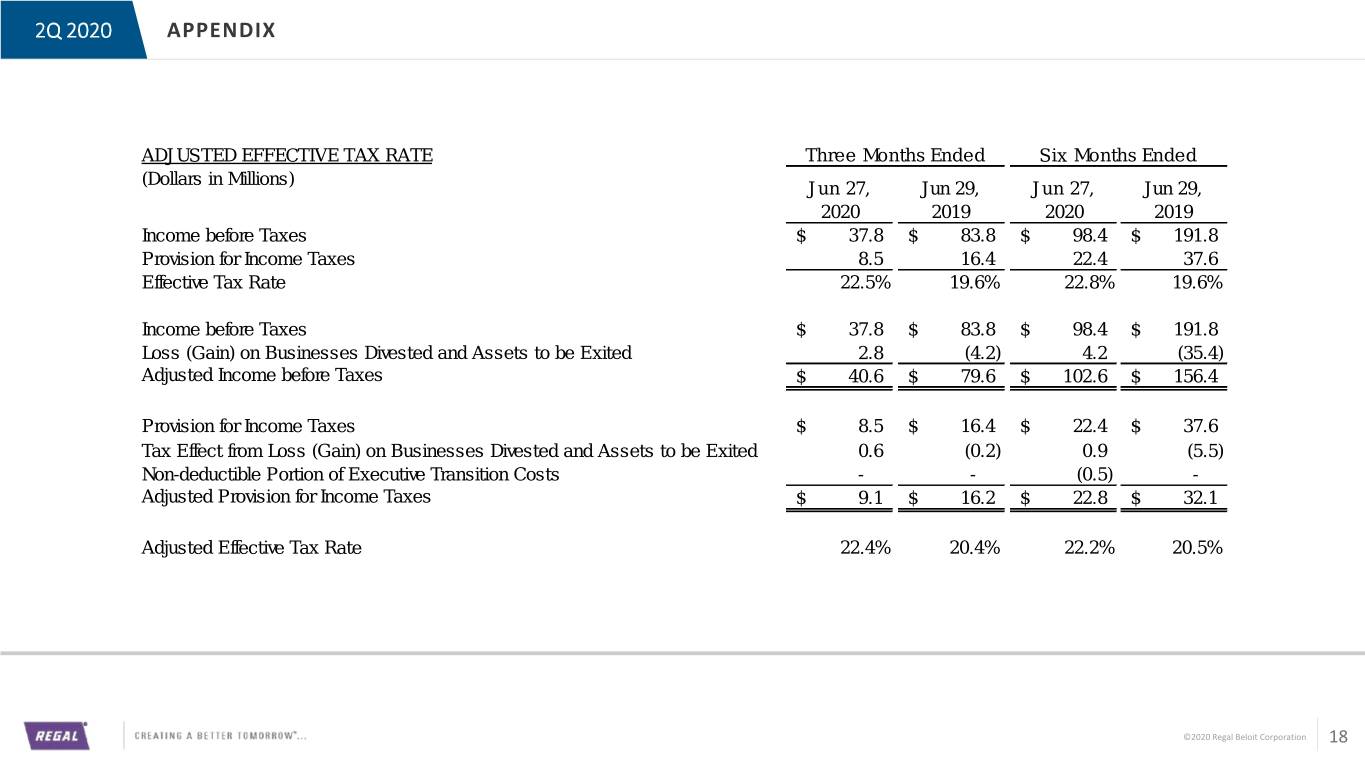
ADJUSTED EFFECTIVE TAX RATE | Three Months Ended | Six Months Ended | ||||||||||||||
Jun 27, 2020 | Jun 29, 2019 | Jun 27, 2020 | Jun 29, 2019 | |||||||||||||
Income before Taxes | $ | 37.8 | $ | 83.8 | $ | 98.4 | $ | 191.8 | ||||||||
Provision for Income Taxes | 8.5 | 16.4 | 22.4 | 37.6 | ||||||||||||
Effective Tax Rate | 22.5 | % | 19.6 | % | 22.8 | % | 19.6 | % | ||||||||
Income before Taxes | $ | 37.8 | $ | 83.8 | $ | 98.4 | $ | 191.8 | ||||||||
Loss (Gain) on Businesses Divested and Assets to be Exited | 2.8 | (4.2 | ) | 4.2 | (35.4 | ) | ||||||||||
Adjusted Income before Taxes | $ | 40.6 | $ | 79.6 | $ | 102.6 | $ | 156.4 | ||||||||
Provision for Income Taxes | $ | 8.5 | $ | 16.4 | $ | 22.4 | $ | 37.6 | ||||||||
Tax Effect from Loss (Gain) on Businesses Divested and Assets to be Exited | 0.6 | (0.2 | ) | 0.9 | (5.5 | ) | ||||||||||
Non-deductible Portion of Executive Transition Costs | — | — | (0.5 | ) | — | |||||||||||
Adjusted Provision for Income Taxes | $ | 9.1 | $ | 16.2 | $ | 22.8 | $ | 32.1 | ||||||||
Adjusted Effective Tax Rate | 22.4 | % | 20.4 | % | 22.2 | % | 20.5 | % | ||||||||
ORGANIC SALES GROWTH | Three Months Ended | |||||||||||||||||||
June 27, 2020 | ||||||||||||||||||||
Commercial Systems | Industrial Systems | Climate Solutions | Power Transmission Solutions | Total Regal | ||||||||||||||||
Net Sales Three Months Ended Jun 27, 2020 | $ | 175.9 | $ | 120.6 | $ | 178.2 | $ | 159.4 | $ | 634.1 | ||||||||||
Impact from Foreign Currency Exchange Rates | 2.7 | 4.1 | 1.8 | 1.5 | 10.1 | |||||||||||||||
Organic Sales Three Months Ended Jun 27, 2020 | $ | 178.6 | $ | 124.7 | $ | 180.0 | $ | 160.9 | $ | 644.2 | ||||||||||
Net Sales Three Months Ended Jun 29, 2019 | $ | 246.3 | $ | 155.5 | $ | 267.9 | $ | 204.0 | $ | 873.7 | ||||||||||
Net Sales from Businesses Divested/to be Exited | (12.6 | ) | — | (5.6 | ) | — | (18.2 | ) | ||||||||||||
Adjusted Net Sales Three Months Ended Jun 29, 2019 | $ | 233.7 | $ | 155.5 | $ | 262.3 | $ | 204.0 | $ | 855.5 | ||||||||||
Three Months Ended Jun 27, 2020 Organic Sales Growth % | (23.6 | )% | (19.8 | )% | (31.4 | )% | (21.1 | )% | (24.7 | )% | ||||||||||
Three Months Ended Jun 27, 2020 Net Sales Growth % | (28.6 | )% | (22.4 | )% | (33.5 | )% | (21.9 | )% | (27.4 | )% | ||||||||||
ORGANIC SALES GROWTH | Six Months Ended | |||||||||||||||||||
June 27, 2020 | ||||||||||||||||||||
Commercial Systems | Industrial Systems | Climate Solutions | Power Transmission Solutions | Total Regal | ||||||||||||||||
Net Sales Six Months Ended Jun 27, 2020 | $ | 375.3 | $ | 250.2 | $ | 388.3 | $ | 354.5 | $ | 1,368.3 | ||||||||||
Impact from Foreign Currency Exchange Rates | 4.4 | 6.4 | 2.8 | 2.5 | 16.1 | |||||||||||||||
Organic Sales Six Months Ended Jun 27, 2020 | $ | 379.7 | $ | 256.6 | $ | 391.1 | $ | 357.0 | $ | 1,384.4 | ||||||||||
Net Sales Six Months Ended Jun 29, 2019 | $ | 488.5 | $ | 293.6 | $ | 531.2 | $ | 414.2 | $ | 1,727.5 | ||||||||||
Net Sales from Businesses Divested/to be Exited | (25.0 | ) | — | (21.1 | ) | (5.6 | ) | (51.7 | ) | |||||||||||
Adjusted Net Sales Six Months Ended Jun 29, 2019 | $ | 463.5 | $ | 293.6 | $ | 510.1 | $ | 408.6 | $ | 1,675.8 | ||||||||||
Six Months Ended Jun 27, 2020 Organic Sales Growth % | (18.1 | )% | (12.6 | )% | (23.3 | )% | (12.6 | )% | (17.4 | )% | ||||||||||
Six Months Ended Jun 27, 2020 Net Sales Growth % | (23.2 | )% | (14.8 | )% | (26.9 | )% | (14.4 | )% | (20.8 | )% | ||||||||||
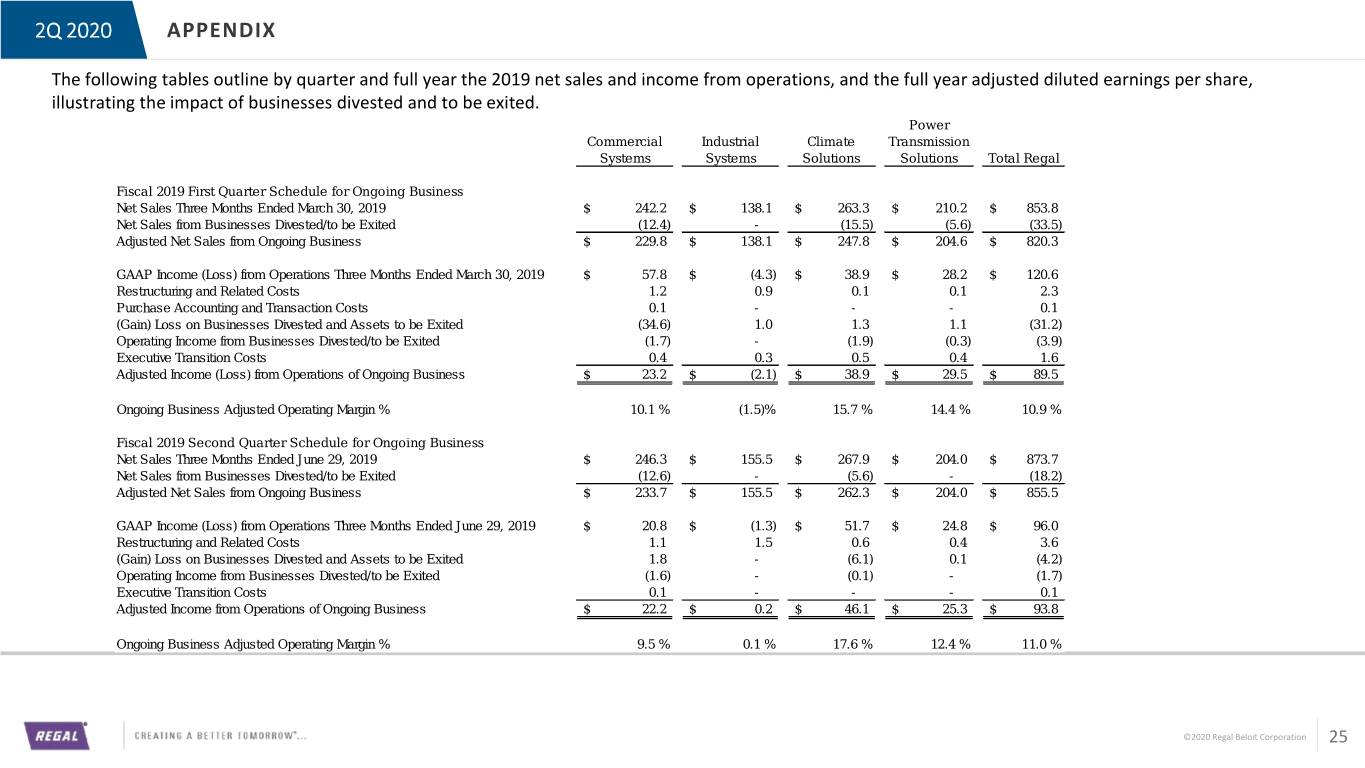
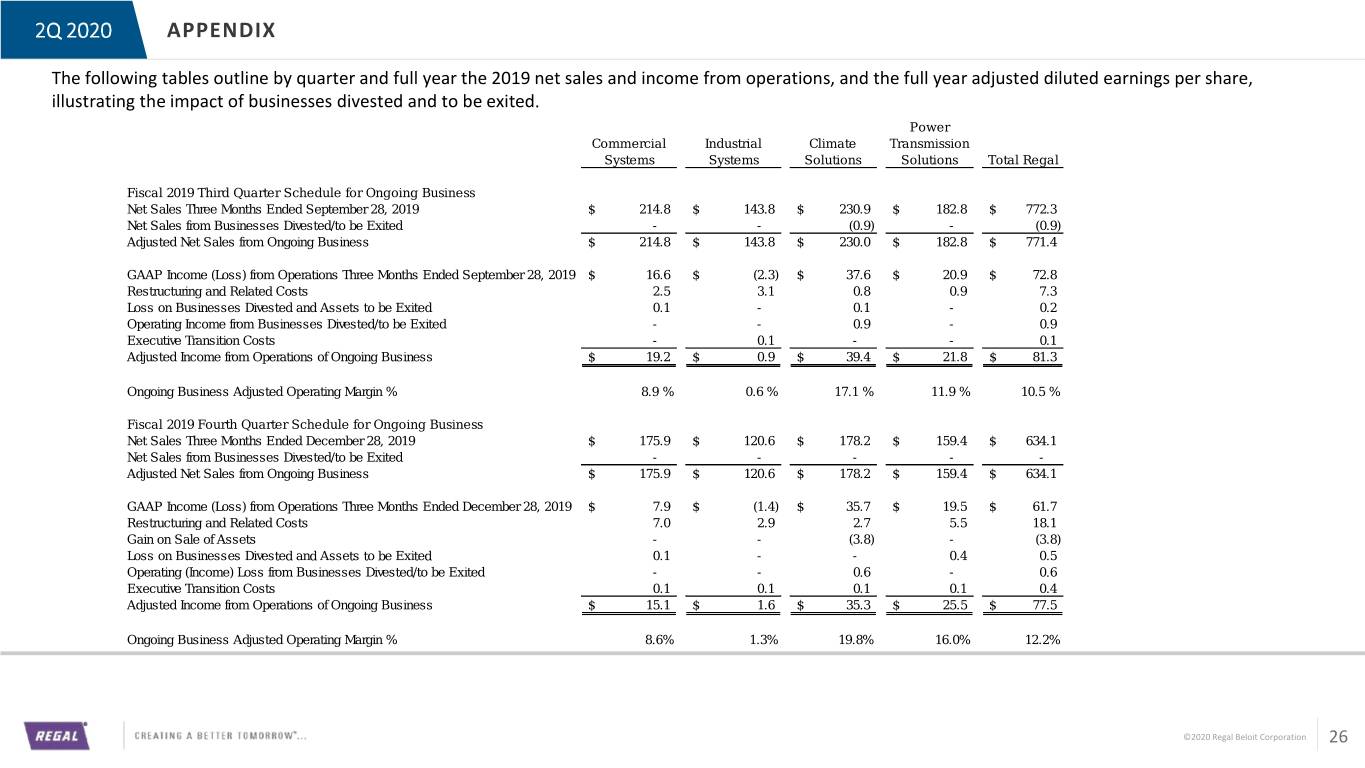
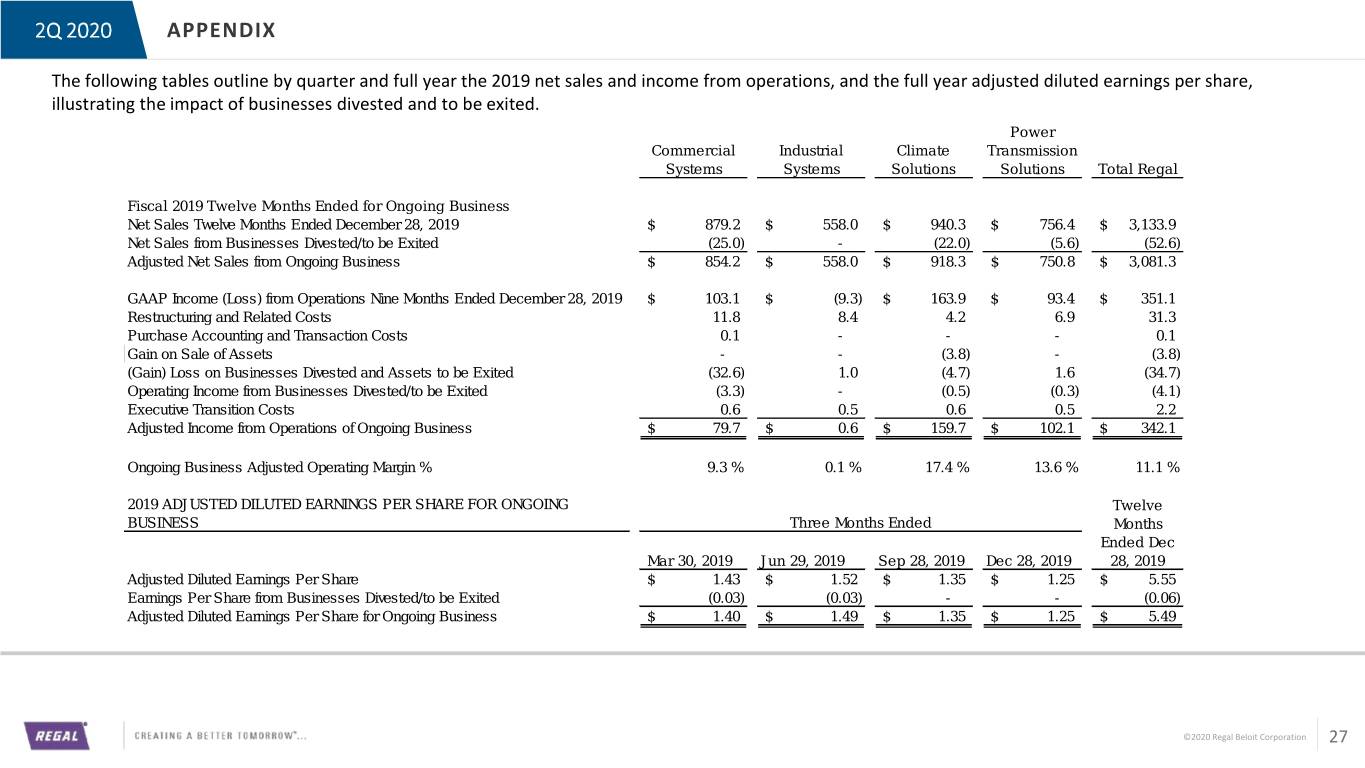
The following tables outline by quarter and full year the 2019 net sales and income from operations, and the full year adjusted diluted earnings per share, illustrating the impact of businesses divested and to be exited.
Commercial Systems | Industrial Systems | Climate Solutions | Power Transmission Solutions | Total Regal | ||||||||||||||||
Fiscal 2019 First Quarter Schedule for Ongoing Business | ||||||||||||||||||||
Net Sales Three Months Ended March 30, 2019 | $ | 242.2 | $ | 138.1 | $ | 263.3 | $ | 210.2 | $ | 853.8 | ||||||||||
Net Sales from Businesses Divested/to be Exited | (12.4 | ) | — | (15.5 | ) | (5.6 | ) | (33.5 | ) | |||||||||||
Net Sales from Ongoing Business | $ | 229.8 | $ | 138.1 | $ | 247.8 | $ | 204.6 | $ | 820.3 | ||||||||||
GAAP Income (Loss) from Operations Three Months Ended March 30, 2019 | $ | 57.8 | $ | (4.3 | ) | $ | 38.9 | $ | 28.2 | $ | 120.6 | |||||||||
Restructuring and Related Costs | 1.2 | 0.9 | 0.1 | 0.1 | 2.3 | |||||||||||||||
Purchase Accounting and Transaction Costs | 0.1 | — | — | — | 0.1 | |||||||||||||||
(Gain) Loss on Businesses Divested and Assets to be Exited | (34.6 | ) | 1.0 | 1.3 | 1.1 | (31.2 | ) | |||||||||||||
Income from Operations of Businesses Divested/to be Exited | (1.7 | ) | — | (1.9 | ) | (0.3 | ) | (3.9 | ) | |||||||||||
Executive Transition Costs | 0.4 | 0.3 | 0.5 | 0.4 | 1.6 | |||||||||||||||
Adjusted Income (Loss) from Operations of Ongoing Business | $ | 23.2 | $ | (2.1 | ) | $ | 38.9 | $ | 29.5 | $ | 89.5 | |||||||||
Ongoing Business Adjusted Operating Margin % | 10.1 | % | (1.5 | )% | 15.7 | % | 14.4 | % | 10.9 | % | ||||||||||
Fiscal 2019 Second Quarter Schedule for Ongoing Business | ||||||||||||||||||||
Net Sales Three Months Ended June 29, 2019 | $ | 246.3 | $ | 155.5 | $ | 267.9 | $ | 204.0 | $ | 873.7 | ||||||||||
Net Sales from Businesses Divested/to be Exited | (12.6 | ) | — | (5.6 | ) | — | (18.2 | ) | ||||||||||||
Net Sales from Ongoing Business | $ | 233.7 | $ | 155.5 | $ | 262.3 | $ | 204.0 | $ | 855.5 | ||||||||||
GAAP Income (Loss) from Operations Three Months Ended June 29, 2019 | $ | 20.8 | $ | (1.3 | ) | $ | 51.7 | $ | 24.8 | $ | 96.0 | |||||||||
Restructuring and Related Costs | 1.1 | 1.5 | 0.6 | 0.4 | 3.6 | |||||||||||||||
(Gain) Loss on Businesses Divested and Assets to be Exited | 1.8 | — | (6.1 | ) | 0.1 | (4.2 | ) | |||||||||||||
Income from Operations of Businesses Divested/to be Exited | (1.6 | ) | — | (0.1 | ) | — | (1.7 | ) | ||||||||||||
Executive Transition Costs | 0.1 | — | — | — | 0.1 | |||||||||||||||
Adjusted Income from Operations of Ongoing Business | $ | 22.2 | $ | 0.2 | $ | 46.1 | $ | 25.3 | $ | 93.8 | ||||||||||
Ongoing Business Adjusted Operating Margin % | 9.5 | % | 0.1 | % | 17.6 | % | 12.4 | % | 11.0 | % | ||||||||||
Commercial Systems | Industrial Systems | Climate Solutions | Power Transmission Solutions | Total Regal | ||||||||||||||||
Fiscal 2019 Third Quarter Schedule for Ongoing Business | ||||||||||||||||||||
Net Sales Three Months Ended September 28, 2019 | $ | 214.8 | $ | 143.8 | $ | 230.9 | $ | 182.8 | $ | 772.3 | ||||||||||
Net Sales from Businesses Divested/to be Exited | — | — | (0.9 | ) | — | (0.9 | ) | |||||||||||||
Net Sales from Ongoing Business | $ | 214.8 | $ | 143.8 | $ | 230.0 | $ | 182.8 | $ | 771.4 | ||||||||||
GAAP Income (Loss) from Operations Three Months Ended September 28, 2019 | $ | 16.6 | $ | (2.3 | ) | $ | 37.6 | $ | 20.9 | $ | 72.8 | |||||||||
Restructuring and Related Costs | 2.5 | 3.1 | 0.8 | 0.9 | 7.3 | |||||||||||||||
Loss on Businesses Divested and Assets to be Exited | 0.1 | — | 0.1 | — | 0.2 | |||||||||||||||
Loss from Operations of Businesses Divested/to be Exited | — | — | 0.9 | — | 0.9 | |||||||||||||||
Executive Transition Costs | — | 0.1 | — | — | 0.1 | |||||||||||||||
Adjusted Income from Operations of Ongoing Business | $ | 19.2 | $ | 0.9 | $ | 39.4 | $ | 21.8 | $ | 81.3 | ||||||||||
Ongoing Business Adjusted Operating Margin % | 8.9 | % | 0.6 | % | 17.1 | % | 11.9 | % | 10.5 | % | ||||||||||
Fiscal 2019 Fourth Quarter Schedule for Ongoing Business | ||||||||||||||||||||
Net Sales Three Months Ended December 28, 2019 | $ | 202.0 | $ | 138.0 | $ | 206.4 | $ | 191.8 | $ | 738.2 | ||||||||||
Net Sales from Businesses Divested/to be Exited | — | — | (0.2 | ) | — | (0.2 | ) | |||||||||||||
Net Sales from Ongoing Business | $ | 202.0 | $ | 138.0 | $ | 206.2 | $ | 191.8 | $ | 738.0 | ||||||||||
GAAP Income (Loss) from Operations Three Months Ended December 28, 2019 | $ | 7.9 | $ | (1.4 | ) | $ | 35.7 | $ | 19.5 | $ | 61.7 | |||||||||
Restructuring and Related Costs | 7.0 | 2.9 | 2.7 | 5.5 | 18.1 | |||||||||||||||
Gain on Sale of Assets | — | — | (3.8 | ) | — | (3.8 | ) | |||||||||||||
Loss on Businesses Divested and Assets to be Exited | 0.1 | — | — | 0.4 | 0.5 | |||||||||||||||
Loss from Operations of Businesses Divested/to be Exited | — | — | 0.6 | — | 0.6 | |||||||||||||||
Executive Transition Costs | 0.1 | 0.1 | 0.1 | 0.1 | 0.4 | |||||||||||||||
Adjusted Income from Operations of Ongoing Business | $ | 15.1 | $ | 1.6 | $ | 35.3 | $ | 25.5 | $ | 77.5 | ||||||||||
Ongoing Business Adjusted Operating Margin % | 7.5 | % | 1.2 | % | 17.1 | % | 13.3 | % | 10.5 | % | ||||||||||
Commercial Systems | Industrial Systems | Climate Solutions | Power Transmission Solutions | Total Regal | ||||||||||||||||
Fiscal 2019 Full Year Schedule for Ongoing Business | ||||||||||||||||||||
Net Sales Twelve Months Ended December 28, 2019 | $ | 905.3 | $ | 575.4 | $ | 968.5 | $ | 788.8 | $ | 3,238.0 | ||||||||||
Net Sales from Businesses Divested/to be Exited | (25.0 | ) | — | (22.2 | ) | (5.6 | ) | (52.8 | ) | |||||||||||
Net Sales from Ongoing Business | $ | 880.3 | $ | 575.4 | $ | 946.3 | $ | 783.2 | $ | 3,185.2 | ||||||||||
GAAP Income (Loss) from Operations Twelve Months Ended December 28, 2019 | $ | 103.1 | $ | (9.3 | ) | $ | 163.9 | $ | 93.4 | $ | 351.1 | |||||||||
Restructuring and Related Costs | 11.8 | 8.4 | 4.2 | 6.9 | 31.3 | |||||||||||||||
Purchase Accounting and Transaction Costs | 0.1 | — | — | — | 0.1 | |||||||||||||||
Gain on Sale of Assets | — | — | (3.8 | ) | — | (3.8 | ) | |||||||||||||
(Gain) Loss on Businesses Divested and Assets to be Exited | (32.6 | ) | 1.0 | (4.7 | ) | 1.6 | (34.7 | ) | ||||||||||||
Income from Operations of Businesses Divested/to be Exited | (3.3 | ) | — | (0.5 | ) | (0.3 | ) | (4.1 | ) | |||||||||||
Executive Transition Costs | 0.6 | 0.5 | 0.6 | 0.5 | 2.2 | |||||||||||||||
Adjusted Income from Operations of Ongoing Business | $ | 79.7 | $ | 0.6 | $ | 159.7 | $ | 102.1 | $ | 342.1 | ||||||||||
Ongoing Business Adjusted Operating Margin % | 9.1 | % | 0.1 | % | 16.9 | % | 13.0 | % | 10.7 | % | ||||||||||
2019 ADJUSTED DILUTED EARNINGS PER SHARE FOR ONGOING BUSINESS | Three Months Ended | Twelve Months Ended Dec 28, 2019 | ||||||||||||||||||
Mar 30, 2019 | Jun 29, 2019 | Sep 28, 2019 | Dec 28, 2019 | |||||||||||||||||
Adjusted Diluted Earnings Per Share | $ | 1.43 | $ | 1.52 | $ | 1.35 | $ | 1.25 | $ | 5.55 | ||||||||||
Earnings Per Share from Businesses Divested/to be Exited | (0.03 | ) | (0.03 | ) | — | — | (0.06 | ) | ||||||||||||
Adjusted Diluted Earnings Per Share for Ongoing Business | $ | 1.40 | $ | 1.49 | $ | 1.35 | $ | 1.25 | $ | 5.49 | ||||||||||