Exhibit 99.1

REDWOOD TRUST REPORTS FOURTH QUARTER 2024 FINANCIAL RESULTS
MILL VALLEY, CA – Redwood Trust, Inc. (NYSE:RWT; "Redwood", the "Company"), a leader in expanding access to housing for homebuyers and renters, today reported its financial results for the quarter ended December 31, 2024.
Key Q4 2024 Financial Results and Metrics
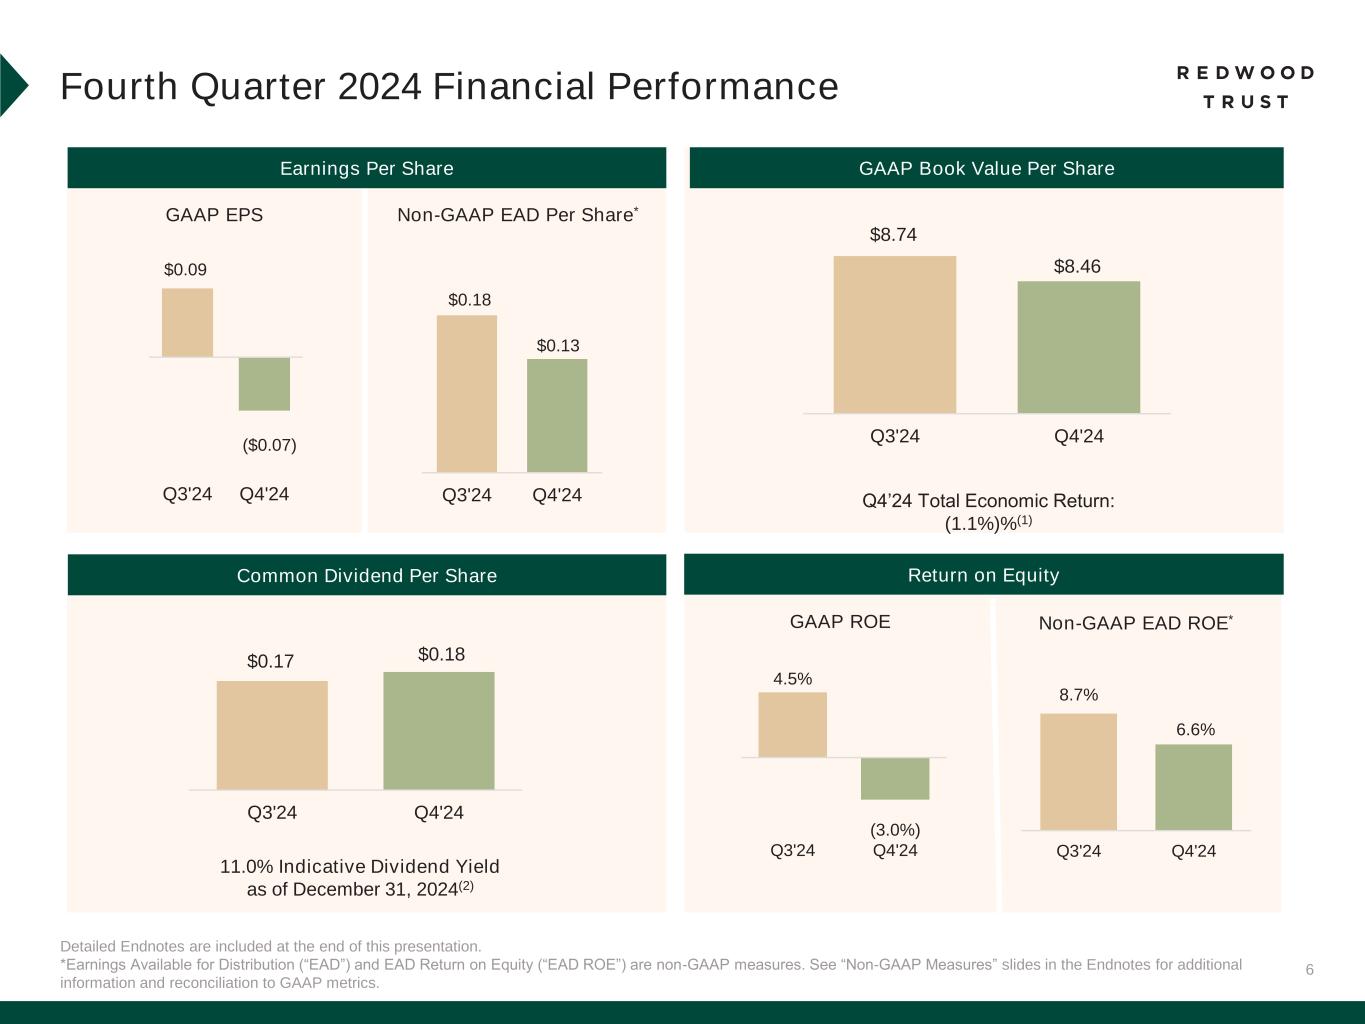
•GAAP book value per common share was $8.46 at December 31, 2024, relative to $8.74 per share at September 30, 2024
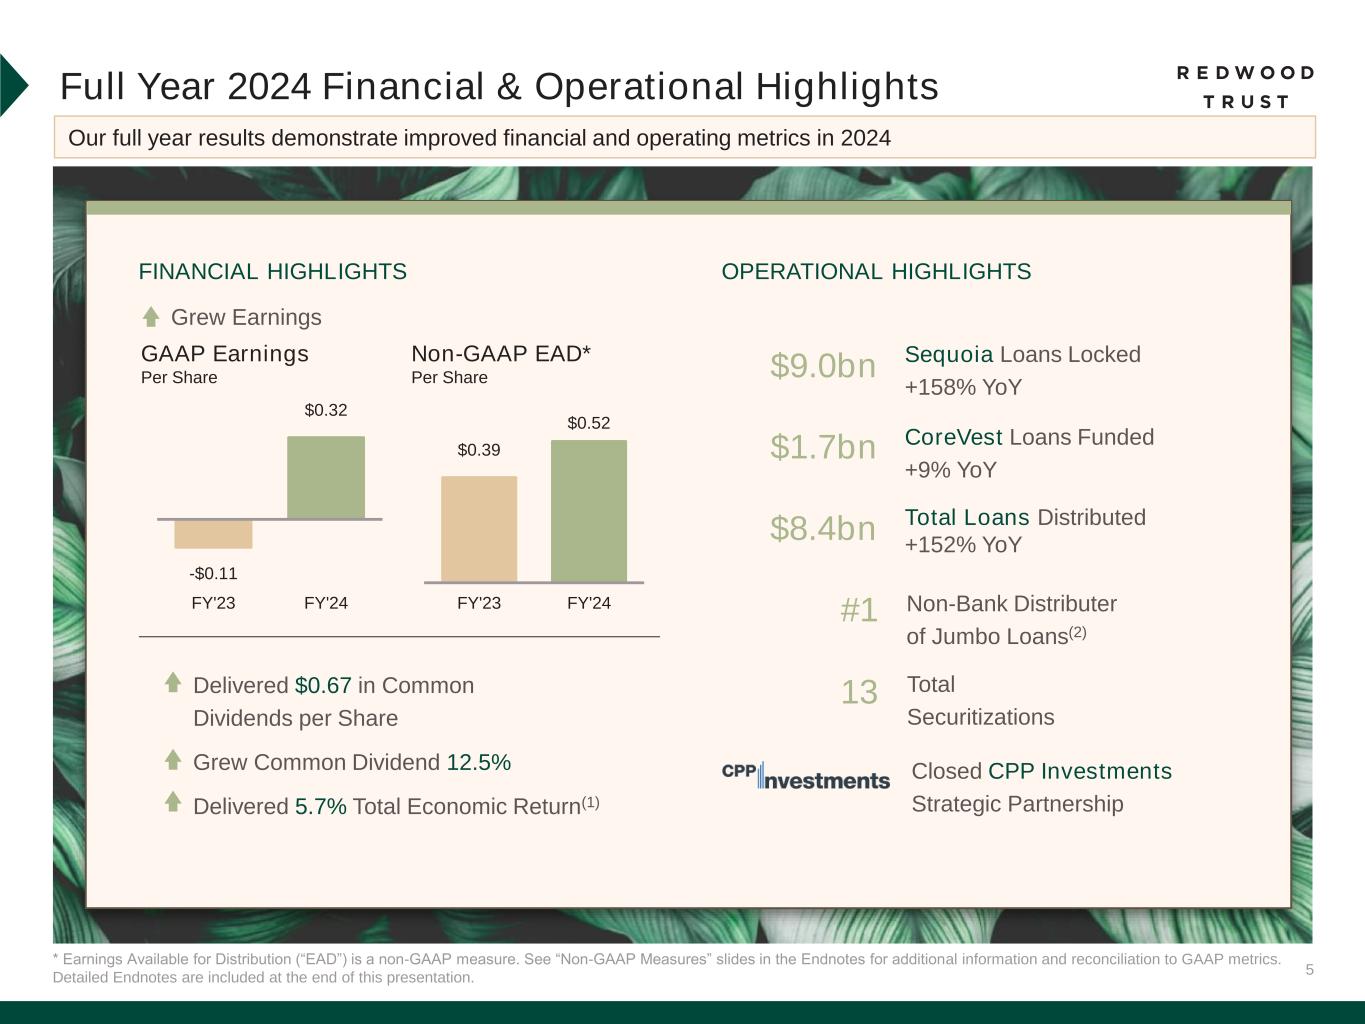
◦Economic return on book value of (1.1)% for the fourth quarter and 5.7% for the full year 2024(1)
•GAAP net loss related to common stockholders of $(8.4) million or $(0.07) per basic and diluted common share
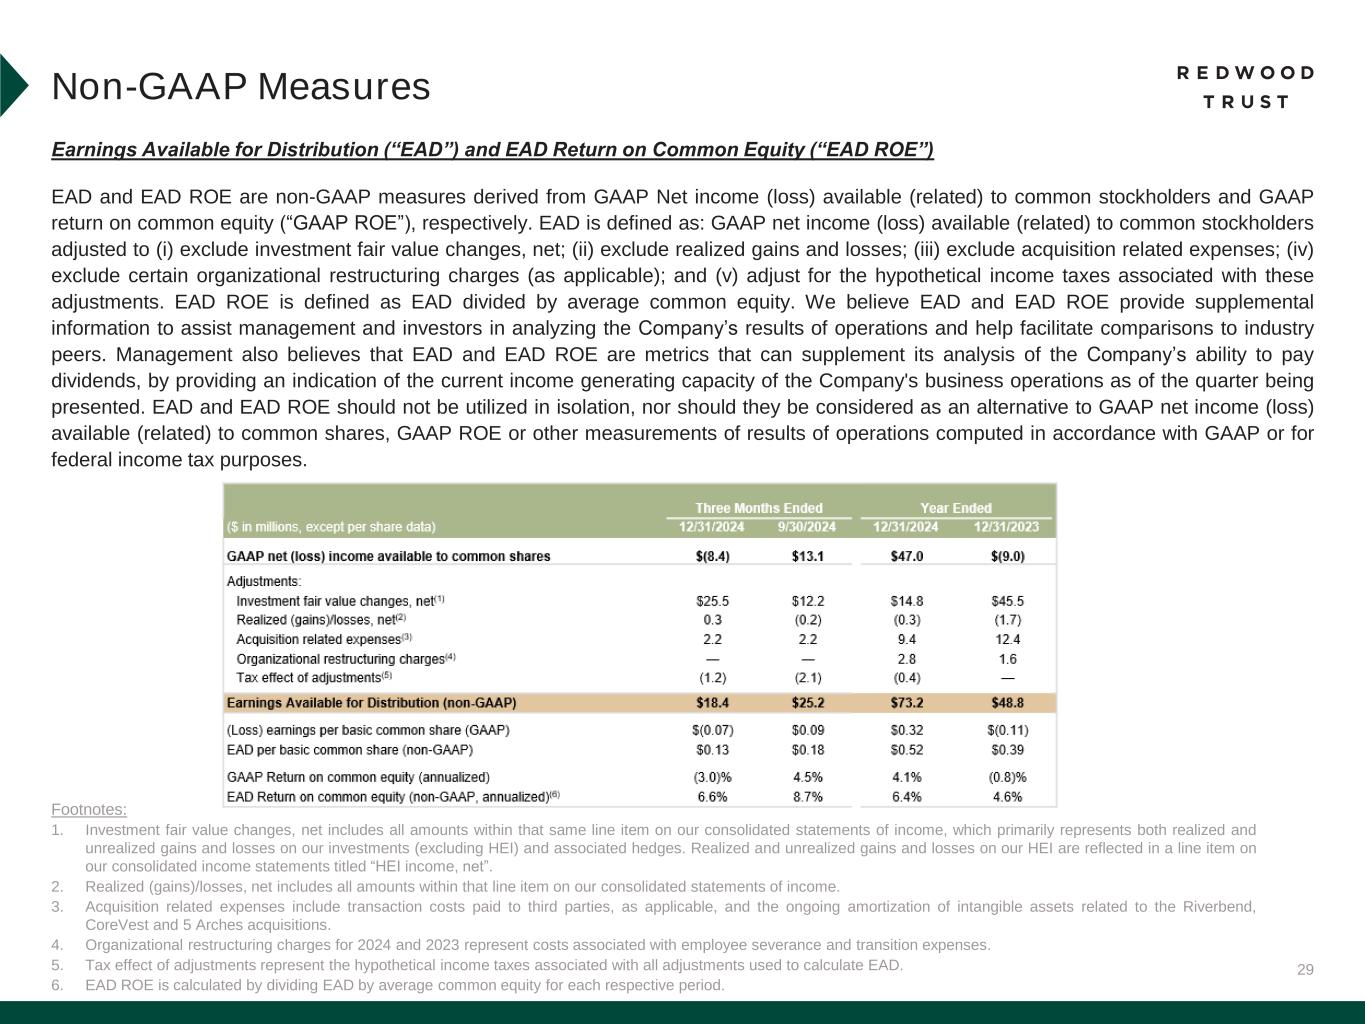
•Non-GAAP Earnings Available for Distribution ("EAD") of $18.4 million or $0.13 per basic common share(2)
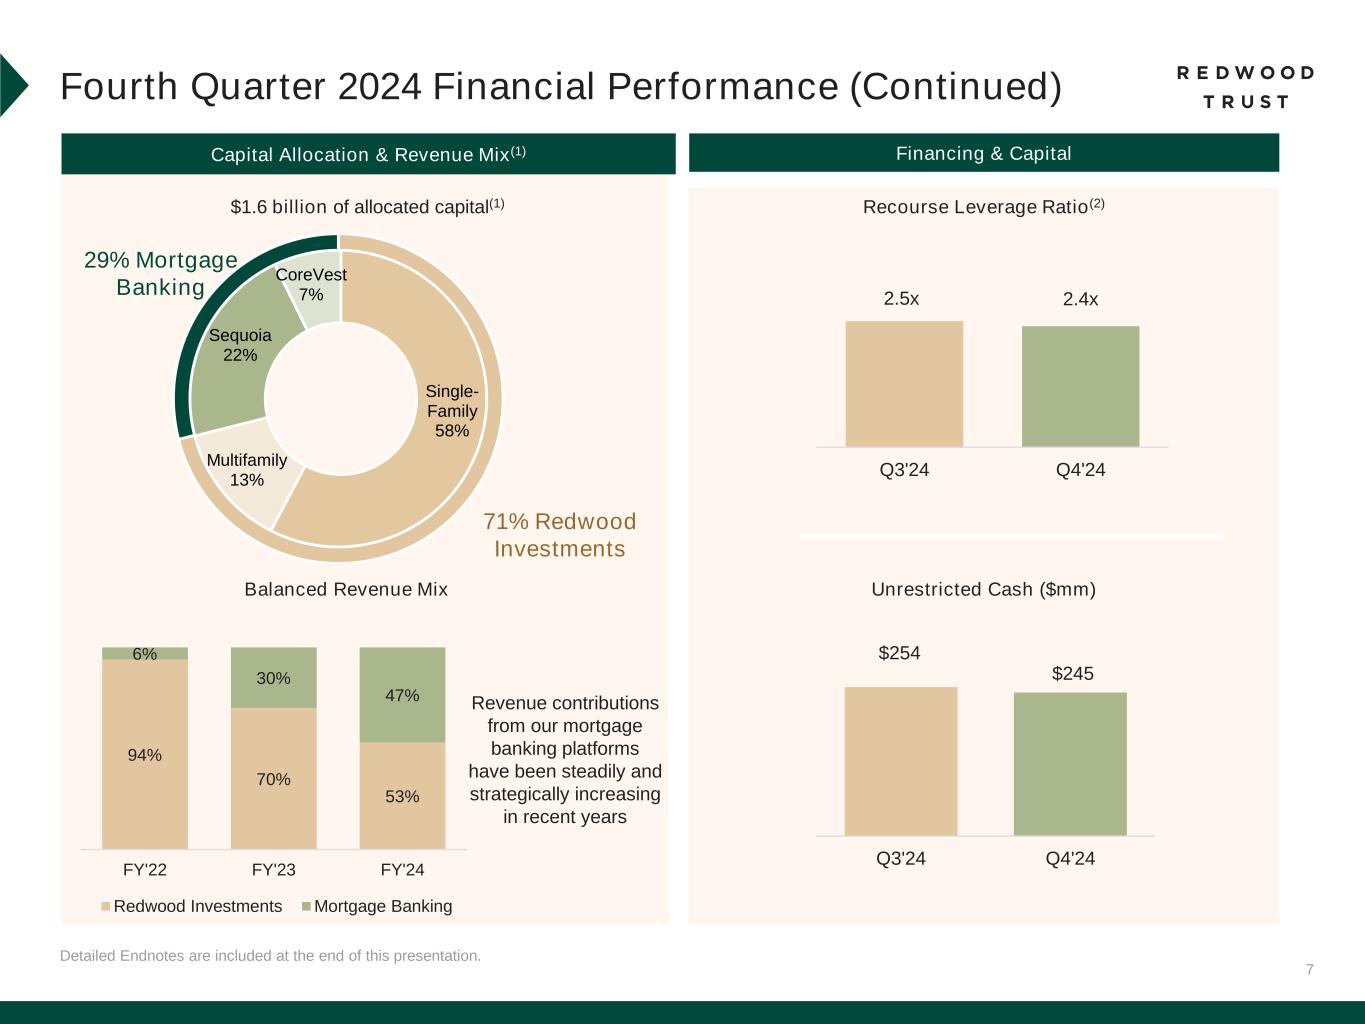
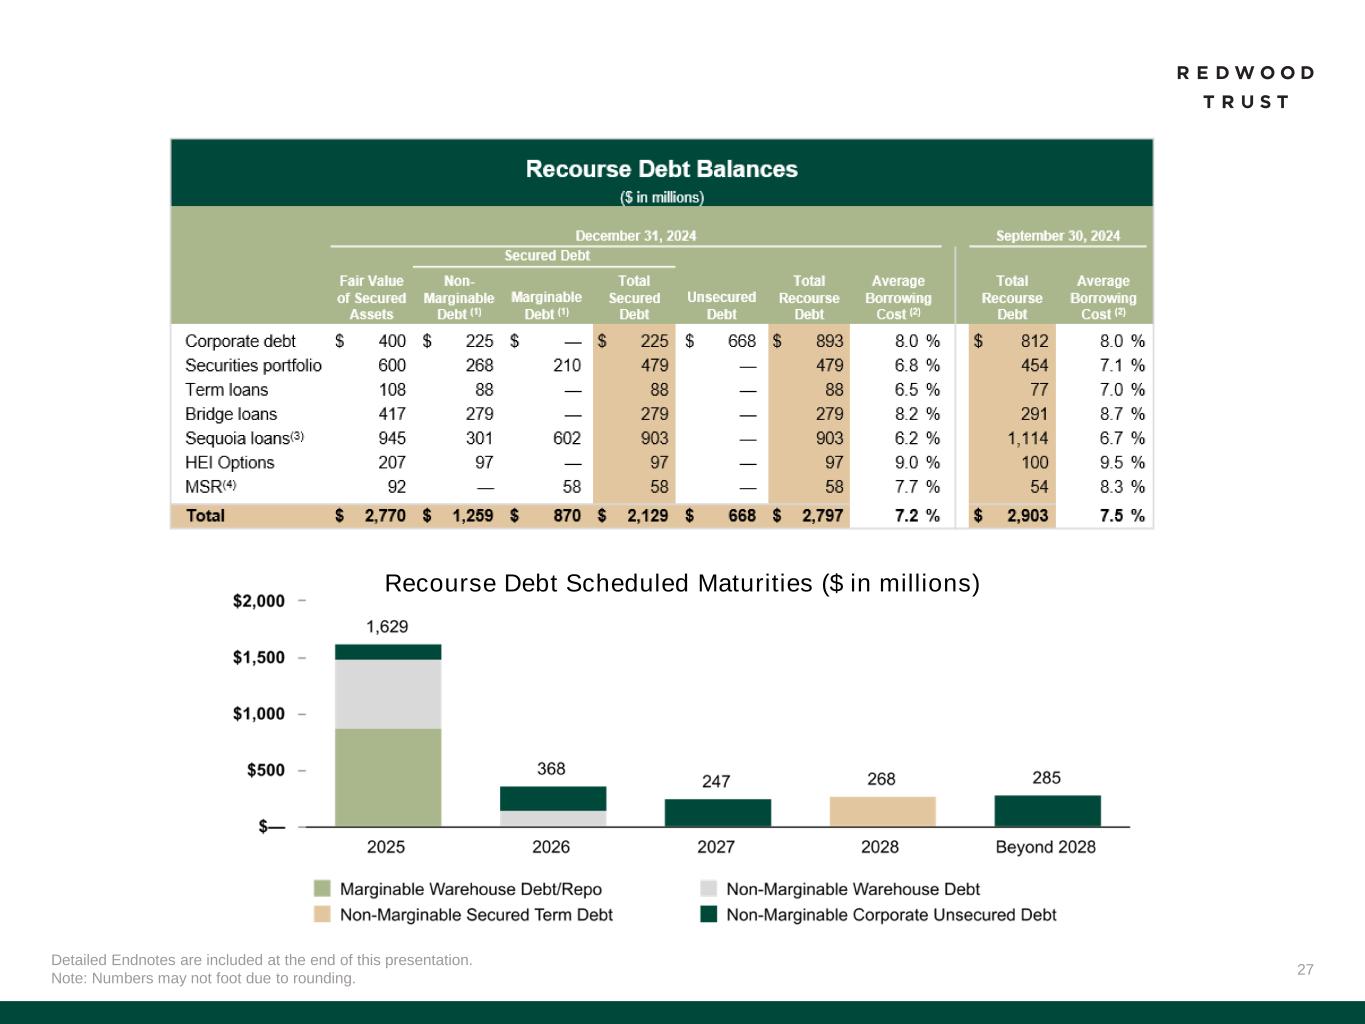
•Recourse leverage ratio of 2.4x at December 31, 2024, relative to 2.5x at September 30, 2024(3)
•Declared and paid a regular quarterly dividend of $0.18 per common share, a 5.9% increase from the third quarter 2024
Q4 2024 Operational Business Highlights
Sequoia (formerly Residential Consumer) Mortgage Banking
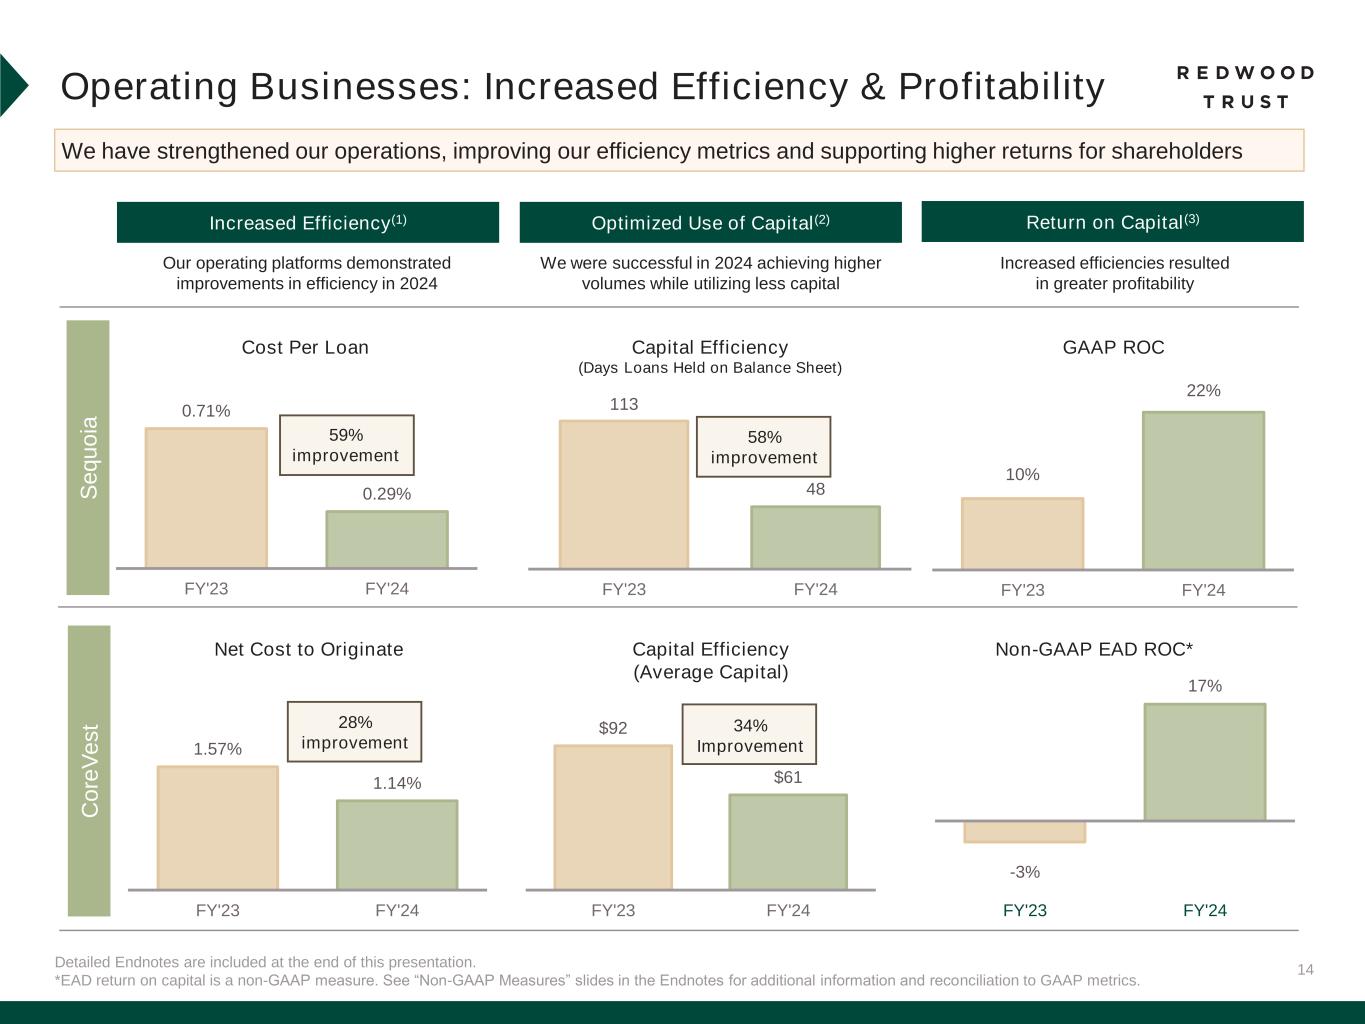
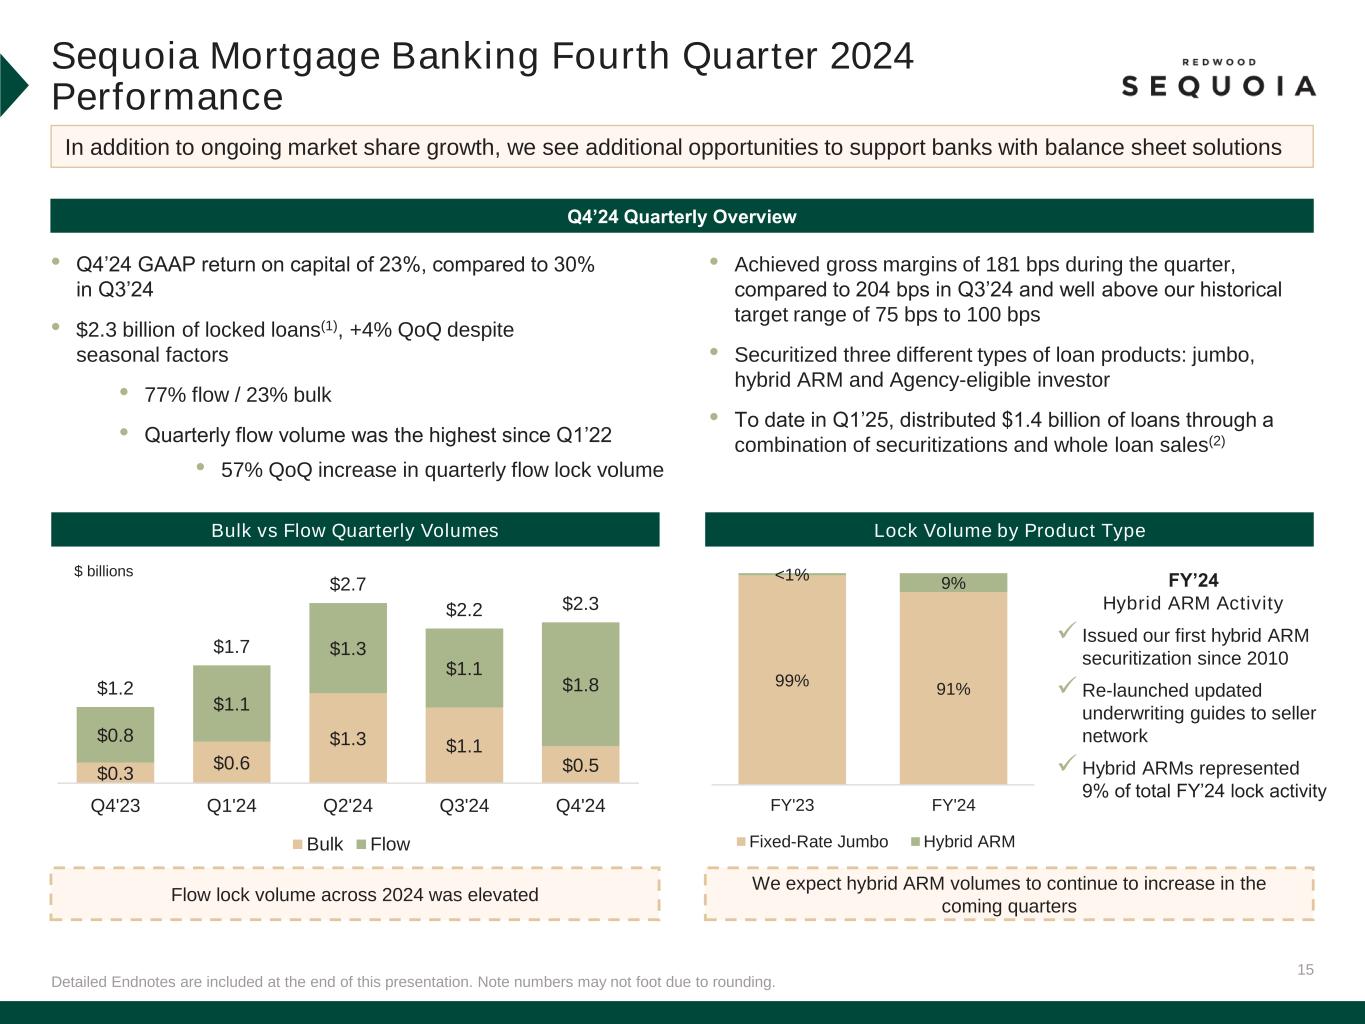
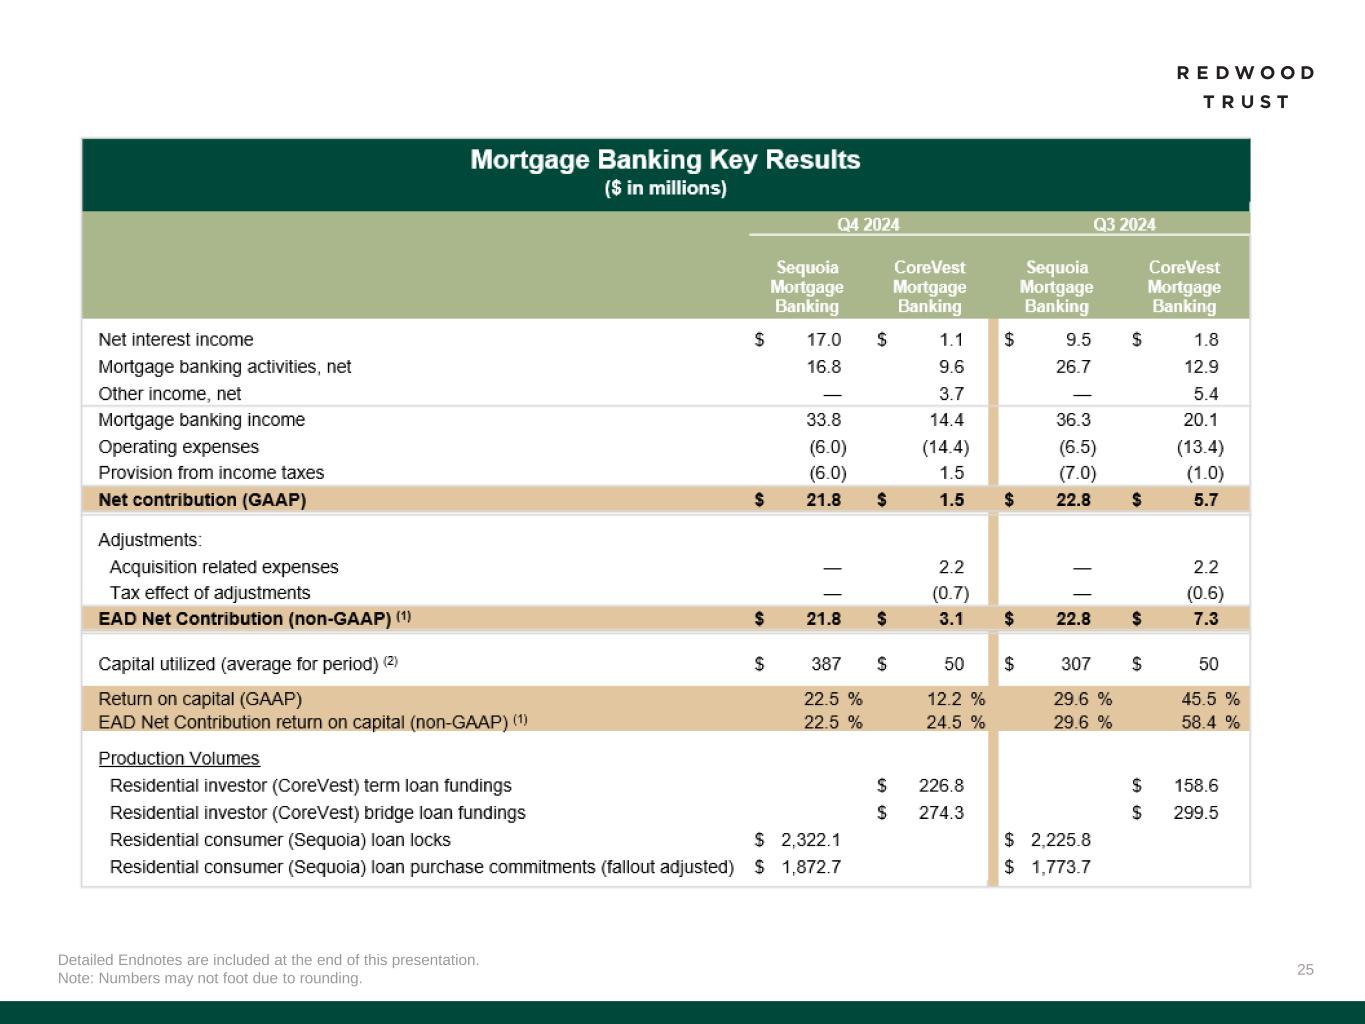
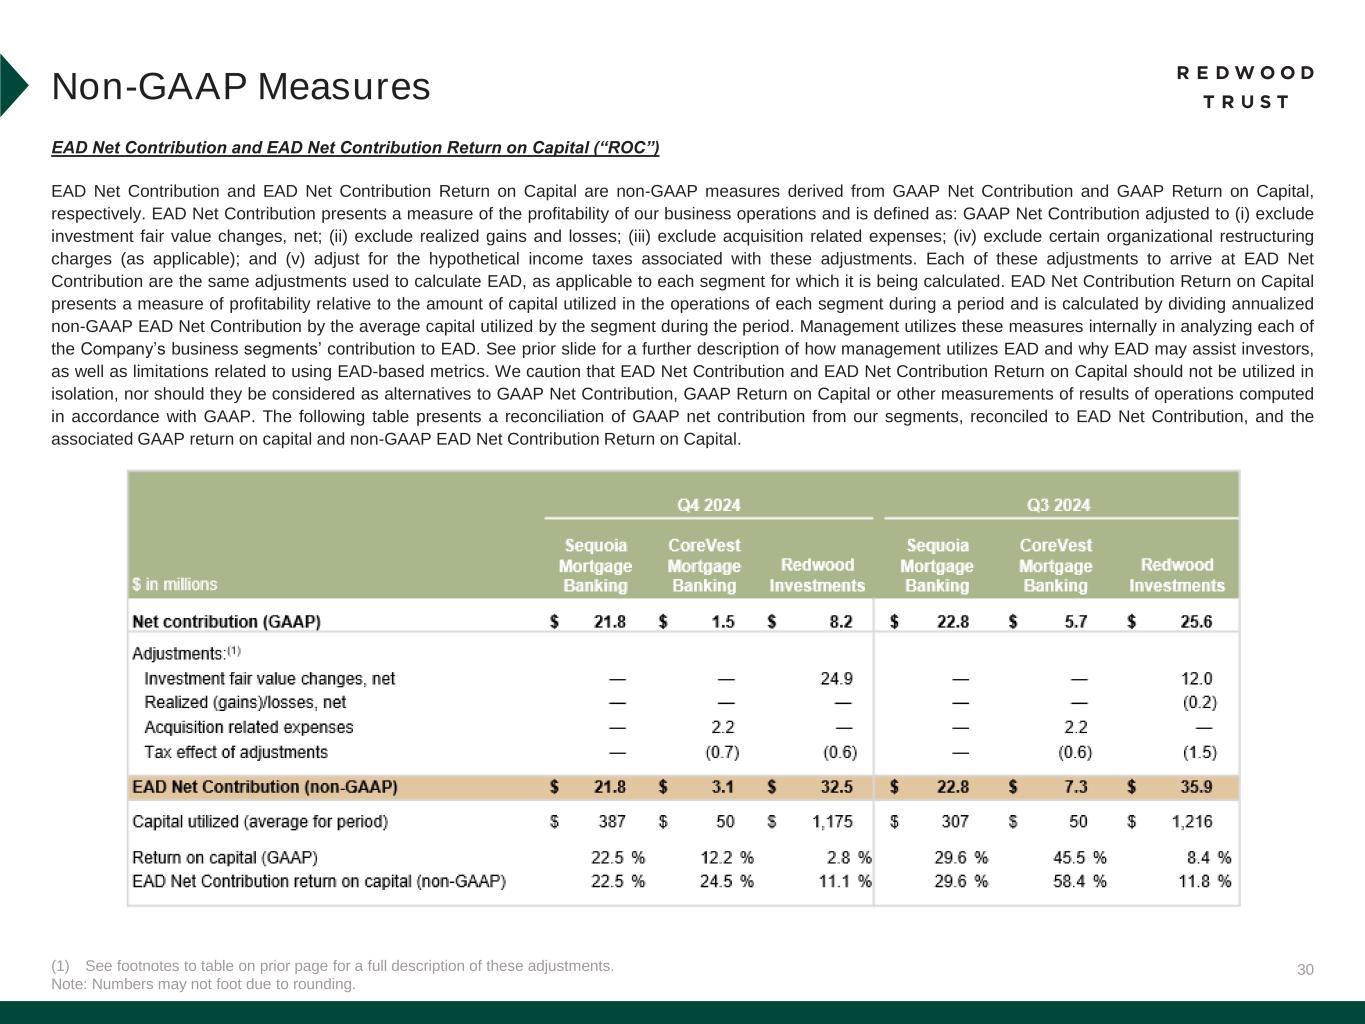
•Generated 23% annualized GAAP Return on Capital ("ROC")
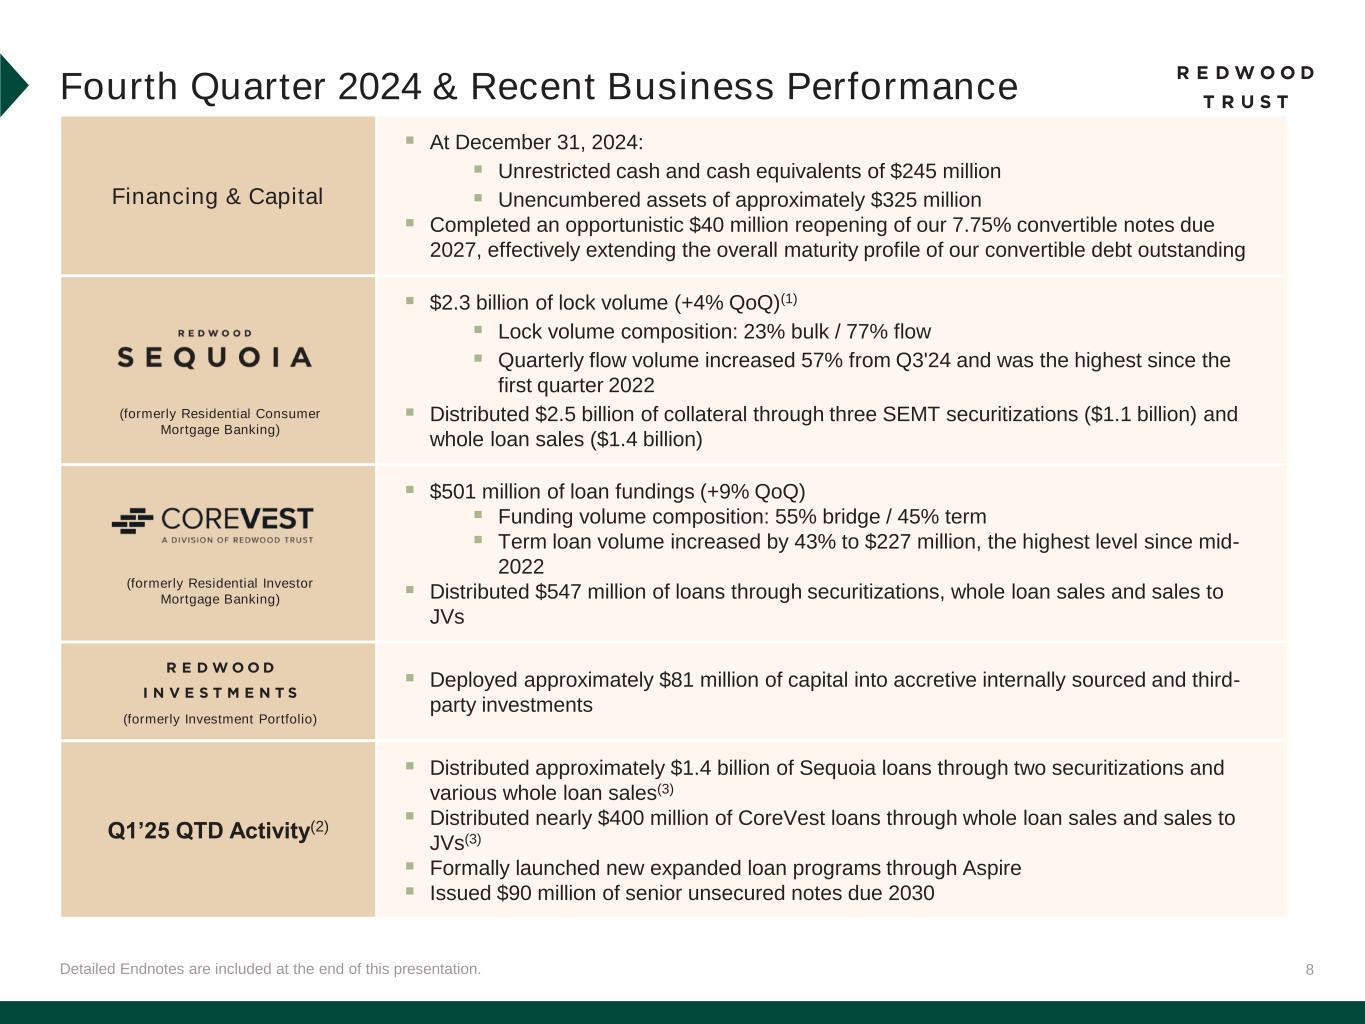
•Locked $2.3 billion of loans(4), a 4% increase from $2.2 billion in the third quarter of 2024
◦Achieved gross margins well in excess of our historical target range of 75bps to 100bps, driven by spread tightening on securitization execution during the quarter
◦Lock volume split 23% / 77% between bulk and flow
◦Quarterly flow volume increased 57% from Q3'24 and was the highest since the first quarter 2022
•Distributed $2.5 billion of loans through a combination of securitizations ($1.1 billion) and whole loan sales ($1.4 billion)
◦Securitization activity consisted of a variety of loan products, including fixed-rate jumbo loans, hybrid adjustable-rate mortgages ("ARMs") and Agency-eligible investor loans
CoreVest (formerly Residential Investor) Mortgage Banking
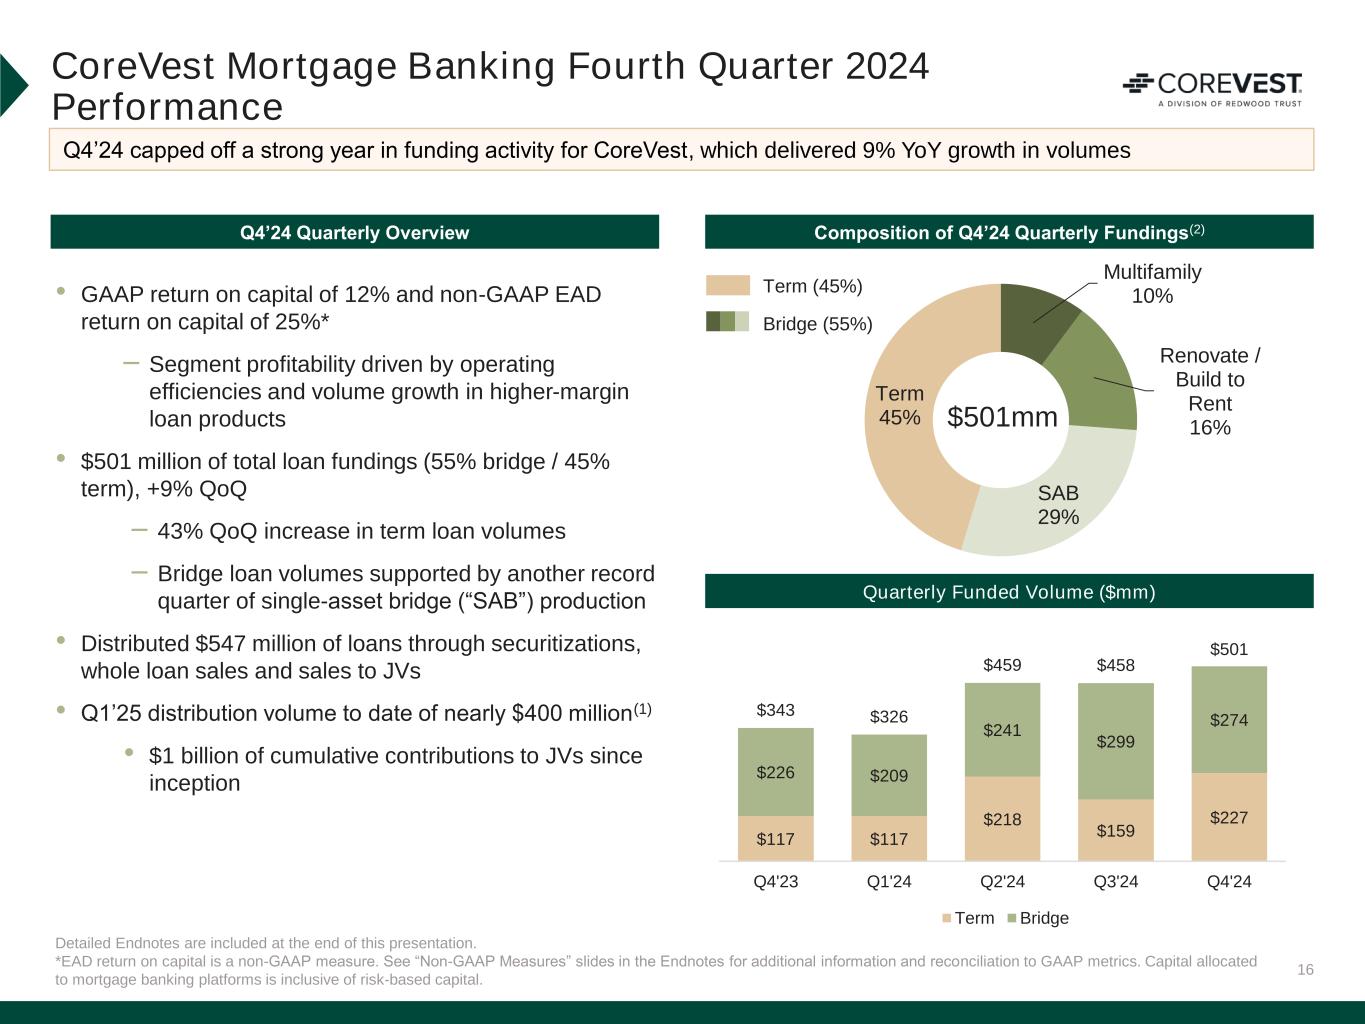
•Generated 12% and 25% annualized GAAP ROC and non-GAAP EAD ROC(2)
•Funded $501 million of loans (55% bridge and 45% term), a 9% increase from $458 million in the third quarter of 2024
◦Term loan volume increased by 43% to $227 million, the highest level since mid-2022
◦Bridge loan production saw continued record quarterly volumes from single-asset bridge ("SAB") product, which represented over 50% of total quarterly bridge loan fundings
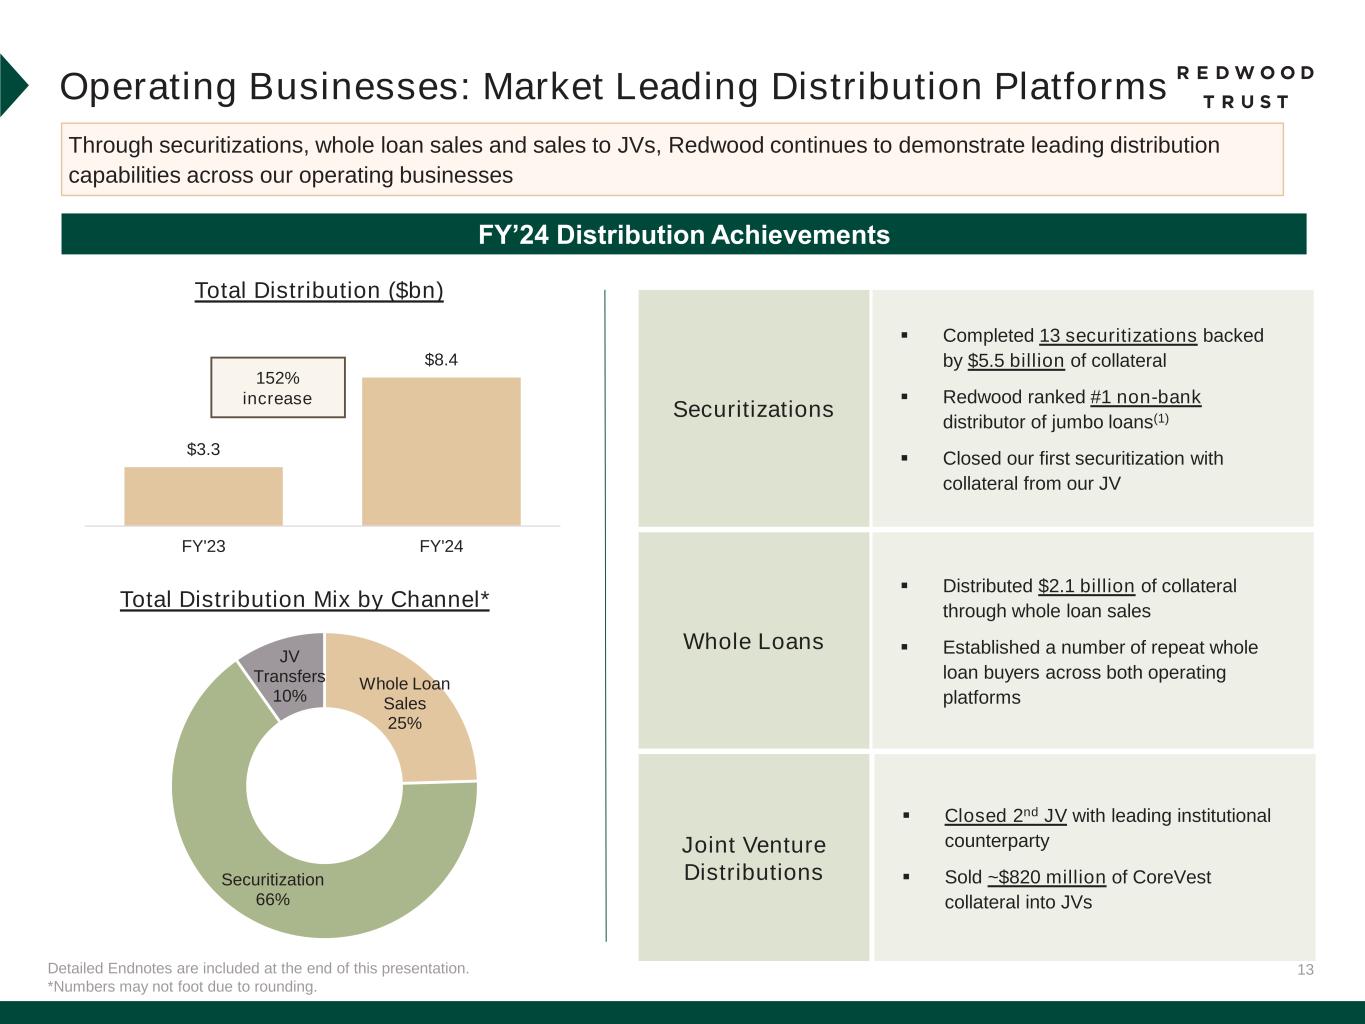
•Continued to deepen distribution channels, selling $547 million of loans through securitizations, whole loan sales and sales to joint ventures ("JVs")
◦Closed our inaugural securitization of loans out of our JV (backed by $299 million of bridge loans)
1
Redwood Investments (formerly Investment Portfolio)
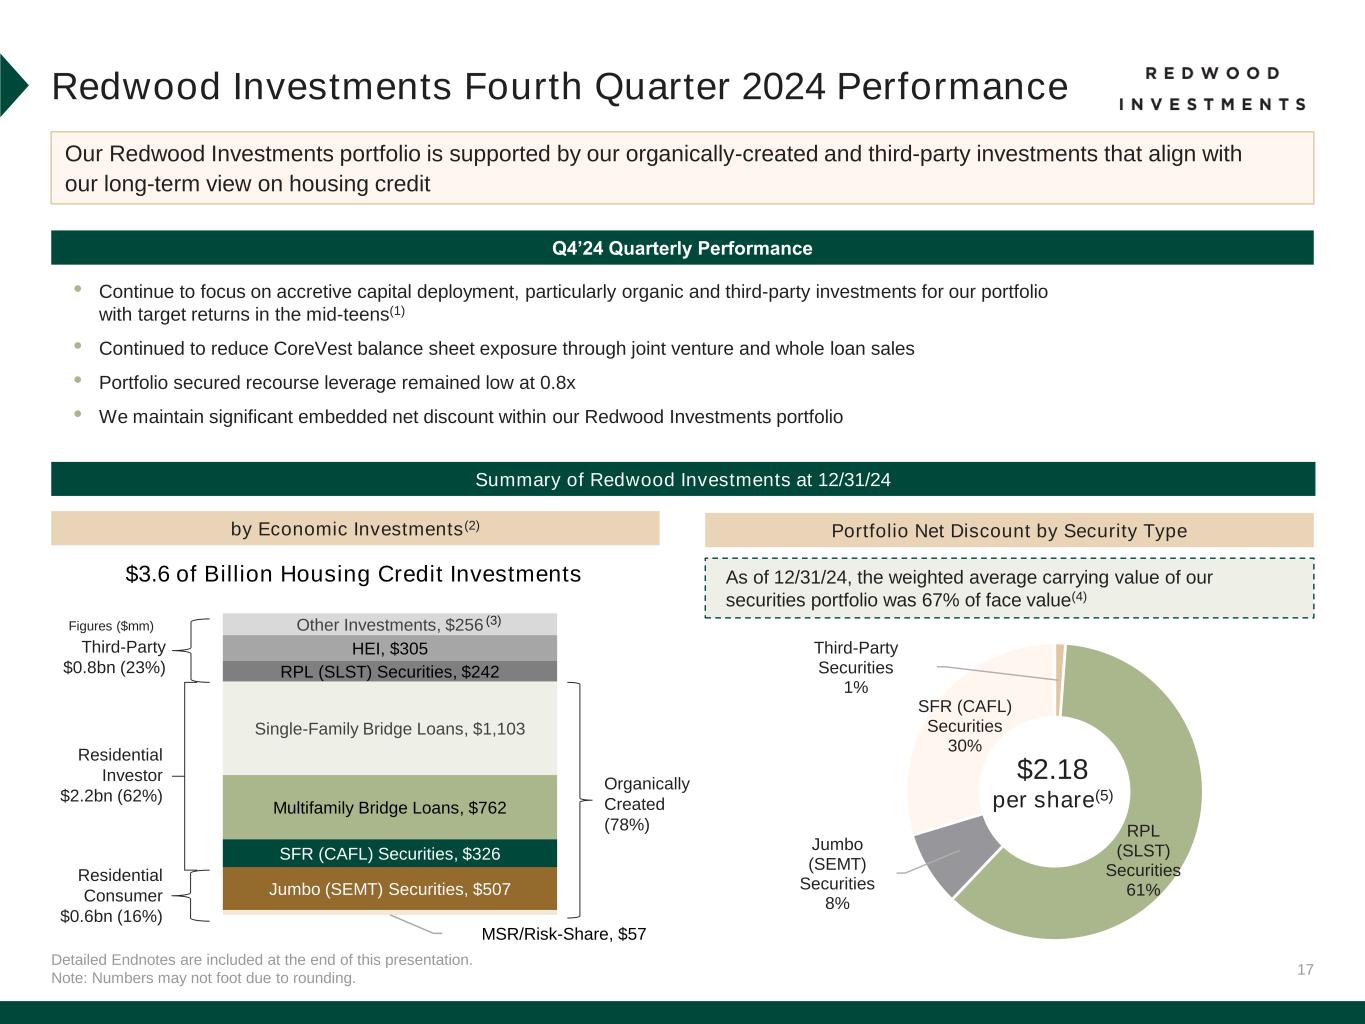
•Accretively deployed approximately $81 million of capital into internally sourced and third-party investments; deployed $525 million of Redwood Investments capital in 2024
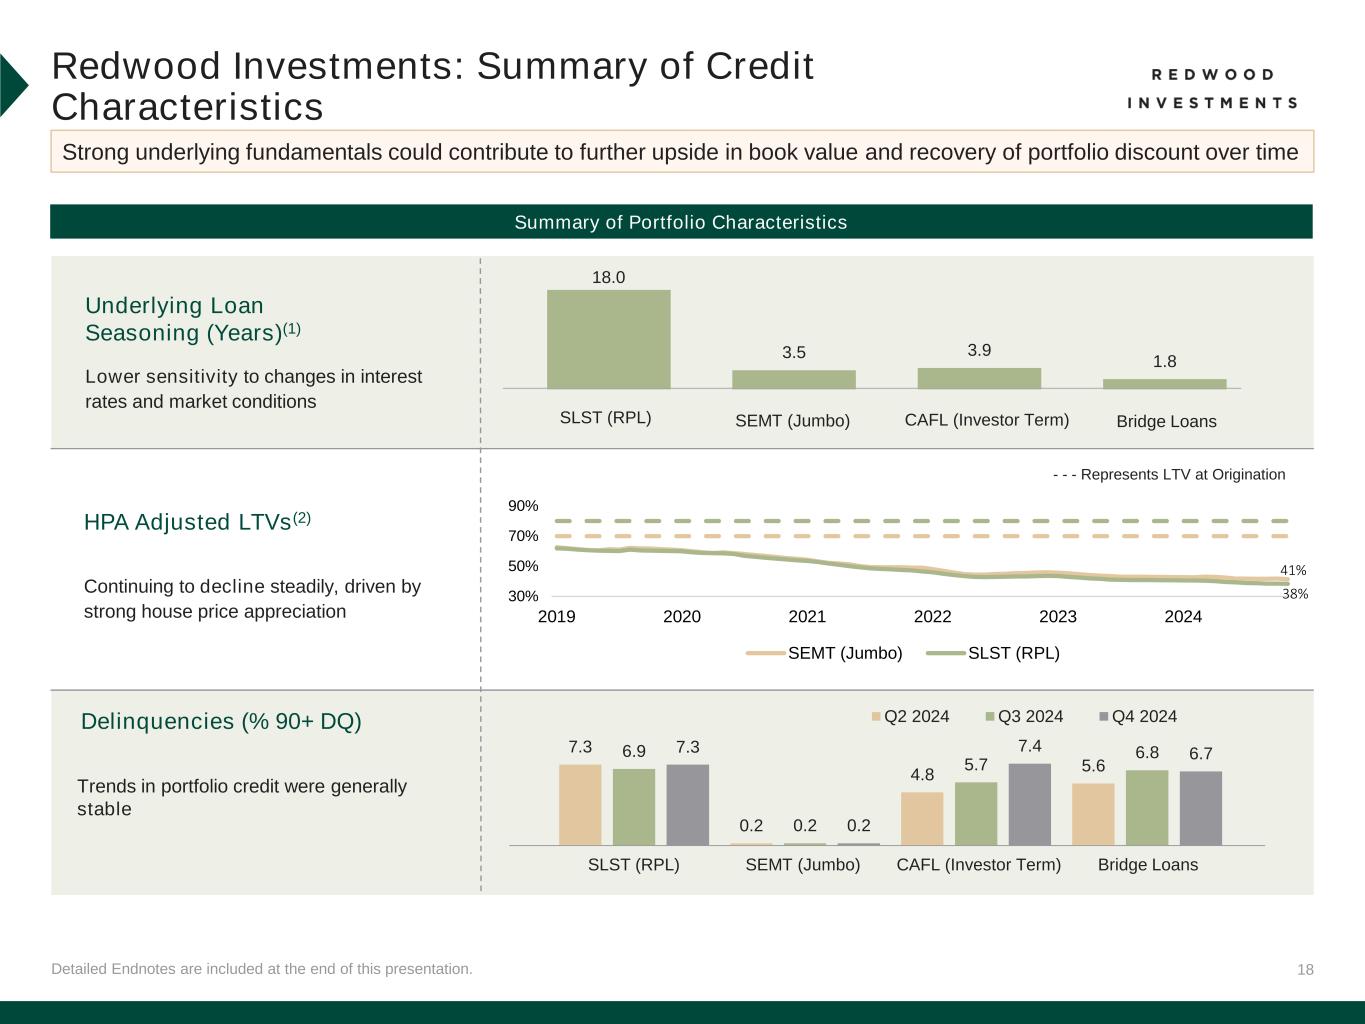
•Trends in portfolio credit were generally stable
◦Re-performing loan ("RPL") and jumbo securities saw steady trends in 90 day+ delinquency rates
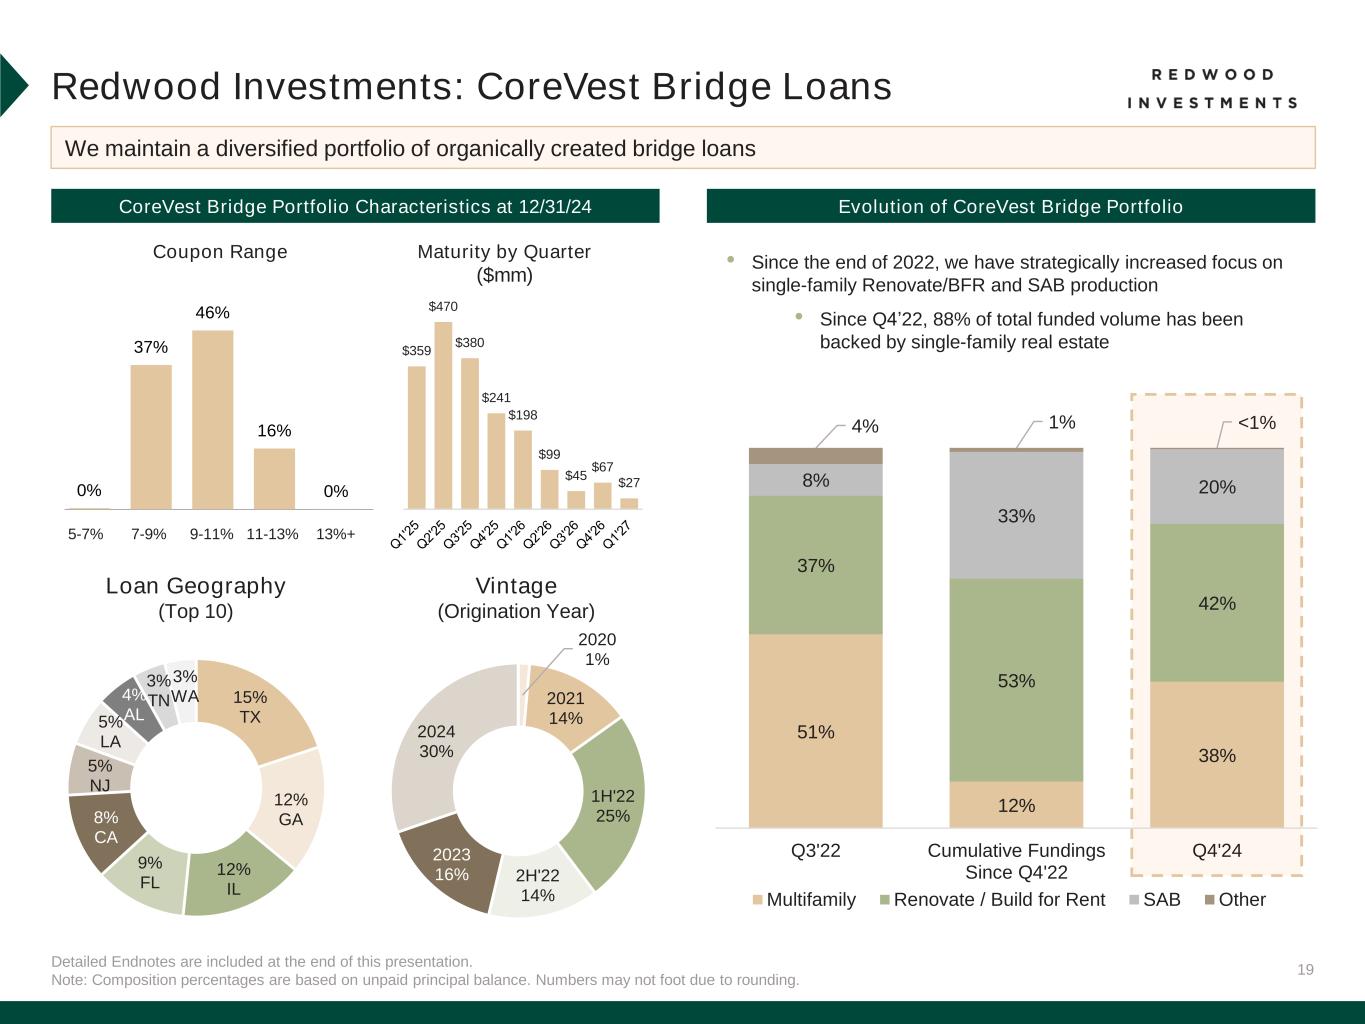
◦The CoreVest portfolio saw a modest increase in delinquencies for the securitized term portfolio, largely on a smaller pool balance, which was partially offset by successful bridge loan resolutions
•Payoffs in the CoreVest portfolio increased 20% in the fourth quarter to $418 million, including $320 million of bridge loans
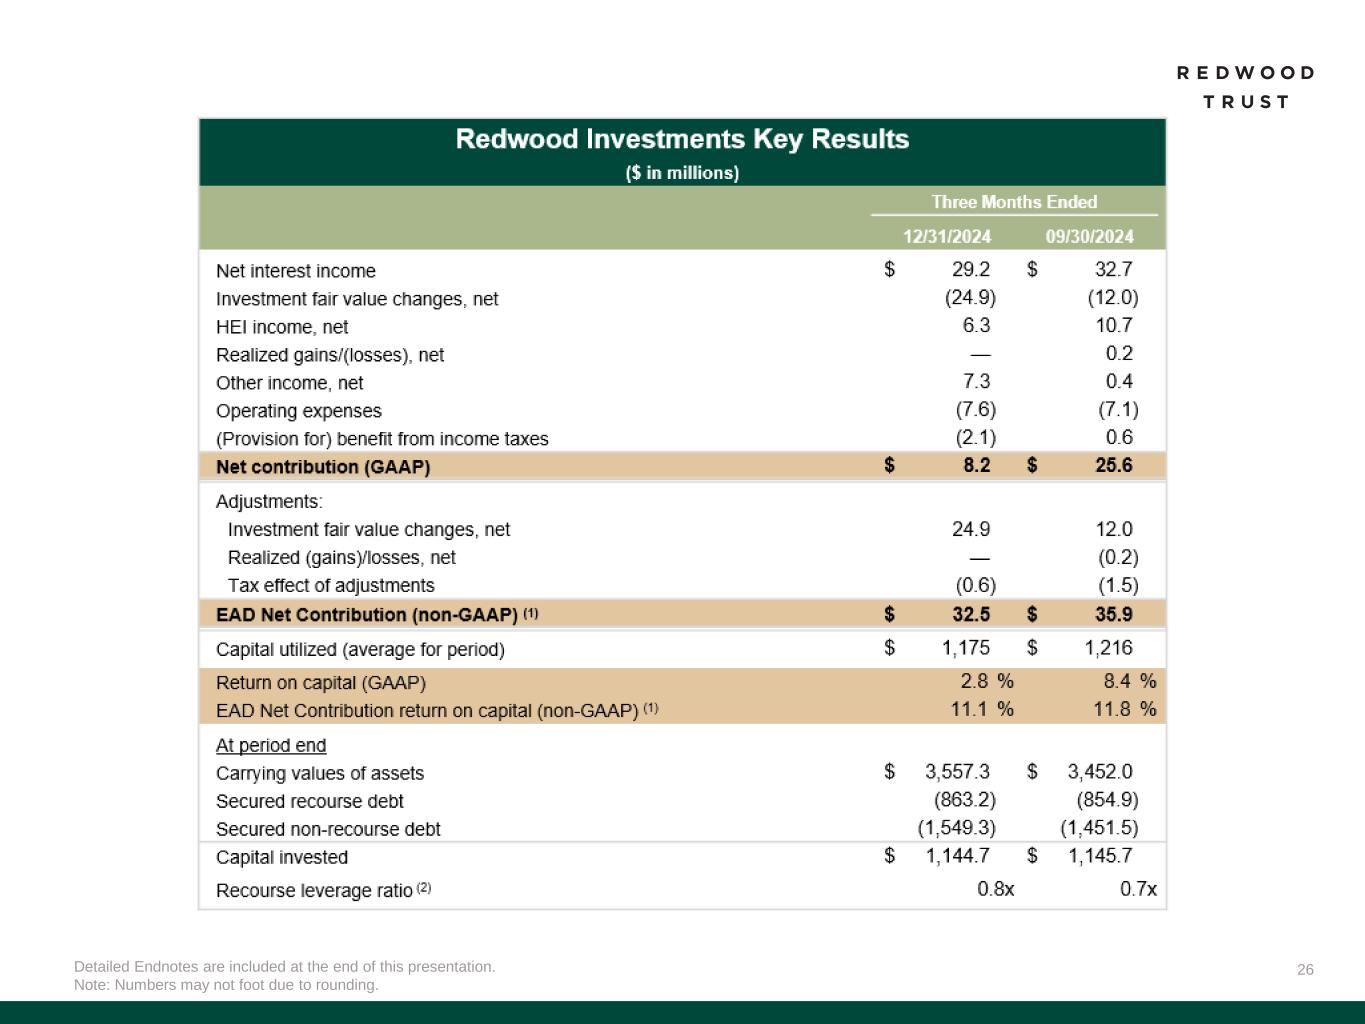
•Redwood Investments recourse leverage ratio remained low at 0.8x at December 31, 2024
Financing / Corporate Highlights
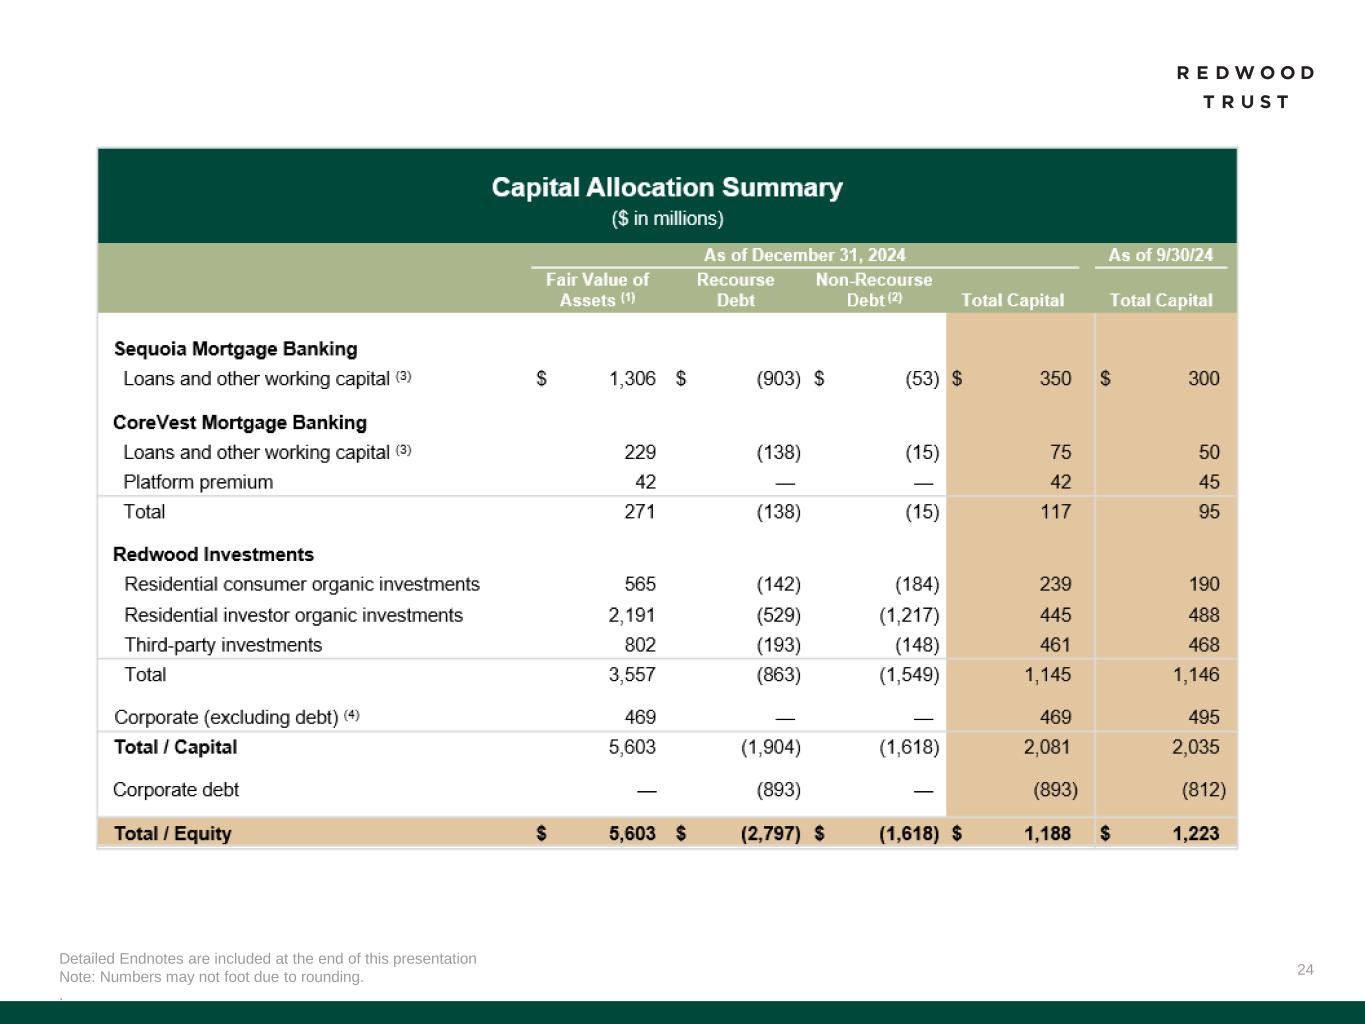
•Unrestricted cash and cash equivalents of $245 million and unencumbered assets of approximately $325 million at December 31, 2024
•Total excess warehouse financing capacity of $4.7 billion at December 31, 2024
•Completed an opportunistic $40 million reopening of our 7.75% convertible notes due 2027; primary use of proceeds to repurchase convertible notes due 2025, effectively extending the overall maturity profile of our convertible debt outstanding
•We renewed or established four financing facilities representing $1.0 billion of total financing capacity
Q1 2025 Highlights to Date(5)
•Distributed approximately $1.4 billion of Sequoia loans through two securitizations and various whole loan sales(6)
•Distributed approximately $400 million of CoreVest loans through whole loan sales and sales to JVs(6)
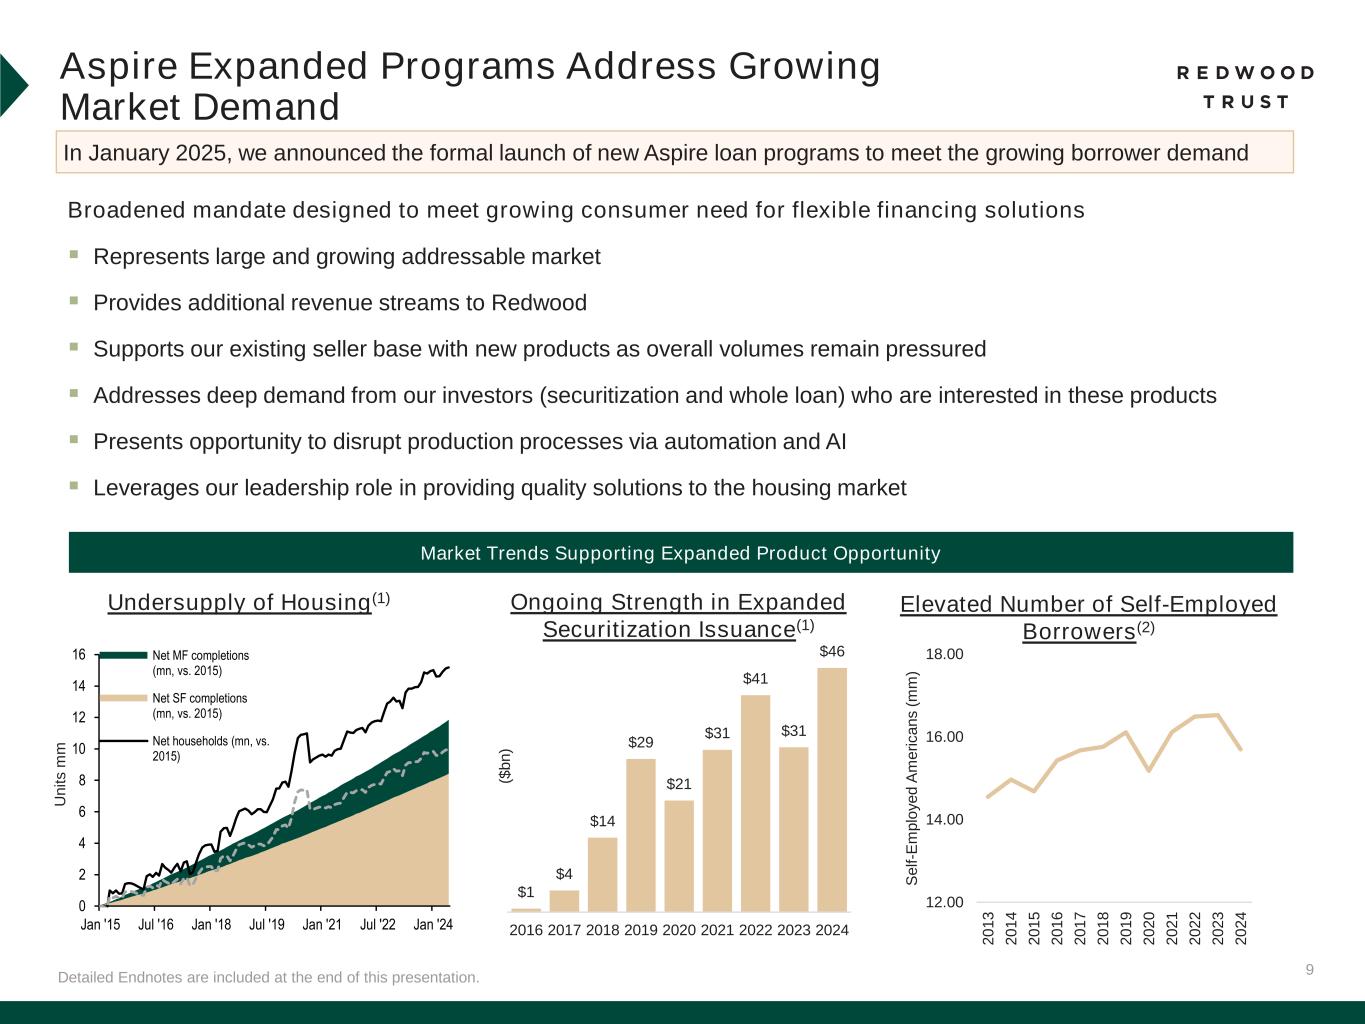
•Formally launched new expanded loan programs through Aspire
•Issued $90 million of senior unsecured notes due 2030
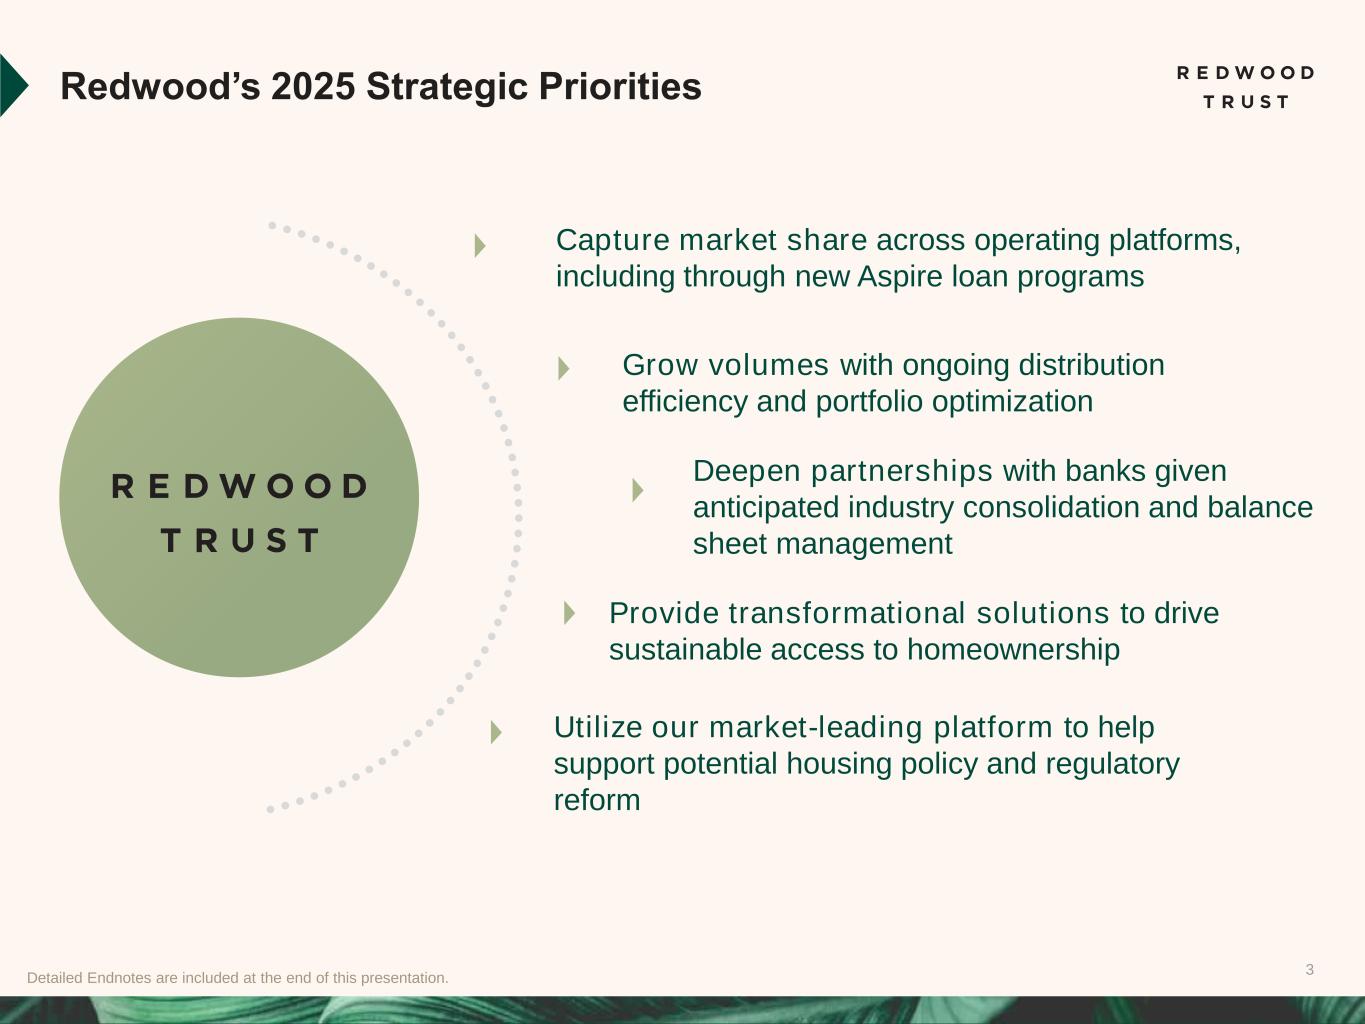
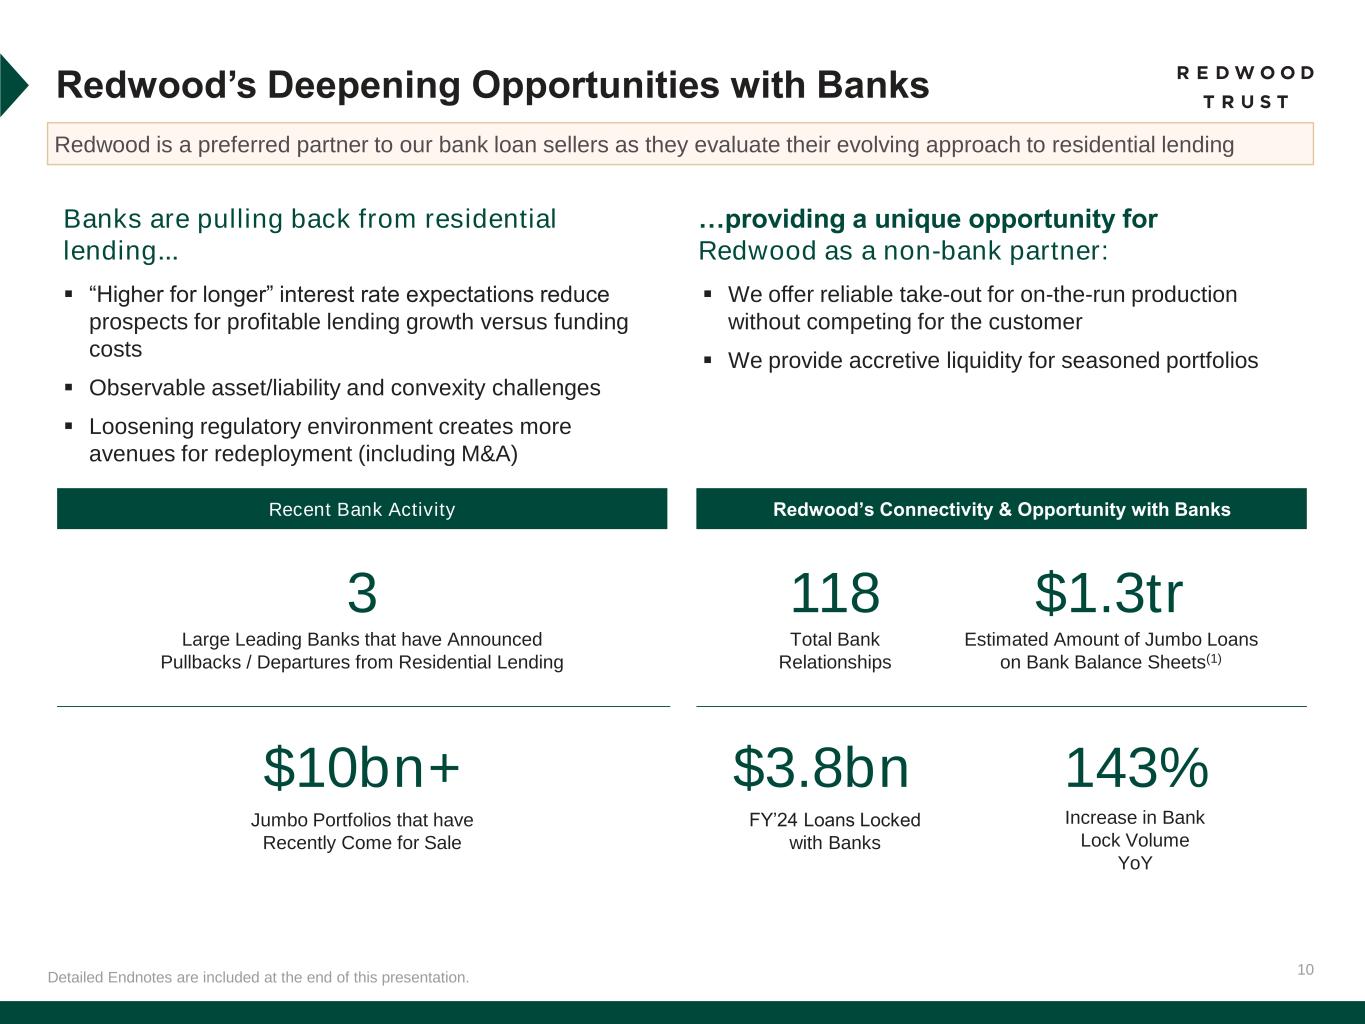
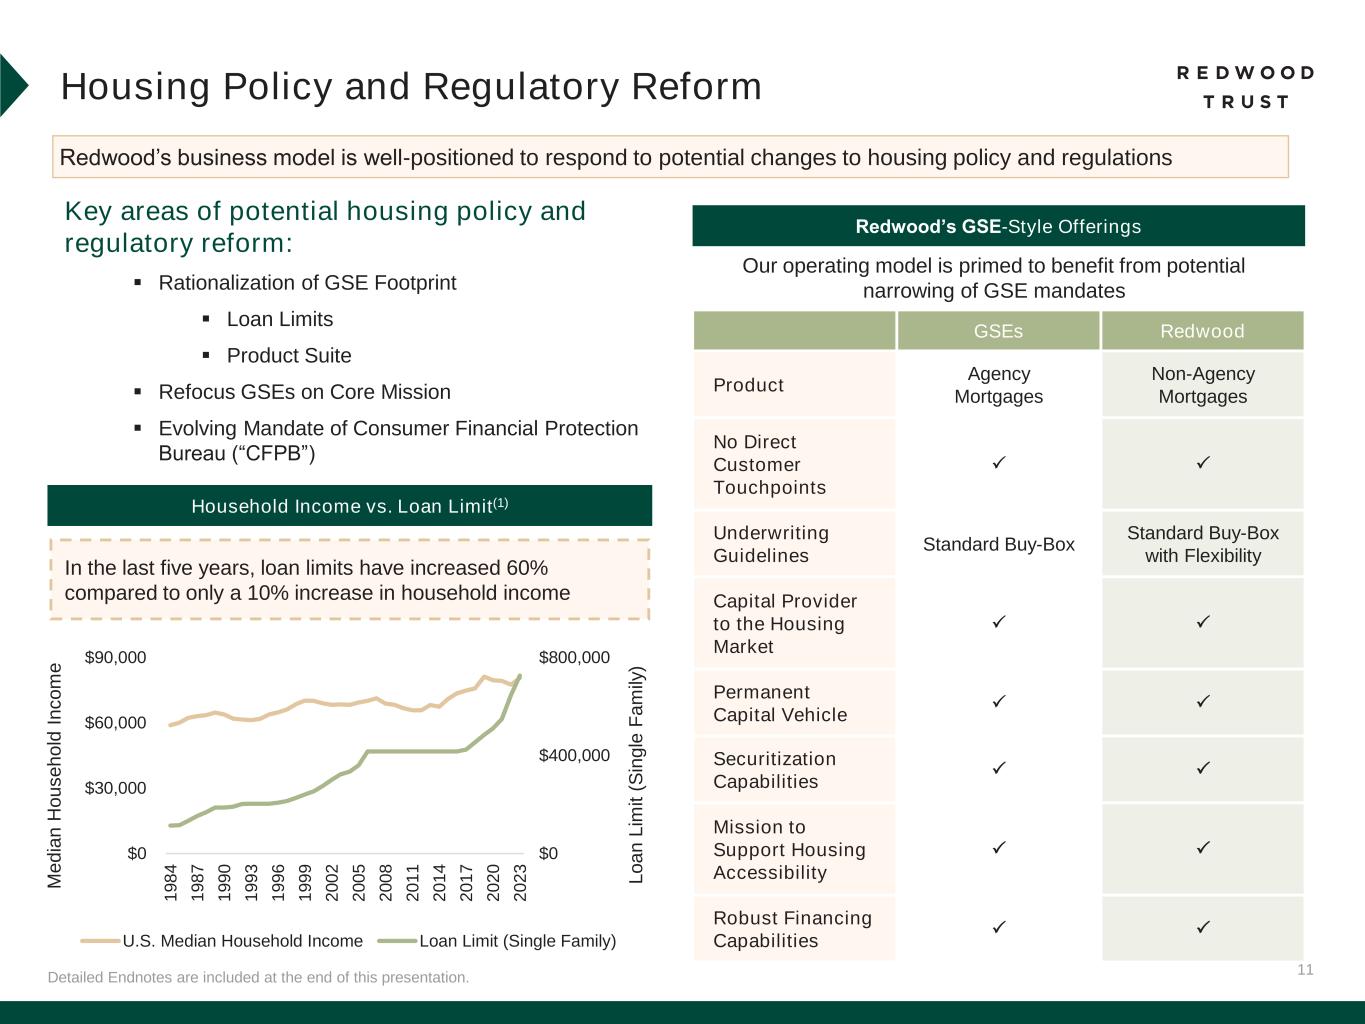
"We are proud of the significant progress we made in 2024 in growing our operating businesses, establishing key capital partnerships, raising our dividend, and achieving solid profitability amidst a challenging market," said Christopher Abate, Chief Executive Officer of Redwood Trust. "Looking ahead to 2025, we expect further progress towards our core operating goals, with the added potential for housing policy and regulatory changes to transform our opportunity set. Our focus on strategic bank relationships and innovative new loan products positions Redwood to continuing growing market share and enhance earnings power. We remain committed to providing critical liquidity to the housing finance market and supporting our partners and shareholders in this evolving landscape."
2
_____________________
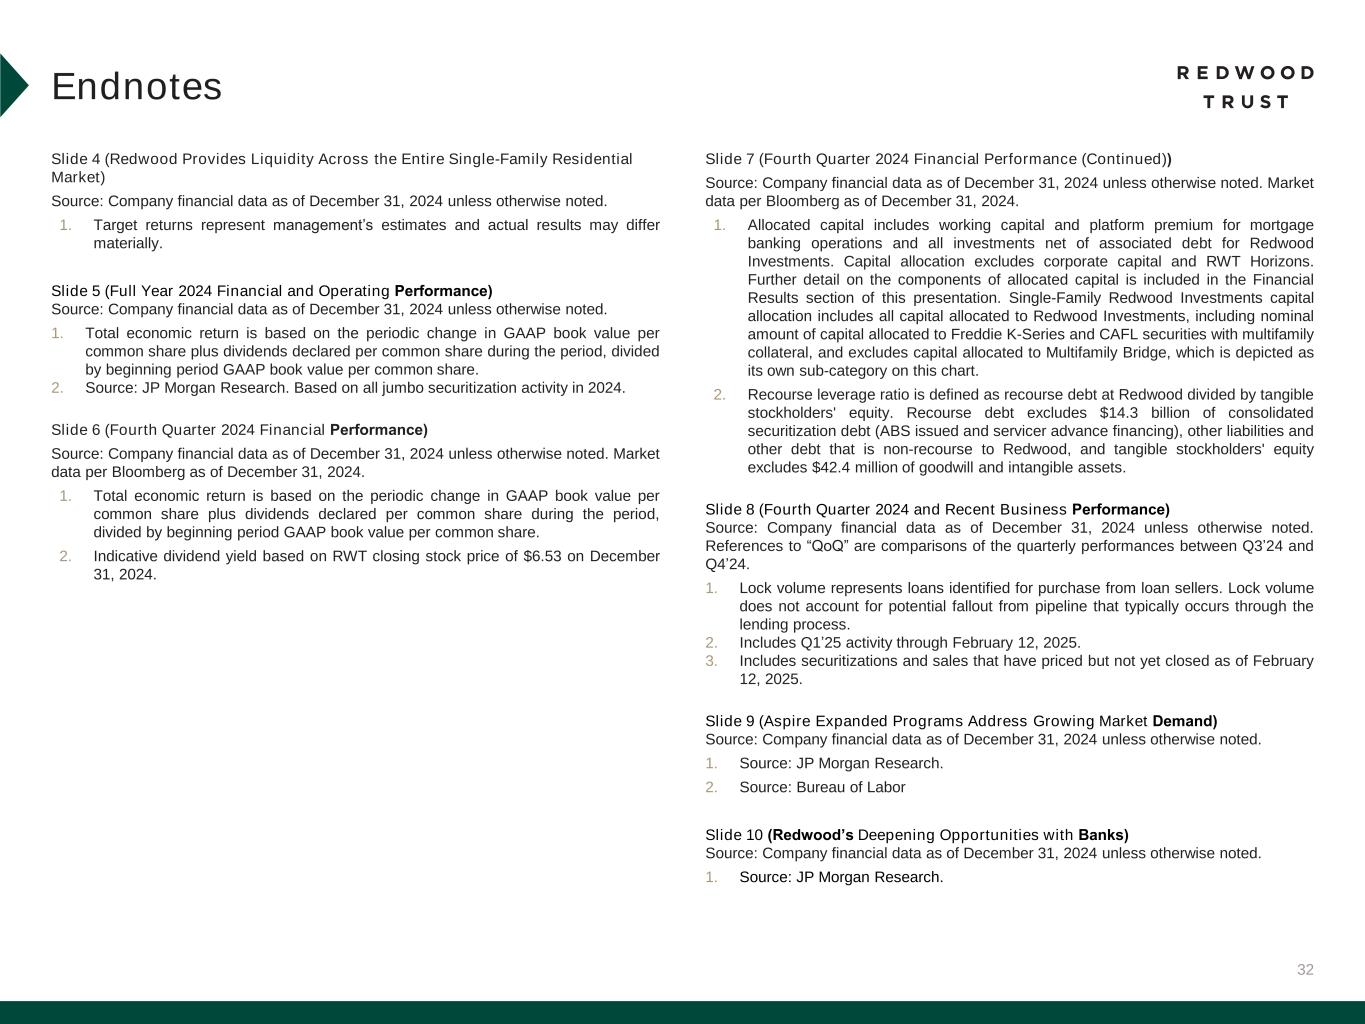
1.Economic return on book value is based on the period change in GAAP book value per common share plus dividends declared per common share in the period.
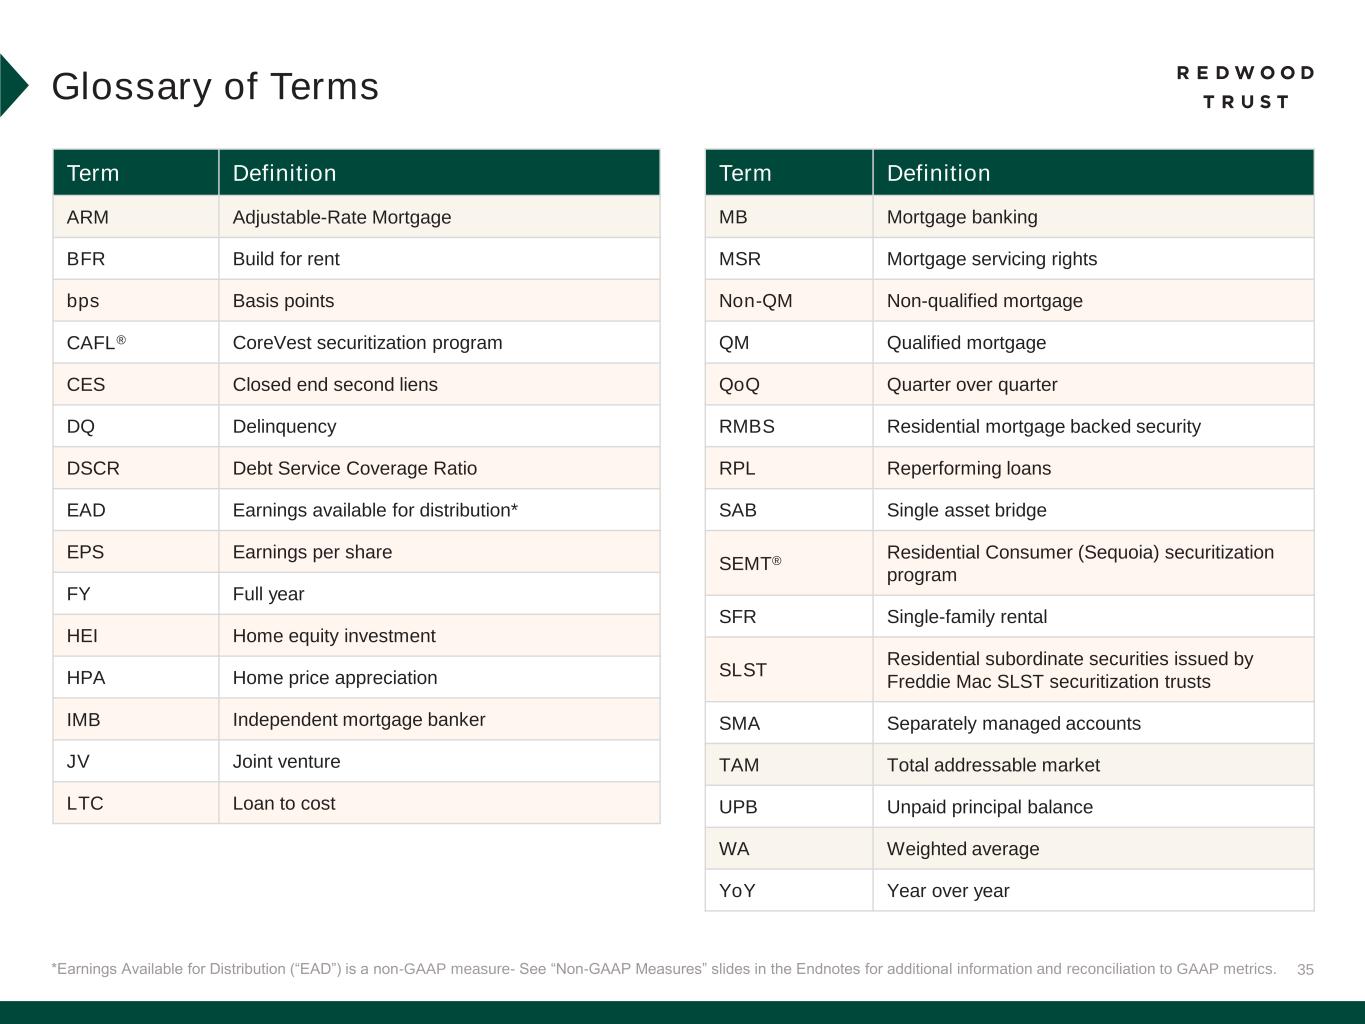
2.Earnings available for distribution and EAD ROC are non-GAAP measures. See Non-GAAP Disclosures section that follows for additional information on this measure.
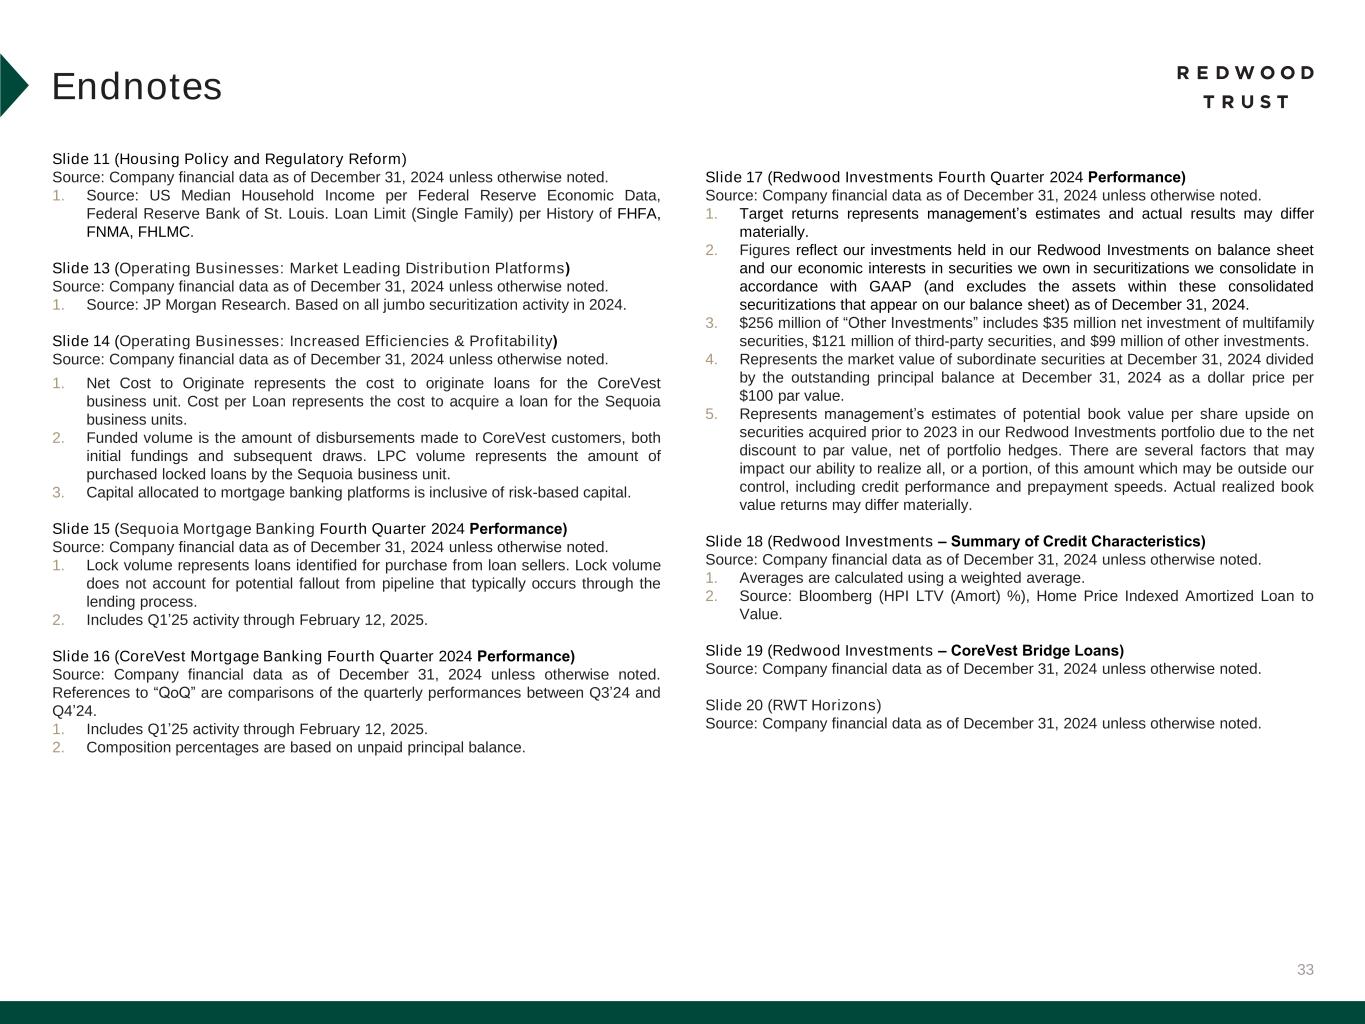
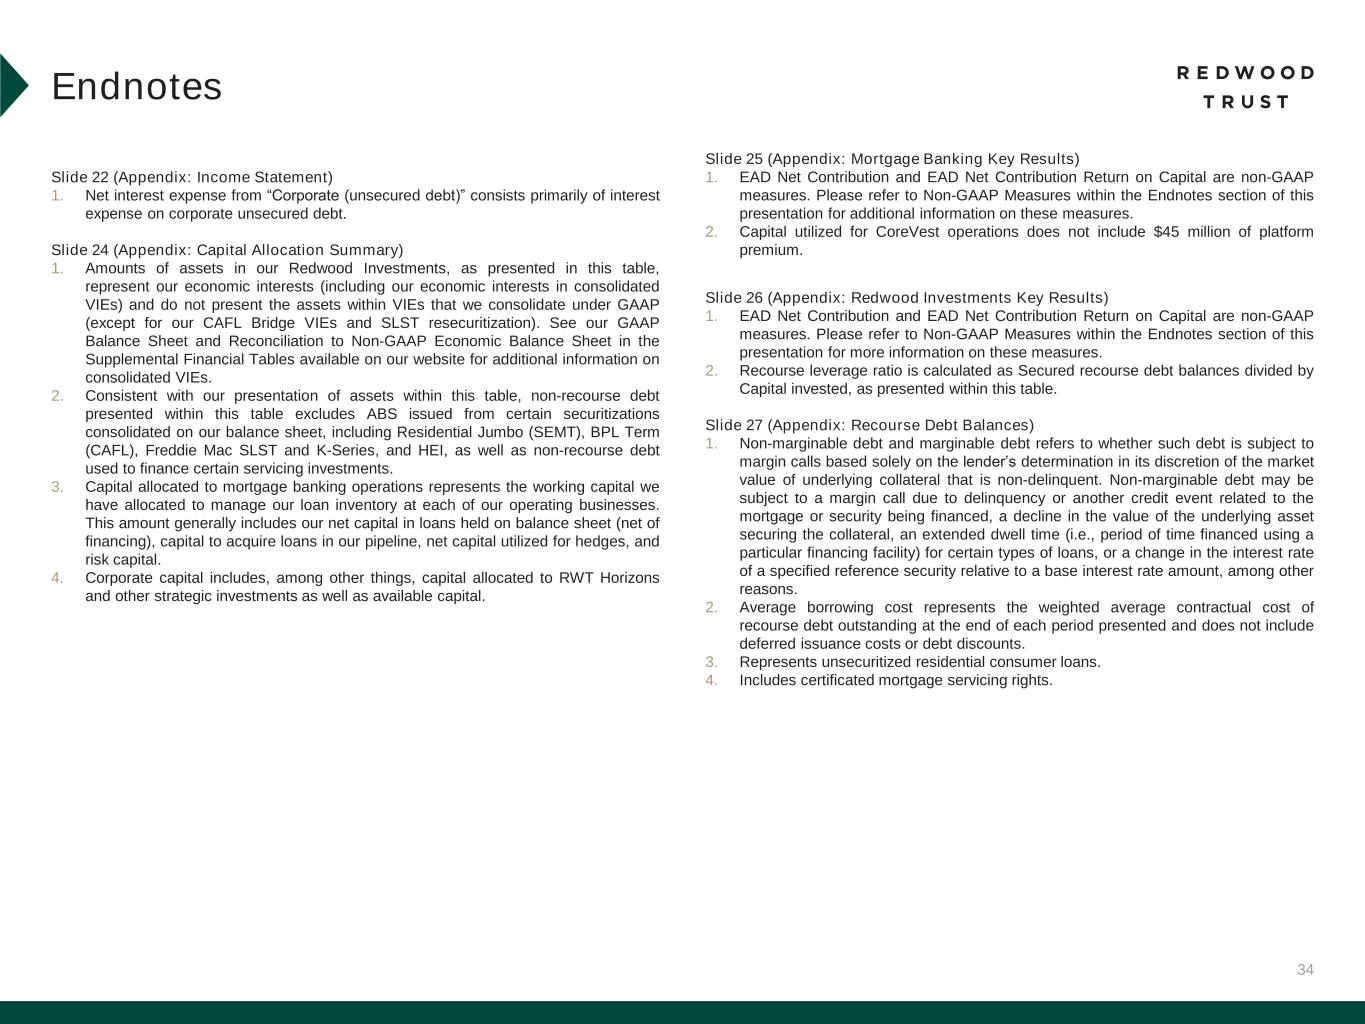
3.Recourse leverage ratio is defined as recourse debt at Redwood divided by tangible stockholders' equity. Recourse debt excludes $14.3 billion of consolidated securitization debt (ABS issued and servicer advance financing), other liabilities and other debt that is non-recourse to Redwood, and tangible stockholders' equity excludes $42.4 million of goodwill and intangible assets.
4.Lock volume represents loans identified for purchase from loan sellers. Lock volume does not account for potential fallout from pipeline that typically occurs through the lending process.
5.Represents Q1'25 activity through February 12, 2025 unless otherwise noted.
6.Includes securitizations and sales that have priced but not yet closed as of February 12, 2025.
3
Fourth Quarter 2024 Redwood Review and Supplemental Tables Available Online
A further discussion of Redwood's business and financial results is included in the fourth quarter 2024 Shareholder Letter and Redwood Review which are available under "Financial Info" within the Investor Relations section of the Company’s website at redwoodtrust.com/investor-relations. Additional supplemental financial tables can also be found within this section of the Company's website.
Conference Call and Webcast
Redwood will host an earnings call today, February 13, 2025, at 5:00 p.m. Eastern Time / 2:00 p.m. Pacific Time to discuss its fourth quarter 2024 financial results. The number to dial in order to listen to the conference call is 1-877-423-9813 in the U.S. and Canada. International callers must dial 1-201-689-8573. A replay of the call will be available through midnight on Thursday, February 27, 2025, and can be accessed by dialing 1-844-512-2921 in the U.S. and Canada or 1-412-317-6671 internationally and entering access code #13750895.
The conference call will be webcast live in listen-only mode through the News & Events section of Redwood’s Investor Relations website at https://www.redwoodtrust.com/investor-relations/news-events/events. To listen to the webcast, please go to Redwood's website at least 15 minutes before the call to register and to download and install any needed audio software. An audio replay of the call will also be available on Redwood's website following the call. Redwood plans to file its Annual Report on Form 10-K with the Securities and Exchange Commission by Monday, March 3, 2025, and also make it available on Redwood’s website.
About Redwood
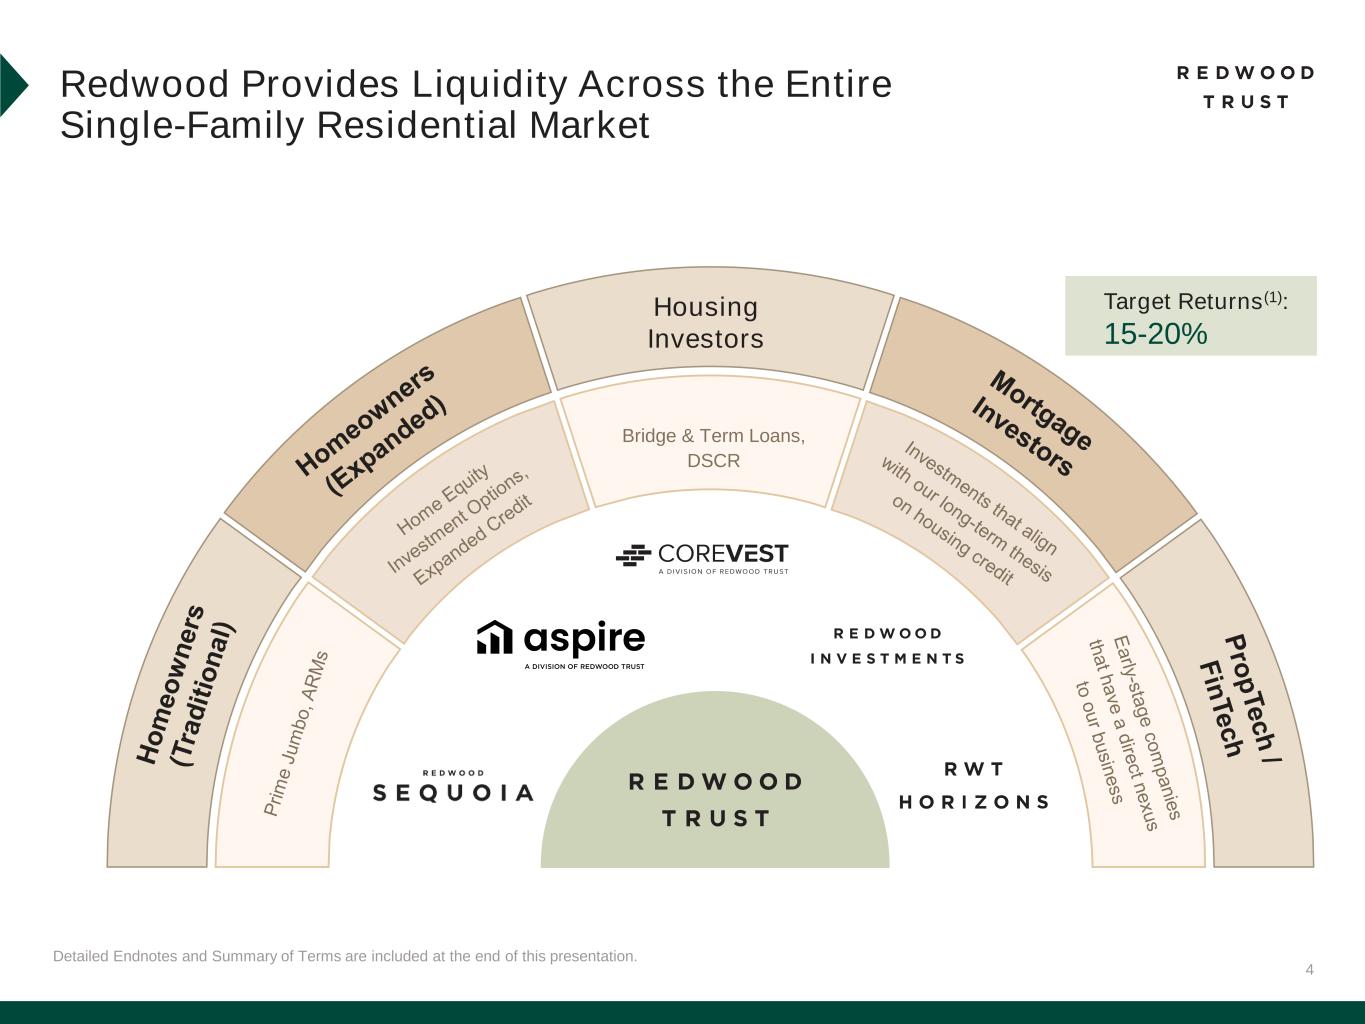
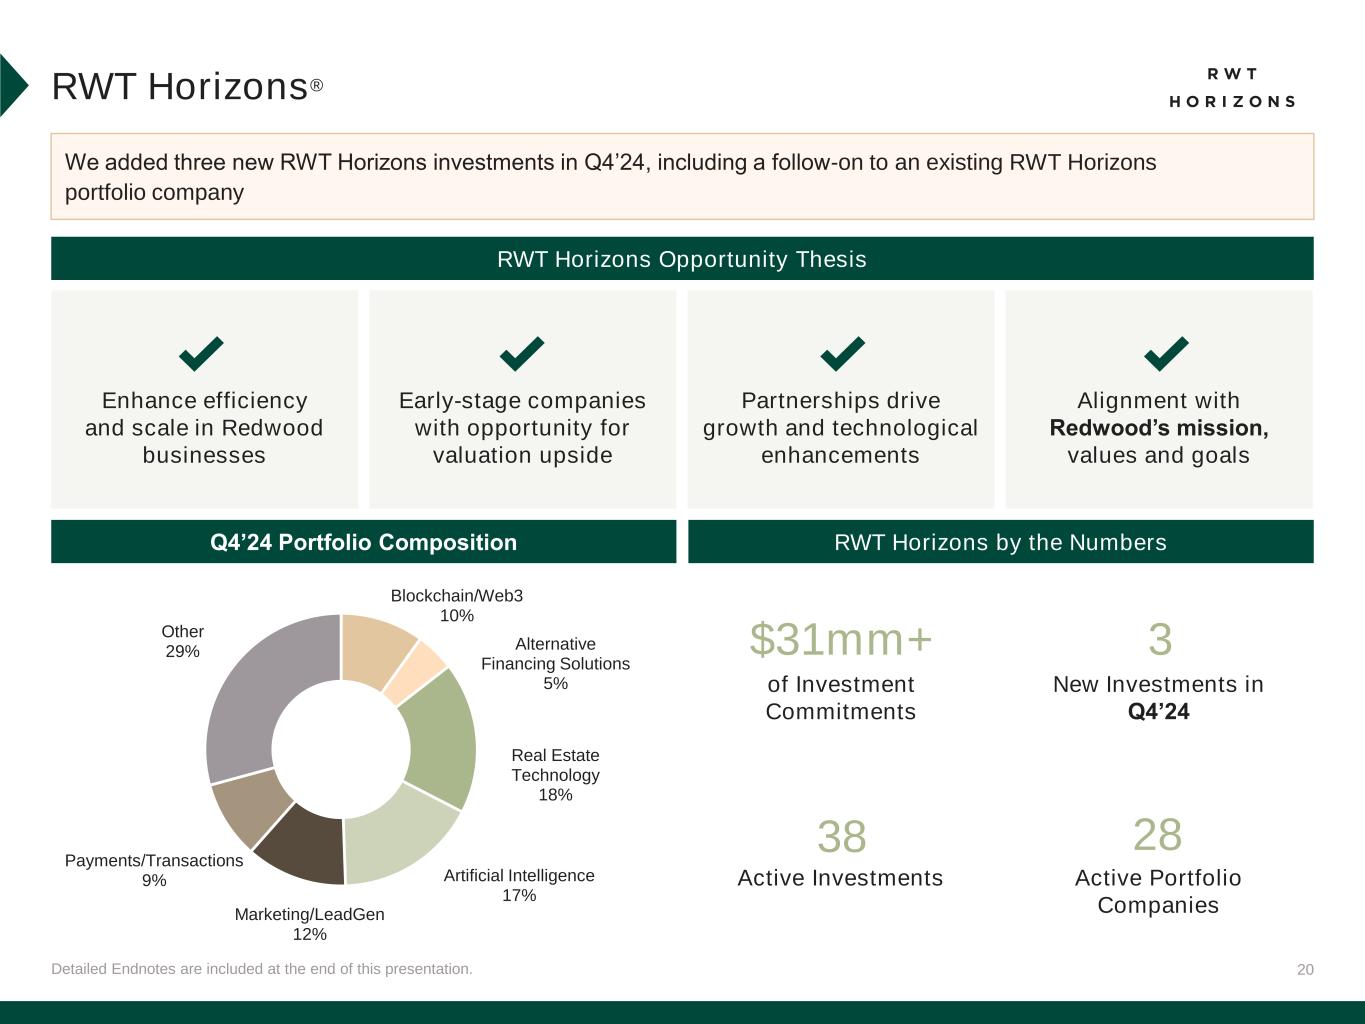
Redwood Trust, Inc. (NYSE: RWT) is a specialty finance company focused on several distinct areas of housing credit where we provide liquidity to growing segments of the U.S. housing market not well served by government programs. We deliver customized housing credit investments to a diverse mix of investors through our best-in-class securitization platforms, whole-loan distribution activities, and our publicly traded shares. We operate our business in three segments: Sequoia Mortgage Banking, CoreVest Mortgage Banking and Redwood Investments. Through RWT Horizons®, our venture investing initiative, we invest in early-stage companies that have a direct nexus to our operating platforms. Additionally, through Aspire, we directly originate home equity investment options to homeowners and purchase expanded home loan products from mortgage originators. Our goal is to provide attractive returns to shareholders through a stable and growing stream of earnings and dividends, capital appreciation, and a commitment to technological innovation that facilitates risk-minded scale. Redwood Trust is internally managed and structured as a real estate investment trust ("REIT") for tax purposes. For more information about Redwood, please visit our website at www.redwoodtrust.com or connect with us on LinkedIn.
Cautionary Statement; Forward-Looking Statements:
This press release and the related conference call contain forward-looking statements within the meaning of the safe harbor provisions of the Private Securities Litigation Reform Act of 1995, including the expected timing for the filing of Redwood's Annual Report on Form 10-K. Forward-looking statements involve numerous risks and uncertainties. Redwood's actual results may differ from Redwood's beliefs, expectations, estimates, and projections and, consequently, you should not rely on these forward-looking statements as predictions of future events. Forward-looking statements are not historical in nature and can be identified by words such as “anticipate,” “estimate,” “will,” “should,” “expect,” “believe,” “intend,” “seek,” “plan” and similar expressions or their negative forms, or by references to strategy, plans, opportunities, or intentions. These forward-looking statements are subject to risks and uncertainties, including, among other things, those described in our Annual Report on Form 10-K for the year ended December 31, 2023 under the caption “Risk Factors”. Other risks, uncertainties, and factors that could cause actual results to differ materially from those projected may be described from time to time in reports we file with the Securities and Exchange Commission, including reports on Forms 10-K, 10-Q and 8-K. We undertake no obligation to update or revise any forward-looking statements, whether as a result of new information, future events, or otherwise.
4
REDWOOD TRUST, INC.
| ($ in millions, except per share data) | Three Months Ended | ||||||||||
| 12/31/2024 | 9/30/2024 | ||||||||||
| Financial Performance | |||||||||||
| Net (loss) income per diluted common share | $ | (0.07) | $ | 0.09 | |||||||
| Net (loss) income per basic common share | $ | (0.07) | $ | 0.09 | |||||||
| EAD per basic common share (non-GAAP) | $ | 0.13 | $ | 0.18 | |||||||
| Return on Common Equity ("ROE") (annualized) | (3.0) | % | 4.5 | % | |||||||
| EAD Return on Common Equity ("EAD ROE") (annualized, non-GAAP) | 6.6 | % | 8.7 | % | |||||||
| Book Value per Common Share | $ | 8.46 | $ | 8.74 | |||||||
| Dividend per Common Share | $ | 0.18 | $ | 0.17 | |||||||
Economic Return on Book Value (1) | (1.1) | % | 2.1 | % | |||||||
Recourse Leverage Ratio (2) | 2.4x | 2.5x | |||||||||
| Operating Metrics | |||||||||||
| Residential Investor (CoreVest) Loans | |||||||||||
| Term fundings | $ | 227 | $ | 159 | |||||||
| Bridge fundings | 274 | 299 | |||||||||
| Term sold | 248 | 207 | |||||||||
| Bridge sold | 259 | 81 | |||||||||
| Residential Consumer (Sequoia) Loans | |||||||||||
| Locks | $ | 2,322 | $ | 2,226 | |||||||
| Purchases | 2,189 | 2,024 | |||||||||
| Securitized | 1,069 | 1,528 | |||||||||
| Sold | 1,404 | 39 | |||||||||
(1) Economic return on book value is based on the periodic change in GAAP book value per common share plus dividends declared per common share during the period.
(2) Recourse leverage ratio is defined as recourse debt at Redwood divided by tangible stockholders' equity. At December 31, 2024, and September 30, 2024, recourse debt excluded $14.3 billion and $14.3 billion, respectively, of consolidated securitization debt (ABS issued and servicer advance financing), other liabilities and other debt that is non-recourse to Redwood, and tangible stockholders' equity excluded $19 million and $45 million, respectively, of goodwill and intangible assets.
5
REDWOOD TRUST, INC.
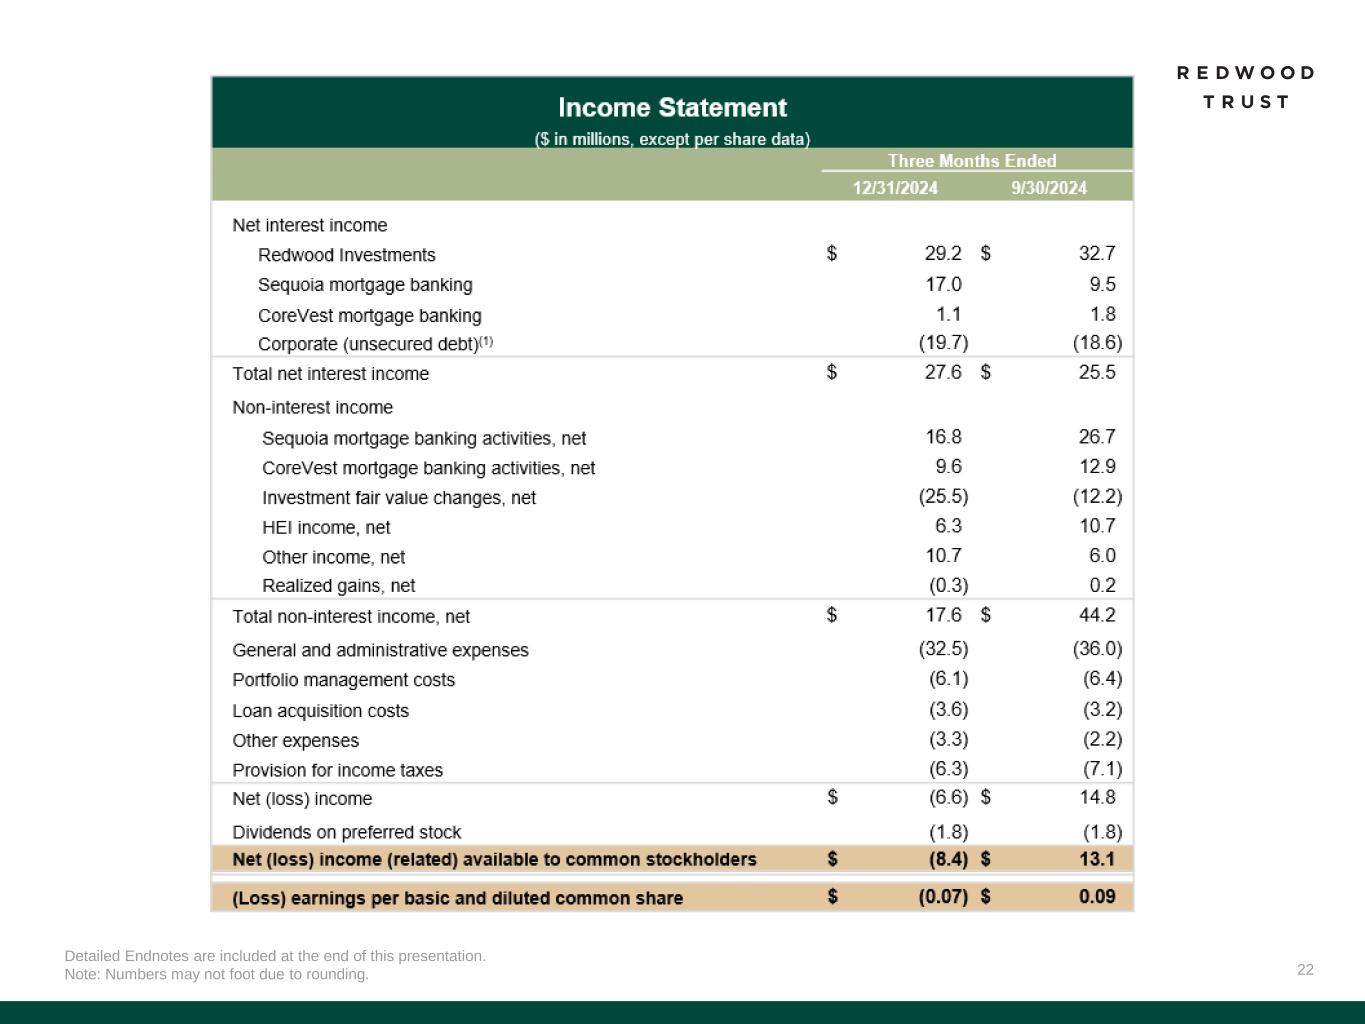
Consolidated Income Statements (1) | Three Months Ended | |||||||||||||||||||||||||||||||
| ($ in millions, except share and per share data) | 12/31/24 | 9/30/24 | 6/30/24 | 3/31/24 | 12/31/23 | |||||||||||||||||||||||||||
| Net Interest Income From: | ||||||||||||||||||||||||||||||||
| Redwood investments | $ | 29.2 | $ | 32.7 | $ | 29.9 | $ | 29.6 | $ | 30.8 | ||||||||||||||||||||||
| Sequoia mortgage banking | 17.0 | 9.5 | 11.2 | 6.0 | 0.7 | |||||||||||||||||||||||||||
| CoreVest mortgage banking | 1.1 | 1.8 | 1.5 | 0.9 | 0.9 | |||||||||||||||||||||||||||
| Corporate/other | (19.7) | (18.6) | (17.3) | (12.3) | (12.3) | |||||||||||||||||||||||||||
| Net Interest Income | $ | 27.6 | $ | 25.5 | $ | 25.3 | $ | 24.2 | $ | 20.1 | ||||||||||||||||||||||
| Non-interest income | ||||||||||||||||||||||||||||||||
| Sequoia mortgage banking activities, net | 16.8 | 26.7 | 6.2 | 7.8 | 8.4 | |||||||||||||||||||||||||||
| CoreVest mortgage banking activities, net | 9.6 | 12.9 | 12.7 | 6.7 | 6.3 | |||||||||||||||||||||||||||
| Investment fair value changes, net | (25.5) | (12.2) | 1.1 | 21.8 | 15.2 | |||||||||||||||||||||||||||
| HEI income, net | 6.3 | 10.7 | 15.8 | 9.0 | 11.7 | |||||||||||||||||||||||||||
| Other income, net | 10.7 | 6.0 | 6.3 | 4.5 | 1.8 | |||||||||||||||||||||||||||
| Realized gains, net | (0.3) | 0.2 | — | 0.4 | 0.6 | |||||||||||||||||||||||||||
| Total non-interest income, net | $ | 17.6 | $ | 44.2 | $ | 42.2 | $ | 50.3 | $ | 44.0 | ||||||||||||||||||||||
| General and administrative expenses | (32.5) | (36.0) | (33.3) | (34.6) | (32.2) | |||||||||||||||||||||||||||
| Portfolio management costs | (6.1) | (6.4) | (4.9) | (3.6) | (4.3) | |||||||||||||||||||||||||||
| Loan acquisition costs | (3.6) | (3.2) | (3.7) | (2.2) | (2.6) | |||||||||||||||||||||||||||
| Other expenses | (3.3) | (2.2) | (5.2) | (3.4) | (2.9) | |||||||||||||||||||||||||||
| (Provision for) benefit from income taxes | (6.3) | (7.1) | (4.9) | (0.5) | (1.0) | |||||||||||||||||||||||||||
| Net (loss) income | $ | (6.6) | $ | 14.8 | $ | 15.5 | $ | 30.3 | $ | 21.0 | ||||||||||||||||||||||
| Dividends on preferred stock | (1.8) | (1.8) | (1.8) | (1.8) | (1.8) | |||||||||||||||||||||||||||
| Net (loss) income (related) available to common stockholders | $ | (8.4) | $ | 13.1 | $ | 13.8 | $ | 28.5 | $ | 19.3 | ||||||||||||||||||||||
| Weighted average basic common shares (thousands) | 132,294 | 132,218 | 132,116 | 131,570 | 121,927 | |||||||||||||||||||||||||||
Weighted average diluted common shares (thousands) (2) | 132,294 | 132,358 | 132,124 | 131,570 | 122,474 | |||||||||||||||||||||||||||
| (Loss) earnings per basic common share | $ | (0.07) | $ | 0.09 | $ | 0.10 | $ | 0.21 | $ | 0.15 | ||||||||||||||||||||||
| (Loss) earnings per diluted common share | $ | (0.07) | $ | 0.09 | $ | 0.10 | $ | 0.21 | $ | 0.15 | ||||||||||||||||||||||
| Regular dividends declared per common share | $ | 0.18 | $ | 0.17 | $ | 0.16 | $ | 0.16 | $ | 0.16 | ||||||||||||||||||||||
(1)Certain totals may not foot due to rounding.
(2)Actual shares outstanding (in thousands) at December 31, 2024, September 30, 2024, March 31, 2024 and December 31, 2023 were 132,520, 132,237, 132,216, 131,871, and 131,486, respectively.
6
Analysis of Income Statement - Changes from Third Quarter 2024 to Fourth Quarter 2024
•Net interest income increased from the third quarter due to accretive capital deployment, partially offset by higher interest expense on corporate debt and a higher cost of funds on secured financing transactions completed in the third quarter.
•Income from Sequoia Mortgage Banking activities, net decreased slightly from the third quarter, but gain on sale margins remained above our historic target range of 75 - 100 basis points, benefiting from continued hedge outperformance and accretive distribution activities.
•Despite higher volume in the fourth quarter, income from CoreVest Mortgage Banking activities, net decreased due to non-recurring fee revenue experienced in the third quarter.
•Fair value changes on our Redwood Investments portfolio in the fourth quarter primarily reflected the net impact from higher benchmark interest rates on our re-performing loan securities and incremental negative fair value changes on our bridge loans.
•HEI income, net decreased in the fourth quarter as home price appreciation slowed from elevated levels the past few quarters, resulting in lower fair market value gains relative to the third quarter. Notwithstanding the slower pace of growth in the fourth quarter, home price appreciation remains in line with modeled expectations.
•General and administrative ("G&A") expenses decreased primarily as a result of lower performance-based variable and equity compensation expenses relative to the third quarter based on quarterly earnings performance.
•Our provision for income taxes in the fourth quarter decreased as a result of lower income from mortgage banking activities relative to the third quarter.
7
REDWOOD TRUST, INC.
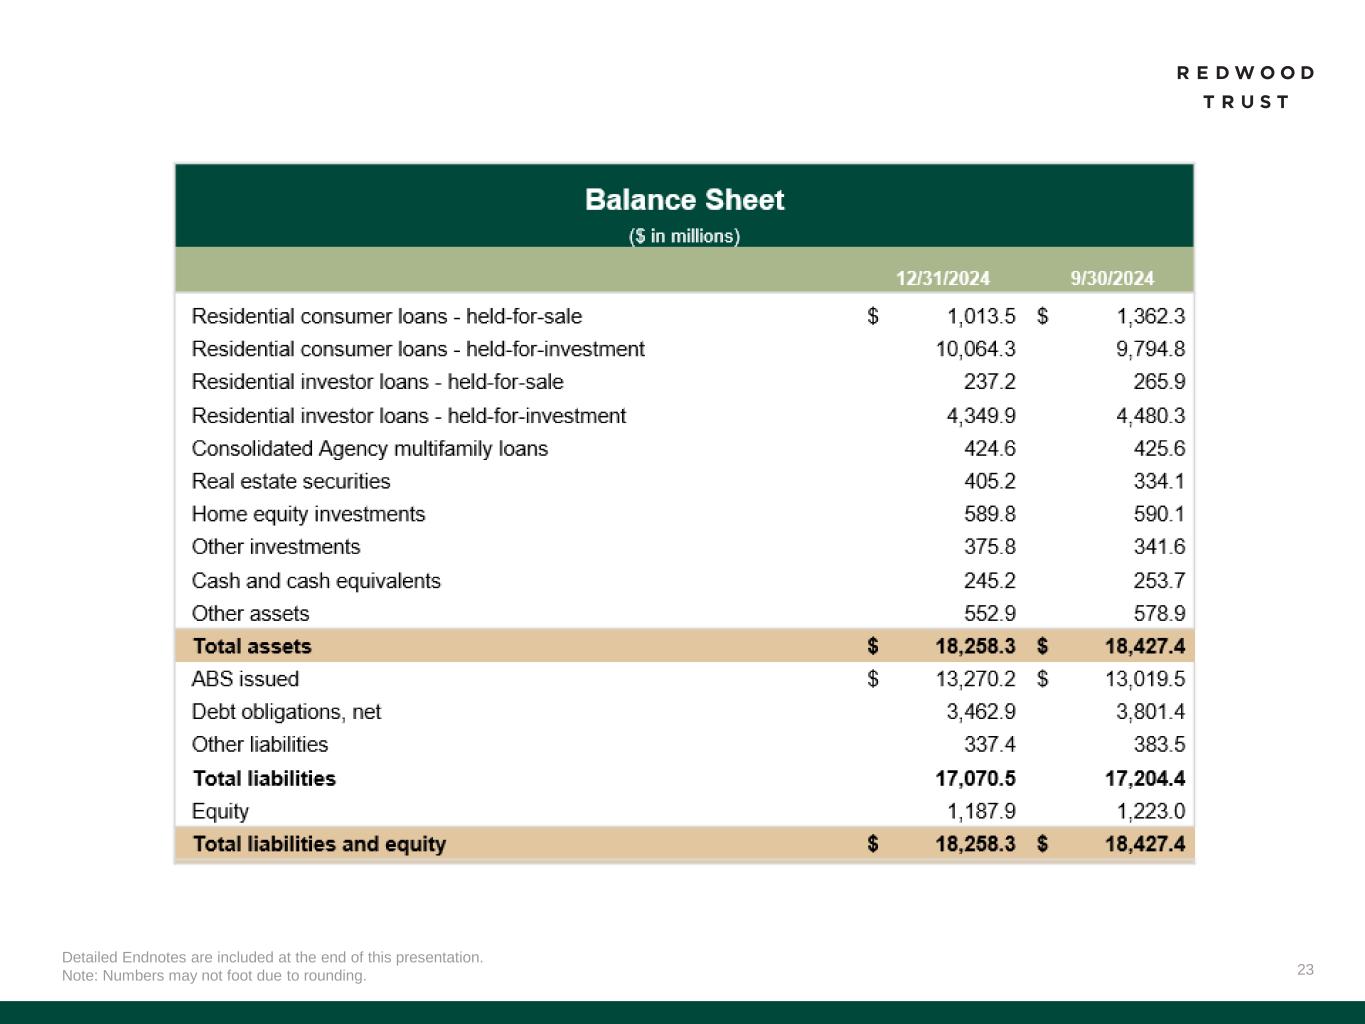
Consolidated Balance Sheets (1) | ||||||||||||||||||||||||||||||||
| ($ in millions, except share and per share data) | 12/31/24 | 9/30/24 | 6/30/24 | 3/31/24 | 12/31/23 | |||||||||||||||||||||||||||
| Residential consumer loans | $ | 11,078 | $ | 11,157 | $ | 9,210 | $ | 7,617 | $ | 7,051 | ||||||||||||||||||||||
| Residential investor loans | 4,587 | 4,746 | 4,880 | 5,182 | 5,220 | |||||||||||||||||||||||||||
| Consolidated Agency multifamily loans | 425 | 426 | 422 | 423 | 425 | |||||||||||||||||||||||||||
| Real estate securities | 405 | 334 | 264 | 212 | 128 | |||||||||||||||||||||||||||
| Home equity investments (HEI) | 590 | 590 | 574 | 561 | 550 | |||||||||||||||||||||||||||
| Other investments | 376 | 342 | 350 | 337 | 344 | |||||||||||||||||||||||||||
| Cash and cash equivalents | 245 | 254 | 276 | 275 | 293 | |||||||||||||||||||||||||||
| Other assets | 553 | 579 | 515 | 451 | 493 | |||||||||||||||||||||||||||
| Total assets | $ | 18,258 | $ | 18,427 | $ | 16,491 | $ | 15,058 | $ | 14,504 | ||||||||||||||||||||||
| Asset-backed securities issued, net | $ | 13,270 | $ | 13,020 | $ | 11,556 | $ | 10,628 | $ | 9,812 | ||||||||||||||||||||||
| Debt obligations, net | 3,463 | 3,801 | 3,415 | 2,959 | 3,239 | |||||||||||||||||||||||||||
| Other liabilities | 337 | 383 | 300 | 247 | 251 | |||||||||||||||||||||||||||
| Total liabilities | $ | 17,070 | $ | 17,204 | $ | 15,270 | $ | 13,834 | $ | 13,302 | ||||||||||||||||||||||
| Stockholders' equity | 1,188 | 1,223 | 1,221 | 1,224 | 1,203 | |||||||||||||||||||||||||||
| Total liabilities and equity | $ | 18,258 | $ | 18,427 | $ | 16,491 | $ | 15,058 | $ | 14,504 | ||||||||||||||||||||||
| Common shares outstanding at period end (thousands) | 132,520 | 132,237 | 132,216 | 131,871 | 131,486 | |||||||||||||||||||||||||||
| GAAP book value per common share | $ | 8.46 | $ | 8.74 | $ | 8.73 | $ | 8.78 | $ | 8.64 | ||||||||||||||||||||||
(1)Certain totals may not foot due to rounding.
8
Non-GAAP Disclosures
Reconciliation of GAAP Net Income Available to Common Stockholders to non-GAAP EAD(1)(2) | |||||||||||||||||
| Three Months Ended | |||||||||||||||||
| ($ in millions, except per share data) | 12/31/24 | 9/30/24 | |||||||||||||||
| GAAP Net income available to common stockholders | $ | (8.4) | $ | 13.1 | |||||||||||||
| Adjustments: | |||||||||||||||||
Investment fair value changes, net(3) | 25.5 | 12.2 | |||||||||||||||
Realized (gains)/losses, net(4) | 0.3 | (0.2) | |||||||||||||||
Acquisition related expenses(5) | 2.2 | 2.2 | |||||||||||||||
Tax effect of adjustments(6) | (1.2) | (2.1) | |||||||||||||||
| Earnings available for distribution (non-GAAP) | $ | 18.4 | $ | 25.2 | |||||||||||||
| Earnings per basic common share (GAAP) | $ | (0.07) | $ | 0.09 | |||||||||||||
| EAD per basic common share (non-GAAP) | $ | 0.13 | $ | 0.18 | |||||||||||||
| GAAP Return on common equity (annualized) | (3.0) | % | 4.5 | % | |||||||||||||
EAD Return on common equity (non-GAAP, annualized)(7) | 6.6 | % | 8.7 | % | |||||||||||||
1.Certain totals may not foot due to rounding.
2.EAD and EAD ROE are non-GAAP measures derived from GAAP Net income (loss) available (related) to common stockholders and GAAP Return on common equity ("GAAP ROE" or "ROE"), respectively. EAD is defined as: GAAP net income (loss) available (related) to common stockholders adjusted to (i) exclude investment fair value changes, net; (ii) exclude realized gains and losses; (iii) exclude acquisition related expenses; (iv) exclude certain organizational restructuring charges (as applicable); and (v) adjust for the hypothetical income taxes associated with these adjustments. EAD ROE is defined as EAD divided by average common equity. We believe EAD and EAD ROE provide supplemental information to assist management and investors in analyzing the Company’s results of operations and help facilitate comparisons to industry peers. Management also believes that EAD and EAD ROE are metrics that can supplement its analysis of the Company’s ability to pay dividends, by providing an indication of the current income generating capacity of the Company's business operations as of the quarter being presented. EAD and EAD ROE should not be utilized in isolation, nor should they be considered as an alternative to GAAP net income (loss) available (related) to common stockholders, GAAP ROE or other measurements of results of operations computed in accordance with GAAP or for federal income tax purposes.
3.Investment fair value changes, net includes all amounts within that same line item on our consolidated statements of income, which primarily represents both realized and unrealized gains and losses on our investments (excluding HEI) and associated hedges. As noted above, realized and unrealized gains and losses on our HEI investments are reflected in a new line item on our consolidated income statements titled "HEI income, net".
4.Realized (gains)/losses, net includes all amounts within that line item on our consolidated statements of income.
5.Acquisition related expenses include transaction costs paid to third parties, as applicable, and the ongoing amortization of intangible assets related to the Riverbend and CoreVest acquisitions.
6.Tax effect of adjustments represents the hypothetical income taxes associated with all adjustments used to calculate EAD.
7.EAD ROE is calculated by dividing EAD by average common equity for each respective period.
9
Non-GAAP Disclosures (Continued)
| Reconciliation of GAAP Net Contribution to non-GAAP EAD | ||||||||||||||||||||||||||
Net Contribution by Mortgage Banking Segment(1)(2) | ||||||||||||||||||||||||||
| Three Months Ended | Three Months Ended | |||||||||||||||||||||||||
| 12/31/24 | 9/30/24 | |||||||||||||||||||||||||
| ($ in millions) | Sequoia Mortgage Banking | CoreVest Mortgage Banking | Sequoia Mortgage Banking | CoreVest Mortgage Banking | ||||||||||||||||||||||
| GAAP Net contribution | $ | 21.8 | $ | 1.5 | $ | 22.8 | $ | 5.7 | ||||||||||||||||||
| Adjustments: | ||||||||||||||||||||||||||
Acquisition related expenses(3) | — | 2.2 | — | 2.2 | ||||||||||||||||||||||
Tax effect of adjustments(4) | — | (0.7) | — | (0.6) | ||||||||||||||||||||||
| EAD Net contribution (non-GAAP) | $ | 21.8 | $ | 3.1 | $ | 22.8 | $ | 7.3 | ||||||||||||||||||
| Capital utilized (average for period) | $ | 387 | $ | 50 | $ | 307 | $ | 50 | ||||||||||||||||||
| Return on capital (GAAP) | 23 | % | 12 | % | 30 | % | 45 | % | ||||||||||||||||||
EAD Net Contribution return on capital (non-GAAP)(5) | 23 | % | 25 | % | 30 | % | 58 | % | ||||||||||||||||||
1.Certain totals may not foot due to rounding.
2.EAD Net contribution and EAD Net contribution ROC are non-GAAP measures derived from GAAP Net contribution and GAAP Return on capital ("GAAP ROC" or "ROC"), respectively. GAAP ROC is defined as: GAAP Net contribution by segment adjusted to (i) exclude investment fair value changes, net (as applicable); (ii) exclude realized gains and losses (as applicable); (iii) exclude acquisition related expenses; (iv) exclude certain organizational restructuring charges (as applicable); and (v) adjust for the hypothetical income taxes associated with these adjustments. Each of these adjustments to arrive at EAD Net contribution are the same adjustments used to calculate EAD, as applicable to each segment for which it is being calculated. EAD Net contribution ROC presents a measure of profitability relative to the amount of capital utilized in the operations of each segment during a period and is calculated by dividing annualized non-GAAP EAD Net contribution by the average capital utilized by the segment during the period. Management utilizes these measures internally in analyzing each of the Company’s business segments’ contribution to EAD. See prior page for a further description of how management utilizes EAD and why EAD may assist investors, as well as limitations related to using EAD-based metrics. We caution that EAD Net contribution and EAD Net contribution ROC should not be utilized in isolation, nor should they be considered as alternatives to GAAP Net Contribution, GAAP ROC or other measurements of results of operations computed in accordance with GAAP.
3.Acquisition related expenses include transaction costs paid to third parties, as applicable, and the ongoing amortization of intangible assets related to the Riverbend and CoreVest acquisitions.
4.Tax effect of adjustments represents the hypothetical income taxes associated with all adjustments used to calculate EAD.
5.EAD ROC is calculated by dividing EAD by average capital utilized for each respective period.
10
| CONTACTS | ||
| Investor Relations | ||
| Kaitlyn Mauritz | ||
| Head of Investor Relations | ||
| Phone: 866-269-4976 | ||
| Email: [email protected] | ||
11