rwt-20220428
false000093023600009302362022-04-282022-04-28


UNITED STATES
SECURITIES AND EXCHANGE COMMISSION
Washington, D.C. 20549
  
FORM 8-K
CURRENT REPORT
Pursuant to Section 13 OR 15(d) of The Securities Exchange Act of 1934
Date of Report (Date of earliest event reported): April 28, 2022
  
REDWOOD TRUST, INC.
(Exact name of registrant as specified in its charter)
 
Maryland001-1375968-0329422
(State or other jurisdiction
of incorporation)
(Commission
File Number)
(I.R.S. Employer
Identification No.)
One Belvedere Place
Suite 300
Mill Valley, California 94941
(Address of principal executive offices and Zip Code)
(415389-7373
(Registrant’s telephone number, including area code)
Not Applicable
(Former name or former address, if changed since last report)  
Check the appropriate box below if the Form 8-K filing is intended to simultaneously satisfy the filing obligation of the registrant under any of the following provisions (see General Instruction A.2. below):
Written communications pursuant to Rule 425 under the Securities Act (17 CFR 230.425)
Soliciting material pursuant to Rule 14a-12 under the Exchange Act (17 CFR 240.14a-12)
Pre-commencement communications pursuant to Rule 14d-2(b) under the Exchange Act (17 CFR 240.14d-2(b))
Pre-commencement communications pursuant to Rule 13e-4(c) under the Exchange Act (17 CFR 240.13e-4(c))
Indicate by check mark whether the registrant is an emerging growth company as defined in Rule 405 of the Securities Act of 1933 or Rule 12b-2 of the Securities Exchange Act of 1934.
Emerging growth company
If an emerging growth company, indicate by check mark if the registrant has elected not to use the extended transition period for complying with any new or revised financial accounting standards provided pursuant to Section 13(a) of the Exchange Act.
Securities registered pursuant to Section 12(b) of the Act:
Title of each classTrading symbol(s)Name of each exchange on which registered
Common stock, par value $0.01 per shareRWTNew York Stock Exchange


Item 2.02.Results of Operations and Financial Condition;
 
Item 7.01.Regulation FD Disclosure.
On April 28, 2022, Redwood Trust, Inc. (the "Company") issued a press release announcing its financial results for the quarter ended March 31, 2022, the Redwood Trust Shareholder Letter - 1st Quarter 2022 and The Redwood Review - 1st Quarter 2022, copies of which are attached as Exhibit 99.1, Exhibit 99.2 and Exhibit 99.3, respectively, to this current report on Form 8-K.
In addition, on April 28, 2022, the Company made available Supplemental Financial Tables presenting certain financial results for the quarter ended March 31, 2022. A link to the Supplemental Financial Tables is available at the Company’s website at http://www.redwoodtrust.com, in the Investor Relations section of the website under “Financials.” An archive of the presentation materials will be available at the same location for 90 days.
The information contained in this Item 2.02 and Item 7.01 and the attached Exhibits 99.1, 99.2 and 99.3 is furnished to and not filed with the SEC, and shall not be incorporated by reference into any registration statement or other document filed under the Securities Act of 1933, as amended, or the Securities Exchange Act of 1934, as amended, except as shall be expressly set forth by specific reference in such filing.

Item 9.01.Financial Statements and Exhibits.
(d)Exhibits
Exhibit 99.1
Exhibit 99.2
Exhibit 99.3
Exhibit 104Cover Page Interactive Data File (embedded within the inline XBRL document)


SIGNATURES

Pursuant to the requirements of the Securities Exchange Act of 1934, the registrant has duly caused this report to be signed on its behalf by the undersigned thereunto duly authorized.
 
Date: April 28, 2022
REDWOOD TRUST, INC.
By: /s/ BROOKE E. CARILLO
Name: Brooke E. Carillo
Title: Chief Financial Officer


Exhibit Index
 
Exhibit No.Exhibit Title
Exhibit 99.1
Exhibit 99.2
Exhibit 99.3
Exhibit 104Cover Page Interactive Data File (embedded within the inline XBRL document)


Exhibit 99.1
rwt_logox102020xprimaryloga.jpg


REDWOOD TRUST REPORTS FIRST QUARTER 2022 FINANCIAL RESULTS

MILL VALLEY, CA Redwood Trust, Inc. (NYSE:RWT; "Redwood" or the "Company"), a leader in expanding access to housing for homebuyers and renters, today reported its financial results for the quarter ended March 31, 2022.
Key Financial Results and Metrics
GAAP net income was $31 million, or $0.24 per diluted common share, representing a 9% annualized return on equity
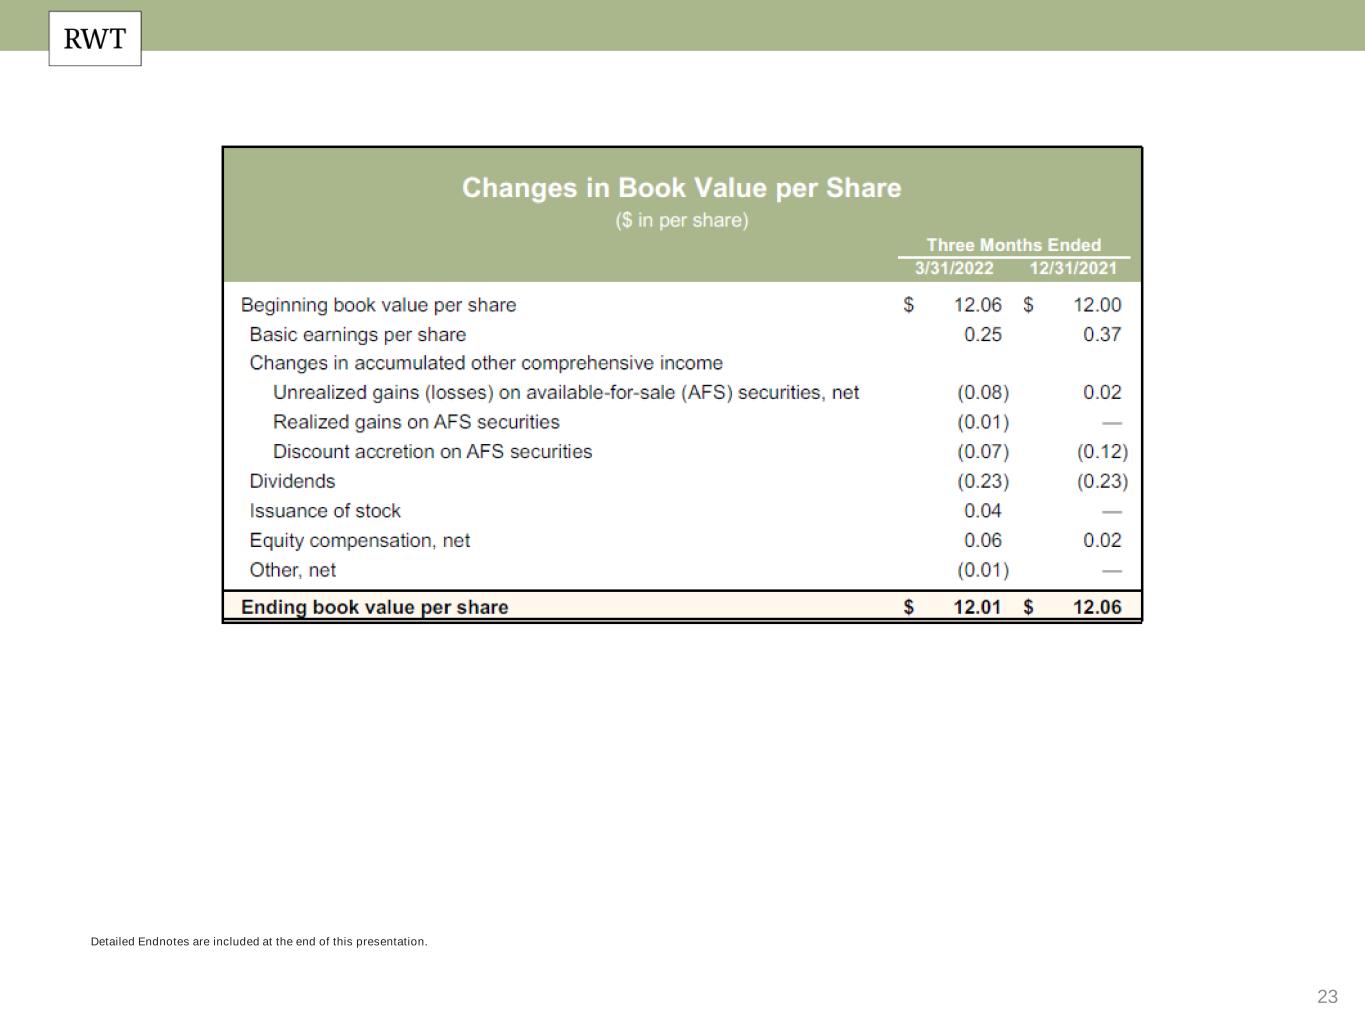
GAAP book value per common share was $12.01 at March 31, 2022, a (0.4)% change from $12.06 per share at December 31, 2021
Economic return on book value(1) of 1.5%
Recourse leverage ratio(2) of 2.1x at March 31, 2022
Declared and paid a regular quarterly dividend of $0.23 per common share for the first quarter 2022
Operational Business Highlights
Investment Portfolio
Deployed $128 million of capital into new investments
Called $102 million of seasoned residential jumbo loan collateral
Credit performance remained strong, with stable delinquencies and continued home price appreciation
Business Purpose Mortgage Banking
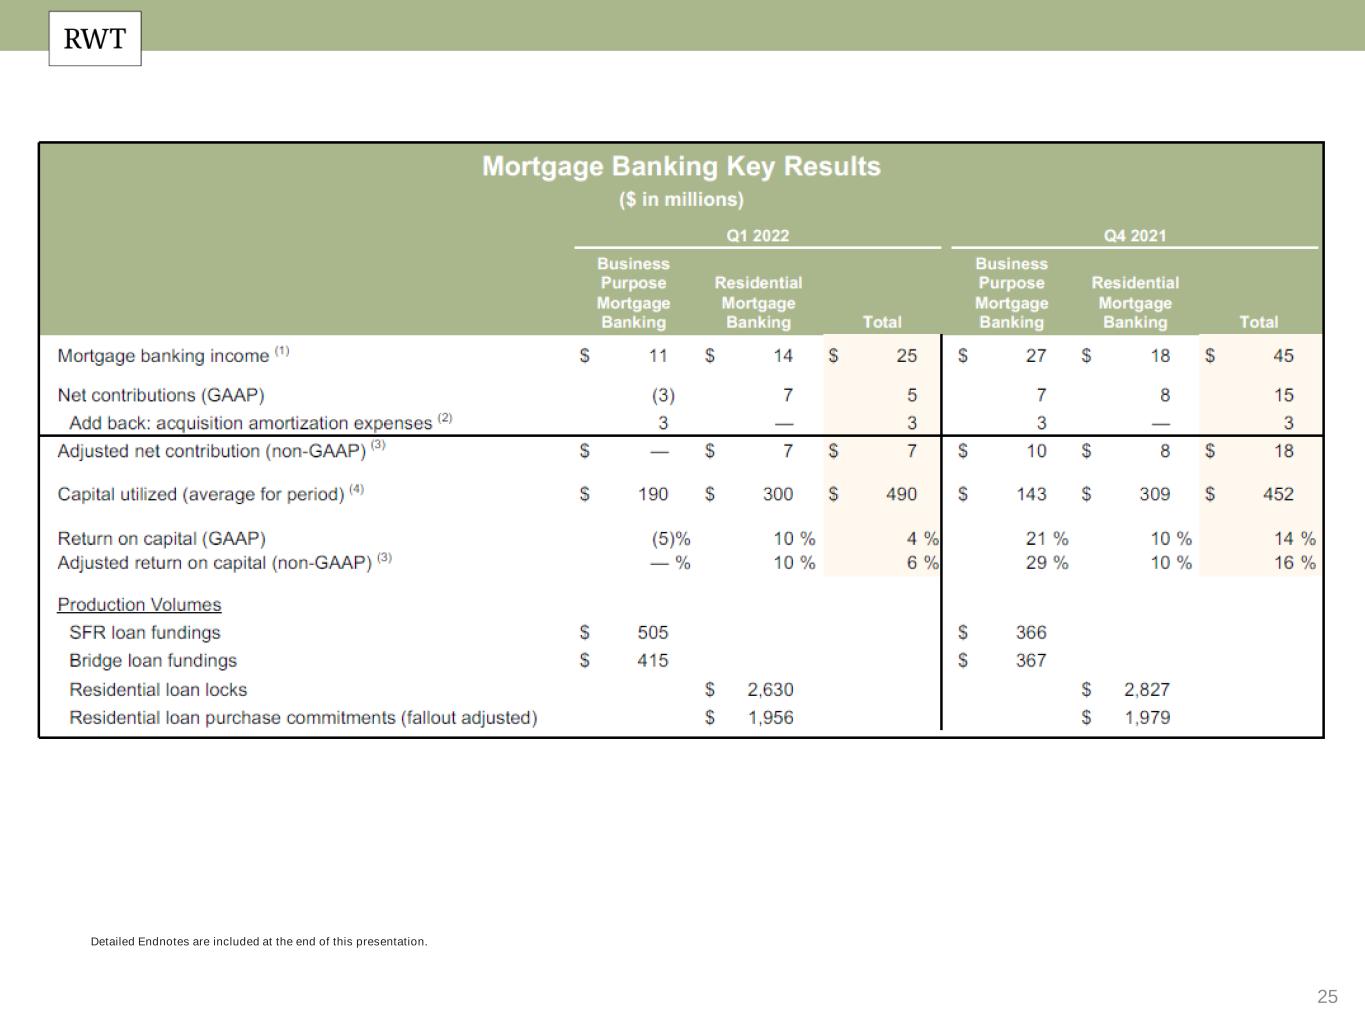
Funded a record $920 million in business purpose loans, up 25% from the fourth quarter of 2021
First quarter fundings included $415 million of bridge loans (up 13% from the fourth quarter) and $505 million of single-family rental ("SFR") loans (up 38% from the fourth quarter)
Launched new short-term rental product and closed inaugural short-term rental portfolio loan
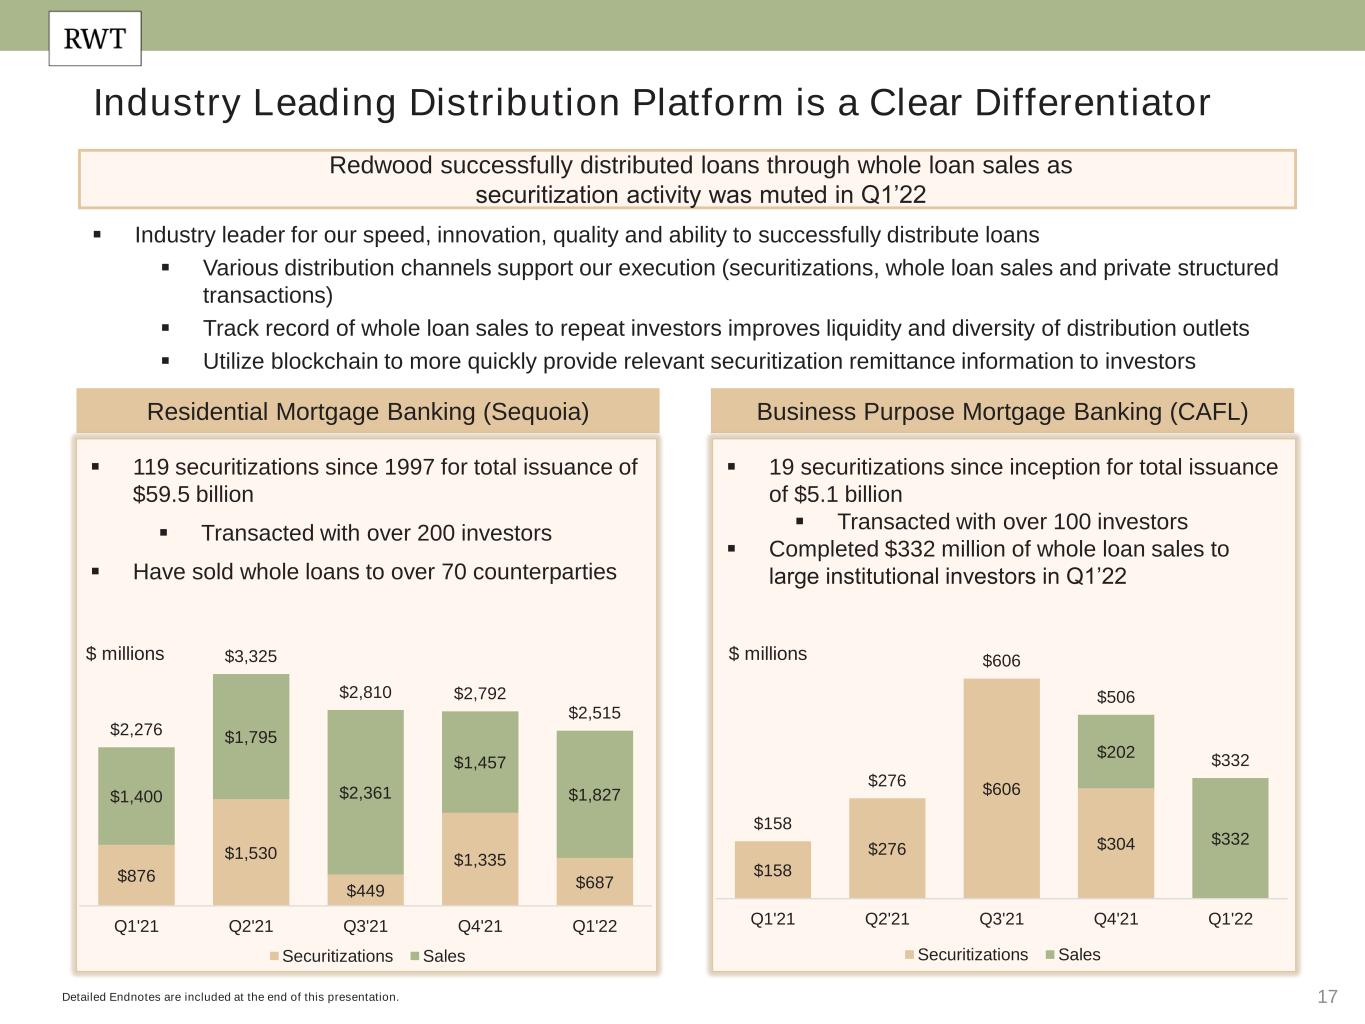
Sold $332 million of SFR loans to large institutional investors and transferred $81 million of bridge loans to our existing revolving securitization
Residential Mortgage Banking
Locked $2.6 billion(3) of jumbo residential loans; loan purchase commitments were $2.0 billion(4)
First quarter lock mix(3) was 65% purchase money loans and 35% refinancings; included 91% Select loans and 9% Choice loans
Purchased $2.0 billion of jumbo loans; jumbo loan pipeline at March 31, 2022 included $1.1 billion of loans identified for purchase
Distributed $2.5 billion of jumbo loans, including $1.8 billion through whole loan sales and one securitization backed by $0.7 billion of loans


_____________________
See following page for footnotes.
1


Financing Highlights
Successfully renewed $2.2 billion of warehouse capacity, including four residential warehouse facilities and one business purpose lending warehouse facility; increased total business purpose lending warehouse capacity by $200 million
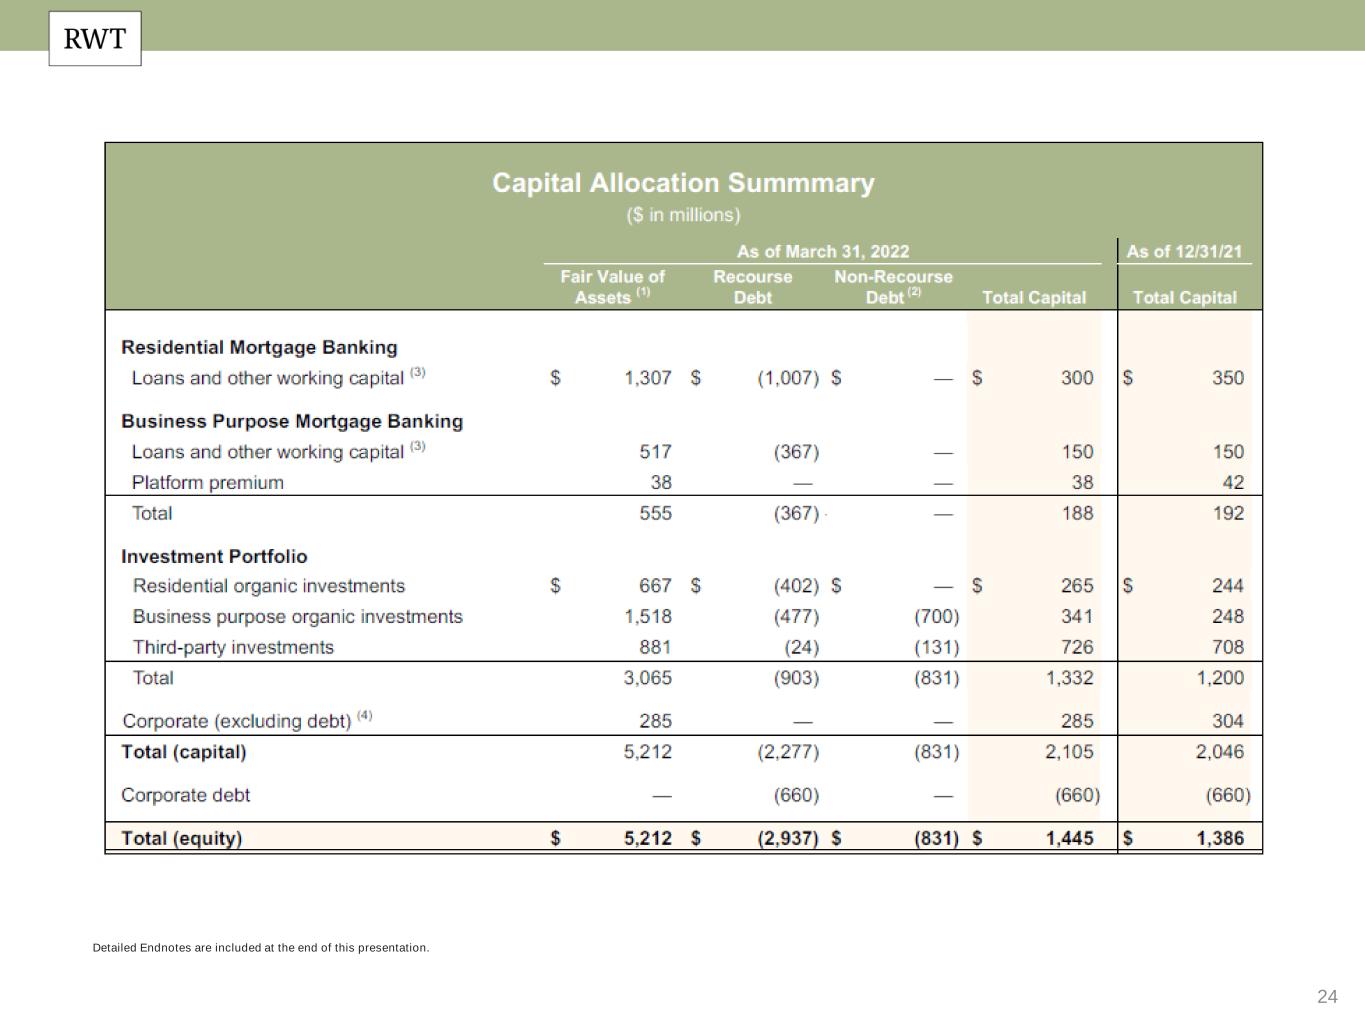
Maintained robust balance sheet with unrestricted cash of $409 million and available capital of $140 million at March 31, 2022

RWT Horizons Highlights
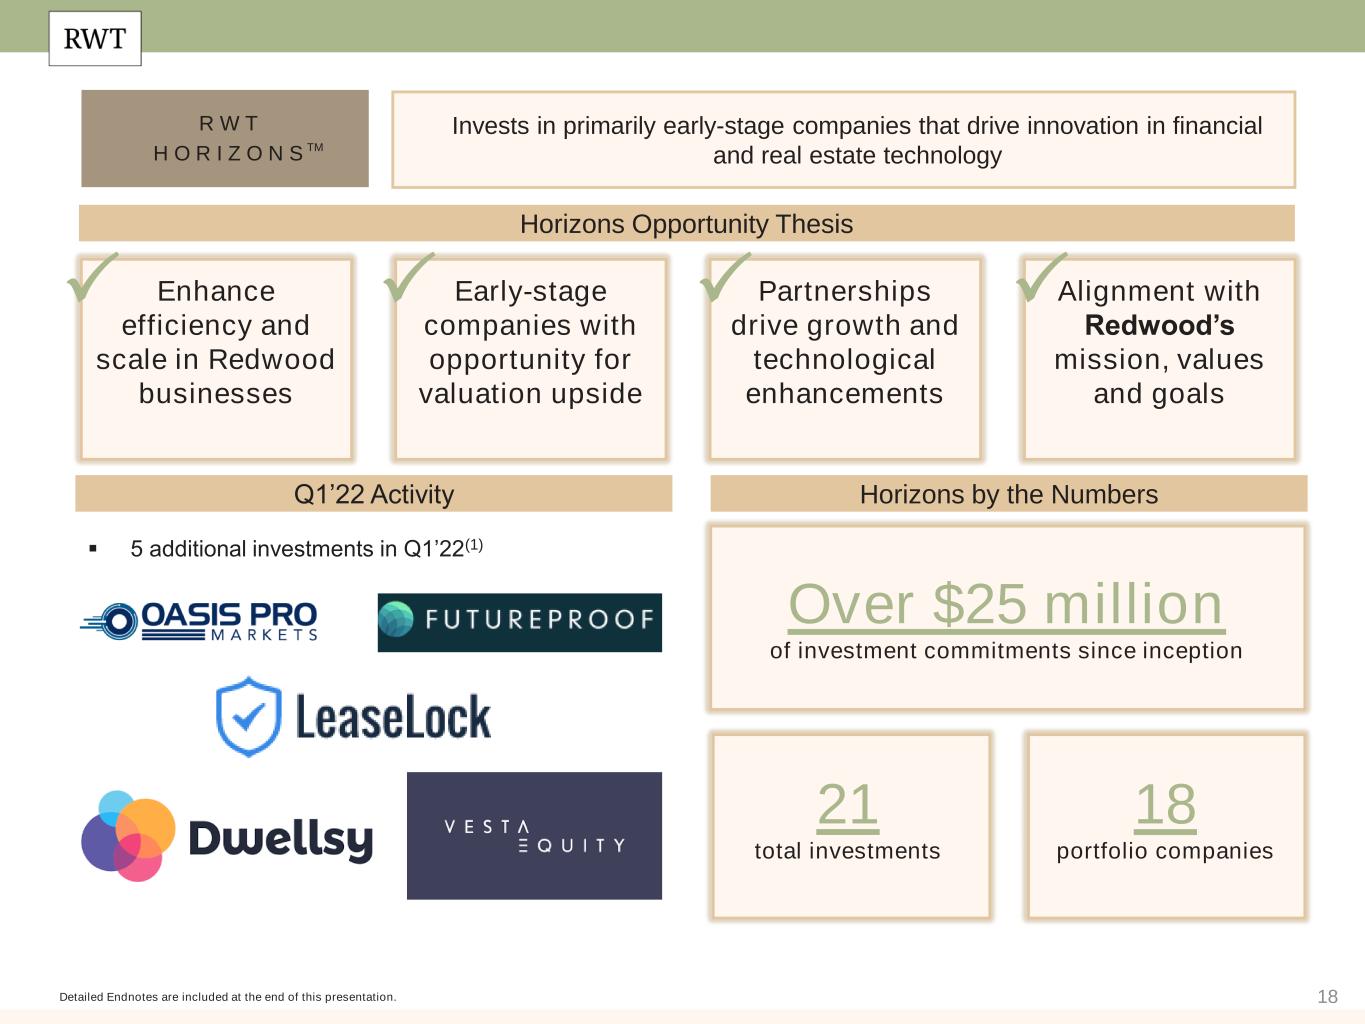
RWT Horizons completed five investments in the first quarter of 2022
Two RWT Horizons companies completed follow-on funding rounds in the first quarter of 2022
Since inception, RWT Horizons has completed 21 technology venture investments in 18 companies with over $25 million of investment commitments

Environmental, Social, Governance ("ESG") Highlights
Made a $25 million commitment to an investment vehicle with mission of providing quality workforce housing opportunities in key Bay Area urban communities
Retirement of two independent directors scheduled for May 2022 in accordance with Redwood’s mandatory retirement age demonstrates ongoing commitment to Board refreshment, with long-term transition planning for these departures prompting the addition of two new directors in 2021 who have brought important expertise and experience to Redwood’s Board, as well as increased gender and ethnic diversity

Post Q1'22 Activity
Entered into definitive agreement to acquire Riverbend Funding, LLC and its subsidiaries ("Riverbend"), a best-in-class private mortgage lender to residential transitional and commercial real estate investors. Following the close of the acquisition, we intend to integrate Riverbend into Redwood’s existing wholly-owned business purpose mortgage banking platform, CoreVest American Finance Lender, LLC

“In a quarter that was characterized by extreme global market and geopolitical volatility, Redwood delivered an annualized return on equity of 9% as well as overall book value stability and positive economic return,” said Chris Abate, Chief Executive Officer of Redwood. “These results reflect the diversified nature of our balanced business model with the quality of our investment holdings, mortgage banking platforms and distribution capabilities remaining a clear differentiator."

Abate continued, "Challenging markets like these offer important opportunities for us to further differentiate our business, particularly as we position Redwood for new chapters of growth. We move into the second quarter and rest of the year with the same risk-minded priorities as the first quarter – namely capital preservation and long-term value creation – and we expect to use our strong positioning more aggressively as attractive investment opportunities arise.”
_____________________
(1)    Economic return on book value is based on the period change in GAAP book value per common share plus dividends declared per common share in the period.
(2)    Recourse leverage ratio is defined as recourse debt at Redwood divided by tangible stockholders' equity. Recourse debt excludes $9.6 billion of consolidated securitization debt (ABS issued and servicer advance financing) and other debt that is non-recourse to Redwood, and tangible stockholders' equity excludes $38 million of intangible assets.
(3)    Does not account for potential fallout from pipeline that typically occurs through the lending process.
(4)    Includes estimated potential fallout from locked pipeline that typically occurs through the lending process.

2


First Quarter 2022 Redwood Review Available Online
A further discussion of Redwood's business and financial results is included in the first quarter 2022 Shareholder Letter and Redwood Review which are available within the “Quarterly Results” section under "Financials" on the Company’s investor relations website at ir.redwoodtrust.com.
Conference Call and Webcast
Redwood will host an earnings call today, April 28, 2022, at 2:00 p.m. Pacific Time / 5:00 p.m. Eastern Time to discuss its first quarter 2022 financial results. The number to dial in order to listen to the conference call is 1-877-423-9813 in the U.S. and Canada. International callers must dial 1-201-689-8573. A replay of the call will be available through midnight on Thursday, May 12, 2022, and can be accessed by dialing 1-844-512-2921 in the U.S. and Canada or 1-412-317-6671 internationally and entering access code #13728235.
The conference call will be webcast live in listen-only mode through the Events and Presentations section of Redwood Trust's Investor Relations website at https://ir.redwoodtrust.com/events-and-presentations/events. To listen to the webcast, please go to Redwood's website at least 15 minutes before the call to register and to download and install any needed audio software. An audio replay of the call will also be available on Redwood's website following the call. Redwood plans to file its Quarterly Report on Form 10-Q with the Securities and Exchange Commission by Tuesday, May 10, 2022, and also make it available on Redwood’s website.
About Redwood Trust
Redwood Trust, Inc. (NYSE: RWT) is a specialty finance company focused on several distinct areas of housing credit. Our operating platforms occupy a unique position in the housing finance value chain, providing liquidity to growing segments of the U.S. housing market not well served by government programs. We deliver customized housing credit investments to a diverse mix of investors, through our best-in-class securitization platforms; whole-loan distribution activities; and our publicly traded shares. Our aggregation, origination and investment activities have evolved to incorporate a diverse mix of residential, business purpose and multifamily assets. Our goal is to provide attractive returns to shareholders through a stable and growing stream of earnings and dividends, capital appreciation, and a commitment to technological innovation that facilitates risk-minded scale. We operate our business in three segments: Residential Mortgage Banking, Business Purpose Mortgage Banking and Investment Portfolio. Additionally, through RWT Horizons™, our venture investing initiative, we invest in early-stage companies strategically aligned with our business across the lending, real estate, and financial technology sectors to drive innovations across our residential and business-purpose lending platforms. Since going public in 1994, we have managed our business through several cycles, built a track record of innovation, and established a best-in-class reputation for service and a common-sense approach to credit investing. Redwood Trust is internally managed and structured as a real estate investment trust ("REIT") for tax purposes. For more information about Redwood, please visit our website at www.redwoodtrust.com or connect with us on LinkedIn, Twitter, or Facebook.

Forward-Looking Statements:  This press release and the related conference call contain forward-looking statements within the meaning of the safe harbor provisions of the Private Securities Litigation Reform Act of 1995, including statements related to the amount of residential mortgage loans that we identified for purchase during the first quarter of 2022 and expected fallout and the corresponding volume of residential mortgage loans expected to be available for purchase, statements relating to our estimates of our available capital, statements related to our expectations with respect to the closing of our acquisition of Riverbend and Riverbend’s integration into the Redwood and CoreVest businesses, and the expected timing for the filing of Redwood's Quarterly Report on Form 10-Q. Forward-looking statements involve numerous risks and uncertainties. Redwood's actual results may differ from Redwood's beliefs, expectations, estimates, and projections and, consequently, you should not rely on these forward-looking statements as predictions of future events. Forward-looking statements are not historical in nature and can be identified by words such as “anticipate,” “estimate,” “will,” “should,” “expect,” “believe,” “intend,” “seek,” “plan” and similar expressions or their negative forms, or by references to strategy, plans, or intentions. These forward-looking statements are subject to risks and uncertainties, including, among other things, those described in our Annual Report on Form 10-K for the year ended December 31, 2021 under the caption “Risk Factors”. Other risks, uncertainties, and factors that could cause actual results to differ materially from those projected may be described from time to time in reports we file with the Securities and Exchange Commission, including reports on Forms 10-Q and 8-K. We undertake no obligation to update or revise any forward-looking statements, whether as a result of new information, future events, or otherwise.

3


REDWOOD TRUST, INC.
($ in millions, except per share data)Three Months Ended
3/31/202212/31/2021
Financial Performance
Net income per diluted common share$0.24 $0.34 
Return on Equity (annualized)8.6 %12.8 %
Book Value per Share$12.01 $12.06 
Dividend per Share$0.23 $0.23 
Economic Return on Book Value (1)
1.5 %2.4 %
Available Capital (in millions)$140 $150 
Recourse Leverage Ratio (2)
2.1x2.4x
Operating Metrics
Business Purpose Loans
SFR fundings$505 $366 
Bridge fundings$415 $367 
SFR securitized$— $304 
SFR sold$332 $202 
Residential Jumbo Loans
Locks$2,630 $2,827 
Purchases$2,008 $3,181 
Securitized$687 $1,335 
Sold$1,827 $1,457 
(1)    Economic return on book value is based on the periodic change in GAAP book value per common share plus dividends declared per common share during the period.
(2)    Recourse leverage ratio is defined as recourse debt at Redwood divided by tangible stockholders' equity. As of March 31, 2022 and December 31, 2021, recourse debt excluded $9.6 billion and $9.9 billion, respectively, of consolidated securitization debt (ABS issued and servicer advance financing) and other debt that is non-recourse to Redwood, and tangible stockholders' equity excluded $38 million and $42 million, respectively, of intangible assets.
4


REDWOOD TRUST, INC.
Consolidated Income Statements (1)
Three Months Ended
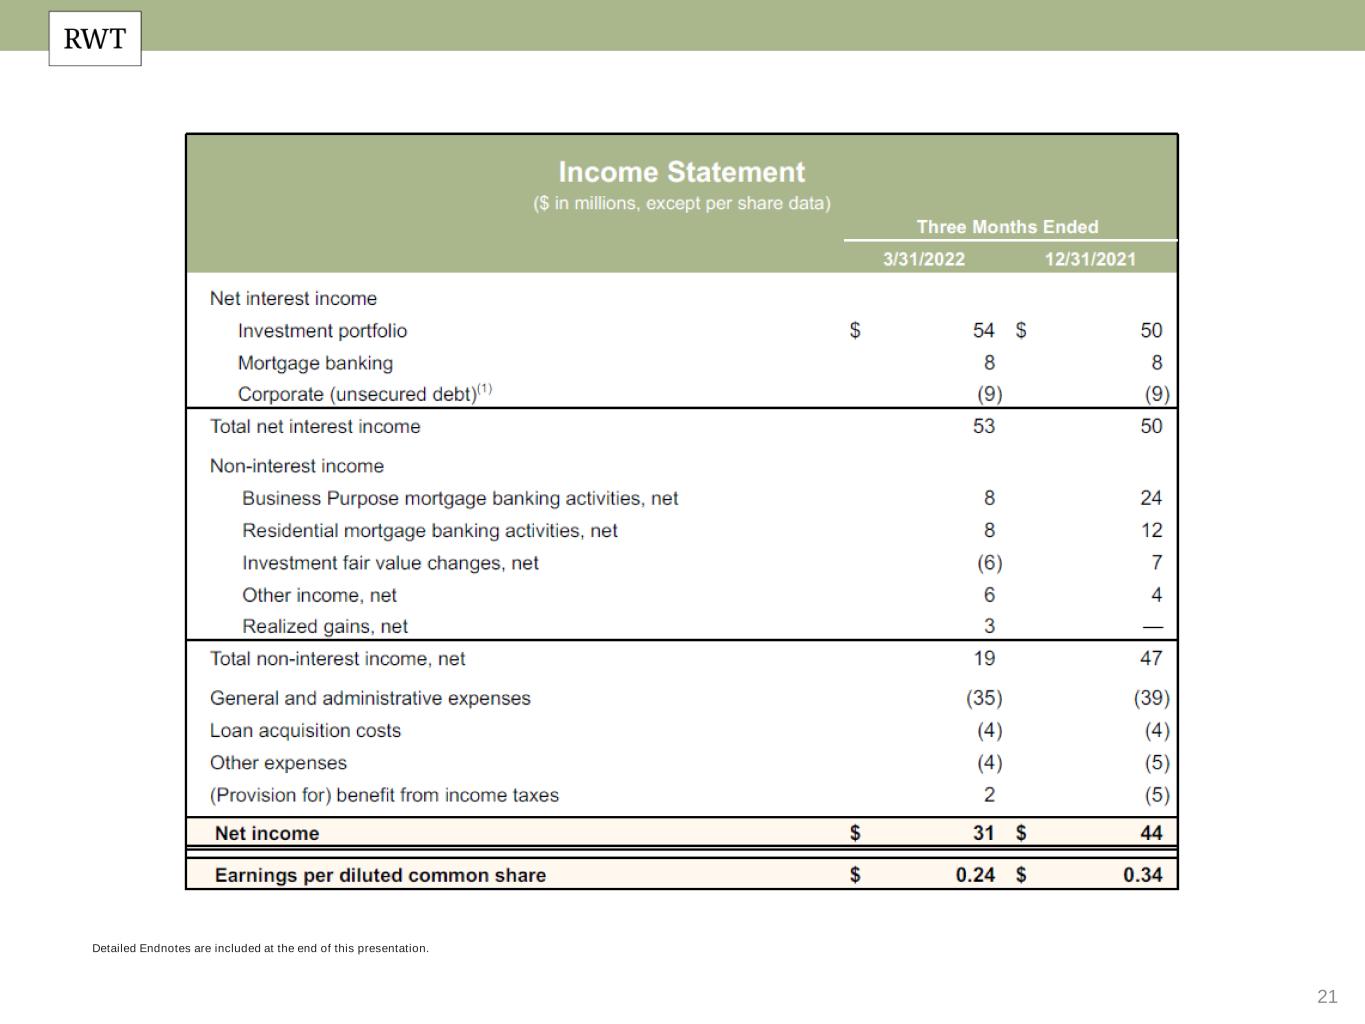
($ in millions, except share and per share data)3/31/2212/31/219/30/216/30/213/31/21
Interest income$189 $162 $146 $139 $128 
Interest expense(136)(112)(104)(108)(103)
Net interest income53 50 42 31 26 
Non-interest income
Residential Mortgage banking activities, net12 33 21 61 
Business Purpose Mortgage banking activities, net24 30 33 21 
Investment fair value changes, net(6)26 49 45 
Other income, net
Realized gains, net— 
Total non-interest income, net19 47 98 114 134 
General and administrative expenses(35)(39)(48)(41)(44)
Loan acquisition costs(4)(4)(5)(4)(4)
Other expenses(4)(5)(4)(4)(4)
(Provision for) benefit from income taxes(5)(7)(12)
Net income$31 $44 $88 $90 $97 
Weighted average diluted shares (thousands) (2)
140,506 143,540 141,855 141,761 141,039 
Diluted earnings per common share$0.24 $0.34 $0.65 $0.66 $0.72 
Regular dividends declared per common share$0.23 $0.23 $0.21 $0.18 $0.16 
(1)Certain totals may not foot due to rounding.
(2)In the periods presented above, weighted average diluted shares included shares from the assumed conversion of our convertible and/or exchangeable debt in accordance with GAAP diluted EPS provisions. Actual shares outstanding at March 31, 2022, December 31, 2021, September 30, 2021, June 30, 2021, and March 31, 2021 were 120,289, 114,892, 114,662, 113,053, and 112,999, respectively.


Analysis of Income Statement - Changes from Fourth Quarter 2021 to First Quarter 2022
Net interest income increased from the fourth quarter, as we grew our bridge loan portfolio and deployed additional capital into other portfolio investments. Additionally, interest income benefited from $7 million of higher yield maintenance income on our SFR securities, driven by increased prepayments, and higher interest income from other investments, which was partially offset by lower discount accretion income of $5 million on our available-for-sale securities, generally reflecting longer expected call periods on our Sequoia securities.
Despite record funding volumes, income from business purpose mortgage banking activities declined from the fourth quarter as increased rate volatility and wider spreads for both securitizations and whole loan sales negatively impacted valuations of our existing loan inventory and resulted in lower margins for our current production of SFR loans. Funding volumes for bridge and SFR loans increased from the fourth quarter of 2021 by 13% and 38%, respectively, and demand for multifamily loans has remained strong with funded volumes in that product increasing 66% quarter-over-quarter.
5


Income from residential mortgage banking activities declined from the fourth quarter primarily due to lower margins, as increased rate volatility drove higher hedging costs during the first quarter and wider spreads negatively impacted both securitization and whole loan executions. Our residential loan locks were down only marginally during the quarter (-7%) as overall industry volumes declined.
Net negative investment fair value changes in the first quarter reflected spread widening across some of our investments (including reperforming loans, CRT securities, residential securities and called jumbo loans) partially offset by fair value increases in our HEI investments, IO securities, MSRs, and certain SFR subordinate securities that benefited from credit resolutions during the first quarter.
Other income increased from the fourth quarter, due to higher MSR income resulting from a reduction in prepayment speeds during the first quarter.
General and administrative expenses decreased from the fourth quarter, as variable compensation decreased commensurate with the decrease in quarterly GAAP earnings.
Other expenses were primarily comprised of acquisition-related intangible amortization expenses.
Our benefit from income taxes resulted from GAAP losses incurred at our TRS in the first quarter.
6


REDWOOD TRUST, INC.
Consolidated Balance Sheets (1)
($ in millions, except share and per share data)3/31/2212/31/219/30/216/30/213/31/21
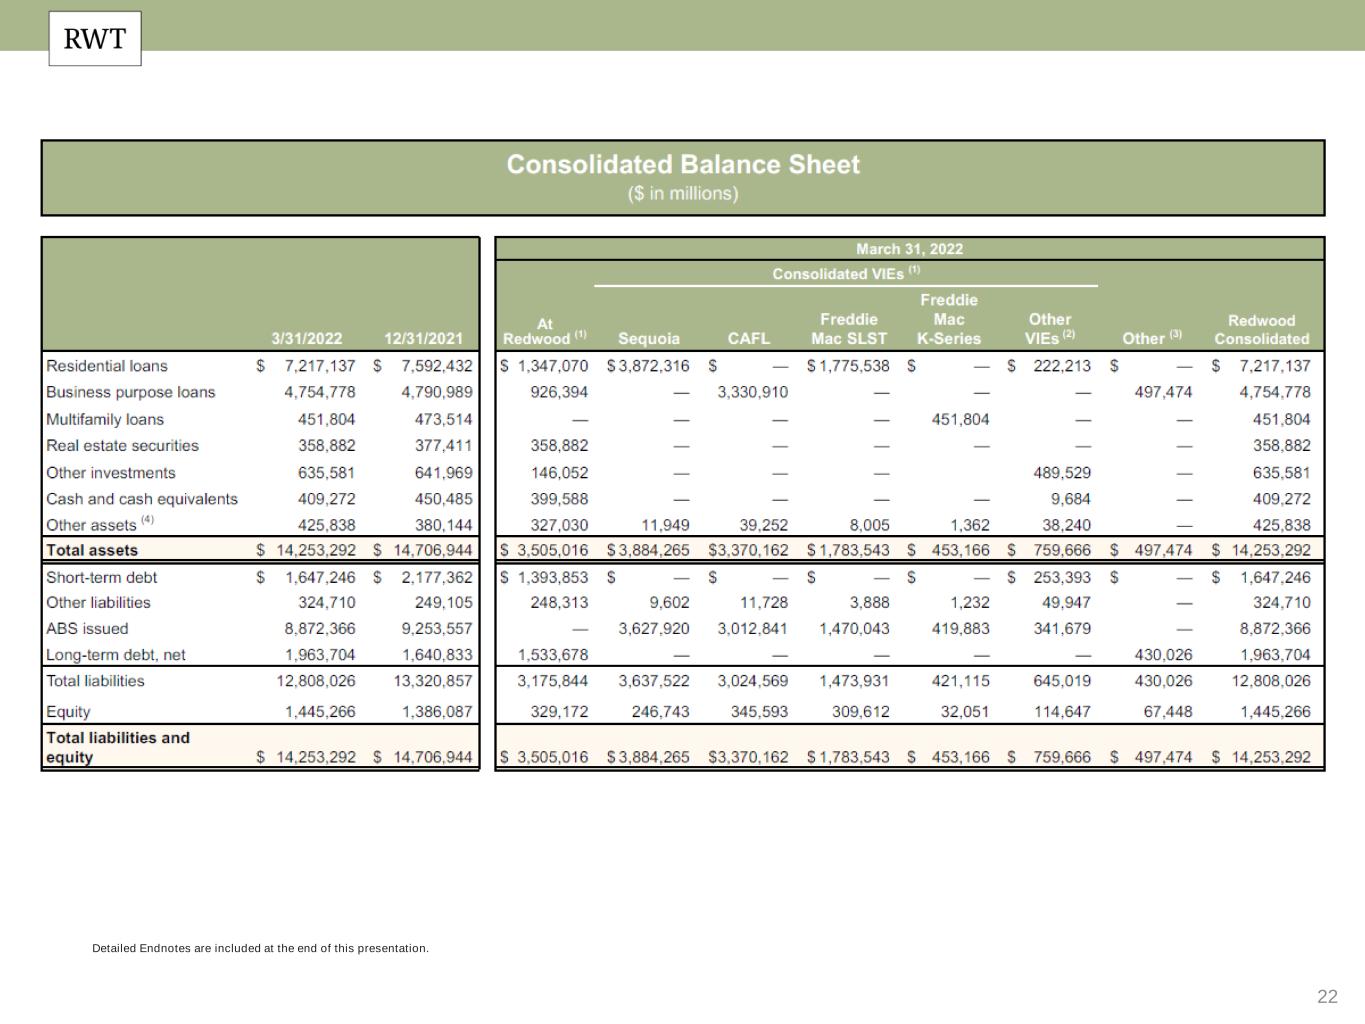
Residential loans$7,217 $7,592 $6,216 $5,743 $4,702 
Business purpose loans4,755 4,791 4,694 4,409 4,172 
Multifamily loans 452 474 483 485 490 
Real estate securities359 377 353 355 364 
Other investments636 642 422 309 323 
Cash and cash equivalents409 450 557 421 426 
Other assets426 380 347 275 420 
Total assets$14,253 $14,707 $13,073 $11,996 $10,897 
Short-term debt$1,647 $2,177 $1,751 $1,485 $1,254 
Other liabilities325 249 263 195 317 
Asset-backed securities issued8,872 9,254 8,184 7,537 6,672 
Long-term debt, net1,964 1,641 1,500 1,484 1,438 
Total liabilities12,808 13,321 11,697 10,701 9,681 
Stockholders' equity1,445 1,386 1,376 1,295 1,216 
Total liabilities and equity$14,253 $14,707 $13,073 $11,996 $10,897 
Shares outstanding at period end (thousands)120,289 114,892 114,662 113,053 112,999 
GAAP book value per share$12.01 $12.06 $12.00 $11.46 $10.76 
(1)Certain totals may not foot due to rounding.


CONTACTS
Investor Relations
Kaitlyn Mauritz
SVP, Head of Investor Relations
Phone: 866-269-4976
Email: [email protected]
Media Relations
Sard Verbinnen & Co
Email: [email protected]
7

Exhibit 99.2

S H A R E H O L D E R L E T T E R

F I R S T Q U A R T E R 2 0 2 2
R E D W O O D
T R U S T
rr_lh.jpg
rr_c.jpg
rr_rh.jpg


image_0.jpg
Dear Shareholders,

When fixed-income markets turn in their worst quarterly performance in over 40 years, there’s nowhere to hide, and sometimes the strength and experience of your team is the only effective hedge. That’s our candid take on the first quarter, and why we’re particularly pleased to have exited it profitably. We head into the second quarter with the same risk-minded priorities as the first quarter – namely, book value stability and long-term value creation – but expect to use our strong capital position more aggressively as attractive investment opportunities arise on the back of market distress. For over twenty-five years, Redwood has been committed to delivering for our shareholders and successfully navigating across markets and cycles.

Our first quarter GAAP earnings were $0.24 per diluted share, and our GAAP book value was $12.01 per share at March 31, 2022, nearly flat with book value at year-end 2021. After paying a first quarter dividend of $0.23 per share, we ended the quarter with over $400 million of unrestricted cash and $140 million of available capital. This does not take into account the ongoing net cash flow we tend to generate internally through our operating businesses, a dynamic that has facilitated much of our recent growth. All told, the resiliency of our mortgage banking businesses, coupled with another quarter of very strong fundamental credit performance across our investment portfolio, has resulted in balanced financial results in an otherwise lopsided environment for the broader residential mortgage sector.

What has become clear early on in 2022 is that this will be a year of great transition, if not capitulation, for many market participants. Expectations for persistently higher inflation and supply chain disruptions are now the norm. The effects on market sentiment have been profound. An unrelenting rise in benchmark interest rates that began in the fourth quarter of 2021 has continued, causing the Federal Reserve in March to raise its federal funds rate for the first time since 2019, with many market observers expecting a total of 9 rate hikes throughout the year. Additionally, the Fed has signaled it may begin paring back its Agency mortgage-backed securities (“MBS”) holdings. For context, the Fed had amassed this portfolio to $2.7 trillion over the past two years, effectively becoming the world’s largest Agency mortgage REIT. The conventional 30-year mortgage rate may soon eclipse 6%, the highest level in over a decade, and credit markets have remained volatile as investors grapple with how the Fed will manage the economy’s next landing.

Challenging markets like these offer important opportunities for us to further differentiate our business, particularly as we position Redwood for new chapters of growth. While each of our business lines address different facets of the housing market, taken together Redwood offers shareholders a comprehensive and highly durable non-Agency investment strategy that cannot be easily replicated.

When we evaluate where in the current market investors can generate strong risk-adjusted returns, a logical starting place is shorter-duration, floating-rate loans whose coupons reset higher as interest rates rise. This is where our business purpose lending platform, CoreVest, continues to shine. The bridge products we offer are generally 12 to 18 months in duration and are geared toward housing investors who rehabilitate single or multifamily units for sale or rent. The industry continues at a torrid pace, as the supply of refurbished,

______________________
This Shareholder Letter contains time-sensitive information and may contain forward-looking statements. The information contained herein is only accurate as of April 28, 2022. We undertake no obligation to update or revise the information contained herein, including forward-looking statements, whether as a result of new information, future events, or otherwise. Additional detail regarding the forward-looking statements in this Shareholder Letter and the important factors that may affect our actual results in 2022 are described at the end of this Shareholder Letter under the heading “Forward-Looking Statements.”

image_0.jpg
“turnkey” housing across the U.S. hovers at all-time lows. Our total business purpose lending (“BPL”) fundings for the first quarter grew 25% versus the fourth quarter of 2021 on record bridge originations, buttressed by strong volumes in multifamily transitional lending. One key competitive advantage of our bridge lending program is the broad array of products we offer the marketplace, from small loans for investors improving one single-family home, to large and more customized products for sponsors focused on build-for-rent or multifamily development.

And we believe the best is yet to come. In keeping with our successful track record of growing both organically and through partnerships, we recently announced a definitive agreement to acquire Riverbend Lending (“Riverbend”), a specialty lender headquartered in Oregon focused on single- and multifamily bridge lending. Riverbend, which we plan to operationally integrate within CoreVest, brings a product and geographic footprint that we believe will be immediately accretive to our overall BPL platform. Riverbend’s deep borrower network should also be fertile territory through which to sell and distribute CoreVest’s existing flagship products. Riverbend’s principals are well known to our leadership team through both current and previous ventures, and both groups are excited about the business and cultural fit. We look forward to formally welcoming the Riverbend team to our platform when we consummate the acquisition, which is expected to be in the second quarter of 2022, pending satisfaction of customary closing conditions.

Away from BPL, the consumer residential mortgage market garnered most of the industry’s headlines in the first quarter, not all of them flattering. The follow-on effects from the Fed’s tightening posture caused mortgage rates to rise approximately 1.50% in a single quarter. And as quickly as major Fed stimulus facilitated record profitability for many originators in 2020 and 2021, the anticipated Fed tightening has pulled the rug out from an industry that entered the year staffed for $4 trillion of annual origination volume.

Cyclical corrections to origination capacity are inevitable, but they really only speak to the downstream effects. The immediate pain felt by market participants has come from the thousands of loans in production since last November that were locked to consumers at rates well below today’s market levels. And not surprisingly, the execution for both Agency MBS and non-Agency securitizations has been impacted, as significant price concessions are granted for investors to accept below market rates on aged loan inventories. We spoke of this inevitable correction on our fourth quarter earnings call in mid-February, though our uncharacteristically solemn tone may not have seemed overly prescient at the time.

However, it’s important to note that the market adversity we are witnessing today remains a crisis of profitability for issuers, not one of liquidity for the private-label securitization (“PLS”) market. We have spoken before of our ability to turn inventory more quickly than competitors and thereby offer investors a cash-flow profile more in line with current market levels. Investor breadth is strong and their capacity to acquire bonds remains high after many years of sterling credit performance and enhanced structural protections. This foundation that we’ve helped build in PLS has enabled the market to weather this latest correction and continues to facilitate very strong issuance levels in 2022.


image_0.jpg
Suffice to say, we’re extremely pleased with how our Redwood Residential business performed relative to what we suspect was one of the worst quarters for the industry in many years. Our playbook was consistent throughout the first quarter, beginning with pulling forward our first securitization of 2022 to early January, ahead of the inevitable purge by other issuers of lower-coupon mortgages that needed to clear the system. Our transaction achieved the best execution of any PLS of its type thus far this year. And as the quarter progressed, we continued to remain light on loan inventory thanks to a laser focus on staying current on pricing, leading the industry in loan processing times, and leveraging a deep whole loan distribution network.

Utilizing this approach, we were able to continue locking loans competitively while others stepped back from the market, resulting in our residential lock volume declining only 7% from the fourth quarter of 2021, versus industry-wide projections of a 25% total decline for the period. We did this while preserving our gross margins at levels near our long-term historical range. Our platform continues to lock loans commensurate with the volumes we were seeing in the first quarter, but we’re positioned to become much more aggressive as the market stabilizes.

As with all spread products, gain on sale margins for our mortgage banking businesses, particularly for the consumer residential and single-family rental (“SFR”) loan pipelines, remain impacted by the interest rate and spread widening that plagued markets in the first quarter. However, in conjunction with an inevitable recovery in margins as industry origination capacity corrects and fixed costs exit the market, we’ve come armed with a slew of new products and services aimed at meeting the evolving needs of investors and consumers in today’s rising rate environment. Our BPL team recently closed on an inaugural term loan backed by a short-term rental portfolio, which we expect will position CoreVest well to meet the needs of a growing cohort of investors branching into the short-term rental space. And our Residential team recently revamped our expanded credit programs – including the addition of a loan program focused on self-employed borrowers – as part of a continuing evolution of our product suite to address the changing needs of homeowners. We also remain well-positioned to speak for a meaningful amount of new supply likely headed to the PLS market, spurred by revised GSE pricing on high-balance conforming mortgages and loans on second homes that took effect in April. With loan officers no longer able to rely on GSE refinance volumes and the industry well underway in right-sizing capacity, we see these new products as a key avenue to increasing our market share by providing additional options that loan officers can use to service their customers.

As illustrated by our first quarter performance and economic return, the impact of the recent volatility on Redwood’s book value was relatively muted, due primarily to our portfolio diversification, low leverage, and proactive risk management. Our investment portfolio continues to be owned at a significant net discount to par and is primarily backed by assets with lower interest rate sensitivity – bridge loans, call-protected SFR loans, and seasoned reperforming residential loans, to name a few. Our book value tends to be levered more to underlying credit performance, and we saw the impact of this in the first quarter as overall delinquencies remained stable. Our outlook on housing credit remains strong given rising home equity, low
 

image_0.jpg
unemployment and historically low housing inventory. Volatility leads to entry points, and we will continue to opportunistically add to our investment portfolio where we see strong return potential.

As a supplement to our primary business lines, it’s only fitting that a strategy we initiated last year to transcend cyclical markets has begun to bear fruit. RWT Horizons, our home-grown venture investment strategy, has begun contributing to the bottom line ahead of schedule, with two smaller investments completing follow-on raises at significantly higher valuations during the first quarter. And in April, one of our earlier partnerships completed a new funding round that is expected to result in a pre-tax gain on our investment of approximately $10 million. Under GAAP, we expect to recognize this valuation adjustment as part of our second quarter earnings.

All told, we completed five new Horizons investments in the first quarter, all with a direct nexus to our operating businesses, including a focus on improving core processes and/or the consumer experience. That brings us to 21 active investments through Horizons across 18 companies, with over $25 million currently deployed. We also saw two of our Horizons portfolio companies collaborate with one another in the first quarter with the shared goal of enhancing loan-backed digital assets, which should ultimately increase transparency and reduce friction costs over the life of a residential loan. Connecting companies through our ecosystem to transform our markets has been a central tenet of our vision for Horizons and it is exciting to see it play out in practice. Finally, in early April we named a full time Chief Investment Officer for Horizons, a notable step toward solidifying this strategy as a permanent fixture of our unified platform. We’ve since continued the process of hiring dedicated internal resources that will help source, invest, survey, and report on our Horizons investments going forward.

As we head into the second quarter, high anxiety remains prevalent across all aspects of the financial markets, as the ground war in eastern Europe and high inflation continue to drive benchmark rates higher and credit spreads wider. The expected life of in-place residential loans continues to extend as rates rise and refinance options fade, while at the same time the estimated home purchasing power of consumers declines due to higher financing costs and persistently low home inventories that have kept real estate prices high across the country. Much of the associated volatility we believe has already been reflected in market pricing levels; for example, in some cases both Agency and non-Agency MBS have recently traded at levels worse than what we saw at the height of the Covid-19 pandemic. So, as we look for attractive entry points to deploy capital, we’re mindful that accessing quality housing remains an ongoing if not prohibitive challenge for many American households. In this regard, our corporate mission has never been more important, and we remain highly engaged in our markets with a motivated workforce that continues to benefit from greater in-person engagement while navigating the continued effects of the Covid pandemic.

All of this is possible because of the support of our shareholders and our Board of Directors. We’re proud to say that our engagement with shareholders has never been stronger, including through recent outreach around corporate governance and Redwood’s approach to key broader environmental, social and governance (“ESG”) topics. In keeping with this approach, our Board is in a continuous process of
 

image_0.jpg
refreshment – a process that includes on-boarding new directors, as well as continuing education and learning through feedback from stakeholders. While it is a process that brings new expertise, diversity and fresh perspectives to Redwood, it also involves the retirement of directors who have provided many years of exemplary service in overseeing Redwood’s long-term strategic development as it has navigated economic and market cycles and an evolving housing finance landscape. On behalf of the leadership team at Redwood, we’d like to use this space to thank two retiring directors – Richard Baum, Redwood’s independent Board Chair, and Jeffrey Pero, the independent Chair of the Board’s Governance and Nominating Committee – for their dedicated service and leadership at Redwood. And, more personally, we extend our appreciation for the guidance, advice and input they have provided to each of us over the years. All of us have benefited from their experience and counsel and we congratulate both of them on their scheduled retirements upon conclusion of this year’s Annual Meeting of Stockholders in May.


Thank you for your continued support.

q319ceosignaturea01.jpg
q319presidentsignaturea01.jpg
Christopher J. AbateDashiell I. Robinson
Chief Executive OfficerPresident


image_0.jpg
Note to Readers
We file annual reports (on Form 10-K) and quarterly reports (on Form 10-Q) with the Securities and Exchange Commission. These filings, our Redwood Review presentation and our earnings press releases provide information about Redwood and our financial results in accordance with generally accepted accounting principles (GAAP). These documents, as well as information about our business and a glossary of terms we use in this and other publications, are available through our website, www.redwoodtrust.com. We encourage you to review these documents. Within this document, in addition to our GAAP results, we may also present certain non-GAAP measures. When we present a non-GAAP measure, we provide a description of that measure and a reconciliation to the comparable GAAP measure within the Non-GAAP Measurement section of the Endnotes to the Redwood Review, which can be found on our website, www.redwoodtrust.com, under “Financials” within the “Investor Relations” Section. References herein to “Redwood,” the “company,” “we,” “us,” and “our” include Redwood Trust, Inc. and its consolidated subsidiaries. Note that because we generally round numbers in the tables to millions, except per share amounts, some numbers may not foot due to rounding. References to the “first quarter” refer to the quarter ended March 31, 2022, and references to the “fourth quarter” refer to the quarter ended December 31, 2021, unless otherwise specified.

Forward-looking statements
This shareholder letter may contain forward-looking statements within the meaning of the safe harbor provisions of the Private Securities Litigation Reform Act of 1995. Forward-looking statements involve numerous risks and uncertainties. Our actual results may differ from our expectations, estimates, and projections and, consequently, you should not rely on these forward-looking statements as predictions of future events. Forward-looking statements are not historical in nature and can be identified by words such as “anticipate,” “estimate,” “will,” “should,” “expect,” “believe,” “intend,” “seek,” “plan,” "could" and similar expressions or their negative forms, or by references to strategy, plans, goals, or intentions. These forward-looking statements are subject to risks and uncertainties, including, among other things, those described in our Annual Report on Form 10-K under the caption “Risk Factors.” Other risks, uncertainties, and factors that could cause actual results to differ materially from those projected are described below and may be described from time to time in reports we file with the Securities and Exchange Commission, including reports on Forms 10-K, 10-Q, and 8-K. We undertake no obligation to update or revise forward-looking statements, whether as a result of new information, future events, or otherwise. Statements regarding the following subjects, among others, are forward-looking by their nature: statements we make regarding Redwood’s business strategy and strategic focus, statements related to our financial outlook and expectations for 2022 and future years, statements regarding our available capital and sourcing additional capital both internally and from the capital markets, and other statements regarding pending business activities and expectations and estimates relating to our business and financial results. Additional detail regarding the forward-looking statements in this shareholder letter and the important factors that may affect our actual results in 2022 are described in the Redwood Review under the heading “Forward-Looking Statements”, which can be found on our website, www.redwoodtrust.com, under “Financials” within the “Investor Relations” Section.








image_02.jpg

1 Q1 2022 Redwood Review April 28, 2022 Exhibit 99.3


2 Forward Looking Statements This presentation contains forward-looking statements, including statements regarding our 2022 forward outlook, statements related to increasing our market share of BPL origination, and estimates of upside and potential earnings in our investment portfolio from embedded discounts to par value on securities, and securitization transactions that could become callable through 2024. Forward-looking statements involve numerous risks and uncertainties. Our actual results may differ from our beliefs, expectations, estimates, and projections and, consequently, you should not rely on these forward-looking statements as predictions of future events. Forward- looking statements are not historical in nature and can be identified by words such as “anticipate,” “estimate,” “will,” “should,” “expect,” “believe,” “intend,” “seek,” “plan” and similar expressions or their negative forms, or by references to strategy, plans, or intentions. These forward-looking statements are subject to risks and uncertainties, including, among other things, those described in the Company’s Annual Report on Form 10-K for the year ended December 31, 2021 and any subsequent Quarterly Reports on Form 10-Q and Annual Reports on Form 10-K under the caption “Risk Factors.” Other risks, uncertainties, and factors that could cause actual results to differ materially from those projected may be described from time to time in reports the Company files with the Securities and Exchange Commission, including reports on Form 8-K. Additionally, this presentation contains estimates and information concerning our industry, including market size and growth rates of the markets in which we participate, that are based on industry publications and reports. This information involves many assumptions and limitations, and you are cautioned not to give undue weight to these estimates. We have not independently verified the accuracy or completeness of the data contained in these industry publications and reports. The industry in which we operate is subject to a high degree of uncertainty and risk due to a variety of factors, including those referred to above, that could cause results to differ materially from those expressed in these publications and reports.


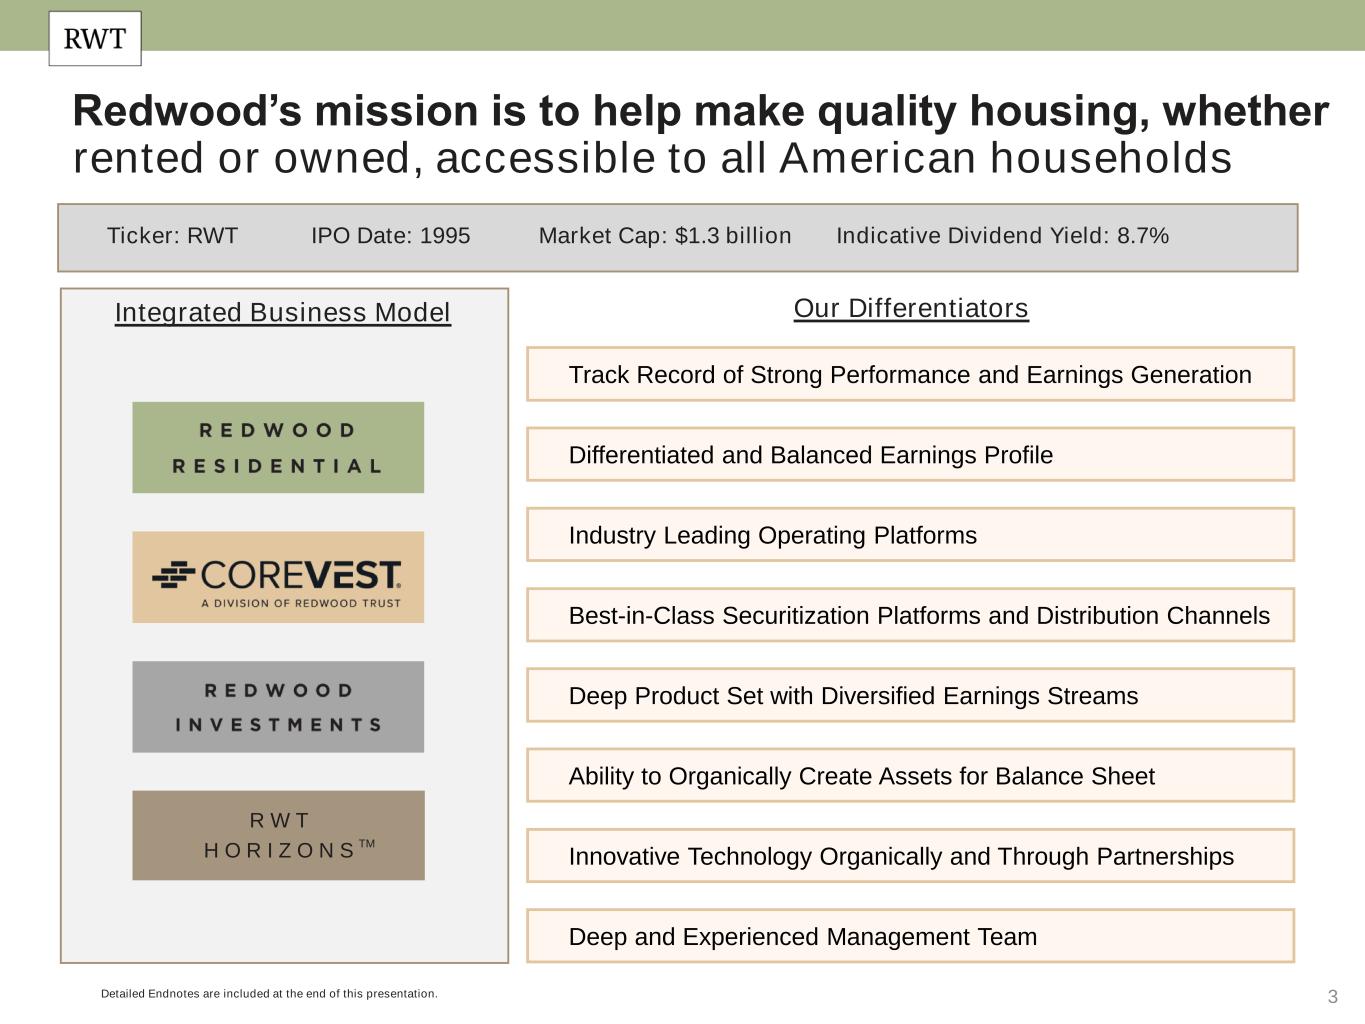
3 Redwood’s mission is to help make quality housing, whether rented or owned, accessible to all American households R W T H O R I Z O N S Innovative Technology Organically and Through Partnerships Industry Leading Operating Platforms Ability to Organically Create Assets for Balance Sheet Best-in-Class Securitization Platforms and Distribution Channels Differentiated and Balanced Earnings Profile Integrated Business Model Our Differentiators Deep Product Set with Diversified Earnings Streams Track Record of Strong Performance and Earnings Generation Deep and Experienced Management Team Ticker: RWT IPO Date: 1995 Market Cap: $1.3 billion Indicative Dividend Yield: 8.7% Detailed Endnotes are included at the end of this presentation. TM

 
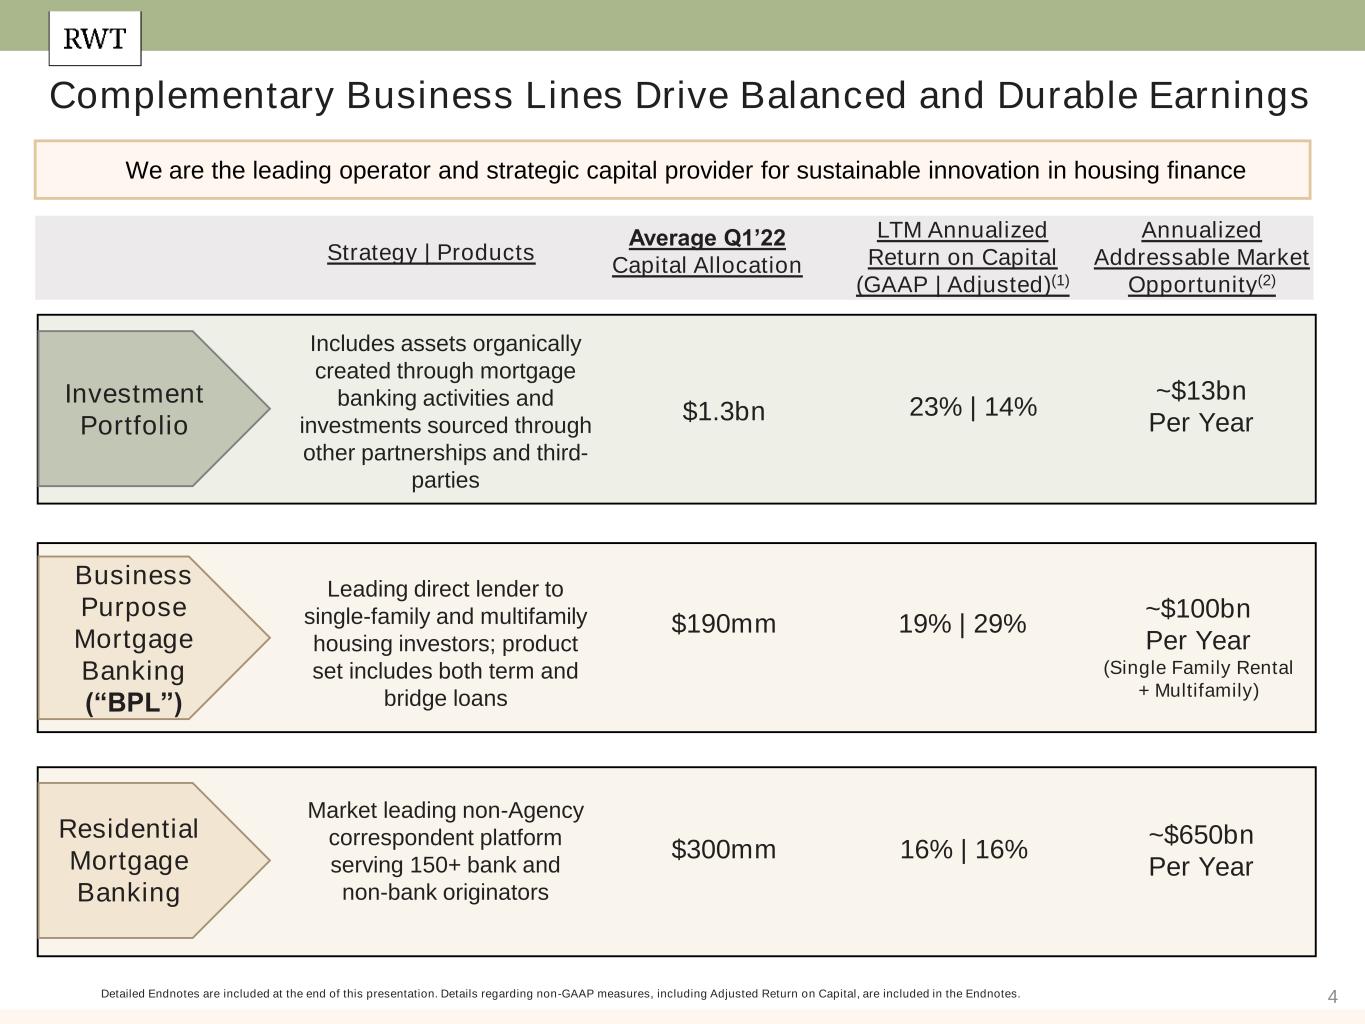
4Detailed Endnotes are included at the end of this presentation. Details regarding non-GAAP measures, including Adjusted Return on Capital, are included in the Endnotes. Business Purpose Mortgage Banking (“BPL”) Strategy | Products Average Q1’22 Capital Allocation Annualized Addressable Market Opportunity(2) ~$100bn Per Year (Single Family Rental + Multifamily) Leading direct lender to single-family and multifamily housing investors; product set includes both term and bridge loans Complementary Business Lines Drive Balanced and Durable Earnings LTM Annualized Return on Capital (GAAP | Adjusted)(1) $190mm 19% | 29% Residential Mortgage Banking $300mm ~$650bn Per Year Market leading non-Agency correspondent platform serving 150+ bank and non-bank originators 16% | 16% We are the leading operator and strategic capital provider for sustainable innovation in housing finance Investment Portfolio Includes assets organically created through mortgage banking activities and investments sourced through other partnerships and third- parties $1.3bn 23% | 14% ~$13bn Per Year

 
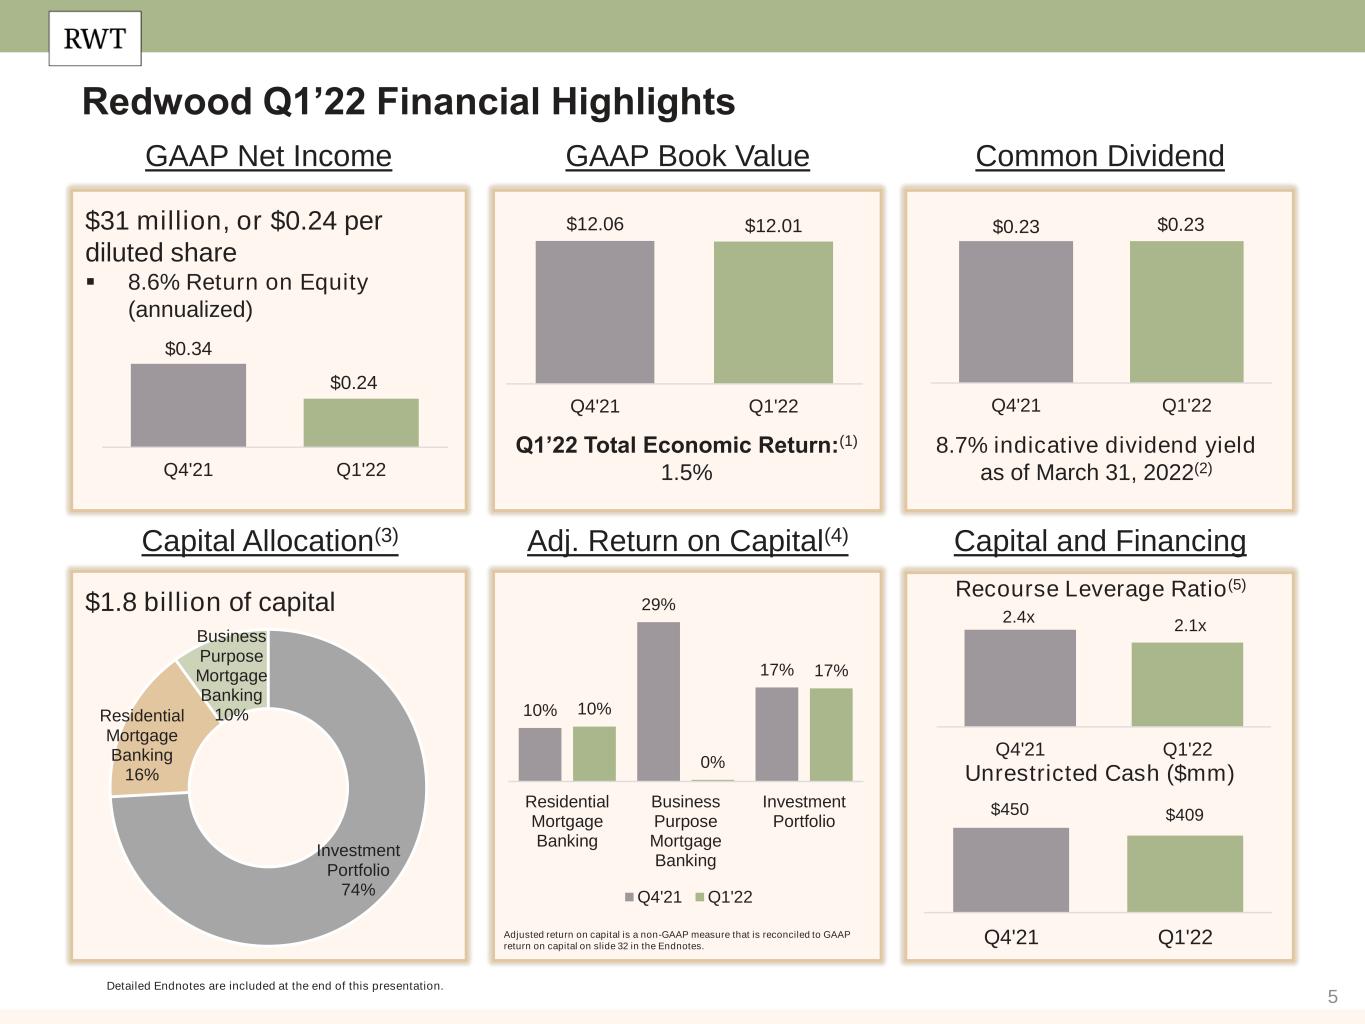
5 Redwood Q1’22 Financial Highlights $31 million, or $0.24 per diluted share ▪ 8.6% Return on Equity (annualized) $1.8 billion of capital Detailed Endnotes are included at the end of this presentation. GAAP Net Income GAAP Book Value Common Dividend Capital Allocation(3) Adj. Return on Capital(4) Capital and Financing Recourse Leverage Ratio(5) Unrestricted Cash ($mm) $12.06 $12.01 Q4'21 Q1'22 $0.23 $0.23 Q4'21 Q1'22 $0.34 $0.24 Q4'21 Q1'22 2.4x 2.1x Q4'21 Q1'22 10% 29% 17% 10% 0% 17% Residential Mortgage Banking Business Purpose Mortgage Banking Investment Portfolio Q4'21 Q1'22 $450 $409 Q4'21 Q1'22 Investment Portfolio 74% Residential Mortgage Banking 16% Business Purpose Mortgage Banking 10% Q1’22 Total Economic Return:(1) 1.5% 8.7% indicative dividend yield as of March 31, 2022(2) Adjusted return on capital is a non-GAAP measure that is reconciled to GAAP return on capital on slide 32 in the Endnotes.

 
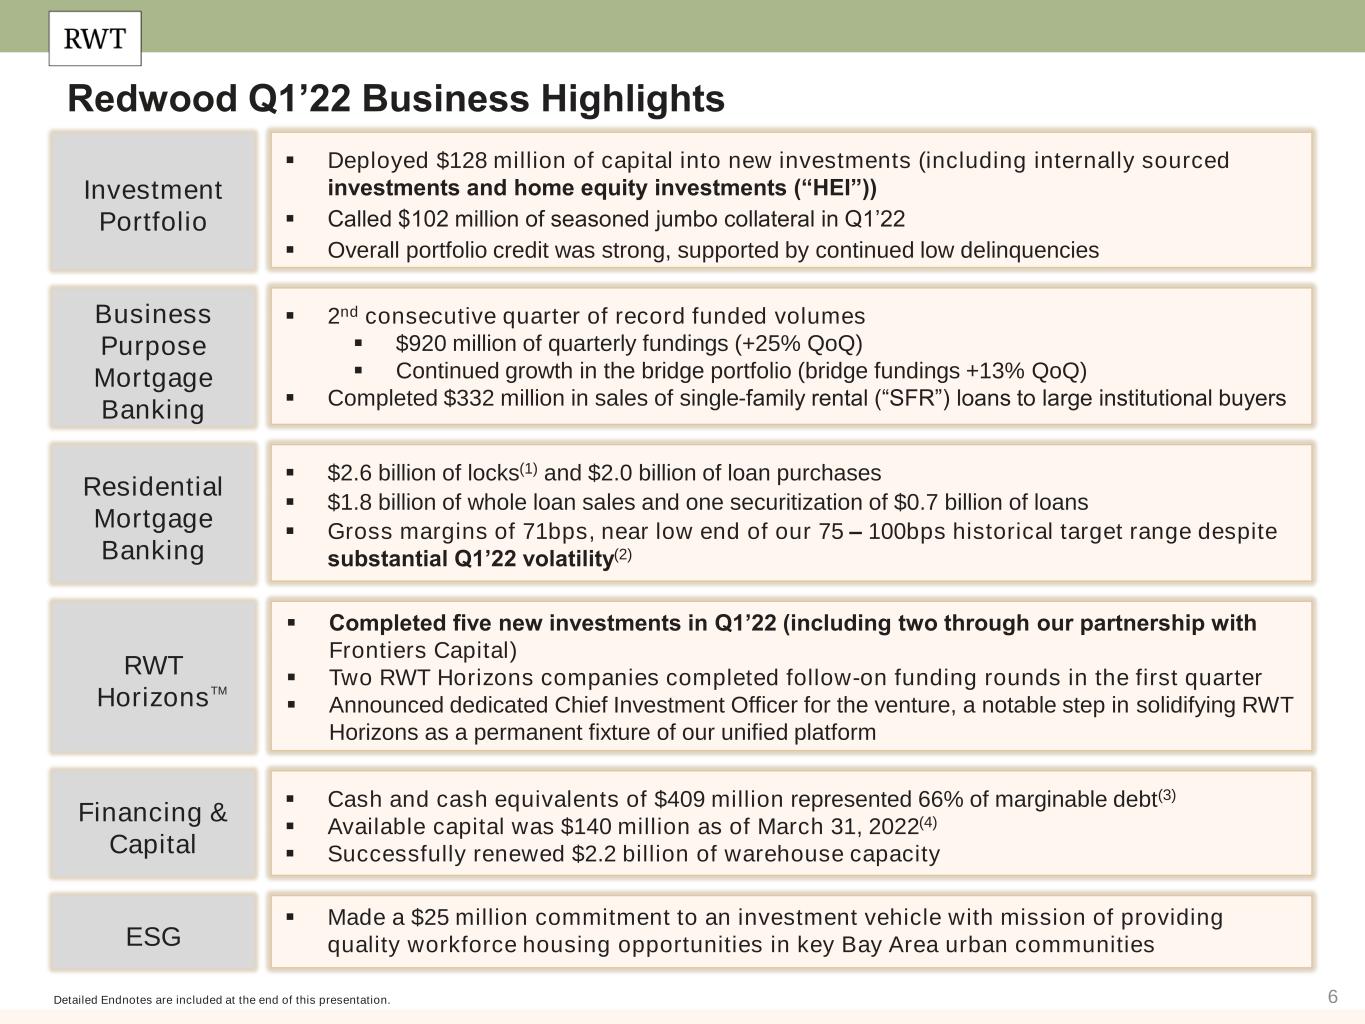
6 Redwood Q1’22 Business Highlights Detailed Endnotes are included at the end of this presentation. ▪ $2.6 billion of locks(1) and $2.0 billion of loan purchases ▪ $1.8 billion of whole loan sales and one securitization of $0.7 billion of loans ▪ Gross margins of 71bps, near low end of our 75 – 100bps historical target range despite substantial Q1’22 volatility(2) Residential Mortgage Banking ▪ Cash and cash equivalents of $409 million represented 66% of marginable debt(3) ▪ Available capital was $140 million as of March 31, 2022(4) ▪ Successfully renewed $2.2 billion of warehouse capacity RWT Horizons Financing & Capital ▪ Made a $25 million commitment to an investment vehicle with mission of providing quality workforce housing opportunities in key Bay Area urban communitiesESG ▪ 2nd consecutive quarter of record funded volumes ▪ $920 million of quarterly fundings (+25% QoQ) ▪ Continued growth in the bridge portfolio (bridge fundings +13% QoQ) ▪ Completed $332 million in sales of single-family rental (“SFR”) loans to large institutional buyers Business Purpose Mortgage Banking TM ▪ Deployed $128 million of capital into new investments (including internally sourced investments and home equity investments (“HEI”)) ▪ Called $102 million of seasoned jumbo collateral in Q1’22 ▪ Overall portfolio credit was strong, supported by continued low delinquencies Investment Portfolio ▪ Completed five new investments in Q1’22 (including two through our partnership with Frontiers Capital) ▪ Two RWT Horizons companies completed follow-on funding rounds in the first quarter ▪ Announced dedicated Chief Investment Officer for the venture, a notable step in solidifying RWT Horizons as a permanent fixture of our unified platform
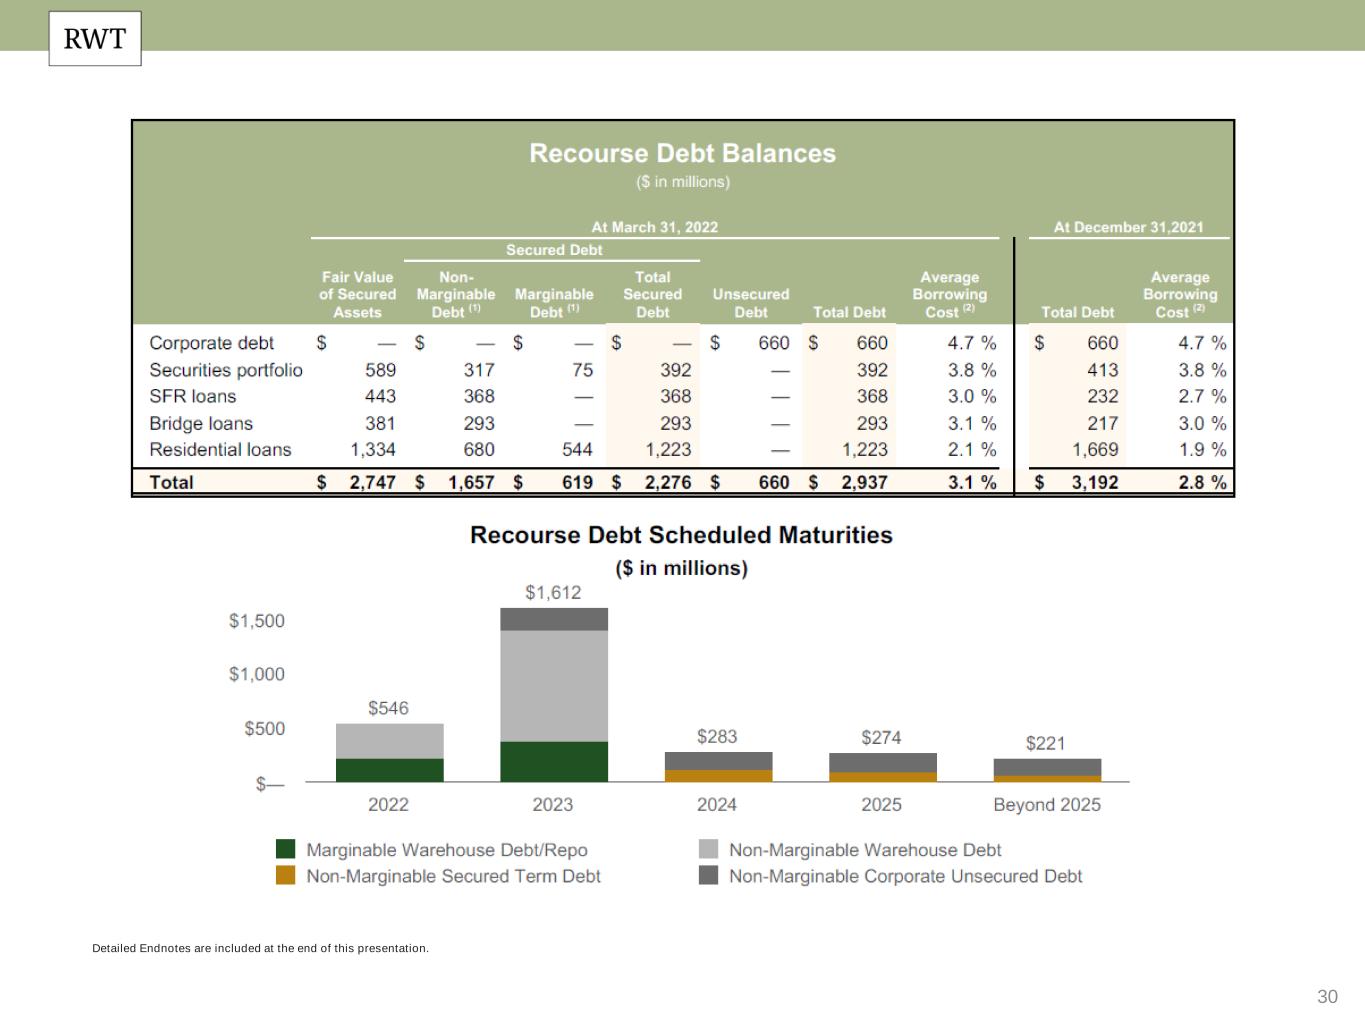

 
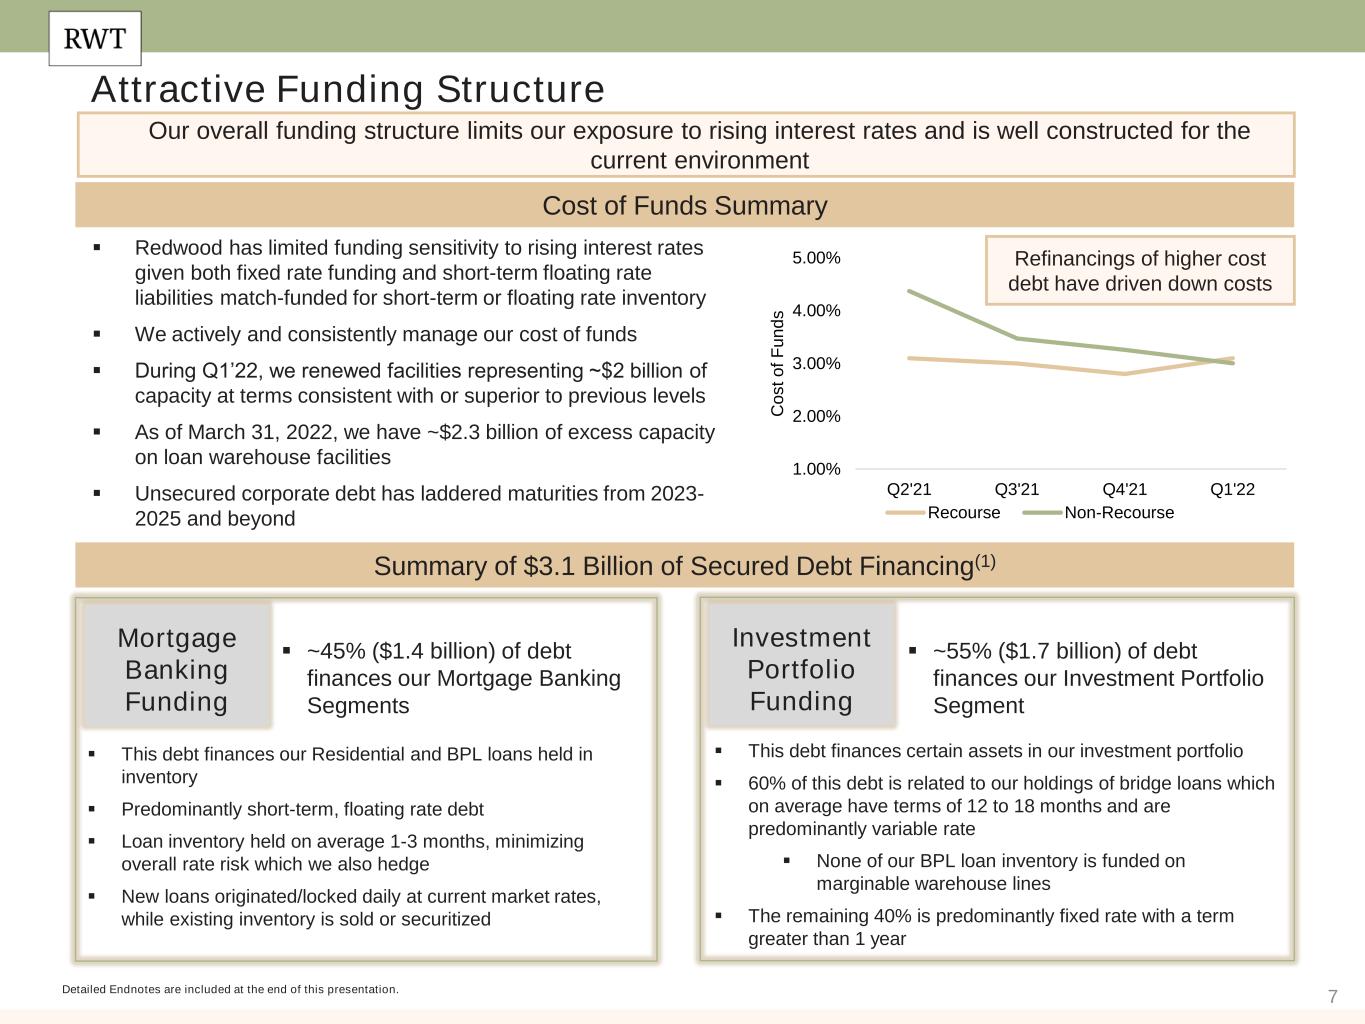
7 1.00% 2.00% 3.00% 4.00% 5.00% Q2'21 Q3'21 Q4'21 Q1'22 C o s t o f F u n d s Recourse Non-Recourse Attractive Funding Structure Our overall funding structure limits our exposure to rising interest rates and is well constructed for the current environment Cost of Funds Summary ▪ Redwood has limited funding sensitivity to rising interest rates given both fixed rate funding and short-term floating rate liabilities match-funded for short-term or floating rate inventory ▪ We actively and consistently manage our cost of funds ▪ During Q1’22, we renewed facilities representing ~$2 billion of capacity at terms consistent with or superior to previous levels ▪ As of March 31, 2022, we have ~$2.3 billion of excess capacity on loan warehouse facilities ▪ Unsecured corporate debt has laddered maturities from 2023- 2025 and beyond Summary of $3.1 Billion of Secured Debt Financing(1) ▪ This debt finances our Residential and BPL loans held in inventory ▪ Predominantly short-term, floating rate debt ▪ Loan inventory held on average 1-3 months, minimizing overall rate risk which we also hedge ▪ New loans originated/locked daily at current market rates, while existing inventory is sold or securitized Mortgage Banking Funding ▪ ~45% ($1.4 billion) of debt finances our Mortgage Banking Segments ▪ This debt finances certain assets in our investment portfolio ▪ 60% of this debt is related to our holdings of bridge loans which on average have terms of 12 to 18 months and are predominantly variable rate ▪ None of our BPL loan inventory is funded on marginable warehouse lines ▪ The remaining 40% is predominantly fixed rate with a term greater than 1 year Investment Portfolio Funding ▪ ~55% ($1.7 billion) of debt finances our Investment Portfolio Segment Detailed Endnotes are included at the end of this presentation. Refinancings of higher cost debt have driven down costs


 
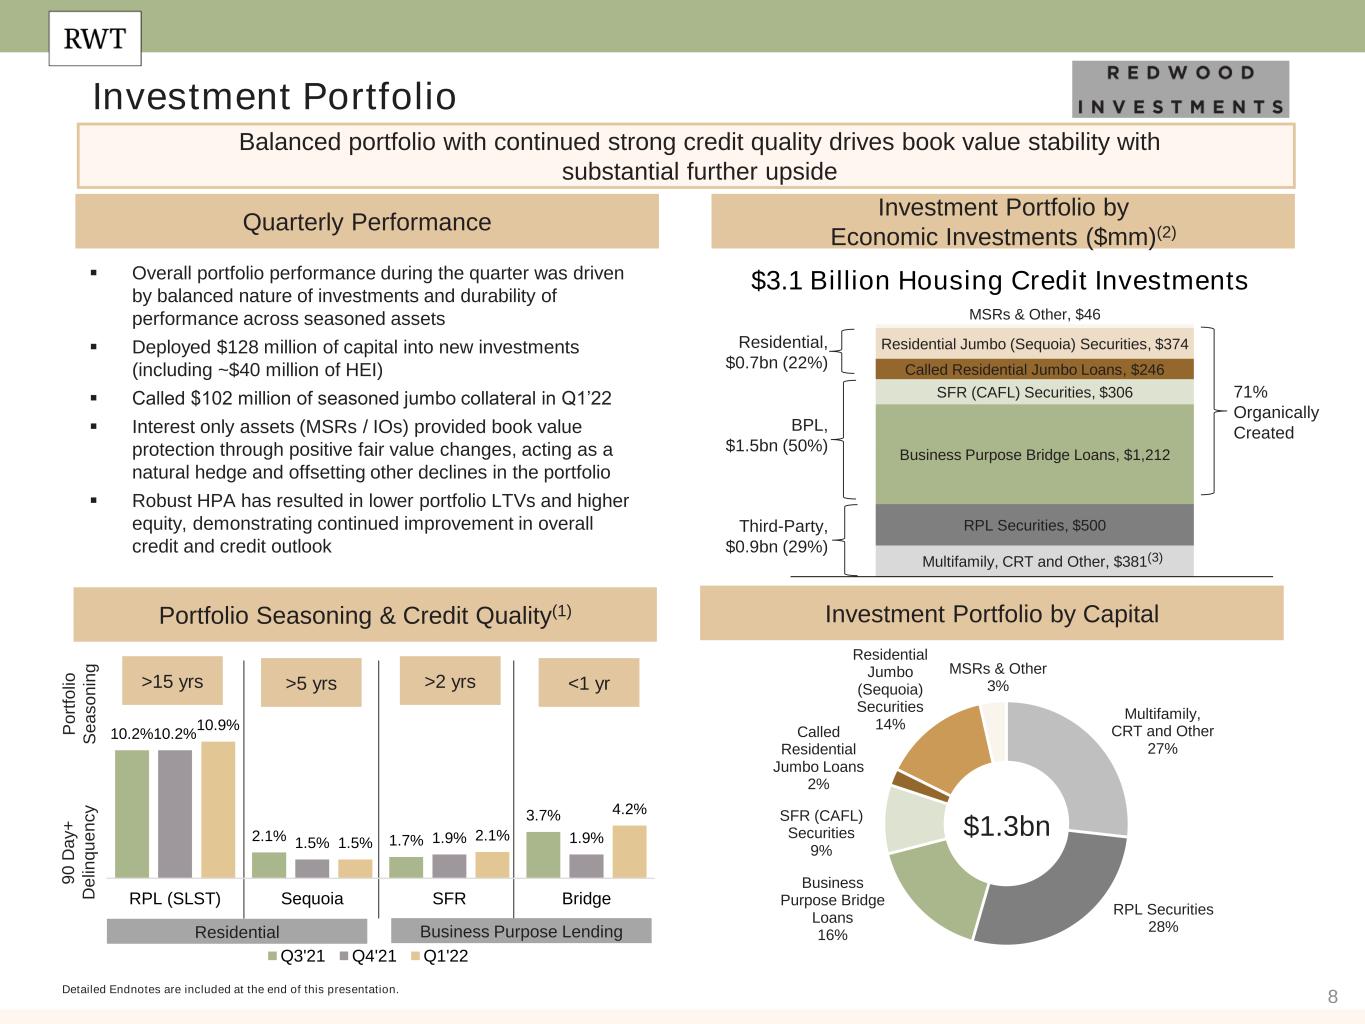
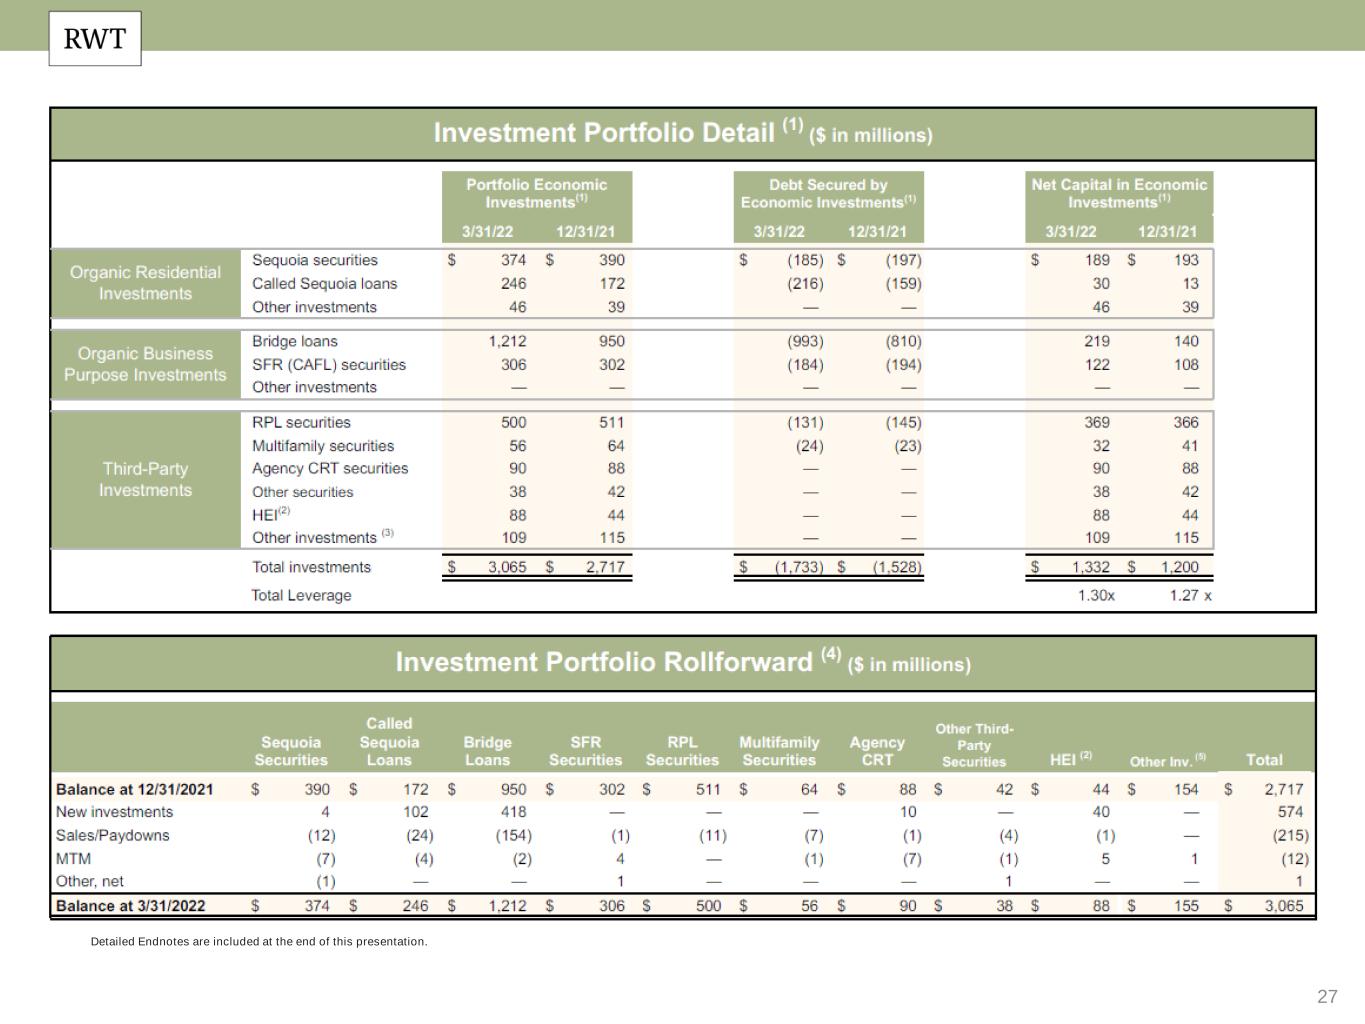
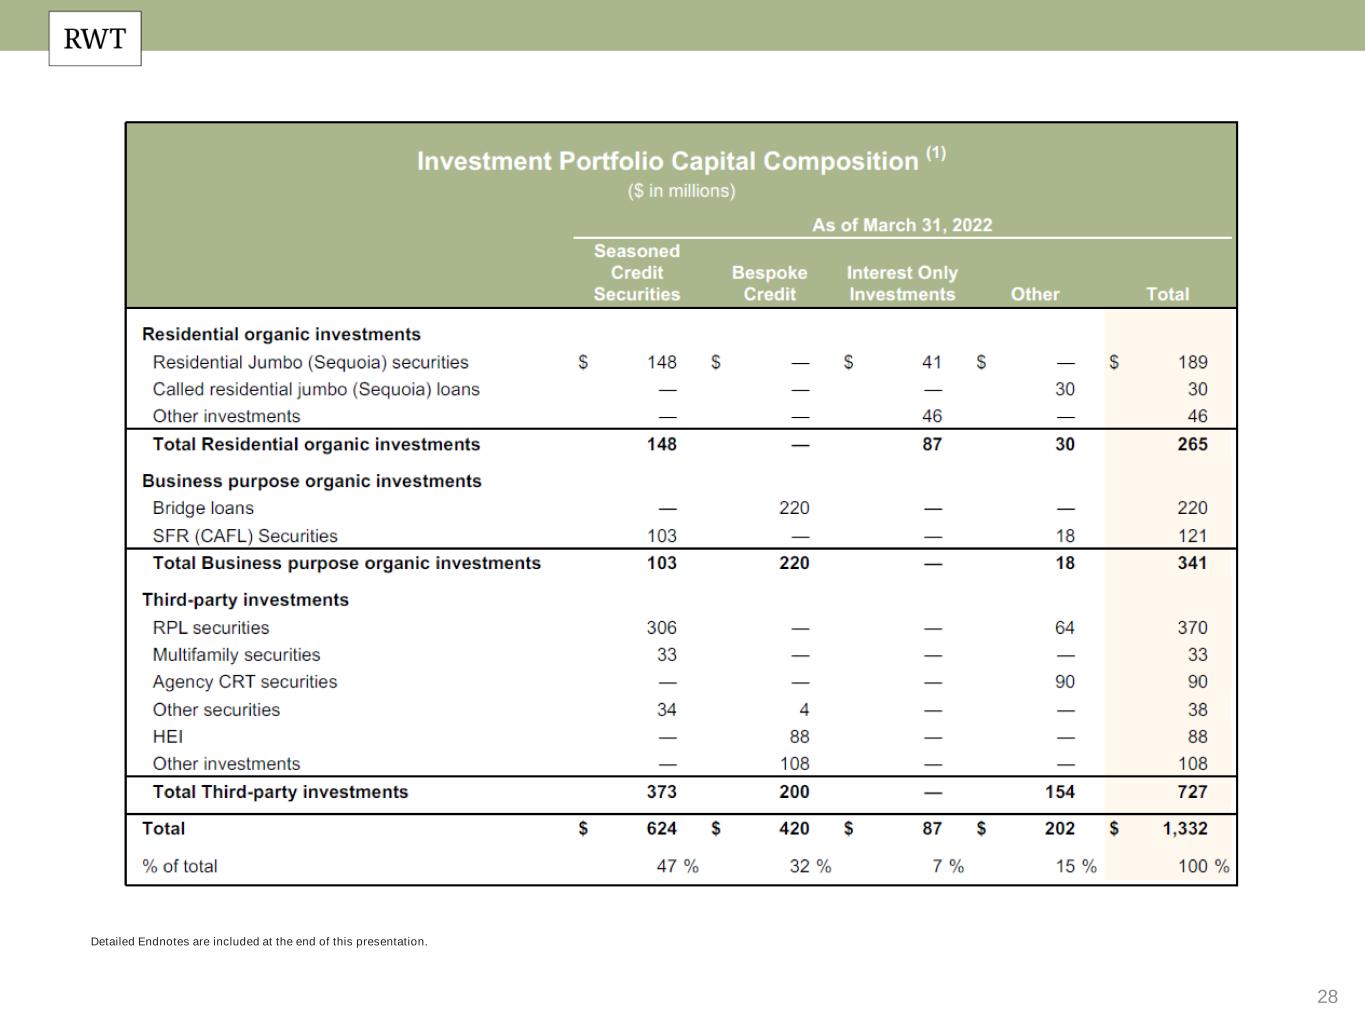
8 Multifamily, CRT and Other, $381 RPL Securities, $500 Business Purpose Bridge Loans, $1,212 SFR (CAFL) Securities, $306 Called Residential Jumbo Loans, $246 Residential Jumbo (Sequoia) Securities, $374 MSRs & Other, $46 Multifamily, CRT and Other 27% RPL Securities 28% Business Purpose Bridge Loans 16% SFR (CAFL) Securities 9% Called Residential Jumbo Loans 2% Residential Jumbo (Sequoia) Securities 14% MSRs & Other 3% Investment Portfolio Investment Portfolio by Economic Investments ($mm)(2)Quarterly Performance ▪ Overall portfolio performance during the quarter was driven by balanced nature of investments and durability of performance across seasoned assets ▪ Deployed $128 million of capital into new investments (including ~$40 million of HEI) ▪ Called $102 million of seasoned jumbo collateral in Q1’22 ▪ Interest only assets (MSRs / IOs) provided book value protection through positive fair value changes, acting as a natural hedge and offsetting other declines in the portfolio ▪ Robust HPA has resulted in lower portfolio LTVs and higher equity, demonstrating continued improvement in overall credit and credit outlook $3.1 Billion Housing Credit Investments 71% Organically Created Detailed Endnotes are included at the end of this presentation. 9 0 D a y + D e lin q u e n c y Portfolio Seasoning & Credit Quality(1) Balanced portfolio with continued strong credit quality drives book value stability with substantial further upside Investment Portfolio by Capital $1.3bn Third-Party, $0.9bn (29%) BPL, $1.5bn (50%) Residential, $0.7bn (22%) P o rt fo lio S e a s o n in g >2 yrs>15 yrs <1 yr>5 yrs 10.2% 2.1% 1.7% 3.7% 10.2% 1.5% 1.9% 1.9% 10.9% 1.5% 2.1% 4.2% RPL (SLST) Sequoia SFR Bridge Q3'21 Q4'21 Q1'22 Residential Business Purpose Lending (3)


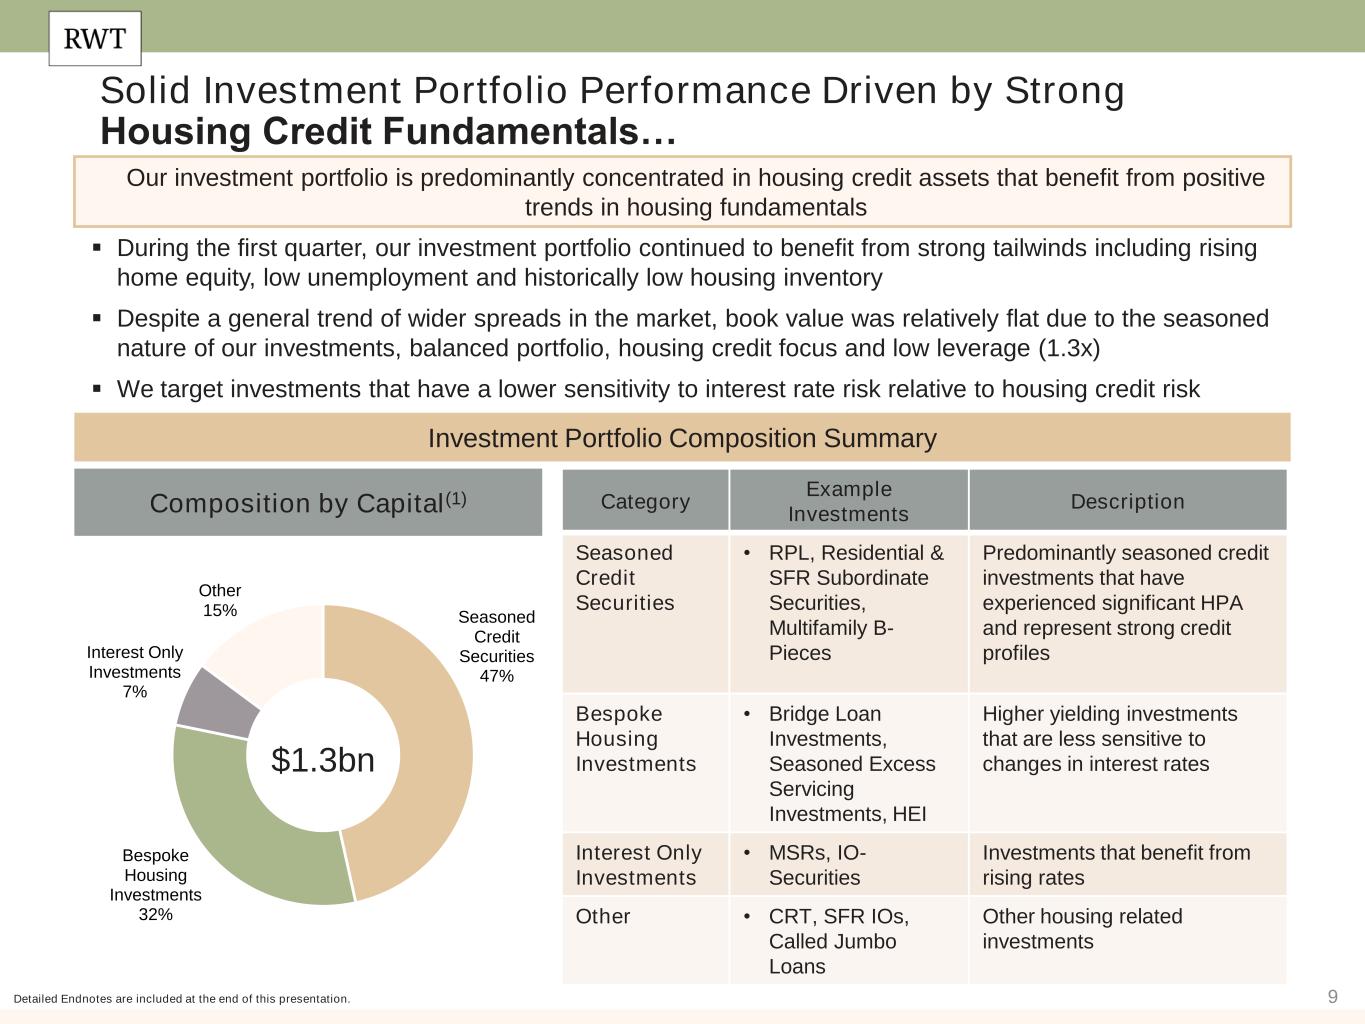
9 Solid Investment Portfolio Performance Driven by Strong Housing Credit Fundamentals… Detailed Endnotes are included at the end of this presentation. Our investment portfolio is predominantly concentrated in housing credit assets that benefit from positive trends in housing fundamentals ▪ During the first quarter, our investment portfolio continued to benefit from strong tailwinds including rising home equity, low unemployment and historically low housing inventory ▪ Despite a general trend of wider spreads in the market, book value was relatively flat due to the seasoned nature of our investments, balanced portfolio, housing credit focus and low leverage (1.3x) ▪ We target investments that have a lower sensitivity to interest rate risk relative to housing credit risk Investment Portfolio Composition Summary Category Example Investments Description Seasoned Credit Securities • RPL, Residential & SFR Subordinate Securities, Multifamily B- Pieces Predominantly seasoned credit investments that have experienced significant HPA and represent strong credit profiles Bespoke Housing Investments • Bridge Loan Investments, Seasoned Excess Servicing Investments, HEI Higher yielding investments that are less sensitive to changes in interest rates Interest Only Investments • MSRs, IO- Securities Investments that benefit from rising rates Other • CRT, SFR IOs, Called Jumbo Loans Other housing related investments Composition by Capital(1) $1.3bn Seasoned Credit Securities 47% Bespoke Housing Investments 32% Interest Only Investments 7% Other 15%


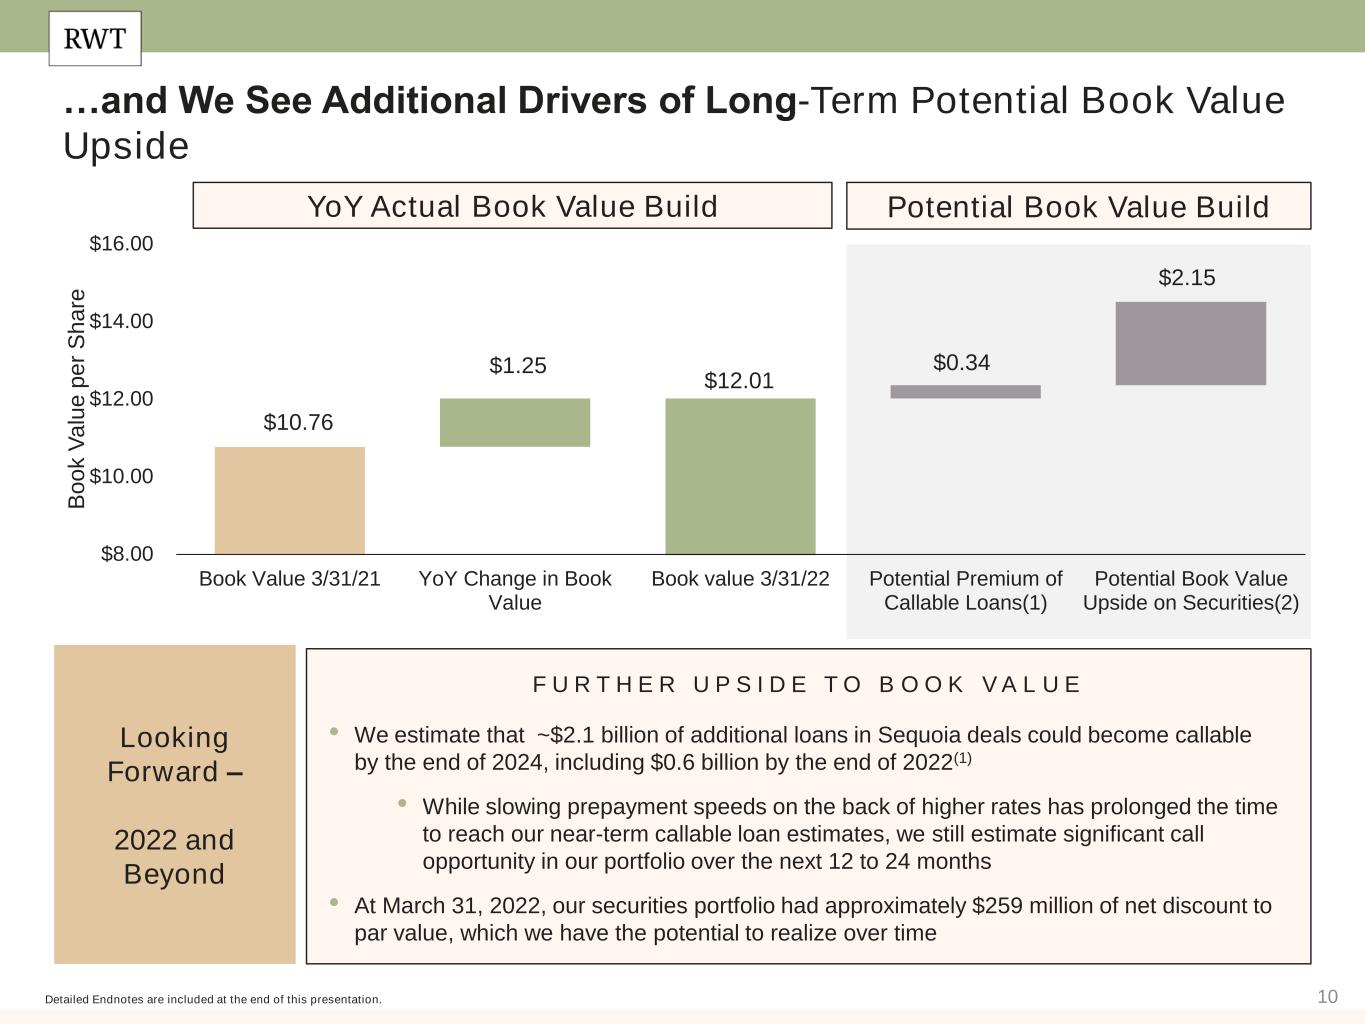
10 $10.76 $1.25 $12.01 $0.34 $2.15 $8.00 $10.00 $12.00 $14.00 $16.00 Book Value 3/31/21 YoY Change in Book Value Book value 3/31/22 Potential Premium of Callable Loans(1) Potential Book Value Upside on Securities(2) B o o k V a lu e p e r S h a re YoY Actual Book Value Build Detailed Endnotes are included at the end of this presentation. Potential Book Value Build F U R T H E R U P S I D E T O B O O K V A L U E • We estimate that ~$2.1 billion of additional loans in Sequoia deals could become callable by the end of 2024, including $0.6 billion by the end of 2022(1) • While slowing prepayment speeds on the back of higher rates has prolonged the time to reach our near-term callable loan estimates, we still estimate significant call opportunity in our portfolio over the next 12 to 24 months • At March 31, 2022, our securities portfolio had approximately $259 million of net discount to par value, which we have the potential to realize over time Looking Forward – 2022 and Beyond …and We See Additional Drivers of Long-Term Potential Book Value Upside


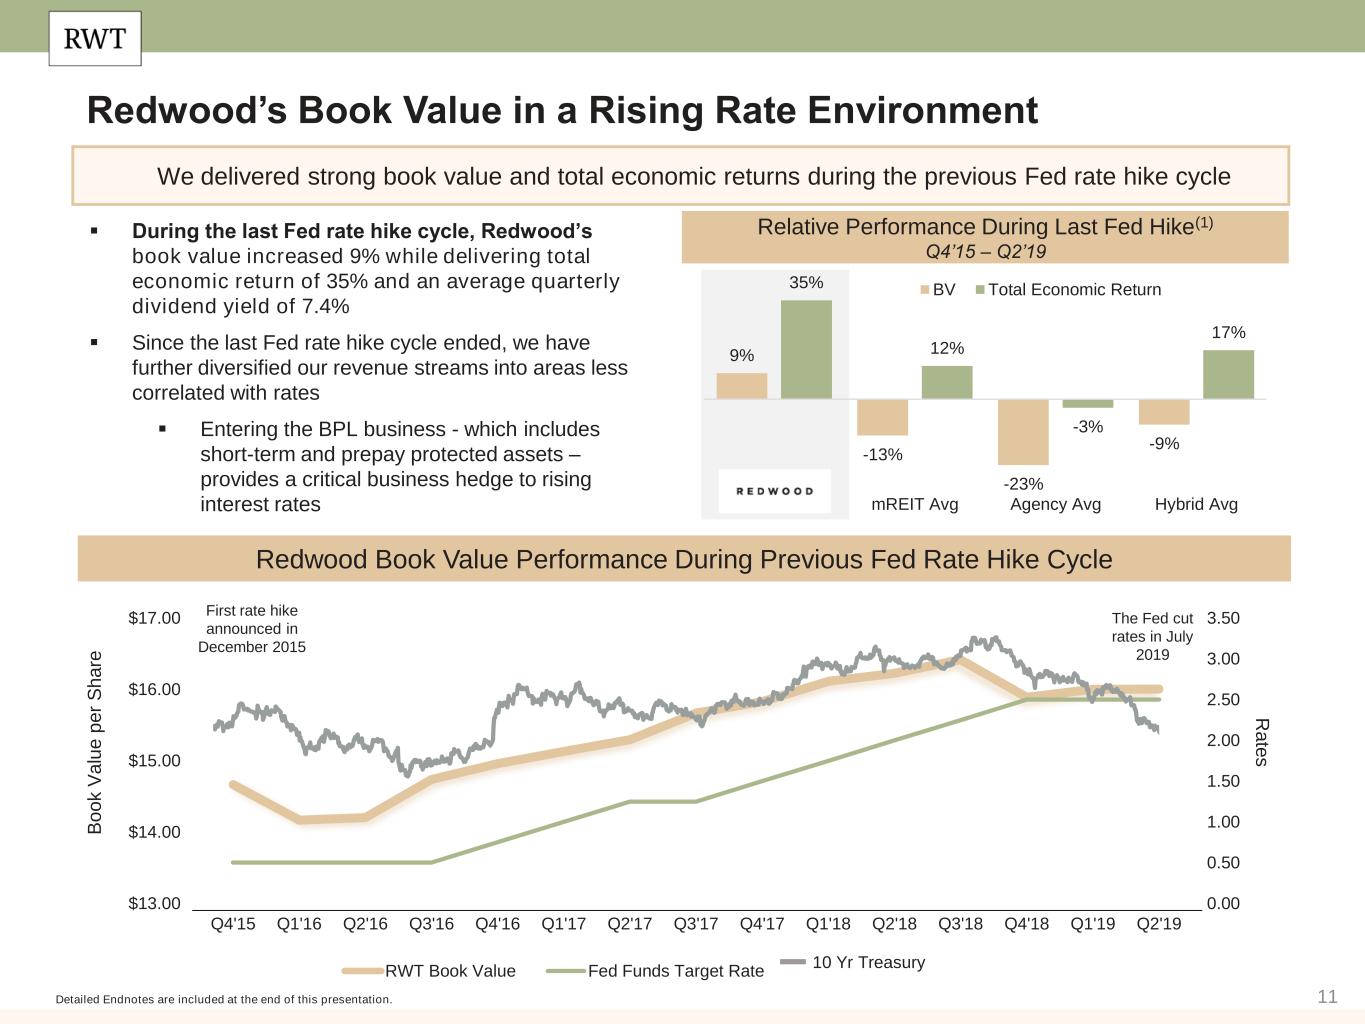
11 Redwood’s Book Value in a Rising Rate Environment Detailed Endnotes are included at the end of this presentation. ▪ During the last Fed rate hike cycle, Redwood’s book value increased 9% while delivering total economic return of 35% and an average quarterly dividend yield of 7.4% ▪ Since the last Fed rate hike cycle ended, we have further diversified our revenue streams into areas less correlated with rates ▪ Entering the BPL business - which includes short-term and prepay protected assets – provides a critical business hedge to rising interest rates RWT Book Value Performance During Previous Fed Hike Cycle B o o k V a lu e p e r S h a re 0.00 0.50 1.00 1.50 2.00 2.50 3.00 3.50 $13.00 $14.00 $15.00 $16.00 $17.00 Q4'15 Q1'16 Q2'16 Q3'16 Q4'16 Q1'17 Q2'17 Q3'17 Q4'17 Q1'18 Q2'18 Q3'18 Q4'18 Q1'19 Q2'19 RWT Book Value Fed Funds Target Rate First rate hike announced in December 2015 The Fed cut rates in July 2019 Redwood ook alue erfor ance uring revious ed Rat Hike Cycle 10 Yr Treasury We delivered strong book value and total economic returns during the previous Fed rate hike cycle Relative Performance During Last Fed Hike(1) Q4’15 – Q2’19 9% -13% -23% -9% 35% 12% -3% 17% Redwood mREIT Avg Agency Avg Hybrid Avg BV Total Economic Return R a te s


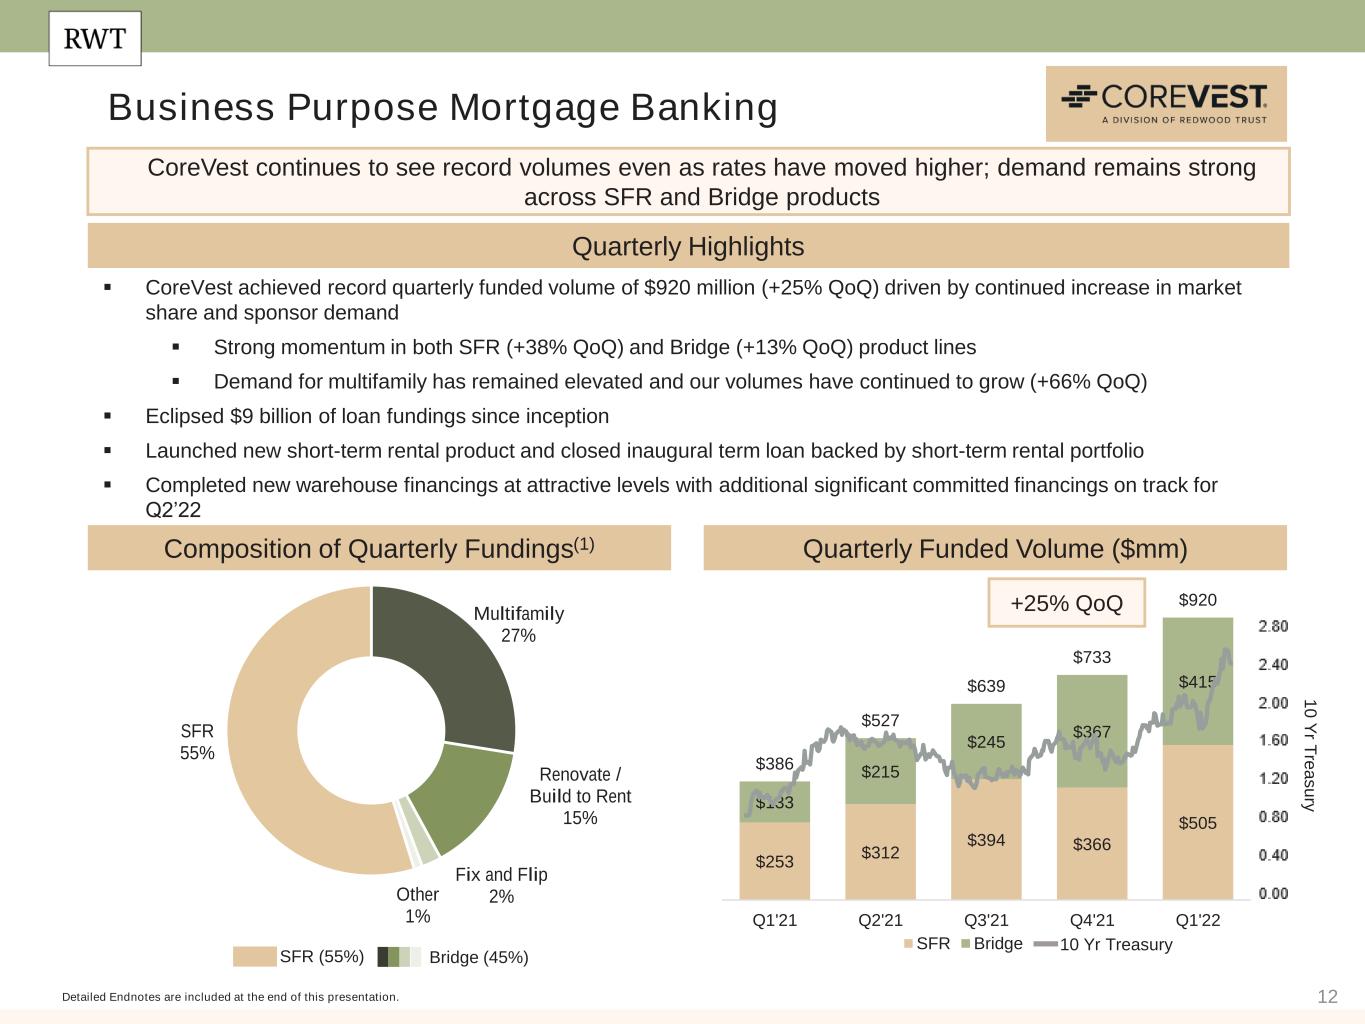
12 Multifamily 27% Renovate / Build to Rent 15% Fix and Flip 2%Other 1% SFR 55% Business Purpose Mortgage Banking Quarterly Highlights Composition of Quarterly Fundings(1) Detailed Endnotes are included at the end of this presentation. ▪ CoreVest achieved record quarterly funded volume of $920 million (+25% QoQ) driven by continued increase in market share and sponsor demand ▪ Strong momentum in both SFR (+38% QoQ) and Bridge (+13% QoQ) product lines ▪ Demand for multifamily has remained elevated and our volumes have continued to grow (+66% QoQ) ▪ Eclipsed $9 billion of loan fundings since inception ▪ Launched new short-term rental product and closed inaugural term loan backed by short-term rental portfolio ▪ Completed new warehouse financings at attractive levels with additional significant committed financings on track for Q2’22 CoreVest continues to see record volumes even as rates have moved higher; demand remains strong across SFR and Bridge products 10 Yr Treasury 1 0 Y r T re a s u ry $253 $312 $394 $366 $505 $133 $215 $245 $367 $415 $386 $527 $639 $733 $920 Q1'21 Q2'21 Q3'21 Q4'21 Q1'22 SFR Bridge Quarterly Funded Volume ($mm) SFR (55%) Bridge (45%) +25% QoQ


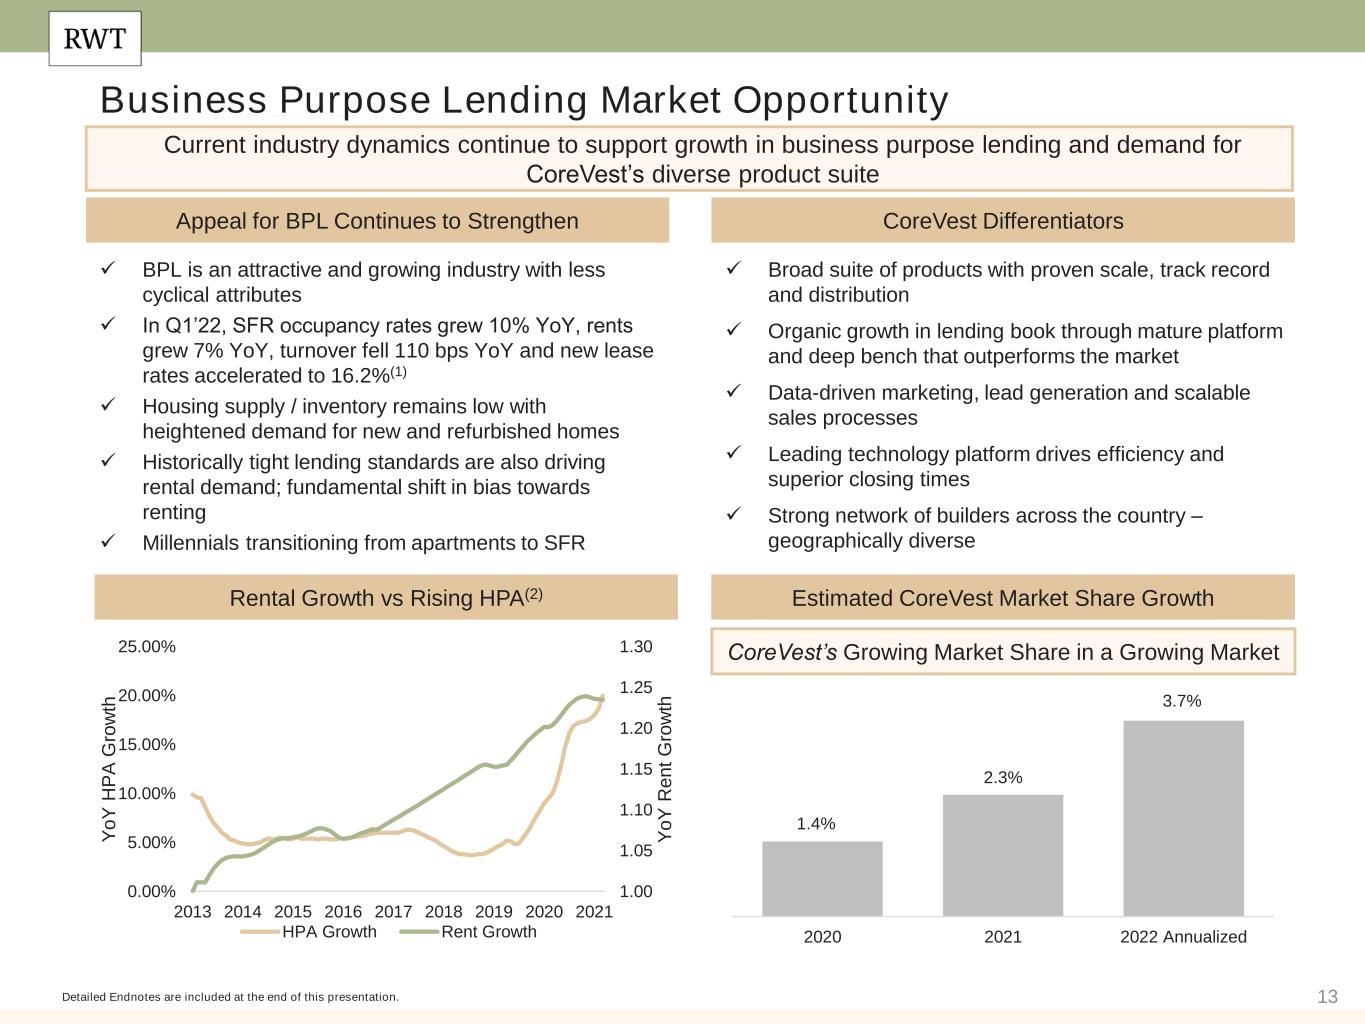
13 Business Purpose Lending Market Opportunity CoreVest DifferentiatorsAppeal for BPL Continues to Strengthen ✓ Broad suite of products with proven scale, track record and distribution ✓ Organic growth in lending book through mature platform and deep bench that outperforms the market ✓ Data-driven marketing, lead generation and scalable sales processes ✓ Leading technology platform drives efficiency and superior closing times ✓ Strong network of builders across the country – geographically diverse Estimated CoreVest Market Share Growth Detailed Endnotes are included at the end of this presentation. Current industry dynamics continue to support growth in business purpose lending and demand for CoreVest’s diverse product suite Rental Growth vs Rising HPA(2) CoreVest’s Growing Market Share in a Growing Market ✓ BPL is an attractive and growing industry with less cyclical attributes ✓ In Q1’22, SFR occupancy rates grew 10% YoY, rents grew 7% YoY, turnover fell 110 bps YoY and new lease rates accelerated to 16.2%(1) ✓ Housing supply / inventory remains low with heightened demand for new and refurbished homes ✓ Historically tight lending standards are also driving rental demand; fundamental shift in bias towards renting ✓ Millennials transitioning from apartments to SFR 1.00 1.05 1.10 1.15 1.20 1.25 1.30 0.00% 5.00% 10.00% 15.00% 20.00% 25.00% 2013 2014 2015 2016 2017 2018 2019 2020 2021 Y o Y R e n t G ro w th Y o Y H P A G ro w th HPA Growth Rent Growth 1.4% 2.3% 3.7% 2020 2021 2022 Annualized


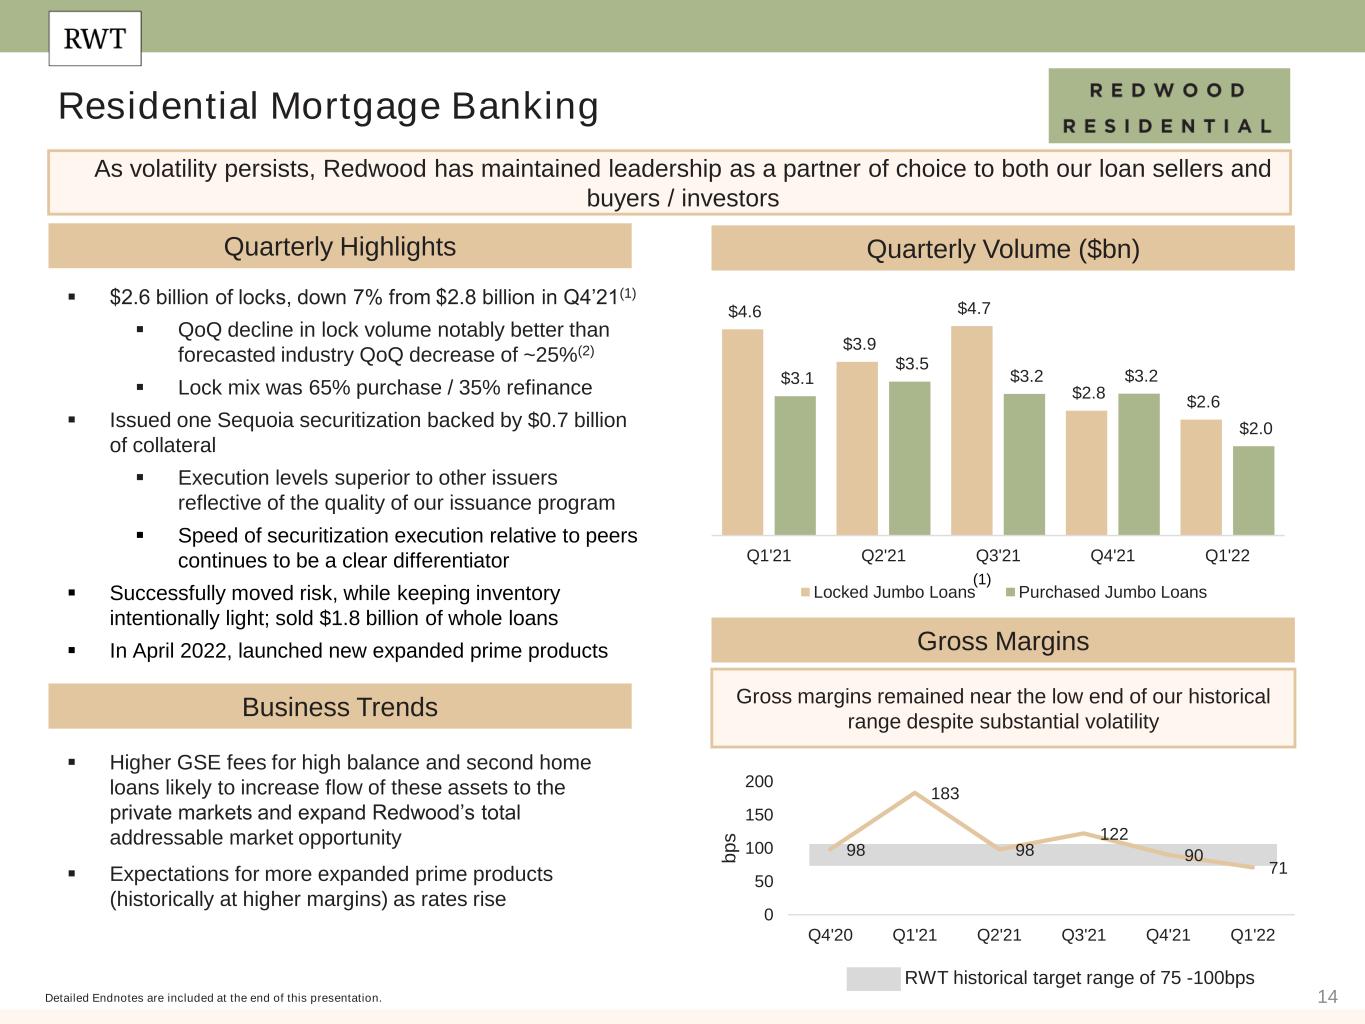
14 $4.6 $3.9 $4.7 $2.8 $2.6 $3.1 $3.5 $3.2 $3.2 $2.0 Q1'21 Q2'21 Q3'21 Q4'21 Q1'22 Locked Jumbo Loans Purchased Jumbo Loans Residential Mortgage Banking Quarterly Volume ($bn) Gross Margins Quarterly Highlights Business Trends ▪ $2.6 billion of locks, down 7% from $2.8 billion in Q4’21(1) ▪ QoQ decline in lock volume notably better than forecasted industry QoQ decrease of ~25%(2) ▪ Lock mix was 65% purchase / 35% refinance ▪ Issued one Sequoia securitization backed by $0.7 billion of collateral ▪ Execution levels superior to other issuers reflective of the quality of our issuance program ▪ Speed of securitization execution relative to peers continues to be a clear differentiator ▪ Successfully moved risk, while keeping inventory intentionally light; sold $1.8 billion of whole loans ▪ In April 2022, launched new expanded prime products ▪ Higher GSE fees for high balance and second home loans likely to increase flow of these assets to the private markets and expand Redwood’s total addressable market opportunity ▪ Expectations for more expanded prime products (historically at higher margins) as rates rise RWT historical target range of 75 -100bps Detailed Endnotes are included at the end of this presentation. As volatility persists, Redwood has maintained leadership as a partner of choice to both our loan sellers and buyers / investors Gross margins remained near the low end of our historical range despite substantial volatility (1) 98 183 98 122 90 71 0 50 100 150 200 Q4'20 Q1'21 Q2'21 Q3'21 Q4'21 Q1'22 b p s


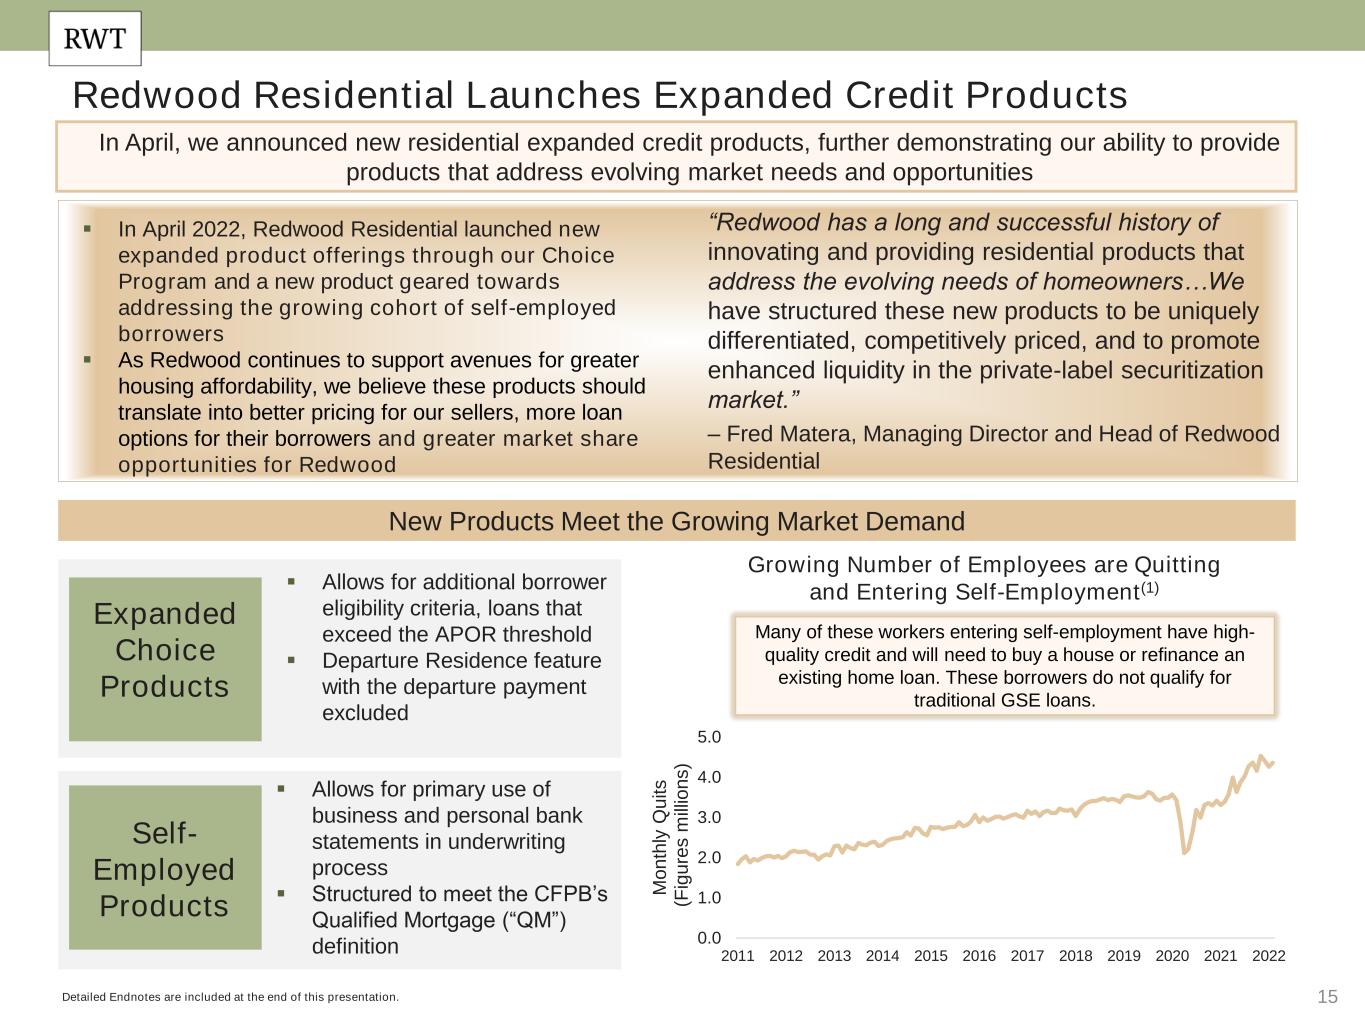
15 Redwood Residential Launches Expanded Credit Products ▪ In April 2022, Redwood Residential launched new expanded product offerings through our Choice Program and a new product geared towards addressing the growing cohort of self-employed borrowers ▪ As Redwood continues to support avenues for greater housing affordability, we believe these products should translate into better pricing for our sellers, more loan options for their borrowers and greater market share opportunities for Redwood “Redwood has a long and successful history of innovating and providing residential products that address the evolving needs of homeowners…We have structured these new products to be uniquely differentiated, competitively priced, and to promote enhanced liquidity in the private-label securitization market.” – Fred Matera, Managing Director and Head of Redwood Residential New Products Meet the Growing Market Demand Detailed Endnotes are included at the end of this presentation. Expanded Choice Products Self- Employed Products ▪ Allows for primary use of business and personal bank statements in underwriting process ▪ Structured to meet the CFPB’s Qualified Mortgage (“QM”) definition ▪ Allows for additional borrower eligibility criteria, loans that exceed the APOR threshold ▪ Departure Residence feature with the departure payment excluded 0.0 1.0 2.0 3.0 4.0 5.0 2011 2012 2013 2014 2015 2016 2017 2018 2019 2020 2021 2022 M o n th ly Q u it s (F ig u re s m ill io n s ) Many of these workers entering self-employment have high- quality credit and will need to buy a house or refinance an existing home loan. These borrowers do not qualify for traditional GSE loans. Growing Number of Employees are Quitting and Entering Self-Employment(1) In April, we announced new residential expanded credit products, further demonstrating our ability to provide products that address evolving market needs and opportunities


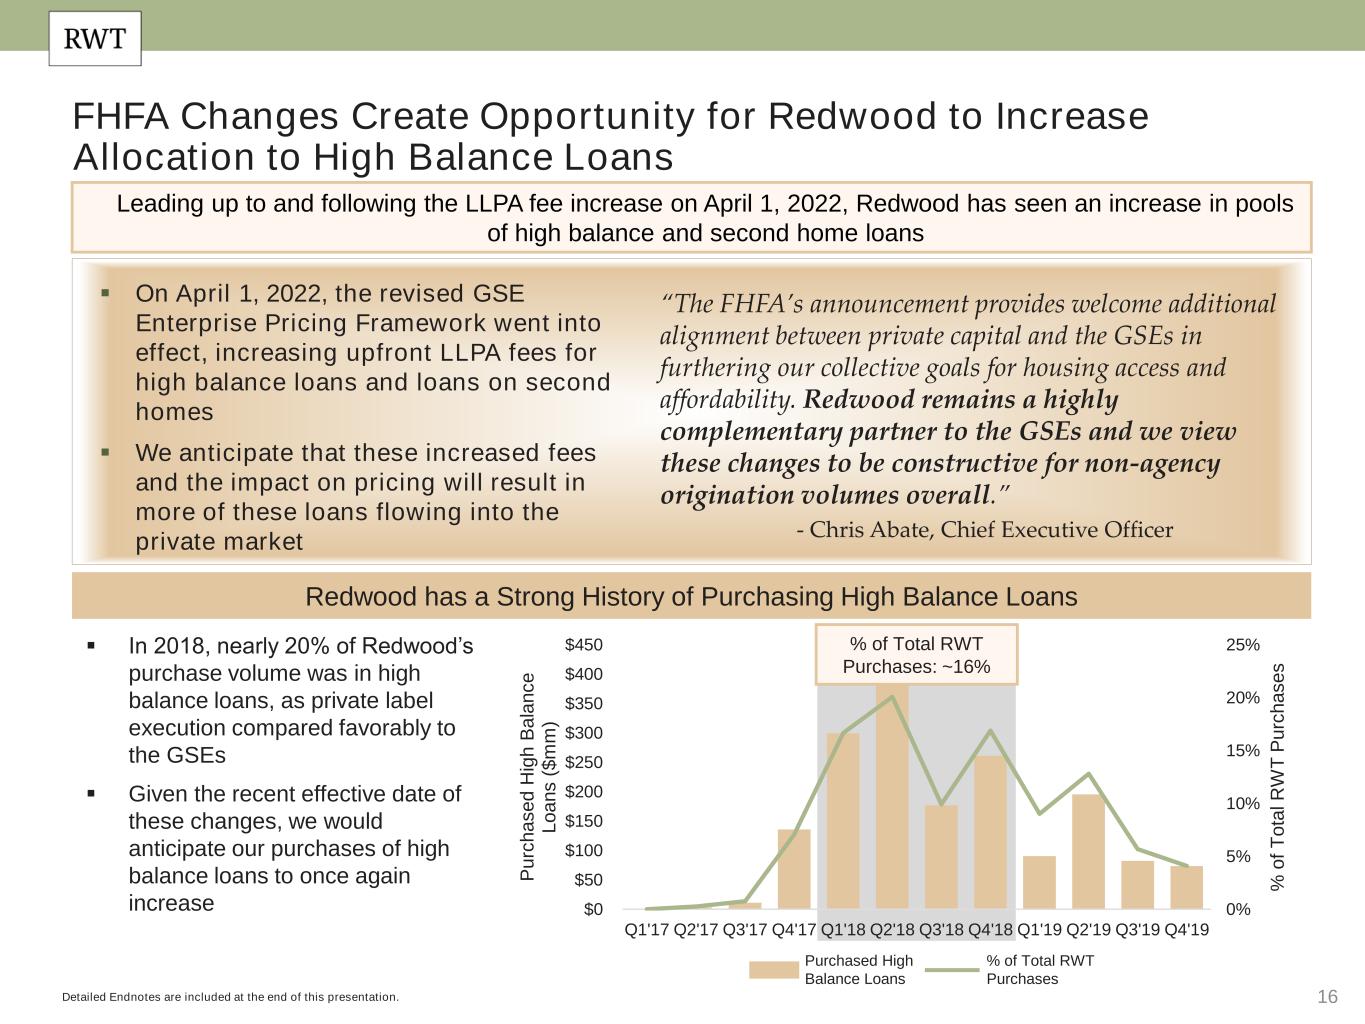
16 FHFA Changes Create Opportunity for Redwood to Increase Allocation to High Balance Loans ▪ On April 1, 2022, the revised GSE Enterprise Pricing Framework went into effect, increasing upfront LLPA fees for high balance loans and loans on second homes ▪ We anticipate that these increased fees and the impact on pricing will result in more of these loans flowing into the private market “The FHFA’s announcement provides welcome additional alignment between private capital and the GSEs in furthering our collective goals for housing access and affordability. Redwood remains a highly complementary partner to the GSEs and we view these changes to be constructive for non-agency origination volumes overall.” - Chris Abate, Chief Executive Officer Redwood has a Strong History of Purchasing High Balance Loans ▪ In 2018, nearly 20% of Redwood’s purchase volume was in high balance loans, as private label execution compared favorably to the GSEs ▪ Given the recent effective date of these changes, we would anticipate our purchases of high balance loans to once again increase 0% 5% 10% 15% 20% 25% $0 $50 $100 $150 $200 $250 $300 $350 $400 $450 Q1'17 Q2'17 Q3'17 Q4'17 Q1'18 Q2'18 Q3'18 Q4'18 Q1'19 Q2'19 Q3'19 Q4'19 % o f T o ta l R W T P u rc h a s e s P u rc h a s e d H ig h B a la n c e L o a n s ( $ m m ) % of Total RWT Purchases: ~16% Leading up to and following the LLPA fee increase on April 1, 2022, Redwood has seen an increase in pools of high balance and second home loans Detailed Endnotes are included at the end of this presentation. Purchased High Balance Loans % of Total RWT Purchases


17 Industry Leading Distribution Platform is a Clear Differentiator Business Purpose Mortgage Banking (CAFL)Residential Mortgage Banking (Sequoia) Detailed Endnotes are included at the end of this presentation. ▪ Industry leader for our speed, innovation, quality and ability to successfully distribute loans ▪ Various distribution channels support our execution (securitizations, whole loan sales and private structured transactions) ▪ Track record of whole loan sales to repeat investors improves liquidity and diversity of distribution outlets ▪ Utilize blockchain to more quickly provide relevant securitization remittance information to investors ▪ 119 securitizations since 1997 for total issuance of $59.5 billion ▪ Transacted with over 200 investors ▪ Have sold whole loans to over 70 counterparties ▪ 19 securitizations since inception for total issuance of $5.1 billion ▪ Transacted with over 100 investors ▪ Completed $332 million of whole loan sales to large institutional investors in Q1’22 Redwood successfully distributed loans through whole loan sales as securitization activity was muted in Q1’22 $ millions$ millions $876 $1,530 $449 $1,335 $687 $1,400 $1,795 $2,361 $1,457 $1,827 $2,276 $3,325 $2,810 $2,792 $2,515 Q1'21 Q2'21 Q3'21 Q4'21 Q1'22 Securitizations Sales $158 $276 $606 $304 $202 $332 $158 $276 $606 $506 $332 Q1'21 Q2'21 Q3'21 Q4'21 Q1'22 Securitizations Sales


18 R W T H O R I Z O N S Horizons by the NumbersQ1’22 Activity Detailed Endnotes are included at the end of this presentation. Invests in primarily early-stage companies that drive innovation in financial and real estate technology TM ▪ 5 additional investments in Q1’22(1) Horizons Opportunity Thesis Enhance efficiency and scale in Redwood businesses Early-stage companies with opportunity for valuation upside Partnerships drive growth and technological enhancements Alignment with Redwood’s mission, values and goals P P P P Over $25 million of investment commitments since inception 21 total investments 18 portfolio companies


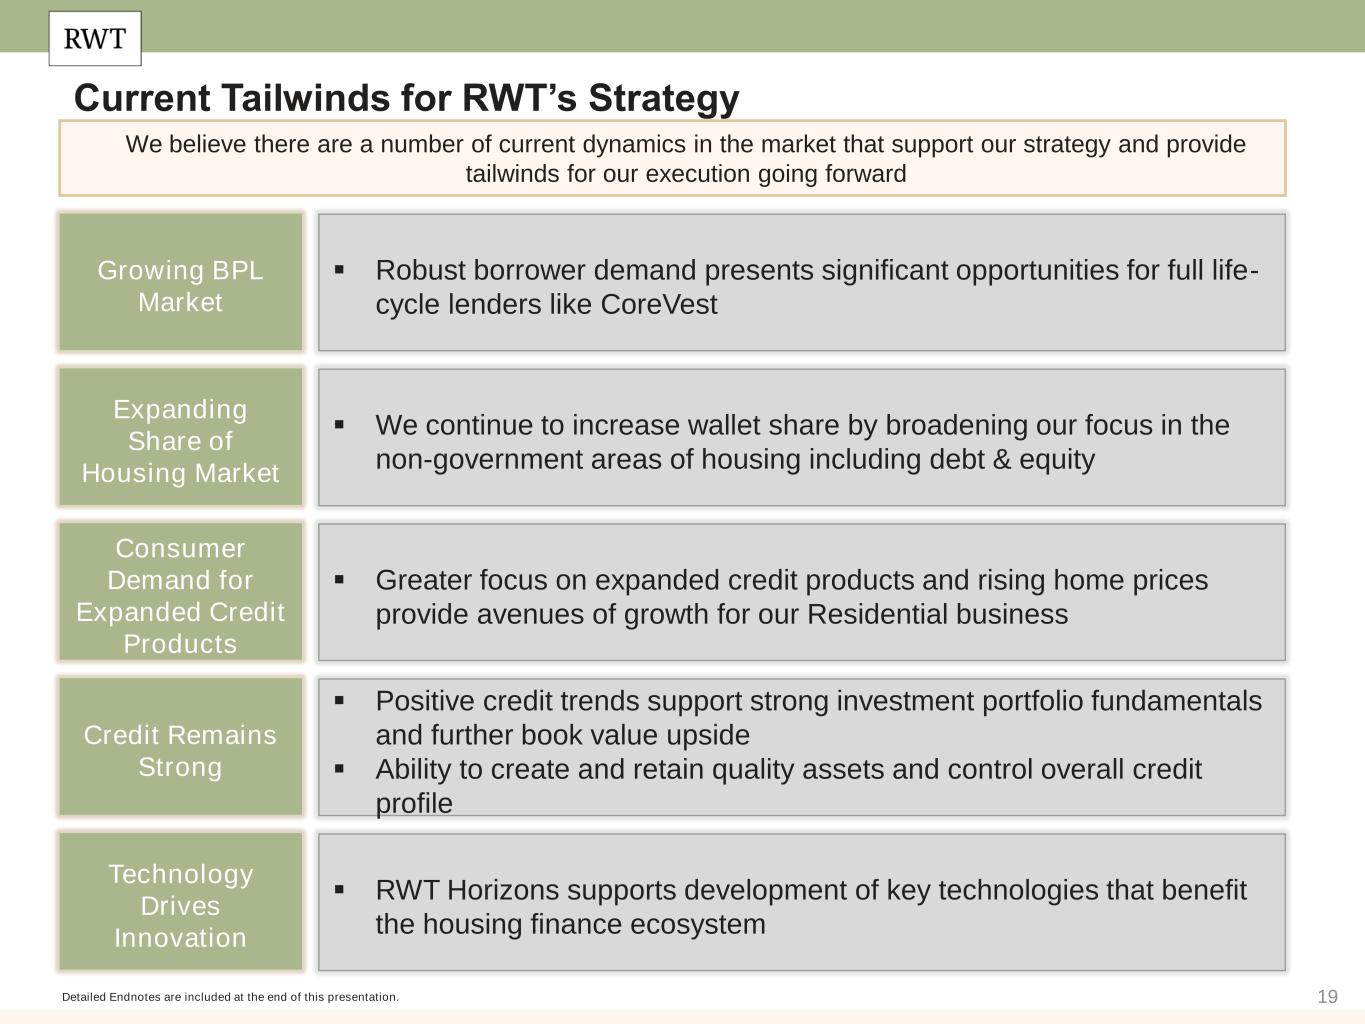
19 Current Tailwinds for RWT’s Strategy Expanding Share of Housing Market Consumer Demand for Expanded Credit Products Technology Drives Innovation Credit Remains Strong ▪ We continue to increase wallet share by broadening our focus in the non-government areas of housing including debt & equity ▪ Greater focus on expanded credit products and rising home prices provide avenues of growth for our Residential business ▪ Positive credit trends support strong investment portfolio fundamentals and further book value upside ▪ Ability to create and retain quality assets and control overall credit profile ▪ RWT Horizons supports development of key technologies that benefit the housing finance ecosystem Detailed Endnotes are included at the end of this presentation. Growing BPL Market ▪ Robust borrower demand presents significant opportunities for full life- cycle lenders like CoreVest We believe there are a number of current dynamics in the market that support our strategy and provide tailwinds for our execution going forward


20 Financial Results


21 Detailed Endnotes are included at the end of this presentation.


22 Detailed Endnotes are included at the end of this presentation.


23 (1) Detailed Endnotes are included at the end of this presentation.


24 Detailed Endnotes are included at the end of this presentation.


25 Detailed Endnotes are included at the end of this presentation.


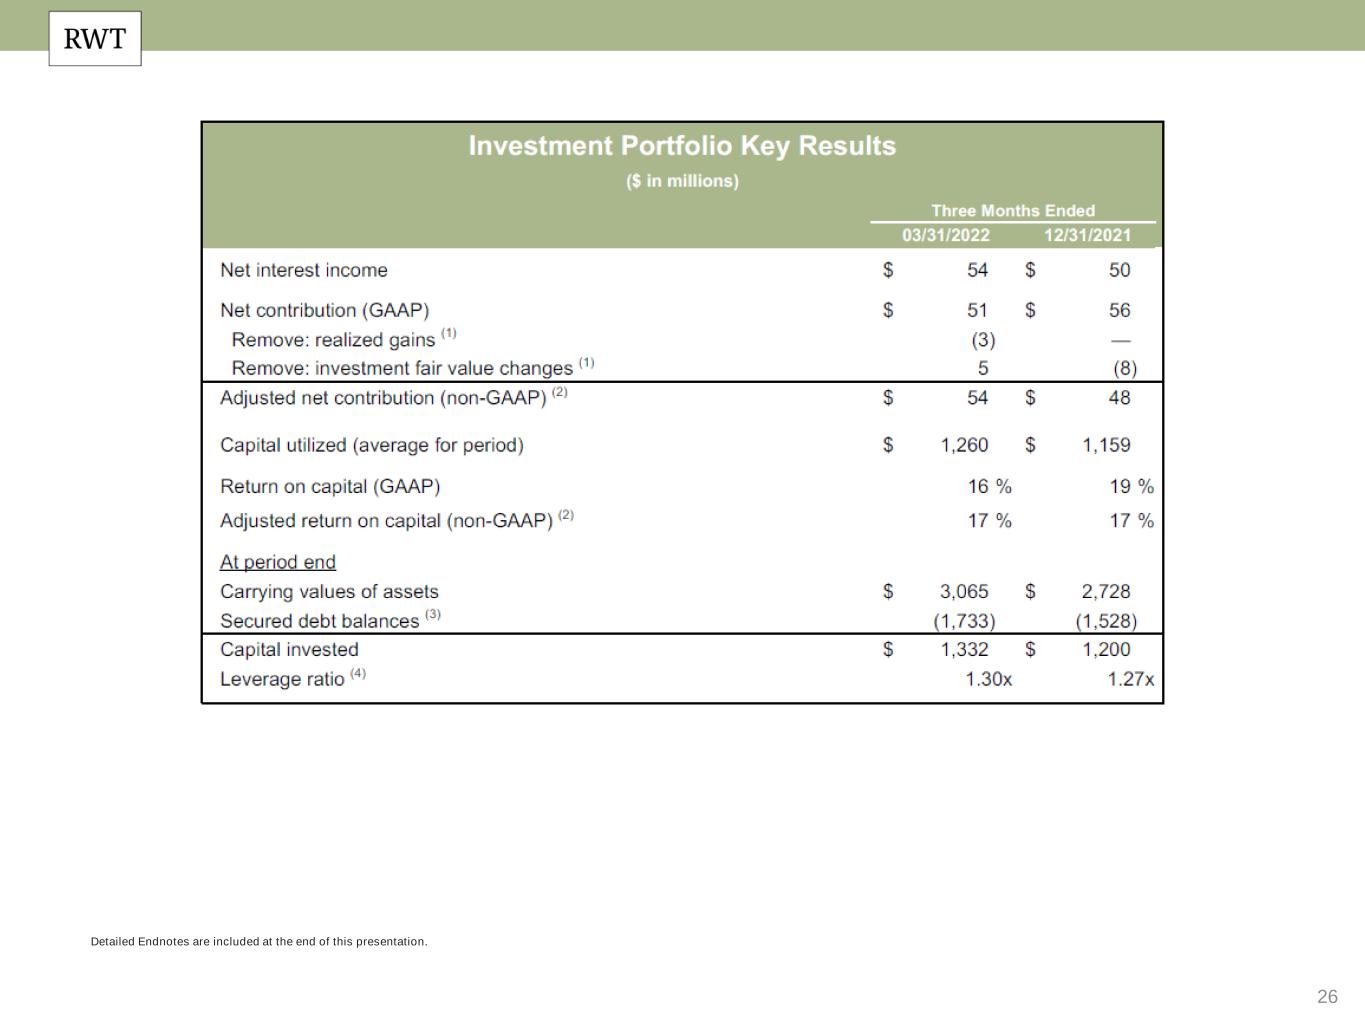
26 Detailed Endnotes are included at the end of this presentation.


27 Detailed Endnotes are included at the end of this presentation.


28 Detailed Endnotes are included at the end of this presentation.


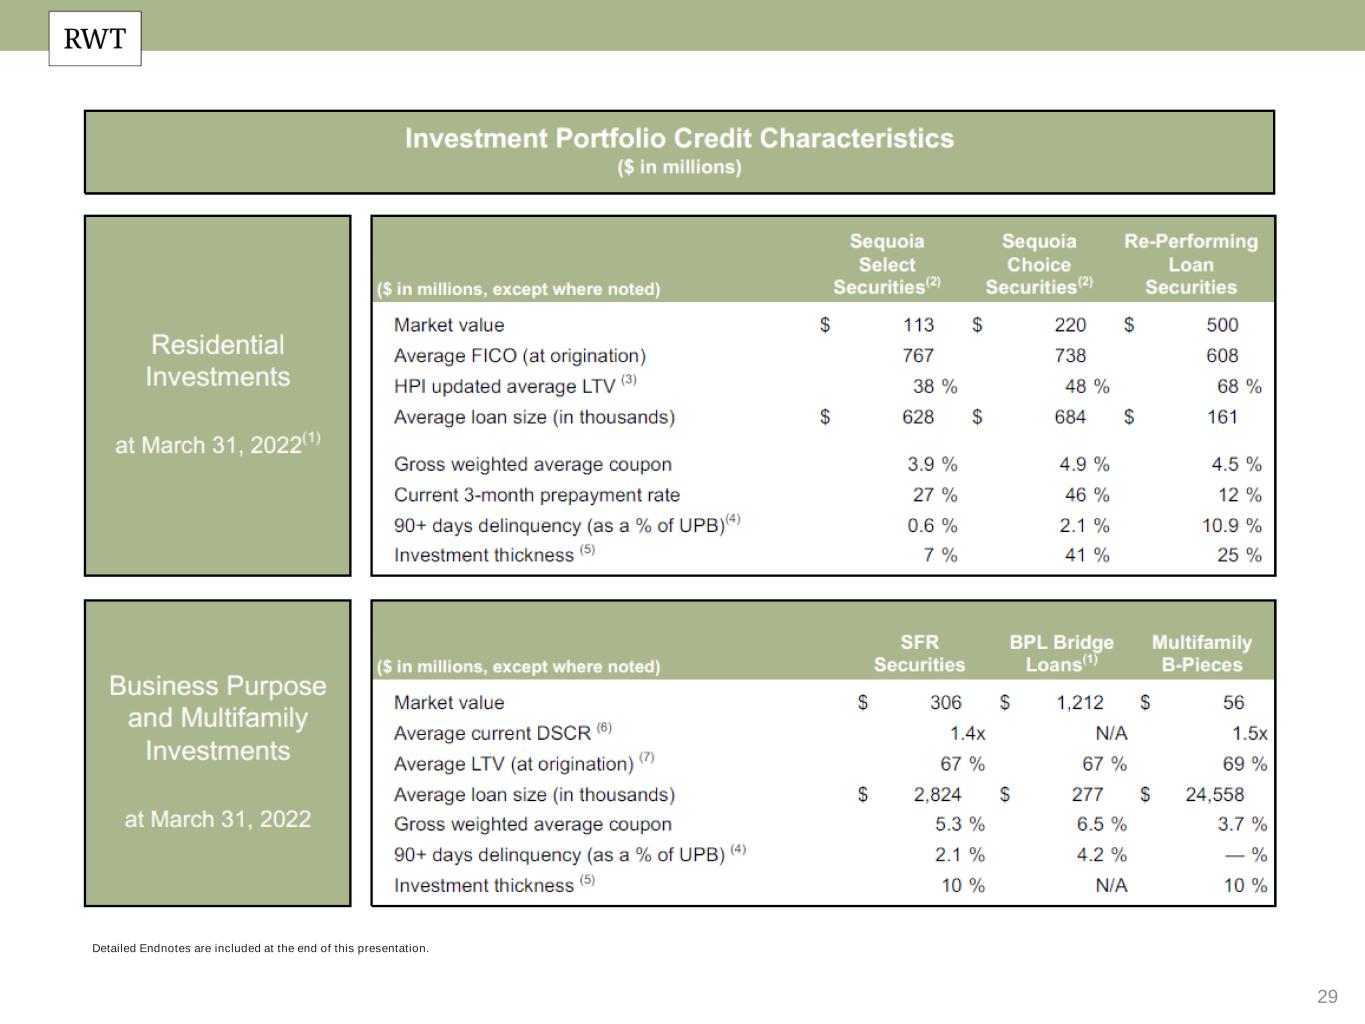
29 Detailed Endnotes are included at the end of this presentation.


30 Detailed Endnotes are included at the end of this presentation.


31 Endnotes


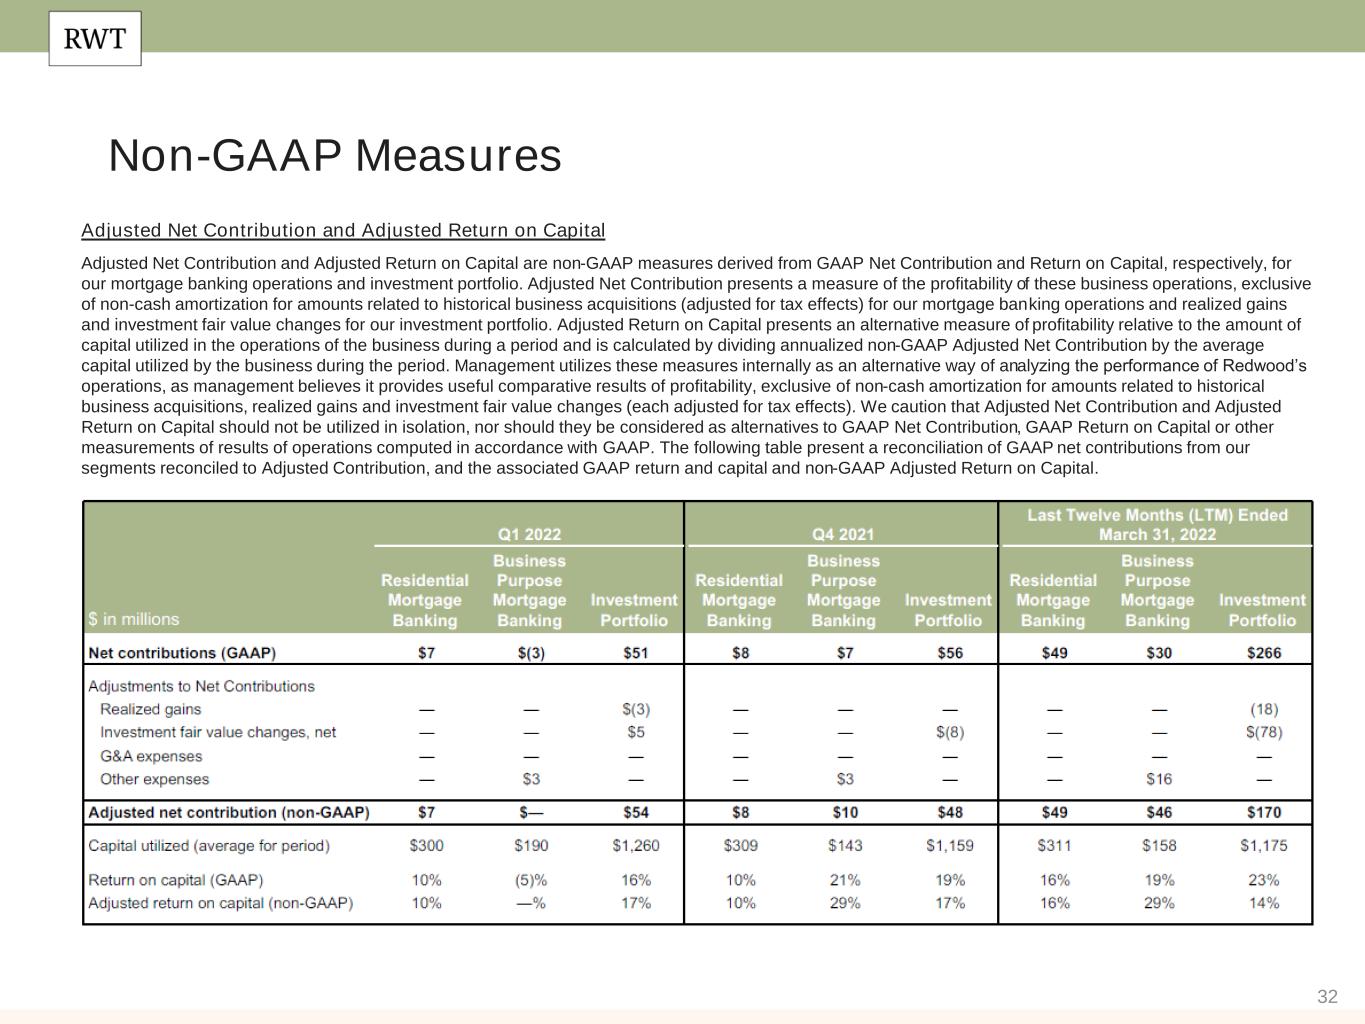
32 Non-GAAP Measures Adjusted Net Contribution and Adjusted Return on Capital Adjusted Net Contribution and Adjusted Return on Capital are non-GAAP measures derived from GAAP Net Contribution and Return on Capital, respectively, for our mortgage banking operations and investment portfolio. Adjusted Net Contribution presents a measure of the profitability of these business operations, exclusive of non-cash amortization for amounts related to historical business acquisitions (adjusted for tax effects) for our mortgage banking operations and realized gains and investment fair value changes for our investment portfolio. Adjusted Return on Capital presents an alternative measure of profitability relative to the amount of capital utilized in the operations of the business during a period and is calculated by dividing annualized non-GAAP Adjusted Net Contribution by the average capital utilized by the business during the period. Management utilizes these measures internally as an alternative way of analyzing the performance of Redwood’s operations, as management believes it provides useful comparative results of profitability, exclusive of non-cash amortization for amounts related to historical business acquisitions, realized gains and investment fair value changes (each adjusted for tax effects). We caution that Adjusted Net Contribution and Adjusted Return on Capital should not be utilized in isolation, nor should they be considered as alternatives to GAAP Net Contribution, GAAP Return on Capital or other measurements of results of operations computed in accordance with GAAP. The following table present a reconciliation of GAAP net contributions from our segments reconciled to Adjusted Contribution, and the associated GAAP return and capital and non-GAAP Adjusted Return on Capital. $ in millions


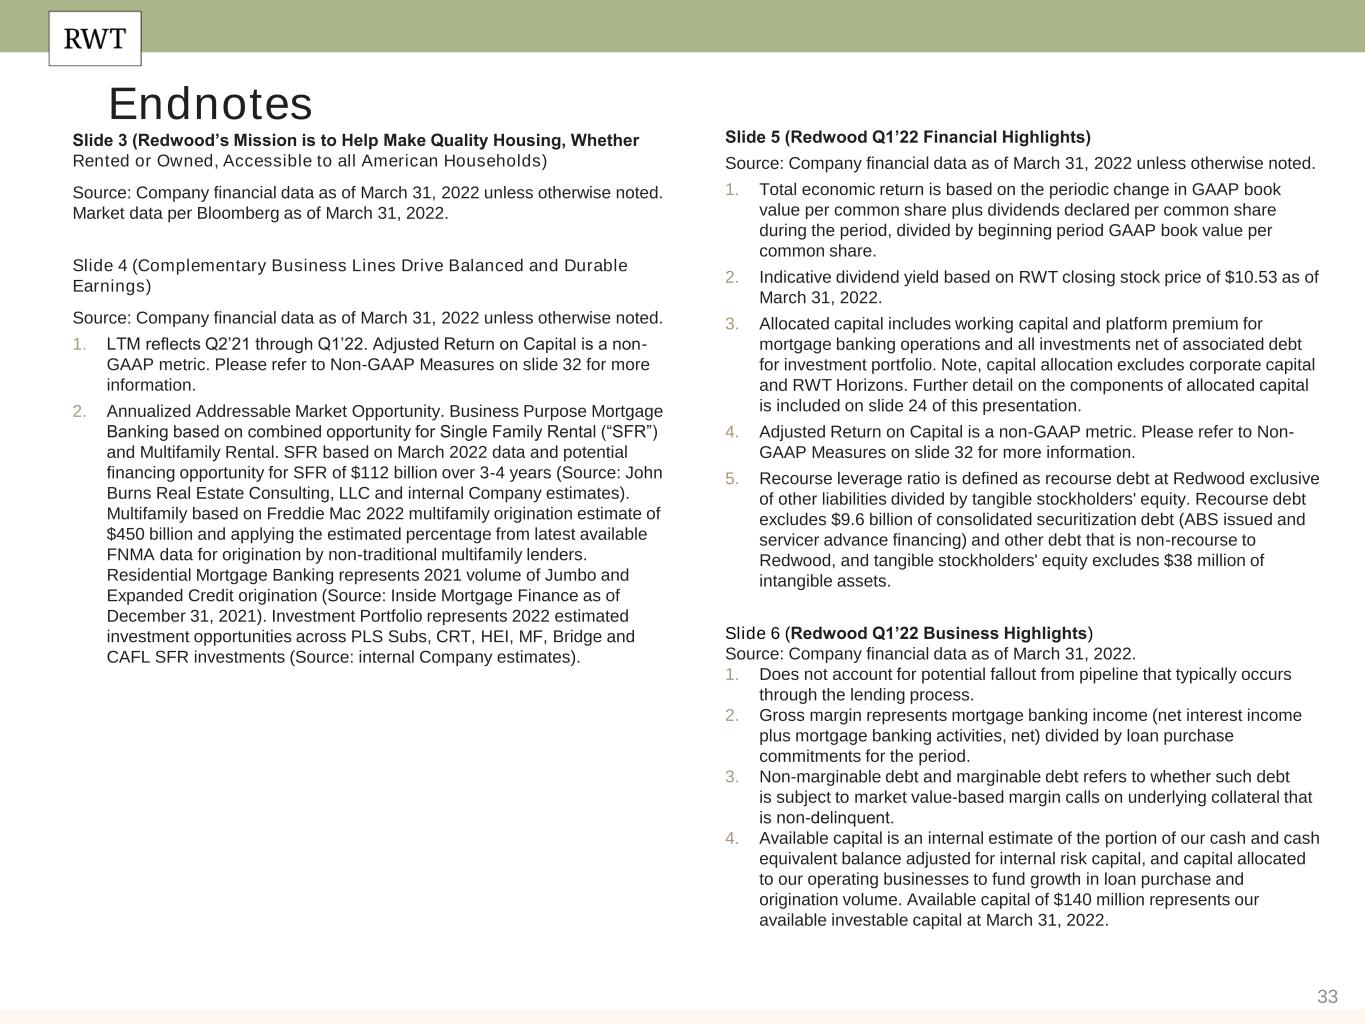
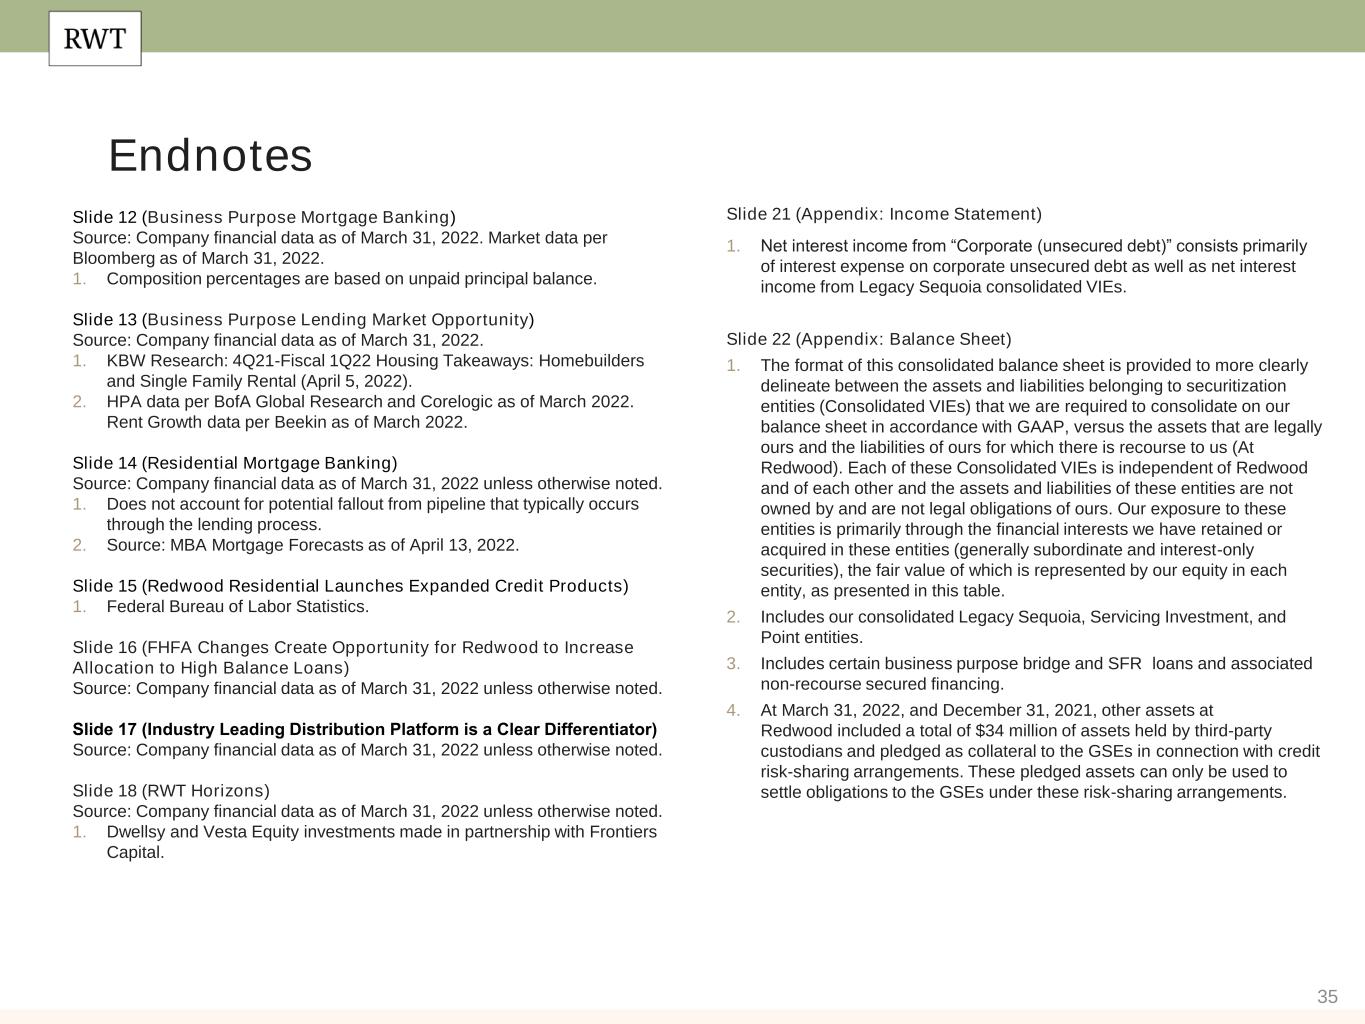
33 Slide 3 (Redwood’s Mission is to Help Make Quality Housing, Whether Rented or Owned, Accessible to all American Households) Source: Company financial data as of March 31, 2022 unless otherwise noted. Market data per Bloomberg as of March 31, 2022. Slide 4 (Complementary Business Lines Drive Balanced and Durable Earnings) Source: Company financial data as of March 31, 2022 unless otherwise noted. 1. LTM reflects Q2’21 through Q1’22. Adjusted Return on Capital is a non- GAAP metric. Please refer to Non-GAAP Measures on slide 32 for more information. 2. Annualized Addressable Market Opportunity. Business Purpose Mortgage Banking based on combined opportunity for Single Family Rental (“SFR”) and Multifamily Rental. SFR based on March 2022 data and potential financing opportunity for SFR of $112 billion over 3-4 years (Source: John Burns Real Estate Consulting, LLC and internal Company estimates). Multifamily based on Freddie Mac 2022 multifamily origination estimate of $450 billion and applying the estimated percentage from latest available FNMA data for origination by non-traditional multifamily lenders. Residential Mortgage Banking represents 2021 volume of Jumbo and Expanded Credit origination (Source: Inside Mortgage Finance as of December 31, 2021). Investment Portfolio represents 2022 estimated investment opportunities across PLS Subs, CRT, HEI, MF, Bridge and CAFL SFR investments (Source: internal Company estimates). Endnotes Slide 5 (Redwood Q1’22 Financial Highlights)​ Source: Company financial data as of March 31, 2022 unless otherwise noted. 1. Total economic return is based on the periodic change in GAAP book value per common share plus dividends declared per common share during the period, divided by beginning period GAAP book value per common share. 2. Indicative dividend yield based on RWT closing stock price of $10.53 as of March 31, 2022. 3. Allocated capital includes working capital and platform premium for mortgage banking operations and all investments net of associated debt for investment portfolio. Note, capital allocation excludes corporate capital and RWT Horizons. Further detail on the components of allocated capital is included on slide 24 of this presentation. 4. Adjusted Return on Capital is a non-GAAP metric. Please refer to Non- GAAP Measures on slide 32 for more information. 5. Recourse leverage ratio is defined as recourse debt at Redwood exclusive of other liabilities divided by tangible stockholders' equity. Recourse debt excludes $9.6 billion of consolidated securitization debt (ABS issued and servicer advance financing) and other debt that is non-recourse to Redwood, and tangible stockholders' equity excludes $38 million of intangible assets. Slide 6 (Redwood Q1’22 Business Highlights) Source: Company financial data as of March 31, 2022. 1. Does not account for potential fallout from pipeline that typically occurs through the lending process. 2. Gross margin represents mortgage banking income (net interest income plus mortgage banking activities, net) divided by loan purchase commitments for the period. 3. Non-marginable debt and marginable debt refers to whether such debt is subject to market value-based margin calls on underlying collateral that is non-delinquent.​ 4. Available capital is an internal estimate of the portion of our cash and cash equivalent balance adjusted for internal risk capital, and capital allocated to our operating businesses to fund growth in loan purchase and origination volume. Available capital of $140 million represents our available investable capital at March 31, 2022.


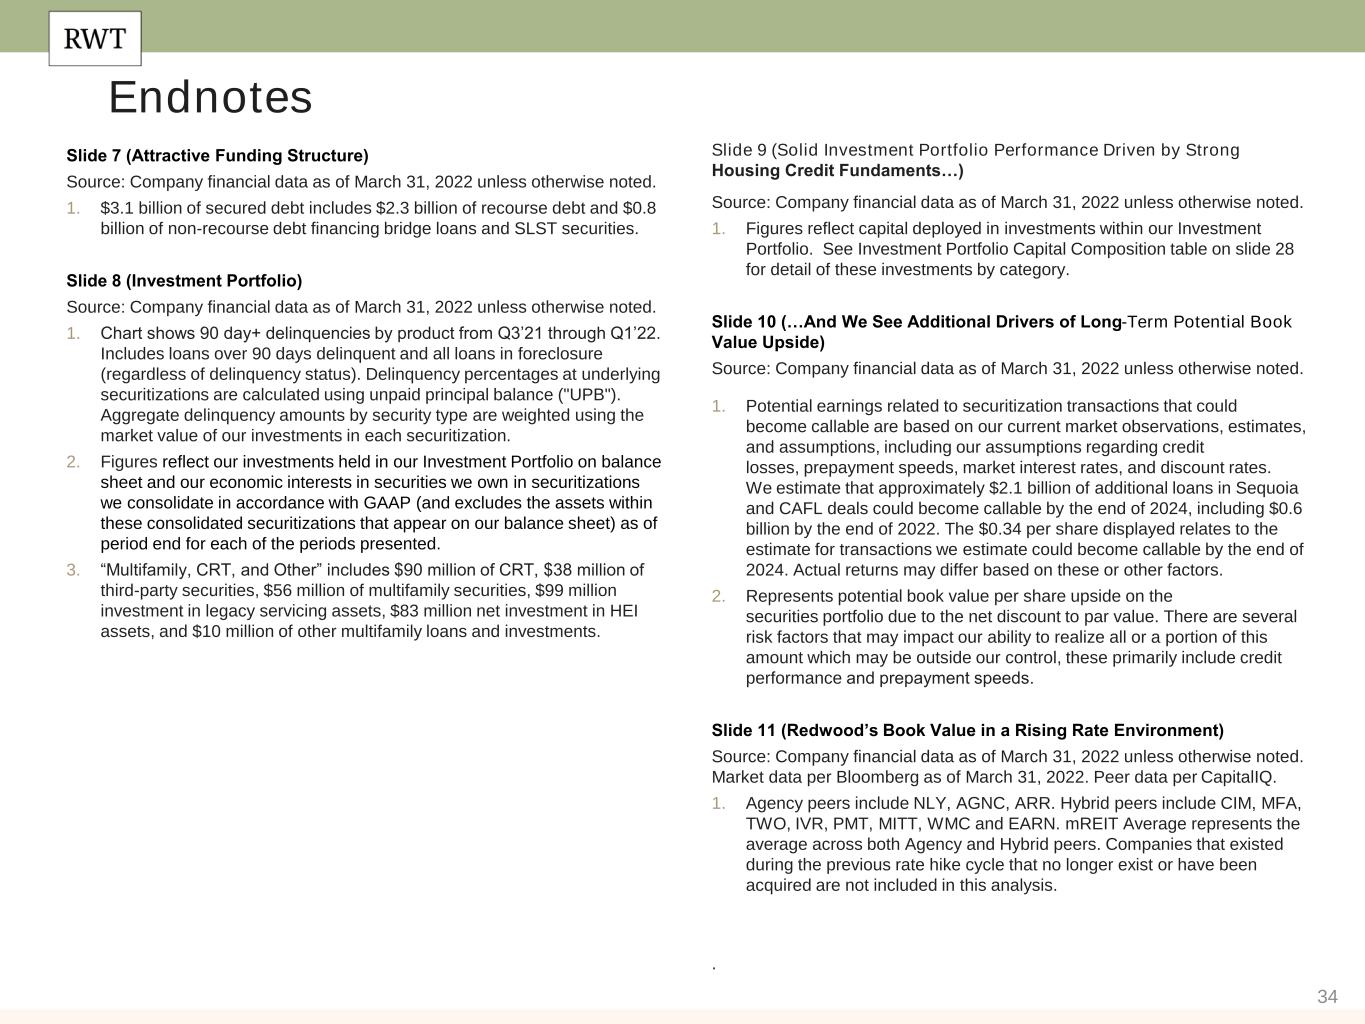
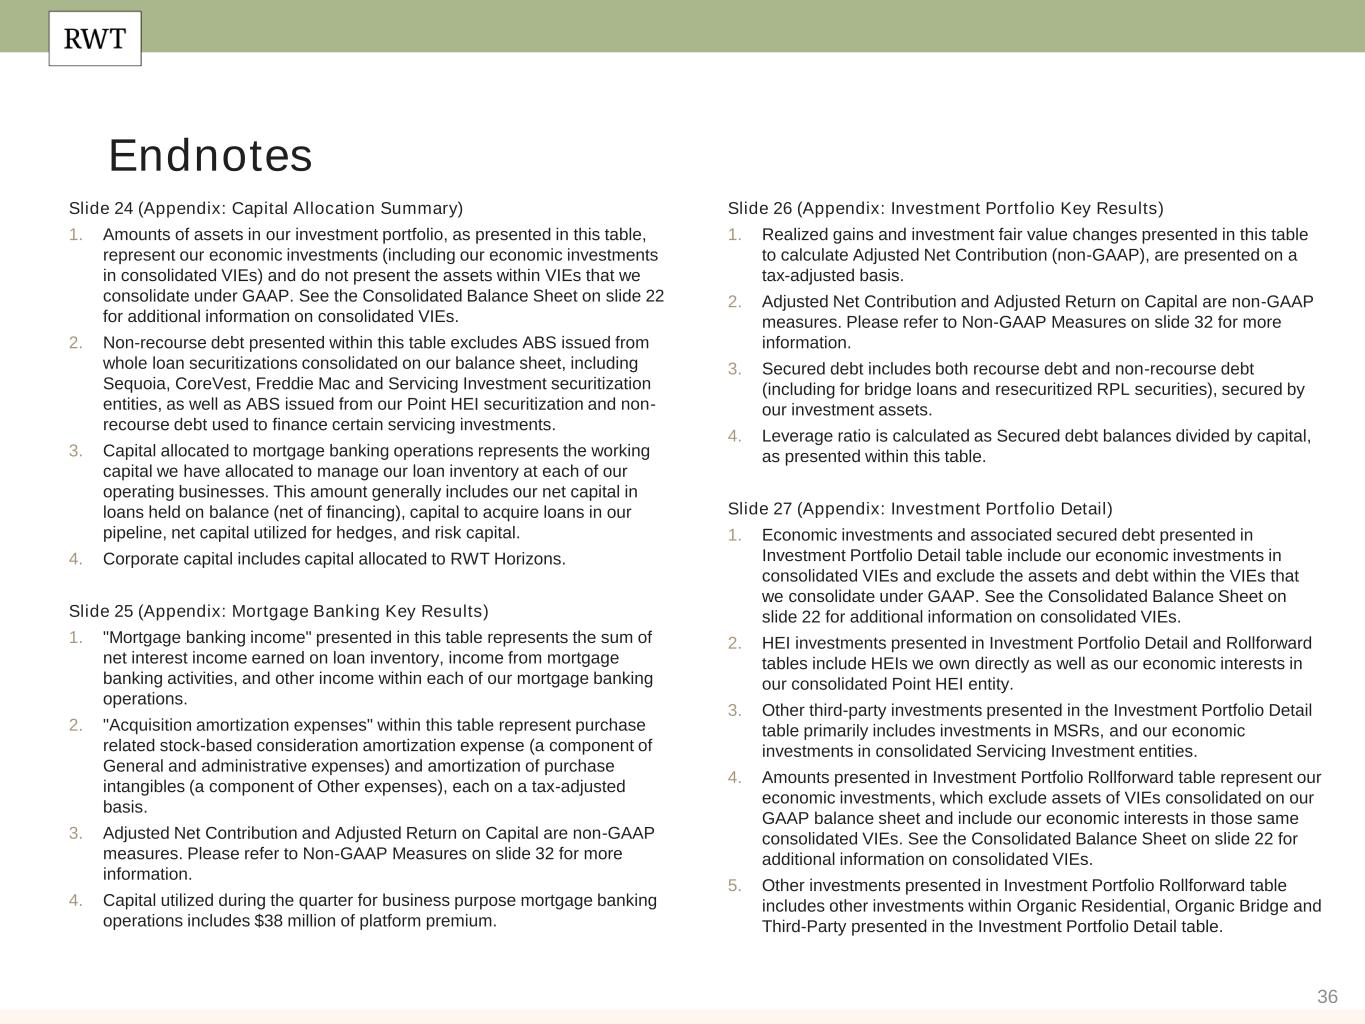
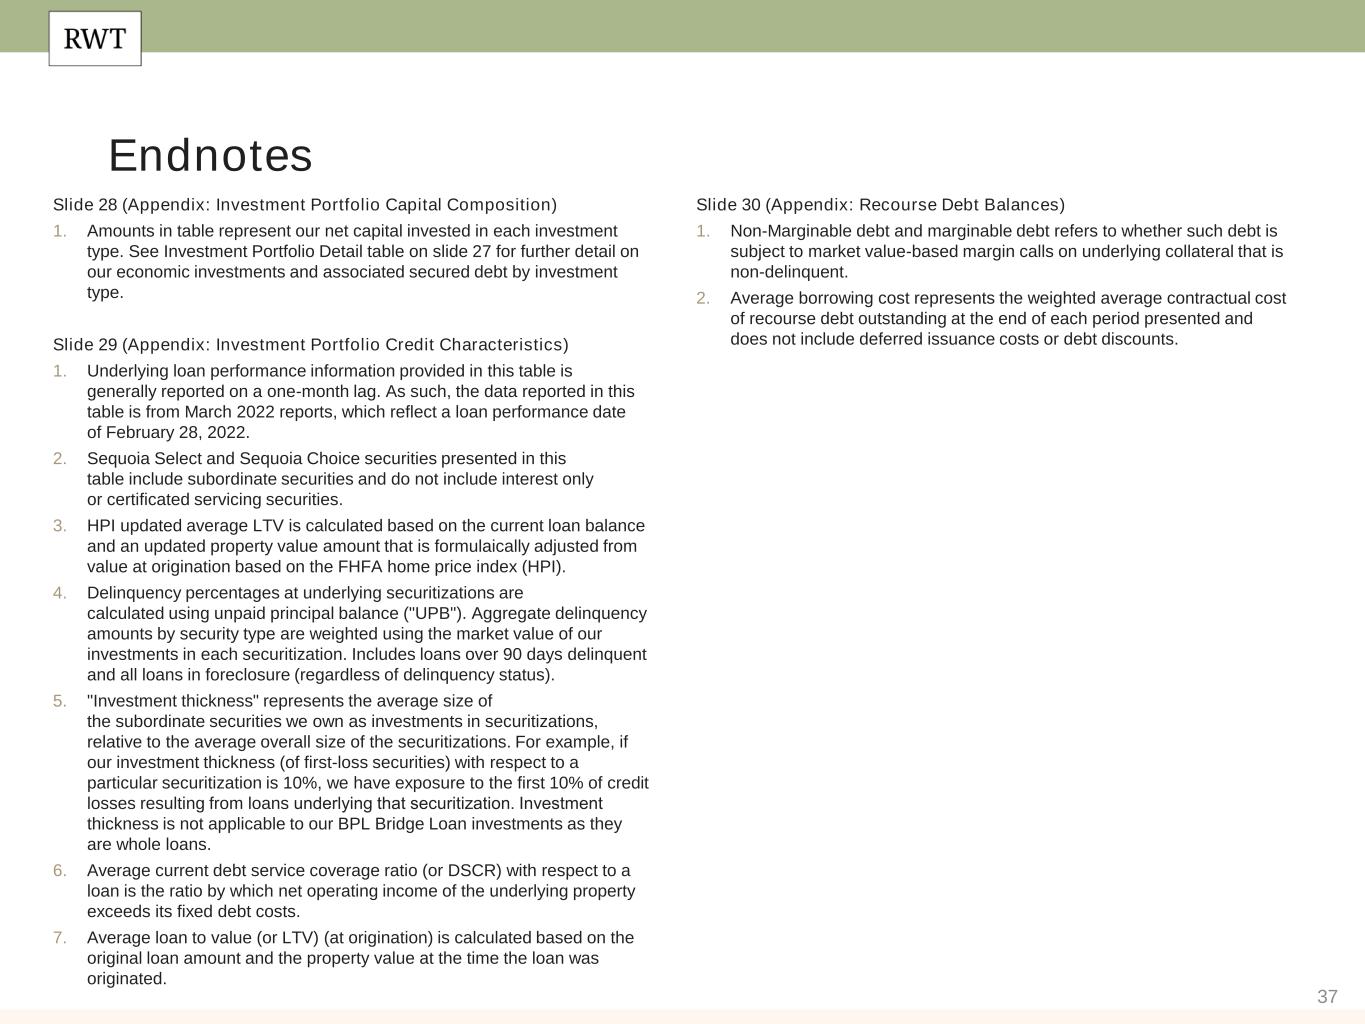
34 Endnotes Slide 7 (Attractive Funding Structure)​ Source: Company financial data as of March 31, 2022 unless otherwise noted. 1. $3.1 billion of secured debt includes $2.3 billion of recourse debt and $0.8 billion of non-recourse debt financing bridge loans and SLST securities. Slide 8 (Investment Portfolio)​ Source: Company financial data as of March 31, 2022 unless otherwise noted. 1. Chart shows 90 day+ delinquencies by product from Q3’21 through Q1’22. Includes loans over 90 days delinquent and all loans in foreclosure (regardless of delinquency status). Delinquency percentages at underlying securitizations are calculated using unpaid principal balance ("UPB"). Aggregate delinquency amounts by security type are weighted using the market value of our investments in each securitization. 2. Figures reflect our investments held in our Investment Portfolio on balance sheet and our economic interests in securities we own in securitizations we consolidate in accordance with GAAP (and excludes the assets within these consolidated securitizations that appear on our balance sheet) as of period end for each of the periods presented. 3. “Multifamily, CRT, and Other” includes $90 million of CRT, $38 million of third-party securities, $56 million of multifamily securities, $99 million investment in legacy servicing assets, $83 million net investment in HEI assets, and $10 million of other multifamily loans and investments. Slide 9 (Solid Investment Portfolio Performance Driven by Strong Housing Credit Fundaments…) Source: Company financial data as of March 31, 2022 unless otherwise noted. 1. Figures reflect capital deployed in investments within our Investment Portfolio. See Investment Portfolio Capital Composition table on slide 28 for detail of these investments by category. Slide 10 (…And We See Additional Drivers of Long-Term Potential Book Value Upside)​ Source: Company financial data as of March 31, 2022 unless otherwise noted. 1. Potential earnings related to securitization transactions that could become callable are based on our current market observations, estimates, and assumptions, including our assumptions regarding credit losses, prepayment speeds, market interest rates, and discount rates. We estimate that approximately $2.1 billion of additional loans in Sequoia and CAFL deals could become callable by the end of 2024, including $0.6 billion by the end of 2022. The $0.34 per share displayed relates to the estimate for transactions we estimate could become callable by the end of 2024. Actual returns may differ based on these or other factors. 2. Represents potential book value per share upside on the securities portfolio due to the net discount to par value. There are several risk factors that may impact our ability to realize all or a portion of this amount which may be outside our control, these primarily include credit performance and prepayment speeds. ​ Slide 11 (Redwood’s Book Value in a Rising Rate Environment​) Source: Company financial data as of March 31, 2022 unless otherwise noted. Market data per Bloomberg as of March 31, 2022. Peer data per CapitalIQ. 1. Agency peers include NLY, AGNC, ARR. Hybrid peers include CIM, MFA, TWO, IVR, PMT, MITT, WMC and EARN. mREIT Average represents the average across both Agency and Hybrid peers. Companies that existed during the previous rate hike cycle that no longer exist or have been acquired are not included in this analysis. .


35 Slide 12 (Business Purpose Mortgage Banking) Source: Company financial data as of March 31, 2022. Market data per Bloomberg as of March 31, 2022. 1. Composition percentages are based on unpaid principal balance. Slide 13 (Business Purpose Lending Market Opportunity) Source: Company financial data as of March 31, 2022. 1. KBW Research: 4Q21-Fiscal 1Q22 Housing Takeaways: Homebuilders and Single Family Rental (April 5, 2022). 2. HPA data per BofA Global Research and Corelogic as of March 2022. Rent Growth data per Beekin as of March 2022. Slide 14 (Residential Mortgage Banking) Source: Company financial data as of March 31, 2022 unless otherwise noted. 1. Does not account for potential fallout from pipeline that typically occurs through the lending process. 2. Source: MBA Mortgage Forecasts as of April 13, 2022. Slide 15 (Redwood Residential Launches Expanded Credit Products) 1. Federal Bureau of Labor Statistics. Slide 16 (FHFA Changes Create Opportunity for Redwood to Increase Allocation to High Balance Loans) Source: Company financial data as of March 31, 2022 unless otherwise noted. Slide 17 (Industry Leading Distribution Platform is a Clear Differentiator)​ Source: Company financial data as of March 31, 2022 unless otherwise noted. Slide 18 (RWT Horizons) Source: Company financial data as of March 31, 2022 unless otherwise noted. 1. Dwellsy and Vesta Equity investments made in partnership with Frontiers Capital. Endnotes Slide 21 (Appendix: Income Statement) 1. Net interest income from “Corporate (unsecured debt)” consists primarily of interest expense on corporate unsecured debt as well as net interest income from Legacy Sequoia consolidated VIEs. Slide 22 (Appendix: Balance Sheet) 1. The format of this consolidated balance sheet is provided to more clearly delineate between the assets and liabilities belonging to securitization entities (Consolidated VIEs) that we are required to consolidate on our balance sheet in accordance with GAAP, versus the assets that are legally ours and the liabilities of ours for which there is recourse to us (At Redwood). Each of these Consolidated VIEs is independent of Redwood and of each other and the assets and liabilities of these entities are not owned by and are not legal obligations of ours. Our exposure to these entities is primarily through the financial interests we have retained or acquired in these entities (generally subordinate and interest-only securities), the fair value of which is represented by our equity in each entity, as presented in this table. 2. Includes our consolidated Legacy Sequoia, Servicing Investment, and Point entities. 3. Includes certain business purpose bridge and SFR loans and associated non-recourse secured financing. 4. At March 31, 2022, and December 31, 2021, other assets at Redwood included a total of $34 million of assets held by third-party custodians and pledged as collateral to the GSEs in connection with credit risk-sharing arrangements. These pledged assets can only be used to settle obligations to the GSEs under these risk-sharing arrangements.


36 Endnotes Slide 24 (Appendix: Capital Allocation Summary) 1. Amounts of assets in our investment portfolio, as presented in this table, represent our economic investments (including our economic investments in consolidated VIEs) and do not present the assets within VIEs that we consolidate under GAAP. See the Consolidated Balance Sheet on slide 22 for additional information on consolidated VIEs. 2. Non-recourse debt presented within this table excludes ABS issued from whole loan securitizations consolidated on our balance sheet, including Sequoia, CoreVest, Freddie Mac and Servicing Investment securitization entities, as well as ABS issued from our Point HEI securitization and non- recourse debt used to finance certain servicing investments. 3. Capital allocated to mortgage banking operations represents the working capital we have allocated to manage our loan inventory at each of our operating businesses. This amount generally includes our net capital in loans held on balance (net of financing), capital to acquire loans in our pipeline, net capital utilized for hedges, and risk capital. 4. Corporate capital includes capital allocated to RWT Horizons. Slide 25 (Appendix: Mortgage Banking Key Results) 1. "Mortgage banking income" presented in this table represents the sum of net interest income earned on loan inventory, income from mortgage banking activities, and other income within each of our mortgage banking operations. 2. "Acquisition amortization expenses" within this table represent purchase related stock-based consideration amortization expense (a component of General and administrative expenses) and amortization of purchase intangibles (a component of Other expenses), each on a tax-adjusted basis. 3. Adjusted Net Contribution and Adjusted Return on Capital are non-GAAP measures. Please refer to Non-GAAP Measures on slide 32 for more information. 4. Capital utilized during the quarter for business purpose mortgage banking operations includes $38 million of platform premium. Slide 26 (Appendix: Investment Portfolio Key Results) 1. Realized gains and investment fair value changes presented in this table to calculate Adjusted Net Contribution (non-GAAP), are presented on a tax-adjusted basis. 2. Adjusted Net Contribution and Adjusted Return on Capital are non-GAAP measures. Please refer to Non-GAAP Measures on slide 32 for more information. 3. Secured debt includes both recourse debt and non-recourse debt (including for bridge loans and resecuritized RPL securities), secured by our investment assets. 4. Leverage ratio is calculated as Secured debt balances divided by capital, as presented within this table. Slide 27 (Appendix: Investment Portfolio Detail) 1. Economic investments and associated secured debt presented in Investment Portfolio Detail table include our economic investments in consolidated VIEs and exclude the assets and debt within the VIEs that we consolidate under GAAP. See the Consolidated Balance Sheet on slide 22 for additional information on consolidated VIEs. 2. HEI investments presented in Investment Portfolio Detail and Rollforward tables include HEIs we own directly as well as our economic interests in our consolidated Point HEI entity. 3. Other third-party investments presented in the Investment Portfolio Detail table primarily includes investments in MSRs, and our economic investments in consolidated Servicing Investment entities. 4. Amounts presented in Investment Portfolio Rollforward table represent our economic investments, which exclude assets of VIEs consolidated on our GAAP balance sheet and include our economic interests in those same consolidated VIEs. See the Consolidated Balance Sheet on slide 22 for additional information on consolidated VIEs. 5. Other investments presented in Investment Portfolio Rollforward table includes other investments within Organic Residential, Organic Bridge and Third-Party presented in the Investment Portfolio Detail table.


37 Endnotes Slide 28 (Appendix: Investment Portfolio Capital Composition) 1. Amounts in table represent our net capital invested in each investment type. See Investment Portfolio Detail table on slide 27 for further detail on our economic investments and associated secured debt by investment type. Slide 29 (Appendix: Investment Portfolio Credit Characteristics) 1. Underlying loan performance information provided in this table is generally reported on a one-month lag. As such, the data reported in this table is from March 2022 reports, which reflect a loan performance date of February 28, 2022. 2. Sequoia Select and Sequoia Choice securities presented in this table include subordinate securities and do not include interest only or certificated servicing securities. 3. HPI updated average LTV is calculated based on the current loan balance and an updated property value amount that is formulaically adjusted from value at origination based on the FHFA home price index (HPI). 4. Delinquency percentages at underlying securitizations are calculated using unpaid principal balance ("UPB"). Aggregate delinquency amounts by security type are weighted using the market value of our investments in each securitization. Includes loans over 90 days delinquent and all loans in foreclosure (regardless of delinquency status). 5. "Investment thickness" represents the average size of the subordinate securities we own as investments in securitizations, relative to the average overall size of the securitizations. For example, if our investment thickness (of first-loss securities) with respect to a particular securitization is 10%, we have exposure to the first 10% of credit losses resulting from loans underlying that securitization.​ Investment thickness is not applicable to our BPL Bridge Loan investments as they are whole loans. 6. Average current debt service coverage ratio (or DSCR) with respect to a loan is the ratio by which net operating income of the underlying property exceeds its fixed debt costs. 7. Average loan to value (or LTV) (at origination) is calculated based on the original loan amount and the property value at the time the loan was originated. Slide 30 (Appendix: Recourse Debt Balances) 1. Non-Marginable debt and marginable debt refers to whether such debt is subject to market value-based margin calls on underlying collateral that is non-delinquent. 2. Average borrowing cost represents the weighted average contractual cost of recourse debt outstanding at the end of each period presented and does not include deferred issuance costs or debt discounts.