Exhibit 99.1

REDWOOD TRUST REPORTS THIRD QUARTER 2022 FINANCIAL RESULTS
MILL VALLEY, CA – Redwood Trust, Inc. (NYSE:RWT; "Redwood" or the "Company"), a leader in expanding access to housing for homebuyers and renters, today reported its financial results for the quarter ended September 30, 2022.
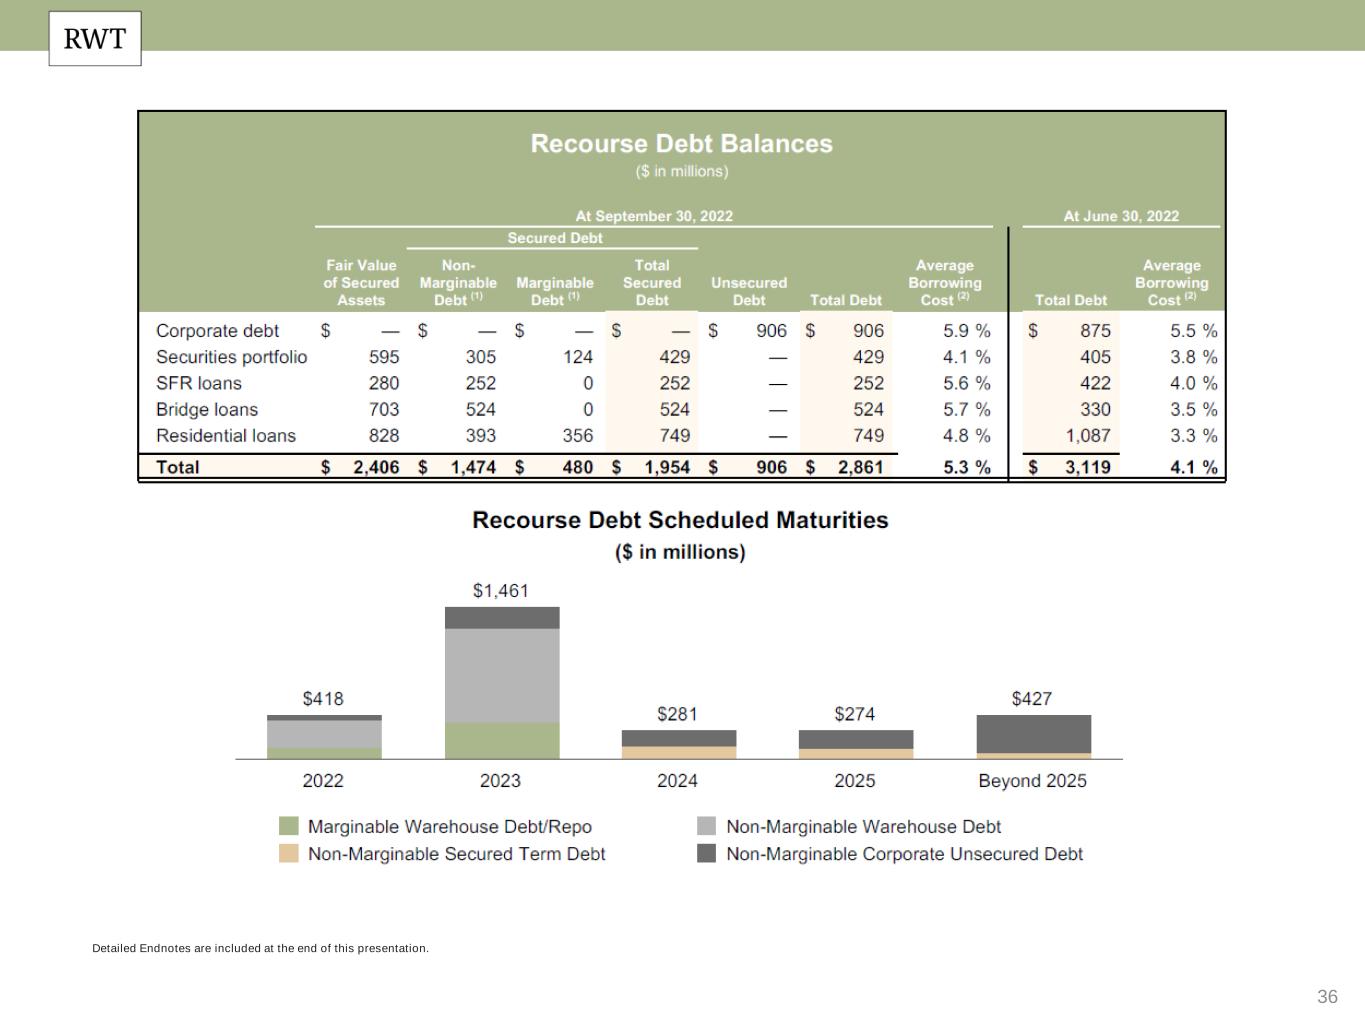
Key Q3 2022 Financial Results and Metrics
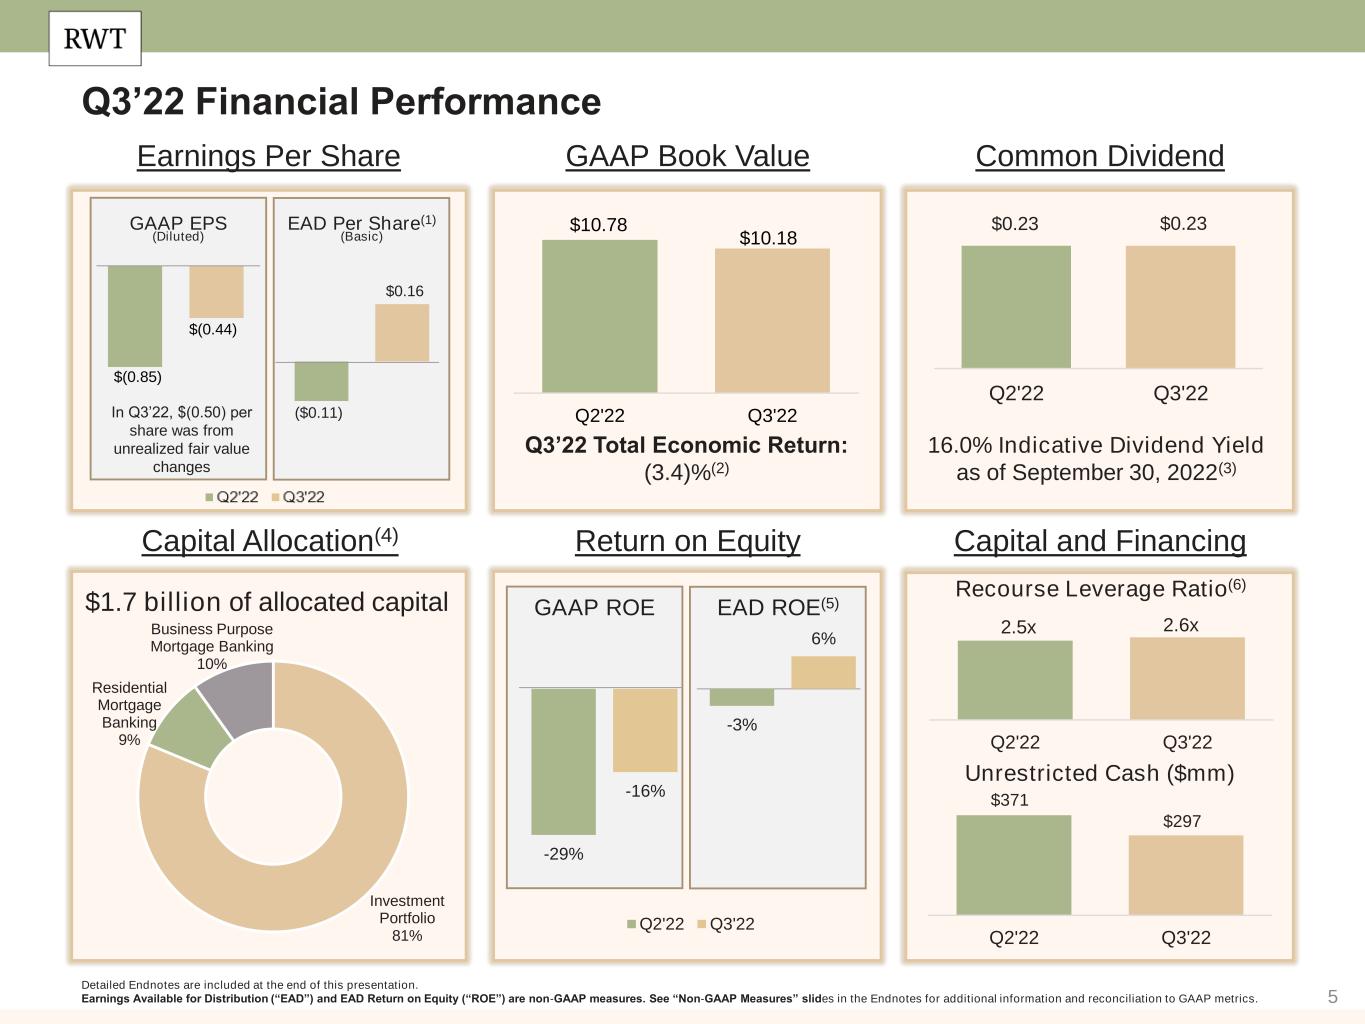
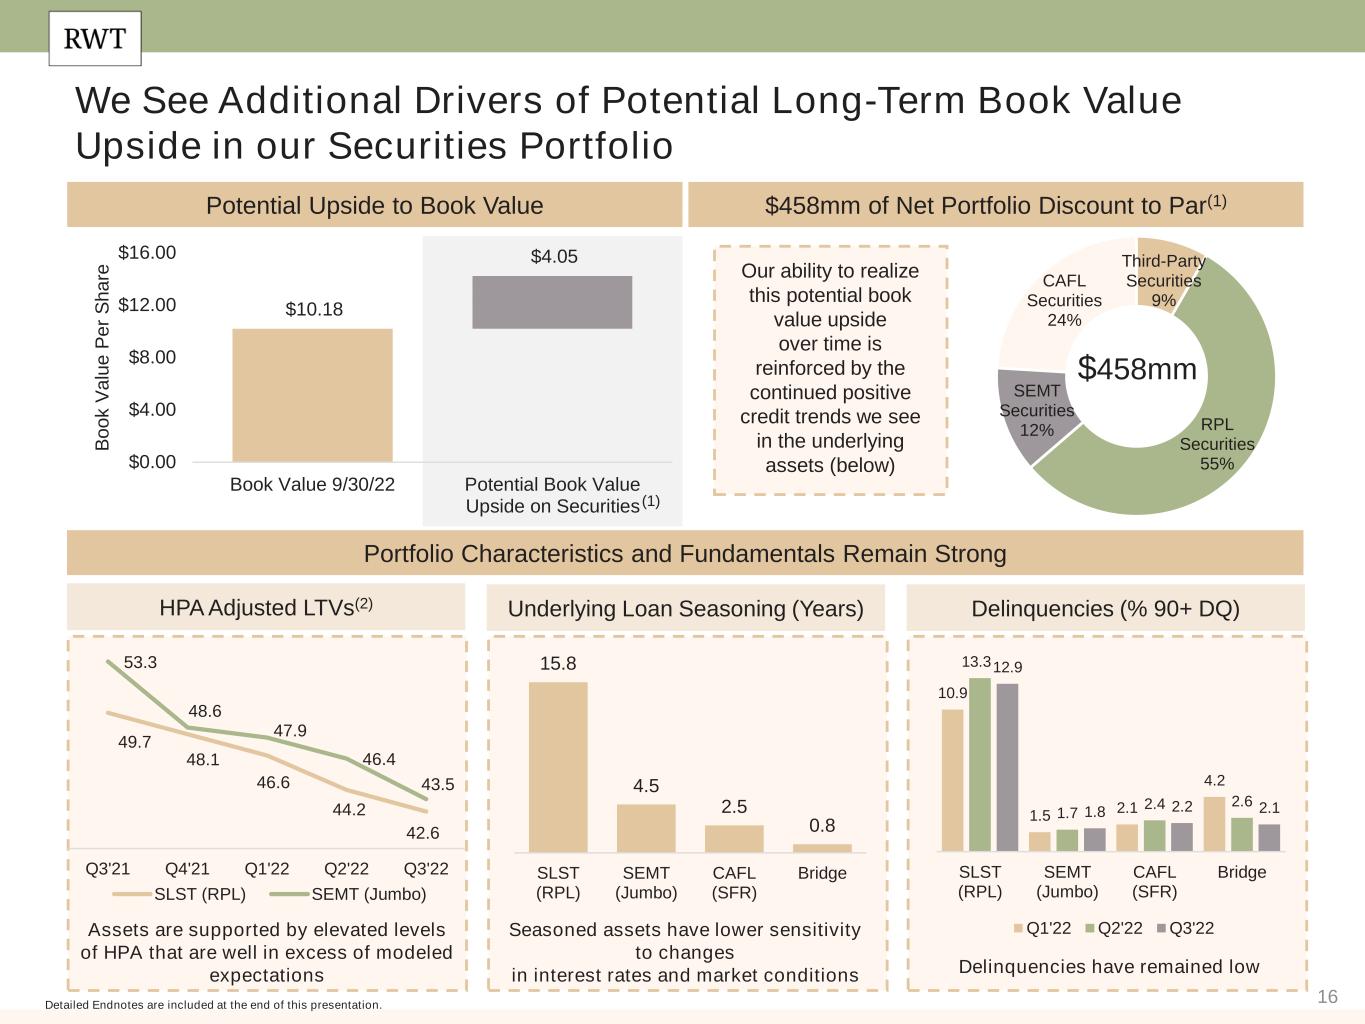
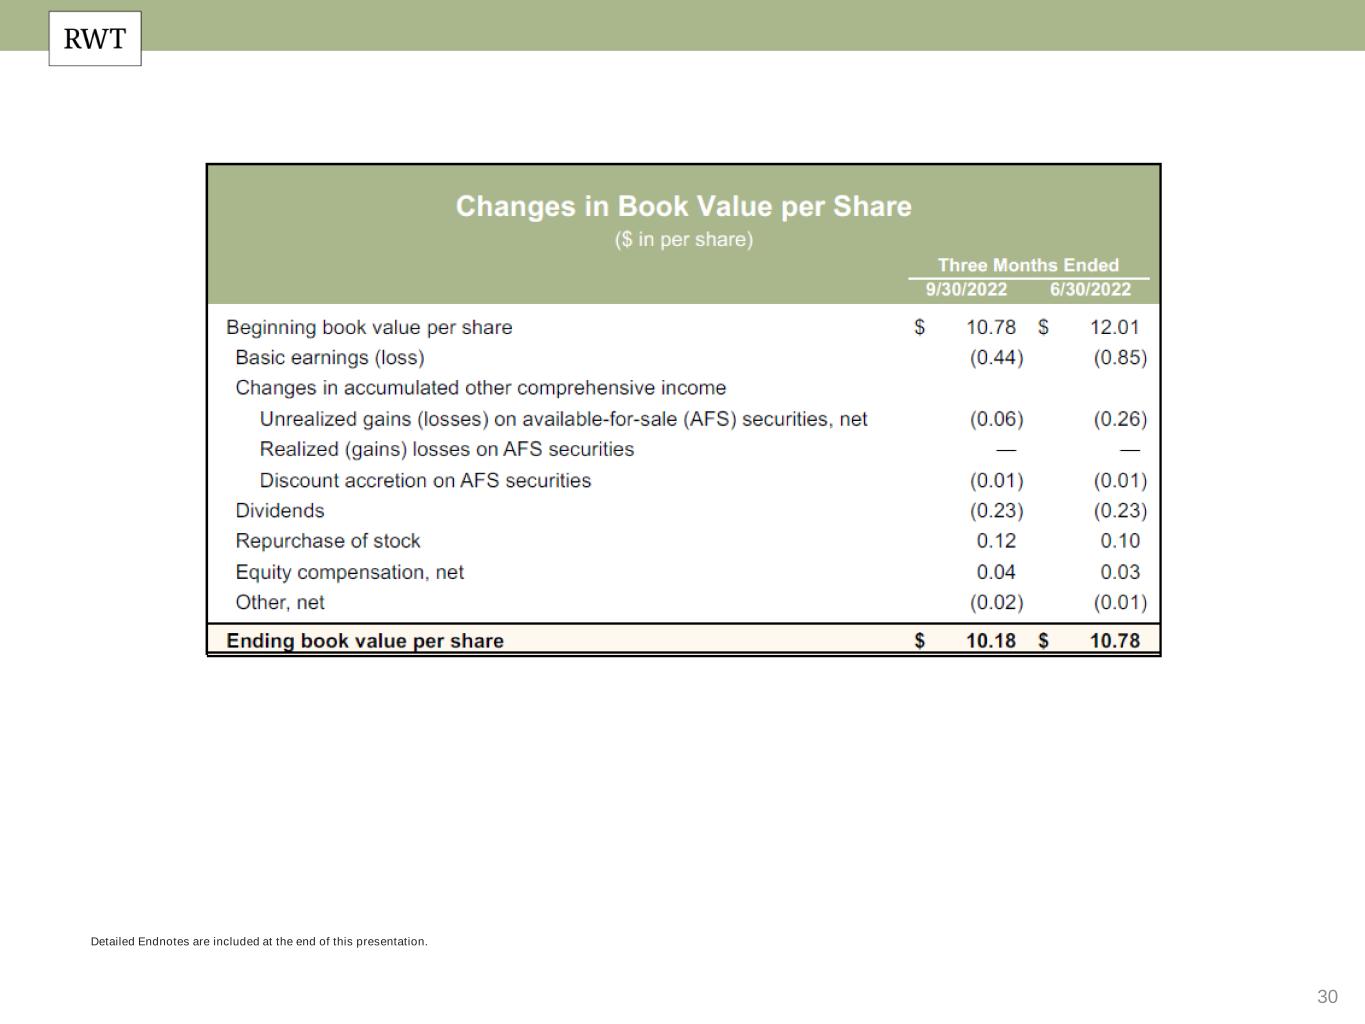
•GAAP book value per common share was $10.18 at September 30, 2022, an approximate 5.6% decrease from $10.78 per share at June 30, 2022
◦Economic return on book value of (3.4)%(1)
•GAAP net loss of $(0.44) per diluted common share
◦$(0.50) per share was attributable to net fair value changes on long-term investments, substantially all of which were unrealized
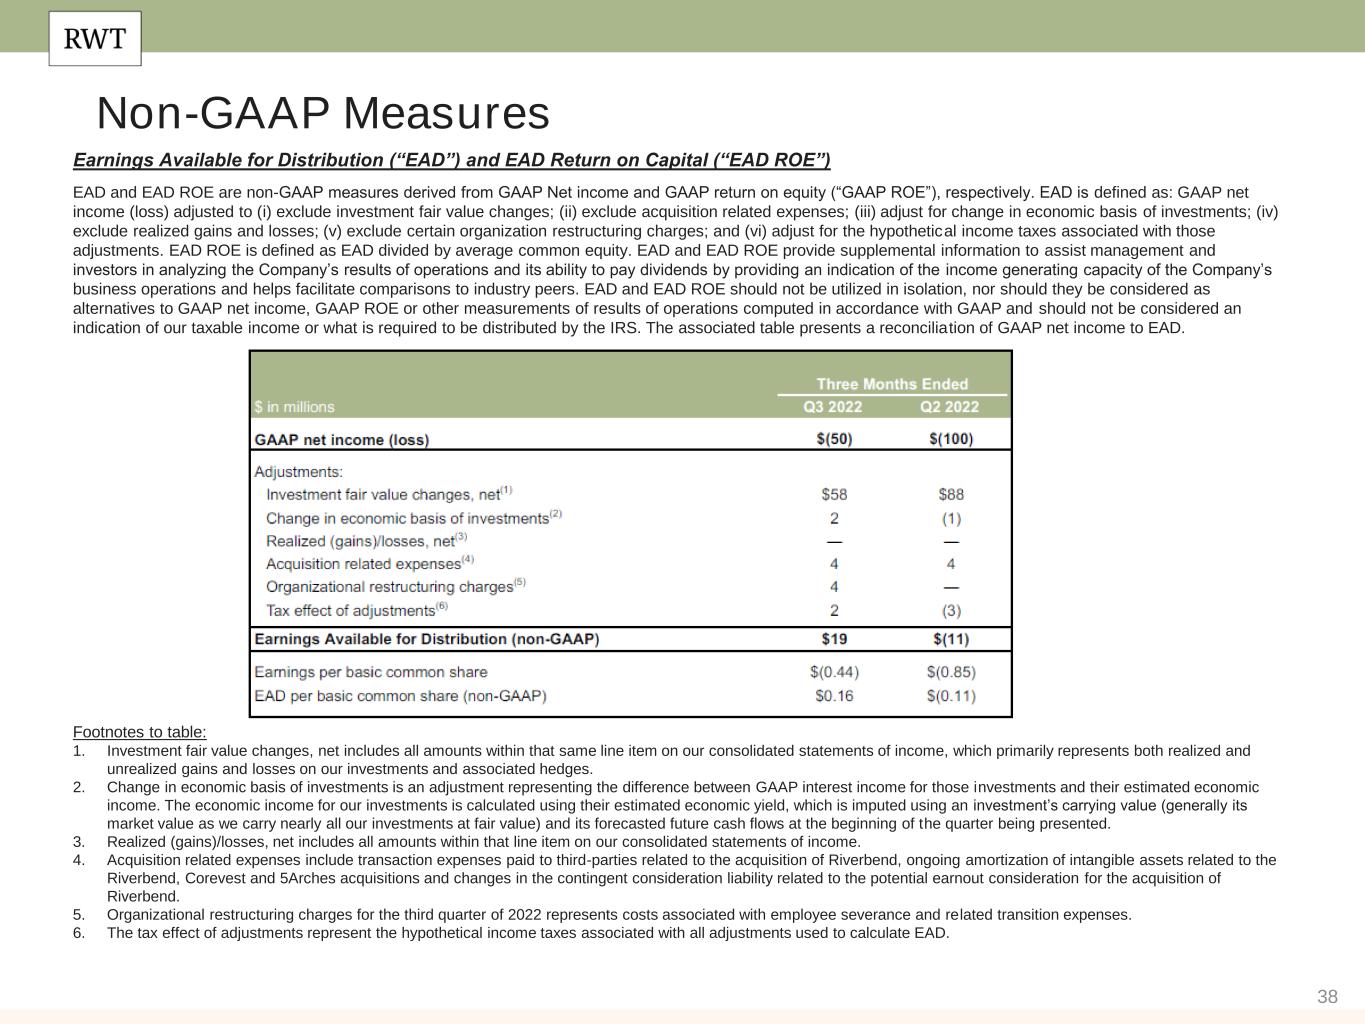
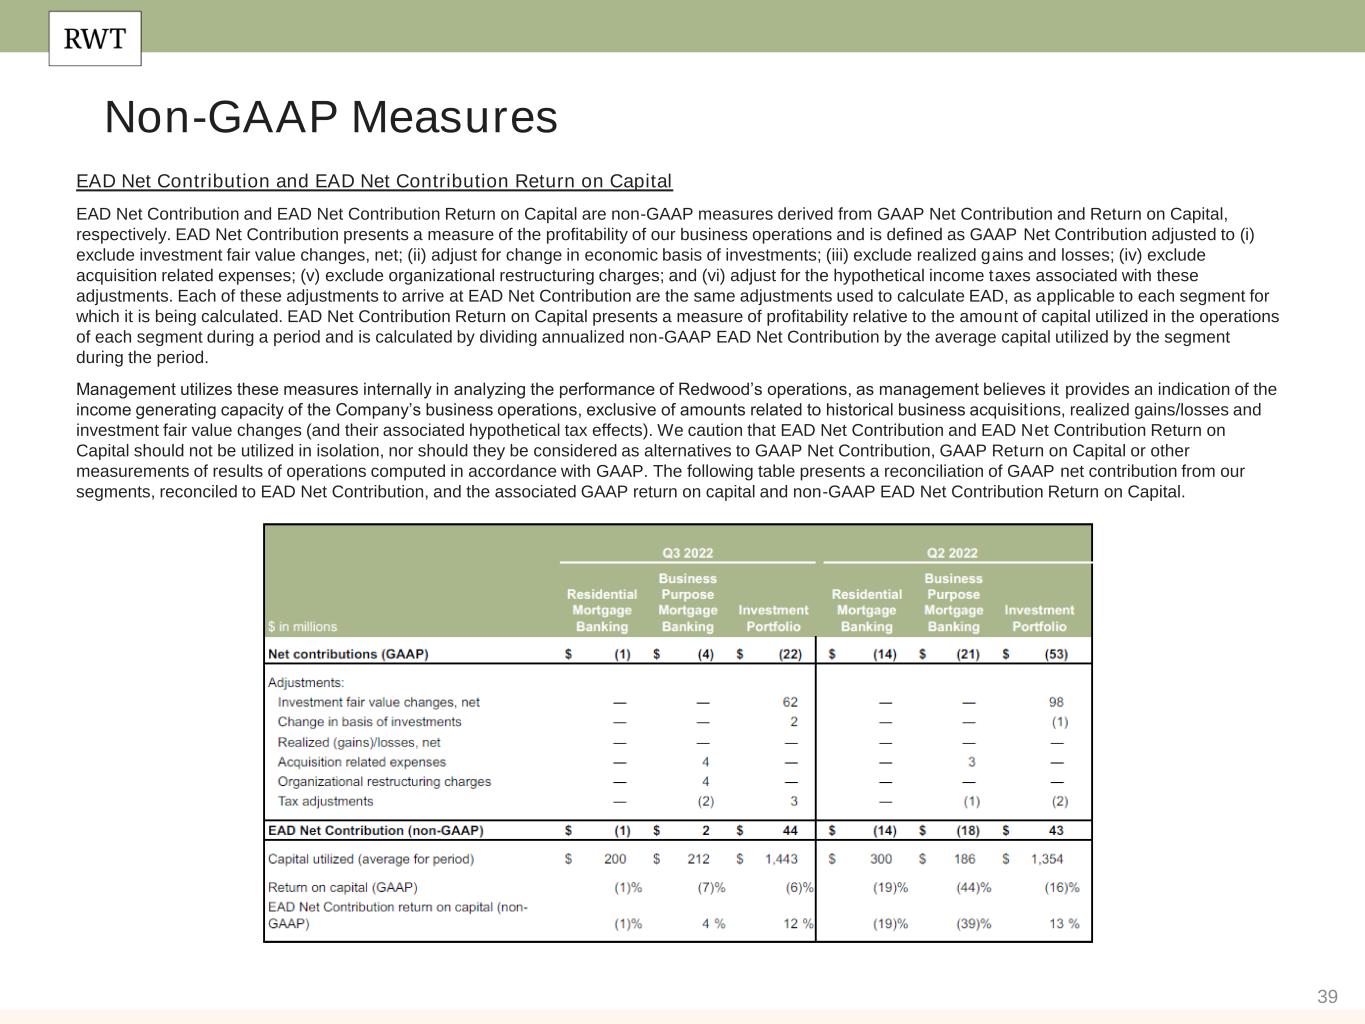
•Non-GAAP Earnings Available for Distribution ("EAD") of $0.16 per basic common share(2)
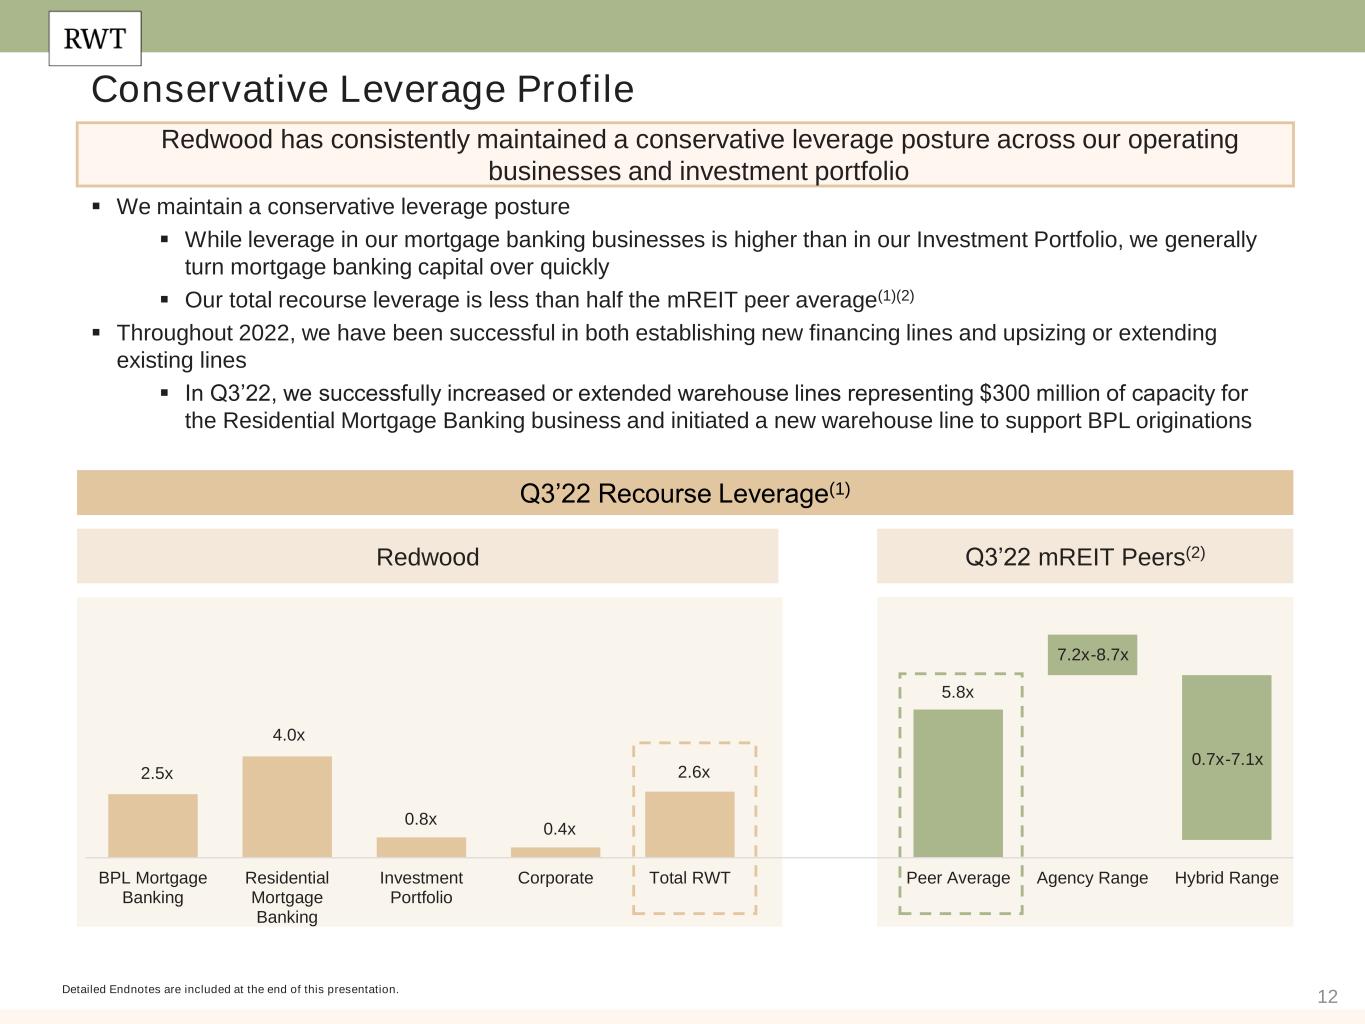
•Recourse leverage ratio of 2.6x at September 30, 2022(3)
•Declared and paid a regular quarterly dividend of $0.23 per common share
Operational Business Highlights
Investment Portfolio
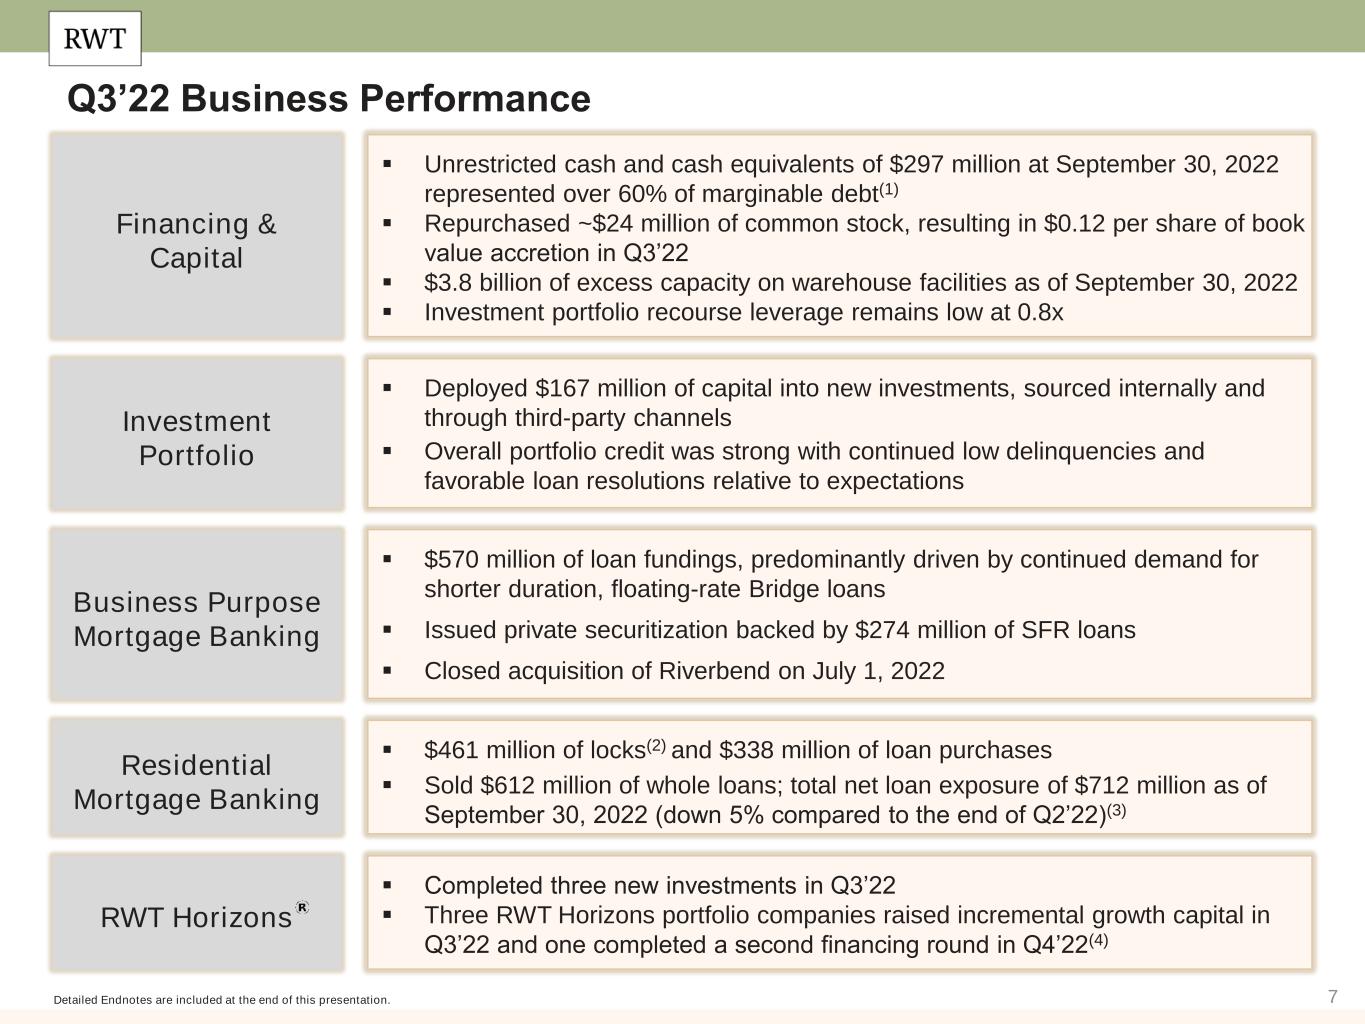
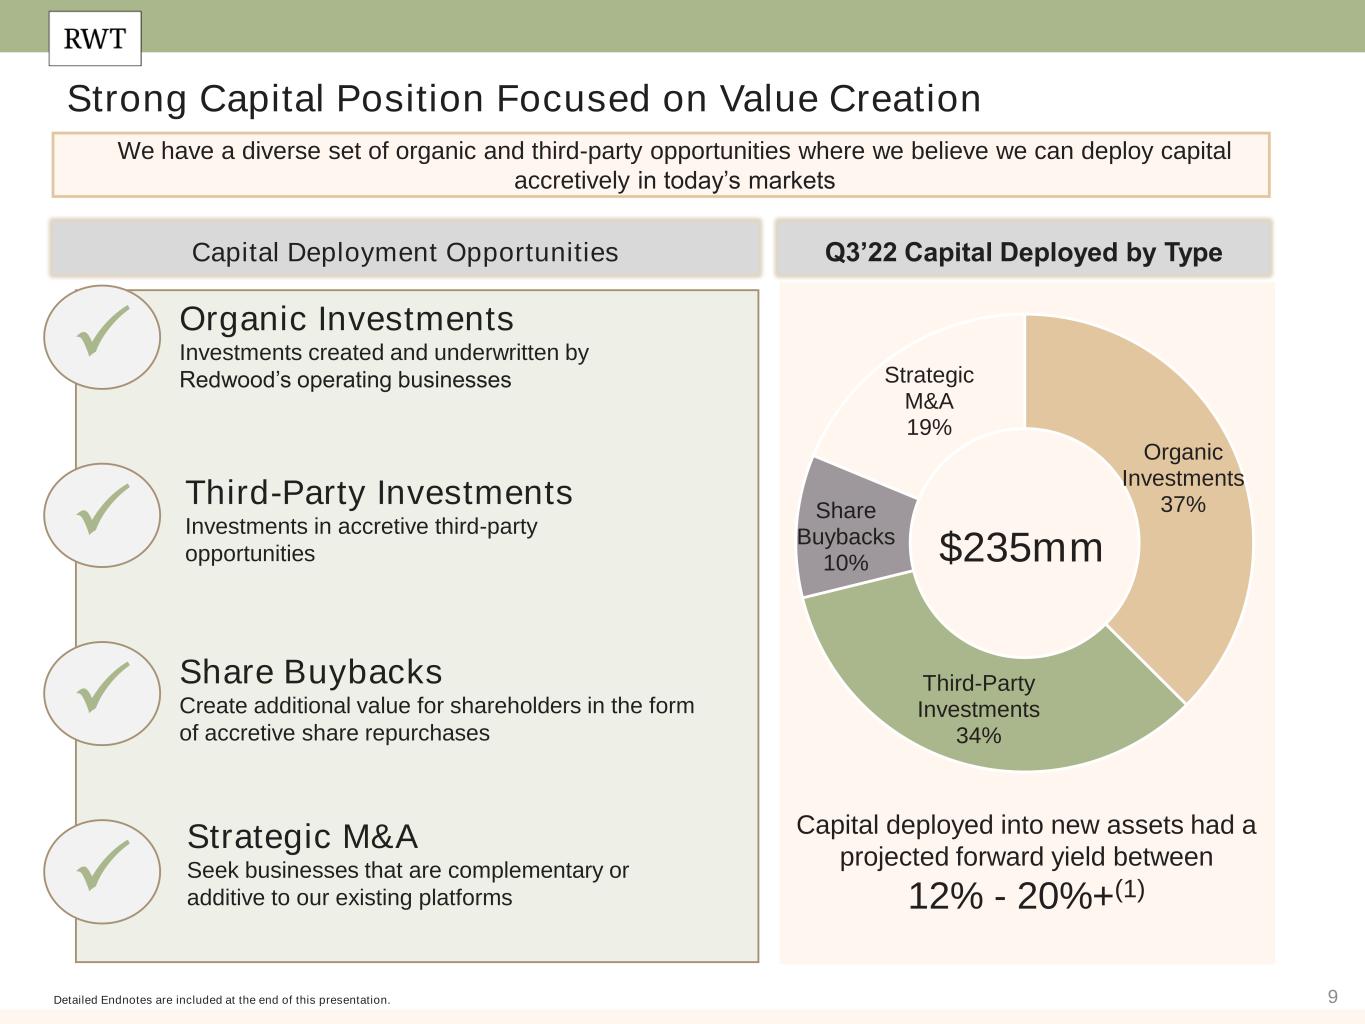
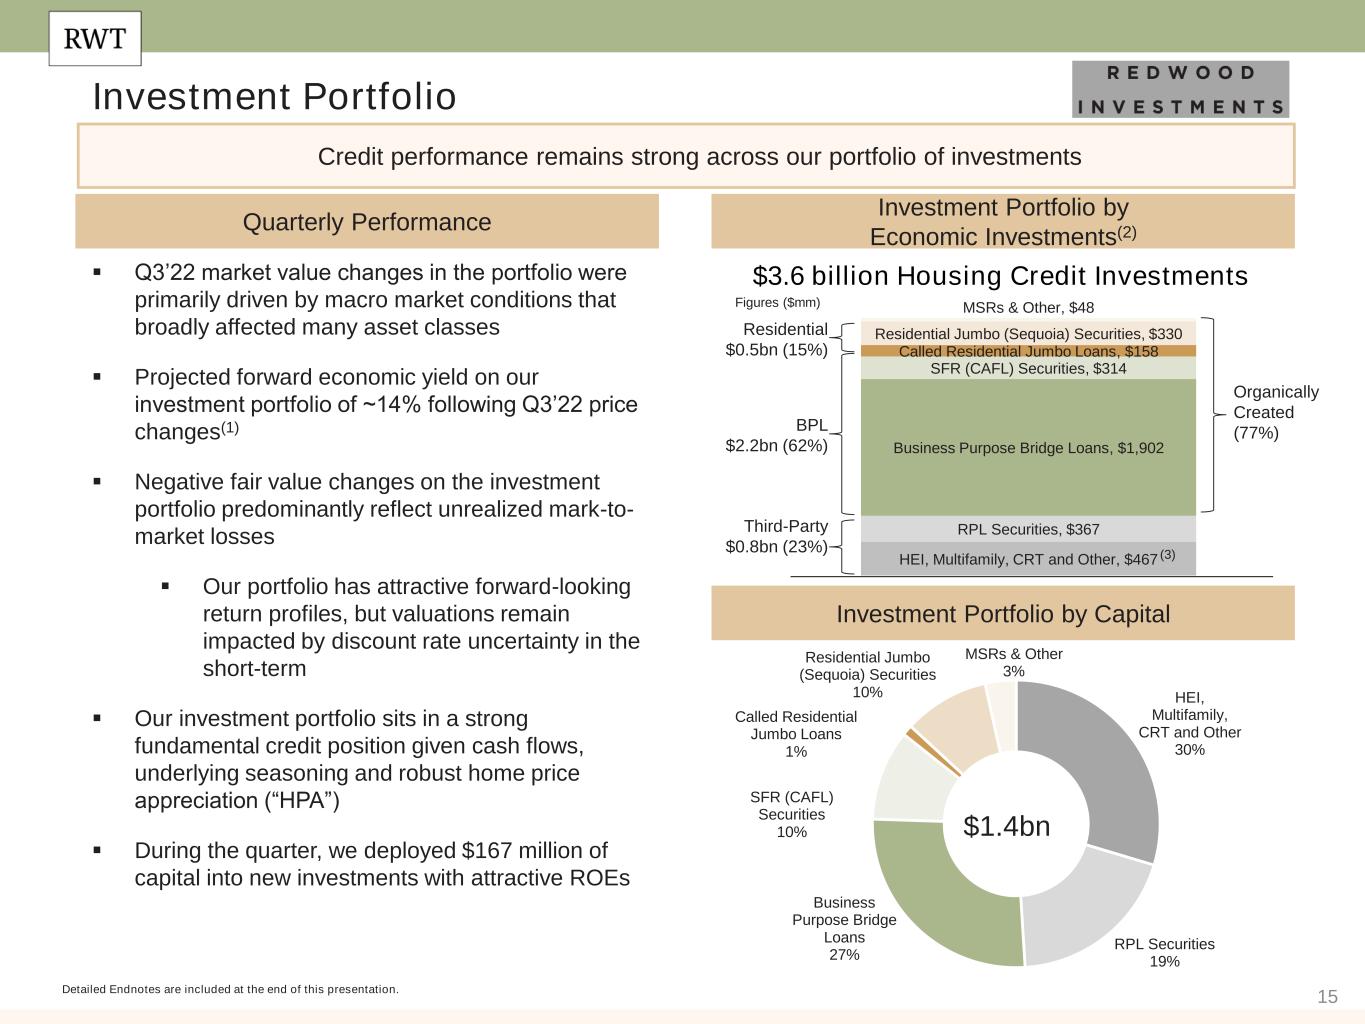
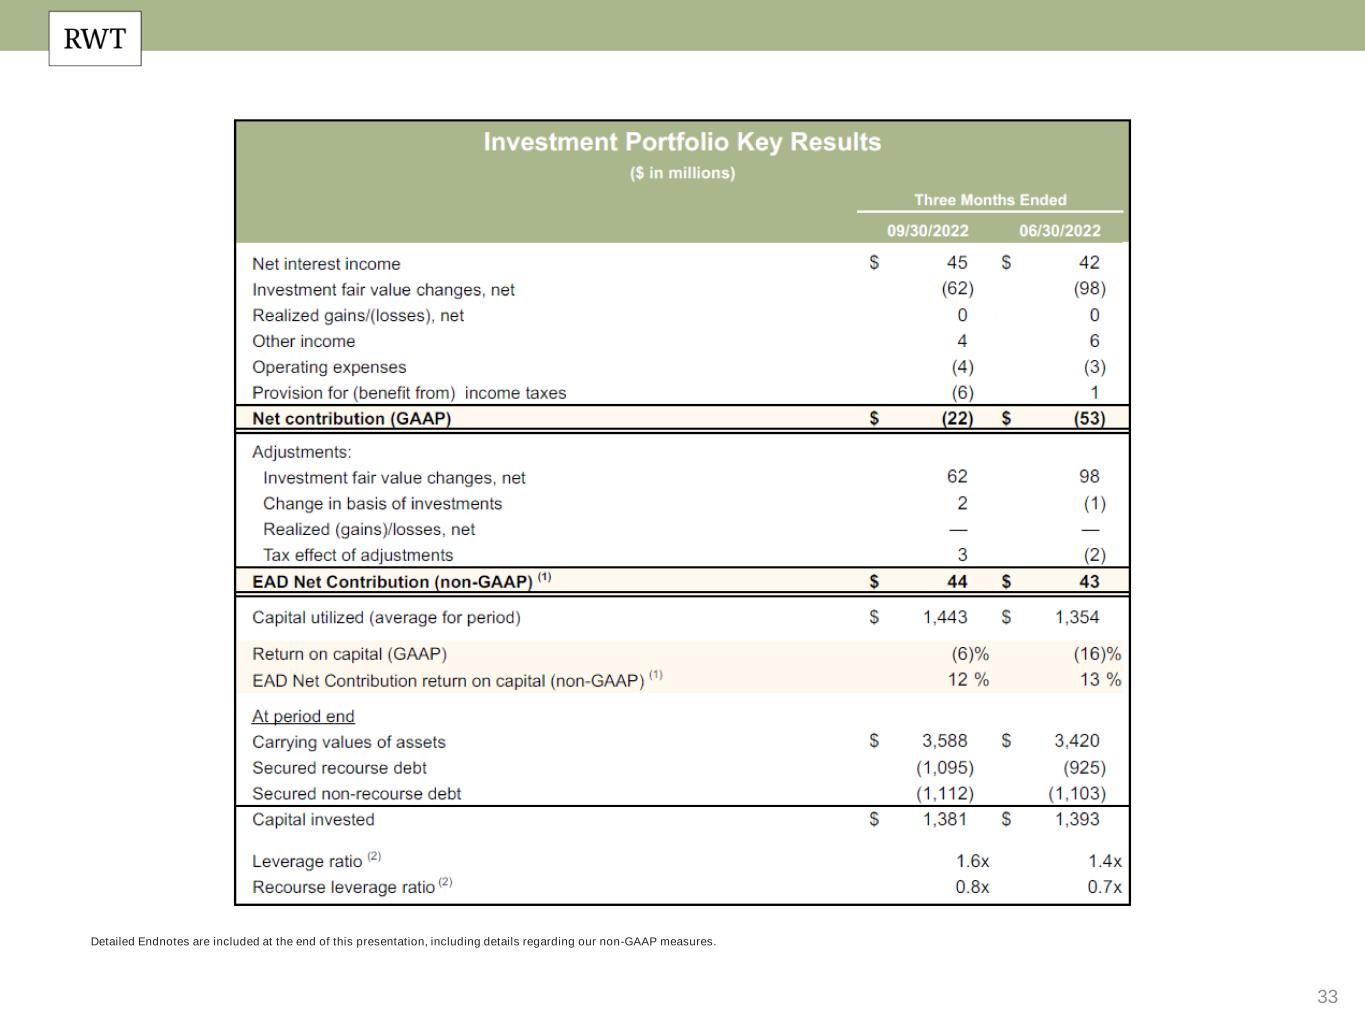
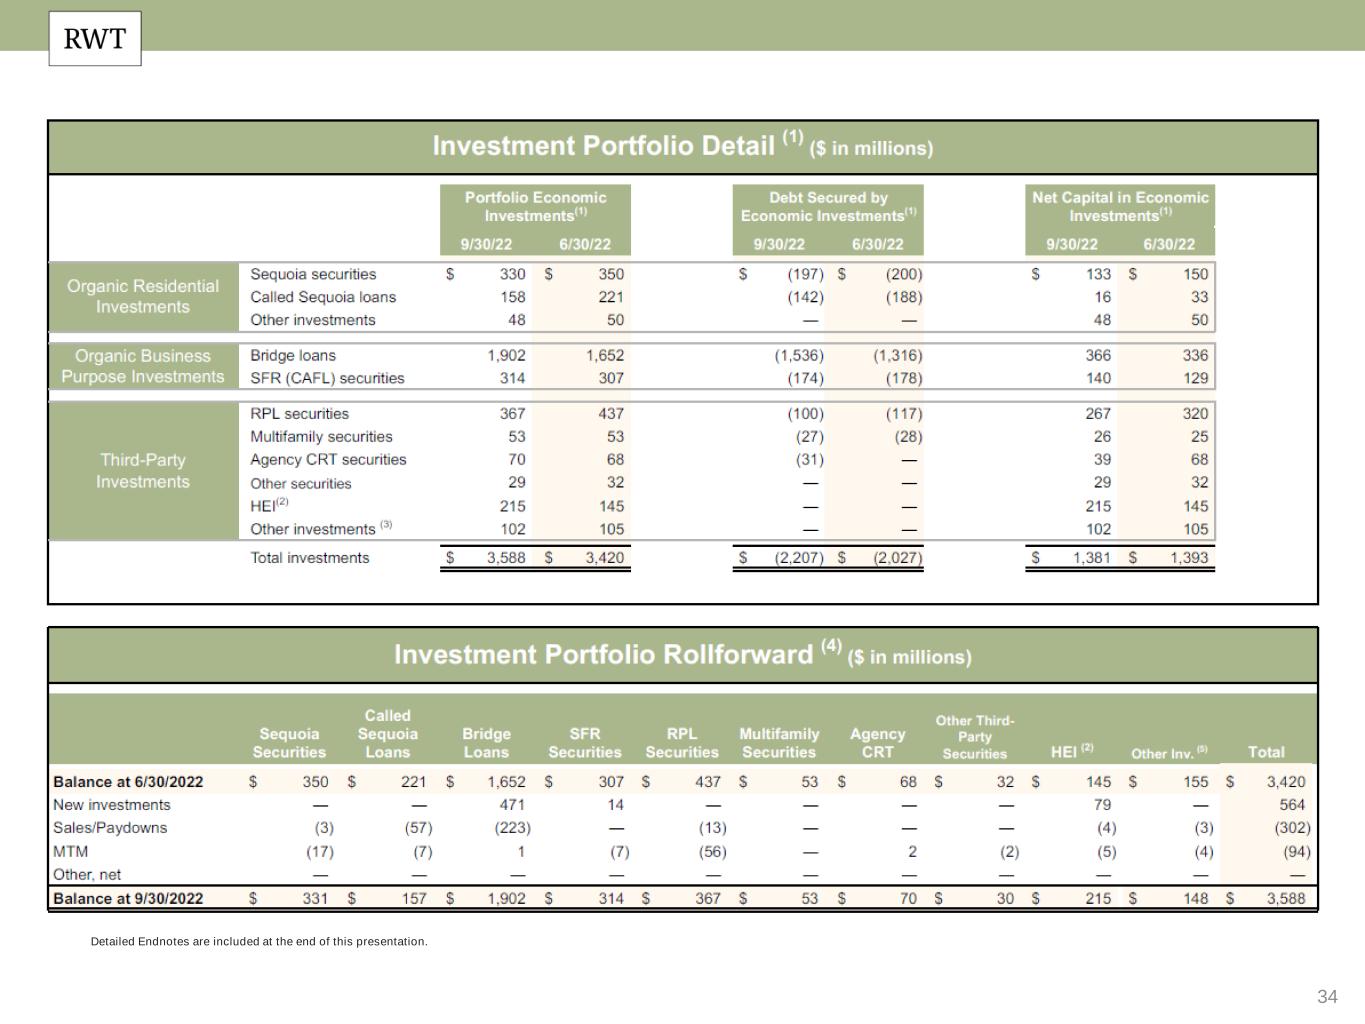
•Deployed $167 million of capital into new, attractively priced organic and third-party investments
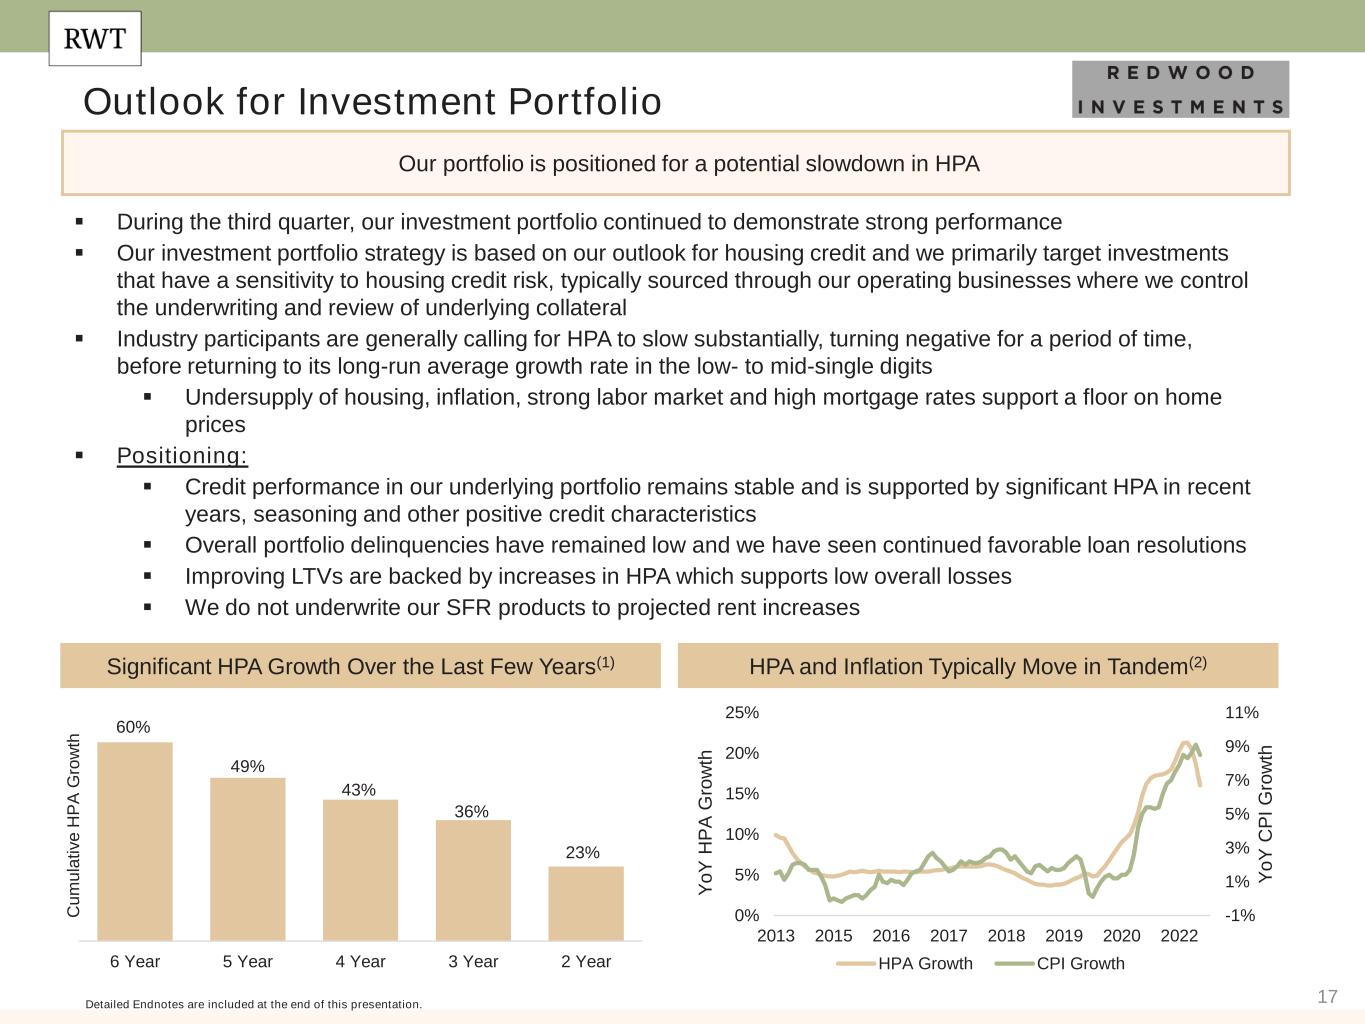
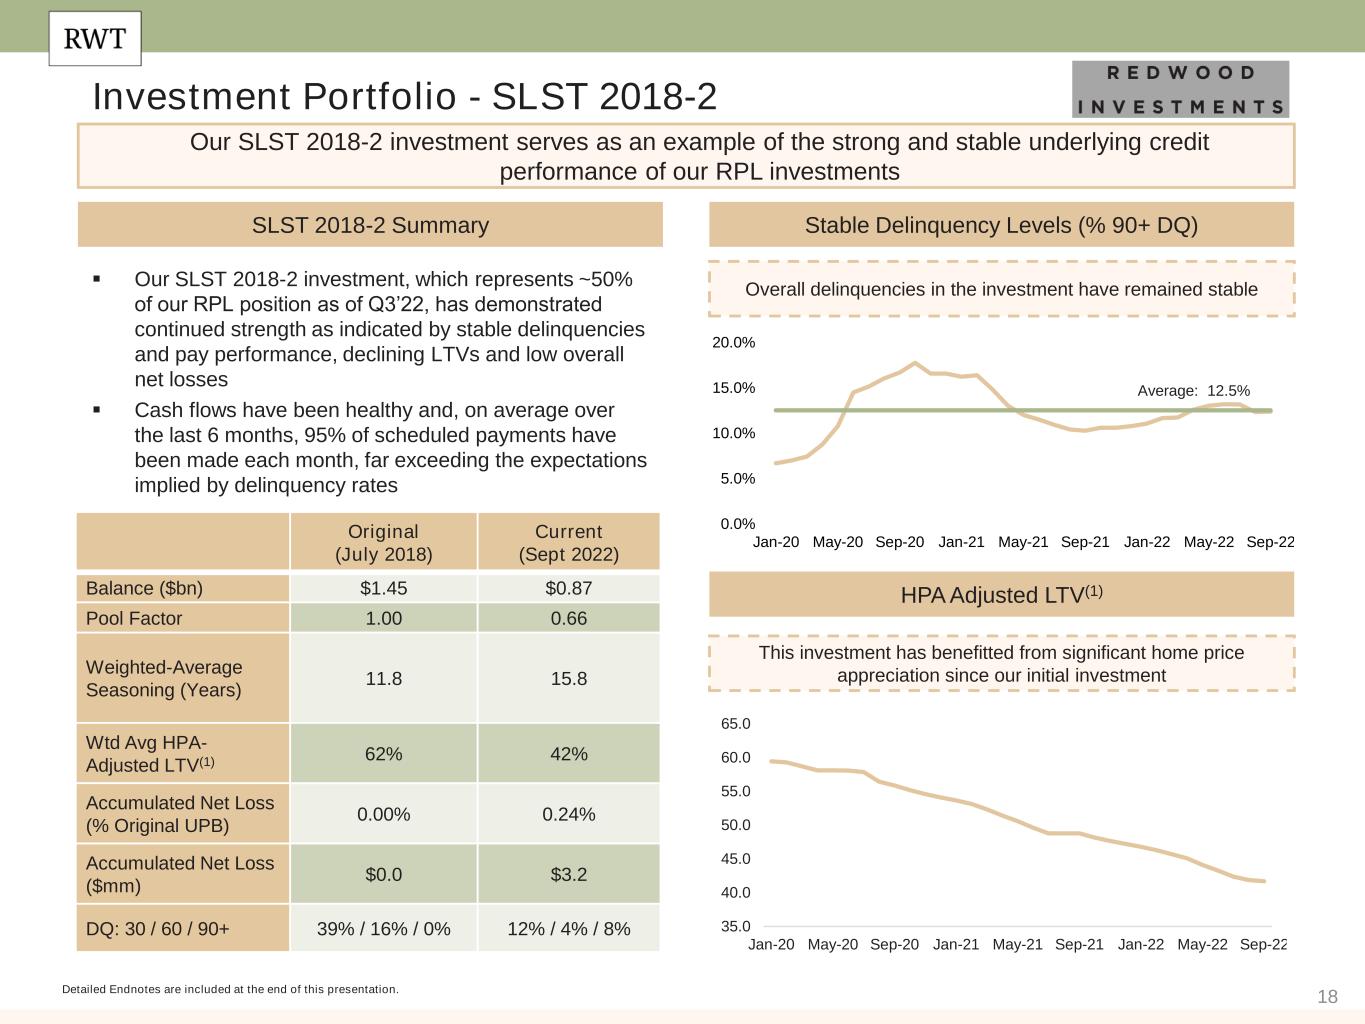
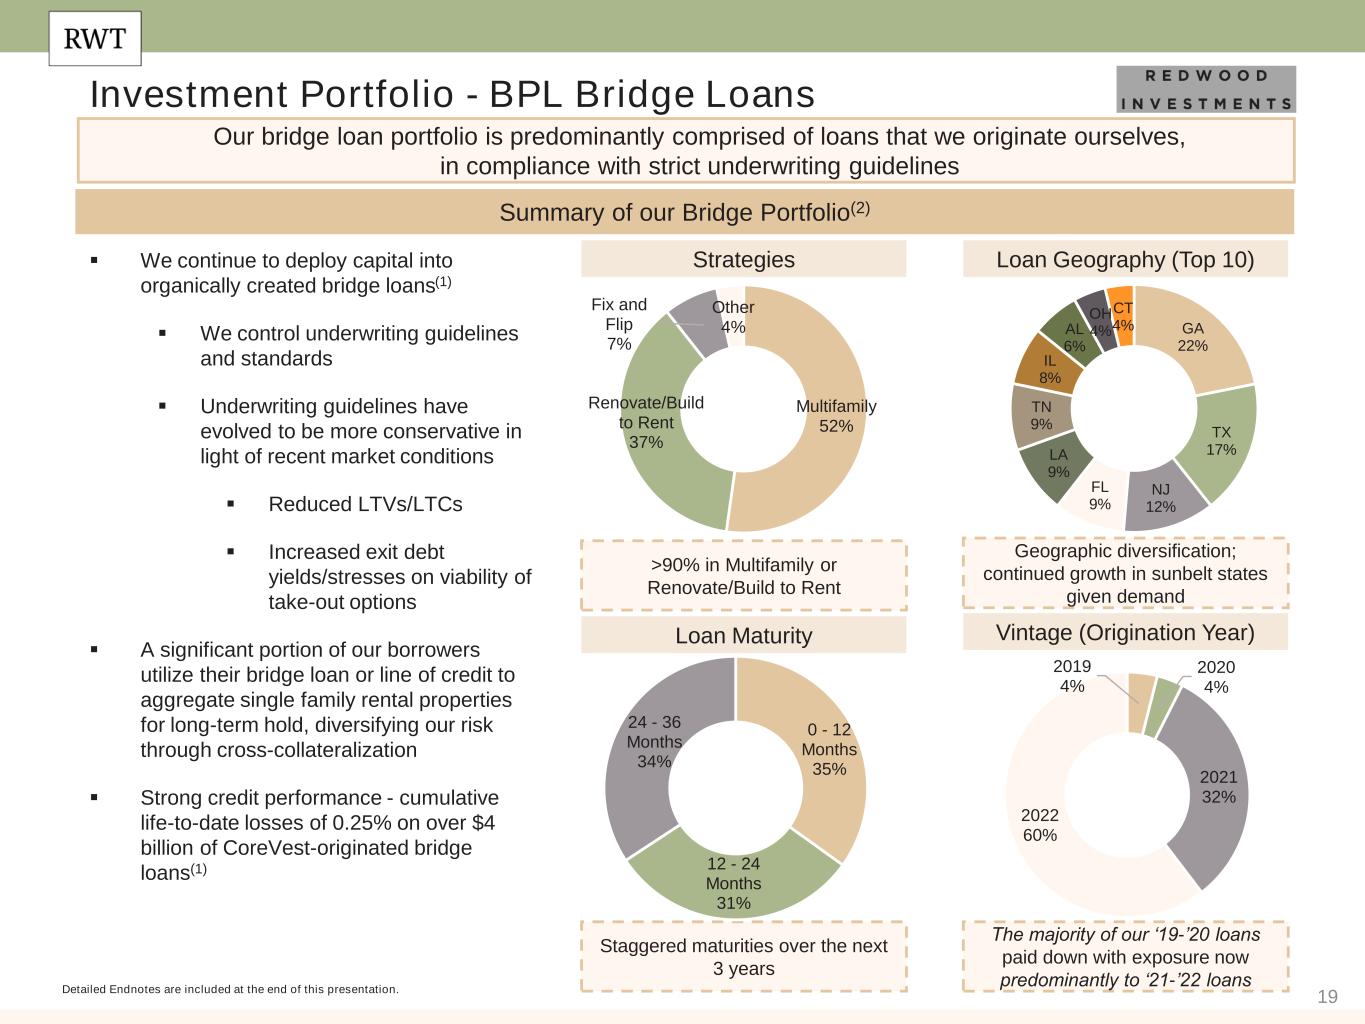
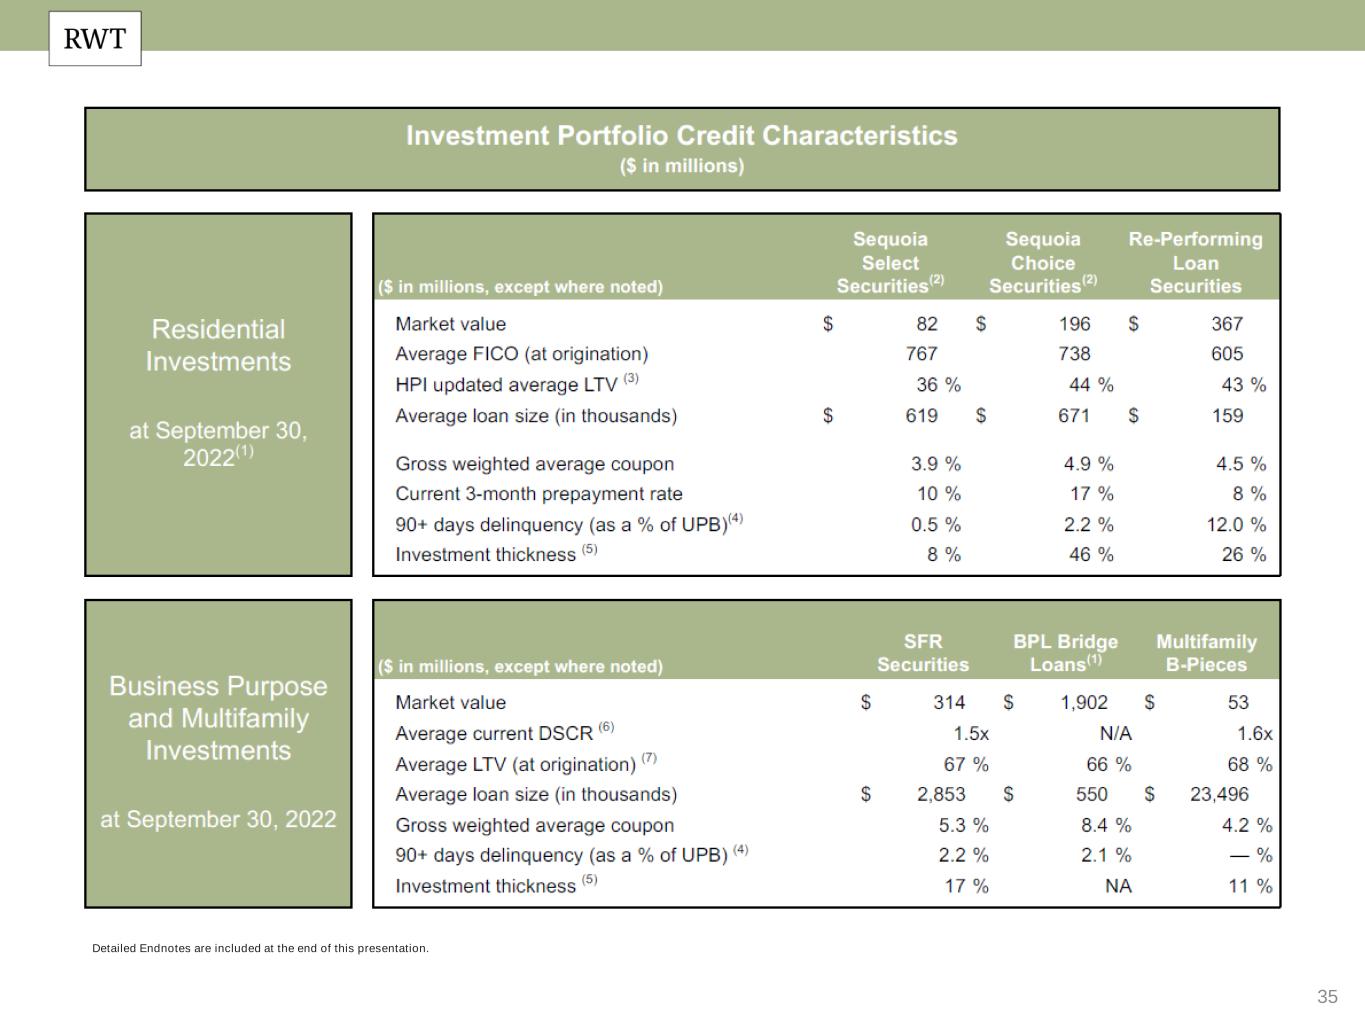
•Credit performance remained strong with stable delinquencies and continued declining LTVs
•Investment Portfolio secured recourse leverage of 0.8x as of September 30, 2022(4)
Business Purpose Mortgage Banking
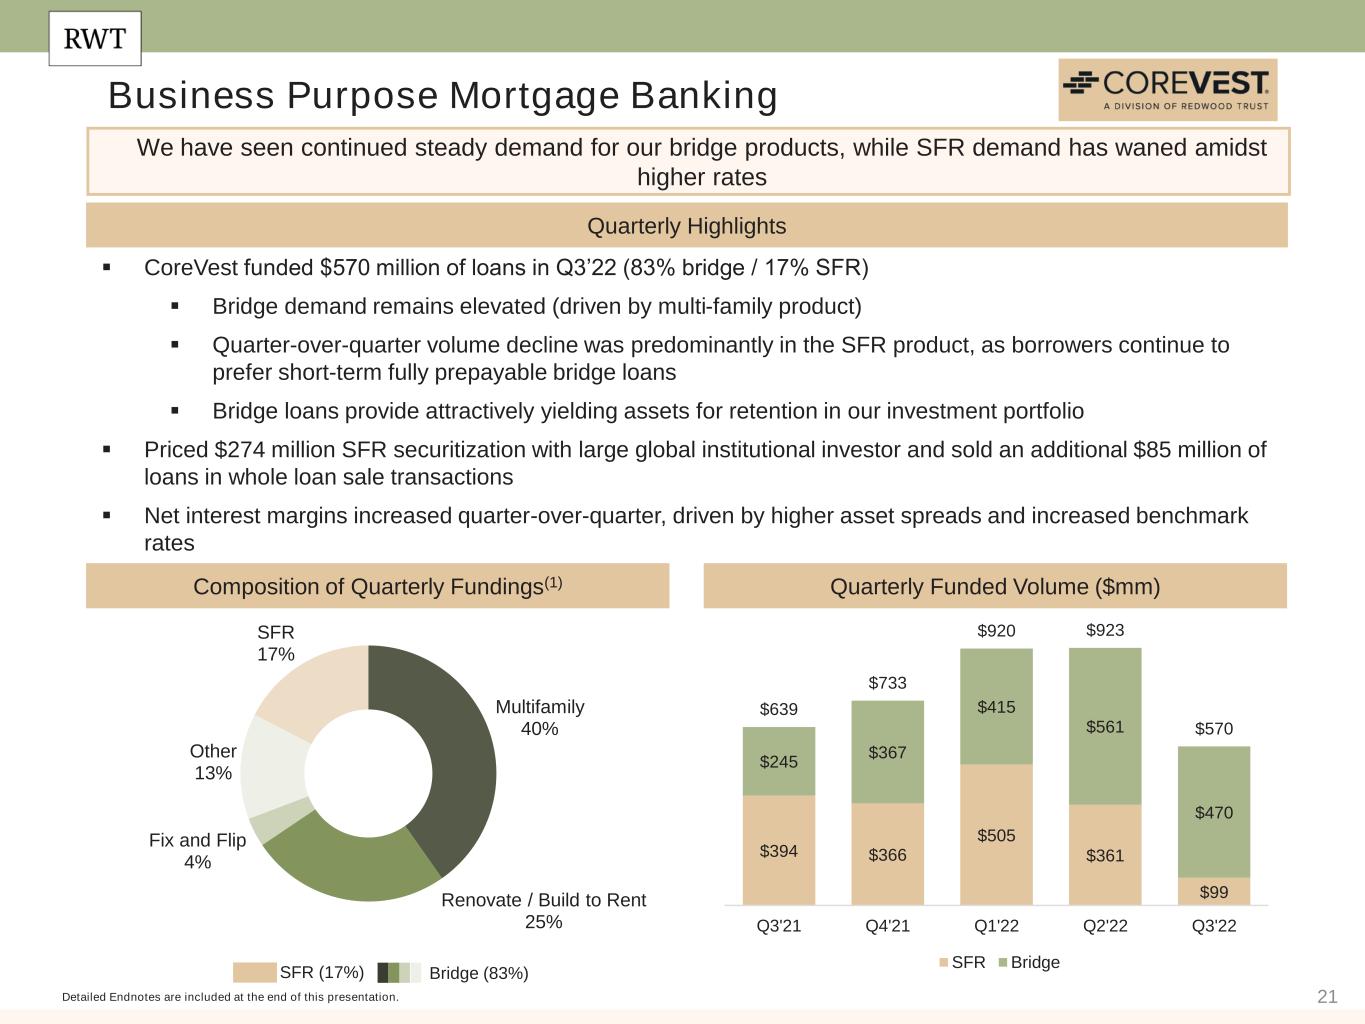
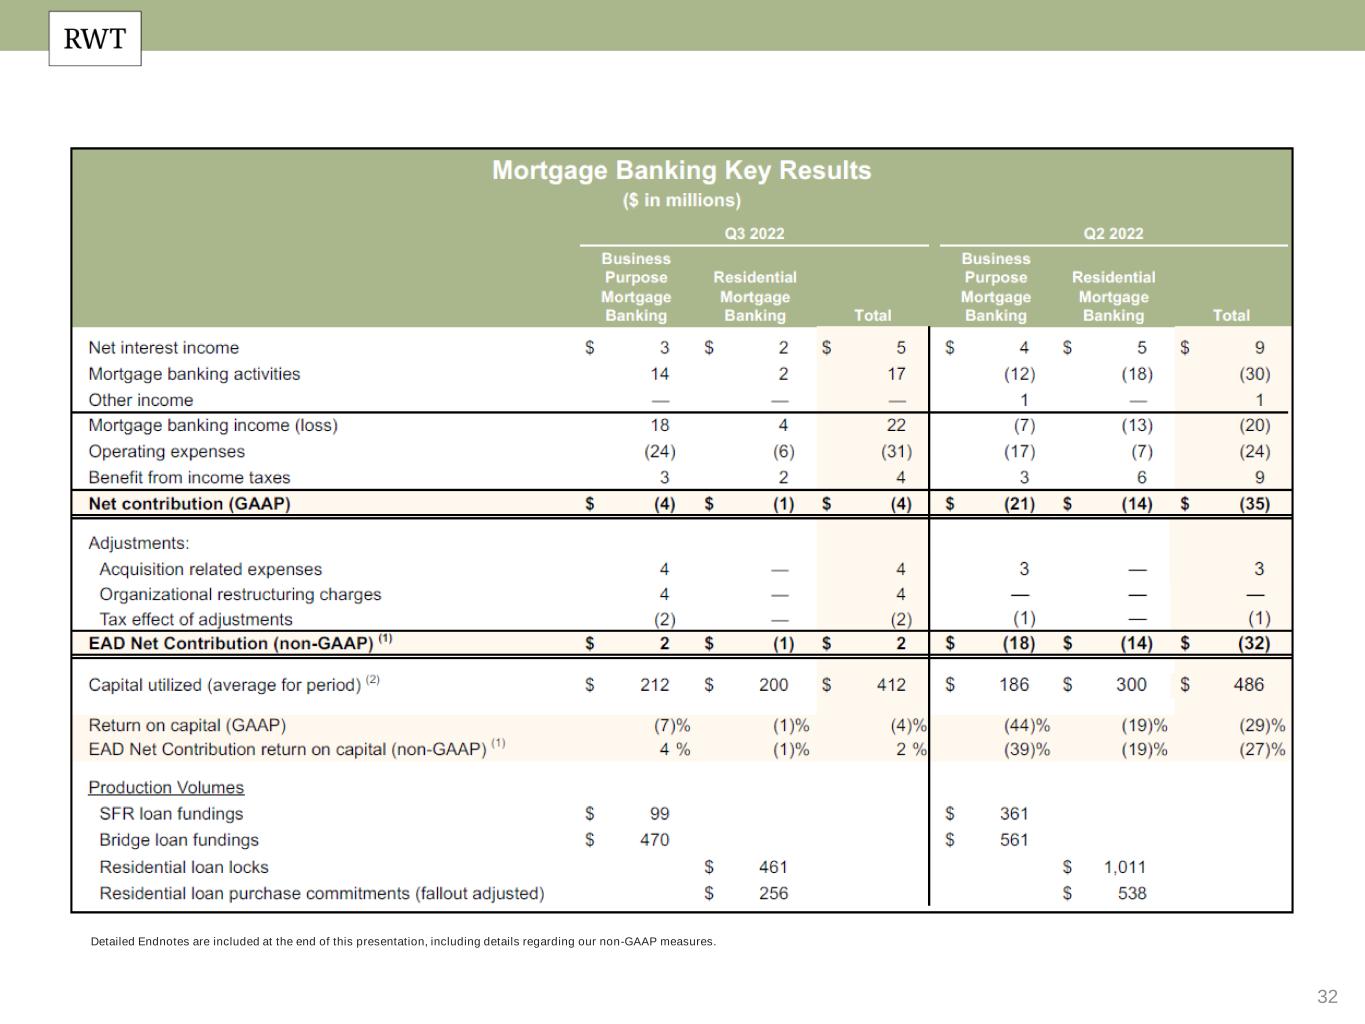
•Funded $570 million in business purpose loans; 83% Bridge and 17% Single-Family Rental ("SFR")
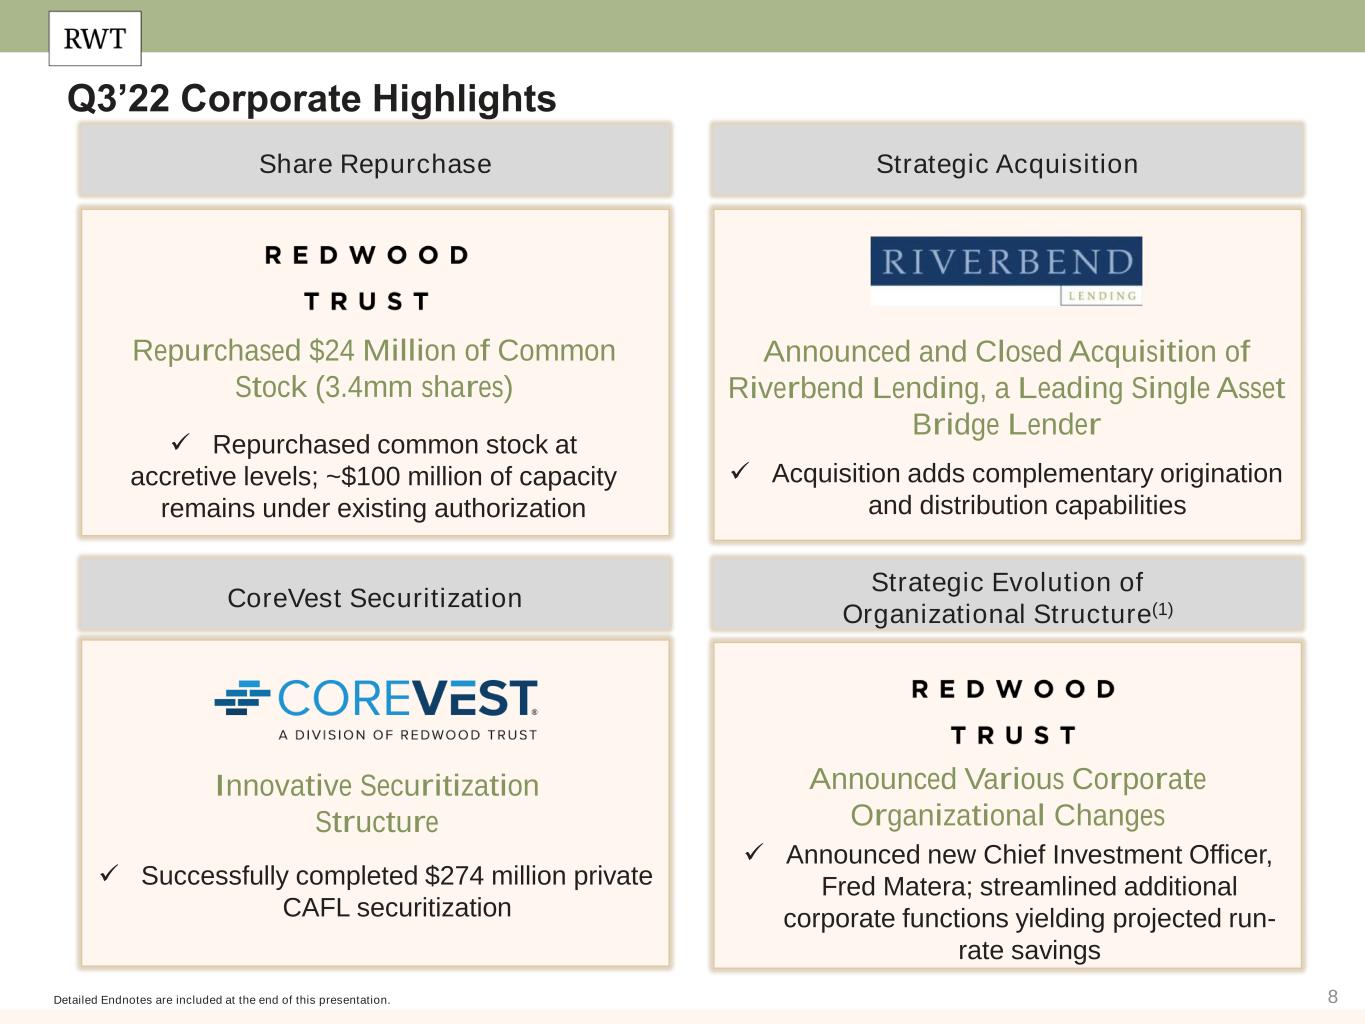
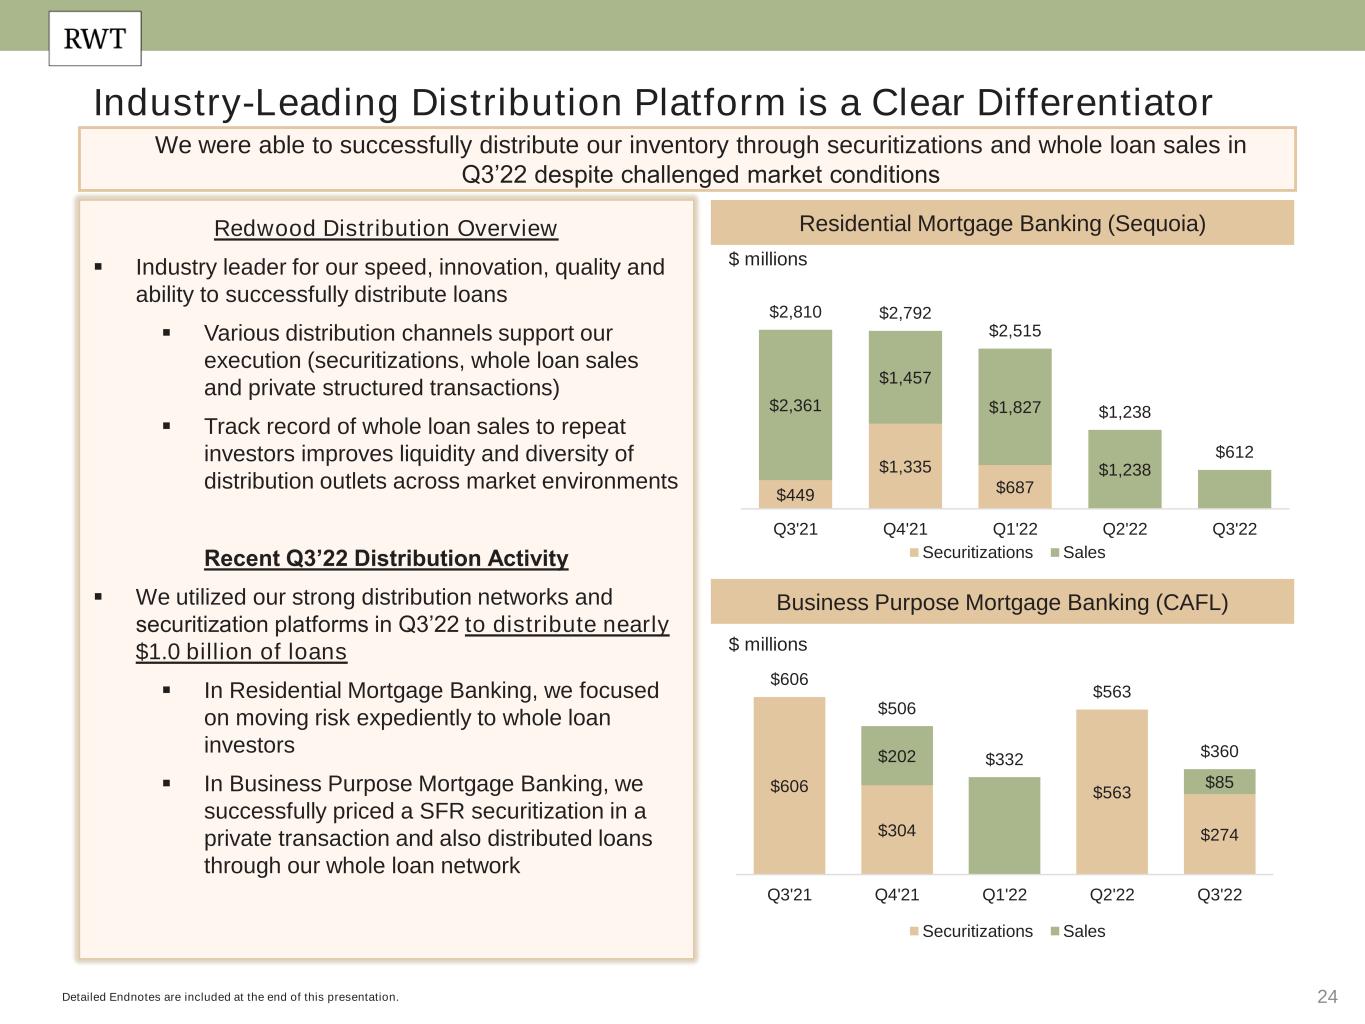
•Securitized $274 million of loans in a private securitization backed by SFR loans
•Closed the previously announced acquisition of Riverbend Funding, LLC and its subsidiaries ("Riverbend"), a best-in-class private mortgage lender to investors in transitional residential and multifamily real estate, for an initial cash purchase price of approximately $44 million paid at closing(5)
Residential Mortgage Banking
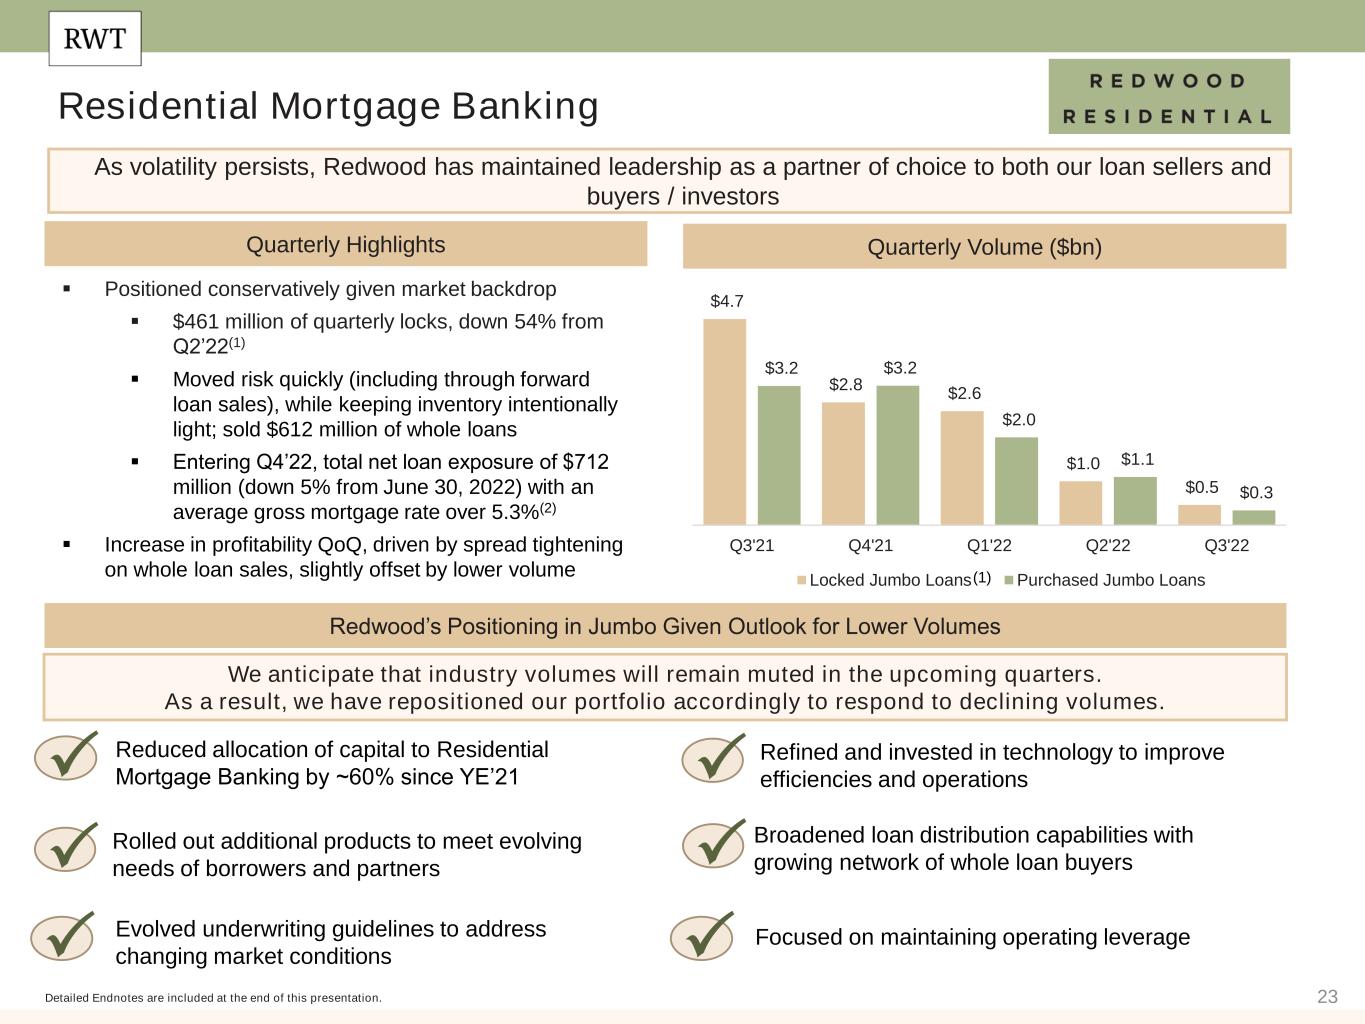
•Distributed $612 million of jumbo loans through whole loan sales; at September 30, 2022, total net jumbo loan exposure was $712 million(6)
•Intentionally maintained light volume, locking $461 million of jumbo loans, down from $1.0 billion in second quarter 2022(7); loan purchase commitments were $256 million, down from $538 million in second quarter 2022(8)
1
Financing and Capital Markets Highlights
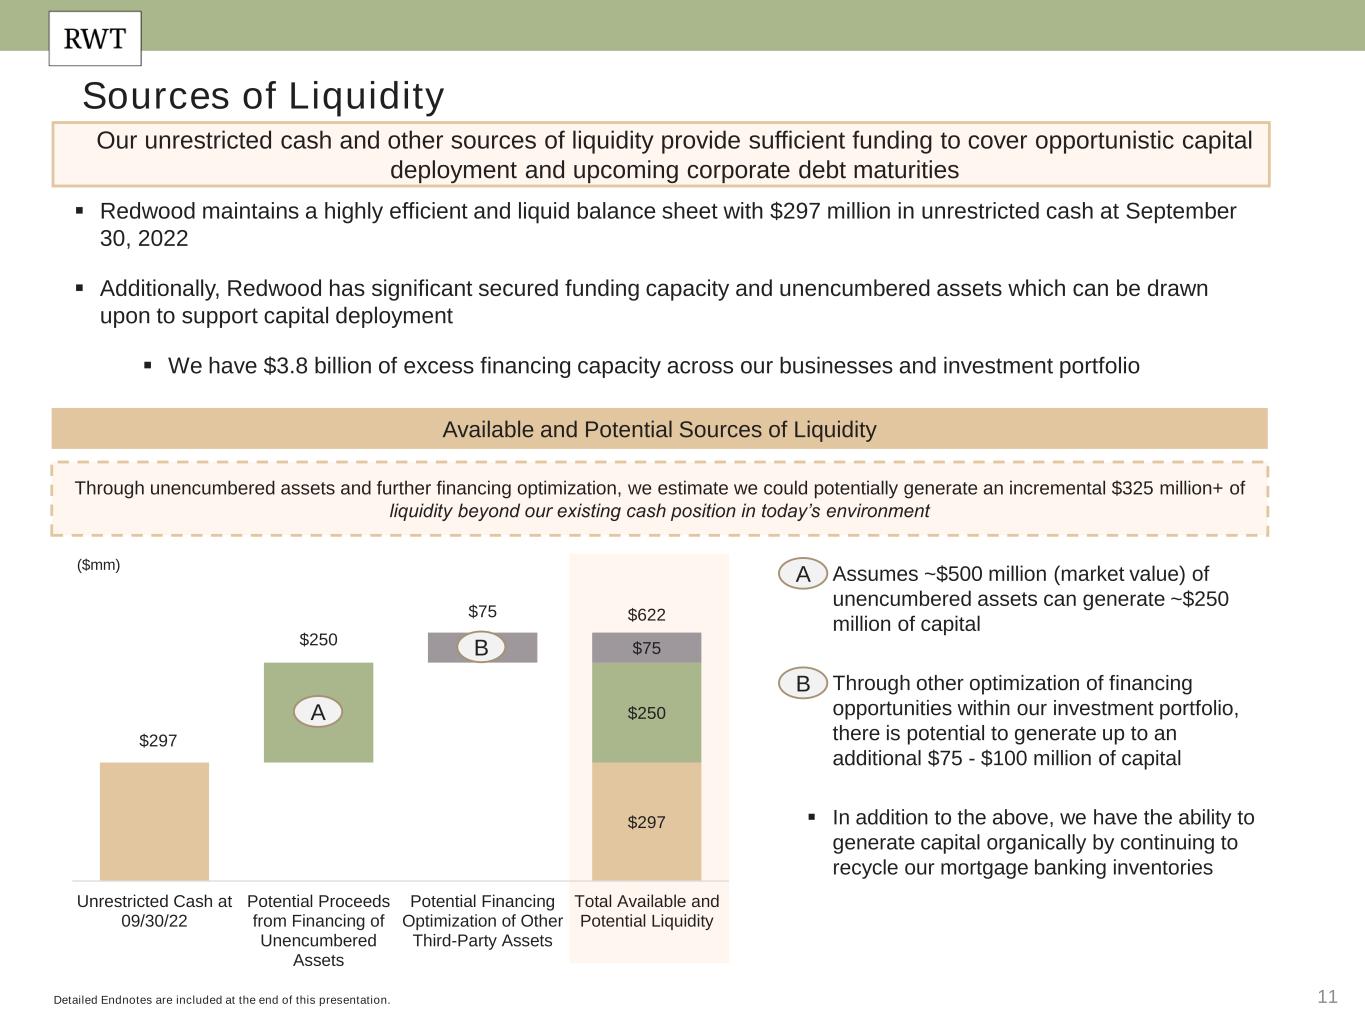
•Maintained robust balance sheet with unrestricted cash of $297 million and unencumbered assets of $491 million at September 30, 2022
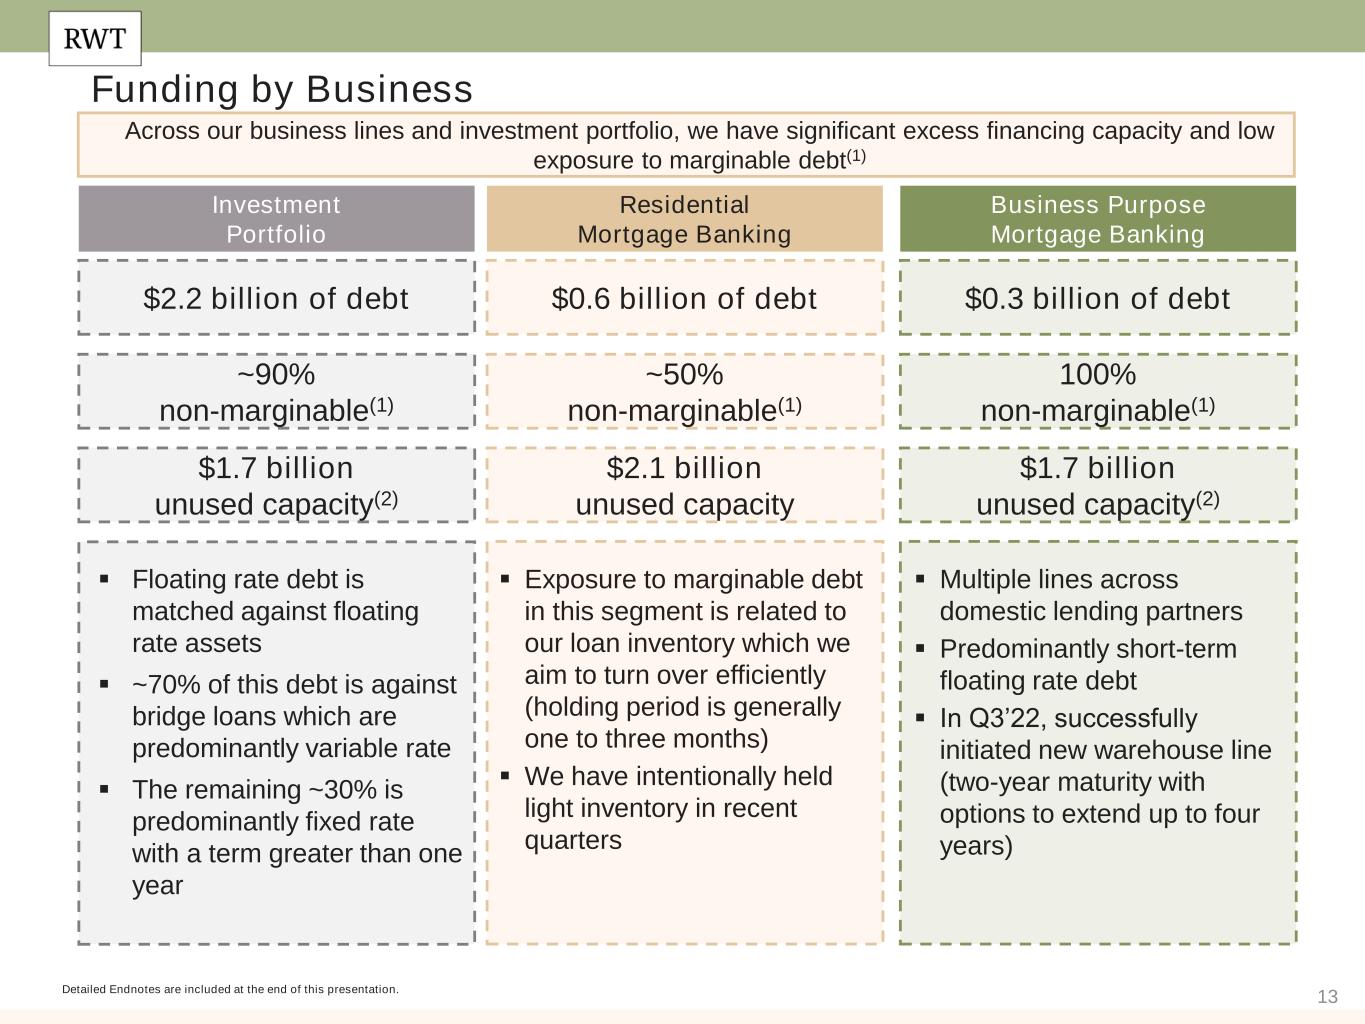
•Added $900 million of new financing capacity across multiple borrowing facilities (with both new and existing domestic depository institutions) in the third quarter to further support operating platforms
◦Successfully renewed warehouse lines with maturities in the third quarter at unchanged advance rates
◦Ended third quarter with $3.8 billion of unused financing capacity across Residential and Business Purpose Mortgage Banking segments
•Total margin call activity in the third quarter resulted in a net return of cash to Redwood from financing and hedging counterparties
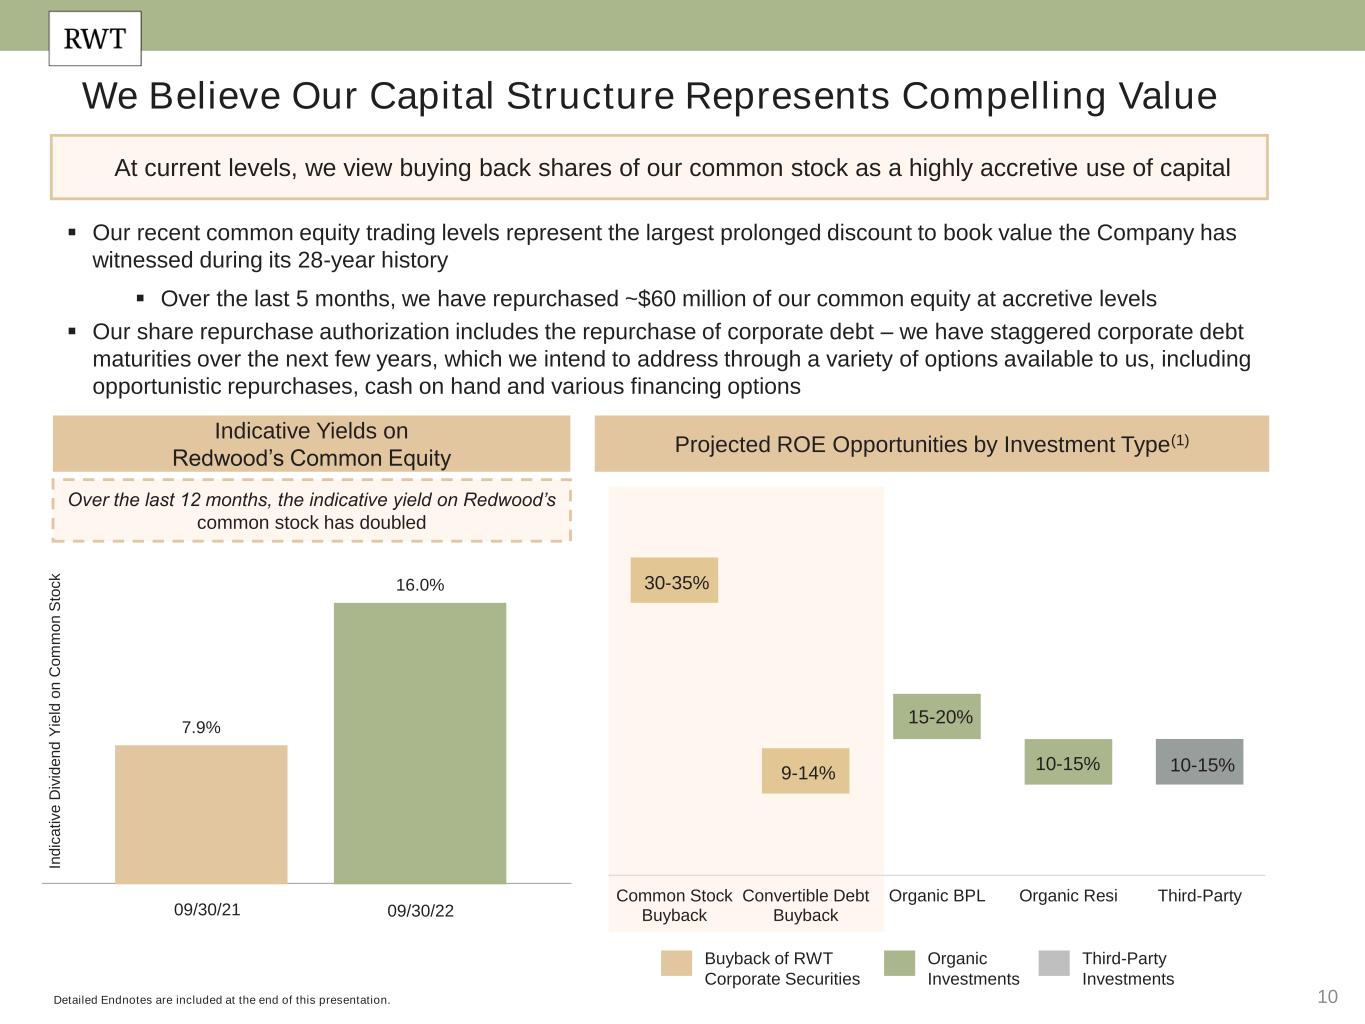
•Repurchased 3.4 million shares of Redwood’s common stock at a cost of $24 million, resulting in $0.12 per share of book value accretion in the third quarter
RWT Horizons Highlights
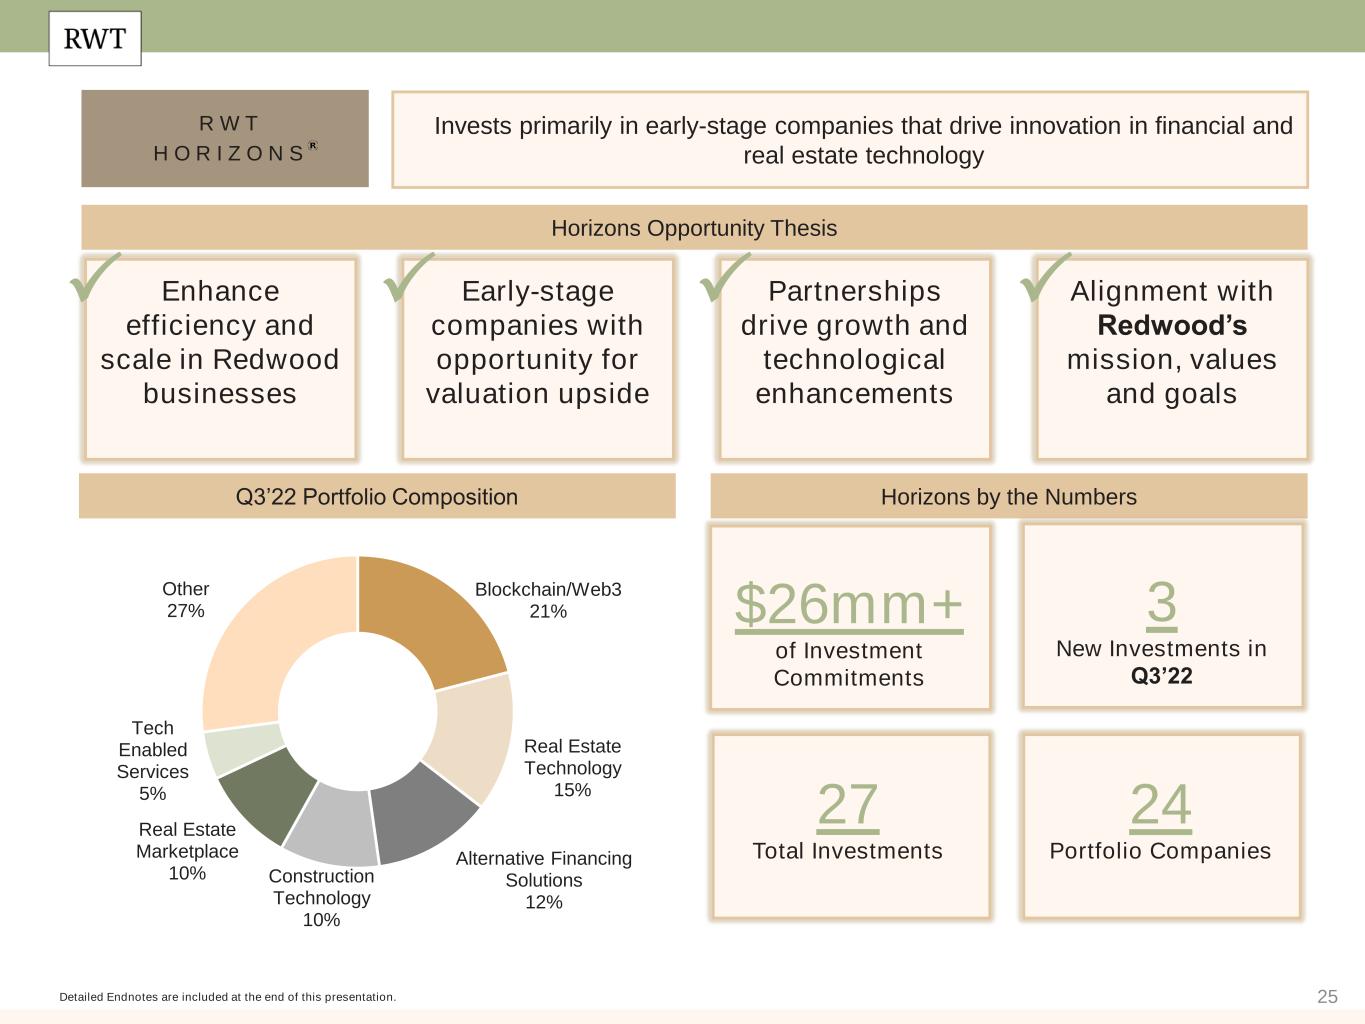
•Completed three new investments in the third quarter
•Since inception, RWT Horizons has completed 27 technology venture investments in 24 companies with an aggregate of over $26 million of investment commitments
“The third quarter was in many ways a continuation of market and macro themes that have dominated much of 2022,” said Christopher Abate, Chief Executive Officer of Redwood. “While volatility persisted, our strong liquidity allowed us to navigate challenging market conditions, serve our customers, and remain well positioned for the inevitable opportunities that arise from dislocation. We remain very pleased with the credit performance and fundamentals underlying our carefully constructed investment portfolio. As the markets work towards greater stability, we remain opportunistic and focused on delivering value to shareholders.”
_____________________
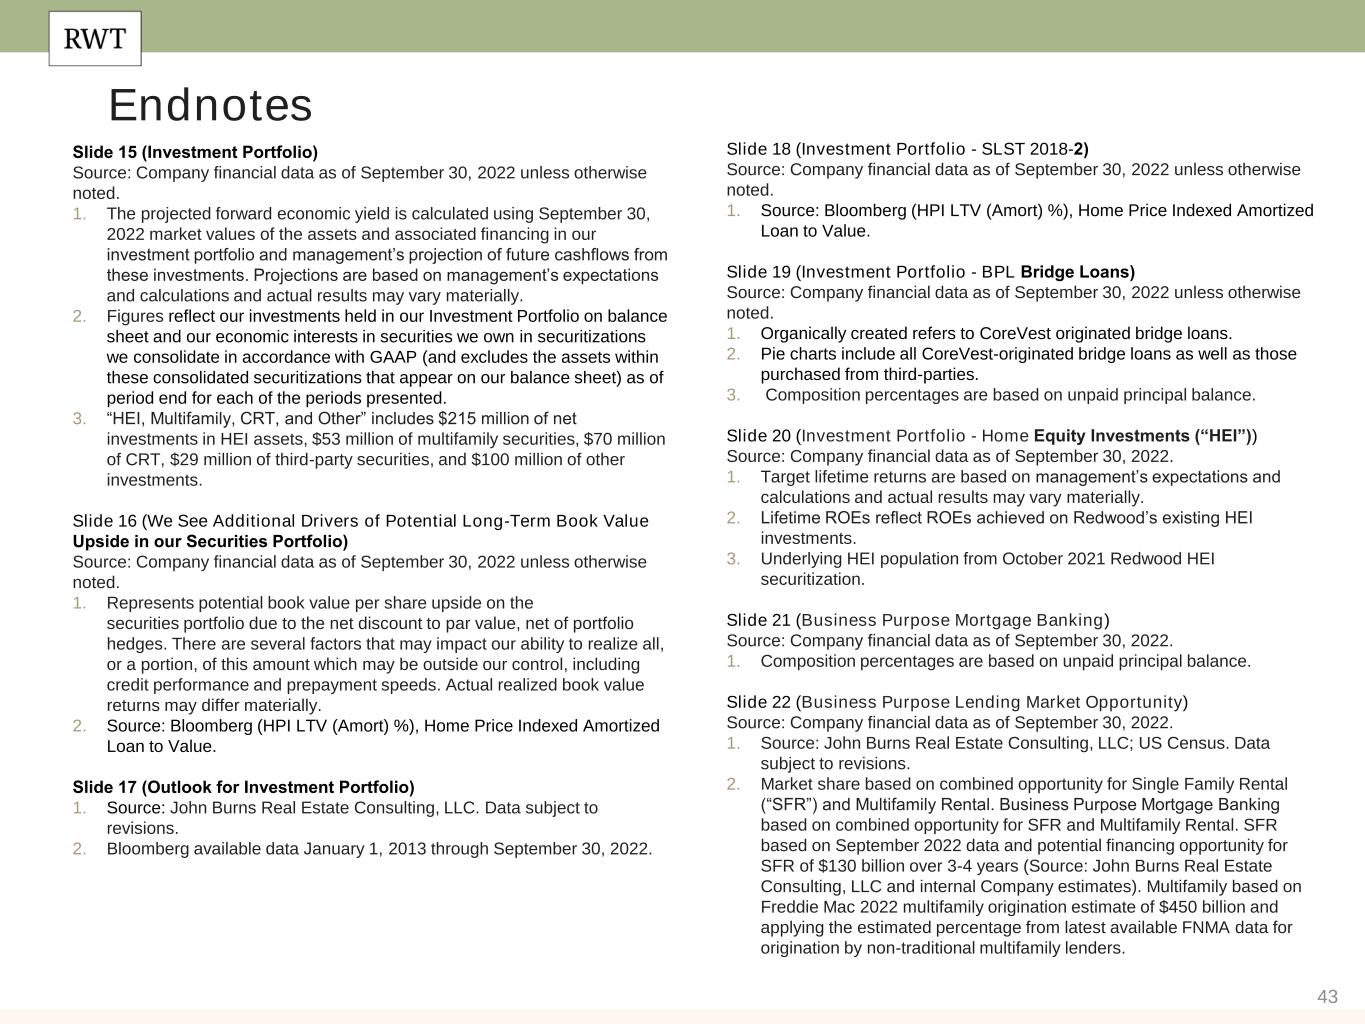
1.Economic return on book value is based on the period change in GAAP book value per common share plus dividends declared per common share in the period.
2.Earnings available for distribution is a non-GAAP measure. See Non-GAAP Disclosures section that follows for additional information on this measure.
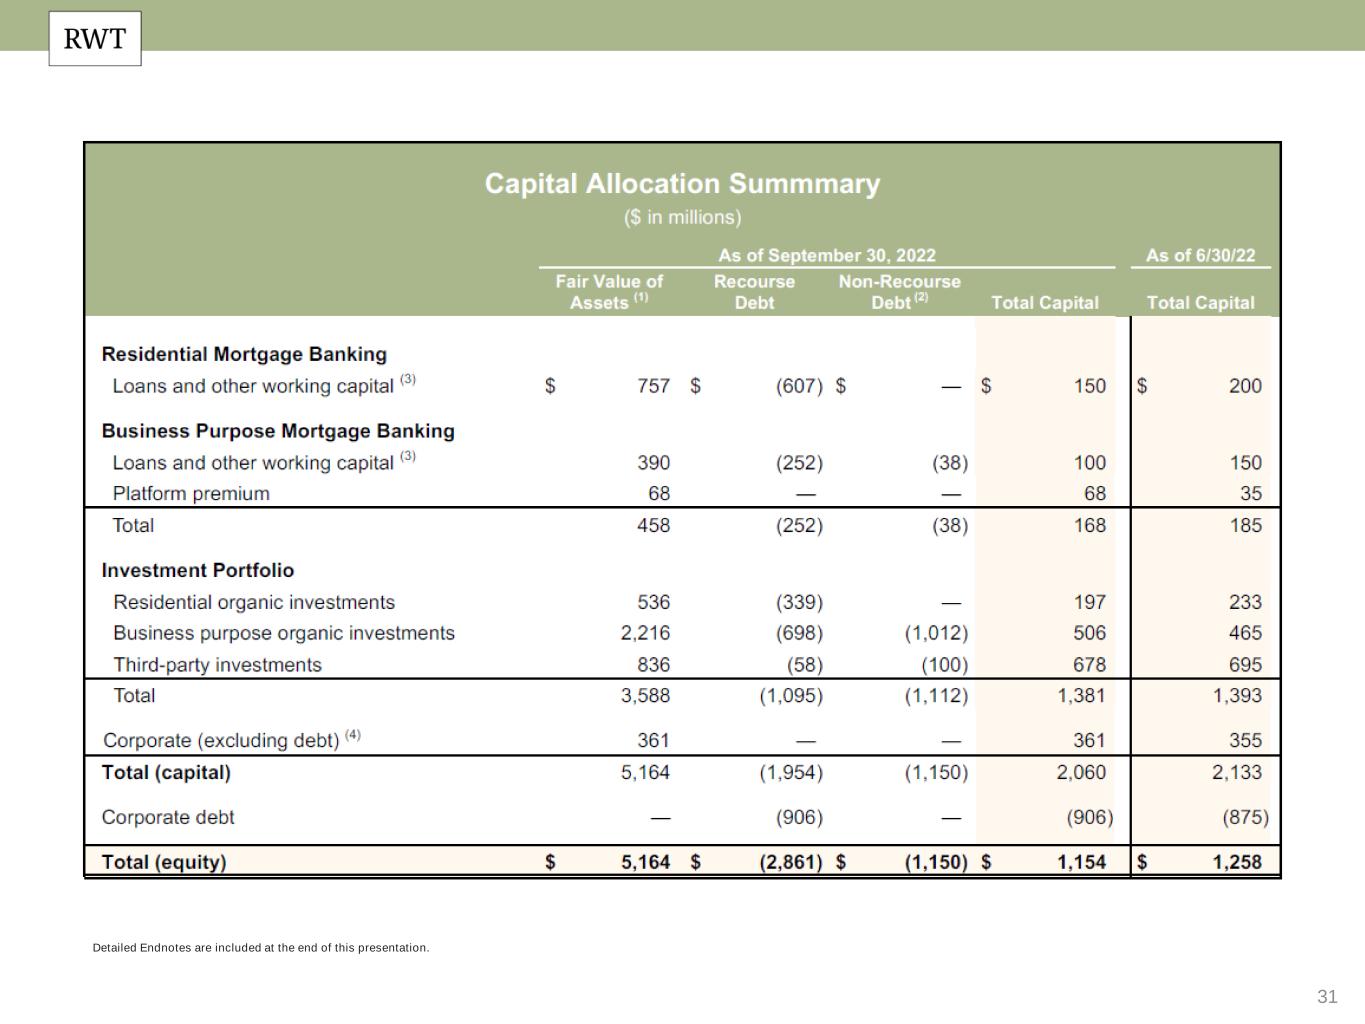
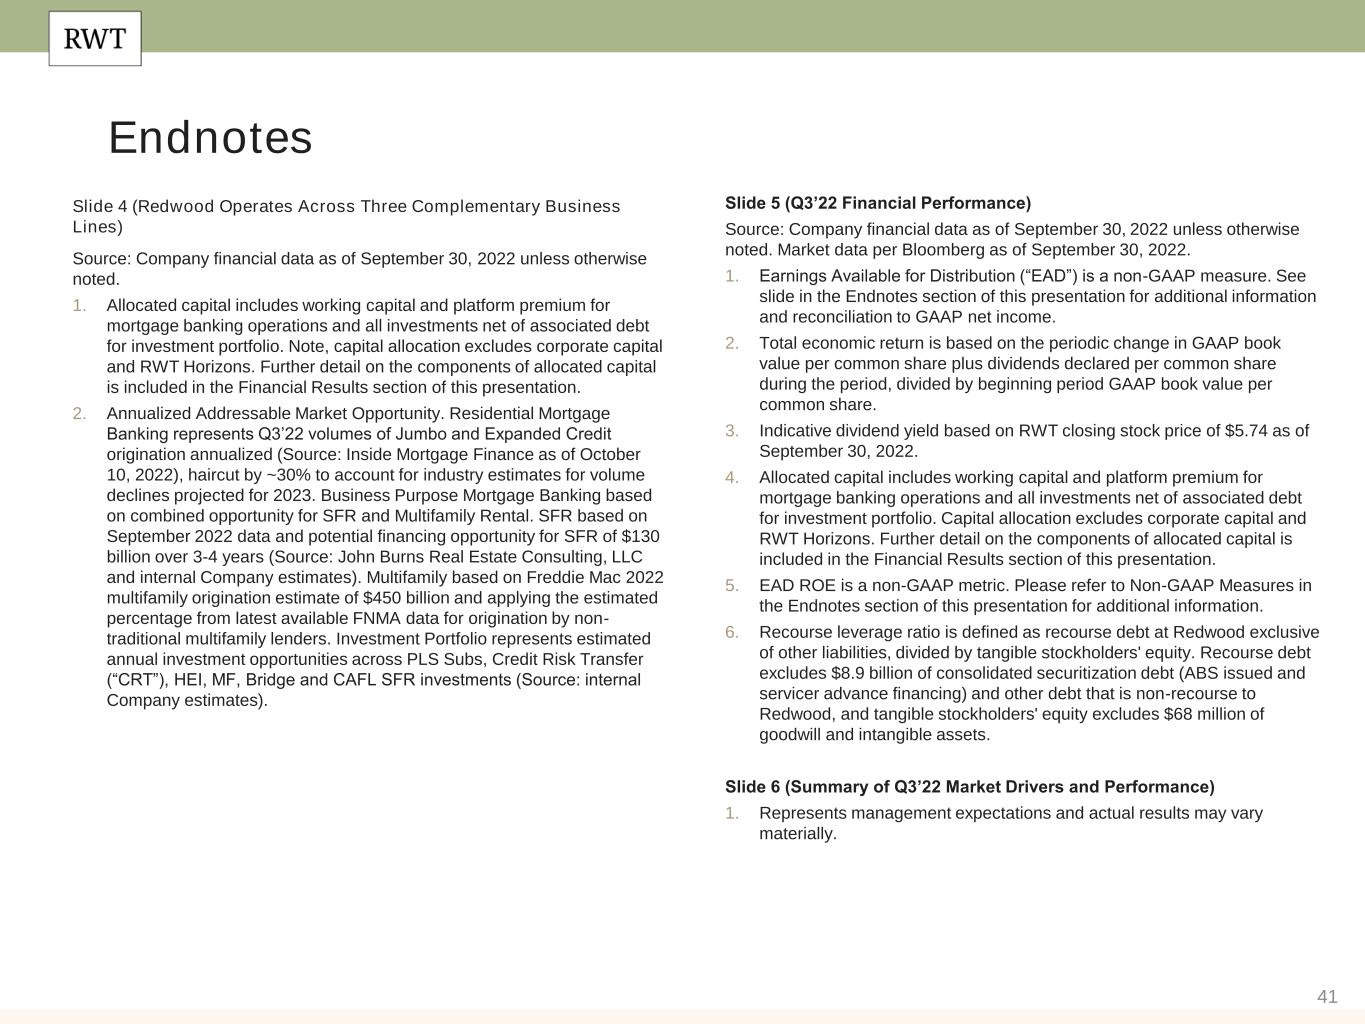
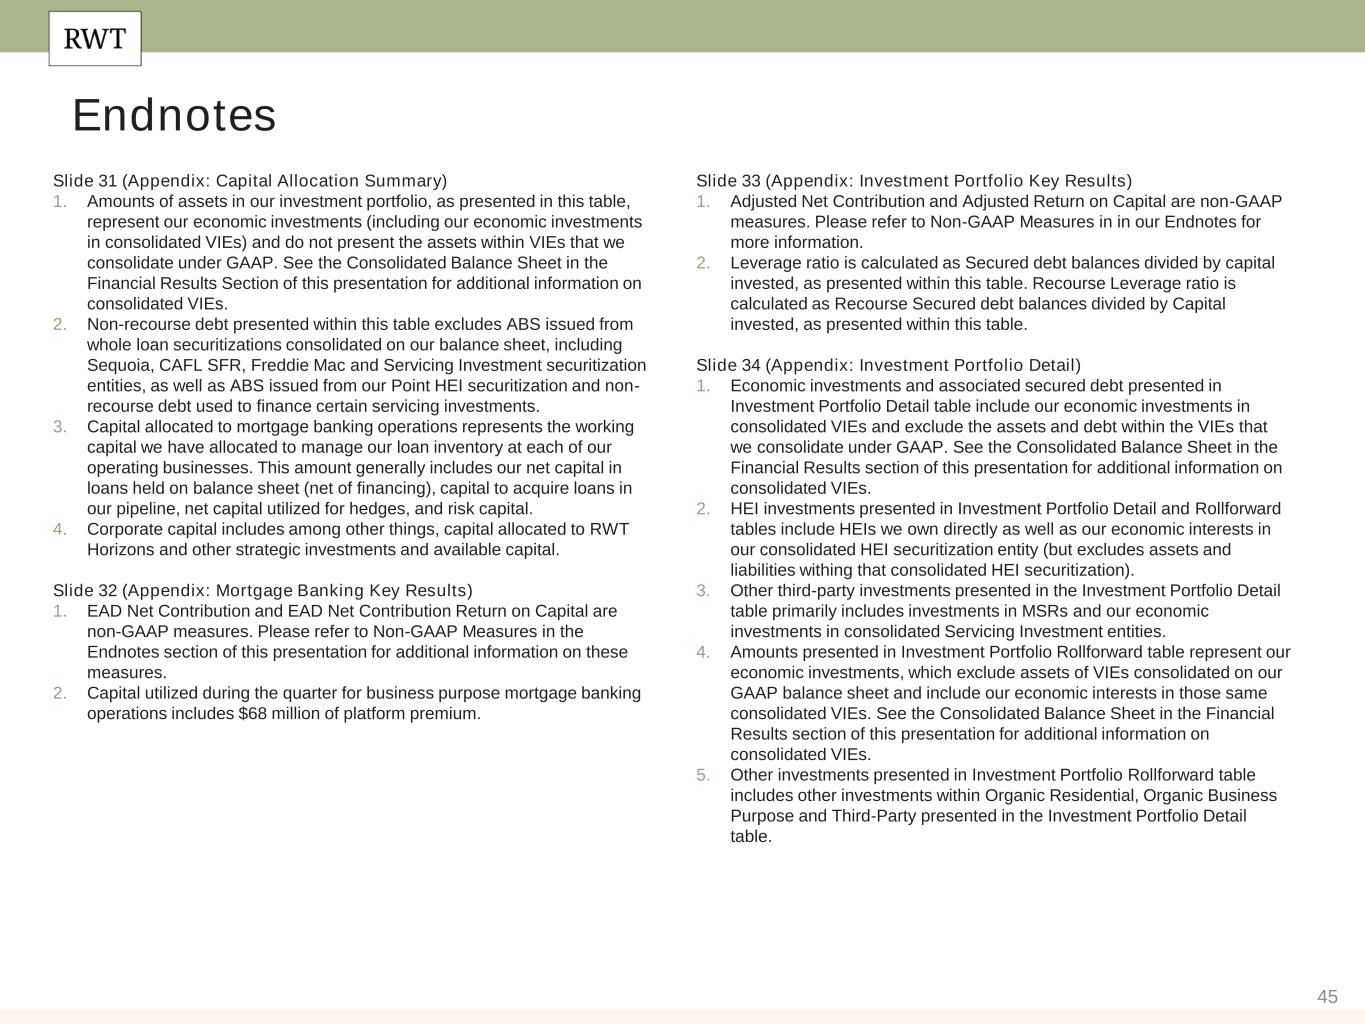
3.Recourse leverage ratio is defined as recourse debt at Redwood divided by tangible stockholders' equity. Recourse debt excludes $8.9 billion of consolidated securitization debt (ABS issued and servicer advance financing) and other debt that is non-recourse to Redwood, and tangible stockholders' equity excludes $68 million of goodwill and intangible assets.
4.Secured recourse leverage for our investment portfolio is defined as secured recourse debt financing our investment portfolio assets divided by capital allocated to our investment portfolio.
5.Subject to certain adjustments including potential earnout consideration.
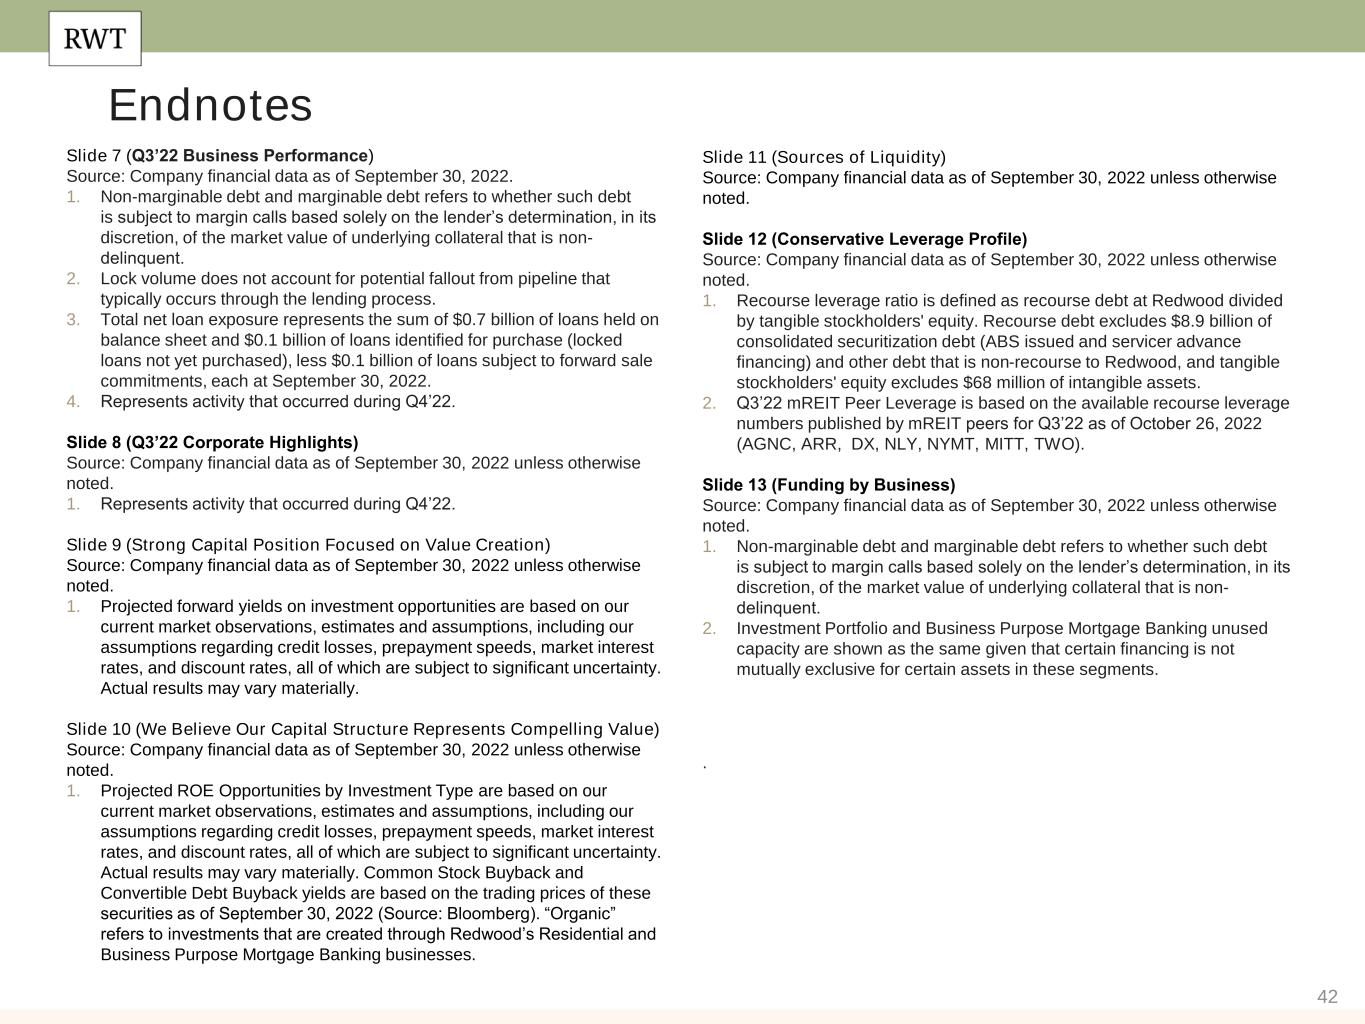
6.Total net jumbo loan exposure represents the sum of $703 million of loans held on balance sheet and $146 million of loans identified for purchase (locked loans not yet purchased), less $137 million of loans subject to forward sale commitments, each at September 30, 2022.
7.Lock volume does not account for potential fallout from pipeline that typically occurs through the lending process.
8.Loan purchase commitments include estimated potential fallout from locked pipeline that typically occurs through the lending process.
2
Third Quarter 2022 Redwood Review Available Online
A further discussion of Redwood's business and financial results is included in the third quarter 2022 Shareholder Letter and Redwood Review which are available within under "Financial Info" section of the Company’s investor relations website at redwoodtrust.com/investor-relations.
Updates to Financial Disclosures
Commencing with the Company’s financial results for the quarter ended September 30, 2022, the Company is publishing an additional earnings metric, “Earnings Available for Distribution” or "EAD" along with the associated "EAD Return on Equity" or "EAD ROE." EAD and EAD ROE are non-GAAP financial measures intended to supplement the Company’s financial results computed in accordance with U.S. generally accepted accounting principles (“GAAP”). In line with evolving industry practices, the Company believes EAD will assist investors in analyzing the Company’s results of operations and ability to pay dividends, and helps facilitate comparisons to industry peers. EAD should not be utilized in isolation, nor should it be considered as an alternative to GAAP net income or other measurements of results of operations computed in accordance with GAAP. A further discussion of EAD is included in the "Non-GAAP Disclosures" section below and within the Endnotes of the Company's Third Quarter 2022 Redwood Review, which can be found on our website.
Conference Call and Webcast
Redwood will host an earnings call today, October 27, 2022, at 2:00 p.m. Pacific Time / 5:00 p.m. Eastern Time to discuss its third quarter 2022 financial results. The number to dial in order to listen to the conference call is 1-877-423-9813 in the U.S. and Canada. International callers must dial 1-201-689-8573. A replay of the call will be available through midnight on Thursday, November 10, 2022, and can be accessed by dialing 1-844-512-2921 in the U.S. and Canada or 1-412-317-6671 internationally and entering access code #13729621.
The conference call will be webcast live in listen-only mode through the News & Events section of Redwood’s Investor Relations website at https://www.redwoodtrust.com/investor-relations/news-events/events. To listen to the webcast, please go to Redwood's website at least 15 minutes before the call to register and to download and install any needed audio software. An audio replay of the call will also be available on Redwood's website following the call. Redwood plans to file its Quarterly Report on Form 10-Q with the Securities and Exchange Commission by Tuesday, November 9, 2022, and also make it available on Redwood’s website.
About Redwood
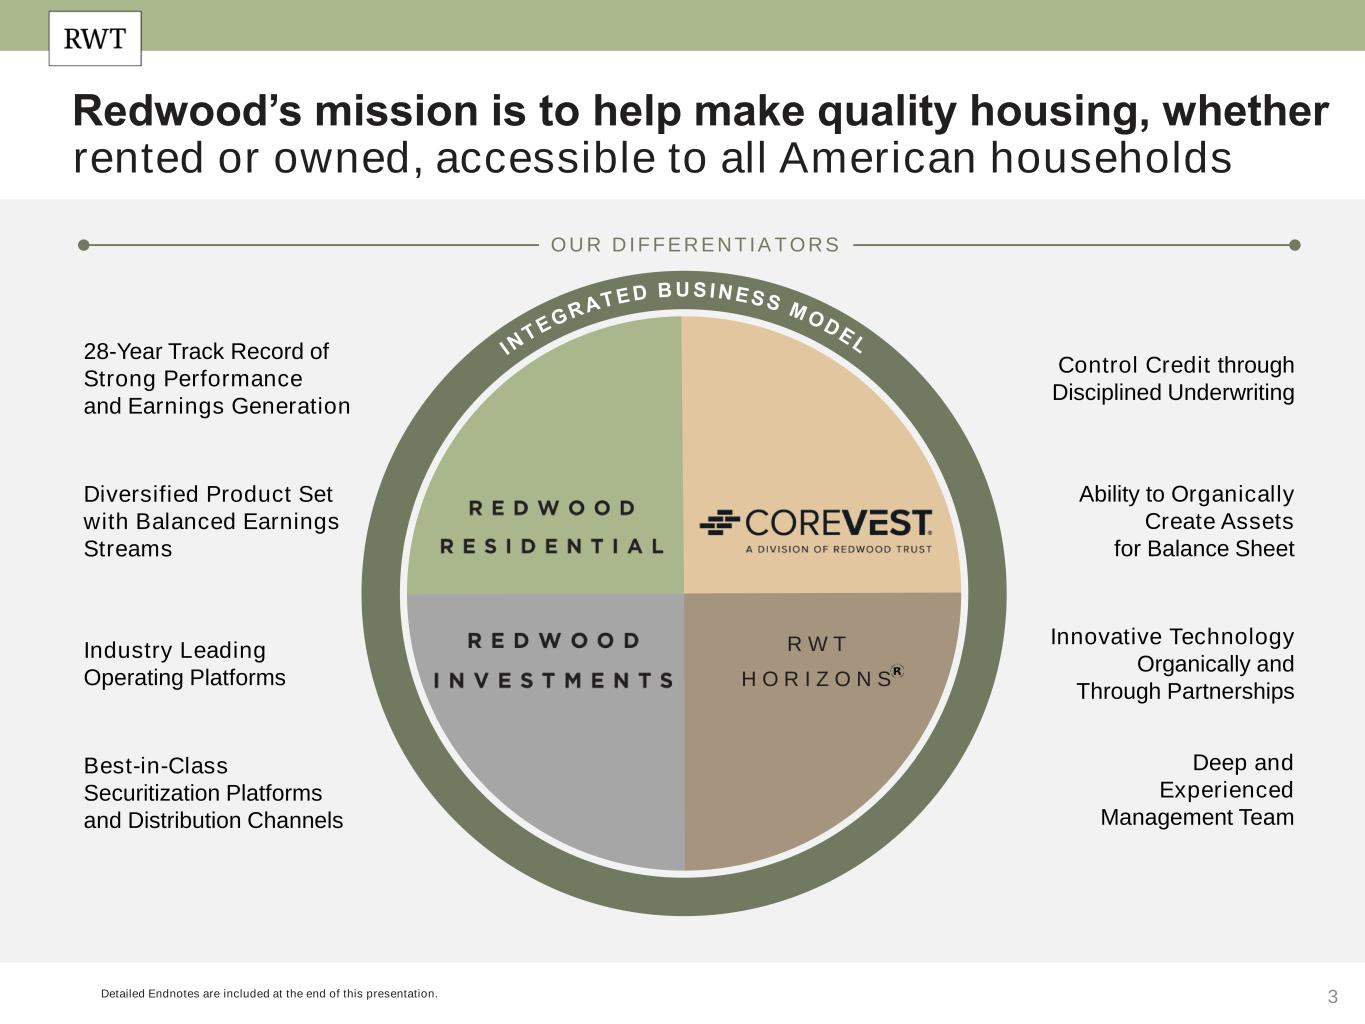
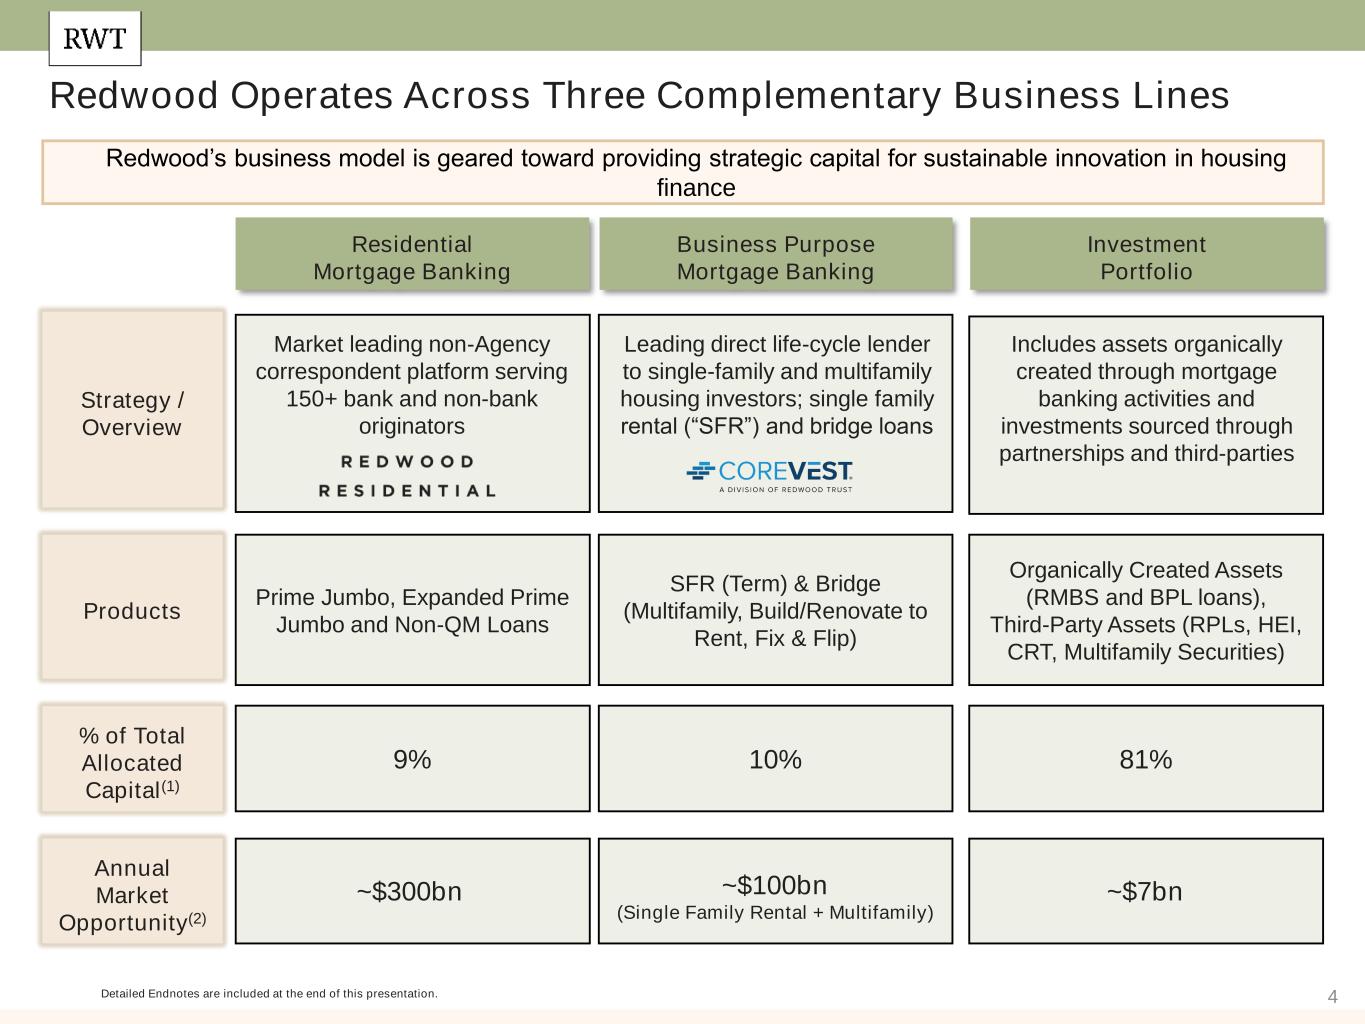
Redwood Trust, Inc. (NYSE: RWT) is a specialty finance company focused on several distinct areas of housing credit. Our operating platforms occupy a unique position in the housing finance value chain, providing liquidity to growing segments of the U.S. housing market not well served by government programs. We deliver customized housing credit investments to a diverse mix of investors, through our best-in-class securitization platforms; whole-loan distribution activities; and our publicly traded shares. Our aggregation, origination and investment activities have evolved to incorporate a diverse mix of residential, business purpose and multifamily assets. Our goal is to provide attractive returns to shareholders through a stable and growing stream of earnings and dividends, capital appreciation, and a commitment to technological innovation that facilitates risk-minded scale. We operate our business in three segments: Residential Mortgage Banking, Business Purpose Mortgage Banking and Investment Portfolio. Additionally, through RWT Horizons, our venture investing initiative, we invest in early-stage companies strategically aligned with our business across the lending, real estate, and financial technology sectors to drive innovations across our residential and business-purpose lending platforms. Since going public in 1994, we have managed our business through several cycles, built a track record of innovation, and established a best-in-class reputation for service and a common-sense approach to credit investing. Redwood Trust is internally managed and structured as a real estate investment trust ("REIT") for tax purposes. For more information about Redwood, please visit our website at www.redwoodtrust.com or connect with us on LinkedIn, Twitter, or Facebook.
3
Forward-Looking Statements: This press release and the related conference call contain forward-looking statements within the meaning of the safe harbor provisions of the Private Securities Litigation Reform Act of 1995, including statements related to the amount of residential mortgage loans that we identified for purchase during the third quarter of 2022, expected fallout and the corresponding volume of residential mortgage loans expected to be available for purchase, residential mortgage loans subject to forward sale commitments, statements relating to our estimates of our available capital, and the expected timing for the filing of Redwood's Quarterly Report on Form 10-Q. Forward-looking statements involve numerous risks and uncertainties. Redwood's actual results may differ from Redwood's beliefs, expectations, estimates, and projections and, consequently, you should not rely on these forward-looking statements as predictions of future events. Forward-looking statements are not historical in nature and can be identified by words such as “anticipate,” “estimate,” “will,” “should,” “expect,” “believe,” “intend,” “seek,” “plan” and similar expressions or their negative forms, or by references to strategy, plans, or intentions. These forward-looking statements are subject to risks and uncertainties, including, among other things, those described in our Annual Report on Form 10-K for the year ended December 31, 2021 under the caption “Risk Factors”. Other risks, uncertainties, and factors that could cause actual results to differ materially from those projected may be described from time to time in reports we file with the Securities and Exchange Commission, including reports on Forms 10-Q and 8-K. We undertake no obligation to update or revise any forward-looking statements, whether as a result of new information, future events, or otherwise.
4
REDWOOD TRUST, INC.
| ($ in millions, except per share data) | Three Months Ended | ||||||||||
| 9/30/2022 | 6/30/2022 | ||||||||||
| Financial Performance | |||||||||||
| Net income (loss) per diluted common share | $ | (0.44) | $ | (0.85) | |||||||
| Net income (loss) per basic common share | $ | (0.44) | $ | (0.85) | |||||||
| EAD per basic common share (non-GAAP) | $ | 0.16 | $ | (0.11) | |||||||
| Return on Equity (annualized) | (16) | % | (29) | % | |||||||
| EAD Return on Equity (annualized, non-GAAP) | 6 | % | (3) | % | |||||||
| Book Value per Share | $ | 10.18 | $ | 10.78 | |||||||
| Dividend per Share | $ | 0.23 | $ | 0.23 | |||||||
Economic Return on Book Value (1) | (3.4) | % | (8.3) | % | |||||||
Recourse Leverage Ratio (2) | 2.6x | 2.5x | |||||||||
| Operating Metrics | |||||||||||
| Business Purpose Loans | |||||||||||
| SFR fundings | $ | 99 | $ | 361 | |||||||
| Bridge fundings | 470 | 561 | |||||||||
| SFR securitized | 274 | 313 | |||||||||
| Bridge securitized | — | 250 | |||||||||
| SFR sold | 37 | — | |||||||||
| Bridge sold | 48 | — | |||||||||
| Residential Jumbo Loans | |||||||||||
| Locks | $ | 461 | $ | 1,011 | |||||||
| Purchases | 338 | 1,137 | |||||||||
| Securitized | — | — | |||||||||
| Sold | 612 | 1,238 | |||||||||
(1) Economic return on book value is based on the periodic change in GAAP book value per common share plus dividends declared per common share during the period.
(2) Recourse leverage ratio is defined as recourse debt at Redwood divided by tangible stockholders' equity. As of September 30, 2022 and June 30, 2022, recourse debt excluded $8.9 billion and $9.3 billion, respectively, of consolidated securitization debt (ABS issued and servicer advance financing) and other debt that is non-recourse to Redwood, and tangible stockholders' equity excluded $68 million and $35 million, respectively, of goodwill and intangible assets.
5
REDWOOD TRUST, INC.
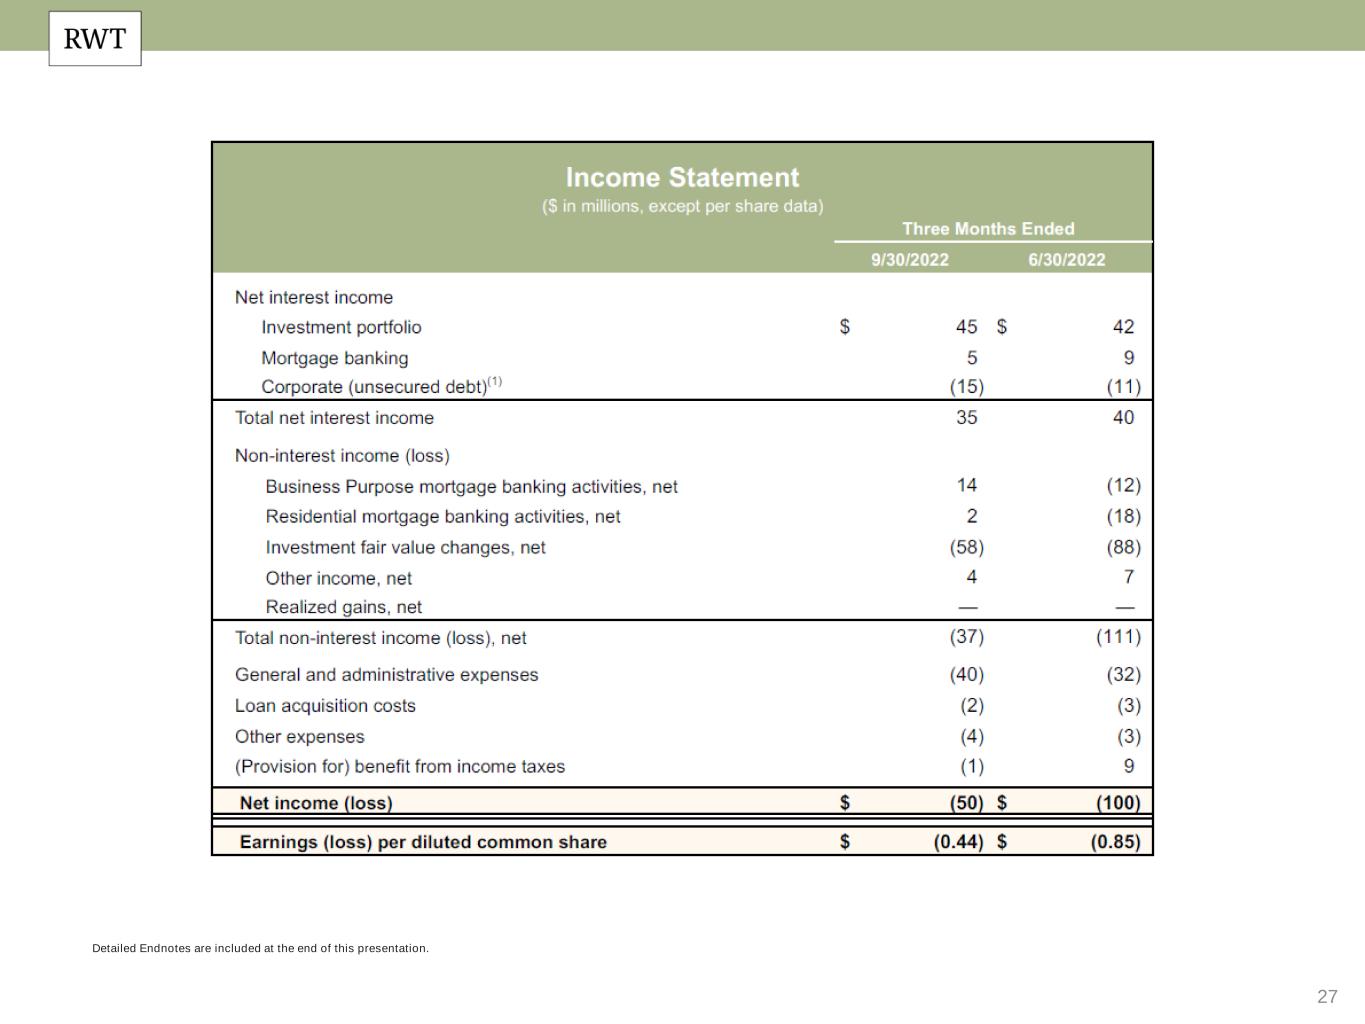
Consolidated Income Statements (1) | Three Months Ended | |||||||||||||||||||||||||||||||
| ($ in millions, except share and per share data) | 9/30/22 | 6/30/22 | 3/31/22 | 12/31/21 | 9/30/21 | |||||||||||||||||||||||||||
| Interest income | $ | 178 | $ | 167 | $ | 189 | $ | 162 | $ | 146 | ||||||||||||||||||||||
| Interest expense | (143) | (127) | (136) | (112) | (104) | |||||||||||||||||||||||||||
| Net interest income | 35 | 40 | 53 | 50 | 42 | |||||||||||||||||||||||||||
| Non-interest income (loss) | ||||||||||||||||||||||||||||||||
| Residential mortgage banking activities, net | 2 | (18) | 8 | 12 | 33 | |||||||||||||||||||||||||||
| Business purpose mortgage banking activities, net | 14 | (12) | 8 | 24 | 30 | |||||||||||||||||||||||||||
| Investment fair value changes, net | (58) | (88) | (6) | 7 | 26 | |||||||||||||||||||||||||||
| Other income, net | 4 | 7 | 6 | 4 | 2 | |||||||||||||||||||||||||||
| Realized gains, net | — | — | 3 | — | 7 | |||||||||||||||||||||||||||
| Total non-interest income (loss), net | (37) | (111) | 19 | 47 | 98 | |||||||||||||||||||||||||||
| General and administrative expenses | (40) | (32) | (35) | (39) | (48) | |||||||||||||||||||||||||||
| Loan acquisition costs | (2) | (3) | (4) | (4) | (5) | |||||||||||||||||||||||||||
| Other expenses | (4) | (3) | (4) | (5) | (4) | |||||||||||||||||||||||||||
| (Provision for) benefit from income taxes | (1) | 9 | 2 | (5) | 4 | |||||||||||||||||||||||||||
| Net income (loss) | $ | (50) | $ | (100) | $ | 31 | $ | 44 | $ | 88 | ||||||||||||||||||||||
| Weighted average basic shares (thousands) | 116,088 | 119,660 | 119,884 | 114,641 | 112,996 | |||||||||||||||||||||||||||
Weighted average diluted shares (thousands) (2) | 116,088 | 119,660 | 140,506 | 143,540 | 141,855 | |||||||||||||||||||||||||||
| Earnings (loss) per basic common share | $ | (0.44) | $ | (0.85) | $ | 0.25 | $ | 0.37 | $ | 0.75 | ||||||||||||||||||||||
| Earnings (loss) per diluted common share | $ | (0.44) | $ | (0.85) | $ | 0.24 | $ | 0.34 | $ | 0.65 | ||||||||||||||||||||||
| Regular dividends declared per common share | $ | 0.23 | $ | 0.23 | $ | 0.23 | $ | 0.23 | $ | 0.21 | ||||||||||||||||||||||
(1)Certain totals may not foot due to rounding.
(2)In the periods presented above, weighted average diluted shares included shares from the assumed conversion of our convertible and/or exchangeable debt in accordance with GAAP diluted EPS provisions. Actual shares outstanding (in thousands) at September 30, 2022, June 30, 2022, March 31, 2022, December 31, 2021, and September 30, 2021, were 113,343, 116,753, 120,289, 114,892, and 114,662, respectively.
6
Analysis of Income Statement - Changes from Second to Third Quarter 2022
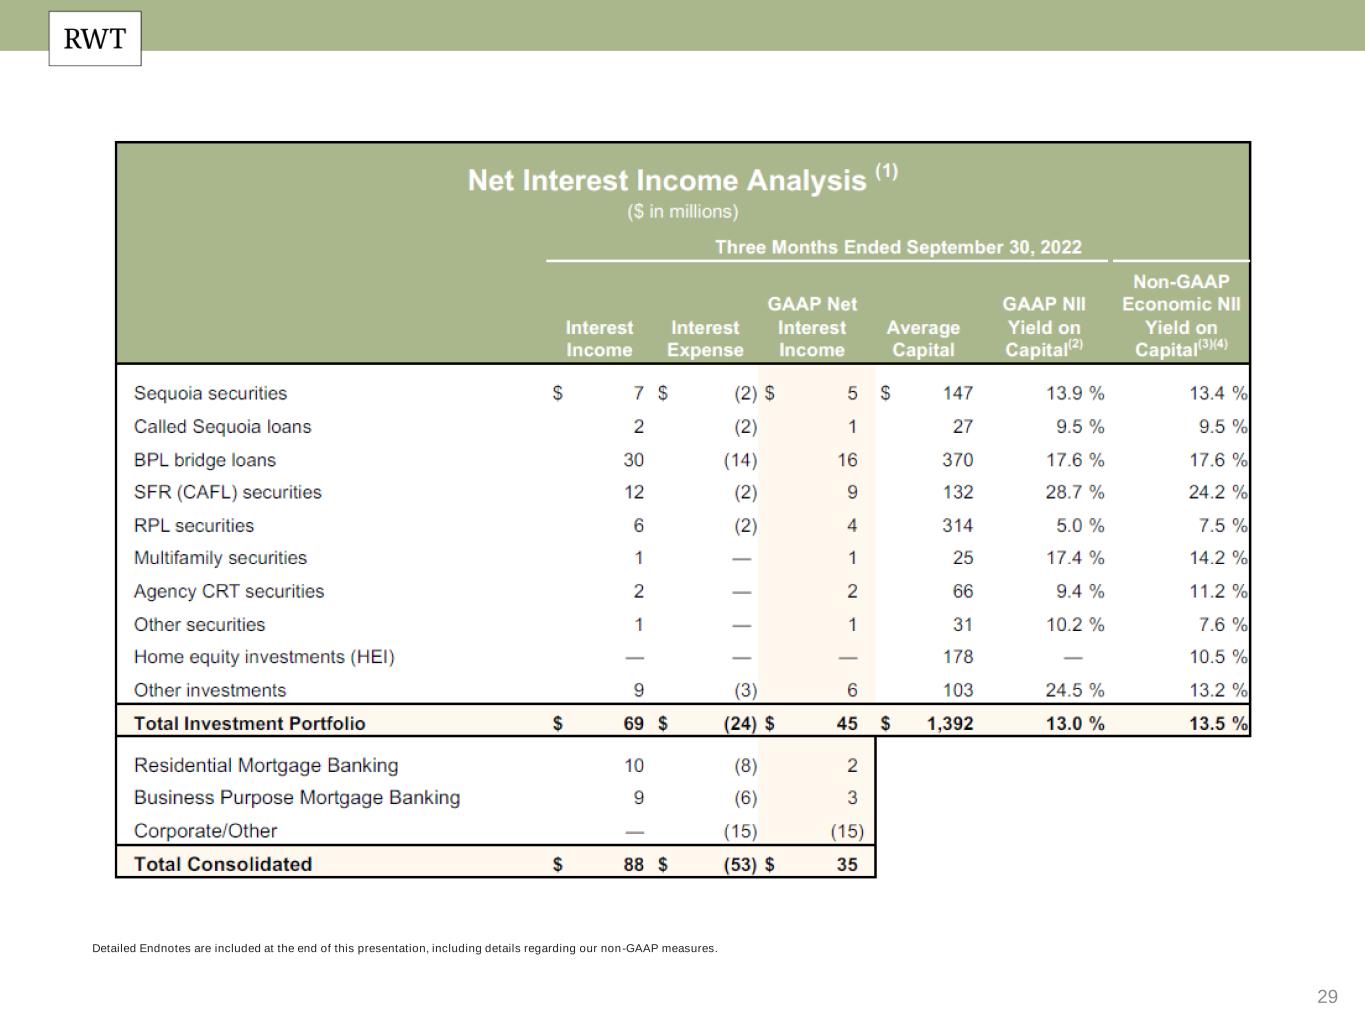
•Net interest income decreased from the second quarter primarily due to lower net interest income from mortgage banking loan inventory as volumes and average balances declined in the third quarter, as well as higher interest expense from convertible debt issued late in the second quarter.
•Income from Residential Mortgage Banking activities increased from the second quarter as margins recovered on improved distribution execution, but overall profitability was impacted by lower volumes.
•Income from Business Purpose Mortgage Banking activities increased from the second quarter as a benefit from stabilized margins was partially offset by lower volumes. The decline in volume during the third quarter was predominantly in the SFR product, as borrowers continue to prefer short-term bridge loans.
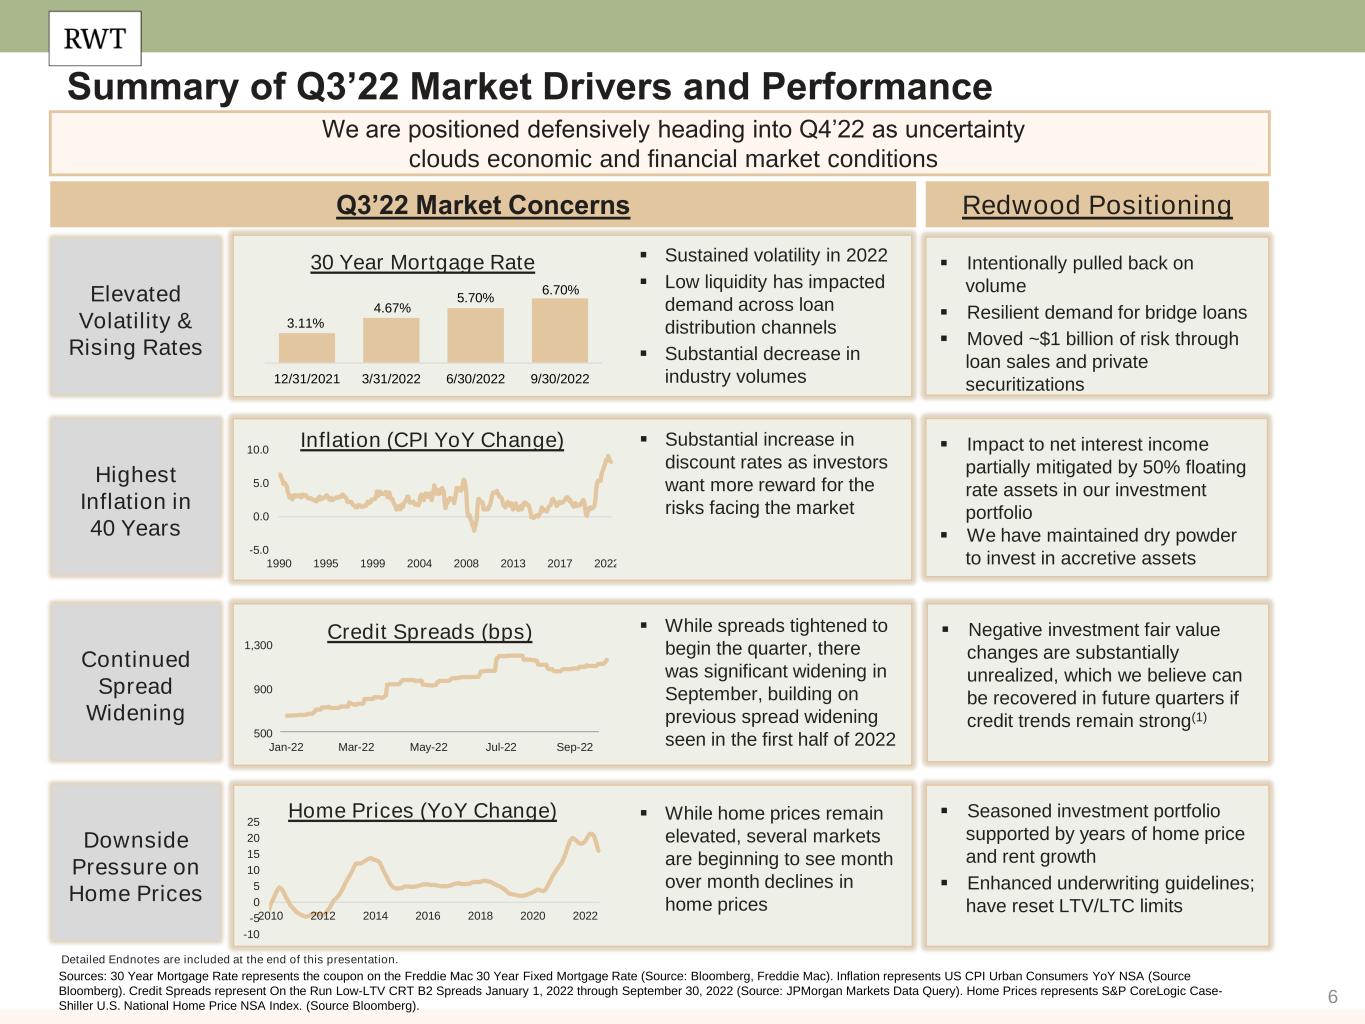
•Net negative investment fair value changes on our Investment Portfolio in the third quarter reflected further credit spread widening during the quarter in several of our investment classes, most notably within our reperforming loan ("RPL") securities. The negative fair value changes were partially offset by fair value increases in our IO securities, MSRs and interest rate hedges, which benefited from rising interest rates. Negative fair value changes primarily reflected unrealized mark-to-market losses, while fundamental credit performance, including delinquencies and LTVs, remained stable across our portfolio.
•General and administrative expenses increased from the second quarter, primarily due to costs associated with the acquisition of Riverbend and employee severance and related transition expenses.
•Other expenses were primarily comprised of acquisition-related intangible amortization expenses, which increased in the third quarter as a result of our acquisition of Riverbend in July.
•Our provision for income taxes in the third quarter reflected net income earned at our taxable REIT subsidiary in the quarter, which benefited from hedge gains associated with certain investments.
7
| REDWOOD TRUST, INC. | ||||||||||||||
Consolidated Income Statements (1) | Nine Months Ended September 30, | |||||||||||||
| ($ in millions, except share and per share data) | 2022 | 2021 | ||||||||||||
| Interest income | $ | 535 | $ | 413 | ||||||||||
| Interest expense | (406) | (314) | ||||||||||||
| Net interest income | 129 | 98 | ||||||||||||
| Non-interest income (loss) | ||||||||||||||
| Mortgage banking activities, net | 3 | 200 | ||||||||||||
| Investment fair value changes, net | (152) | 121 | ||||||||||||
| Other income | 17 | 8 | ||||||||||||
| Realized gains, net | 3 | 18 | ||||||||||||
| Total non-interest income (loss), net | (129) | 347 | ||||||||||||
| General and administrative expenses | (107) | (132) | ||||||||||||
| Loan acquisition costs | (10) | (12) | ||||||||||||
| Other expenses | (12) | (12) | ||||||||||||
| Benefit from (provision for) income taxes | 10 | (14) | ||||||||||||
| Net income (loss) | $ | (119) | $ | 276 | ||||||||||
| Weighted average basic shares (thousands) | 118,530 | 112,755 | ||||||||||||
| Weighted average diluted shares (thousands) | 118,530 | 141,575 | ||||||||||||
| Earnings (loss) per basic common share | $ | (1.04) | $ | 2.36 | ||||||||||
| Earnings (loss) per diluted common share | $ | (1.04) | $ | 2.03 | ||||||||||
| Regular dividends declared per common share | $ | 0.69 | $ | 0.55 | ||||||||||
(1)Certain totals may not foot due to rounding.
8
REDWOOD TRUST, INC.
Consolidated Balance Sheets (1) | |||||||||||||||||||||||||||||||||||
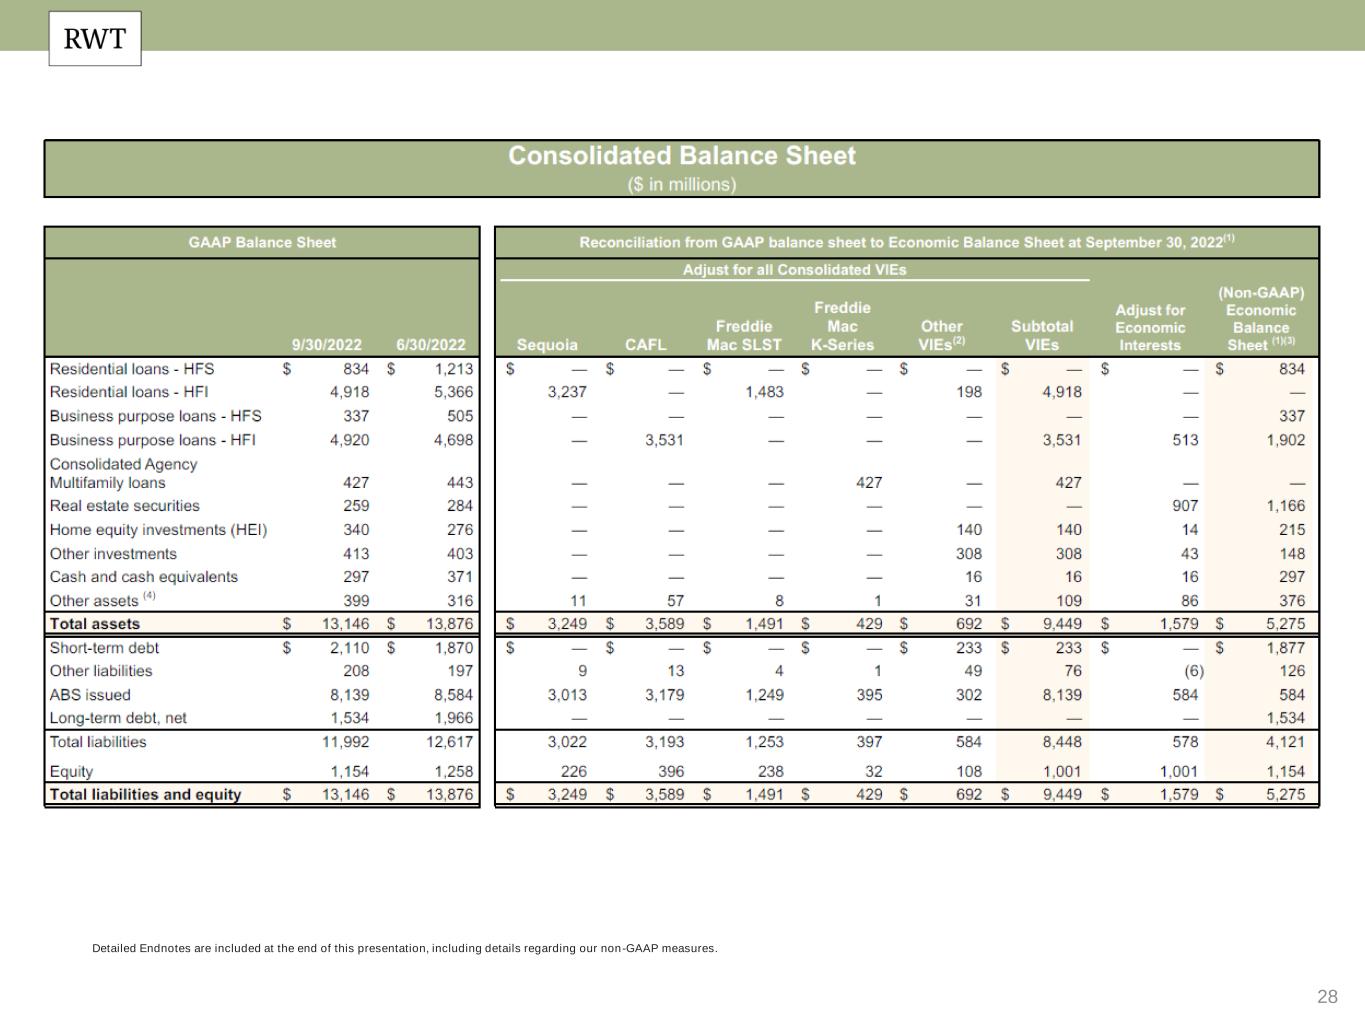
| ($ in millions, except share and per share data) | 9/30/22 | 6/30/22 | 3/31/22 | 12/31/21 | 9/30/21 | ||||||||||||||||||||||||||||||
| Residential loans | $ | 5,753 | $ | 6,579 | $ | 7,217 | $ | 7,592 | $ | 6,216 | |||||||||||||||||||||||||
| Business purpose loans | 5,257 | 5,203 | 4,755 | 4,791 | 4,694 | ||||||||||||||||||||||||||||||
| Consolidated Agency multifamily loans | 427 | 443 | 452 | 474 | 483 | ||||||||||||||||||||||||||||||
| Real estate securities | 259 | 284 | 359 | 377 | 353 | ||||||||||||||||||||||||||||||
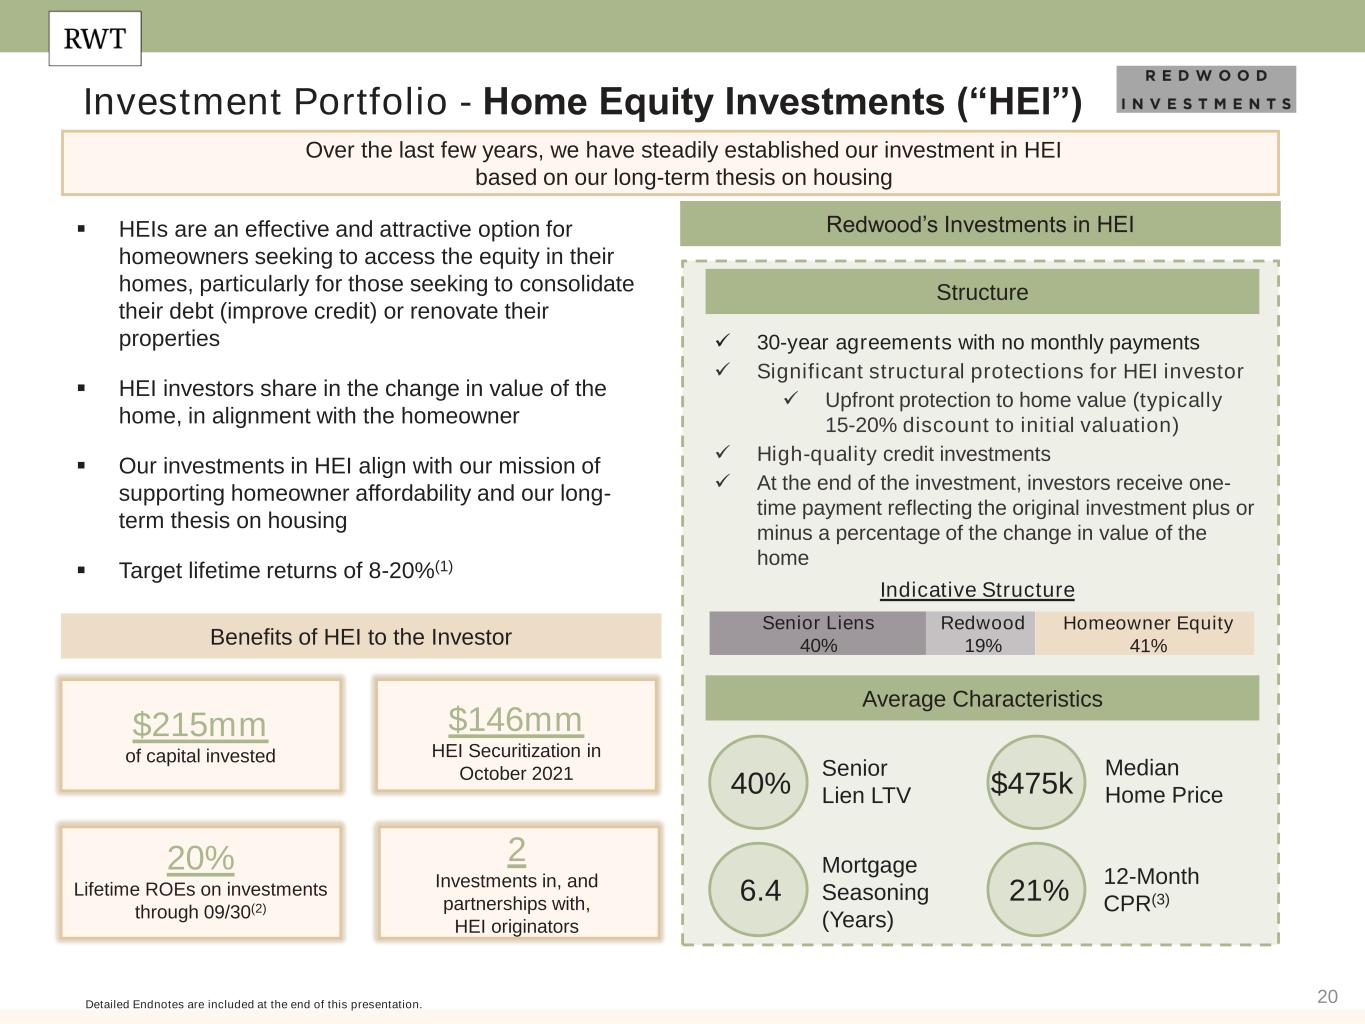
| Home equity investments (HEI) | 340 | 276 | 227 | 193 | 168 | ||||||||||||||||||||||||||||||
| Other investments | 413 | 403 | 408 | 449 | 255 | ||||||||||||||||||||||||||||||
| Cash and cash equivalents | 297 | 371 | 409 | 450 | 557 | ||||||||||||||||||||||||||||||
| Other assets | 399 | 316 | 425 | 380 | 347 | ||||||||||||||||||||||||||||||
| Total assets | $ | 13,146 | $ | 13,876 | $ | 14,253 | $ | 14,707 | $ | 13,073 | |||||||||||||||||||||||||
| Short-term debt | $ | 2,110 | $ | 1,870 | $ | 1,647 | $ | 2,177 | $ | 1,751 | |||||||||||||||||||||||||
| Other liabilities | 208 | 197 | 325 | 249 | 263 | ||||||||||||||||||||||||||||||
| Asset-backed securities issued | 8,139 | 8,584 | 8,872 | 9,254 | 8,184 | ||||||||||||||||||||||||||||||
| Long-term debt, net | 1,534 | 1,966 | 1,964 | 1,641 | 1,500 | ||||||||||||||||||||||||||||||
| Total liabilities | 11,992 | 12,617 | 12,808 | 13,321 | 11,697 | ||||||||||||||||||||||||||||||
| Stockholders' equity | 1,154 | 1,258 | 1,445 | 1,386 | 1,376 | ||||||||||||||||||||||||||||||
| Total liabilities and equity | $ | 13,146 | $ | 13,876 | $ | 14,253 | $ | 14,707 | $ | 13,073 | |||||||||||||||||||||||||
| Shares outstanding at period end (thousands) | 113,343 | 116,753 | 120,289 | 114,892 | 114,662 | ||||||||||||||||||||||||||||||
| GAAP book value per share | $ | 10.18 | $ | 10.78 | $ | 12.01 | $ | 12.06 | $ | 12.00 | |||||||||||||||||||||||||
(1)Certain totals may not foot due to rounding.
9
Non-GAAP Disclosures
Reconciliation of GAAP Net Income (Loss) to Earnings Available for Distribution (1)(2) | Three Months Ended | ||||||||||||||||
| ($ in millions, except share and per share data) | 9/30/22 | 6/30/22 | |||||||||||||||
| GAAP net income (loss) | $ | (50) | $ | (100) | |||||||||||||
| Adjustments: | |||||||||||||||||
Investment fair value changes, net(3) | 58 | 88 | |||||||||||||||
Change in economic basis of investments(4) | 2 | (1) | |||||||||||||||
Realized (gains)/losses, net(5) | — | — | |||||||||||||||
Acquisition related expenses(6) | 4 | 4 | |||||||||||||||
Organizational restructuring charges(7) | 4 | — | |||||||||||||||
Tax effect of adjustments(8) | 2 | (3) | |||||||||||||||
| Earnings Available for Distribution (non-GAAP) | $ | 19 | $ | (11) | |||||||||||||
| Earnings per basic common share | $ | (0.44) | $ | (0.85) | |||||||||||||
| EAD per basic common share (non-GAAP) | $ | 0.16 | $ | (0.11) | |||||||||||||
| GAAP ROE (annualized) | (16) | % | (29) | % | |||||||||||||
EAD ROE (annualized)(9) | 6 | % | (3) | % | |||||||||||||
1.Certain totals may not foot due to rounding.
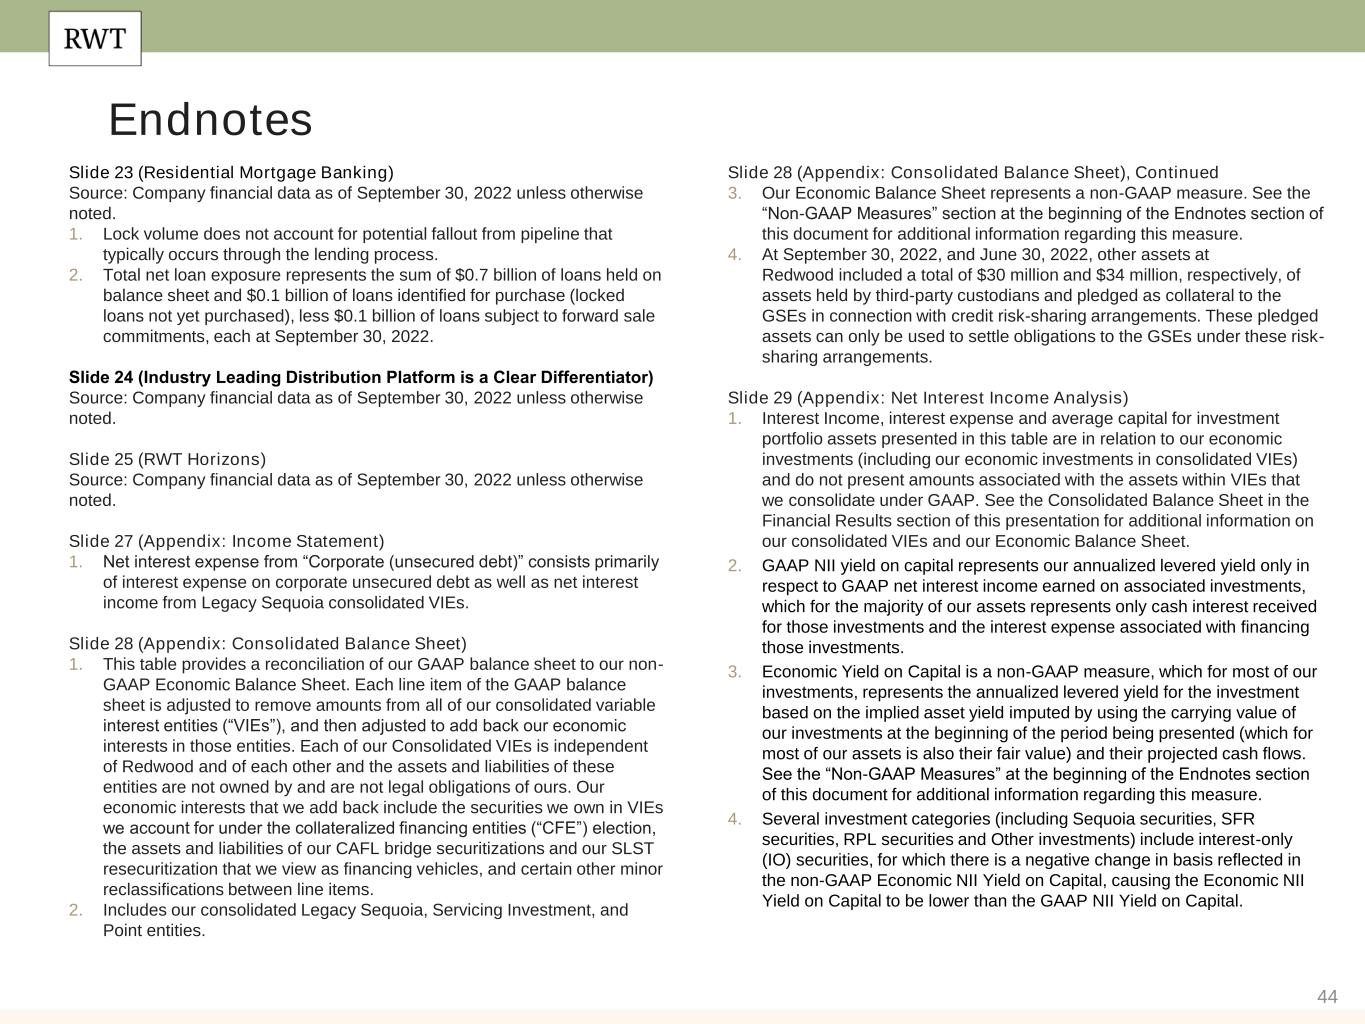
2.Earnings Available for Distribution ("EAD") is a non-GAAP measure defined as: GAAP net income (loss) adjusted to (i) exclude investment fair value changes, net; (ii) adjust for change in economic basis of investments; (iii) exclude realized gains and losses; (iv) exclude acquisition related expenses; (v) exclude organizational restructuring charges; and (vi) adjust for the hypothetical income taxes associated with these adjustments. We believe EAD and EAD ROE provide supplemental information to assist management and investors in analyzing the Company’s results of operations and ability to pay dividends, and helps facilitate comparisons to industry peers. EAD and EAD ROE should not be utilized in isolation, nor should they be considered as an alternative to GAAP net income, GAAP ROE or other measurements of results of operations computed in accordance with GAAP. A further discussion of EAD and EAD ROE is included in the "Non-GAAP Disclosures" section of the Endnotes to the Third Quarter 2022 Redwood Review, which can be found on our website.
3.Investment fair value changes, net includes all amounts within that same line item on our consolidated statements of income, which primarily represents both realized and unrealized gains and losses on our investments and associated hedges.
4.Change in economic basis of investments is an adjustment representing the difference between GAAP interest income for those investments and their estimated economic income. The economic income for our investments is calculated using their estimated economic yield, which is imputed using an investment's carrying value (generally its market value as we carry nearly all our investments at fair value) and its forecasted future cash flows at the beginning of the quarter being presented.
5.Realized (gains)/losses, net includes all amounts within that line item on our consolidated statements of income.
6.Acquisition related expenses include transaction expenses paid to third parties related to the acquisition of Riverbend, ongoing amortization of intangible assets related to the Riverbend, Corevest and 5Arches acquisitions and changes in the contingent consideration liability related to the potential earnout consideration for the acquisition of Riverbend.
7.Organizational restructuring charges for the third quarter of 2022 represents costs associated with employee severance and related transition expenses.
8.Tax effect of adjustments represent the hypothetical income taxes associated with all adjustments used to calculate EAD.
9.EAD ROE is calculated by dividing EAD by average common equity for each respective period
10
| CONTACTS | ||
| Investor Relations | ||
| Kaitlyn Mauritz | ||
| SVP, Head of Investor Relations | ||
| Phone: 866-269-4976 | ||
| Email: [email protected] | ||
11