Exhibit 99.1

RXO Delivers Strong Fourth Quarter
Driven by Brokerage Volume Growth
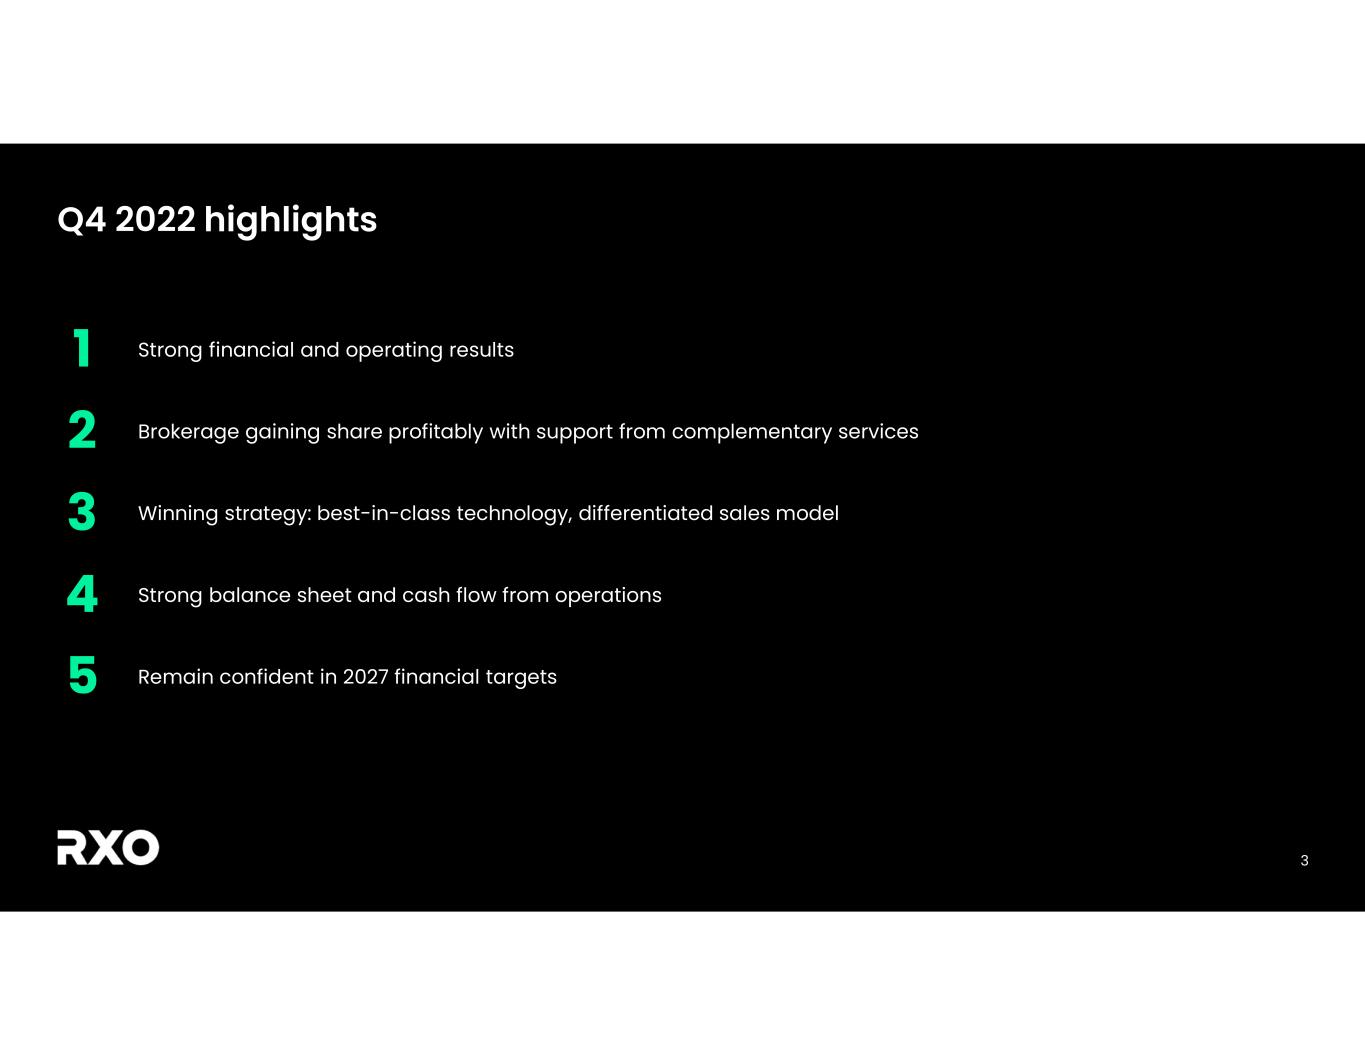
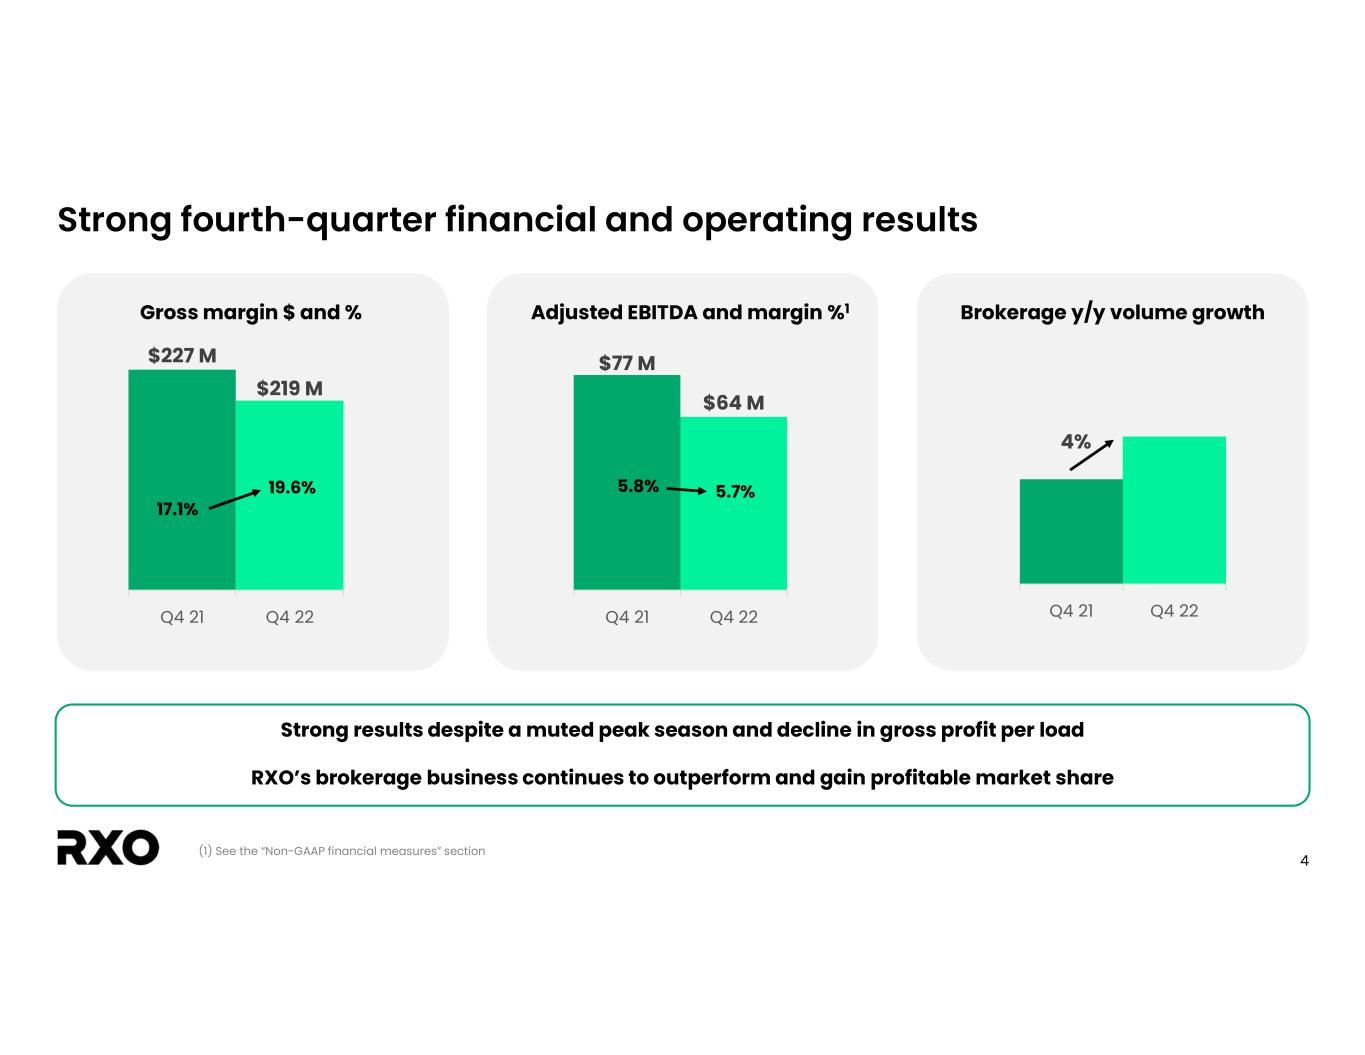
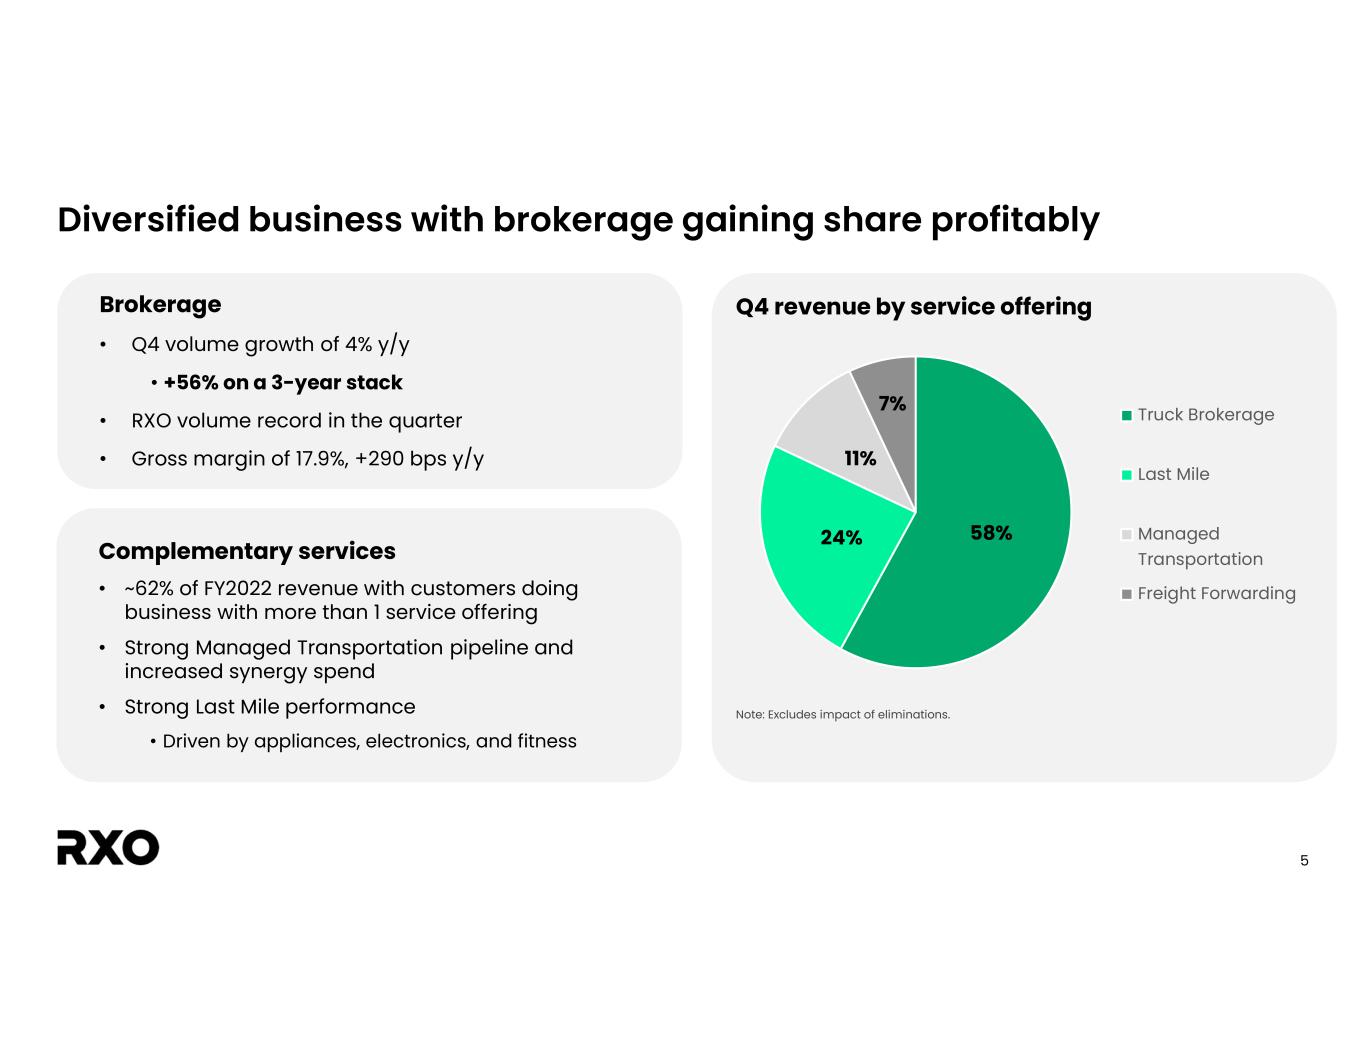
•Companywide gross margin was 19.6 percent, up 250 basis points year-over-year; brokerage profitability remained strong with 17.9 percent gross margin in the fourth quarter, up 290 basis points year-over-year
•Brokerage volume increased by 4% year-over-year and set a company record for loads per day
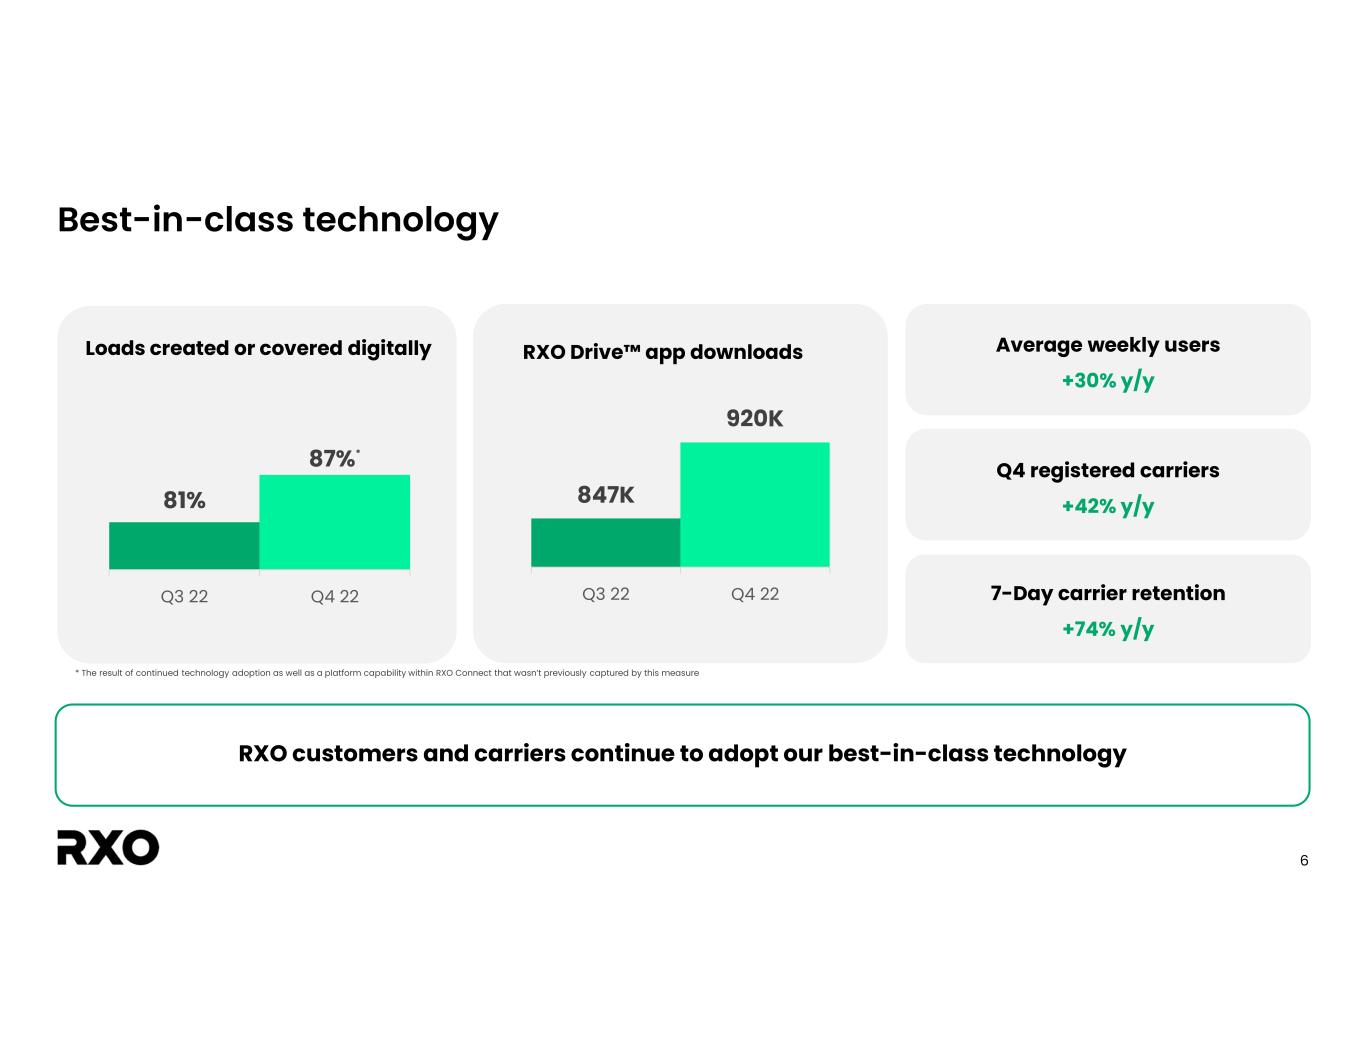
•Downloads of RXO Drive™ app increased 45% year-over-year, and 87% of loads in the quarter were created or covered digitally
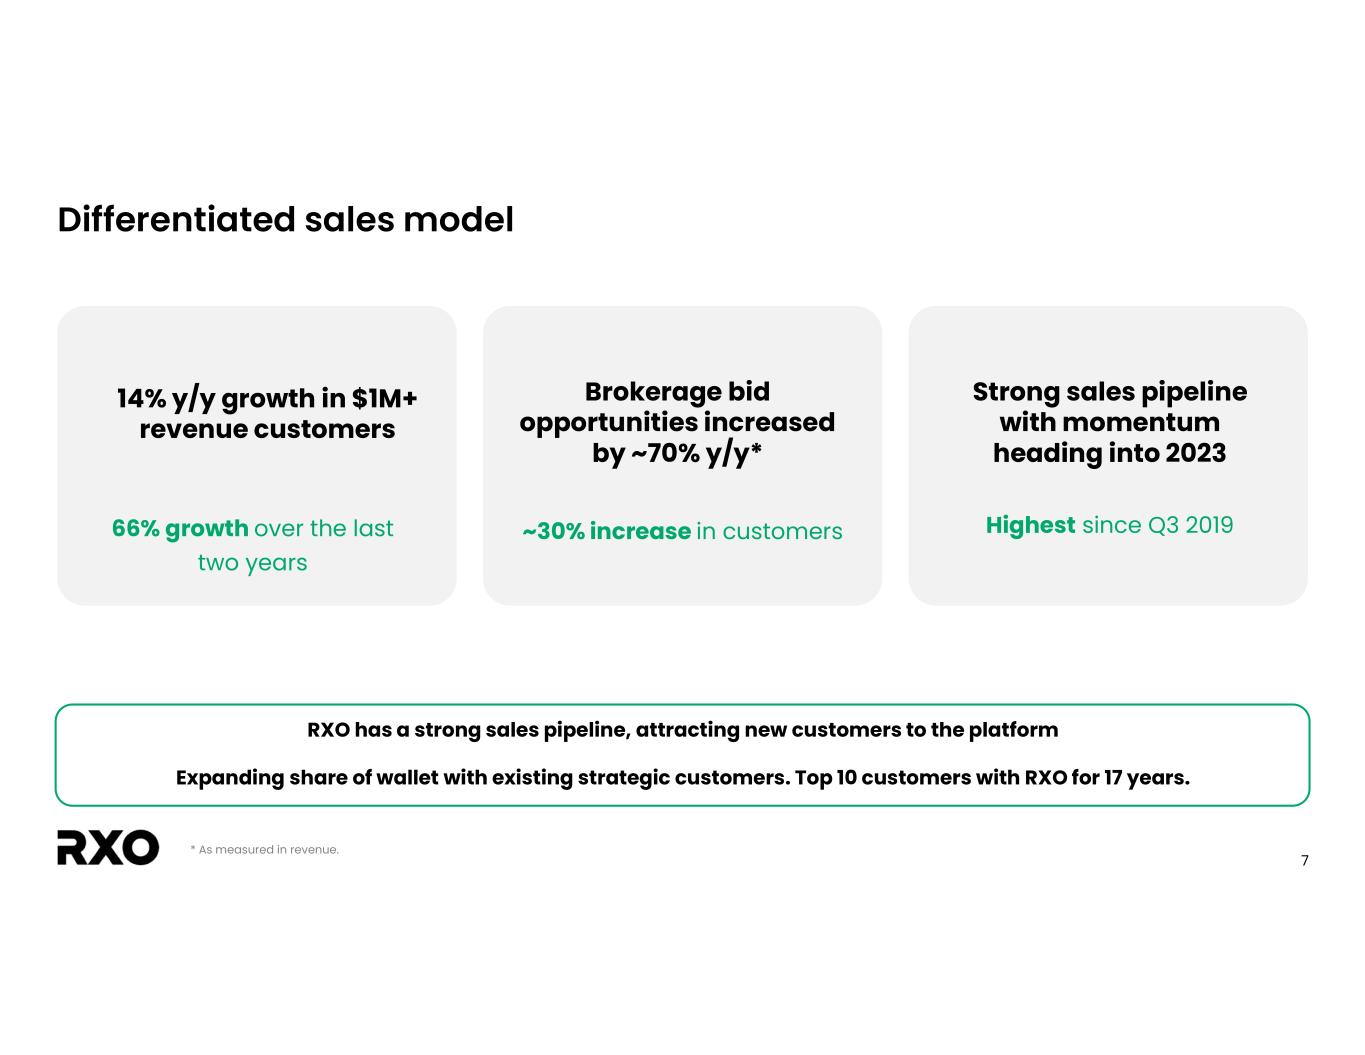
•Company expects continued year-over-year brokerage volume growth in the first quarter of 2023, driven by strong sales pipeline
CHARLOTTE, N.C. — February 7, 2023 — RXO (NYSE: RXO) today announced its financial results for the fourth quarter of 2022.
Drew Wilkerson, chief executive officer of RXO, said, “We’re proud of what we were able to accomplish in our first quarterly report as a standalone company, despite the dynamics of the current freight cycle and the challenging macroeconomy. We achieved record volume in our brokerage business, with volume growth of 4 percent year-over-year in the quarter. Importantly, companywide gross margin was 19.6 percent, up 250 basis points year-over-year.
“Demand for our managed transportation and last mile services remained strong in the quarter. Also, our best-in-class technology continued to be adopted by some of the world’s largest and most well-respected companies,” Wilkerson continued. “Eighty-seven percent of brokerage loads in the fourth quarter were created or covered digitally, and downloads of our driver app, RXO Drive™, increased by 45 percent year-over-year.”
Wilkerson concluded, “We remain focused on taking profitable market share. With our massive capacity and best-in-class technology, RXO remains in a great position to deliver our long-term financial targets.”
Companywide Results
The company’s revenue was $1.1 billion for the fourth quarter, compared to $1.3 billion in the fourth quarter of 2021. Profitability remained strong, with 19.6 percent gross margin, up 250 basis points year-over-year.
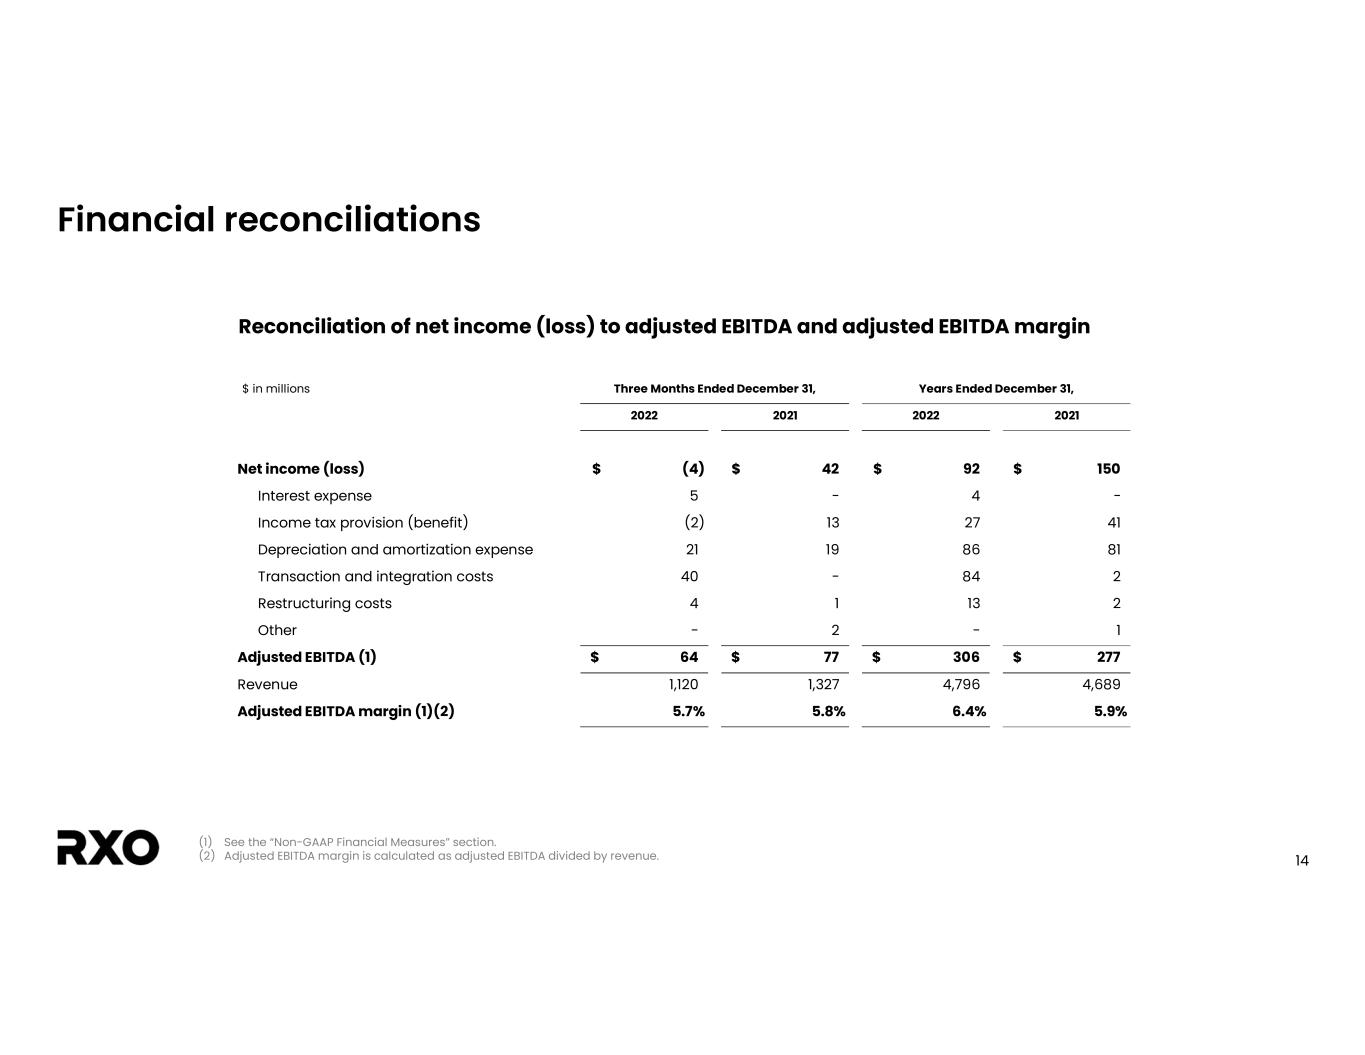
Due to $44 million in spin-related transaction, integration and restructuring costs, the company reported a fourth-quarter 2022 GAAP net loss of $4 million, compared to net income of $42 million in the fourth quarter of 2021. Adjusted net income in the quarter was $33 million, compared to $47 million in the fourth quarter of 2021. Adjusted earnings before interest, taxes, depreciation and amortization (adjusted EBITDA) was $64 million, compared to $77 million in the fourth quarter of 2021. Adjusted EBITDA margin was 5.7 percent, down 10 basis points year-over-year.
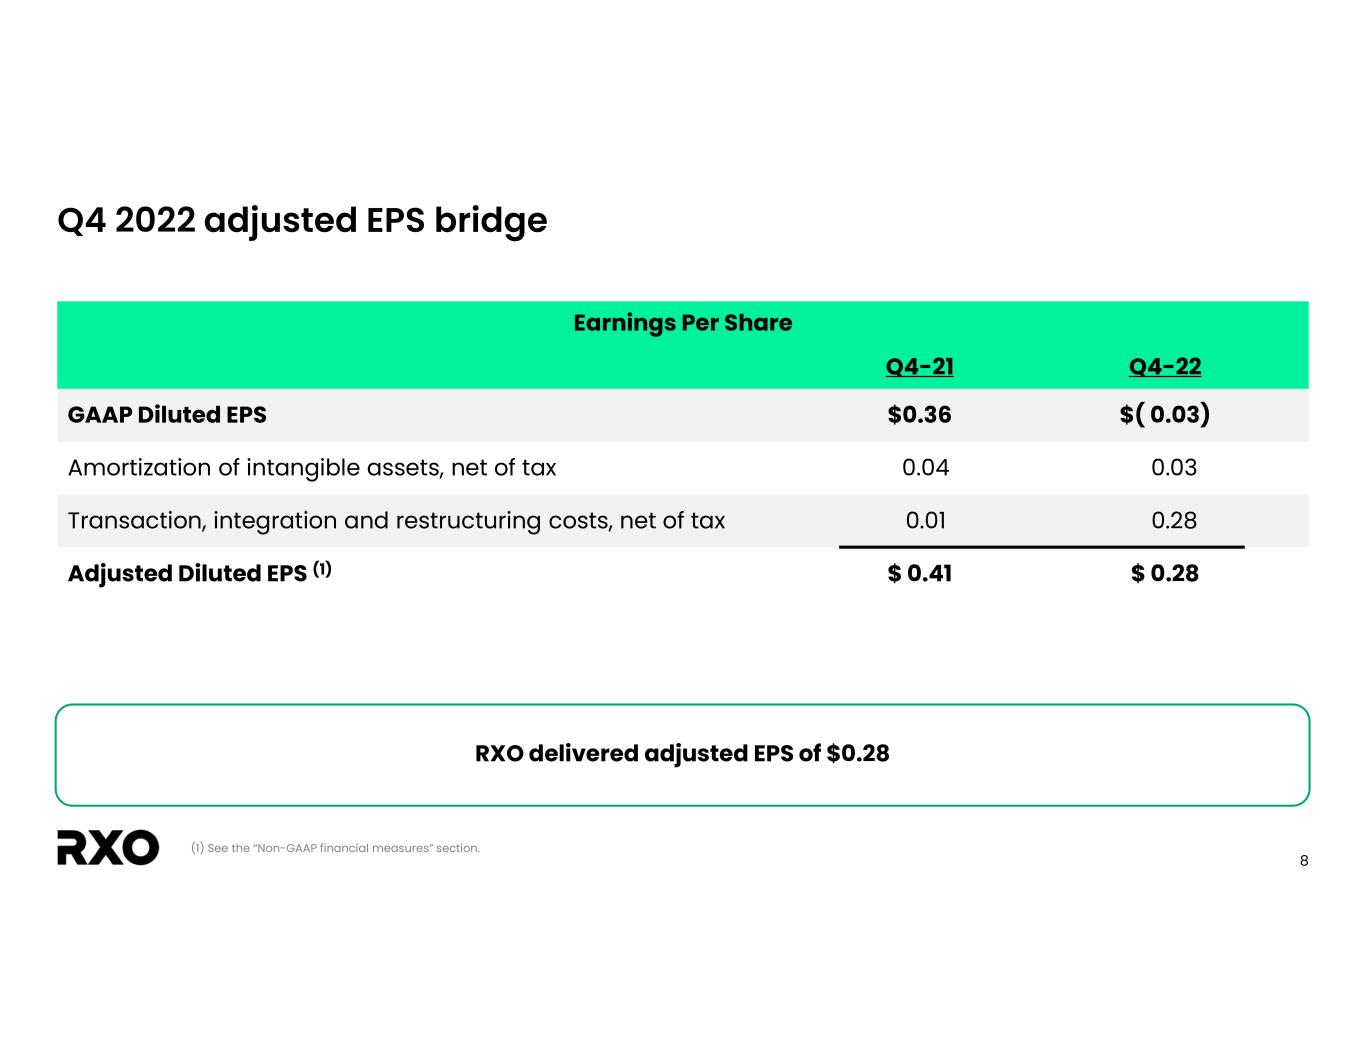
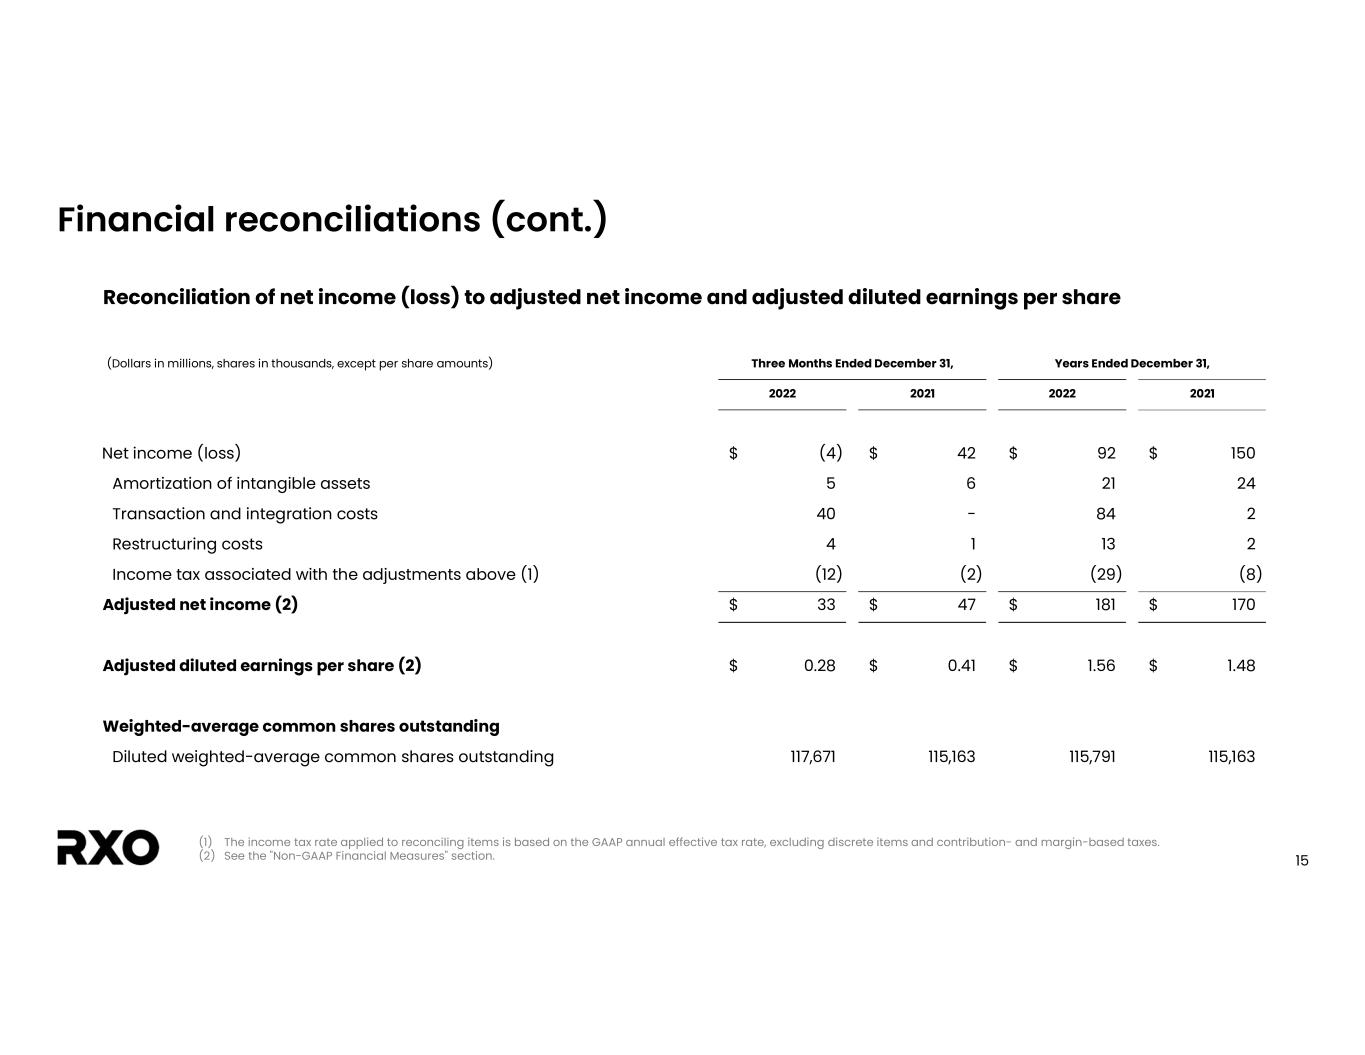
Spin-related transaction, integration and restructuring costs, and amortization of intangibles, impacted GAAP earnings per share by $0.31, net of tax. For the fourth quarter, RXO reported a GAAP diluted loss per share of $0.03. Adjusted diluted earnings per share were $0.28.
RXO 4Q 2022 Earnings Press Release | 1
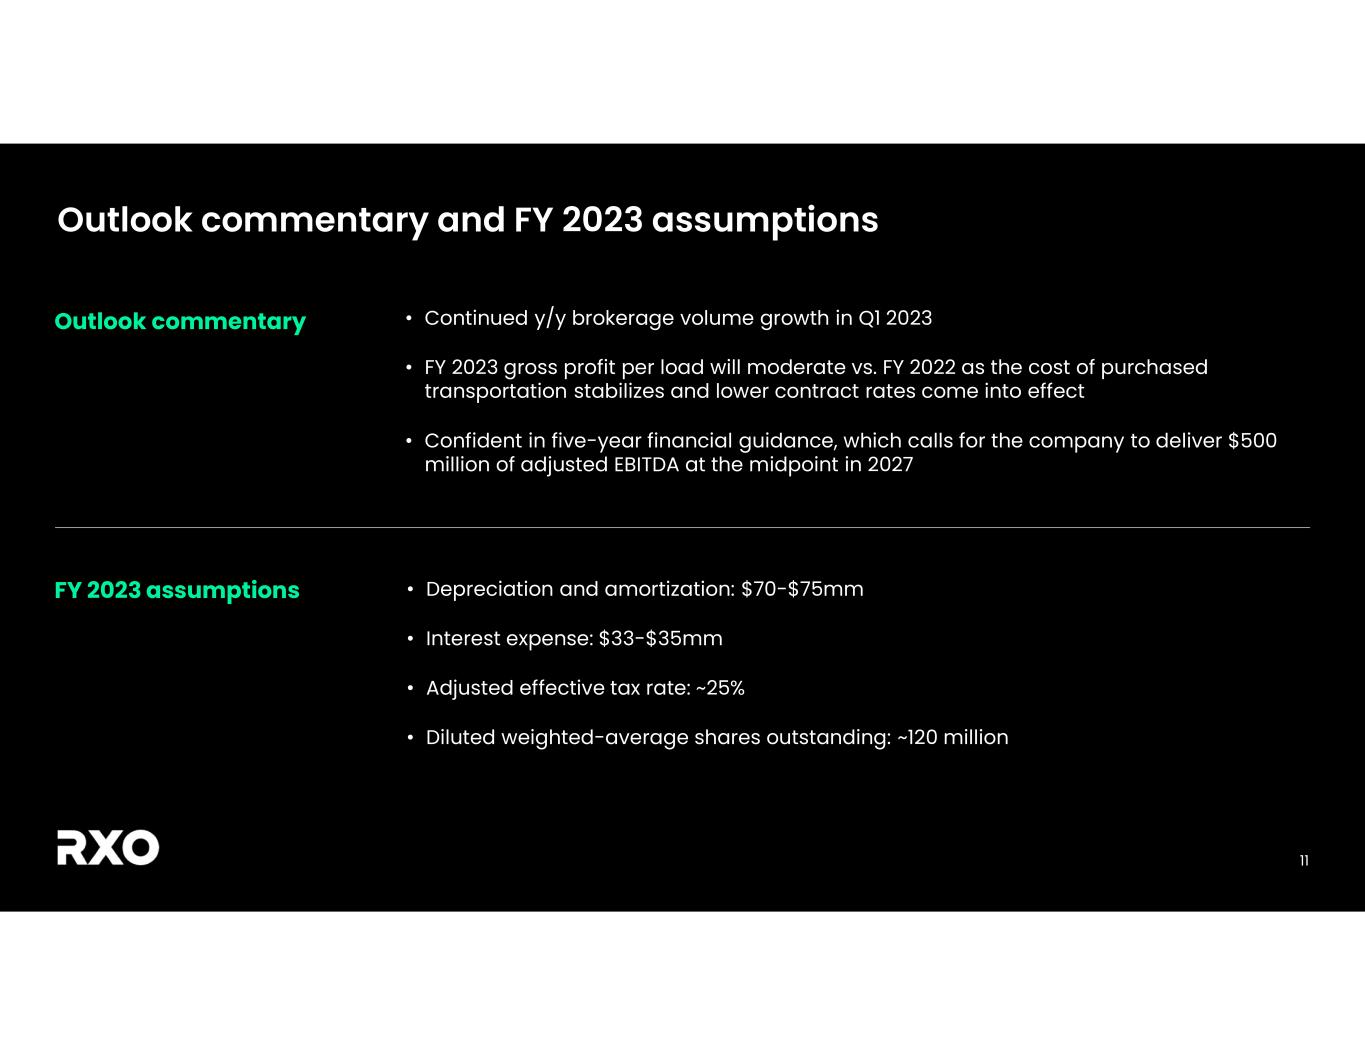
RXO remains confident in achieving its five-year financial targets, which call for the company to deliver $500 million of adjusted EBITDA at the midpoint in 2027.
Brokerage
RXO’s brokerage business grew volume 4 percent year-over-year and set a new volume record in the fourth quarter.
Brokerage gross margin was 17.9 percent in the fourth quarter, up 290 basis points year-over-year.
The company expects brokerage volumes to continue to grow on a year-over-year basis in the first quarter of 2023.
Complementary Services
Approximately 62 percent of RXO’s full-year 2022 revenue came from customers that conducted business with more than one service offering.
Customer demand for managed transportation services increased during the fourth quarter of 2022, and last mile stops remained robust driven by customers in the appliance, electronics and fitness industries.
Technology Update
In the fourth quarter of 2022, 87 percent of RXO’s brokerage loads were created or covered digitally using RXO’s best-in-class technology platform.
Additionally, downloads of the company’s driver app, RXO Drive™, increased by 45 percent year-over-year in the fourth quarter to more than 920,000.
The company increased registered carriers on its RXO Connect™ platform by 42 percent and increased average weekly users by 30 percent year-over-year in the fourth quarter.
Conference Call
The company will hold a conference call and webcast on Wednesday, February 8 at 8 a.m. Eastern Time. Participants can call in toll-free (from U.S./Canada) at 1-888-886-7786; international callers dial +1-416-764-8658. The conference ID is 54142388.
A live webcast of the conference call will be available on the investor relations area of the company’s website, http://investors.rxo.com. A replay of the conference call will be available through March 1, 2023, by calling toll-free (from U.S./Canada) 1-877-674-7070; international callers dial +1-416-764-8692. Use the passcode 142388#. Additionally, the call will be archived on http://investors.rxo.com.
About RXO
RXO (NYSE: RXO) is a leading provider of asset-light transportation solutions. RXO is primarily driven by a tech-enabled truck brokerage and also offers complementary solutions for managed transportation, freight forwarding and last mile delivery. The company combines massive capacity and cutting-edge technology to move freight efficiently through supply chains. RXO’s proprietary technology connects approximately 10,000 customers with more than 100,000 independent carriers across North America. The company is headquartered in Charlotte, N.C. Visit RXO.com for more information and connect with RXO on Facebook, Twitter, LinkedIn, Instagram and YouTube.
Media Contact
Nina Reinhardt
+1 980-408-1594
Investor Contact
Kevin Sterling
+ 1 804-305-5285
RXO 4Q 2022 Earnings Press Release | 2
Non-GAAP Financial Measures
We provide reconciliations of the non-GAAP financial measures contained in this release to the most directly comparable measure under GAAP, which are set forth in the financial tables attached to this release.
The non-GAAP financial measures in this release include: adjusted earnings before interest, taxes, depreciation and amortization (“adjusted EBITDA”); adjusted EBITDA margin; gross margin (revenue less cost of transportation and services (exclusive of depreciation and amortization) and direct operating expense (exclusive of depreciation and amortization)) and gross margin as a percentage of revenue by service offering; and adjusted net income and adjusted diluted earnings per share (“adjusted EPS”).
We believe that these adjusted financial measures facilitate analysis of our ongoing business operations because they exclude items that may not reflect, or are unrelated to, RXO’s core operating performance, and may assist investors with comparisons to prior periods and assessing trends in our underlying businesses. Other companies may calculate these non-GAAP financial measures differently, and therefore our measures may not be comparable to similarly titled measures of other companies. These non-GAAP financial measures should only be used as supplemental measures of our operating performance.
Adjusted EBITDA, adjusted EBITDA margin, adjusted net income and adjusted EPS include adjustments for transaction and integration costs, as well as restructuring costs and other adjustments as set forth in the attached tables. Management uses these non-GAAP financial measures in making financial, operating and planning decisions and evaluating RXO’s ongoing performance.
We believe that adjusted EBITDA, adjusted EBITDA margin, gross margin and gross margin as a percentage of revenue improve comparability from period to period by removing the impact of our capital structure (interest and financing expenses), asset base (depreciation and amortization), tax impacts and other adjustments that management has determined do not reflect our core operating activities and thereby assist investors with assessing trends in our underlying business. We believe that adjusted net income and adjusted EPS improve the comparability of our operating results from period to period by removing the impact of certain costs that management has determined do not reflect our core operating activities, including amortization of acquisition-related intangible assets, transaction and integration costs, restructuring costs and other adjustments as set out in the attached tables.
Forward-looking Statements
This release includes forward-looking statements, including statements relating to our continued year-over-year brokerage volume growth in the first quarter of 2023, our five-year financial targets, and our ability to outperform in any market cycle. All statements other than statements of historical fact are, or may be deemed to be, forward-looking statements. In some cases, forward-looking statements can be identified by the use of forward-looking terms such as "anticipate," "estimate," "believe," "continue," "could," "intend," "may," "plan," "predict," "should," "will," "expect," "project," "forecast," "goal," "outlook," "target,” or the negative of these terms or other comparable terms. However, the absence of these words does not mean that the statements are not forward-looking. These forward-looking statements are based on certain assumptions and analyses made by us in light of our experience and our perception of historical trends, current conditions and expected future developments, as well as other factors we believe are appropriate in the circumstances.
These forward-looking statements are subject to known and unknown risks, uncertainties and assumptions that may cause actual results, levels of activity, performance, or achievements to be materially different from any future results, levels of activity, performance or achievements expressed or implied by such forward-looking statements. Factors that might cause or contribute to a material difference include the risks discussed in our filings with the SEC and the following: competition and pricing pressures; economic conditions generally; the severity, magnitude, duration and aftereffects of the COVID-19 pandemic and government responses to the COVID-19 pandemic; fluctuations in fuel prices; increased carrier prices; severe weather, natural disasters, terrorist attacks or similar incidents that cause material disruptions to our operations or the operations of the third-party carriers and independent contractors with which we contract; our dependence on third-party carriers and independent contractors; labor disputes or organizing efforts affecting our workforce and those of our third-party carriers; legal and regulatory challenges to the status of the third-party carriers with which we contract, and their delivery workers, as independent contractors, rather than employees; litigation that may adversely affect our business or reputation; increasingly stringent laws protecting the environment, including transitional risks relating to climate change, that impact our third-party carriers; governmental regulation and political conditions; our ability to develop and implement suitable information technology systems and prevent failures in or breaches of such systems; the impact of potential cyber-attacks and information technology or data security breaches; issues related to our intellectual property rights; our ability to access the capital markets and generate sufficient cash flow to satisfy our debt obligations; our ability to attract and retain qualified personnel; our ability to successfully implement our cost and revenue initiatives and other strategies; our ability to successfully manage our growth; our reliance on certain large customers for a significant portion of our revenue; damage to our reputation through unfavorable publicity; our failure to meet performance levels required by our contracts with our customers; the inability to achieve the level of revenue growth, cash generation, cost savings, improvement in profitability and margins, fiscal discipline, or strengthening of competitiveness and operations anticipated or targeted;
RXO 4Q 2022 Earnings Press Release | 3
a determination by the IRS that the distribution or certain related separation transactions should be treated as taxable transactions; and the impact of the separation on our businesses, operations and results. All forward-looking statements set forth in this release are qualified by these cautionary statements and there can be no assurance that the actual results or developments anticipated by us will be realized or, even if substantially realized, that they will have the expected consequences to or effects on us or our business or operations. Forward-looking statements set forth in this release speak only as of the date hereof, and we do not undertake any obligation to update forward-looking statements to reflect subsequent events or circumstances, changes in expectations or the occurrence of unanticipated events, except to the extent required by law.
RXO 4Q 2022 Earnings Press Release | 4
RXO, Inc.
Consolidated Statements of Operations
(Unaudited)
| Three Months Ended December 31, | Years Ended December 31, | |||||||||||||||||||||||||
| (Dollars in millions, shares in thousands, except per share amounts) | 2022 | 2021 | 2022 | 2021 | ||||||||||||||||||||||
| Revenue | $ | 1,120 | $ | 1,327 | $ | 4,796 | $ | 4,689 | ||||||||||||||||||
| Cost of transportation and services (exclusive of depreciation and amortization) | 842 | 1,051 | 3,624 | 3,681 | ||||||||||||||||||||||
| Direct operating expense (exclusive of depreciation and amortization) | 59 | 49 | 226 | 192 | ||||||||||||||||||||||
| Sales, general and administrative expense | 155 | 152 | 640 | 539 | ||||||||||||||||||||||
| Depreciation and amortization expense | 21 | 19 | 86 | 81 | ||||||||||||||||||||||
| Transaction and integration costs | 40 | — | 84 | 2 | ||||||||||||||||||||||
| Restructuring costs | 4 | 1 | 13 | 2 | ||||||||||||||||||||||
| Operating income (loss) | (1) | 55 | 123 | 192 | ||||||||||||||||||||||
| Other expense | — | — | — | 1 | ||||||||||||||||||||||
| Interest expense, net | 5 | — | 4 | — | ||||||||||||||||||||||
| Income (loss) before income taxes | (6) | 55 | 119 | 191 | ||||||||||||||||||||||
| Income tax provision (benefit) | (2) | 13 | 27 | 41 | ||||||||||||||||||||||
| Net income (loss) | $ | (4) | $ | 42 | $ | 92 | $ | 150 | ||||||||||||||||||
| Earnings (loss) per share data | ||||||||||||||||||||||||||
| Basic earnings (loss) per share | $ | (0.03) | $ | 0.36 | $ | 0.80 | $ | 1.30 | ||||||||||||||||||
| Diluted earnings (loss) per share | $ | (0.03) | $ | 0.36 | $ | 0.79 | $ | 1.30 | ||||||||||||||||||
| Weighted-average shares outstanding | ||||||||||||||||||||||||||
| Basic weighted-average shares outstanding | 115,848 | 115,163 | 115,335 | 115,163 | ||||||||||||||||||||||
| Diluted weighted-average shares outstanding | 115,848 | 115,163 | 115,791 | 115,163 | ||||||||||||||||||||||
RXO 4Q 2022 Earnings Press Release | 5
RXO, Inc.
Consolidated Balance Sheets
(Unaudited)
| December 31, | ||||||||||||||
| (Dollars in millions, shares in thousands, except per share amounts) | 2022 | 2021 | ||||||||||||
| ASSETS | ||||||||||||||
| Current assets | ||||||||||||||
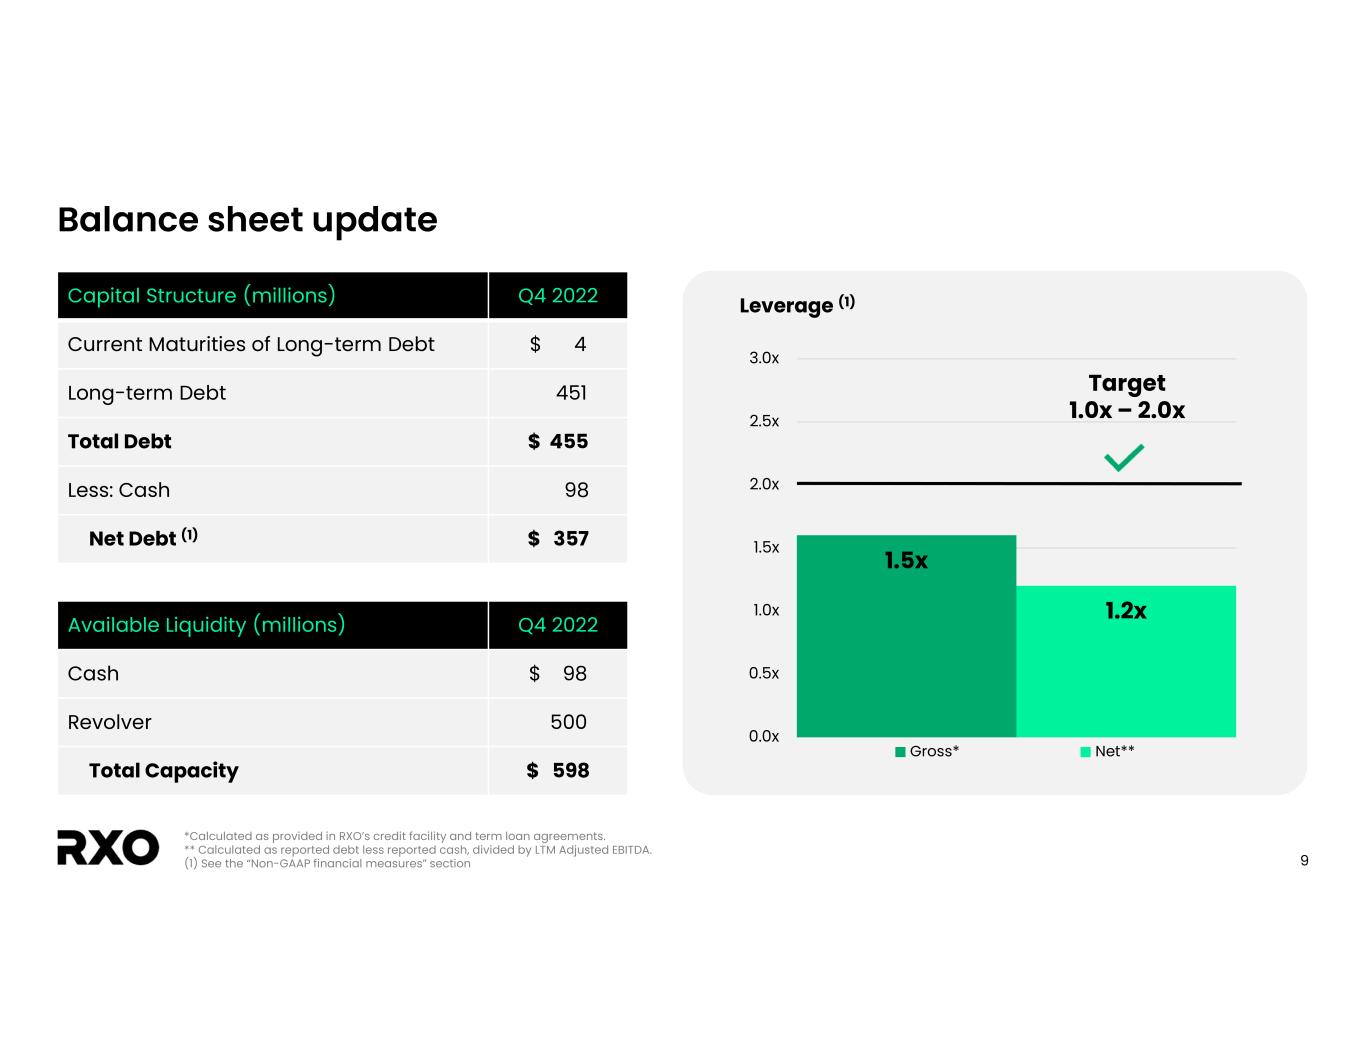
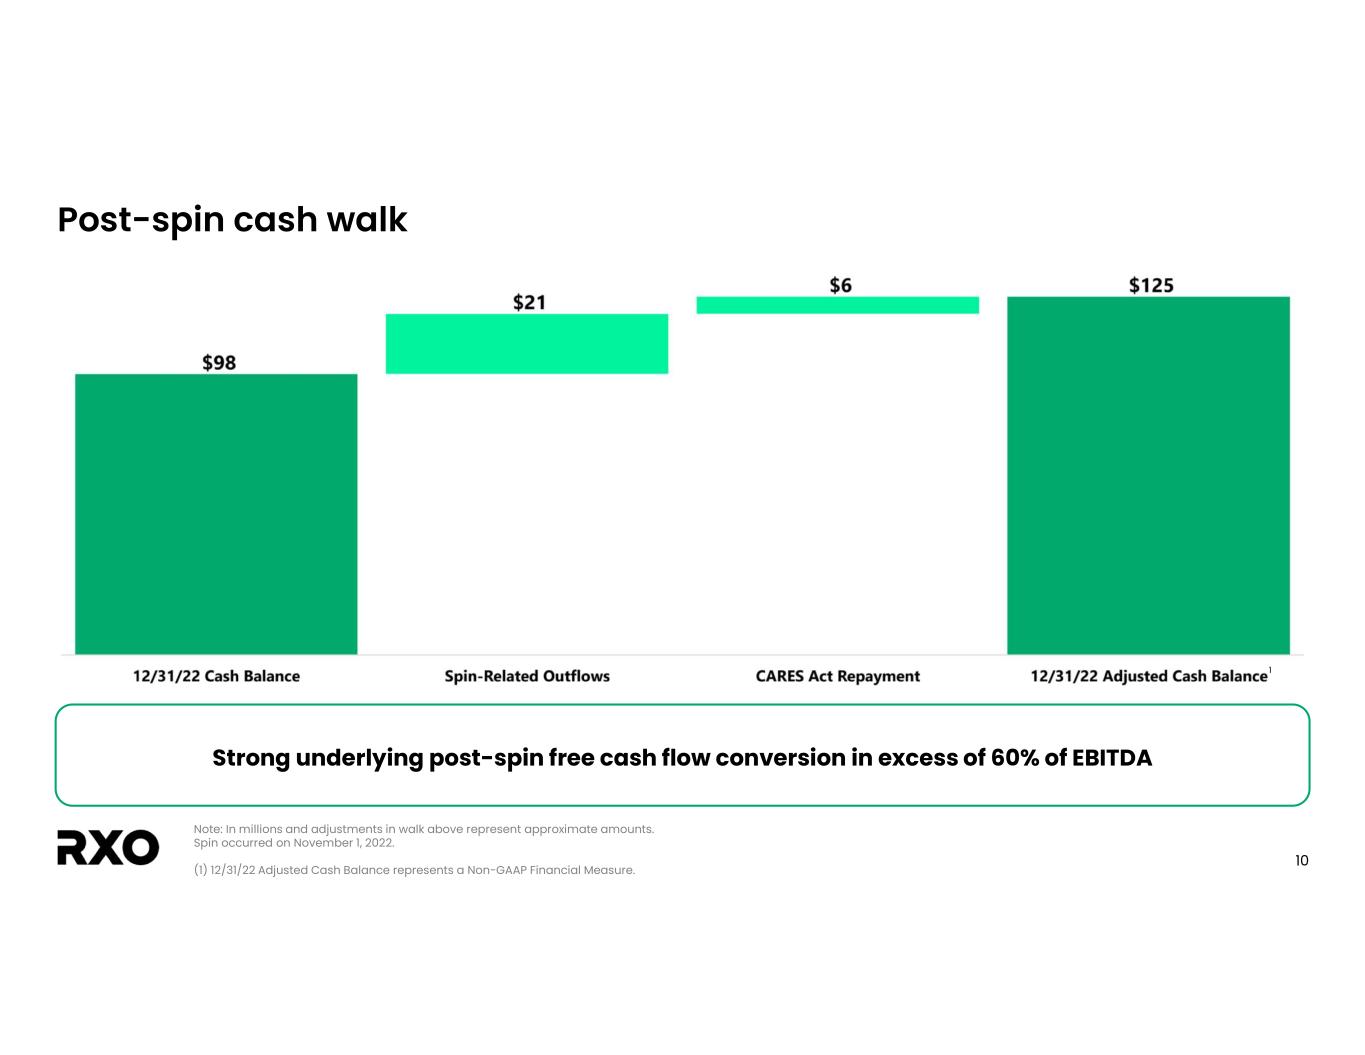
| Cash and cash equivalents | $ | 98 | $ | 29 | ||||||||||
| Accounts receivable, net of allowances of $13 and $9, respectively | 907 | 1,010 | ||||||||||||
| Other current assets | 32 | 44 | ||||||||||||
| Total current assets | 1,037 | 1,083 | ||||||||||||
| Long-term assets | ||||||||||||||
| Property and equipment, net of $241 and $219 in accumulated depreciation, respectively | 119 | 111 | ||||||||||||
| Operating lease assets | 159 | 128 | ||||||||||||
| Goodwill | 630 | 630 | ||||||||||||
| Identifiable intangible assets, net of $106 and $217 in accumulated amortization, respectively | 79 | 100 | ||||||||||||
| Other long-term assets | 14 | 16 | ||||||||||||
| Total long-term assets | 1,001 | 985 | ||||||||||||
| Total assets | $ | 2,038 | $ | 2,068 | ||||||||||
| LIABILITIES AND STOCKHOLDERS’ EQUITY | ||||||||||||||
| Current liabilities | ||||||||||||||
| Accounts payable | $ | 508 | $ | 520 | ||||||||||
| Accrued expenses | 266 | 248 | ||||||||||||
| Current maturities of long-term debt | 4 | — | ||||||||||||
| Short-term operating lease liabilities | 48 | 42 | ||||||||||||
| Other current liabilities | 13 | 6 | ||||||||||||
| Total current liabilities | 839 | 816 | ||||||||||||
| Long-term liabilities | ||||||||||||||
| Long-term debt and obligations under finance leases | 451 | — | ||||||||||||
| Deferred tax liability | 16 | 52 | ||||||||||||
| Long-term operating lease liabilities | 114 | 93 | ||||||||||||
| Other long-term liabilities | 29 | 37 | ||||||||||||
| Total long-term liabilities | 610 | 182 | ||||||||||||
| Equity | ||||||||||||||
| Preferred stock, $0.01 par value; 10,000 shares authorized; 0 shares issued and outstanding as of December 31, 2022 | — | — | ||||||||||||
| Common stock, $0.01 par value; 300,000 shares authorized; 116,400 issued and outstanding as of December 31, 2022 | 1 | — | ||||||||||||
| Additional paid-in capital | 590 | — | ||||||||||||
| Retained earnings | 2 | — | ||||||||||||
| XPO investment | — | 1,072 | ||||||||||||
| Accumulated other comprehensive loss | (4) | (2) | ||||||||||||
| Total equity | 589 | 1,070 | ||||||||||||
| Total liabilities and equity | $ | 2,038 | $ | 2,068 | ||||||||||
RXO 4Q 2022 Earnings Press Release | 6
RXO, Inc.
Consolidated Statements of Cash Flows
(Unaudited)
| Years Ended December 31, | ||||||||||||||
| (In millions) | 2022 | 2021 | ||||||||||||
| Operating activities | ||||||||||||||
| Net income | $ | 92 | $ | 150 | ||||||||||
| Adjustments to reconcile net income to net cash from operating activities | ||||||||||||||
| Depreciation and amortization expense | 86 | 81 | ||||||||||||
| Stock compensation expense | 32 | 8 | ||||||||||||
| Deferred tax expense | (20) | 3 | ||||||||||||
| Other | 6 | 3 | ||||||||||||
| Changes in assets and liabilities | ||||||||||||||
| Accounts receivable | 92 | (242) | ||||||||||||
| Other assets | 14 | (4) | ||||||||||||
| Accounts payable | (14) | 129 | ||||||||||||
| Accrued expenses and other liabilities | 22 | 27 | ||||||||||||
| Net cash provided by operating activities | 310 | 155 | ||||||||||||
| Investing activities | ||||||||||||||
| Payment for purchases of property and equipment | (57) | (39) | ||||||||||||
| Proceeds from sale of property and equipment | 1 | 1 | ||||||||||||
| Net cash used in investing activities | (56) | (38) | ||||||||||||
| Financing activities | ||||||||||||||
| Proceeds from issuance of debt | 451 | — | ||||||||||||
| Payment for debt issuance costs | (9) | — | ||||||||||||
| Payment for tax withholdings for restricted shares | (3) | — | ||||||||||||
| Net transfers to XPO | (621) | (159) | ||||||||||||
| Other | (1) | 1 | ||||||||||||
| Net cash used in financing activities | (183) | (158) | ||||||||||||
| Effect of exchange rates of cash, cash equivalents and restricted cash | (2) | — | ||||||||||||
| Net increase (decrease) in cash, cash equivalents and restricted cash | 69 | (41) | ||||||||||||
| Cash, cash equivalents and restricted cash, beginning of period | 29 | 70 | ||||||||||||
| Cash, cash equivalents and restricted cash, end of period | $ | 98 | $ | 29 | ||||||||||
RXO 4Q 2022 Earnings Press Release | 7
RXO, Inc.
Revenue Disaggregated by Service Offering
(Unaudited)
| Three Months Ended December 31, | Years Ended December 31, | |||||||||||||||||||||||||
| (In millions) | 2022 | 2021 | 2022 | 2021 | ||||||||||||||||||||||
| Revenue | ||||||||||||||||||||||||||
| Truck brokerage | $ | 664 | $ | 846 | $ | 2,929 | $ | 2,749 | ||||||||||||||||||
| Last mile | 277 | 251 | 1,061 | 1,016 | ||||||||||||||||||||||
| Managed transportation | 129 | 118 | 523 | 603 | ||||||||||||||||||||||
| Freight forwarding | 82 | 145 | 422 | 434 | ||||||||||||||||||||||
| Eliminations | (32) | (33) | (139) | (113) | ||||||||||||||||||||||
| Total | $ | 1,120 | $ | 1,327 | $ | 4,796 | $ | 4,689 | ||||||||||||||||||
RXO 4Q 2022 Earnings Press Release | 8
RXO, Inc.
Reconciliation of Net Income (Loss) to Adjusted EBITDA and Adjusted EBITDA Margin
(Unaudited)
| Three Months Ended December 31, | Years Ended December 31, | |||||||||||||||||||||||||
| (Dollars in millions) | 2022 | 2021 | 2022 | 2021 | ||||||||||||||||||||||
| Reconciliation of Net Income (Loss) to Adjusted EBITDA | ||||||||||||||||||||||||||
| Net income (loss) | $ | (4) | $ | 42 | $ | 92 | $ | 150 | ||||||||||||||||||
| Interest expense | 5 | — | 4 | — | ||||||||||||||||||||||
| Income tax provision (benefit) | (2) | 13 | 27 | 41 | ||||||||||||||||||||||
| Depreciation and amortization expense | 21 | 19 | 86 | 81 | ||||||||||||||||||||||
| Transaction and integration costs | 40 | — | 84 | 2 | ||||||||||||||||||||||
| Restructuring costs | 4 | 1 | 13 | 2 | ||||||||||||||||||||||
| Other | — | 2 | — | 1 | ||||||||||||||||||||||
Adjusted EBITDA (1) | $ | 64 | $ | 77 | $ | 306 | $ | 277 | ||||||||||||||||||
| Revenue | $ | 1,120 | $ | 1,327 | $ | 4,796 | $ | 4,689 | ||||||||||||||||||
Adjusted EBITDA margin (1) (2) | 5.7 | % | 5.8 | % | 6.4 | % | 5.9 | % | ||||||||||||||||||
(1)See the “Non-GAAP Financial Measures” section of the press release.
(2)Adjusted EBITDA margin is calculated as Adjusted EBITDA divided by Revenue.
RXO 4Q 2022 Earnings Press Release | 9
RXO, Inc.
Reconciliation of Net Income (Loss) to Adjusted Net Income and Adjusted Net Income Per Share
(Unaudited)
| Three Months Ended December 31, | Years Ended December 31, | |||||||||||||||||||||||||
| (Dollars in millions, shares in thousands, except per share amounts) | 2022 | 2021 | 2022 | 2021 | ||||||||||||||||||||||
| Reconciliation of Net Income (Loss) to Adjusted Net Income and Adjusted Net Income Per Share | ||||||||||||||||||||||||||
| Net income (loss) | $ | (4) | $ | 42 | $ | 92 | $ | 150 | ||||||||||||||||||
| Amortization of intangible assets | 5 | 6 | 21 | 24 | ||||||||||||||||||||||
| Transaction and integration costs | 40 | — | 84 | 2 | ||||||||||||||||||||||
| Restructuring costs | 4 | 1 | 13 | 2 | ||||||||||||||||||||||
Income tax associated with adjustments above (1) | (12) | (2) | (29) | (8) | ||||||||||||||||||||||
Adjusted net income (2) | $ | 33 | $ | 47 | $ | 181 | $ | 170 | ||||||||||||||||||
Adjusted diluted earnings per share (2) | $ | 0.28 | $ | 0.41 | $ | 1.56 | $ | 1.48 | ||||||||||||||||||
| Weighted-average shares outstanding | ||||||||||||||||||||||||||
| Diluted weighted-average shares outstanding | 117,671 | 115,163 | 115,791 | 115,163 | ||||||||||||||||||||||
(1)The income tax rate applied to reconciling items is based on the GAAP effective tax rate, excluding discrete items and contribution- and margin-based taxes.
| Amortization of intangible assets | (1) | (2) | (5) | (6) | ||||||||||||||||||||||
| Transaction and integration costs | (10) | — | (21) | (1) | ||||||||||||||||||||||
| Restructuring costs | (1) | — | (3) | (1) | ||||||||||||||||||||||
| Total income tax associated with the adjustments above | $ | (12) | $ | (2) | $ | (29) | $ | (8) | ||||||||||||||||||
(2)See the "Non-GAAP Financial Measures" section of the press release.
RXO 4Q 2022 Earnings Press Release | 10
RXO, Inc.
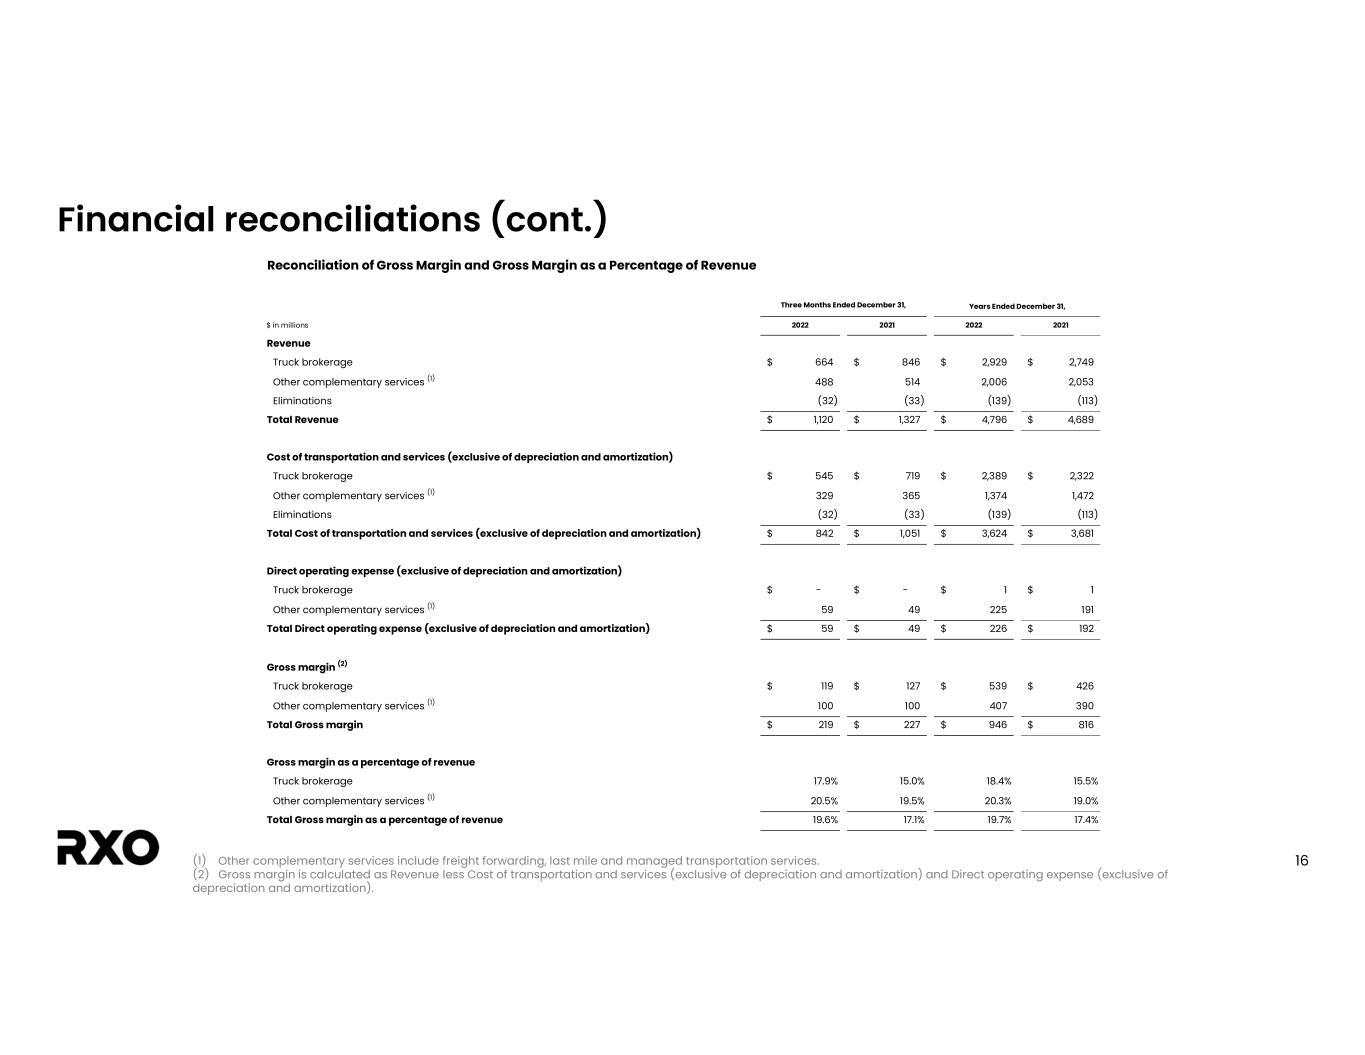
Reconciliation of Gross Margin and Gross Margin as a Percentage of Revenue
(Unaudited)
| Three Months Ended December 31, | Years Ended December 31, | |||||||||||||||||||||||||
| (Dollars in millions) | 2022 | 2021 | 2022 | 2021 | ||||||||||||||||||||||
| Revenue | ||||||||||||||||||||||||||
| Truck brokerage | $ | 664 | $ | 846 | $ | 2,929 | $ | 2,749 | ||||||||||||||||||
Other complementary services (1) | 488 | 514 | 2,006 | 2,053 | ||||||||||||||||||||||
| Eliminations | (32) | (33) | (139) | (113) | ||||||||||||||||||||||
| Total Revenue | $ | 1,120 | $ | 1,327 | $ | 4,796 | $ | 4,689 | ||||||||||||||||||
| Cost of transportation and services (exclusive of depreciation and amortization) | ||||||||||||||||||||||||||
| Truck brokerage | $ | 545 | $ | 719 | $ | 2,389 | $ | 2,322 | ||||||||||||||||||
Other complementary services (1) | 329 | 365 | 1,374 | 1,472 | ||||||||||||||||||||||
| Eliminations | (32) | (33) | (139) | (113) | ||||||||||||||||||||||
| Total Cost of transportation and services (exclusive of depreciation and amortization) | $ | 842 | $ | 1,051 | $ | 3,624 | $ | 3,681 | ||||||||||||||||||
| Direct operating expense (exclusive of depreciation and amortization) | ||||||||||||||||||||||||||
| Truck brokerage | $ | — | $ | — | $ | 1 | $ | 1 | ||||||||||||||||||
Other complementary services (1) | 59 | 49 | 225 | 191 | ||||||||||||||||||||||
| Total Direct operating expense (exclusive of depreciation and amortization) | $ | 59 | $ | 49 | $ | 226 | $ | 192 | ||||||||||||||||||
Gross margin (2) | ||||||||||||||||||||||||||
| Truck brokerage | $ | 119 | $ | 127 | $ | 539 | $ | 426 | ||||||||||||||||||
Other complementary services (1) | 100 | 100 | 407 | 390 | ||||||||||||||||||||||
| Total Gross margin | $ | 219 | $ | 227 | $ | 946 | $ | 816 | ||||||||||||||||||
| Gross margin as a percentage of revenue | ||||||||||||||||||||||||||
| Truck brokerage | 17.9 | % | 15.0 | % | 18.4 | % | 15.5 | % | ||||||||||||||||||
Other complementary services (1) | 20.5 | % | 19.5 | % | 20.3 | % | 19.0 | % | ||||||||||||||||||
| Total Gross margin as a percentage of revenue | 19.6 | % | 17.1 | % | 19.7 | % | 17.4 | % | ||||||||||||||||||
(1)Other complementary services include freight forwarding, last mile and managed transportation services.
(2)Gross margin is calculated as Revenue less Cost of transportation and services (exclusive of depreciation and amortization) and Direct operating expense (exclusive of depreciation and amortization).
RXO 4Q 2022 Earnings Press Release | 11