UNITED STATES
SECURITIES AND EXCHANGE COMMISSION
Washington, D.C. 20549
FORM 8-K
CURRENT REPORT
Pursuant to Section 13 or 15(d)
of the Securities Exchange Act of 1934
Date of Report (Date of earliest event reported): March 4, 2020
Ryerson Holding Corporation
(Exact name of registrant as specified in its charter)
Delaware
(State or other jurisdiction of incorporation)
001-34735
(Commission File Number)
26-1251524
(I.R.S. Employer Identification No.)
227 W. Monroe St., 27th Floor, Chicago, IL 60606
(Address of principal executive offices and zip code)
(312) 292-5000
(Registrant’s telephone number, including area code)
Check the appropriate box below if the Form 8-K filing is intended to simultaneously satisfy the filing obligation of the registrant under any of the following provisions:
|
☐ |
Written communications pursuant to Rule 425 under the Securities Act (17 CFR 230.425) |
|
☐ |
Soliciting material pursuant to Rule 14a-12 under the Exchange Act (17 CFR 240.14a-12) |
|
☐ |
Pre-commencement communications pursuant to Rule 14d-2(b) under the Exchange Act (17 CFR 240.14d-2(b)) |
|
☐ |
Pre-commencement communications pursuant to Rule 13e-4(c) under the Exchange Act (17 CFR 240.13e-4(c))
Securities registered pursuant to Section 12(b) of the Act:
|
|
|
|
|
Title of each class |
Trading symbol(s) |
Name of each exchange on which registered |
|
Common Stock, $0.01 par value, 100,000,000 shares authorized |
RYI |
New York Stock Exchange |
Indicate by check mark whether the registrant is an emerging growth company as defined in Rule 405 of the Securities Act of 1933 (§230.405 of this chapter) or Rule 12b-2 of the Securities Exchange Act of 1934 (§240.12b-2 of this chapter).
Emerging growth company ☐
If an emerging growth company, indicate by check mark if the registrant has elected not to use the extended transition period for complying with any new or revised financial accounting standards provided pursuant to Section 13(a) of the Exchange Act. ☐
Item 2.02. Results of Operations and Financial Condition.
The information contained within Item 2.02 of this Form 8-K and the Exhibits attached hereto shall not be deemed “filed” for purposes of Section 18 of the Securities Exchange Act of 1934 and shall not be deemed incorporated by reference in any filing under the Securities Act of 1933, except as shall be expressly set forth by specific reference in such filing.
On March 4, 2020, Ryerson Holding Corporation (the “Company”) issued a press release announcing its financial results for the quarter and year ended December 31, 2019. A copy of the press release is attached hereto as Exhibit 99.1 and is incorporated herein by reference. In connection with its press release announcing its financial results, the Company also provided a presentation to investors using slides containing the information attached to this Current Report on Form 8-K as Exhibit 99.2 and incorporated herein by reference.
|
Item 9.01. |
Financial Statements and Exhibits. |
d) Exhibits
The following exhibits are furnished with this report:
SIGNATURE
Pursuant to the requirements of the Securities Exchange Act of 1934, the Registrant has duly caused this report to be signed on its behalf by the undersigned hereunto duly authorized.
Dated: March 4, 2020
|
|
|
|
|
RYERSON HOLDING CORPORATION |
|
|
|
|
By: |
|
/s/ Molly D. Kannan |
|
Name: |
|
Molly D. Kannan |
|
Title: |
|
Interim Principal Financial Officer, Chief Accounting Officer and Controller |
Exhibit 99.1
Media and Investor Contact:
Justine Carlson
312.292.5130
Ryerson Reports Fourth Quarter and Full-Year 2019 Results
Gained market share, achieved same-store expense leverage & reduced debt with strong operating cash flow generation in 2019.
CHICAGO – March 4, 2020 – Ryerson Holding Corporation (NYSE: RYI), a leading value-added processor and distributor of industrial metals, today reported results for the fourth quarter and full-year ended December 31, 2019.
Q4 2019 Key Metrics:
|
|
|
|
$962M |
Net Sales |
(17.1%) vs. Q4 2018 |
|
18.8% |
Gross Margin |
+30 bps vs. Q3 2019 |
|
18.1% |
Gross Margin, excl. LIFO |
+230 bps vs. Q3 2019 |
|
$26.4M |
Net income attributable to Ryerson Holding Corporation |
+$25.8M vs. Q4 2018 |
|
$46.9M |
Adj. EBITDA, excl. LIFO |
($3.6M) vs. Q4 2018 |
|
4.9x |
Net Debt / LTM Adj. EBITDA, excl. LIFO |
+1.2x vs. Q4 2018 |
A reconciliation of non-GAAP financial measures to the comparable GAAP measure is included below in this news release.
|
$ in millions, tons in thousands except
average selling prices and EPS |
|
|
|
|
|
|
|
|
|
|
|
|
|
Financial Highlights: |
Q4 2019 |
|
Q4 2018 |
|
Q3 2019 |
|
|
YoY |
|
QoQ |
|
|
2019 |
|
2018 |
|
|
YoY |
|
|
|
|
|
|
|
|
|
|
|
|
|
|
|
|
|
|
|
|
|
|
|
|
|
|
|
|
|
|
|
Tons Shipped |
541 |
|
577 |
|
598 |
|
|
|
(6.2% |
) |
|
(9.5% |
) |
|
|
2,381 |
|
|
2,268 |
|
|
|
5.0% |
|
|
Revenues |
$ |
962 |
|
$ |
1,160 |
|
$ |
1,104 |
|
|
|
(17.1% |
) |
|
(12.9% |
) |
|
$ |
4,502 |
|
$ |
4,408 |
|
|
|
2.1% |
|
|
Average selling prices |
$ |
1,777 |
|
$ |
2,010 |
|
$ |
1,847 |
|
|
|
(11.6% |
) |
|
(3.8% |
) |
|
$ |
1,891 |
|
$ |
1,944 |
|
|
|
(2.7% |
) |
|
Gross Margin, excl. LIFO |
18.1% |
|
17.3% |
|
15.8% |
|
|
|
0.8% |
|
|
2.3% |
|
|
16.9% |
|
19.2% |
|
|
|
(2.3% |
) |
|
Warehousing, delivery, general, & administrative expenses |
$ |
143 |
|
$ |
171 |
|
$ |
166 |
|
|
|
(16.6% |
) |
|
(13.7% |
) |
|
$ |
637 |
|
$ |
615 |
|
|
|
3.6% |
|
|
As a percentage of revenue |
14.9% |
|
14.8% |
|
15.0% |
|
|
|
0.1% |
|
|
(0.1% |
) |
|
14.1% |
|
13.9% |
|
|
|
0.2% |
|
|
Adjusted net income |
$ |
12 |
|
$ |
6 |
|
$ |
9 |
|
|
|
87.1% |
|
|
26.1% |
|
|
$ |
68 |
|
$ |
40 |
|
|
|
68.1% |
|
|
Diluted adjusted earnings per share |
$ |
0.30 |
|
$ |
0.16 |
|
$ |
0.24 |
|
|
|
87.5% |
|
|
25.0% |
|
|
$ |
1.79 |
|
$ |
1.07 |
|
|
|
67.3% |
|
|
Adj. EBITDA, excl. LIFO |
$ |
47 |
|
$ |
51 |
|
$ |
30 |
|
|
|
(7.1% |
) |
|
59.0% |
|
|
$ |
190 |
|
$ |
308 |
|
|
|
(38.3% |
) |
|
As a percentage of revenue |
4.9% |
|
4.4% |
|
2.7% |
|
|
|
0.5% |
|
|
2.2% |
|
|
4.2% |
|
7.0% |
|
|
|
(2.8% |
) |
|
|
|
|
|
|
|
|
|
|
|
|
|
|
|
|
|
|
|
|
|
|
|
|
|
|
|
|
|
|
Balance Sheet and Cash Flow Highlights: |
|
|
|
|
|
|
|
|
|
|
|
|
|
|
|
|
|
|
|
|
|
|
|
|
|
|
|
|
Net debt |
$ |
923 |
|
$ |
1,130 |
|
$ |
1,017 |
|
|
|
(18.3% |
) |
|
(9.2% |
) |
|
|
|
|
|
|
|
|
|
|
|
|
Net debt / LTM Adj. EBITDA, excl. LIFO |
|
4.9 |
x |
|
3.7 |
x |
|
5.2 |
x |
|
|
1.2 |
x |
|
(0.3 |
x) |
|
|
|
|
|
|
|
|
|
|
|
|
Days of supply |
|
84 |
|
|
82 |
|
|
76 |
|
|
2 |
|
8 |
|
|
76 |
|
|
73 |
|
|
3 |
|
|
Net cash provided by operating activities |
$ |
63 |
|
$ |
120 |
|
$ |
83 |
|
|
|
(57 |
) |
|
(20 |
) |
|
$ |
193 |
|
$ |
57 |
|
|
|
136 |
|
A reconciliation of non-GAAP financial measures to the comparable GAAP measure is included below in this news release.
Management Commentary
Eddie Lehner, President and Chief Executive Officer of Ryerson said, “First, I want to thank our valued customers for their business which we never take for granted. I also want to thank my Ryerson teammates for their performance in navigating the challenging industrial metals demand and price environments experienced throughout the year in the form of both prolonged
commodity price deflation as well as industry wide demand contraction. While Metals Service Center Industry (“MSCI”) shipments decreased by more than seven percent in North America in 2019, Ryerson gained market share year-over-year with same-store North American shipments down only 1.3 percent.”
“In addition,” Mr. Lehner continued, “regardless of the year’s turbulence, Ryerson successfully acted upon opportunities presented within the year while continuing to progress toward our long-term financial targets by gaining market share, achieving same-store expense leverage, generating significant cash from operations, reducing debt year-over-year, and building net book value of equity to its highest level in more than ten years. We made these advances amidst the ongoing turnaround at Central Steel & Wire, or CS&W, which, although showing noteworthy progress to date, was significantly impacted by the recessed industry conditions noted throughout 2019. In all, these accomplishments demonstrate a stronger, more cycle-resilient Ryerson that continues to invest in creating exceptional customer experiences at speed and scale.”
Fourth Quarter Results
Ryerson achieved revenues of $961.5 million in the fourth quarter of 2019, a decrease of 17.1 percent compared to $1.16 billion for the same period last year, with average selling prices down 11.6 percent and tons shipped down 6.2 percent. Gross margin expanded to 18.8 percent, compared to 18.5 percent in the third quarter of 2019, and 17.2 percent for the same quarter last year. Included in fourth quarter 2019 cost of materials sold was LIFO income of $6.5 million, compared to LIFO income of $29.6 million in the third quarter of 2019, and LIFO expense of $0.9 million in the fourth quarter of 2018. Excluding LIFO, gross margin was 18.1 percent in the fourth quarter of 2019 compared to 15.8 percent in the third quarter of 2019, and 17.3 percent in the fourth quarter of 2018. A reconciliation of gross margin, excluding LIFO to gross margin is included below in this news release.
Reflective of depressed industry shipments, Ryerson reduced warehousing, delivery, selling, general, and administrative expense by $28.4 million, or 16.6 percent, in the fourth quarter of 2019 compared to the year-ago period. Warehousing, delivery, selling, general, and administrative expenses as a percentage of sales were relatively flat in the fourth quarter of 2019 at 14.9 percent compared to 14.8 percent in the fourth quarter of 2018 as the Company managed expenses in line with year-over-year declines in revenue. However, on a same-store basis (excluding CS&W), warehousing, delivery, selling, general, and administrative expenses decreased by $24.4 million, or 17.6 percent, and also decreased as a percentage of sales from 14.0 percent to 13.5 percent.
Net income attributable to Ryerson Holding Corporation was $26.4 million, or $0.69 per diluted share, in the fourth quarter of 2019 compared to $0.6 million, or $0.01 per diluted share, in the prior year period. Adjusted net income attributable to Ryerson Holding Corporation, excluding the gain on bargain purchase related to the CS&W acquisition, gain on sale of assets related to the sale-leaseback transaction of nine of our facilities, restructuring and other charges, loss on retirement of debt, and the associated income taxes on these items, was $11.6 million for the fourth quarter of 2019, or $0.30 per diluted share compared to $6.2 million or $0.16 per diluted share in the prior year period. Ryerson achieved Adjusted EBITDA, excluding LIFO of $46.9 million in the fourth quarter of 2019, a decrease of $3.6 million compared to the fourth quarter of 2018, or $17.4 million more than the third quarter of 2019. Adj. EBITDA, excluding LIFO exceeded the guidance articulated in our third quarter 2019 news release due to a reduction of $11.0 million of accrued vacation expense resulting from changes to our vacation policy that were adopted at the end of the year which altered the timing of accrual recognition. A reconciliation of Adjusted net income to net income attributable to Ryerson Holding Corporation and Adjusted EBITDA, excluding LIFO to net income attributable to Ryerson Holding Corporation is included below in this news release.
2019 Results
Full-year 2019 revenues were $4.50 billion, an increase of 2.1 percent compared to 2018, with tons shipped 5.0 percent higher and average selling prices 2.7 percent lower. On a same-store basis, excluding the contributions of CS&W from the second half of 2018 and full-year 2019 results, revenues were $3.93 billion in 2019 compared to $4.06 billion in 2018, with tons shipped down 1.9 percent and average selling prices down 1.5 percent. Warehousing, delivery, selling, general, and administrative expenses increased by $22.1 million, or 3.6 percent, and increased as a percentage of sales from 13.9 percent to 14.1 percent in 2019 compared to 2018. Ryerson’s prudent expense management during the weakened demand environment was clearly exhibited on a same-store basis, as warehousing, delivery, selling, general, and administrative expenses decreased by $31.1 million, or 5.7 percent, and also decreased as a percentage of sales from 13.5 percent in 2018 to 13.2 percent in 2019.
Net income attributable to Ryerson Holding Corporation was $82.4 million, or $2.17 per diluted share, in 2019 compared to $106.0 million, or $2.81 per diluted share, for the prior year. Adjusted net income attributable to Ryerson Holding Corporation, excluding the gain on bargain purchase related to the CS&W acquisition, gain on sale of assets related to the sale-leaseback transaction, gain on insurance settlement, restructuring and other charges, loss on retirement of debt, and the associated income taxes on these items was $67.9 million for 2019, or $1.79 per diluted share compared to $40.4 million, or $1.07 per diluted share for 2018. Adjusted EBITDA, excluding LIFO was $190.1 million in 2019 compared to $308.0 million in 2018. Reconciliations of Adjusted EBITDA, excluding LIFO and adjusted net income to net income attributable to Ryerson Holding Corporation are included below in this news release.
CS&W Results
Concluding a year and a half within the Ryerson family of companies, CS&W continued to track above post-acquisition targets by achieving $25 million in annualized expense take-outs, realizing $12 million in cumulative proceeds from real estate sales for operations that were consolidated into existing facilities, and exceeding customer account retention expectations. CS&W was acquired with significant working capital of nearly 140 days of inventory supply, and management continues to target levels more in-line with Ryerson’s same-store service center metrics. However, days of supply at CS&W increased from 92 days at the end of the third quarter of 2019 to 103 at the end of the fourth quarter of 2019 due in part to shipment declines reflective of industry demand weakness as well as opportunistic restocking of carbon steel inventories. Adj. EBITDA, excluding LIFO improved quarter-over-quarter from a loss of $4.5 million in the third quarter to a slight loss of $0.3 million in the fourth quarter, aided by gross margin expansion and execution of structural expense take-outs that are consistent with management’s turnaround strategy. As the early innings of CS&W’s turnaround progress with synergies coming together, structural expense reductions taking hold, and operational efficiencies moving through its next phases, management maintains its long-term, mid-cycle target of $600 million in revenue and $50 million in Adjusted EBITDA, excluding LIFO on an annual basis for the CS&W business.
Liquidity & Debt Management
At the end of the fourth quarter of 2019, Ryerson had 84 days of supply in inventory, up from 76 days at the end of the third quarter. On a same-store basis, Ryerson had 81 days of supply due to opportunistic carbon restocking and progressive shipment declines through the 4th quarter.
Cash generated by operating activities was $62.6 million for the fourth quarter of 2019 compared to $119.8 million in the year-ago period. We utilized our cash flow from operations to reduce debt by $56.8 million and invest in capital expenditures of $13.3 million during the quarter. In total, due to the lower working capital requirements, Ryerson generated $193.1 million from operating activities in 2019 compared to $57.4 million in 2018, and primarily utilized the cash generated to reduce outstanding debt by $171.5 million. At the same time, Ryerson maintained ample liquidity of $439 million as of December 31, 2019 to operate our business.
Corporate Controller and Chief Accounting Officer Molly Kannan said, “Despite the challenges our industry faced in 2019 with decreased demand and falling commodity prices, Ryerson generated significant counter-cyclical cash flow and continued to prioritize balance sheet deleveraging. As of the close of the year, we reduced outstanding debt by $172 million compared to 2018. In addition, Ryerson completed a sale-leaseback transaction in the fourth quarter of 2019, which generated a total of $62 million in net proceeds, which we can use for capital expenditures and debt reduction, and resulted in a $21 million gain on sale. And finally, in acknowledgement of the significant improvements in the company’s operating performance, we are pleased that Moody’s Ratings upgraded Ryerson’s corporate rating to B2 and the senior secured rating to B3. This rating upgrade builds upon the favorable first-time B+ rating awarded to Ryerson during the third quarter by Fitch Ratings, who also recognized our improved operating performance concurrent with a strengthened balance sheet. Together with S&P’s existing B rating on Ryerson’s senior secured debt, Ryerson’s senior secured bonds are B rated across the board. In all, the fourth quarter and full-year 2019 periods proved to be commendable in terms of improving Ryerson’s credit profile, fortifying the balance sheet, and building forward momentum for further deleveraging.”
Outlook Commentary
For the first quarter of 2020, Ryerson anticipates revenues of $1.03 billion to $1.07 billion, driven by the normal seasonality patterns experienced in prior years, but mildly tempered by the recessed manufacturing demand that has carried over from the 2nd half of 2019. In addition, the Coronavirus outbreak is causing temporary and partial operational interruptions within our
China service centers, resulting in decreased shipping days and reducing our revenue outlook for the first quarter by approximately $15 million year-over-year. We cannot yet quantitatively estimate the Coronavirus’s impact to Ryerson’s North American business, however, qualitatively, we expect that it will be a drag on business sentiment and activity. Therefore, Ryerson sequential shipment growth for the first quarter is expected to be in the range of 7 to 9 percent, excluding China. At this point in the first quarter, current carbon prices have increased sequentially, stainless surcharges have continued to decline since their peak in October, and aluminum prices continue to decline on tepid demand and over-supply. Despite these commodity price driver dynamics, Ryerson expects average selling prices in the first quarter to be flat to up 2 percent compared to the fourth quarter due to recovering carbon pricing, lower China shipments, and higher transactional shipment volumes relative to program shipment volumes. LIFO income in the first quarter is expected to be in the range of $21 to $25 million as average inventory costs continue to move closer to replacement costs. Given these expectations, Adjusted EBITDA, excluding LIFO is expected to be in the range of $34 to $38 million and earnings per diluted share are expected to be in the range of $0.31 to $0.42. A reconciliation of Adjusted EBITDA, excluding LIFO to net income is included below in this news release.
|
Same-store Key Financial Metrics Reconciliation |
|
|
|
|
|
|
|
|
|
|
|
Full Year 2019 |
|
|
$ in millions, tons in thousands |
Central Steel & Wire Company |
|
Ryerson Same Store |
|
Ryerson Holding Corporation |
|
|
|
|
|
|
|
|
|
|
|
|
|
Tons Shipped |
|
339 |
|
|
2,042 |
|
|
2,381 |
|
|
Revenues |
$ |
576 |
|
$ |
3,926 |
|
$ |
4,502 |
|
|
Gross Margin, excl. LIFO |
19.0% |
|
16.5% |
|
16.9% |
|
|
Warehousing, delivery, general, & administrative expenses |
$ |
120 |
|
$ |
517 |
|
$ |
637 |
|
|
As a percentage of revenue |
20.8% |
|
13.2% |
|
14.1% |
|
|
Adj. EBITDA, excl. LIFO |
$ |
(3 |
) |
$ |
193 |
|
$ |
190 |
|
|
As a percentage of revenue |
(0.5% |
) |
4.9% |
|
4.2% |
|
|
Fourth Quarter 2019 Major Product Metrics |
|
|
|
|
|
|
|
|
|
|
|
|
|
|
|
|
Tons Shipped (thousands) |
|
|
Average Selling Prices |
|
|
|
Q4 2019 |
|
Q4 2018 |
|
Q3 2019 |
|
Year-over-year |
|
Quarter-over-quarter |
|
|
Year-over-year |
|
Quarter-over-quarter |
|
|
|
|
|
|
|
|
|
|
|
|
|
|
|
|
|
|
|
|
|
|
|
|
|
|
Carbon Steel |
|
421 |
|
|
446 |
|
|
461 |
|
|
(5.6 |
%) |
|
(8.7 |
%) |
|
|
(16.7 |
%) |
|
(5.2 |
%) |
|
Aluminum |
|
50 |
|
|
54 |
|
|
59 |
|
|
(7.4 |
%) |
|
(15.3 |
%) |
|
|
(8.0 |
%) |
|
(2.6 |
%) |
|
Stainless Steel |
|
67 |
|
|
73 |
|
|
76 |
|
|
(8.2 |
%) |
|
(11.8 |
%) |
|
|
(0.1 |
%) |
|
5.6 |
% |
|
|
|
|
|
|
|
|
|
|
|
|
|
|
|
|
|
|
|
|
|
|
|
|
|
|
|
|
|
|
|
|
|
|
|
|
|
|
|
|
|
|
|
|
|
|
|
|
|
|
Net Sales (millions) |
|
|
|
|
|
|
|
|
|
|
Q4 2019 |
|
Q4 2018 |
|
Q3 2019 |
|
Year-over-year |
|
Quarter-over-quarter |
|
|
|
|
|
|
|
|
|
|
|
|
|
|
|
|
|
|
|
|
|
|
|
|
|
|
|
|
|
|
|
|
|
Carbon Steel |
$ |
492 |
|
$ |
626 |
|
$ |
568 |
|
|
(21.4% |
) |
|
(13.4% |
) |
|
|
|
|
|
|
|
|
Aluminum |
$ |
213 |
|
$ |
250 |
|
$ |
258 |
|
|
(14.8% |
) |
|
(17.4% |
) |
|
|
|
|
|
|
|
|
Stainless Steel |
$ |
242 |
|
$ |
264 |
|
$ |
260 |
|
|
(8.3% |
) |
|
(6.9% |
) |
|
|
|
|
|
|
|
|
Full Year 2019 Major Product Metrics |
|
|
|
|
|
|
|
|
|
|
Tons Shipped (thousands) |
|
|
Average Selling Prices |
|
|
|
2019 |
|
2018 |
|
Year-over-year |
|
|
Year-over-year |
|
|
|
|
|
|
|
|
|
|
|
|
|
|
|
|
|
Carbon Steel |
|
1,840 |
|
|
1,729 |
|
6.4% |
|
|
|
(3.4 |
%) |
|
Aluminum |
|
228 |
|
|
222 |
|
2.7% |
|
|
|
1.1 |
% |
|
Stainless Steel |
|
303 |
|
|
302 |
|
0.3% |
|
|
|
(1.4 |
%) |
|
|
|
|
|
|
|
|
|
|
|
|
|
|
|
|
|
|
|
|
|
|
|
|
|
|
|
|
|
|
|
|
Net Sales (millions) |
|
|
|
|
|
|
|
2019 |
|
2018 |
|
Year-over-year |
|
|
|
|
|
|
|
|
|
|
|
|
|
|
|
|
|
|
|
|
|
Carbon Steel |
$ |
2,351 |
|
$ |
2,287 |
|
2.8% |
|
|
|
|
|
|
Aluminum |
$ |
1,018 |
|
$ |
980 |
|
3.9% |
|
|
|
|
|
|
Stainless Steel |
$ |
1,059 |
|
$ |
1,070 |
|
(1.0% |
) |
|
|
|
|
|
|
|
|
|
|
|
|
|
|
|
|
|
|
|
Earnings Call Information
Ryerson will host a conference call to discuss its fourth quarter and full-year 2019 results Thursday, March 5, 2020 at 10 a.m. Eastern Time. Participants may access the conference call by dialing 833-241-7253 (Domestic) or 647-689-4217 (International) and using conference ID 8678507. The live online broadcast will be available on the Company’s investor relations website, ir.ryerson.com. A replay will be available at the same website for 90 days.
About Ryerson
Ryerson is a leading value-added processor and distributor of industrial metals, with operations in the United States, Canada, Mexico, and China. Founded in 1842, Ryerson has around 4,500 employees in approximately 100 locations. Visit Ryerson at www.ryerson.com.
Safe Harbor Provision
Certain statements made in this press release and other written or oral statements made by or on behalf of the Company constitute “forward-looking statements” within the meaning of the federal securities laws, including statements regarding our future performance, as well as management’s expectations, beliefs, intentions, plans, estimates, or projections relating to the future. Such statements can be identified by the use of forward-looking terminology such as “objectives,” “goals,” “preliminary,” “range,” “believes,” “expects,” “may,” “estimates,” “will,” “should,” “plans,” or “anticipates,” or the negative thereof or other variations thereon or comparable terminology, or by discussions of strategy. The Company cautions that any such forward-looking statements are not guarantees of future performance and may involve significant risks and uncertainties, and that actual results may vary materially from those in the forward-looking statements as a result of various factors. Among the factors that significantly impact the metals distribution industry and our business are: the cyclicality of our business; the highly competitive, volatile, and fragmented market in which we operate; fluctuating metal prices; our substantial indebtedness and the covenants in instruments governing such indebtedness; the integration of acquired operations; regulatory and other operational risks associated with our operations located inside and outside of the United States; work stoppages; obligations under certain employee retirement benefit plans; the ownership of a majority of our equity securities by a single investor group; currency fluctuations; and consolidation in the metals producer industry. Forward-looking statements should, therefore, be considered in light of various factors, including those set forth above and those set forth under “Risk Factors” in our annual report on Form 10-K for the year ended December 31, 2019, and in our other filings with the Securities and Exchange Commission. Moreover, we caution against placing undue reliance on these statements, which speak only as of the date they were made. The Company does not undertake any obligation to publicly update or revise any forward-looking statements to reflect future events or circumstances, new information or otherwise.
|
RYERSON HOLDING CORPORATION AND SUBSIDIARY COMPANIES |
|
|
Selected Income and Cash Flow Data - Unaudited |
|
|
(Dollars and Shares in Millions, except Per Share and Per Ton Data) |
|
|
|
|
|
|
|
|
|
|
|
|
|
|
|
|
|
|
|
|
|
|
|
|
|
|
Fourth Quarter |
|
|
Third Quarter |
|
|
Year Ended
December 31, |
|
|
|
|
2019 |
|
|
2018 |
|
|
2019 |
|
|
2019 |
|
|
2018 |
|
|
|
|
|
|
|
|
|
|
|
|
|
|
|
|
|
|
|
|
|
|
|
|
NET SALES |
|
$ |
961.5 |
|
|
$ |
1,160.0 |
|
|
$ |
1,104.4 |
|
|
$ |
4,501.6 |
|
|
$ |
4,408.4 |
|
|
Cost of materials sold |
|
|
781.1 |
|
|
|
960.3 |
|
|
|
900.0 |
|
|
|
3,673.7 |
|
|
|
3,650.3 |
|
|
Gross profit |
|
|
180.4 |
|
|
|
199.7 |
|
|
|
204.4 |
|
|
|
827.9 |
|
|
|
758.1 |
|
|
Warehousing, delivery, selling, general, and administrative |
|
|
142.9 |
|
|
|
171.3 |
|
|
|
165.6 |
|
|
|
636.8 |
|
|
|
614.7 |
|
|
Gain on sale of assets (1) |
|
|
(20.6 |
) |
|
|
— |
|
|
|
— |
|
|
|
(20.6 |
) |
|
|
— |
|
|
Gain on insurance settlement |
|
|
— |
|
|
|
— |
|
|
|
(1.5 |
) |
|
|
(1.5 |
) |
|
|
— |
|
|
Restructuring and other charges |
|
|
0.7 |
|
|
|
1.5 |
|
|
|
0.3 |
|
|
|
2.4 |
|
|
|
4.2 |
|
|
OPERATING PROFIT |
|
|
57.4 |
|
|
|
26.9 |
|
|
|
40.0 |
|
|
|
210.8 |
|
|
|
139.2 |
|
|
Other income and (expense), net (2) |
|
|
(1.1 |
) |
|
|
(2.2 |
) |
|
|
(0.3 |
) |
|
|
(2.4 |
) |
|
|
76.7 |
|
|
Interest and other expense on debt |
|
|
(22.2 |
) |
|
|
(26.0 |
) |
|
|
(23.2 |
) |
|
|
(93.2 |
) |
|
|
(99.2 |
) |
|
INCOME (LOSS) BEFORE INCOME TAXES |
|
|
34.1 |
|
|
|
(1.3 |
) |
|
|
16.5 |
|
|
|
115.2 |
|
|
|
116.7 |
|
|
Provision (benefit) for income taxes |
|
|
7.7 |
|
|
|
(2.0 |
) |
|
|
6.3 |
|
|
|
32.5 |
|
|
|
10.3 |
|
|
NET INCOME |
|
|
26.4 |
|
|
|
0.7 |
|
|
|
10.2 |
|
|
|
82.7 |
|
|
|
106.4 |
|
|
Less: Net income attributable to noncontrolling interest |
|
|
— |
|
|
|
0.1 |
|
|
|
0.1 |
|
|
|
0.3 |
|
|
|
0.4 |
|
|
NET INCOME ATTRIBUTABLE TO RYERSON HOLDING CORPORATION |
|
$ |
26.4 |
|
|
$ |
0.6 |
|
|
$ |
10.1 |
|
|
$ |
82.4 |
|
|
$ |
106.0 |
|
|
EARNINGS PER SHARE |
|
|
|
|
|
|
|
|
|
|
|
|
|
|
|
|
|
|
|
|
|
Basic |
|
$ |
0.70 |
|
|
$ |
0.01 |
|
|
$ |
0.27 |
|
|
$ |
2.19 |
|
|
$ |
2.84 |
|
|
Diluted |
|
$ |
0.69 |
|
|
$ |
0.01 |
|
|
$ |
0.27 |
|
|
$ |
2.17 |
|
|
$ |
2.81 |
|
|
Shares outstanding - basic |
|
|
37.8 |
|
|
|
37.4 |
|
|
|
37.8 |
|
|
|
37.7 |
|
|
|
37.3 |
|
|
Shares outstanding - diluted |
|
|
38.1 |
|
|
|
37.7 |
|
|
|
38.0 |
|
|
|
38.0 |
|
|
|
37.7 |
|
|
|
|
|
|
|
|
|
|
|
|
|
|
|
|
|
|
|
|
|
|
|
|
Supplemental Data : |
|
|
|
|
|
|
|
|
|
|
|
|
|
|
|
|
|
|
|
|
|
Tons shipped (000) |
|
|
541 |
|
|
|
577 |
|
|
|
598 |
|
|
|
2,381 |
|
|
|
2,268 |
|
|
Shipping days |
|
|
61 |
|
|
|
61 |
|
|
|
64 |
|
|
|
252 |
|
|
|
252 |
|
|
Average selling price/ton |
|
$ |
1,777 |
|
|
$ |
2,010 |
|
|
$ |
1,847 |
|
|
$ |
1,891 |
|
|
$ |
1,944 |
|
|
Gross profit/ton |
|
|
333 |
|
|
|
346 |
|
|
|
342 |
|
|
|
348 |
|
|
|
334 |
|
|
Operating profit/ton |
|
|
106 |
|
|
|
47 |
|
|
|
67 |
|
|
|
89 |
|
|
|
61 |
|
|
LIFO expense (income) per ton |
|
|
(12 |
) |
|
|
2 |
|
|
|
(49 |
) |
|
|
(29 |
) |
|
|
40 |
|
|
LIFO expense (income) |
|
|
(6.5 |
) |
|
|
0.9 |
|
|
|
(29.6 |
) |
|
|
(69.1 |
) |
|
|
90.2 |
|
|
Depreciation and amortization expense |
|
|
14.1 |
|
|
|
15.7 |
|
|
|
15.6 |
|
|
|
58.4 |
|
|
|
52.9 |
|
|
Cash flow provided by operating activities |
|
|
62.6 |
|
|
|
119.8 |
|
|
|
82.5 |
|
|
|
193.1 |
|
|
|
57.4 |
|
|
Capital expenditures |
|
|
(13.3 |
) |
|
|
(8.7 |
) |
|
|
(9.1 |
) |
|
|
(45.8 |
) |
|
|
(38.4 |
) |
|
|
|
|
|
|
|
|
|
|
|
|
|
|
|
|
|
|
|
|
|
|
|
(1) In the fourth quarter of 2019, we recorded a $20.6 million gain on the sale and leaseback of a group of properties located in Arizona, Arkansas, Georgia, New York, Ohio, Texas, Virginia, and Washington with net proceeds of approximately $61.5 million.
(2) The fourth quarter of 2018 includes a $3.2 million reduction to the gain on bargain purchase, and the year 2018 includes a $70.0 million gain on bargain purchase related to our Central Steel & Wire acquisition. |
|
|
|
|
|
|
|
|
|
|
|
|
|
|
|
|
|
|
|
|
|
|
|
|
See Schedule 1 for Condensed Consolidated Balance Sheets |
|
|
See Schedule 2 for EBITDA and Adjusted EBITDA reconciliation |
|
|
See Schedule 3 for Adjusted EPS reconciliation |
|
|
See Schedule 4 for Free Cash Flow reconciliation |
|
|
See Schedule 5 for Fourth Quarter 2019 Guidance reconciliation |
|
|
See Schedule 6 for First Quarter 2020 Guidance reconciliation |
|
|
Schedule 1 |
|
|
RYERSON HOLDING CORPORATION AND SUBSIDIARY COMPANIES |
|
|
Condensed Consolidated Balance Sheets |
|
|
(In millions, except shares) |
|
|
|
|
|
|
|
|
|
|
|
|
|
|
December 31, |
|
|
December 31, |
|
|
|
|
2019 |
|
|
2018 |
|
|
Assets |
|
|
|
|
|
|
|
|
|
Current assets: |
|
|
|
|
|
|
|
|
|
Cash and cash equivalents |
|
$ |
11.0 |
|
|
$ |
23.2 |
|
|
Restricted cash |
|
|
48.8 |
|
|
|
1.1 |
|
|
Receivables, less provisions of $3.5 in 2019 and $2.5 in 2018 |
|
|
425.1 |
|
|
|
521.0 |
|
|
Inventories |
|
|
742.9 |
|
|
|
806.3 |
|
|
Prepaid expenses and other current assets |
|
|
52.2 |
|
|
|
61.5 |
|
|
Total current assets |
|
|
1,280.0 |
|
|
|
1,413.1 |
|
|
Property, plant, and equipment, at cost |
|
|
806.5 |
|
|
|
838.4 |
|
|
Less: accumulated depreciation |
|
|
366.8 |
|
|
|
349.4 |
|
|
Property, plant, and equipment, net |
|
|
439.7 |
|
|
|
489.0 |
|
|
Operating lease assets |
|
|
128.2 |
|
|
|
— |
|
|
Other intangible assets |
|
|
50.6 |
|
|
|
58.1 |
|
|
Goodwill |
|
|
120.3 |
|
|
|
120.3 |
|
|
Deferred charges and other assets |
|
|
2.7 |
|
|
|
5.8 |
|
|
Total assets |
|
$ |
2,021.5 |
|
|
$ |
2,086.3 |
|
|
Liabilities |
|
|
|
|
|
|
|
|
|
Current liabilities: |
|
|
|
|
|
|
|
|
|
Accounts payable |
|
$ |
311.5 |
|
|
$ |
390.2 |
|
|
Salaries, wages, and commissions |
|
|
35.3 |
|
|
|
66.6 |
|
|
Other accrued liabilities |
|
|
68.0 |
|
|
|
77.0 |
|
|
Short-term debt |
|
|
49.2 |
|
|
|
27.3 |
|
|
Current portion of operating lease liabilities |
|
|
20.9 |
|
|
|
— |
|
|
Current portion of deferred employee benefits |
|
|
7.0 |
|
|
|
7.9 |
|
|
Total current liabilities |
|
|
491.9 |
|
|
|
569.0 |
|
|
Long-term debt |
|
|
932.6 |
|
|
|
1,126.0 |
|
|
Deferred employee benefits |
|
|
217.5 |
|
|
|
258.4 |
|
|
Noncurrent operating lease liabilities |
|
|
112.8 |
|
|
|
— |
|
|
Deferred income taxes |
|
|
65.2 |
|
|
|
13.3 |
|
|
Other noncurrent liabilities |
|
|
22.9 |
|
|
|
43.7 |
|
|
Total liabilities |
|
|
1,842.9 |
|
|
|
2,010.4 |
|
|
Commitments and contingencies |
|
|
|
|
|
|
|
|
|
Equity |
|
|
|
|
|
|
|
|
|
Ryerson Holding Corporation stockholders' equity: |
|
|
|
|
|
|
|
|
|
Preferred stock, $0.01 par value; 7,000,000 shares authorized and no shares issued at 2019 and 2018 |
|
|
— |
|
|
|
— |
|
|
Common stock, $0.01 par value; 100,000,000 shares authorized; 37,996,261 and 37,656,505 shares issued at 2019 and 2018, respectively |
|
|
0.4 |
|
|
|
0.4 |
|
|
Capital in excess of par value |
|
|
381.2 |
|
|
|
381.0 |
|
|
Retained earnings |
|
|
99.6 |
|
|
|
14.2 |
|
|
Treasury stock, at cost - Common stock of 212,500 shares in 2019 and 2018 |
|
|
(6.6 |
) |
|
|
(6.6 |
) |
|
Accumulated other comprehensive loss |
|
|
(302.0 |
) |
|
|
(315.8 |
) |
|
Total Ryerson Holding Corporation Stockholders' Equity |
|
|
172.6 |
|
|
|
73.2 |
|
|
Noncontrolling interest |
|
|
6.0 |
|
|
|
2.7 |
|
|
Total Equity |
|
|
178.6 |
|
|
|
75.9 |
|
|
Total Liabilities and Stockholders' Equity |
|
$ |
2,021.5 |
|
|
$ |
2,086.3 |
|
|
Schedule 2 |
|
|
RYERSON HOLDING CORPORATION AND SUBSIDIARY COMPANIES |
|
|
Reconciliations of Net Income Attributable to Ryerson Holding Corporation to EBITDA and Gross profit to Gross profit excluding LIFO |
|
|
(Dollars in millions) |
|
|
|
|
|
|
|
|
|
|
|
|
|
|
|
|
|
|
|
|
|
|
|
|
|
|
Fourth Quarter |
|
|
Third Quarter |
|
|
Year Ended
December 31, |
|
|
|
|
2019 |
|
|
2018 |
|
|
2019 |
|
|
2019 |
|
|
2018 |
|
|
|
|
|
|
|
|
|
|
|
|
|
|
|
|
|
|
|
|
|
|
|
|
Net income attributable to Ryerson Holding Corporation |
|
$ |
26.4 |
|
|
$ |
0.6 |
|
|
$ |
10.1 |
|
|
$ |
82.4 |
|
|
$ |
106.0 |
|
|
Interest and other expense on debt |
|
|
22.2 |
|
|
|
26.0 |
|
|
|
23.2 |
|
|
|
93.2 |
|
|
|
99.2 |
|
|
Provision (benefit) for income taxes |
|
|
7.7 |
|
|
|
(2.0 |
) |
|
|
6.3 |
|
|
|
32.5 |
|
|
|
10.3 |
|
|
Depreciation and amortization expense |
|
|
14.1 |
|
|
|
15.7 |
|
|
|
15.6 |
|
|
|
58.4 |
|
|
|
52.9 |
|
|
EBITDA |
|
$ |
70.4 |
|
|
$ |
40.3 |
|
|
$ |
55.2 |
|
|
$ |
266.5 |
|
|
$ |
268.4 |
|
|
Gain on bargain purchase |
|
|
— |
|
|
|
3.2 |
|
|
|
— |
|
|
|
— |
|
|
|
(70.0 |
) |
|
Gain on sale of assets |
|
|
(20.6 |
) |
|
|
— |
|
|
|
— |
|
|
|
(20.6 |
) |
|
|
— |
|
|
Gain on insurance settlement |
|
|
— |
|
|
|
— |
|
|
|
(1.5 |
) |
|
|
(1.5 |
) |
|
|
— |
|
|
Reorganization |
|
|
2.4 |
|
|
|
1.8 |
|
|
|
4.0 |
|
|
|
9.3 |
|
|
|
6.1 |
|
|
Foreign currency transaction (gains) losses |
|
|
(0.1 |
) |
|
|
(1.6 |
) |
|
|
0.4 |
|
|
|
1.1 |
|
|
|
(2.5 |
) |
|
Loss on retirement of debt |
|
|
— |
|
|
|
1.7 |
|
|
|
— |
|
|
|
0.2 |
|
|
|
1.7 |
|
|
Purchase consideration and other transaction costs |
|
|
1.3 |
|
|
|
3.8 |
|
|
|
1.0 |
|
|
|
4.1 |
|
|
|
14.3 |
|
|
Other adjustments |
|
|
— |
|
|
|
0.4 |
|
|
|
— |
|
|
|
0.1 |
|
|
|
(0.2 |
) |
|
Adjusted EBITDA |
|
$ |
53.4 |
|
|
$ |
49.6 |
|
|
$ |
59.1 |
|
|
$ |
259.2 |
|
|
$ |
217.8 |
|
|
|
|
|
|
|
|
|
|
|
|
|
|
|
|
|
|
|
|
|
|
|
|
Adjusted EBITDA |
|
$ |
53.4 |
|
|
$ |
49.6 |
|
|
$ |
59.1 |
|
|
$ |
259.2 |
|
|
$ |
217.8 |
|
|
LIFO expense (income) |
|
|
(6.5 |
) |
|
|
0.9 |
|
|
|
(29.6 |
) |
|
|
(69.1 |
) |
|
|
90.2 |
|
|
Adjusted EBITDA, excluding LIFO expense (income) |
|
$ |
46.9 |
|
|
$ |
50.5 |
|
|
$ |
29.5 |
|
|
$ |
190.1 |
|
|
$ |
308.0 |
|
|
|
|
|
|
|
|
|
|
|
|
|
|
|
|
|
|
|
|
|
|
|
|
Net sales |
|
$ |
961.5 |
|
|
$ |
1,160.0 |
|
|
$ |
1,104.4 |
|
|
$ |
4,501.6 |
|
|
$ |
4,408.4 |
|
|
|
|
|
|
|
|
|
|
|
|
|
|
|
|
|
|
|
|
|
|
|
|
Adjusted EBITDA, excluding LIFO expense (income), as a percentage of net sales |
|
|
4.9 |
% |
|
|
4.4 |
% |
|
|
2.7 |
% |
|
|
4.2 |
% |
|
|
7.0 |
% |
|
|
|
|
|
|
|
|
|
|
|
|
|
|
|
|
|
|
|
|
|
|
|
Gross profit |
|
$ |
180.4 |
|
|
$ |
199.7 |
|
|
$ |
204.4 |
|
|
$ |
827.9 |
|
|
$ |
758.1 |
|
|
|
|
|
|
|
|
|
|
|
|
|
|
|
|
|
|
|
|
|
|
|
|
Gross margin |
|
|
18.8 |
% |
|
|
17.2 |
% |
|
|
18.5 |
% |
|
|
18.4 |
% |
|
|
17.2 |
% |
|
|
|
|
|
|
|
|
|
|
|
|
|
|
|
|
|
|
|
|
|
|
|
Gross profit |
|
$ |
180.4 |
|
|
$ |
199.7 |
|
|
$ |
204.4 |
|
|
$ |
827.9 |
|
|
$ |
758.1 |
|
|
LIFO expense (income), net |
|
|
(6.5 |
) |
|
|
0.9 |
|
|
|
(29.6 |
) |
|
|
(69.1 |
) |
|
|
90.2 |
|
|
Gross profit, excluding LIFO expense (income) |
|
$ |
173.9 |
|
|
$ |
200.6 |
|
|
$ |
174.8 |
|
|
$ |
758.8 |
|
|
$ |
848.3 |
|
|
|
|
|
|
|
|
|
|
|
|
|
|
|
|
|
|
|
|
|
|
|
|
Gross margin, excluding LIFO expense (income) |
|
|
18.1 |
% |
|
|
17.3 |
% |
|
|
15.8 |
% |
|
|
16.9 |
% |
|
|
19.2 |
% |
|
|
|
|
|
|
|
|
|
|
|
|
|
|
|
|
|
|
|
|
|
|
|
Note: EBITDA represents net income before interest and other expense on debt, provision for income taxes, depreciation, and amortization. Adjusted EBITDA gives further effect to, among other things, gain on the sale of assets, impairment charges on assets, reorganization expenses, gain on bargain purchase, and foreign currency transaction gains and losses. We believe that the presentation of EBITDA, Adjusted EBITDA, and Adjusted EBITDA, excluding LIFO expense (income), provides useful information to investors regarding our operational performance because they enhance an investor’s overall understanding of our core financial performance and provide a basis of comparison of results between current, past, and future periods. We also disclose the metric Adjusted EBITDA, excluding LIFO expense (income), to provide a means of comparison amongst our competitors who may not use the same basis of accounting for inventories. EBITDA, Adjusted EBITDA, and Adjusted EBITDA, excluding LIFO expense (income), are three of the primary metrics management uses for planning and forecasting in future periods, including trending and analyzing the core operating performance of our business without the effect of U.S. generally accepted accounting principles, or GAAP, expenses, revenues, and gains (losses) that are unrelated to the day to day performance of our business. We also establish compensation programs for our executive management and regional employees that are based upon the achievement of pre-established EBITDA, Adjusted EBITDA, and Adjusted EBITDA, excluding LIFO expense (income), targets. We also use EBITDA, Adjusted EBITDA, and Adjusted EBITDA, excluding LIFO expense (income), to benchmark our operating performance to that of our competitors. EBITDA, Adjusted EBITDA, and Adjusted EBITDA, excluding LIFO expense (income), do not represent, and should not be used as a substitute for, net income or cash flows from operations as determined in accordance with generally accepted accounting principles, and neither EBITDA, Adjusted EBITDA, and Adjusted EBITDA, excluding LIFO expense (income), is necessarily an indication of whether cash flow will be sufficient to fund our cash requirements. This release also presents gross margin, excluding LIFO expense (income), which is calculated as gross profit plus LIFO expense (or minus LIFO income), divided by net sales. We have excluded LIFO expense (income) from gross margin and Adjusted EBITDA as a percentage of net sales metrics in order to provide a means of comparison amongst our competitors who may not use the same basis of accounting for inventories as we do. Our definitions of EBITDA, Adjusted EBITDA, Adjusted EBITDA, excluding LIFO expense (income), gross margin, excluding LIFO expense (income), and Adjusted EBITDA, excluding LIFO expense (income), as a percentage of sales may differ from that of other companies. |
|
|
Schedule 3 |
|
|
RYERSON HOLDING CORPORATION AND SUBSIDIARY COMPANIES |
|
|
Reconciliation of Net Income and Earnings per Share to Adjusted Net Income and Adjusted Earnings per Share |
|
|
(Dollars and Shares in Millions, Except Per Share Data) |
|
|
|
|
|
|
|
|
|
|
|
|
|
|
|
|
|
|
|
|
|
|
|
|
|
|
Fourth Quarter |
|
|
Third Quarter |
|
|
Year Ended
December 31, |
|
|
|
|
2019 |
|
|
2018 |
|
|
2019 |
|
|
2019 |
|
|
2018 |
|
|
|
|
|
|
|
|
|
|
|
|
|
|
|
|
|
|
|
|
|
|
|
|
Net income attributable to Ryerson Holding Corporation |
|
$ |
26.4 |
|
|
$ |
0.6 |
|
|
$ |
10.1 |
|
|
$ |
82.4 |
|
|
$ |
106.0 |
|
|
|
|
|
|
|
|
|
|
|
|
|
|
|
|
|
|
|
|
|
|
|
|
Gain on bargain purchase |
|
|
— |
|
|
|
3.2 |
|
|
|
— |
|
|
|
— |
|
|
|
(70.0 |
) |
|
Gain on sale of assets |
|
|
(20.6 |
) |
|
|
— |
|
|
|
— |
|
|
|
(20.6 |
) |
|
|
— |
|
|
Gain on insurance settlement |
|
|
— |
|
|
|
— |
|
|
|
(1.5 |
) |
|
|
(1.5 |
) |
|
|
— |
|
|
Restructuring and other charges |
|
|
0.7 |
|
|
|
1.5 |
|
|
|
0.3 |
|
|
|
2.4 |
|
|
|
4.2 |
|
|
Loss on retirement of debt |
|
|
— |
|
|
|
1.7 |
|
|
|
— |
|
|
|
0.2 |
|
|
|
1.7 |
|
|
Provision (benefit) for income taxes |
|
|
5.1 |
|
|
|
(0.8 |
) |
|
|
0.3 |
|
|
|
5.0 |
|
|
|
(1.5 |
) |
|
|
|
|
|
|
|
|
|
|
|
|
|
|
|
|
|
|
|
|
|
|
|
Adjusted net income attributable to Ryerson Holding Corporation |
|
$ |
11.6 |
|
|
$ |
6.2 |
|
|
$ |
9.2 |
|
|
$ |
67.9 |
|
|
$ |
40.4 |
|
|
|
|
|
|
|
|
|
|
|
|
|
|
|
|
|
|
|
|
|
|
|
|
Diluted adjusted earnings per share |
|
$ |
0.30 |
|
|
$ |
0.16 |
|
|
$ |
0.24 |
|
|
$ |
1.79 |
|
|
$ |
1.07 |
|
|
|
|
|
|
|
|
|
|
|
|
|
|
|
|
|
|
|
|
|
|
|
|
Shares outstanding - diluted |
|
|
38.1 |
|
|
|
37.7 |
|
|
|
38.0 |
|
|
|
38.0 |
|
|
|
37.7 |
|
|
|
|
|
|
|
|
|
|
|
|
|
|
|
|
|
|
|
|
|
|
|
|
Note: Adjusted net income and Adjusted earnings per share is presented to provide a means of comparison with periods that do not include similar adjustments. |
|
|
|
|
|
|
|
|
|
|
|
|
|
|
|
|
|
|
|
|
|
|
|
|
|
|
|
|
|
|
|
|
|
|
|
|
|
|
|
|
|
|
|
|
|
|
Schedule 4 |
|
|
RYERSON HOLDING CORPORATION AND SUBSIDIARY COMPANIES |
|
|
Cash Flow from Operations to Free Cash Flow Yield |
|
|
(Dollars in Millions) |
|
|
|
|
|
|
|
|
|
|
|
|
|
|
|
|
|
|
|
|
|
|
|
|
|
|
Fourth Quarter |
|
|
Third Quarter |
|
|
Year Ended
December 31, |
|
|
|
|
2019 |
|
|
2018 |
|
|
2019 |
|
|
2019 |
|
|
2018 |
|
|
|
|
|
|
|
|
|
|
|
|
|
|
|
|
|
|
|
|
|
|
|
|
Net cash provided by operating activities |
|
$ |
62.6 |
|
|
$ |
119.8 |
|
|
$ |
82.5 |
|
|
$ |
193.1 |
|
|
$ |
57.4 |
|
|
Capital expenditures |
|
|
(13.3 |
) |
|
|
(8.7 |
) |
|
|
(9.1 |
) |
|
|
(45.8 |
) |
|
|
(38.4 |
) |
|
Proceeds from sales of property, plant, and equipment |
|
|
61.6 |
|
|
|
5.2 |
|
|
|
0.2 |
|
|
|
70.4 |
|
|
|
5.9 |
|
|
Free cash flow |
|
$ |
110.9 |
|
|
$ |
116.3 |
|
|
$ |
73.6 |
|
|
$ |
217.7 |
|
|
$ |
24.9 |
|
|
|
|
|
|
|
|
|
|
|
|
|
|
|
|
|
|
|
|
|
|
|
|
Market capitalization |
|
$ |
447.0 |
|
|
$ |
237.4 |
|
|
$ |
322.3 |
|
|
$ |
447.0 |
|
|
$ |
237.4 |
|
|
|
|
|
|
|
|
|
|
|
|
|
|
|
|
|
|
|
|
|
|
|
|
Free cash flow yield |
|
|
24.8 |
% |
|
|
49.0 |
% |
|
|
22.8 |
% |
|
|
48.7 |
% |
|
|
10.5 |
% |
|
|
|
|
|
|
|
|
|
|
|
|
|
|
|
|
|
|
|
|
|
|
|
Note: Market capitalization is calculated using December 31, 2019, September 30, 2019 and December 31, 2018 stock prices and shares outstanding. |
|
|
Schedule 5 |
|
|
RYERSON HOLDING CORPORATION AND SUBSIDIARY COMPANIES |
|
|
Adjusted Guidance for Fourth Quarter 2019 Net Income, Diluted Earnings per Share and Adj. EBITDA, excl. LIFO |
|
|
(Dollars in Millions, except Per Share Data) |
|
|
|
|
|
|
|
|
|
|
|
|
|
|
Fourth Quarter 2019 Guidance |
|
|
|
|
Low |
|
|
High |
|
|
Net income attributable to Ryerson Holding Corporation fourth quarter 2019 guidance |
|
$ |
3 |
|
|
$ |
7 |
|
|
Gain on sale of assets not included in guidance |
|
|
21 |
|
|
|
21 |
|
|
Effect of change in vacation policy not included in guidance |
|
|
11 |
|
|
|
11 |
|
|
Provision for income taxes |
|
|
8 |
|
|
|
8 |
|
|
Adjusted net income attributable to Ryerson Holding Corporation fourth quarter 2019 guidance |
|
$ |
27 |
|
|
$ |
31 |
|
|
|
|
|
|
|
|
|
|
|
|
Diluted earnings per share fourth quarter 2019 guidance |
|
$ |
0.08 |
|
|
$ |
0.18 |
|
|
Earnings per share effect of adjustment items above not included in guidance |
|
|
0.62 |
|
|
|
0.62 |
|
|
Revised earnings per share fourth quarter 2019 guidance |
|
$ |
0.70 |
|
|
$ |
0.80 |
|
|
|
|
|
|
|
|
|
|
|
|
Adjusted EBITDA, excluding LIFO income fourth quarter 2019 guidance |
|
$ |
36 |
|
|
$ |
40 |
|
|
Effect of change in vacation policy not included in guidance |
|
|
11 |
|
|
|
11 |
|
|
Revised fourth quarter 2019 Adjusted EBITDA, excluding LIFO income guidance |
|
$ |
47 |
|
|
$ |
51 |
|
|
|
|
|
|
|
|
|
|
|
|
Note: See the note within Schedule 2 for a description of EBITDA and Adjusted EBITDA. |
|
|
Schedule 6 |
|
|
RYERSON HOLDING CORPORATION AND SUBSIDIARY COMPANIES |
|
|
Reconciliation of First Quarter 2020 Earnings per Share to Adj. EBITDA, excl. LIFO Guidance |
|
|
(Dollars in Millions, except Per Share Data) |
|
|
|
First Quarter 2020 |
|
|
|
Low |
|
|
High |
|
|
Net income attributable to Ryerson Holding Corporation |
$ |
12 |
|
|
$ |
16 |
|
|
|
|
|
|
|
|
|
|
|
Diluted earnings per share |
$ |
0.31 |
|
|
$ |
0.42 |
|
|
|
|
|
|
|
|
|
|
|
Interest and other expense on debt |
|
23 |
|
|
|
23 |
|
|
Provision for income taxes |
|
5 |
|
|
|
7 |
|
|
Depreciation and amortization expense |
|
14 |
|
|
|
14 |
|
|
EBITDA |
$ |
54 |
|
|
$ |
60 |
|
|
Adjustments |
|
1 |
|
|
|
3 |
|
|
Adjusted EBITDA |
$ |
55 |
|
|
$ |
63 |
|
|
LIFO income |
|
(21 |
) |
|
|
(25 |
) |
|
Adjusted EBITDA, excluding LIFO income |
$ |
34 |
|
|
$ |
38 |
|
|
|
|
|
|
|
|
|
|
|
Note: See the note within Schedule 2 for a description of EBITDA and Adjusted EBITDA. |
|
Q4 2019 Ryerson Quarterly Release Presentation Exhibit 99.2
31 Important Information About Ryerson Holding Corporation These materials do not constitute an offer or solicitation to purchase or sell securities of Ryerson Holding Corporation (“Ryerson” or “the Company”) and no investment decision should be made based upon the information provided herein. Ryerson strongly urges you to review its filings with the Securities and Exchange Commission, which can be found at https://ir.ryerson.com/financials/sec-filings/default.aspx. This site also provides additional information about Ryerson. Safe Harbor Provision Certain statements made in this presentation and other written or oral statements made by or on behalf of the Company constitute "forward-looking statements" within the meaning of the federal securities laws, including statements regarding our future performance, as well as management's expectations, beliefs, intentions, plans, estimates, objectives, or projections relating to the future. Such statements can be identified by the use of forward-looking terminology such as “objectives,” “goals,” “preliminary,” “range,” "believes," "expects," "may," "estimates," "will," "should," "plans," or "anticipates" or the negative thereof or other variations thereon or comparable terminology, or by discussions of strategy. The Company cautions that any such forward-looking statements are not guarantees of future performance and may involve significant risks and uncertainties, and that actual results may vary materially from those in the forward-looking statements as a result of various factors. Among the factors that significantly impact the metals distribution industry and our business are: the cyclicality of our business; the highly competitive, volatile, and fragmented market in which we operate; fluctuating metal prices; our substantial indebtedness and the covenants in instruments governing such indebtedness; the integration of acquired operations; regulatory and other operational risks associated with our operations located inside and outside of the United States; work stoppages; obligations under certain employee retirement benefit plans; the ownership of a majority of our equity securities by a single investor group; currency fluctuations; and consolidation in the metals producer industry. Forward-looking statements should, therefore, be considered in light of various factors, including those set forth above and those set forth under "Risk Factors" in our annual report on Form 10-K for the year ended December 31, 2019, and in our other filings with the Securities and Exchange Commission. Moreover, we caution against placing undue reliance on these statements, which speak only as of the date they were made. The Company does not undertake any obligation to publicly update or revise any forward-looking statements to reflect future events or circumstances, new information or otherwise. Non-GAAP Measures Certain measures contained in these slides or the related presentation are not measures calculated in accordance with generally accepted accounting principles (“GAAP”). They should not be considered a replacement for GAAP results. Non-GAAP financial measures appearing in these slides are identified in the footnotes. A reconciliation of these non-GAAP measures to the most directly comparable GAAP financial measures is included in the Appendix.
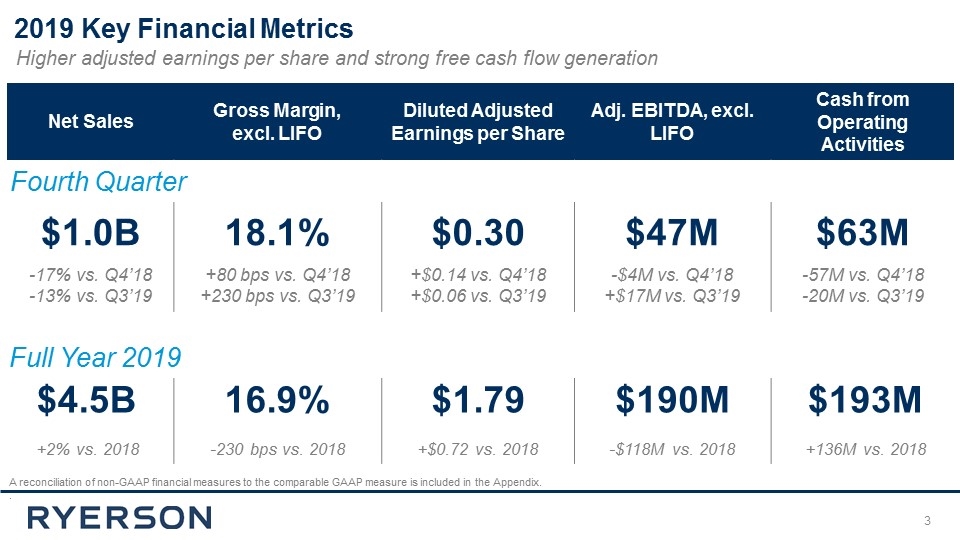
2019 Key Financial Metrics A reconciliation of non-GAAP financial measures to the comparable GAAP measure is included in the Appendix. . Higher adjusted earnings per share and strong free cash flow generation Net Sales Gross Margin, excl. LIFO Diluted Adjusted Earnings per Share Adj. EBITDA, excl. LIFO Cash from Operating Activities $1.0B 18.1% $0.30 $47M $63M -17% vs. Q4’18 -13% vs. Q3’19 +80 bps vs. Q4’18 +230 bps vs. Q3’19 +$0.14 vs. Q4’18 +$0.06 vs. Q3’19 -$4M vs. Q4’18 +$17M vs. Q3’19 -57M vs. Q4’18 -20M vs. Q3’19 $4.5B 16.9% $1.79 $190M $193M +2% vs. 2018 -230 bps vs. 2018 +$0.72 vs. 2018 -$118M vs. 2018 +136M vs. 2018 Fourth Quarter Full Year 2019
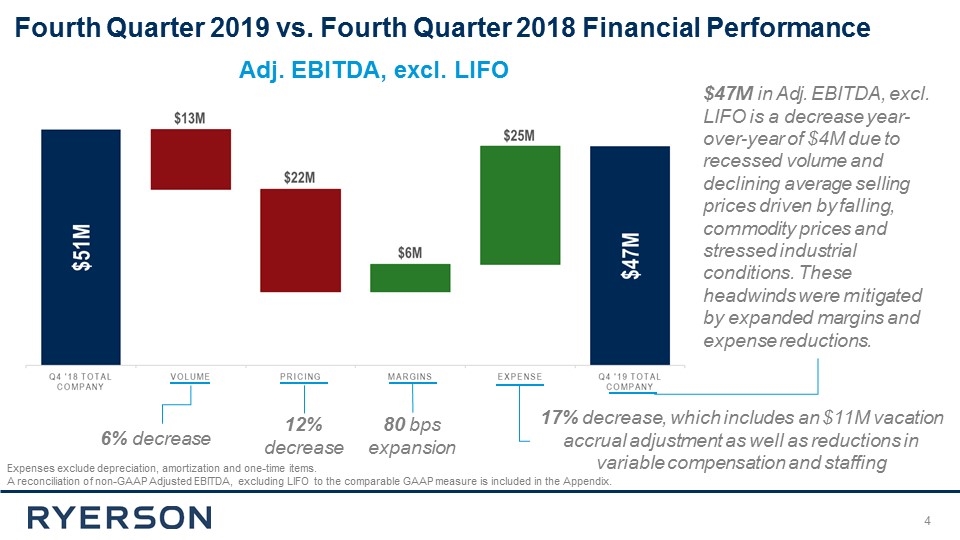
Fourth Quarter 2019 vs. Fourth Quarter 2018 Financial Performance 6% decrease 12% decrease 17% decrease, which includes an $11M vacation accrual adjustment as well as reductions in variable compensation and staffing Expenses exclude depreciation, amortization and one-time items. A reconciliation of non-GAAP Adjusted EBITDA, excluding LIFO to the comparable GAAP measure is included in the Appendix. $47M in Adj. EBITDA, excl. LIFO is a decrease year-over-year of $4M due to recessed volume and declining average selling prices driven by falling, commodity prices and stressed industrial conditions. These headwinds were mitigated by expanded margins and expense reductions. Adj. EBITDA, excl. LIFO 80 bps expansion
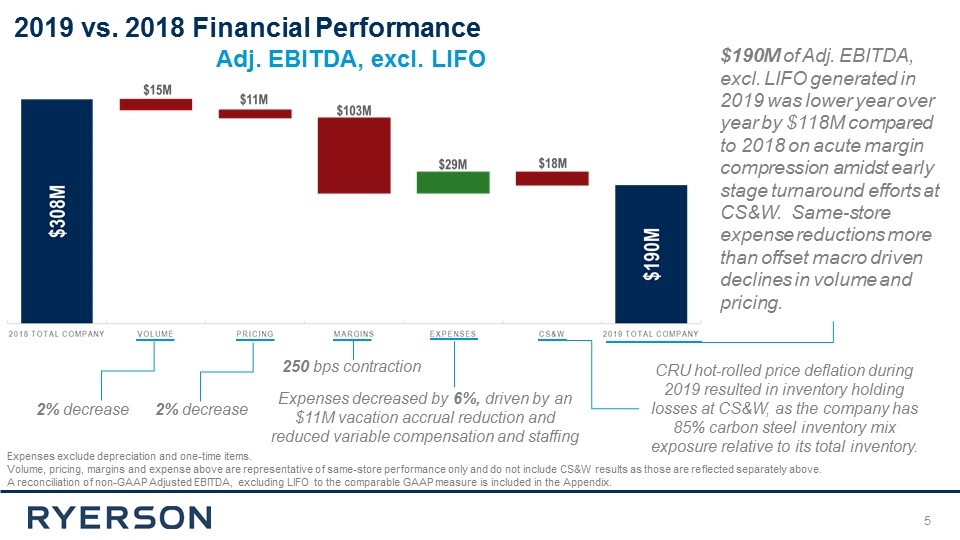
2019 vs. 2018 Financial Performance 2% decrease 2% decrease 250 bps contraction Expenses decreased by 6%, driven by an $11M vacation accrual reduction and reduced variable compensation and staffing Expenses exclude depreciation and one-time items. Volume, pricing, margins and expense above are representative of same-store performance only and do not include CS&W results as those are reflected separately above. A reconciliation of non-GAAP Adjusted EBITDA, excluding LIFO to the comparable GAAP measure is included in the Appendix. $190M of Adj. EBITDA, excl. LIFO generated in 2019 was lower year over year by $118M compared to 2018 on acute margin compression amidst early stage turnaround efforts at CS&W. Same-store expense reductions more than offset macro driven declines in volume and pricing. Adj. EBITDA, excl. LIFO CRU hot-rolled price deflation during 2019 resulted in inventory holding losses at CS&W, as the company has 85% carbon steel inventory mix exposure relative to its total inventory.
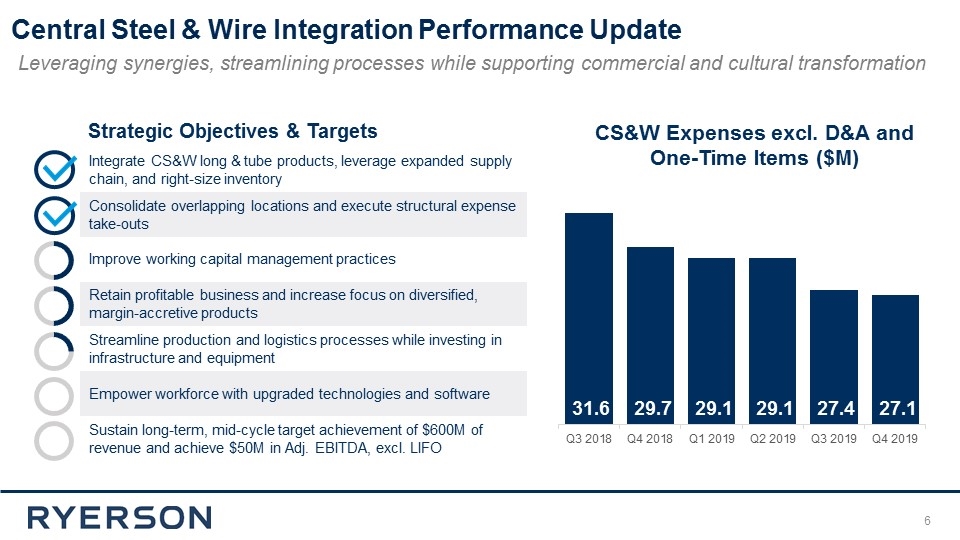
Central Steel & Wire Integration Performance Update Leveraging synergies, streamlining processes while supporting commercial and cultural transformation Integrate CS&W long & tube products, leverage expanded supply chain, and right-size inventory Consolidate overlapping locations and execute structural expense take-outs Improve working capital management practices Retain profitable business and increase focus on diversified, margin-accretive products Streamline production and logistics processes while investing in infrastructure and equipment Empower workforce with upgraded technologies and software Sustain long-term, mid-cycle target achievement of $600M of revenue and achieve $50M in Adj. EBITDA, excl. LIFO CS&W Expenses excl. D&A and One-Time Items ($M) Strategic Objectives & Targets
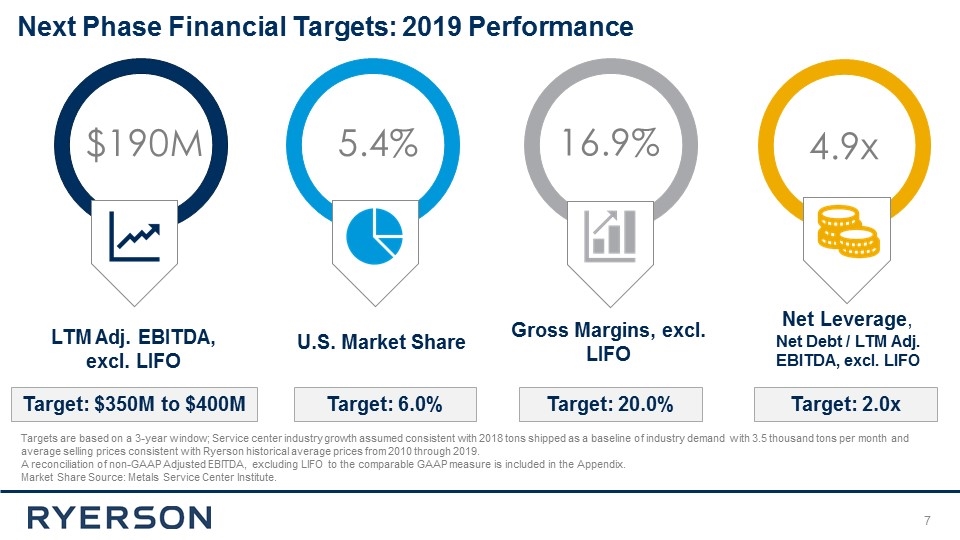
Next Phase Financial Targets: 2019 Performance 16.9% Gross Margins, excl. LIFO Target: 20.0% 5.4% U.S. Market Share Target: 6.0% Targets are based on a 3-year window; Service center industry growth assumed consistent with 2018 tons shipped as a baseline of industry demand with 3.5 thousand tons per month and average selling prices consistent with Ryerson historical average prices from 2010 through 2019. A reconciliation of non-GAAP Adjusted EBITDA, excluding LIFO to the comparable GAAP measure is included in the Appendix. Market Share Source: Metals Service Center Institute. $190M LTM Adj. EBITDA, excl. LIFO Target: $350M to $400M 4.9x Net Leverage, Net Debt / LTM Adj. EBITDA, excl. LIFO Target: 2.0x
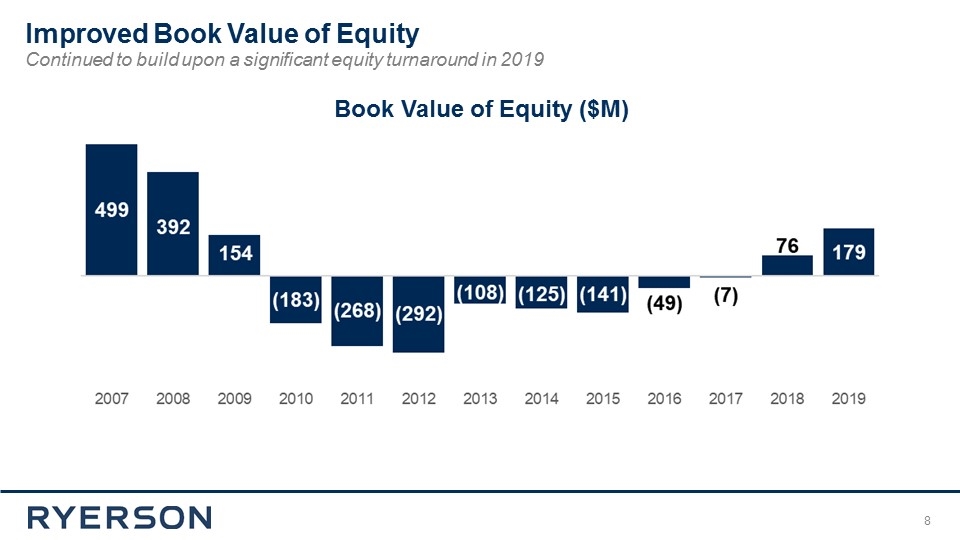
Improved Book Value of Equity Continued to build upon a significant equity turnaround in 2019 Book Value of Equity ($M)
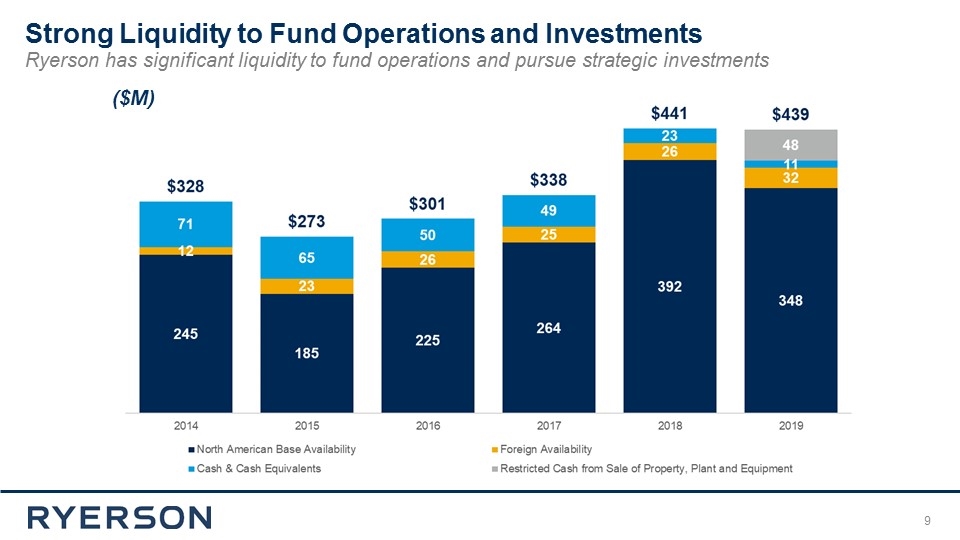
Strong Liquidity to Fund Operations and Investments Ryerson has significant liquidity to fund operations and pursue strategic investments ($M)
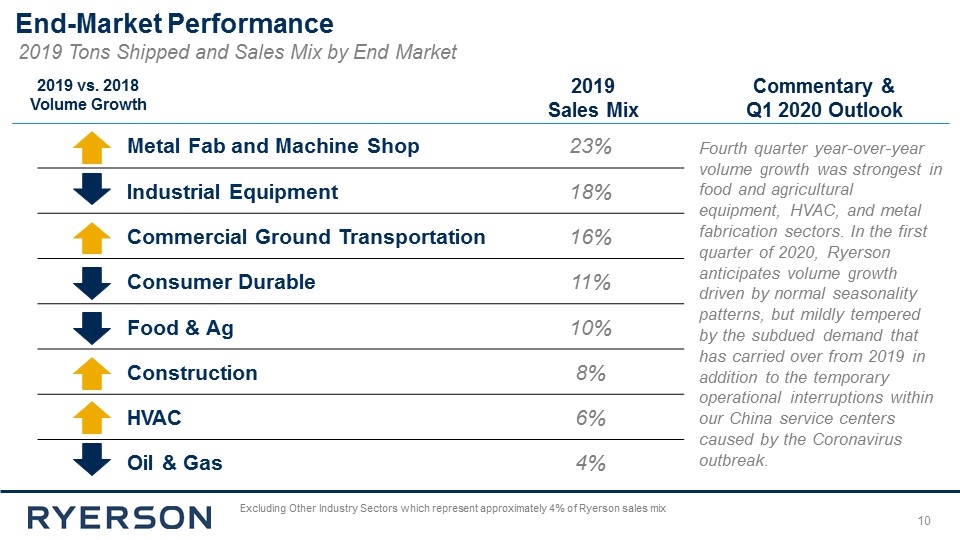
End-Market Performance 2019 Tons Shipped and Sales Mix by End Market Metal Fab and Machine Shop 23% Industrial Equipment 18% Commercial Ground Transportation 16% Consumer Durable 11% Food & Ag 10% Construction 8% HVAC 6% Oil & Gas 4% Excluding Other Industry Sectors which represent approximately 4% of Ryerson sales mix Fourth quarter year-over-year volume growth was strongest in food and agricultural equipment, HVAC, and metal fabrication sectors. In the first quarter of 2020, Ryerson anticipates volume growth driven by normal seasonality patterns, but mildly tempered by the subdued demand that has carried over from 2019 in addition to the temporary operational interruptions within our China service centers caused by the Coronavirus outbreak. 2019 Sales Mix Commentary & Q1 2020 Outlook 2019 vs. 2018 Volume Growth
Appendix
31 EBITDA represents net income before interest and other expense on debt, provision (benefit) for income taxes, depreciation, and amortization. Adjusted EBITDA gives further effect to, among other things, gain on the sale of assets, impairment charges on assets, reorganization expenses, gain on bargain purchase, and foreign currency transaction gains and losses. We believe that the presentation of EBITDA, Adjusted EBITDA, and Adjusted EBITDA, excluding LIFO expense (income), provides useful information to investors regarding our operational performance because they enhance an investor’s overall understanding of our core financial performance and provide a basis of comparison of results between current, past, and future periods. We also disclose the metric Adjusted EBITDA, excluding LIFO expense (income), to provide a means of comparison amongst our competitors who may not use the same basis of accounting for inventories. EBITDA, Adjusted EBITDA, and Adjusted EBITDA, excluding LIFO expense (income), are three of the primary metrics management uses for planning and forecasting in future periods, including trending and analyzing the core operating performance of our business without the effect of U.S. generally accepted accounting principles, or GAAP, expenses, revenues, and gains (losses) that are unrelated to the day to day performance of our business. We also establish compensation programs for our executive management and regional employees that are based upon the achievement of pre-established EBITDA, Adjusted EBITDA, and Adjusted EBITDA, excluding LIFO expense (income), targets. We also use EBITDA, Adjusted EBITDA, and Adjusted EBITDA, excluding LIFO expense (income), to benchmark our operating performance to that of our competitors. EBITDA, Adjusted EBITDA, and Adjusted EBITDA, excluding LIFO expense (income), do not represent, and should not be used as a substitute for, net income or cash flows from operations as determined in accordance with generally accepted accounting principles, and neither EBITDA, Adjusted EBITDA, and Adjusted EBITDA, excluding LIFO expense (income), is necessarily an indication of whether cash flow will be sufficient to fund our cash requirements. This release also presents gross margin, excluding LIFO expense (income), which is calculated as gross profit plus LIFO expense (or minus LIFO income), divided by net sales, and gross margin, excluding LIFO expense (income), which is calculated as gross profit plus LIFO expense (or minus LIFO income) divided by net sales. We have excluded LIFO expense (income) from gross margin and Adjusted EBITDA as a percentage of net sales metrics in order to provide a means of comparison amongst our competitors who may not use the same basis of accounting for inventories as we do. Our definitions of EBITDA, Adjusted EBITDA, Adjusted EBITDA, excluding LIFO expense (income), as a percentage of sales, and Adjusted EBITDA, excluding LIFO expense (income), as a percentage of sales may differ from that of other companies. Non-GAAP Reconciliation
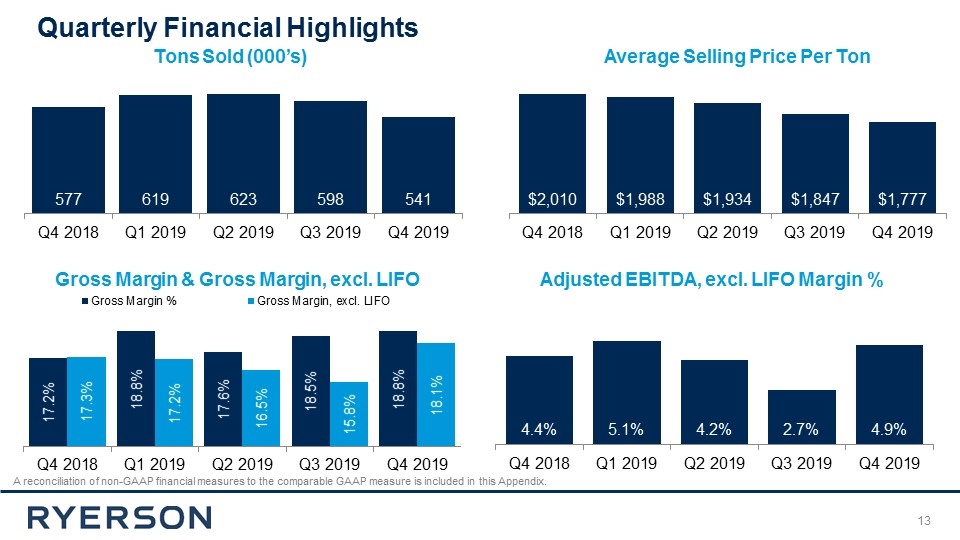
Quarterly Financial Highlights A reconciliation of non-GAAP financial measures to the comparable GAAP measure is included in this Appendix. Tons Sold (000’s) Average Selling Price Per Ton Adjusted EBITDA, excl. LIFO Margin % Gross Margin & Gross Margin, excl. LIFO
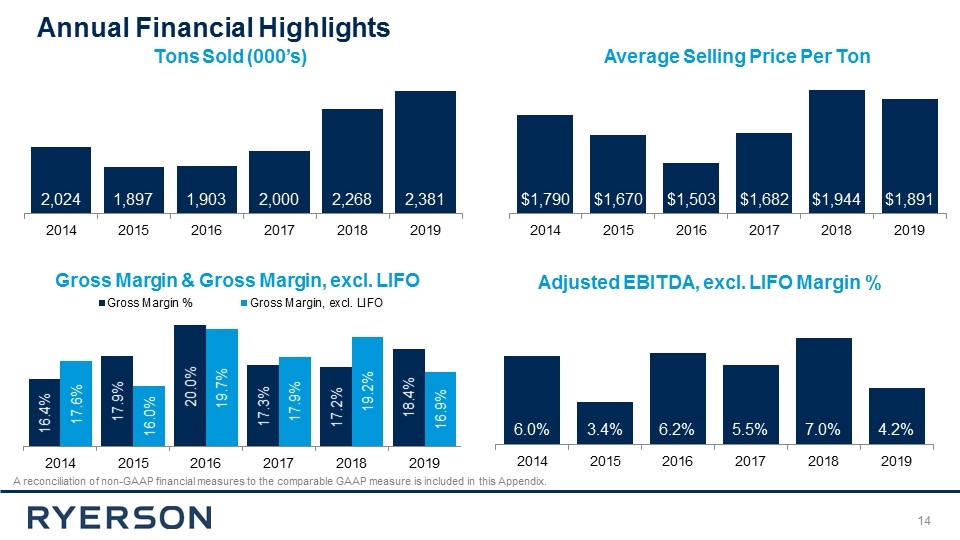
Annual Financial Highlights A reconciliation of non-GAAP financial measures to the comparable GAAP measure is included in this Appendix. Tons Sold (000’s) Average Selling Price Per Ton Gross Margin & Gross Margin, excl. LIFO Adjusted EBITDA, excl. LIFO Margin %
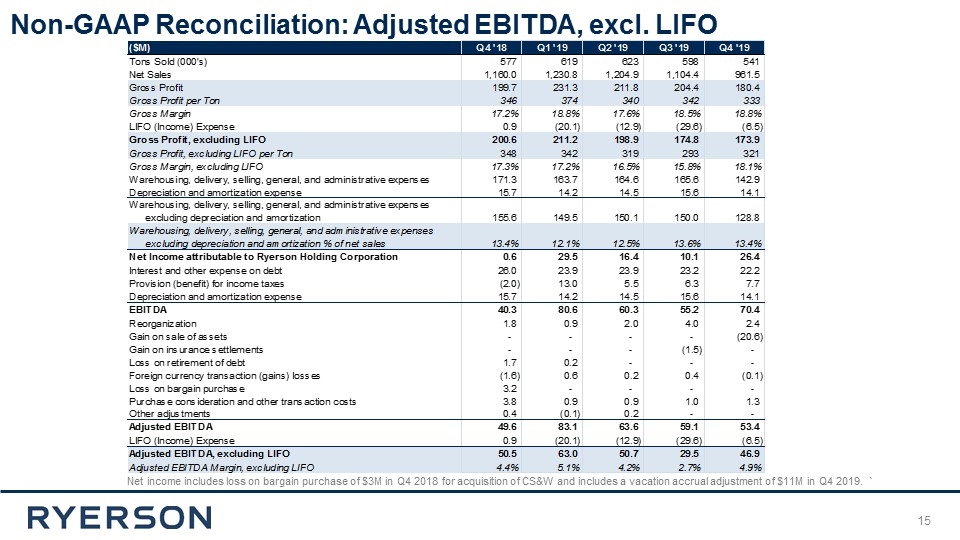
Non-GAAP Reconciliation: Adjusted EBITDA, excl. LIFO Net income includes loss on bargain purchase of $3M in Q4 2018 for acquisition of CS&W and includes a vacation accrual adjustment of $11M in Q4 2019. `
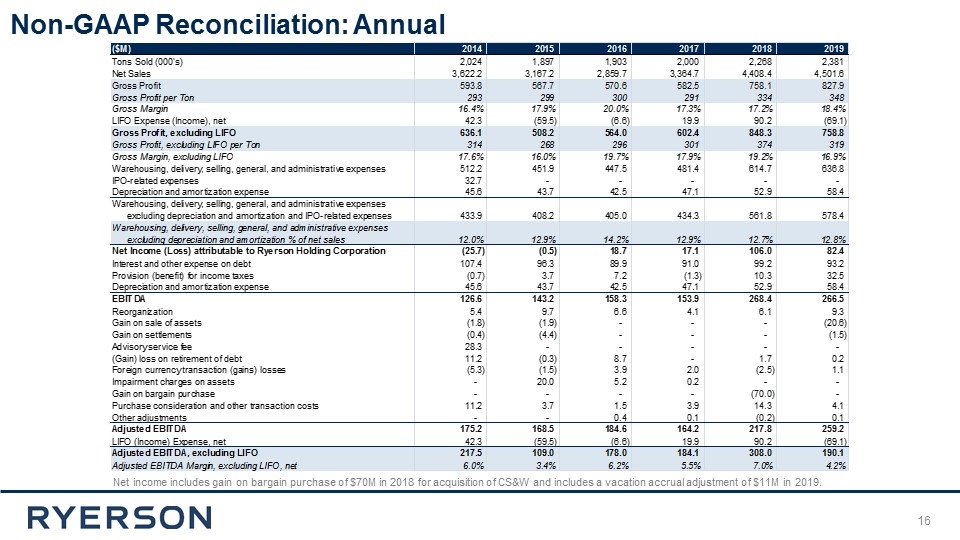
Non-GAAP Reconciliation: Annual Net income includes gain on bargain purchase of $70M in 2018 for acquisition of CS&W and includes a vacation accrual adjustment of $11M in 2019.
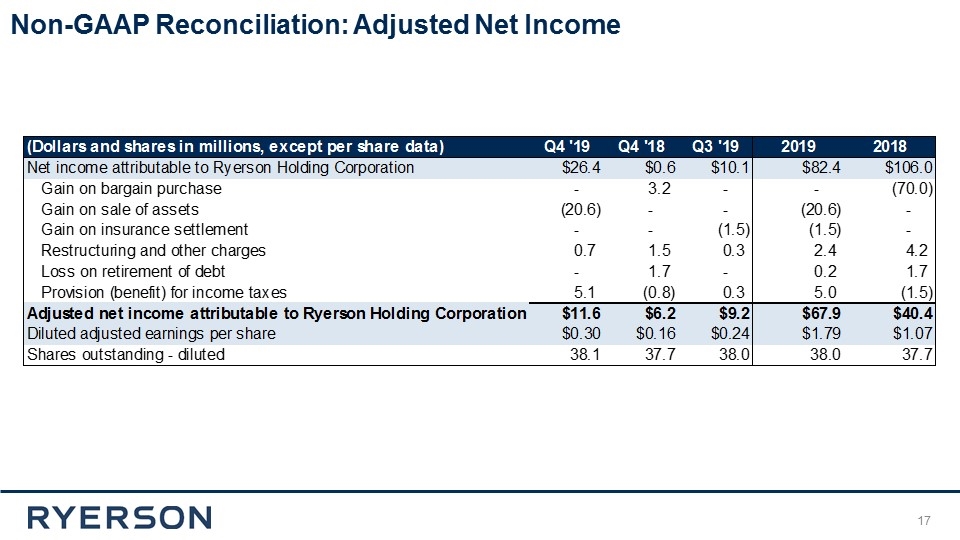
Non-GAAP Reconciliation: Adjusted Net Income