Exhibit 99.1
Ryerson Reports Second Quarter 2025 Results
Operationalization of significant capex projects continued to progress as we gained market share, continued to grow our transactional business, and achieved Adjusted EBITDA, excl. LIFO at the top of our guidance range.
CHICAGO – July 29, 2025 – Ryerson Holding Corporation (NYSE: RYI), a leading value-added processor and distributor of industrial metals, today reported results for the second quarter ended June 30, 2025.
Highlights:
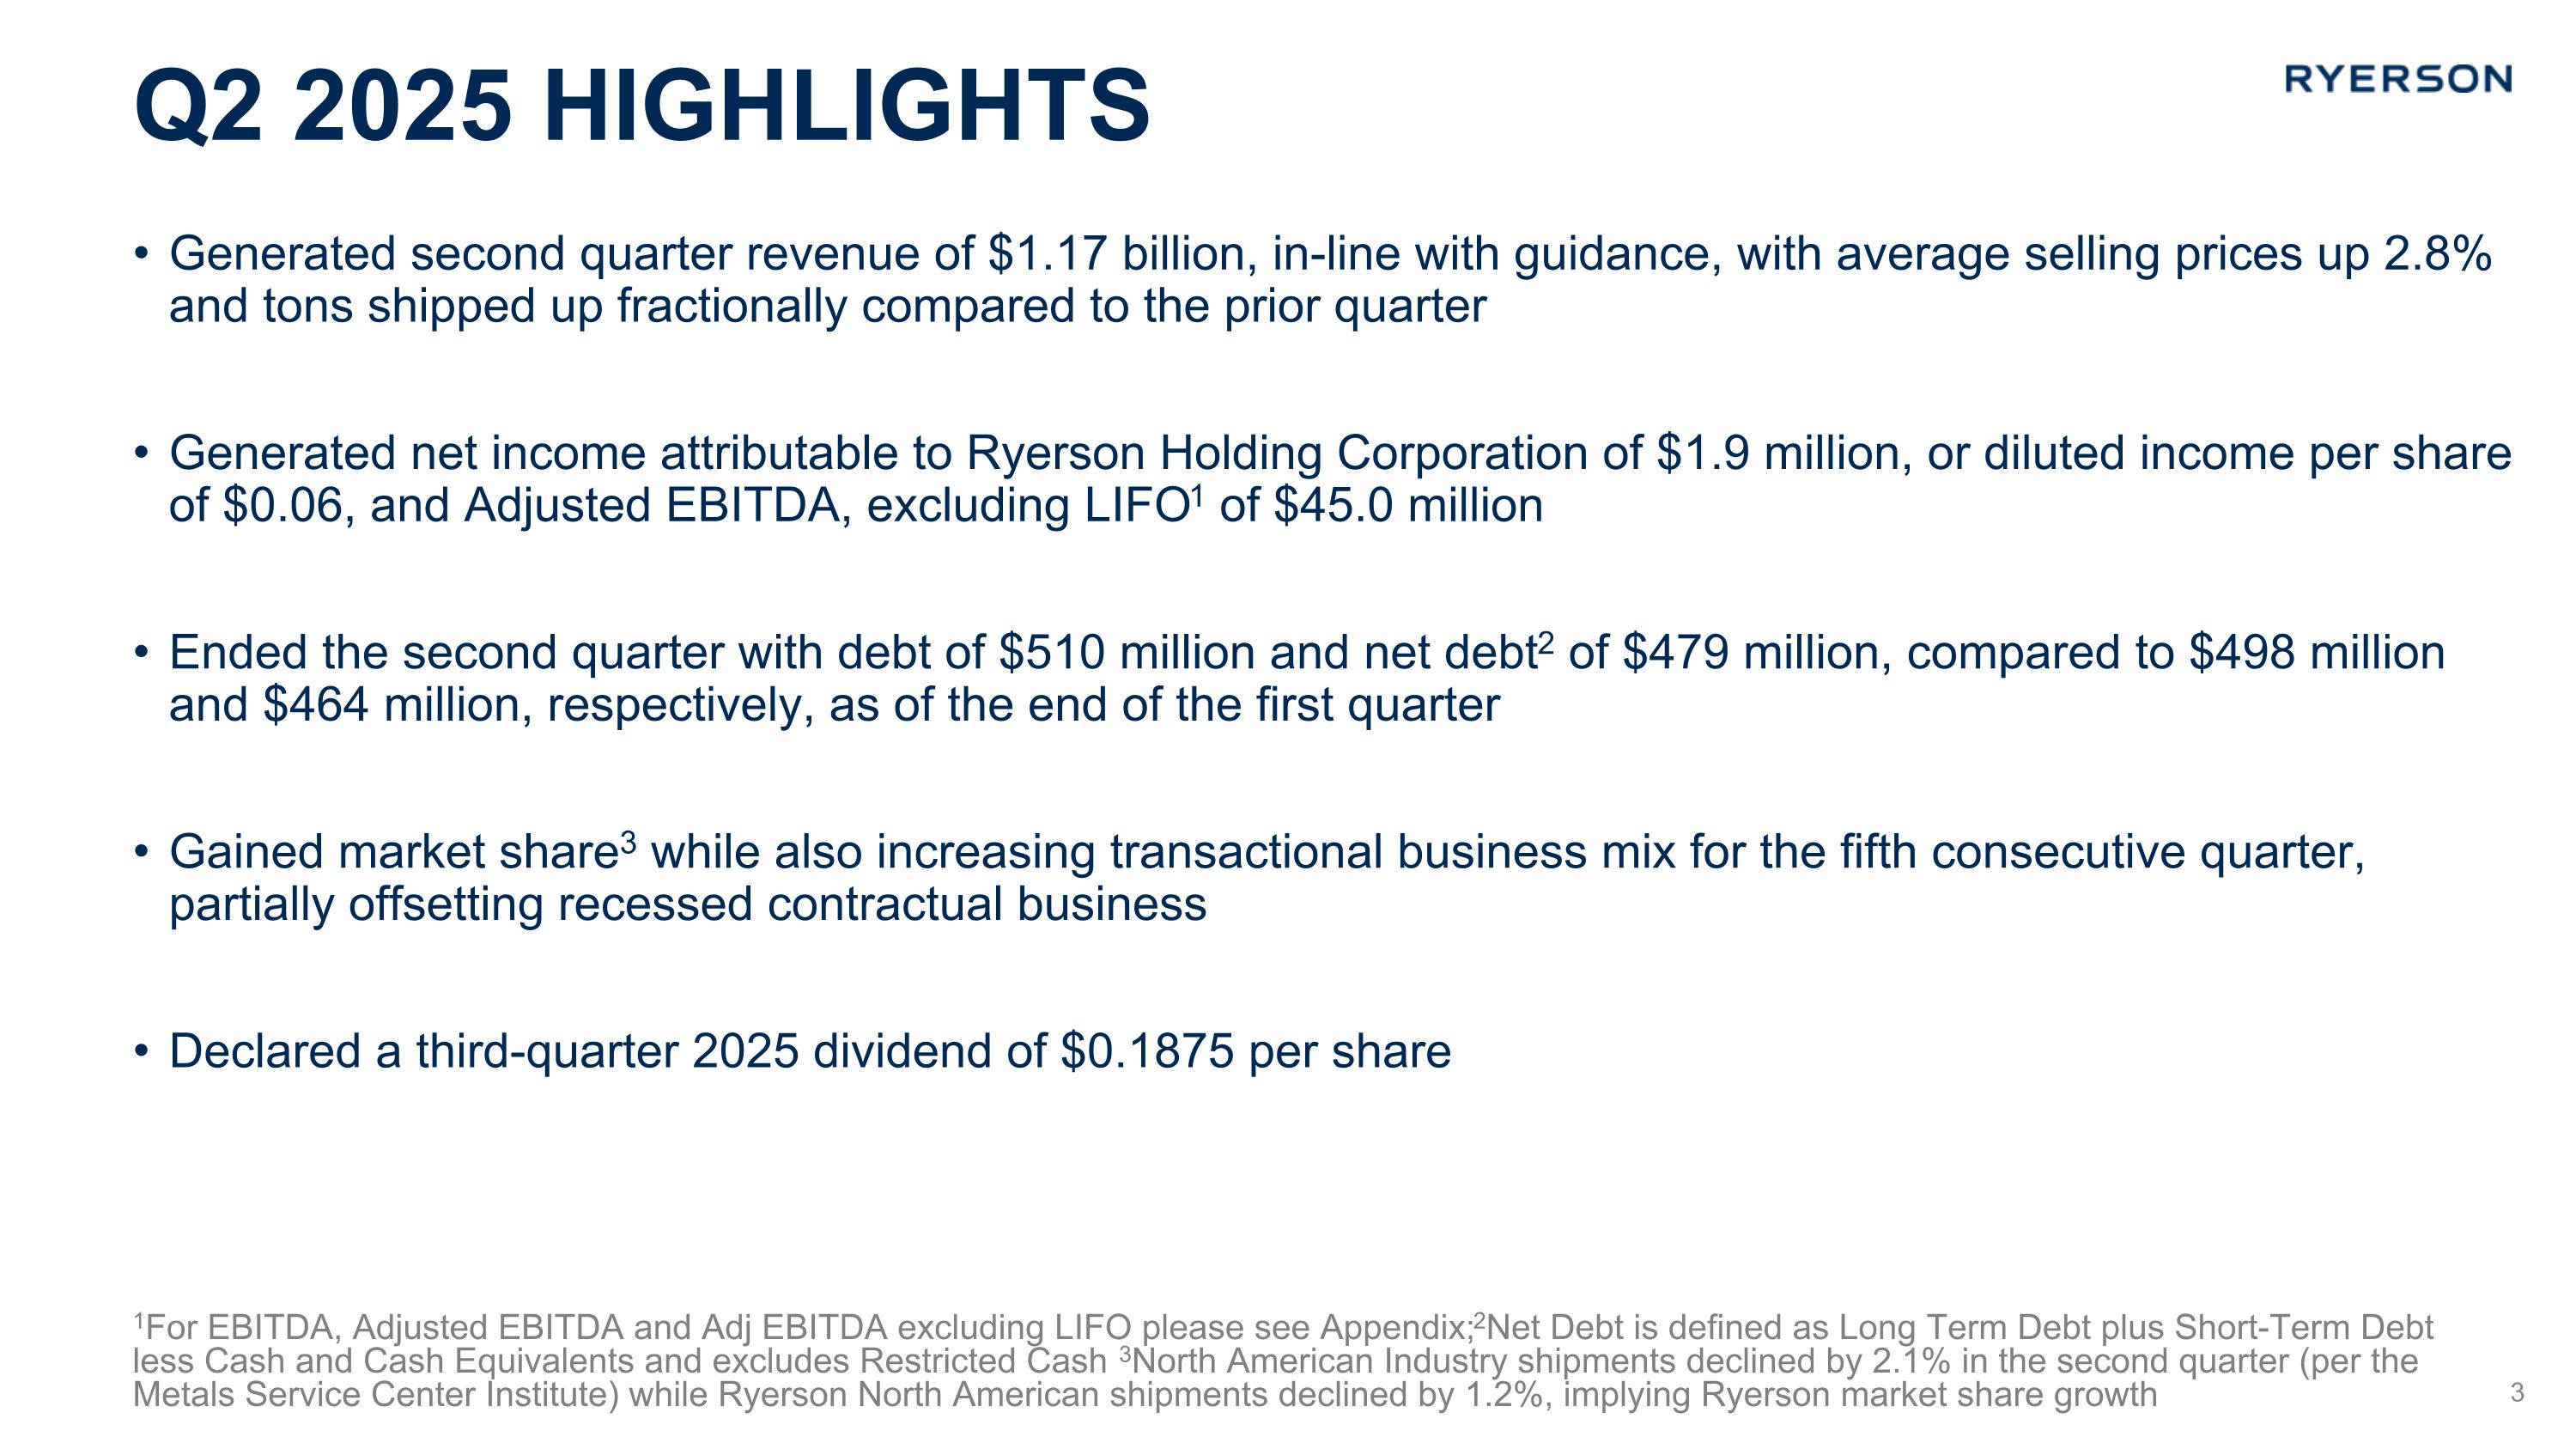
•Generated second quarter revenue of $1.17 billion, in-line with guidance, with average selling prices up 2.8% and tons shipped up fractionally compared to the prior quarter
•Generated net income attributable to Ryerson Holding Corporation of $1.9 million, or diluted income per share of $0.06, and Adjusted EBITDA, excluding LIFO1 of $45.0 million
•Ended the second quarter with debt of $510 million and net debt2 of $479 million, compared to $498 million and $464 million, respectively, as of the end of the first quarter
•Gained market share3 while also increasing transactional business mix for the fifth consecutive quarter, partially offsetting recessed contractual business
•Declared a third-quarter 2025 dividend of $0.1875 per share
A reconciliation of non-GAAP financial measures to the comparable GAAP measure is included below in this news release.
|
|
|
|
|
|
|
|
|
|
|
|
|
|
|
|
|
$ in millions, except tons (in thousands), average selling prices, and earnings per share |
|
|
|
|
|
|
|
|
|
|
|
|
|
|
|
|
|
|
|
Financial Highlights: |
|
Q2 2025 |
|
Q1 2025 |
|
Q2 2024 |
|
QoQ |
|
YoY |
|
1H 2025 |
|
1H 2024 |
|
YoY |
|
|
|
|
|
|
|
|
|
|
|
|
|
|
|
|
|
Revenue |
|
$1,169.3 |
|
$1,135.7 |
|
$1,225.5 |
|
3.0% |
|
(4.6)% |
|
$2,305.0 |
|
$2,464.7 |
|
(6.5)% |
Tons shipped |
|
501 |
|
500 |
|
508 |
|
0.2% |
|
(1.4)% |
|
1,001 |
|
1,005 |
|
(0.4)% |
Average selling price/ton |
|
$2,334 |
|
$2,271 |
|
$2,412 |
|
2.8% |
|
(3.2)% |
|
$2,303 |
|
$2,452 |
|
(6.1)% |
Gross margin |
|
17.9% |
|
18.0% |
|
18.2% |
|
-10 bps |
|
-30 bps |
|
18.0% |
|
17.9% |
|
10 bps |
Gross margin, excl. LIFO |
|
19.0% |
|
18.6% |
|
17.4% |
|
40 bps |
|
160 bps |
|
18.8% |
|
17.5% |
|
130 bps |
Warehousing, delivery, selling, general, and administrative expenses |
|
$203.6 |
|
$202.1 |
|
$199.0 |
|
0.7% |
|
2.3% |
|
$405.7 |
|
$415.8 |
|
(2.4)% |
As a percentage of revenue |
|
17.4% |
|
17.8% |
|
16.2% |
|
-40 bps |
|
120 bps |
|
17.6% |
|
16.9% |
|
70 bps |
Net income (loss) attributable to Ryerson Holding Corporation |
|
$1.9 |
|
$(5.6) |
|
$9.9 |
|
133.9% |
|
(80.8)% |
|
$(3.7) |
|
$2.3 |
|
(260.9)% |
Diluted earnings (loss) per share |
|
$0.06 |
|
$(0.18) |
|
$0.29 |
|
$0.24 |
|
$(0.23) |
|
$(0.12) |
|
$0.07 |
|
$(0.19) |
Adjusted diluted earnings (loss) per share |
|
$0.08 |
|
$(0.18) |
|
$0.33 |
|
$0.26 |
|
$(0.25) |
|
$(0.10) |
|
$0.14 |
|
$(0.24) |
Adj. EBITDA, excl. LIFO |
|
$45.0 |
|
$32.8 |
|
$42.6 |
|
37.2% |
|
5.6% |
|
$77.8 |
|
$82.8 |
|
(6.0)% |
Adj. EBITDA, excl. LIFO margin |
|
3.8% |
|
2.9% |
|
3.5% |
|
90 bps |
|
30 bps |
|
3.4% |
|
3.4% |
|
0 bps |
|
|
|
|
|
|
|
|
|
|
|
|
|
|
|
|
|
Balance Sheet and Cash Flow Highlights: |
|
|
|
|
|
|
|
|
|
|
|
|
|
|
|
|
Total debt |
|
$510.2 |
|
$497.3 |
|
$525.4 |
|
2.6% |
|
(2.9)% |
|
$510.2 |
|
$525.4 |
|
(2.9)% |
Cash and cash equivalents |
|
$30.8 |
|
$33.6 |
|
$28.0 |
|
(8.3)% |
|
10.0% |
|
$30.8 |
|
$28.0 |
|
10.0% |
Net debt |
|
$479.4 |
|
$463.7 |
|
$497.4 |
|
3.4% |
|
(3.6)% |
|
$479.4 |
|
$497.4 |
|
(3.6)% |
Net debt / LTM Adj. EBITDA, excl. LIFO |
|
4.4x |
|
4.3x |
|
3.2x |
|
0.1x |
|
1.2x |
|
4.4x |
|
3.2x |
|
1.2x |
Cash conversion cycle (days) |
|
66.3 |
|
66.5 |
|
77.6 |
|
(0.2) |
|
(11.3) |
|
66.7 |
|
76.5 |
|
(9.8) |
Net cash provided by (used in) operating activities |
|
$23.8 |
|
$(41.2) |
|
$25.9 |
|
$65.0 |
|
$(2.1) |
|
$(17.4) |
|
$(21.9) |
|
$4.5 |
Management Commentary
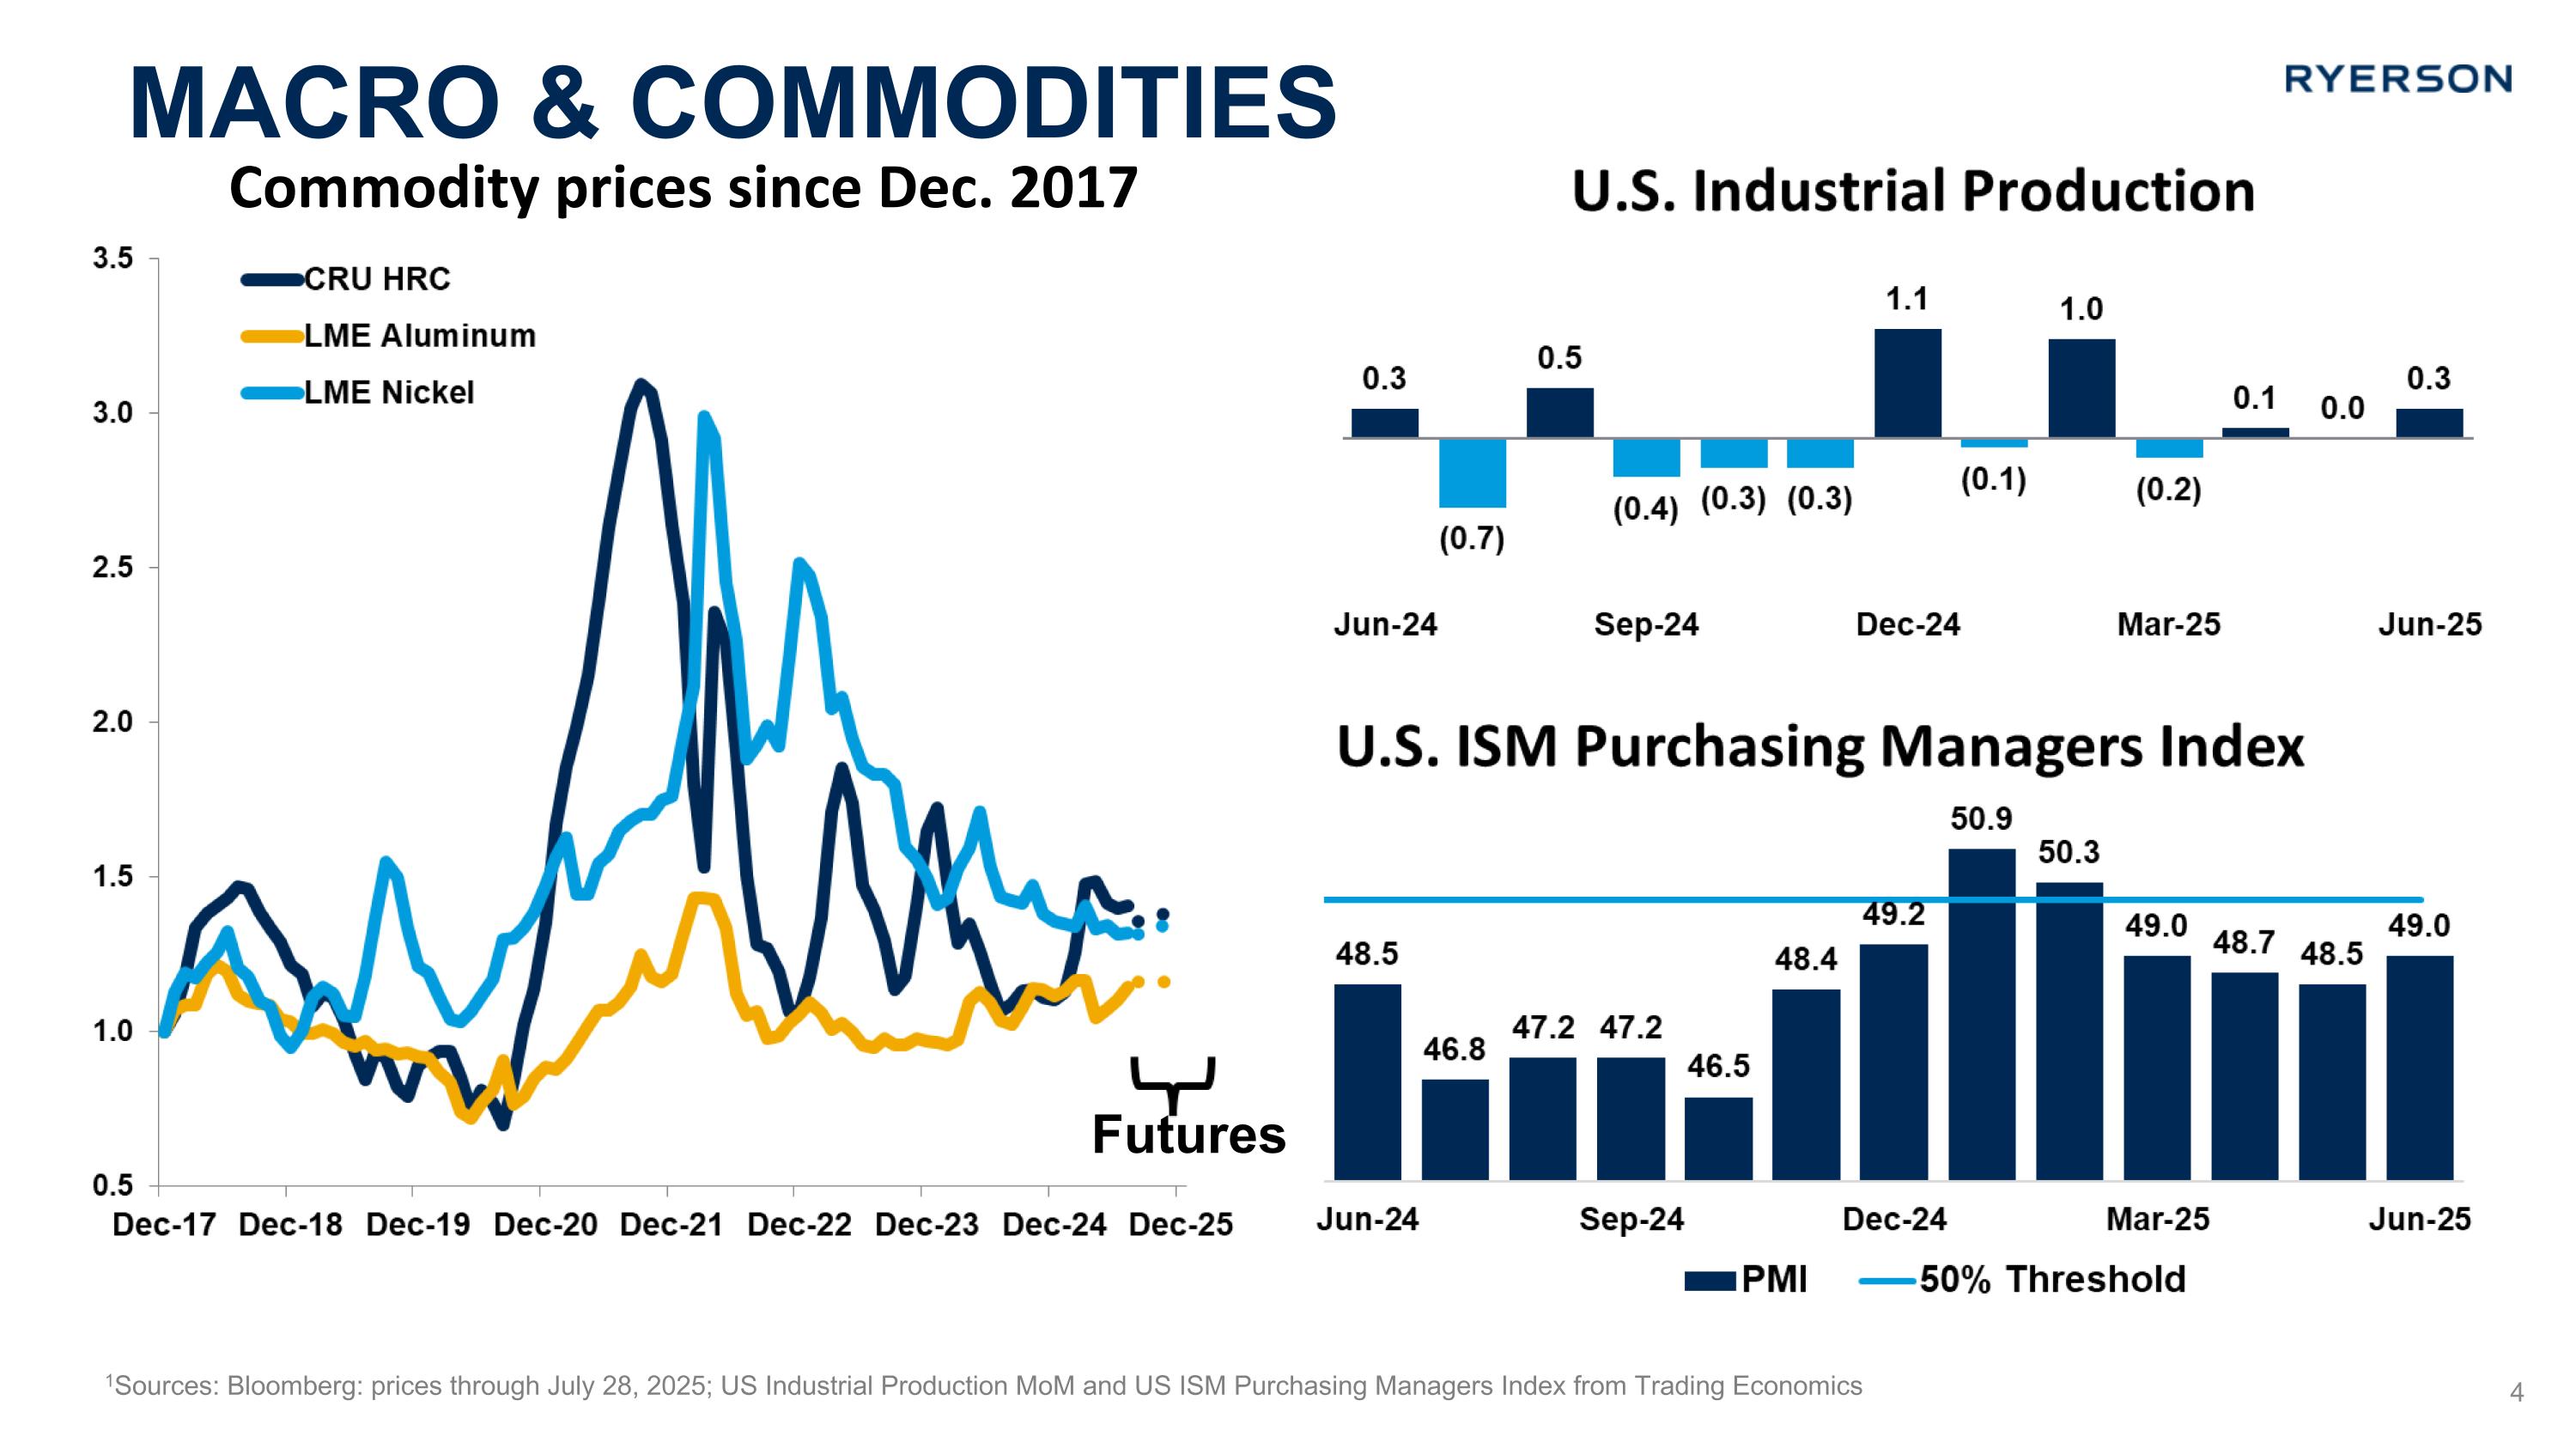
Eddie Lehner, Ryerson’s President, Chief Executive Officer & Director, said, “Self-help and execution are the name of the game amidst ongoing recessed demand conditions in the overall manufacturing and industrial metals sectors of the economy. Looking at macro-indicators such as PMI prints which continue to show contracting manufacturing conditions that square-up with our own internal demand indicators of quoting activity and order rates, we continue realizing the benefits of better execution around service center fundamentals of faster lead times, inventory placement, and on-time delivery. We grew market share and transactional business across the network as more capex and systems projects became fully operational and normalized despite ongoing sluggishness within OEM program accounts. On the pricing side of the house, we have seen falling stainless and carbon prices begin to stabilize while aluminum prices have trended higher, but the key is duration of this relative price stability as price discounting in the market is still prevalent. I want to thank all of my Ryerson colleagues for working safely and productively as we continue advancing our ability to create great customer experiences at speed, scale, value-add, and consistency across our network of intelligently connected service centers."
Second Quarter Results
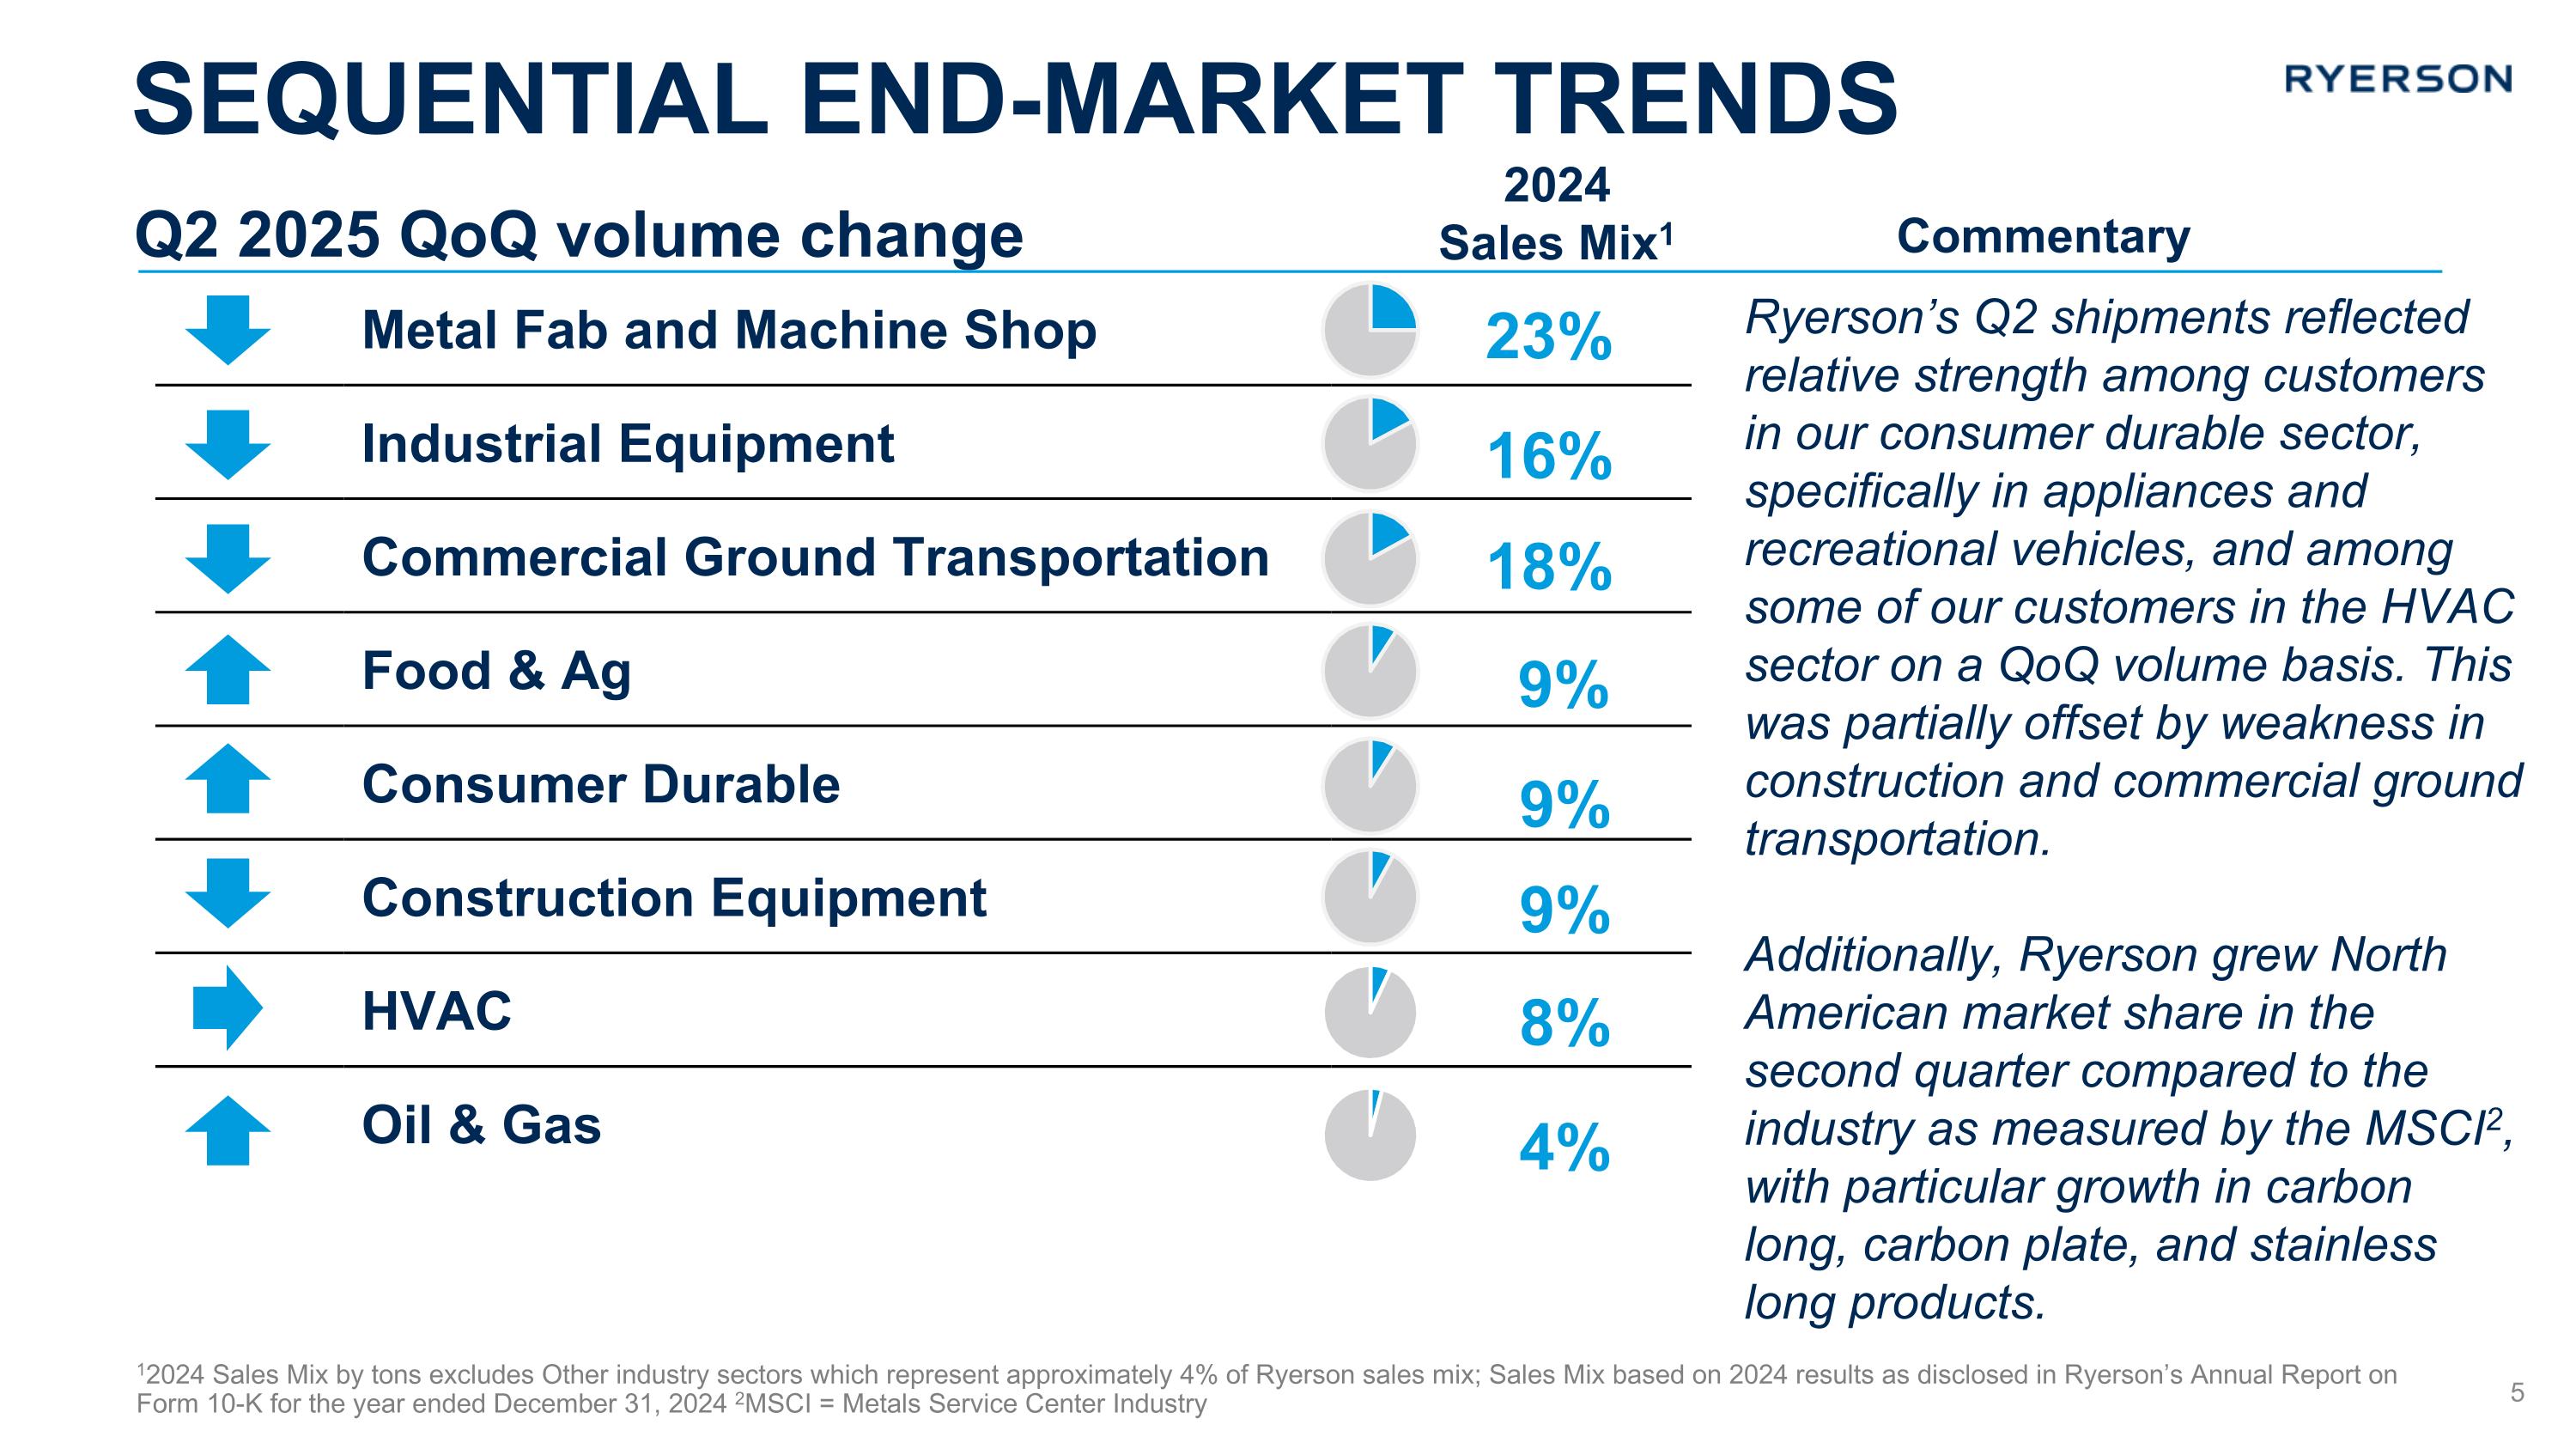
Ryerson generated net sales of $1.17 billion in the second quarter of 2025, an increase of 3.0% compared to the prior quarter and within our guidance range. Average selling prices increased by 2.8% and tons shipped increased by 0.2% quarter-over-quarter. Revenue performance during the quarter was influenced by a combination of tariff-supported higher average selling prices for our carbon and aluminum products partially offset by slowed customer activity following first quarter pre-buying and a continuation of trade policy uncertainty.
Gross margin contracted by 10 basis points to 17.9% in the second quarter of 2025 compared to 18.0% in the first quarter of 2025, driven by the increase in cost of goods sold outpacing the increase in average selling prices for our product mix. In addition, due to the rising commodity price environment, increasing inventory values resulted in a higher-than-expected LIFO expense of $13.2 million compared to the previous quarter's LIFO expense of $6.8 million. Excluding the impact of LIFO, gross margin expanded by 40 basis points to 19.0% in the second quarter of 2025, compared to 18.6% in the first quarter.
Second quarter warehousing, delivery, selling, general, and administrative expenses of $203.6 million represents an increase of 0.7% compared to the first quarter of 2025 due to an additional business day. Expenses decreased sequentially both on a percentage of revenue and on a per day basis, illustrating management's commitment to tightly managing operating expenses. Compared to the prior year period, second quarter 2025 operating expenses increased by $4.6 million, or 2.3%, primarily driven by increased delivery expenses as well as the addition of Production Metals, which was acquired in August 2024.
Net income attributable to Ryerson Holding Corporation for the second quarter of 2025 was $1.9 million, or $0.06 per diluted share, compared to net loss of $5.6 million, or $0.18 per diluted share, in the previous quarter. Ryerson generated Adjusted EBITDA, excluding LIFO of $45.0 million in the second quarter of 2025 compared to $32.8 million in the first quarter of 2025.
Liquidity & Debt Management
Ryerson generated cash from operating activities of $23.8 million in the second quarter of 2025 compared to a usage of $41.2 million in the first quarter as accounts receivable normalized but were partially offset by modest inventory replacement. The Company ended the second quarter of 2025 with debt of $510 million and net debt of $479 million, a sequential increase of $12 million and $15 million, respectively, compared to the first quarter of 2025. Ryerson’s global liquidity, composed of cash and cash equivalents and availability on its revolving credit facilities, was $485 million as of June 30, 2025, compared to $490 million as of March 31, 2025.
Shareholder Return Activity
Dividends. On July 29, 2025, the Board of Directors declared a quarterly cash dividend of $0.1875 per share of common stock, payable on September 18, 2025, to stockholders of record as of September 4, 2025. During the second quarter of 2025, Ryerson’s quarterly dividend amounted to a cash return of approximately $6.0 million.
Share Repurchases and Authorization. Ryerson did not repurchase shares during the second quarter of 2025. As of June 30, 2025, $38.4 million remained under the existing authorization.
Outlook Commentary
For the third quarter of 2025, Ryerson expects customer shipments to decrease by 2% to 4% quarter-over-quarter, reflecting both normal seasonality patterns as well as overall recessed manufacturing and industrial metal demand conditions driving cautious customer behavior, particularly in our larger OEM contractual customers book of business. The Company anticipates third quarter net sales to be in the range of $1.14 billion to $1.18 billion, with average selling prices increasing 1% to 3%. LIFO expense in the third quarter of 2025 is expected to be between $9 million to $11 million. We therefore expect adjusted EBITDA, excluding LIFO in the range of $40 million to $45 million and earnings per diluted share in the range of $0.00 to $0.06.
|
|
|
|
|
|
|
|
|
|
|
|
|
Second Quarter 2025 Major Product Metrics |
|
|
|
|
|
|
Net Sales (millions) |
|
|
Q2 2025 |
|
Q1 2025 |
|
|
Q2 2024 |
|
Quarter-over-quarter |
Year-over-year |
|
|
|
|
|
|
|
|
|
|
|
Carbon Steel |
$ |
578 |
$ |
563 |
|
$ |
644 |
|
2.7% |
|
(10.2%) |
|
Aluminum |
$ |
306 |
$ |
275 |
|
$ |
277 |
|
11.3% |
|
10.5% |
|
Stainless Steel |
$ |
271 |
$ |
281 |
|
$ |
286 |
|
(3.6%) |
|
(5.2%) |
|
|
|
|
|
|
|
|
|
|
|
|
|
|
|
Tons Shipped (thousands) |
|
|
Q2 2025 |
|
Q1 2025 |
|
|
Q2 2024 |
|
Quarter-over-quarter |
Year-over-year |
|
|
|
|
|
|
|
|
|
|
|
Carbon Steel |
|
391 |
|
389 |
|
|
397 |
|
0.5% |
|
(1.5%) |
|
Aluminum |
|
50 |
|
48 |
|
|
49 |
|
4.2% |
|
2.0% |
|
Stainless Steel |
|
60 |
|
61 |
|
|
59 |
|
(1.6%) |
|
1.7% |
|
|
|
|
|
|
|
|
|
|
|
|
|
|
|
Average Selling Prices (per ton) |
|
|
Q2 2025 |
|
Q1 2025 |
|
|
Q2 2024 |
|
Quarter-over-quarter |
Year-over-year |
|
|
|
|
|
|
|
|
|
|
|
Carbon Steel |
$ |
1,478 |
$ |
1,447 |
|
$ |
1,622 |
|
2.1% |
|
(8.9%) |
|
Aluminum |
$ |
6,120 |
$ |
5,729 |
|
$ |
5,653 |
|
6.8% |
|
8.3% |
|
Stainless Steel |
$ |
4,517 |
$ |
4,607 |
|
$ |
4,847 |
|
(2.0%) |
|
(6.8%) |
|
|
|
|
|
|
|
|
|
|
|
|
|
|
|
|
|
|
|
|
|
|
|
|
|
|
|
|
|
|
|
|
|
|
|
|
|
|
|
|
|
|
|
|
|
|
|
|
|
|
|
|
|
First Half 2025 Major Product Metrics |
|
|
|
|
|
|
|
|
|
|
|
|
Net Sales (millions) |
|
|
|
|
|
|
1H 2025 |
|
|
1H 2024 |
Year-over-year |
|
|
|
|
|
|
|
|
|
|
|
|
|
|
|
Carbon Steel |
|
$ |
1,141 |
|
$ |
1,288 |
|
(11.4%) |
|
|
|
Aluminum |
|
|
$ |
581 |
|
$ |
556 |
|
4.5% |
|
|
|
Stainless Steel |
|
$ |
552 |
|
$ |
583 |
|
(5.3%) |
|
|
|
|
|
|
|
|
|
|
|
|
|
|
|
|
|
|
|
|
Tons Shipped (thousands) |
|
|
|
|
|
|
1H 2025 |
|
|
1H 2024 |
Year-over-year |
|
|
|
|
|
|
|
|
|
|
|
|
|
|
|
Carbon Steel |
|
|
780 |
|
|
781 |
|
(0.1%) |
|
|
|
Aluminum |
|
|
|
98 |
|
|
99 |
|
(1.0%) |
|
|
|
Stainless Steel |
|
|
121 |
|
|
120 |
|
0.8% |
|
|
|
|
|
|
|
|
|
|
|
|
|
|
|
|
|
|
|
|
Average Selling Prices (per ton) |
|
|
|
|
|
|
1H 2025 |
|
|
1H 2024 |
Year-over-year |
|
|
|
|
|
|
|
|
|
|
|
|
|
|
|
Carbon Steel |
|
$ |
1,463 |
|
$ |
1,649 |
|
(11.3%) |
|
|
|
Aluminum |
|
|
$ |
5,929 |
|
$ |
5,616 |
|
5.6% |
|
|
|
Stainless Steel |
|
$ |
4,562 |
|
$ |
4,858 |
|
(6.1%) |
|
|
|
Earnings Call Information
Ryerson will host a conference call to discuss second quarter 2025 financial results for the period ended June 30, 2025, on Wednesday, July 30, 2025, at 10 a.m. Eastern Time. The live online broadcast will be available on the Company’s investor relations website, ir.ryerson.com. A replay will be available at the same website for 90 days.
About Ryerson
Ryerson is a leading value-added processor and distributor of industrial metals, with operations in the United States, Canada, Mexico, and China. Founded in 1842, Ryerson has approximately 4,300 employees and over 110 locations. Visit Ryerson at www.ryerson.com.
Ryerson Investor Relations:
[email protected]
Notes:
1For EBITDA, Adjusted EBITDA and Adjusted EBITDA excluding LIFO please see Schedule 2
2Net debt is defined as long term debt plus short term debt less cash and cash equivalents and excludes restricted cash
3North American Industry shipments declined by 2.1% in the second quarter (per the Metals Service Center Institute) while Ryerson North American shipments declined by 1.2%, implying Ryerson market share growth
Legal Disclaimer
The contents herein are provided for general information purposes only and do not constitute an offer to sell or purchase, or a solicitation of an offer to purchase, any security (“Security”) of the Company or its affiliates (“Ryerson”) in any jurisdiction. Ryerson does not intend to solicit, and is not soliciting, any action with respect to any Security or any other contractual relationship with Ryerson. Nothing in this release, individually or taken in the aggregate, constitutes an offer of securities for sale or purchase, or a solicitation of an offer to purchase, any Security in the United States, or to U.S. persons, or in any other jurisdiction in which such an offer or solicitation is unlawful.
Safe Harbor Provision
Certain statements made in this release and other written or oral statements made by or on behalf of the Company constitute “forward-looking statements” within the meaning of the federal securities laws, including statements regarding our future performance, as well as management's expectations, beliefs, intentions, plans, estimates, objectives, or projections relating to the future. Such statements can be identified by the use of forward-looking terminology such as “objectives,” “goals,” “preliminary,” “range,” “believes,” “expects,” “may,” “estimates,” “will,” “should,” “plans,” or “anticipates” or the negative thereof or other variations thereon or comparable terminology, or by discussions of strategy. The Company cautions that any such forward-looking statements are not guarantees of future performance and may involve significant risks and uncertainties, and that actual results may vary materially from those in the forward-looking statements as a result of various factors. Among the factors that significantly impact our business are: the cyclicality of our business; the highly competitive, volatile, and fragmented metals industry in which we operate; the impact of geopolitical events; fluctuating metal prices; our indebtedness and the covenants in instruments governing such indebtedness; the integration of acquired operations; regulatory and other operational risks associated with our operations located inside and outside of the United States; the influence of a single investor group over our policies and procedures; work stoppages; obligations under certain employee retirement benefit plans; currency fluctuations; and consolidation in the metals industry. Forward-looking statements should, therefore, be considered in light of various factors, including those set forth above and those set forth under “Risk Factors” in our most recent our annual report on Form 10-K and in our other filings with the Securities and Exchange Commission. Moreover, we caution against placing undue reliance on these statements, which speak only as of the date they were made. The Company does not undertake any obligation to publicly update or revise any forward-looking statements to reflect future events or circumstances, new information or otherwise.
|
|
|
|
|
|
|
|
|
|
|
|
|
|
|
|
|
|
|
|
|
RYERSON HOLDING CORPORATION AND SUBSIDIARY COMPANIES |
|
Selected Income and Cash Flow Data - Unaudited |
|
(Dollars and Shares in Millions, except Per Share and Per Ton Data) |
|
|
|
|
|
|
|
|
|
|
|
|
|
|
|
|
|
|
|
2025 |
|
|
2024 |
|
|
First Six Months Ended |
|
|
|
Second |
|
|
First |
|
|
Second |
|
|
June 30, |
|
|
|
Quarter |
|
|
Quarter |
|
|
Quarter |
|
|
2025 |
|
|
2024 |
|
|
|
|
|
|
|
|
|
|
|
|
|
|
|
|
|
NET SALES |
|
$ |
1,169.3 |
|
|
$ |
1,135.7 |
|
|
$ |
1,225.5 |
|
|
$ |
2,305.0 |
|
|
$ |
2,464.7 |
|
Cost of materials sold |
|
|
959.9 |
|
|
|
931.3 |
|
|
|
1,002.0 |
|
|
|
1,891.2 |
|
|
|
2,023.6 |
|
Gross profit |
|
|
209.4 |
|
|
|
204.4 |
|
|
|
223.5 |
|
|
|
413.8 |
|
|
|
441.1 |
|
Warehousing, delivery, selling, general, and administrative |
|
|
203.6 |
|
|
|
202.1 |
|
|
|
199.0 |
|
|
|
405.7 |
|
|
|
415.8 |
|
Restructuring and other charges |
|
|
— |
|
|
|
— |
|
|
|
1.7 |
|
|
|
— |
|
|
|
1.7 |
|
OPERATING PROFIT |
|
|
5.8 |
|
|
|
2.3 |
|
|
|
22.8 |
|
|
|
8.1 |
|
|
|
23.6 |
|
Other income and (expense), net |
|
|
(2.3 |
) |
|
|
0.3 |
|
|
|
1.8 |
|
|
|
(2.0 |
) |
|
|
1.6 |
|
Interest and other expense on debt |
|
|
(9.8 |
) |
|
|
(9.5 |
) |
|
|
(11.3 |
) |
|
|
(19.3 |
) |
|
|
(21.4 |
) |
INCOME (LOSS) BEFORE INCOME TAXES |
|
|
(6.3 |
) |
|
|
(6.9 |
) |
|
|
13.3 |
|
|
|
(13.2 |
) |
|
|
3.8 |
|
Provision (benefit) for income taxes |
|
|
(8.4 |
) |
|
|
(1.6 |
) |
|
|
3.0 |
|
|
|
(10.0 |
) |
|
|
0.9 |
|
NET INCOME (LOSS) |
|
|
2.1 |
|
|
|
(5.3 |
) |
|
|
10.3 |
|
|
|
(3.2 |
) |
|
|
2.9 |
|
Less: Net income attributable to noncontrolling interest |
|
|
0.2 |
|
|
|
0.3 |
|
|
|
0.4 |
|
|
|
0.5 |
|
|
|
0.6 |
|
NET INCOME (LOSS) ATTRIBUTABLE TO RYERSON HOLDING CORPORATION |
|
$ |
1.9 |
|
|
$ |
(5.6 |
) |
|
$ |
9.9 |
|
|
$ |
(3.7 |
) |
|
$ |
2.3 |
|
EARNINGS (LOSS) PER SHARE |
|
|
|
|
|
|
|
|
|
|
|
|
|
|
|
Basic |
|
$ |
0.06 |
|
|
$ |
(0.18 |
) |
|
$ |
0.29 |
|
|
$ |
(0.12 |
) |
|
$ |
0.07 |
|
Diluted |
|
$ |
0.06 |
|
|
$ |
(0.18 |
) |
|
$ |
0.29 |
|
|
$ |
(0.12 |
) |
|
$ |
0.07 |
|
Shares outstanding - basic |
|
|
32.2 |
|
|
|
31.9 |
|
|
|
34.2 |
|
|
|
32.0 |
|
|
|
34.1 |
|
Shares outstanding - diluted |
|
|
32.4 |
|
|
|
31.9 |
|
|
|
34.4 |
|
|
|
32.0 |
|
|
|
34.6 |
|
|
|
|
|
|
|
|
|
|
|
|
|
|
|
|
|
Dividends declared per share |
|
$ |
0.1875 |
|
|
$ |
0.1875 |
|
|
$ |
0.1875 |
|
|
$ |
0.375 |
|
|
$ |
0.375 |
|
|
|
|
|
|
|
|
|
|
|
|
|
|
|
|
|
Supplemental Data : |
|
|
|
|
|
|
|
|
|
|
|
|
|
|
|
Tons shipped (000) |
|
|
501 |
|
|
|
500 |
|
|
|
508 |
|
|
|
1,001 |
|
|
|
1,005 |
|
Shipping days |
|
|
64 |
|
|
|
63 |
|
|
|
64 |
|
|
|
127 |
|
|
|
128 |
|
Average selling price/ton |
|
$ |
2,334 |
|
|
$ |
2,271 |
|
|
$ |
2,412 |
|
|
$ |
2,303 |
|
|
$ |
2,452 |
|
Gross profit/ton |
|
|
418 |
|
|
|
409 |
|
|
|
440 |
|
|
|
413 |
|
|
|
439 |
|
Operating profit/ton |
|
|
12 |
|
|
|
5 |
|
|
|
45 |
|
|
|
8 |
|
|
|
23 |
|
LIFO expense (income) per ton |
|
|
26 |
|
|
|
14 |
|
|
|
(20 |
) |
|
|
20 |
|
|
|
(9 |
) |
LIFO expense (income) |
|
|
13.2 |
|
|
|
6.8 |
|
|
|
(10.0 |
) |
|
|
20.0 |
|
|
|
(9.0 |
) |
Depreciation and amortization expense |
|
|
19.4 |
|
|
|
19.2 |
|
|
|
18.0 |
|
|
|
38.6 |
|
|
|
35.4 |
|
Cash flow provided by (used in) operating activities |
|
|
23.8 |
|
|
|
(41.2 |
) |
|
|
25.9 |
|
|
|
(17.4 |
) |
|
|
(21.9 |
) |
Capital expenditures |
|
|
(9.9 |
) |
|
|
(8.0 |
) |
|
|
(22.7 |
) |
|
|
(17.9 |
) |
|
|
(44.5 |
) |
|
|
|
|
|
|
|
|
|
|
|
|
|
|
|
|
See Schedule 1 for Condensed Consolidated Balance Sheets |
|
|
|
|
|
|
|
|
|
|
See Schedule 2 for EBITDA and Adjusted EBITDA reconciliation |
|
|
|
|
|
|
|
|
|
|
See Schedule 3 for Adjusted EPS reconciliation |
|
|
|
|
|
|
|
|
|
|
See Schedule 4 for Free Cash Flow reconciliation |
|
|
|
|
|
|
|
|
|
|
See Schedule 5 for Third Quarter 2025 Guidance reconciliation |
|
|
|
|
|
|
|
|
|
|
|
|
|
|
|
|
|
|
|
Schedule 1 |
|
RYERSON HOLDING CORPORATION AND SUBSIDIARY COMPANIES |
|
Condensed Consolidated Balance Sheets |
|
(In millions, except shares) |
|
|
|
|
|
|
|
|
|
|
June 30, |
|
|
December 31, |
|
|
|
2025 |
|
|
2024 |
|
Assets |
|
(unaudited) |
|
|
|
|
Current assets: |
|
|
|
|
|
|
Cash and cash equivalents |
|
$ |
30.8 |
|
|
$ |
27.7 |
|
Restricted cash |
|
|
1.4 |
|
|
|
1.6 |
|
Receivables, less provisions of $3.4 at June 30, 2025 and $2.5 at December 31, 2024 |
|
|
532.8 |
|
|
|
425.6 |
|
Inventories |
|
|
675.6 |
|
|
|
684.6 |
|
Prepaid expenses and other current assets |
|
|
84.0 |
|
|
|
68.1 |
|
Total current assets |
|
|
1,324.6 |
|
|
|
1,207.6 |
|
Property, plant, and equipment, at cost |
|
|
1,163.9 |
|
|
|
1,152.0 |
|
Less: accumulated depreciation |
|
|
544.6 |
|
|
|
515.3 |
|
Property, plant, and equipment, net |
|
|
619.3 |
|
|
|
636.7 |
|
Operating lease assets |
|
|
343.4 |
|
|
|
344.6 |
|
Other intangible assets |
|
|
63.5 |
|
|
|
68.3 |
|
Goodwill |
|
|
161.5 |
|
|
|
161.8 |
|
Deferred charges and other assets |
|
|
25.8 |
|
|
|
20.5 |
|
Total assets |
|
$ |
2,538.1 |
|
|
$ |
2,439.5 |
|
Liabilities |
|
|
|
|
|
|
Current liabilities: |
|
|
|
|
|
|
Accounts payable |
|
$ |
506.3 |
|
|
$ |
440.8 |
|
Salaries, wages, and commissions |
|
|
39.6 |
|
|
|
35.7 |
|
Other accrued liabilities |
|
|
66.9 |
|
|
|
67.1 |
|
Short-term debt |
|
|
1.4 |
|
|
|
0.7 |
|
Current portion of operating lease liabilities |
|
|
33.2 |
|
|
|
32.1 |
|
Current portion of deferred employee benefits |
|
|
3.8 |
|
|
|
3.7 |
|
Total current liabilities |
|
|
651.2 |
|
|
|
580.1 |
|
Long-term debt |
|
|
508.8 |
|
|
|
466.7 |
|
Deferred employee benefits |
|
|
81.1 |
|
|
|
90.9 |
|
Noncurrent operating lease liabilities |
|
|
336.0 |
|
|
|
334.6 |
|
Deferred income taxes |
|
|
127.7 |
|
|
|
129.0 |
|
Other noncurrent liabilities |
|
|
12.1 |
|
|
|
13.7 |
|
Total liabilities |
|
|
1,716.9 |
|
|
|
1,615.0 |
|
Commitments and contingencies |
|
|
|
|
|
|
Equity |
|
|
|
|
|
|
Ryerson Holding Corporation stockholders' equity: |
|
|
|
|
|
|
Preferred stock, $0.01 par value; 7,000,000 shares authorized and no shares issued at June 30, 2025 and December 31, 2024 |
|
|
— |
|
|
|
— |
|
Common stock, $0.01 par value; 100,000,000 shares authorized; 40,360,234 and 39,899,093 shares issued at June 30, 2025 and December 31, 2024, respectively |
|
|
0.4 |
|
|
|
0.4 |
|
Capital in excess of par value |
|
|
430.6 |
|
|
|
423.5 |
|
Retained earnings |
|
|
763.7 |
|
|
|
779.6 |
|
Treasury stock, at cost - Common stock of 8,164,148 shares at June 30, 2025 and 8,051,226 shares at December 31, 2024 |
|
|
(237.0 |
) |
|
|
(234.4 |
) |
Accumulated other comprehensive loss |
|
|
(146.2 |
) |
|
|
(153.8 |
) |
Total Ryerson Holding Corporation Stockholders' Equity |
|
|
811.5 |
|
|
|
815.3 |
|
Noncontrolling interest |
|
|
9.7 |
|
|
|
9.2 |
|
Total Equity |
|
|
821.2 |
|
|
|
824.5 |
|
Total Liabilities and Stockholders' Equity |
|
$ |
2,538.1 |
|
|
$ |
2,439.5 |
|
|
|
|
|
|
|
|
|
|
|
|
|
|
|
|
|
|
|
|
|
|
Schedule 2 |
|
RYERSON HOLDING CORPORATION AND SUBSIDIARY COMPANIES |
|
Reconciliations of Net Income (Loss) Attributable to Ryerson Holding Corporation to EBITDA and Gross profit to Gross profit excluding LIFO |
|
(Dollars in millions) |
|
|
|
|
|
|
|
|
|
|
|
|
|
|
|
|
|
|
|
2025 |
|
|
2024 |
|
|
First Six Months Ended |
|
|
|
Second |
|
|
First |
|
|
Second |
|
|
June 30, |
|
|
|
Quarter |
|
|
Quarter |
|
|
Quarter |
|
|
2025 |
|
|
2024 |
|
|
|
|
|
|
|
|
|
|
|
|
|
|
|
|
|
Net income (loss) attributable to Ryerson Holding Corporation |
|
$ |
1.9 |
|
|
$ |
(5.6 |
) |
|
$ |
9.9 |
|
|
$ |
(3.7 |
) |
|
$ |
2.3 |
|
Interest and other expense on debt |
|
|
9.8 |
|
|
|
9.5 |
|
|
|
11.3 |
|
|
|
19.3 |
|
|
|
21.4 |
|
Provision (benefit) for income taxes |
|
|
(8.4 |
) |
|
|
(1.6 |
) |
|
|
3.0 |
|
|
|
(10.0 |
) |
|
|
0.9 |
|
Depreciation and amortization expense |
|
|
19.4 |
|
|
|
19.2 |
|
|
|
18.0 |
|
|
|
38.6 |
|
|
|
35.4 |
|
EBITDA |
|
$ |
22.7 |
|
|
$ |
21.5 |
|
|
$ |
42.2 |
|
|
$ |
44.2 |
|
|
$ |
60.0 |
|
Gain on insurance settlement |
|
|
(1.0 |
) |
|
|
— |
|
|
|
— |
|
|
|
(1.0 |
) |
|
|
— |
|
Reorganization |
|
|
5.0 |
|
|
|
4.0 |
|
|
|
12.7 |
|
|
|
9.0 |
|
|
|
32.8 |
|
Impairment charges on assets |
|
|
1.8 |
|
|
|
— |
|
|
|
— |
|
|
|
1.8 |
|
|
|
— |
|
Pension settlement loss |
|
|
— |
|
|
|
— |
|
|
|
— |
|
|
|
— |
|
|
|
2.2 |
|
Benefit plan curtailment gain |
|
|
— |
|
|
|
— |
|
|
|
— |
|
|
|
— |
|
|
|
(0.3 |
) |
Foreign currency transaction (gains) losses |
|
|
2.7 |
|
|
|
— |
|
|
|
(0.4 |
) |
|
|
2.7 |
|
|
|
(1.6 |
) |
Purchase consideration and other transaction costs (credits) |
|
|
0.5 |
|
|
|
0.4 |
|
|
|
(1.1 |
) |
|
|
0.9 |
|
|
|
(1.0 |
) |
Other adjustments |
|
|
0.1 |
|
|
|
0.1 |
|
|
|
(0.8 |
) |
|
|
0.2 |
|
|
|
(0.3 |
) |
Adjusted EBITDA |
|
$ |
31.8 |
|
|
$ |
26.0 |
|
|
$ |
52.6 |
|
|
$ |
57.8 |
|
|
$ |
91.8 |
|
|
|
|
|
|
|
|
|
|
|
|
|
|
|
|
|
Adjusted EBITDA |
|
$ |
31.8 |
|
|
$ |
26.0 |
|
|
$ |
52.6 |
|
|
$ |
57.8 |
|
|
$ |
91.8 |
|
LIFO expense (income) |
|
|
13.2 |
|
|
|
6.8 |
|
|
|
(10.0 |
) |
|
|
20.0 |
|
|
|
(9.0 |
) |
Adjusted EBITDA, excluding LIFO expense (income) |
|
$ |
45.0 |
|
|
$ |
32.8 |
|
|
$ |
42.6 |
|
|
$ |
77.8 |
|
|
$ |
82.8 |
|
|
|
|
|
|
|
|
|
|
|
|
|
|
|
|
|
Net sales |
|
$ |
1,169.3 |
|
|
$ |
1,135.7 |
|
|
$ |
1,225.5 |
|
|
$ |
2,305.0 |
|
|
$ |
2,464.7 |
|
|
|
|
|
|
|
|
|
|
|
|
|
|
|
|
|
Adjusted EBITDA, excluding LIFO expense (income), as a percentage of net sales |
|
|
3.8 |
% |
|
|
2.9 |
% |
|
|
3.5 |
% |
|
|
3.4 |
% |
|
|
3.4 |
% |
|
|
|
|
|
|
|
|
|
|
|
|
|
|
|
|
Gross profit |
|
$ |
209.4 |
|
|
$ |
204.4 |
|
|
$ |
223.5 |
|
|
$ |
413.8 |
|
|
$ |
441.1 |
|
|
|
|
|
|
|
|
|
|
|
|
|
|
|
|
|
Gross margin |
|
|
17.9 |
% |
|
|
18.0 |
% |
|
|
18.2 |
% |
|
|
18.0 |
% |
|
|
17.9 |
% |
|
|
|
|
|
|
|
|
|
|
|
|
|
|
|
|
Gross profit |
|
$ |
209.4 |
|
|
$ |
204.4 |
|
|
$ |
223.5 |
|
|
$ |
413.8 |
|
|
$ |
441.1 |
|
LIFO expense (income) |
|
|
13.2 |
|
|
|
6.8 |
|
|
|
(10.0 |
) |
|
|
20.0 |
|
|
|
(9.0 |
) |
Gross profit, excluding LIFO expense (income) |
|
$ |
222.6 |
|
|
$ |
211.2 |
|
|
$ |
213.5 |
|
|
$ |
433.8 |
|
|
$ |
432.1 |
|
|
|
|
|
|
|
|
|
|
|
|
|
|
|
|
|
Gross margin, excluding LIFO expense (income) |
|
|
19.0 |
% |
|
|
18.6 |
% |
|
|
17.4 |
% |
|
|
18.8 |
% |
|
|
17.5 |
% |
|
|
|
|
|
|
|
|
|
|
|
|
|
|
|
|
|
|
Note: EBITDA represents net income before interest and other expense on debt, provision for income taxes, depreciation, and amortization. Adjusted EBITDA gives further effect to, among other things, gain on insurance settlement, reorganization expenses, impairment charges on assets, pension settlement loss, benefit plan curtailment gain, and foreign currency transaction gains and losses. We believe that the presentation of EBITDA, Adjusted EBITDA, and Adjusted EBITDA, excluding LIFO expense (income), provides useful information to investors regarding our operational performance because they enhance an investor’s overall understanding of our core financial performance and provide a basis of comparison of results between current, past, and future periods. We also disclose the metric Adjusted EBITDA, excluding LIFO expense (income), to provide a means of comparison amongst our competitors who may not use the same basis of accounting for inventories. EBITDA, Adjusted EBITDA, and Adjusted EBITDA, excluding LIFO expense (income), are three of the primary metrics management uses for planning and forecasting in future periods, including trending and analyzing the core operating performance of our business without the effect of U.S. generally accepted accounting principles, or GAAP, expenses, revenues, and gains (losses) that are unrelated to the day to day performance of our business. We also establish compensation programs for our executive management and regional employees that are based upon the achievement of pre-established EBITDA, Adjusted EBITDA, and Adjusted EBITDA, excluding LIFO expense (income), targets. We also use EBITDA, Adjusted EBITDA, and Adjusted EBITDA, excluding LIFO expense (income), to benchmark our operating performance to that of our competitors. EBITDA, Adjusted EBITDA, and Adjusted EBITDA, excluding LIFO expense (income), do not represent, and should not be used as a substitute for, net income or cash flows from operations as determined in accordance with generally accepted accounting principles, and neither EBITDA, Adjusted EBITDA, and Adjusted EBITDA, excluding LIFO expense (income), is necessarily an indication of whether cash flow will be sufficient to fund our cash requirements. This release also presents gross margin, excluding LIFO expense (income), which is calculated as gross profit minus LIFO expense (income), divided by net sales. We have excluded LIFO expense from gross margin and Adjusted EBITDA as a percentage of net sales metrics in order to provide a means of comparison amongst our competitors who may not use the same basis of accounting for inventories as we do. Our definitions of EBITDA, Adjusted EBITDA, Adjusted EBITDA, excluding LIFO expense (income), gross margin, excluding LIFO expense (income), and Adjusted EBITDA, excluding LIFO expense (income), as a percentage of sales may differ from that of other companies. |
|
|
|
|
|
|
|
|
|
|
|
|
|
|
|
|
|
|
|
|
|
|
Schedule 3 |
|
RYERSON HOLDING CORPORATION AND SUBSIDIARY COMPANIES |
|
Reconciliation of Net Income (Loss) to Adjusted Net Income (Loss) and Adjusted Earnings (Loss) per Share |
|
(Dollars and Shares in Millions, Except Per Share Data) |
|
|
|
|
|
|
|
|
|
|
|
|
|
|
|
|
|
|
|
2025 |
|
|
2024 |
|
|
First Six Months Ended |
|
|
|
Second |
|
|
First |
|
|
Second |
|
|
June 30, |
|
|
|
Quarter |
|
|
Quarter |
|
|
Quarter |
|
|
2025 |
|
|
2024 |
|
|
|
|
|
|
|
|
|
|
|
|
|
|
|
|
|
Net income (loss) attributable to Ryerson Holding Corporation |
|
$ |
1.9 |
|
|
$ |
(5.6 |
) |
|
$ |
9.9 |
|
|
$ |
(3.7 |
) |
|
$ |
2.3 |
|
|
|
|
|
|
|
|
|
|
|
|
|
|
|
|
|
Gain on insurance settlement |
|
|
(1.0 |
) |
|
|
— |
|
|
|
— |
|
|
|
(1.0 |
) |
|
|
— |
|
Restructuring and other charges |
|
|
— |
|
|
|
— |
|
|
|
1.7 |
|
|
|
— |
|
|
|
1.7 |
|
Impairment charges on assets |
|
|
1.8 |
|
|
|
— |
|
|
|
— |
|
|
|
1.8 |
|
|
|
— |
|
Pension settlement loss |
|
|
— |
|
|
|
— |
|
|
|
— |
|
|
|
— |
|
|
|
2.2 |
|
Benefit plan curtailment gain |
|
|
— |
|
|
|
— |
|
|
|
— |
|
|
|
— |
|
|
|
(0.3 |
) |
Benefit for income taxes |
|
|
(0.2 |
) |
|
|
— |
|
|
|
(0.4 |
) |
|
|
(0.2 |
) |
|
|
(0.9 |
) |
|
|
|
|
|
|
|
|
|
|
|
|
|
|
|
|
Adjusted net income (loss) attributable to Ryerson Holding Corporation |
|
$ |
2.5 |
|
|
$ |
(5.6 |
) |
|
$ |
11.2 |
|
|
$ |
(3.1 |
) |
|
$ |
5.0 |
|
|
|
|
|
|
|
|
|
|
|
|
|
|
|
|
|
Adjusted diluted earnings (loss) per share |
|
$ |
0.08 |
|
|
$ |
(0.18 |
) |
|
$ |
0.33 |
|
|
$ |
(0.10 |
) |
|
$ |
0.14 |
|
|
|
|
|
|
|
|
|
|
|
|
|
|
|
|
|
Shares outstanding - diluted |
|
|
32.4 |
|
|
|
31.9 |
|
|
|
34.4 |
|
|
|
32.0 |
|
|
|
34.6 |
|
|
|
|
|
|
|
|
|
|
|
|
|
|
|
|
|
Note: Adjusted net income (loss) and Adjusted earnings (loss) per share is presented to provide a means of comparison with periods that do not include similar adjustments. |
|
|
|
|
|
|
|
|
|
|
|
|
|
|
|
|
|
|
|
|
|
|
|
|
|
|
|
|
|
|
|
|
|
Schedule 4 |
|
RYERSON HOLDING CORPORATION AND SUBSIDIARY COMPANIES |
|
Cash Flow from Operations to Free Cash Flow Yield |
|
(Dollars in Millions) |
|
|
|
|
|
|
|
|
|
|
|
|
|
|
|
|
|
|
|
2025 |
|
|
2024 |
|
|
First Six Months Ended |
|
|
|
Second |
|
|
First |
|
|
Second |
|
|
June 30, |
|
|
|
Quarter |
|
|
Quarter |
|
|
Quarter |
|
|
2025 |
|
|
2024 |
|
|
|
|
|
|
|
|
|
|
|
|
|
|
|
|
|
Net cash provided by (used in) operating activities |
|
$ |
23.8 |
|
|
$ |
(41.2 |
) |
|
$ |
25.9 |
|
|
$ |
(17.4 |
) |
|
$ |
(21.9 |
) |
Capital expenditures |
|
|
(9.9 |
) |
|
|
(8.0 |
) |
|
|
(22.7 |
) |
|
|
(17.9 |
) |
|
|
(44.5 |
) |
Proceeds from sales of property, plant, and equipment |
|
|
0.2 |
|
|
|
0.1 |
|
|
|
0.1 |
|
|
|
0.3 |
|
|
|
1.5 |
|
Free cash flow |
|
$ |
14.1 |
|
|
$ |
(49.1 |
) |
|
$ |
3.3 |
|
|
$ |
(35.0 |
) |
|
$ |
(64.9 |
) |
|
|
|
|
|
|
|
|
|
|
|
|
|
|
|
|
Market capitalization |
|
$ |
694.5 |
|
|
$ |
739.2 |
|
|
$ |
657.0 |
|
|
$ |
694.5 |
|
|
$ |
657.0 |
|
|
|
|
|
|
|
|
|
|
|
|
|
|
|
|
|
Free cash flow yield |
|
|
2.0 |
% |
|
|
(6.6 |
)% |
|
|
0.5 |
% |
|
|
(5.0 |
)% |
|
|
(9.9 |
)% |
|
|
|
|
|
|
|
|
|
|
|
|
|
|
|
|
Note: Market capitalization is calculated using June 30, 2025, March 31, 2025, and June 30, 2024 stock prices and shares outstanding. |
|
|
|
|
|
|
|
|
|
|
|
|
|
|
|
|
|
|
|
|
|
|
|
|
|
|
|
Schedule 5 |
RYERSON HOLDING CORPORATION AND SUBSIDIARY COMPANIES |
Reconciliation of Third Quarter 2025 Net Income Attributable to Ryerson Holding Corporation to Adj. EBITDA, excl. LIFO Guidance |
(Dollars in Millions, except Per Share Data) |
|
Third Quarter 2025 |
|
Low |
|
High |
Net income attributable to Ryerson Holding Corporation |
$- |
|
$2 |
|
|
|
|
Diluted earnings per share |
$- |
|
$0.06 |
|
|
|
|
Interest and other expense on debt |
10 |
|
10 |
Provision for income taxes |
- |
|
1 |
Depreciation and amortization expense |
20 |
|
20 |
EBITDA |
$30 |
|
$33 |
Adjustments |
1 |
|
1 |
Adjusted EBITDA |
$31 |
|
$34 |
LIFO expense |
9 |
|
11 |
Adjusted EBITDA, excluding LIFO expense |
$40 |
|
$45 |
|
|
|
|
Note: See the note within Schedule 2 for a description of EBITDA and Adjusted EBITDA. |
|
|
|

Ryerson Quarterly Release Presentation Q2 2025 Exhibit 99.2
Important Information About Ryerson Holding Corporation These materials do not constitute an offer or solicitation to purchase or sell securities of Ryerson Holding Corporation (“Ryerson” or “the Company”) or its subsidiaries and no investment decision should be made based upon the information provided herein. Ryerson strongly urges you to review its filings with the Securities and Exchange Commission, which can be found at https://ir.ryerson.com/financials/sec-filings/default.aspx. This site also provides additional information about Ryerson. Safe Harbor Provision Certain statements made in this release and other written or oral statements made by or on behalf of the Company constitute “forward-looking statements” within the meaning of the federal securities laws, including statements regarding our future performance, as well as management's expectations, beliefs, intentions, plans, estimates, objectives, or projections relating to the future. Such statements can be identified by the use of forward-looking terminology such as “objectives,” “goals,” “preliminary,” “range,” “believes,” “expects,” “may,” “estimates,” “will,” “should,” “plans,” or “anticipates” or the negative thereof or other variations thereon or comparable terminology, or by discussions of strategy. The Company cautions that any such forward-looking statements are not guarantees of future performance and may involve significant risks and uncertainties, and that actual results may vary materially from those in the forward-looking statements as a result of various factors. Among the factors that significantly impact our business are: the cyclicality of our business; the highly competitive, volatile, and fragmented metals industry in which we operate; the impact of geopolitical events; fluctuating metal prices; our indebtedness and the covenants in instruments governing such indebtedness; the integration of acquired operations; regulatory and other operational risks associated with our operations located inside and outside of the United States; the influence of a single investor group over our policies and procedures; work stoppages; obligations under certain employee retirement benefit plans; currency fluctuations; and consolidation in the metals industry. Forward-looking statements should, therefore, be considered in light of various factors, including those set forth above and those set forth under “Risk Factors” in our most recent annual report on Form 10-K for the year ended December 31, 2024, and in our other filings with the Securities and Exchange Commission. Moreover, we caution against placing undue reliance on these statements, which speak only as of the date they were made. The Company does not undertake any obligation to publicly update or revise any forward-looking statements to reflect future events or circumstances, new information or otherwise. Non-GAAP Measures Certain measures contained in these slides or the related presentation are not measures calculated in accordance with generally accepted accounting principles (“GAAP”). They should not be considered a replacement for GAAP results. Non-GAAP financial measures appearing in these slides are identified in the footnotes. A reconciliation of these non-GAAP measures to the most directly comparable GAAP financial measures is included in the Appendix.
Generated second quarter revenue of $1.17 billion, in-line with guidance, with average selling prices up 2.8% and tons shipped up fractionally compared to the prior quarter Generated net income attributable to Ryerson Holding Corporation of $1.9 million, or diluted income per share of $0.06, and Adjusted EBITDA, excluding LIFO1 of $45.0 million Ended the second quarter with debt of $510 million and net debt2 of $479 million, compared to $498 million and $464 million, respectively, as of the end of the first quarter Gained market share3 while also increasing transactional business mix for the fifth consecutive quarter, partially offsetting recessed contractual business Declared a third-quarter 2025 dividend of $0.1875 per share Q2 2025 Highlights 1For EBITDA, Adjusted EBITDA and Adj EBITDA excluding LIFO please see Appendix; 2Net Debt is defined as Long Term Debt plus Short-Term Debt less Cash and Cash Equivalents and excludes Restricted Cash 3North American Industry shipments declined by 2.1% in the second quarter (per the Metals Service Center Institute) while Ryerson North American shipments declined by 1.2%, implying Ryerson market share growth
Commodity prices since Dec. 2017 1Sources: Bloomberg: prices through July 28, 2025; US Industrial Production MoM and US ISM Purchasing Managers Index from Trading Economics Macro & commodities Futures
12024 Sales Mix by tons excludes Other industry sectors which represent approximately 4% of Ryerson sales mix; Sales Mix based on 2024 results as disclosed in Ryerson’s Annual Report on Form 10-K for the year ended December 31, 2024 2MSCI = Metals Service Center Industry Metal Fab and Machine Shop Industrial Equipment Commercial Ground Transportation Food & Ag Consumer Durable Construction Equipment HVAC Oil & Gas 2024 Sales Mix1 Commentary Q2 2025 QoQ volume change 23% 16% 18% 9% 9% 9% 8% 4% Ryerson’s Q2 shipments reflected relative strength among customers in our consumer durable sector, specifically in appliances and recreational vehicles, and among some of our customers in the HVAC sector on a QoQ volume basis. This was partially offset by weakness in construction and commercial ground transportation. Additionally, Ryerson grew North American market share in the second quarter compared to the industry as measured by the MSCI2, with particular growth in carbon long, carbon plate, and stainless long products. Sequential end-market trends
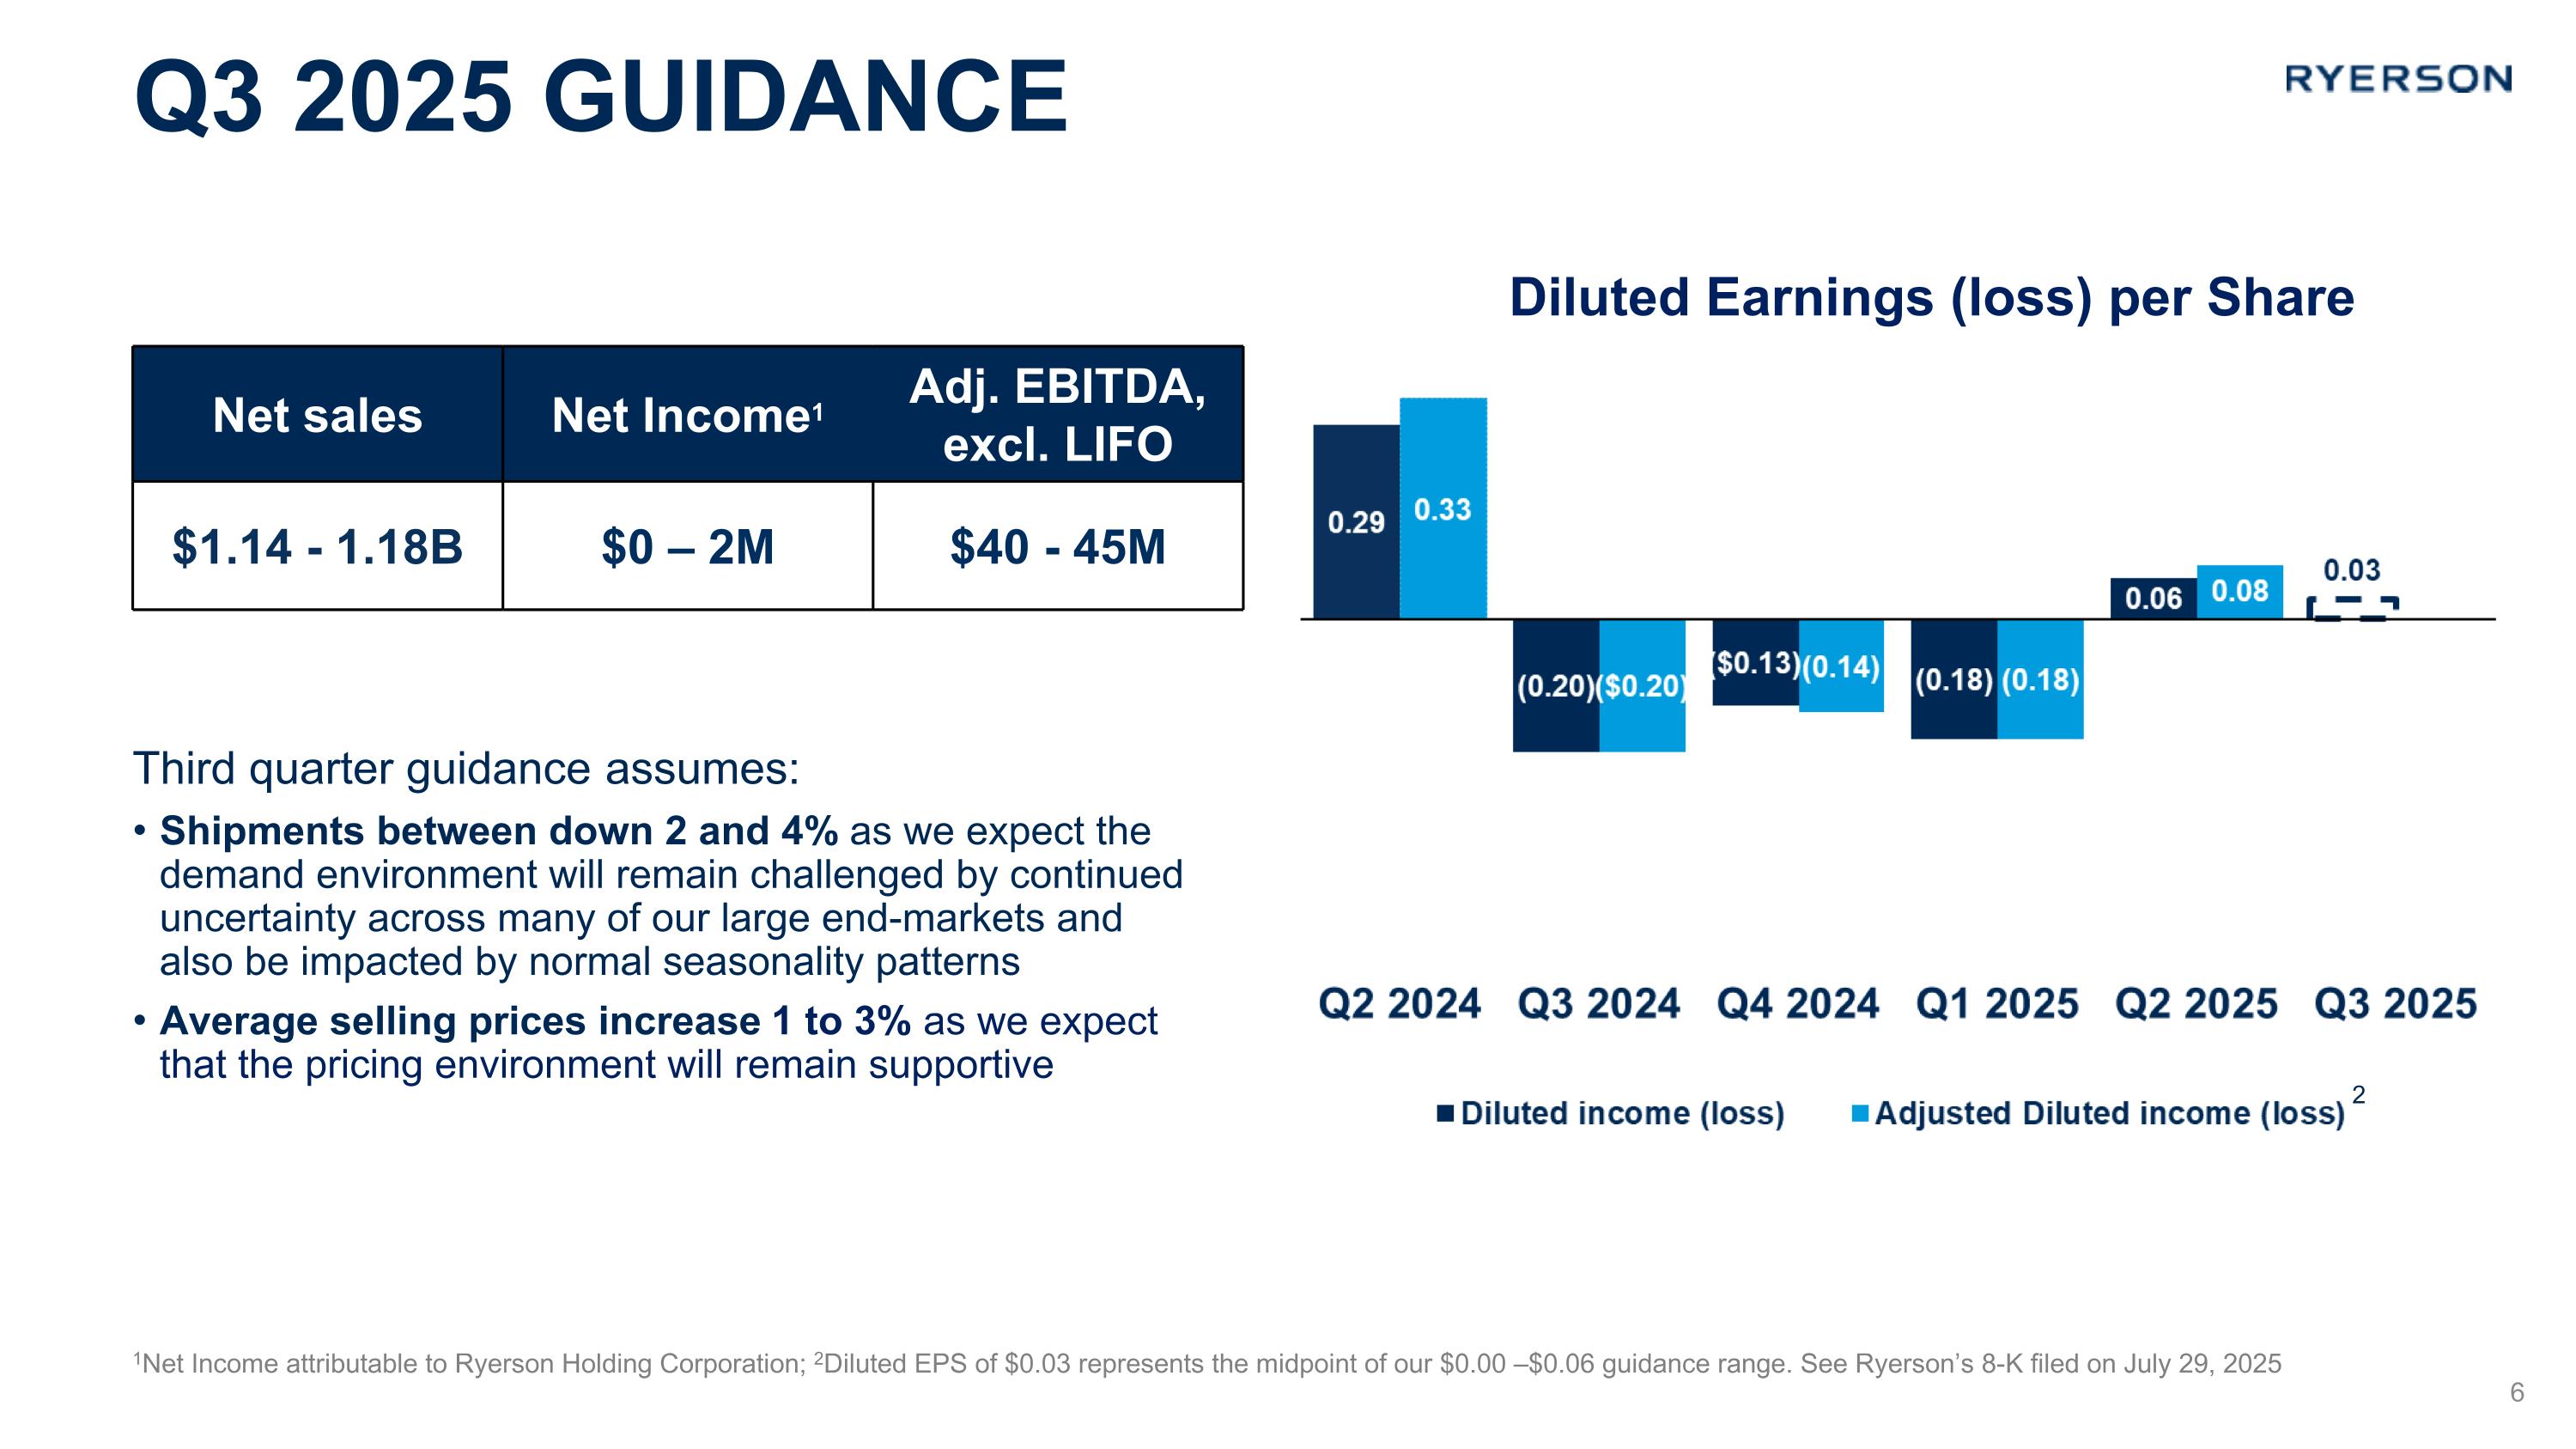
1Net Income attributable to Ryerson Holding Corporation; 2Diluted EPS of $0.03 represents the midpoint of our $0.00 –$0.06 guidance range. See Ryerson’s 8-K filed on July 29, 2025 Net sales Net Income1 Adj. EBITDA, excl. LIFO $1.14 - 1.18B $0 – 2M $40 - 45M Third quarter guidance assumes: Shipments between down 2 and 4% as we expect the demand environment will remain challenged by continued uncertainty across many of our large end-markets and also be impacted by normal seasonality patterns Average selling prices increase 1 to 3% as we expect that the pricing environment will remain supportive Diluted Earnings (loss) per Share Q3 2025 Guidance 2
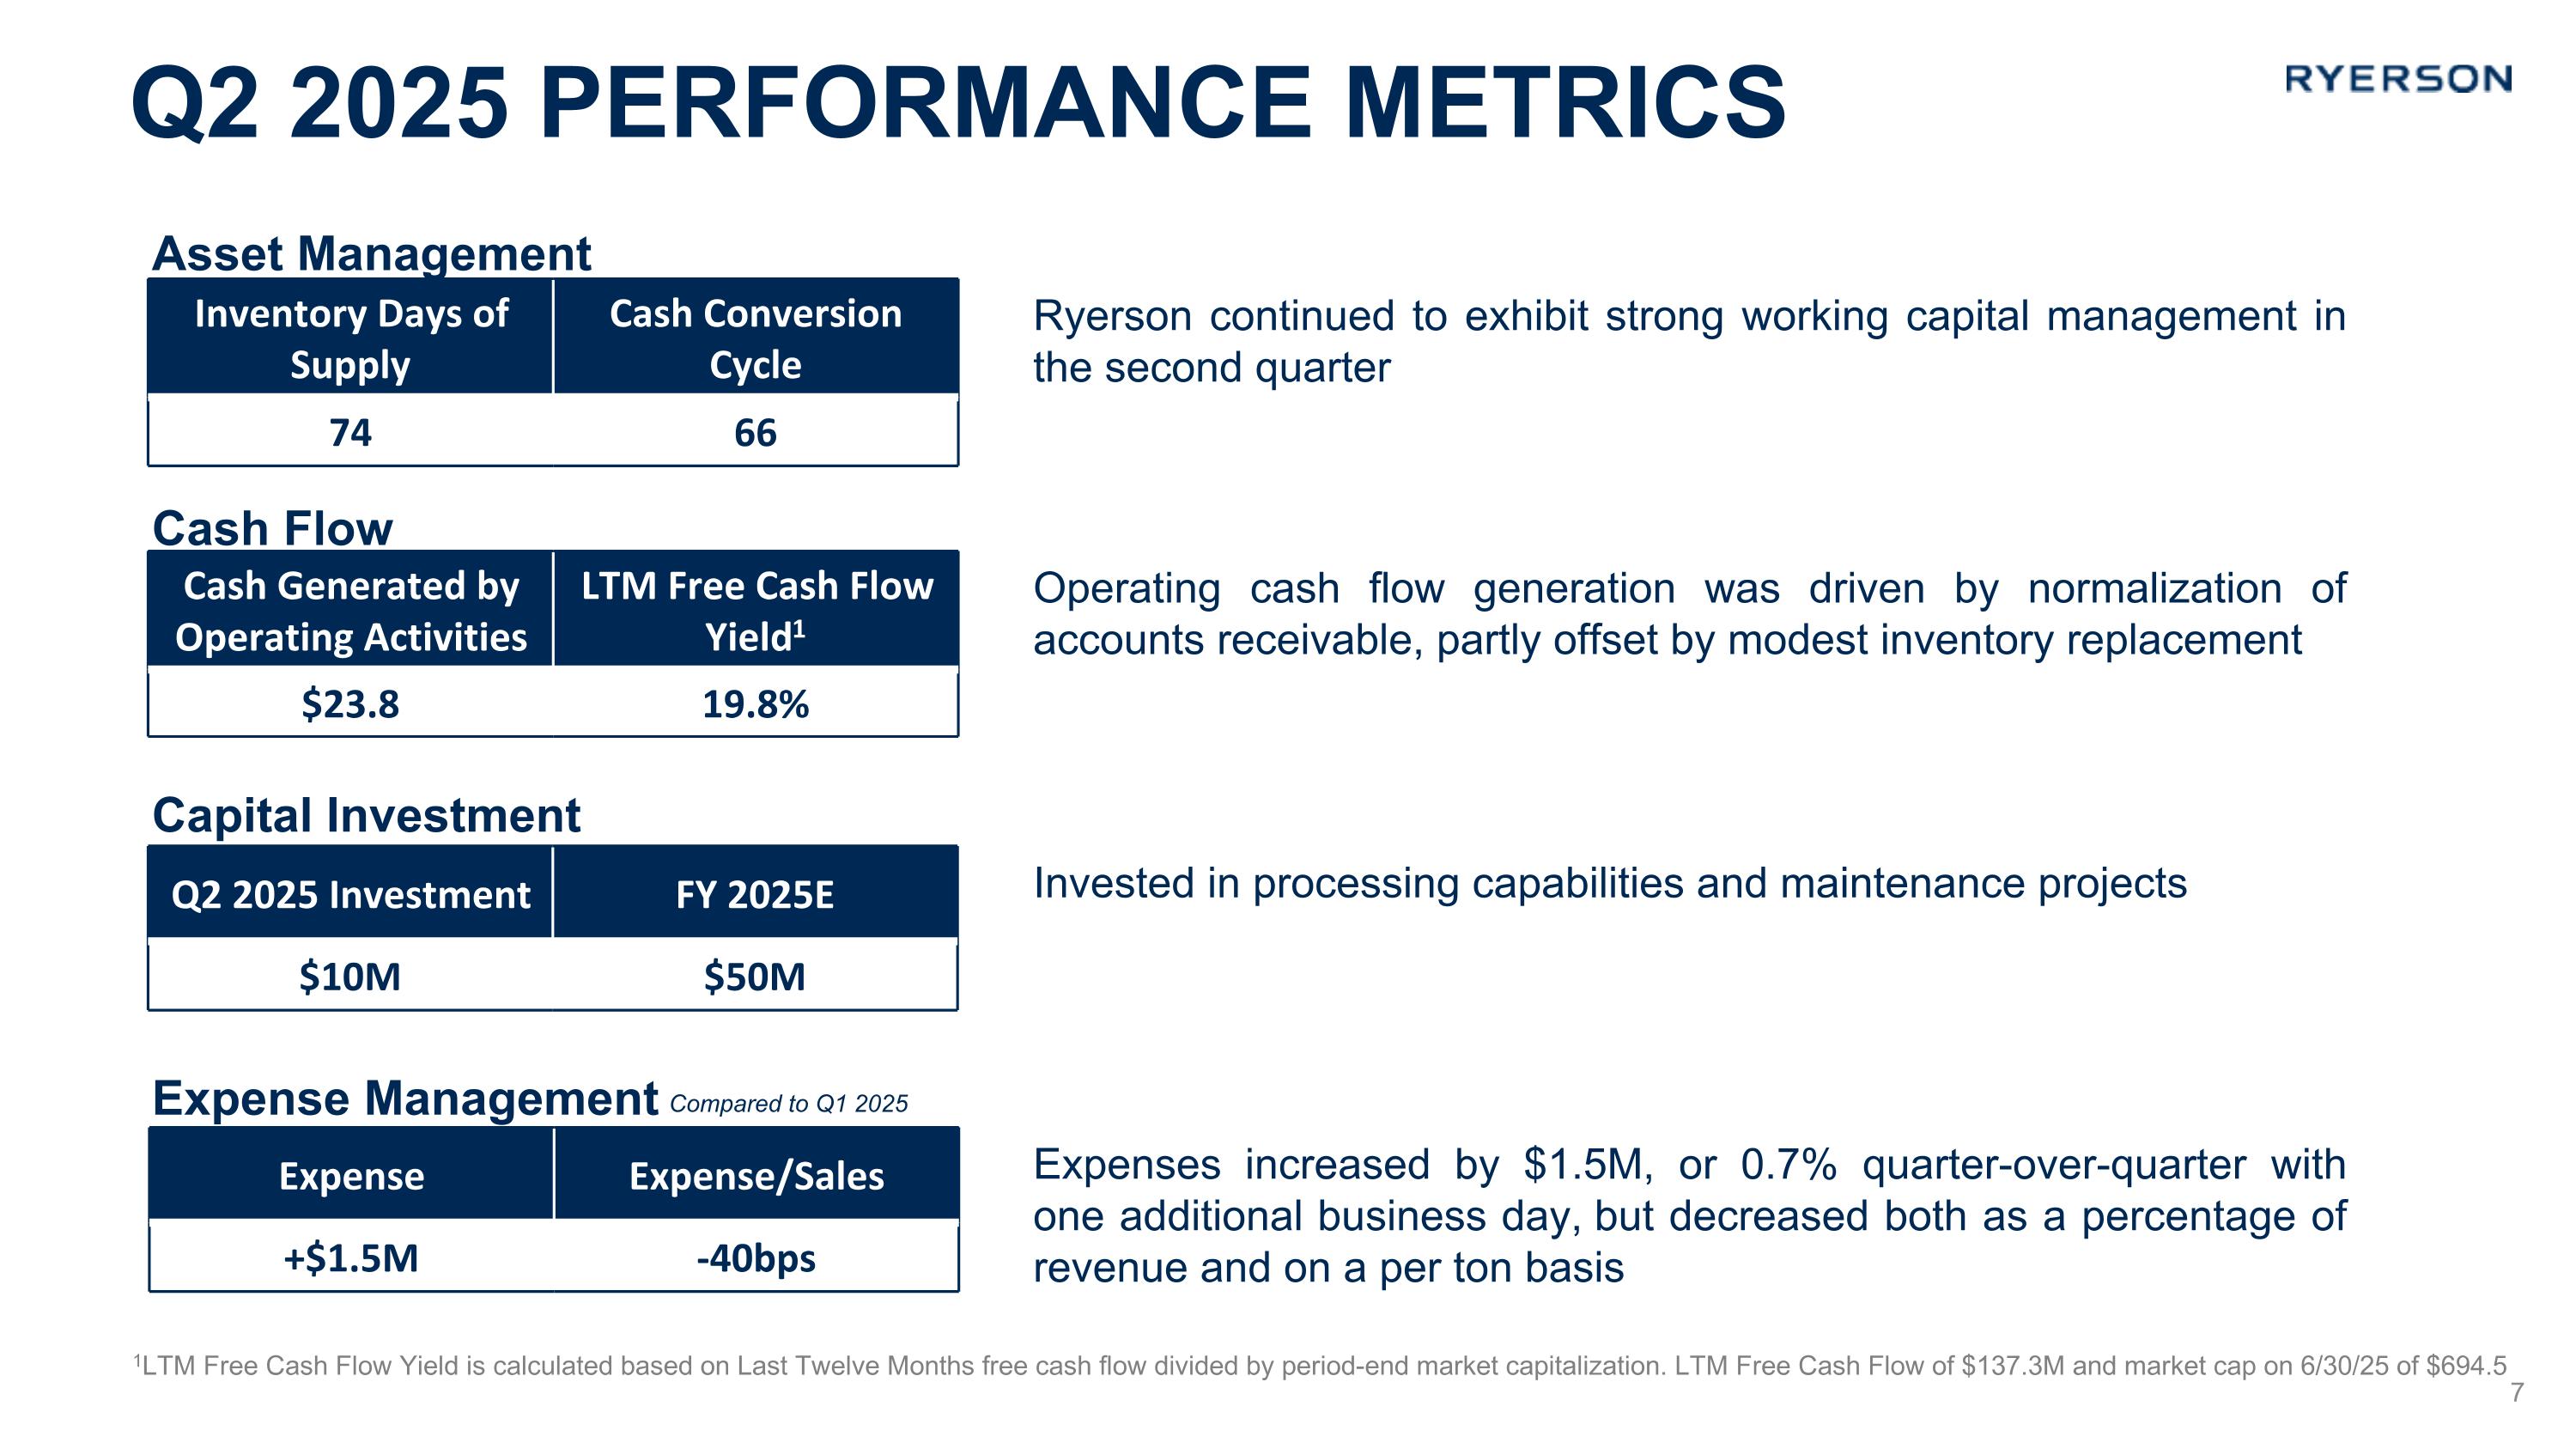
1LTM Free Cash Flow Yield is calculated based on Last Twelve Months free cash flow divided by period-end market capitalization. LTM Free Cash Flow of $137.3M and market cap on 6/30/25 of $694.5 Capital Investment Expense Management Compared to Q1 2025 Inventory Days of Supply Cash Conversion Cycle 74 66 Asset Management Cash Flow Invested in processing capabilities and maintenance projects Operating cash flow generation was driven by normalization of accounts receivable, partly offset by modest inventory replacement Ryerson continued to exhibit strong working capital management in the second quarter Cash Generated by Operating Activities LTM Free Cash Flow Yield1 $23.8 19.8% Q2 2025 Investment FY 2025E $10M $50M Expense Expense/Sales +$1.5M -40bps Expenses increased by $1.5M, or 0.7% quarter-over-quarter with one additional business day, but decreased both as a percentage of revenue and on a per ton basis Q2 2025 performance metrics
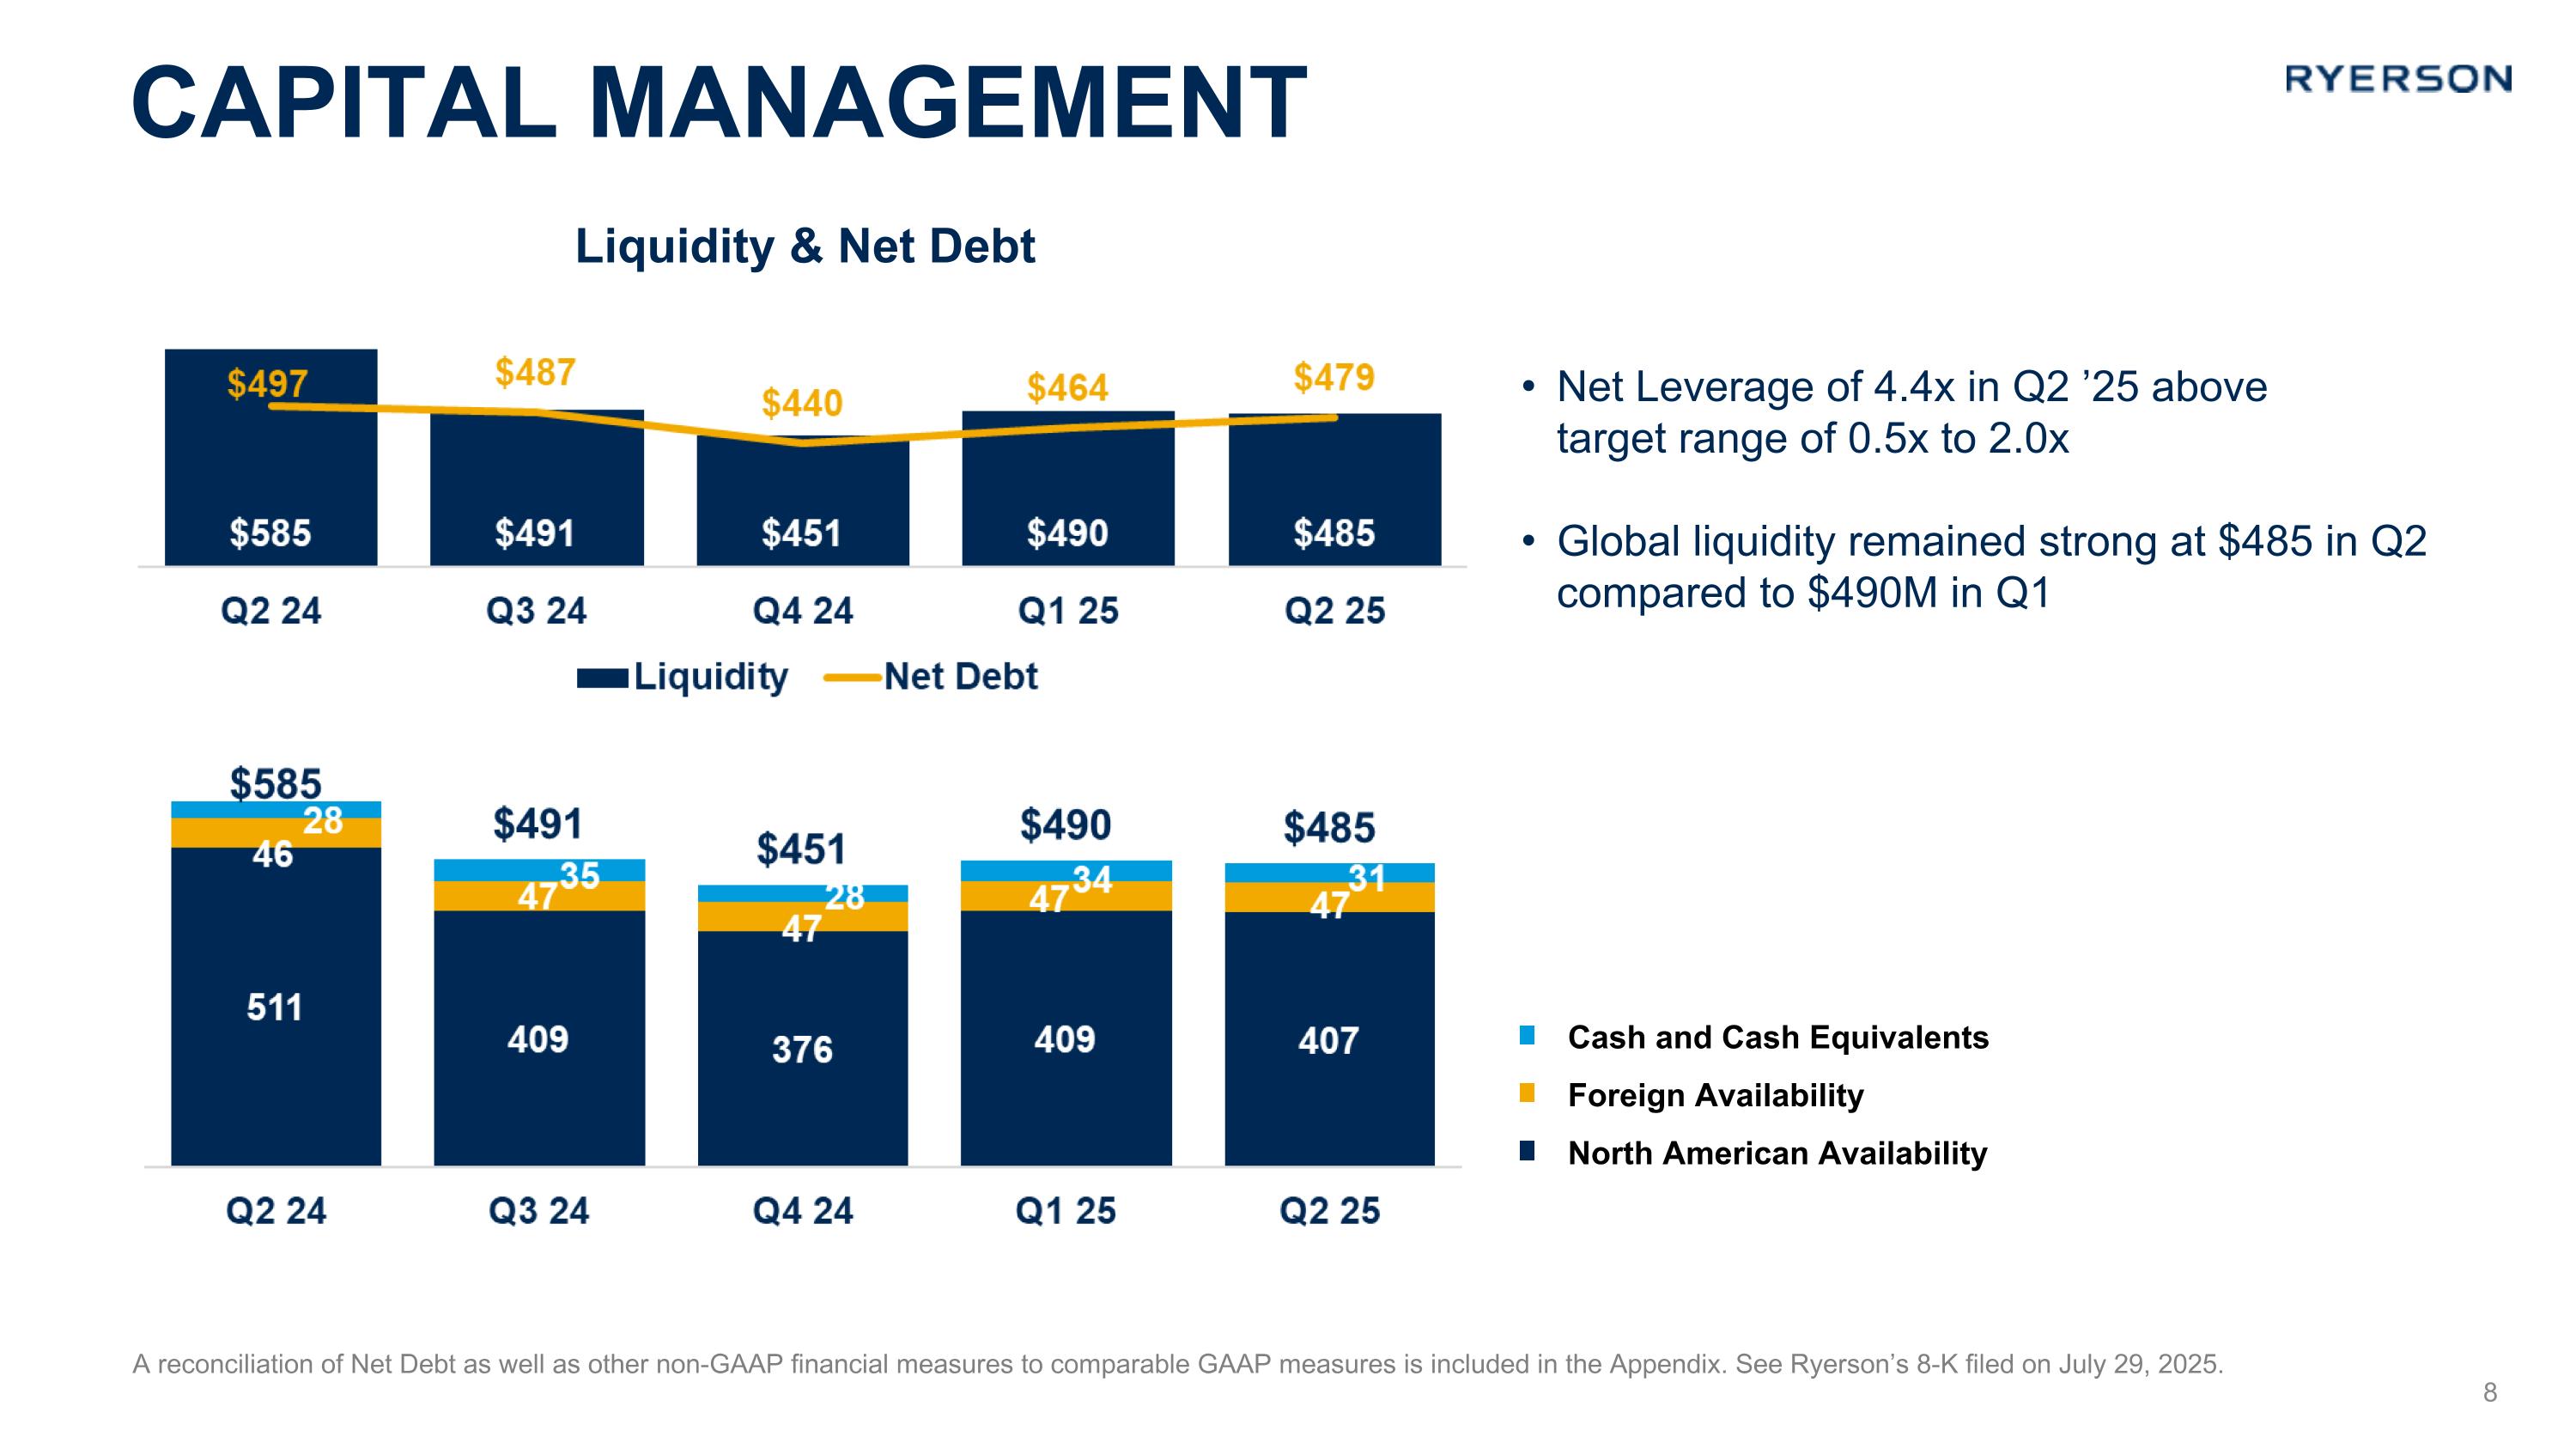
A reconciliation of Net Debt as well as other non-GAAP financial measures to comparable GAAP measures is included in the Appendix. See Ryerson’s 8-K filed on July 29, 2025. Net Leverage of 4.4x in Q2 ’25 above target range of 0.5x to 2.0x Global liquidity remained strong at $485 in Q2 compared to $490M in Q1 Capital Management Liquidity & Net Debt Cash and Cash Equivalents Foreign Availability North American Availability 8
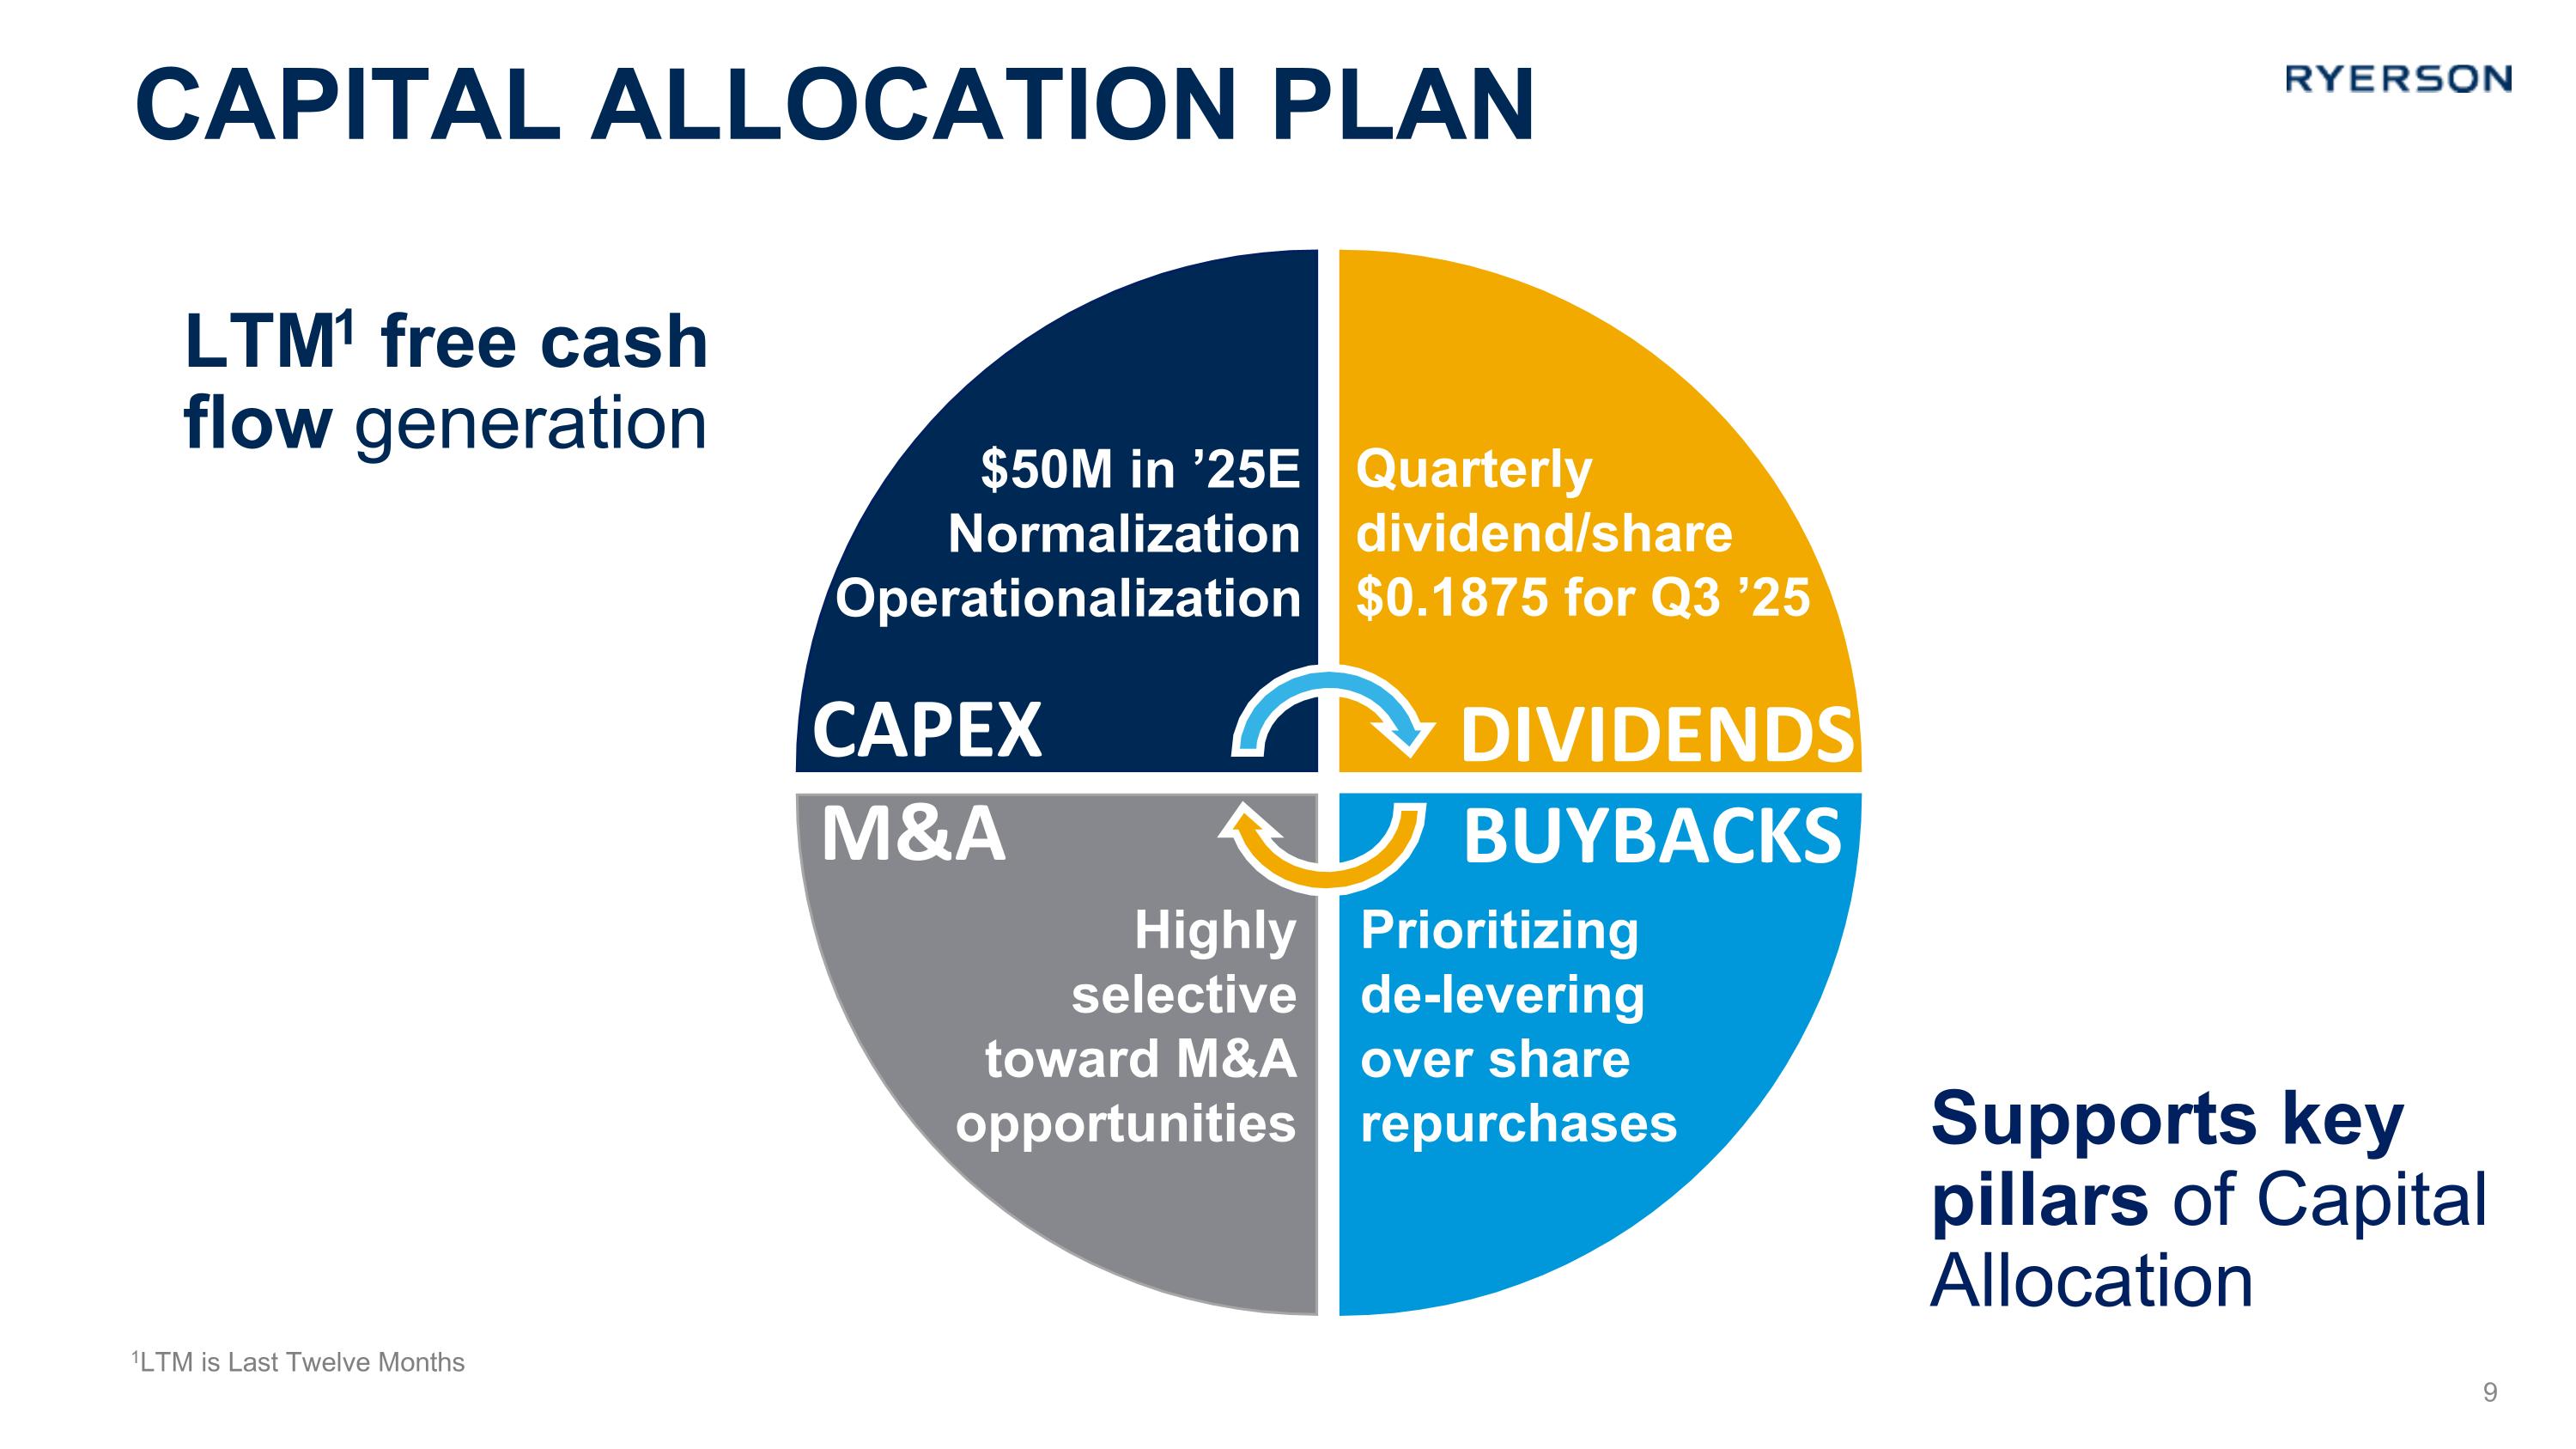
LTM1 free cash flow generation CAPEX DIVIDENDS BUYBACKS M&A Supports key pillars of Capital Allocation Capital allocation plan 1LTM is Last Twelve Months $50M in ’25E Normalization Operationalization Quarterly �dividend/share �$0.1875 for Q3 ’25 Highly selective toward M&A opportunities Prioritizing de-levering over share repurchases CAPEX M&A DIVIDENDS BUYBACKS 9
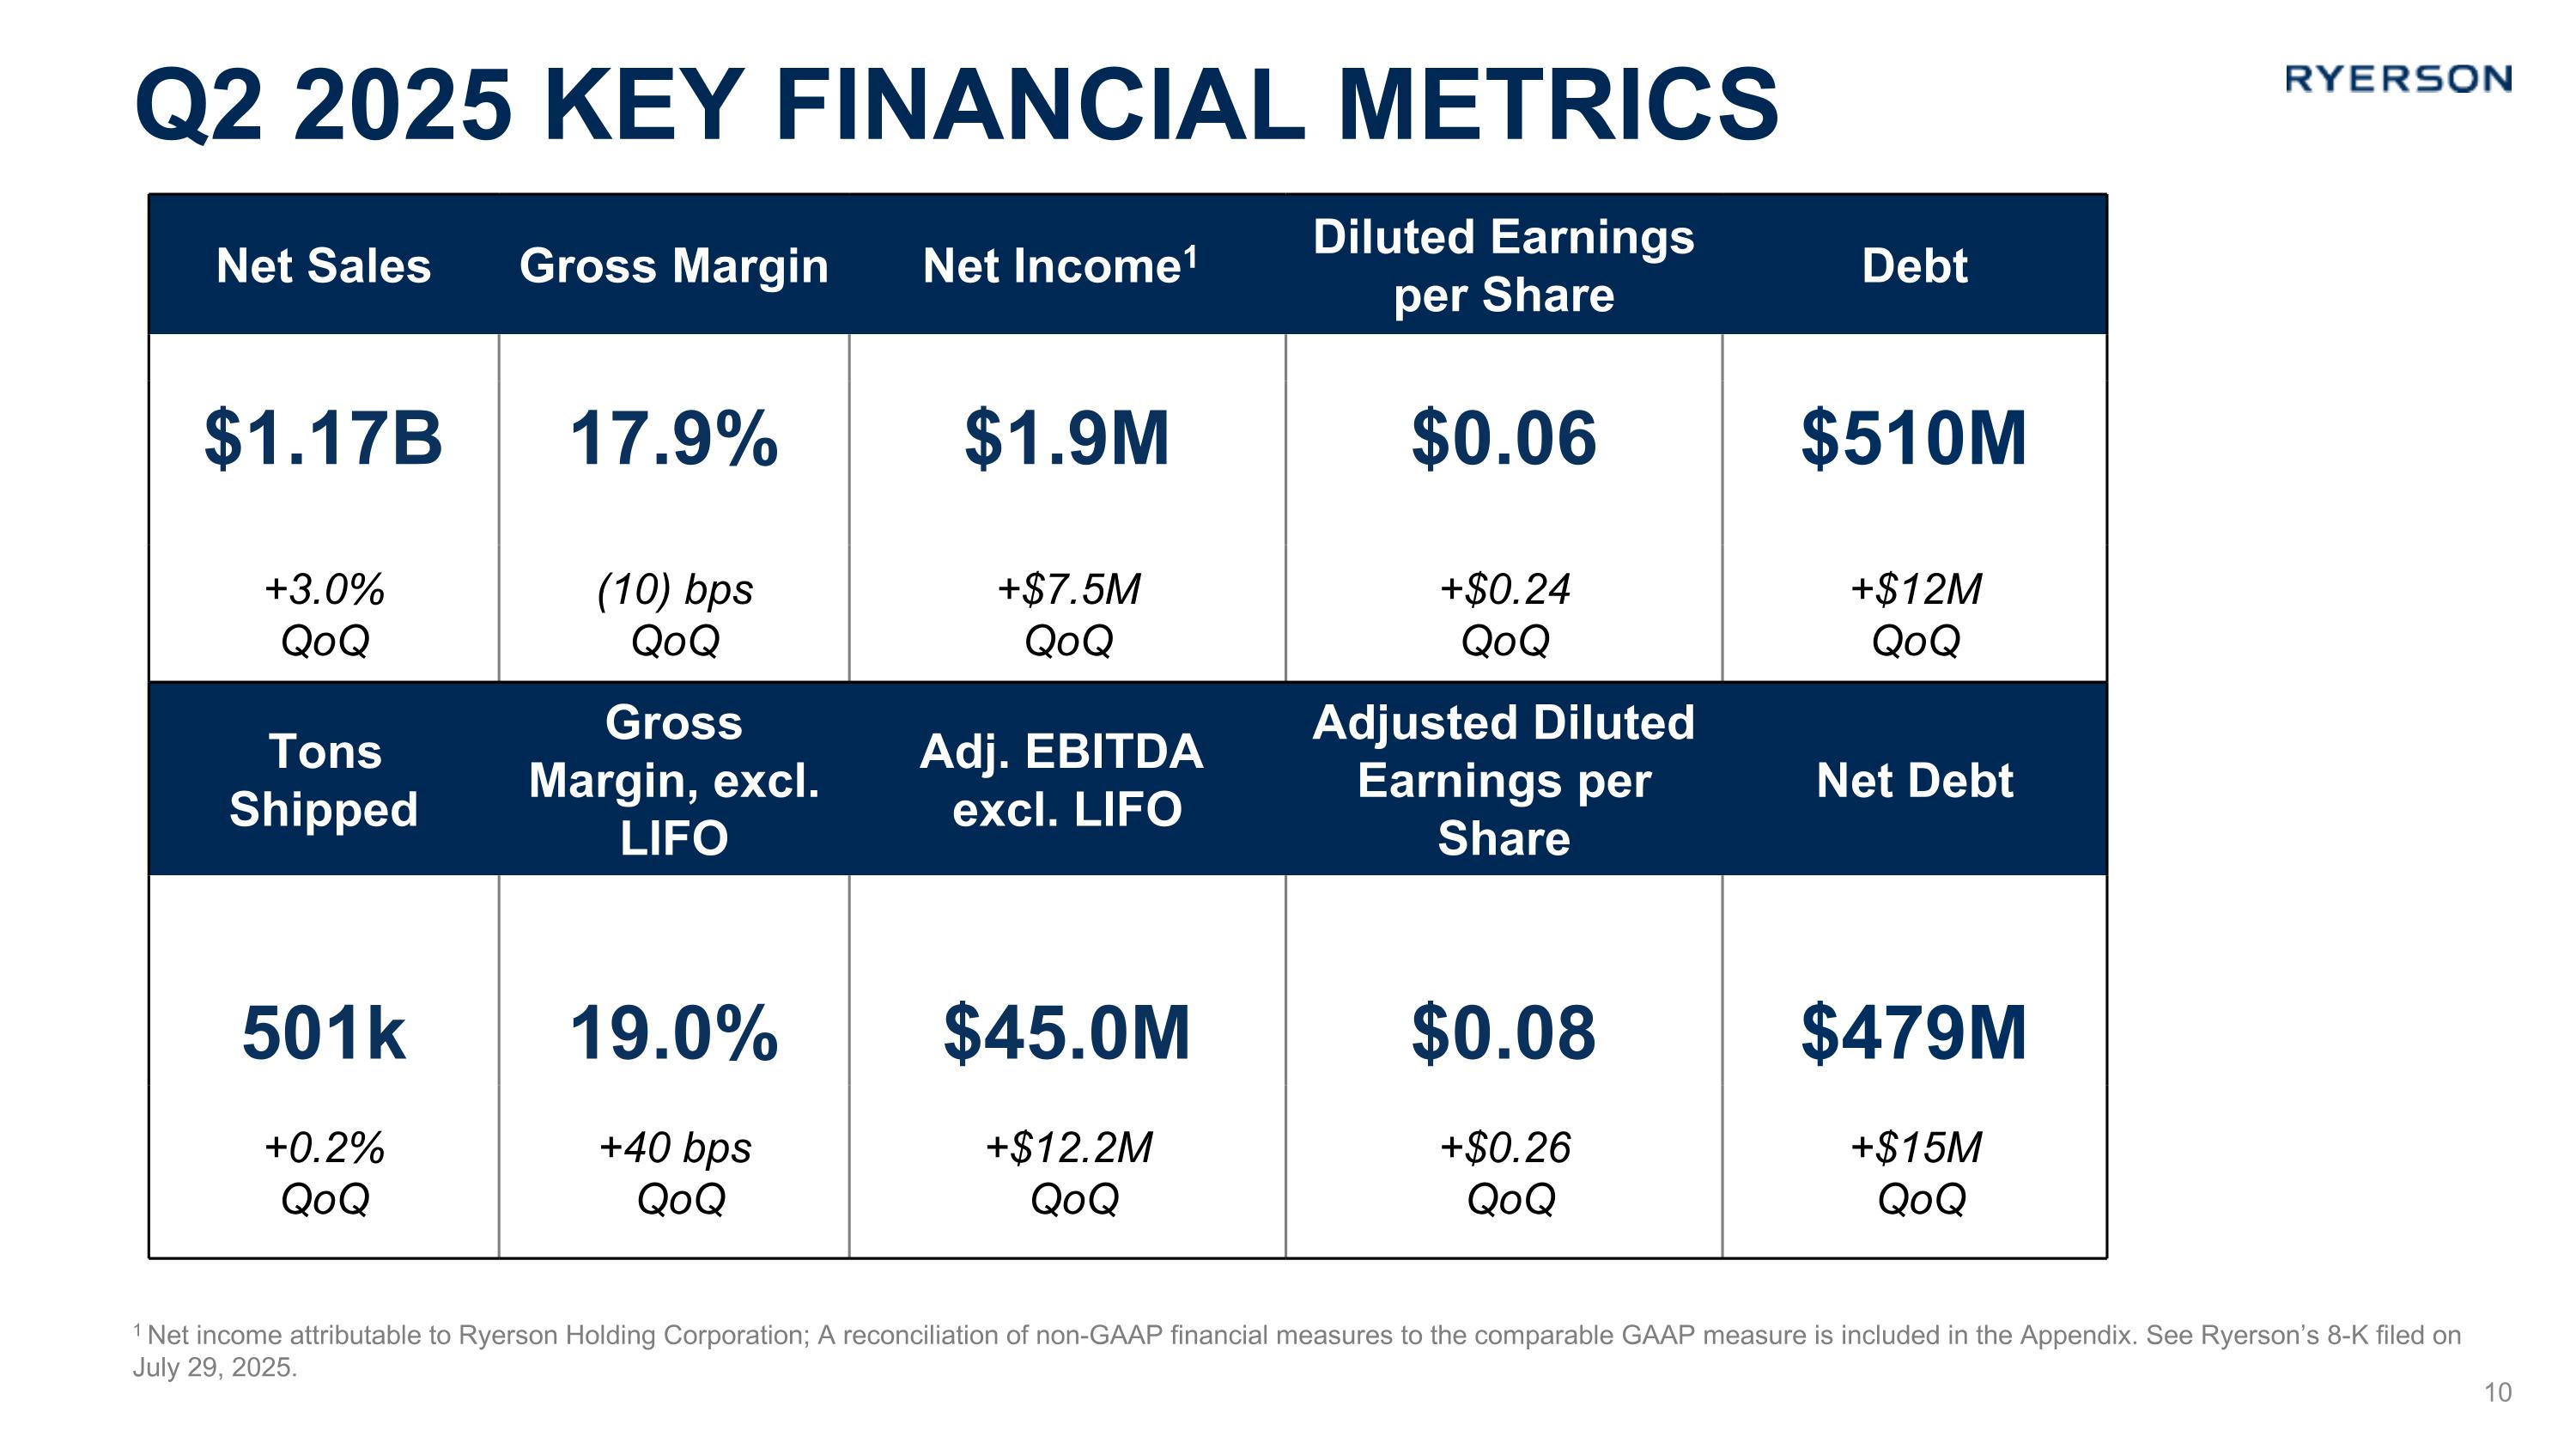
Q2 2025 key financial metrics 1 Net income attributable to Ryerson Holding Corporation; A reconciliation of non-GAAP financial measures to the comparable GAAP measure is included in the Appendix. See Ryerson’s 8-K filed on July 29, 2025. Net Sales Gross Margin Net Income1 Diluted Earnings�per Share Debt $1.17B 17.9% $1.9M $0.06 $510M +3.0% �QoQ (10) bps �QoQ +$7.5M �QoQ +$0.24 �QoQ +$12M�QoQ Tons Shipped Gross Margin, excl. LIFO Adj. EBITDA excl. LIFO Adjusted Diluted Earnings per Share Net Debt 501k 19.0% $45.0M $0.08 $479M +0.2% �QoQ +40 bps� QoQ +$12.2M� QoQ +$0.26� QoQ +$15M� QoQ 10
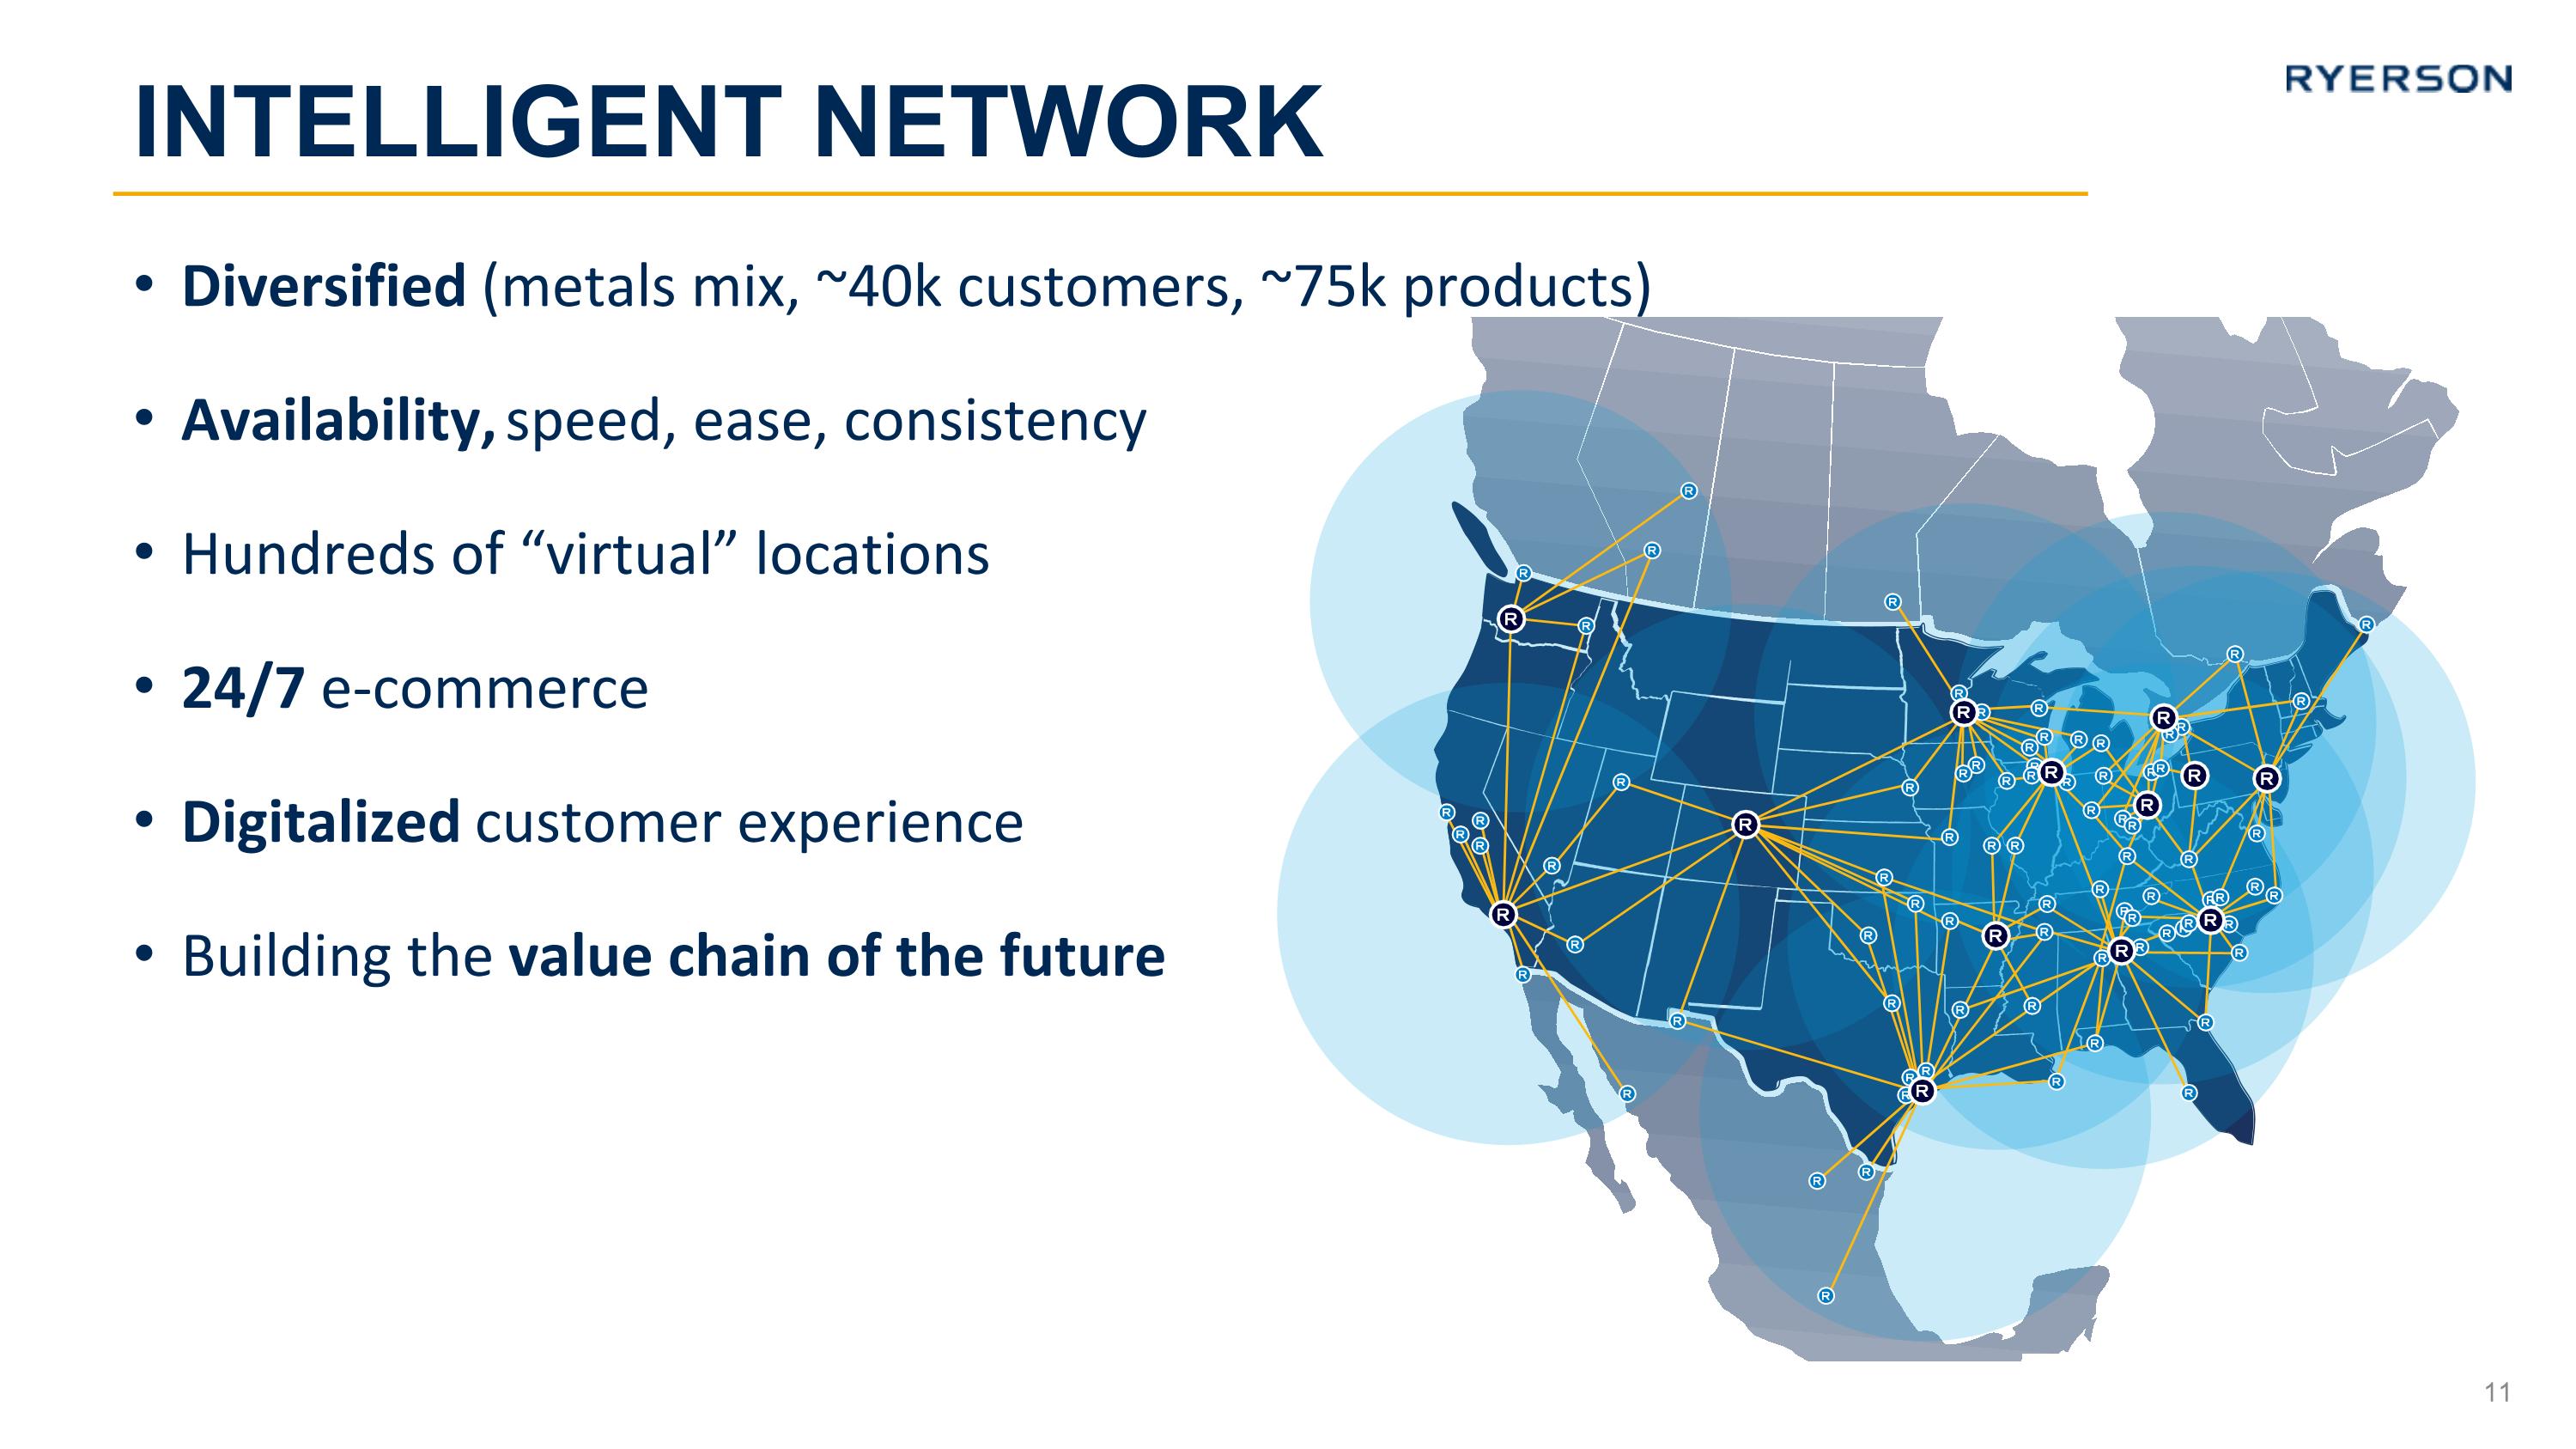
Diversified (metals mix, ~40k customers, ~75k products) Availability, speed, ease, consistency Hundreds of “virtual” locations 24/7 e-commerce Digitalized customer experience Building the value chain of the future Intelligent Network
Appendix
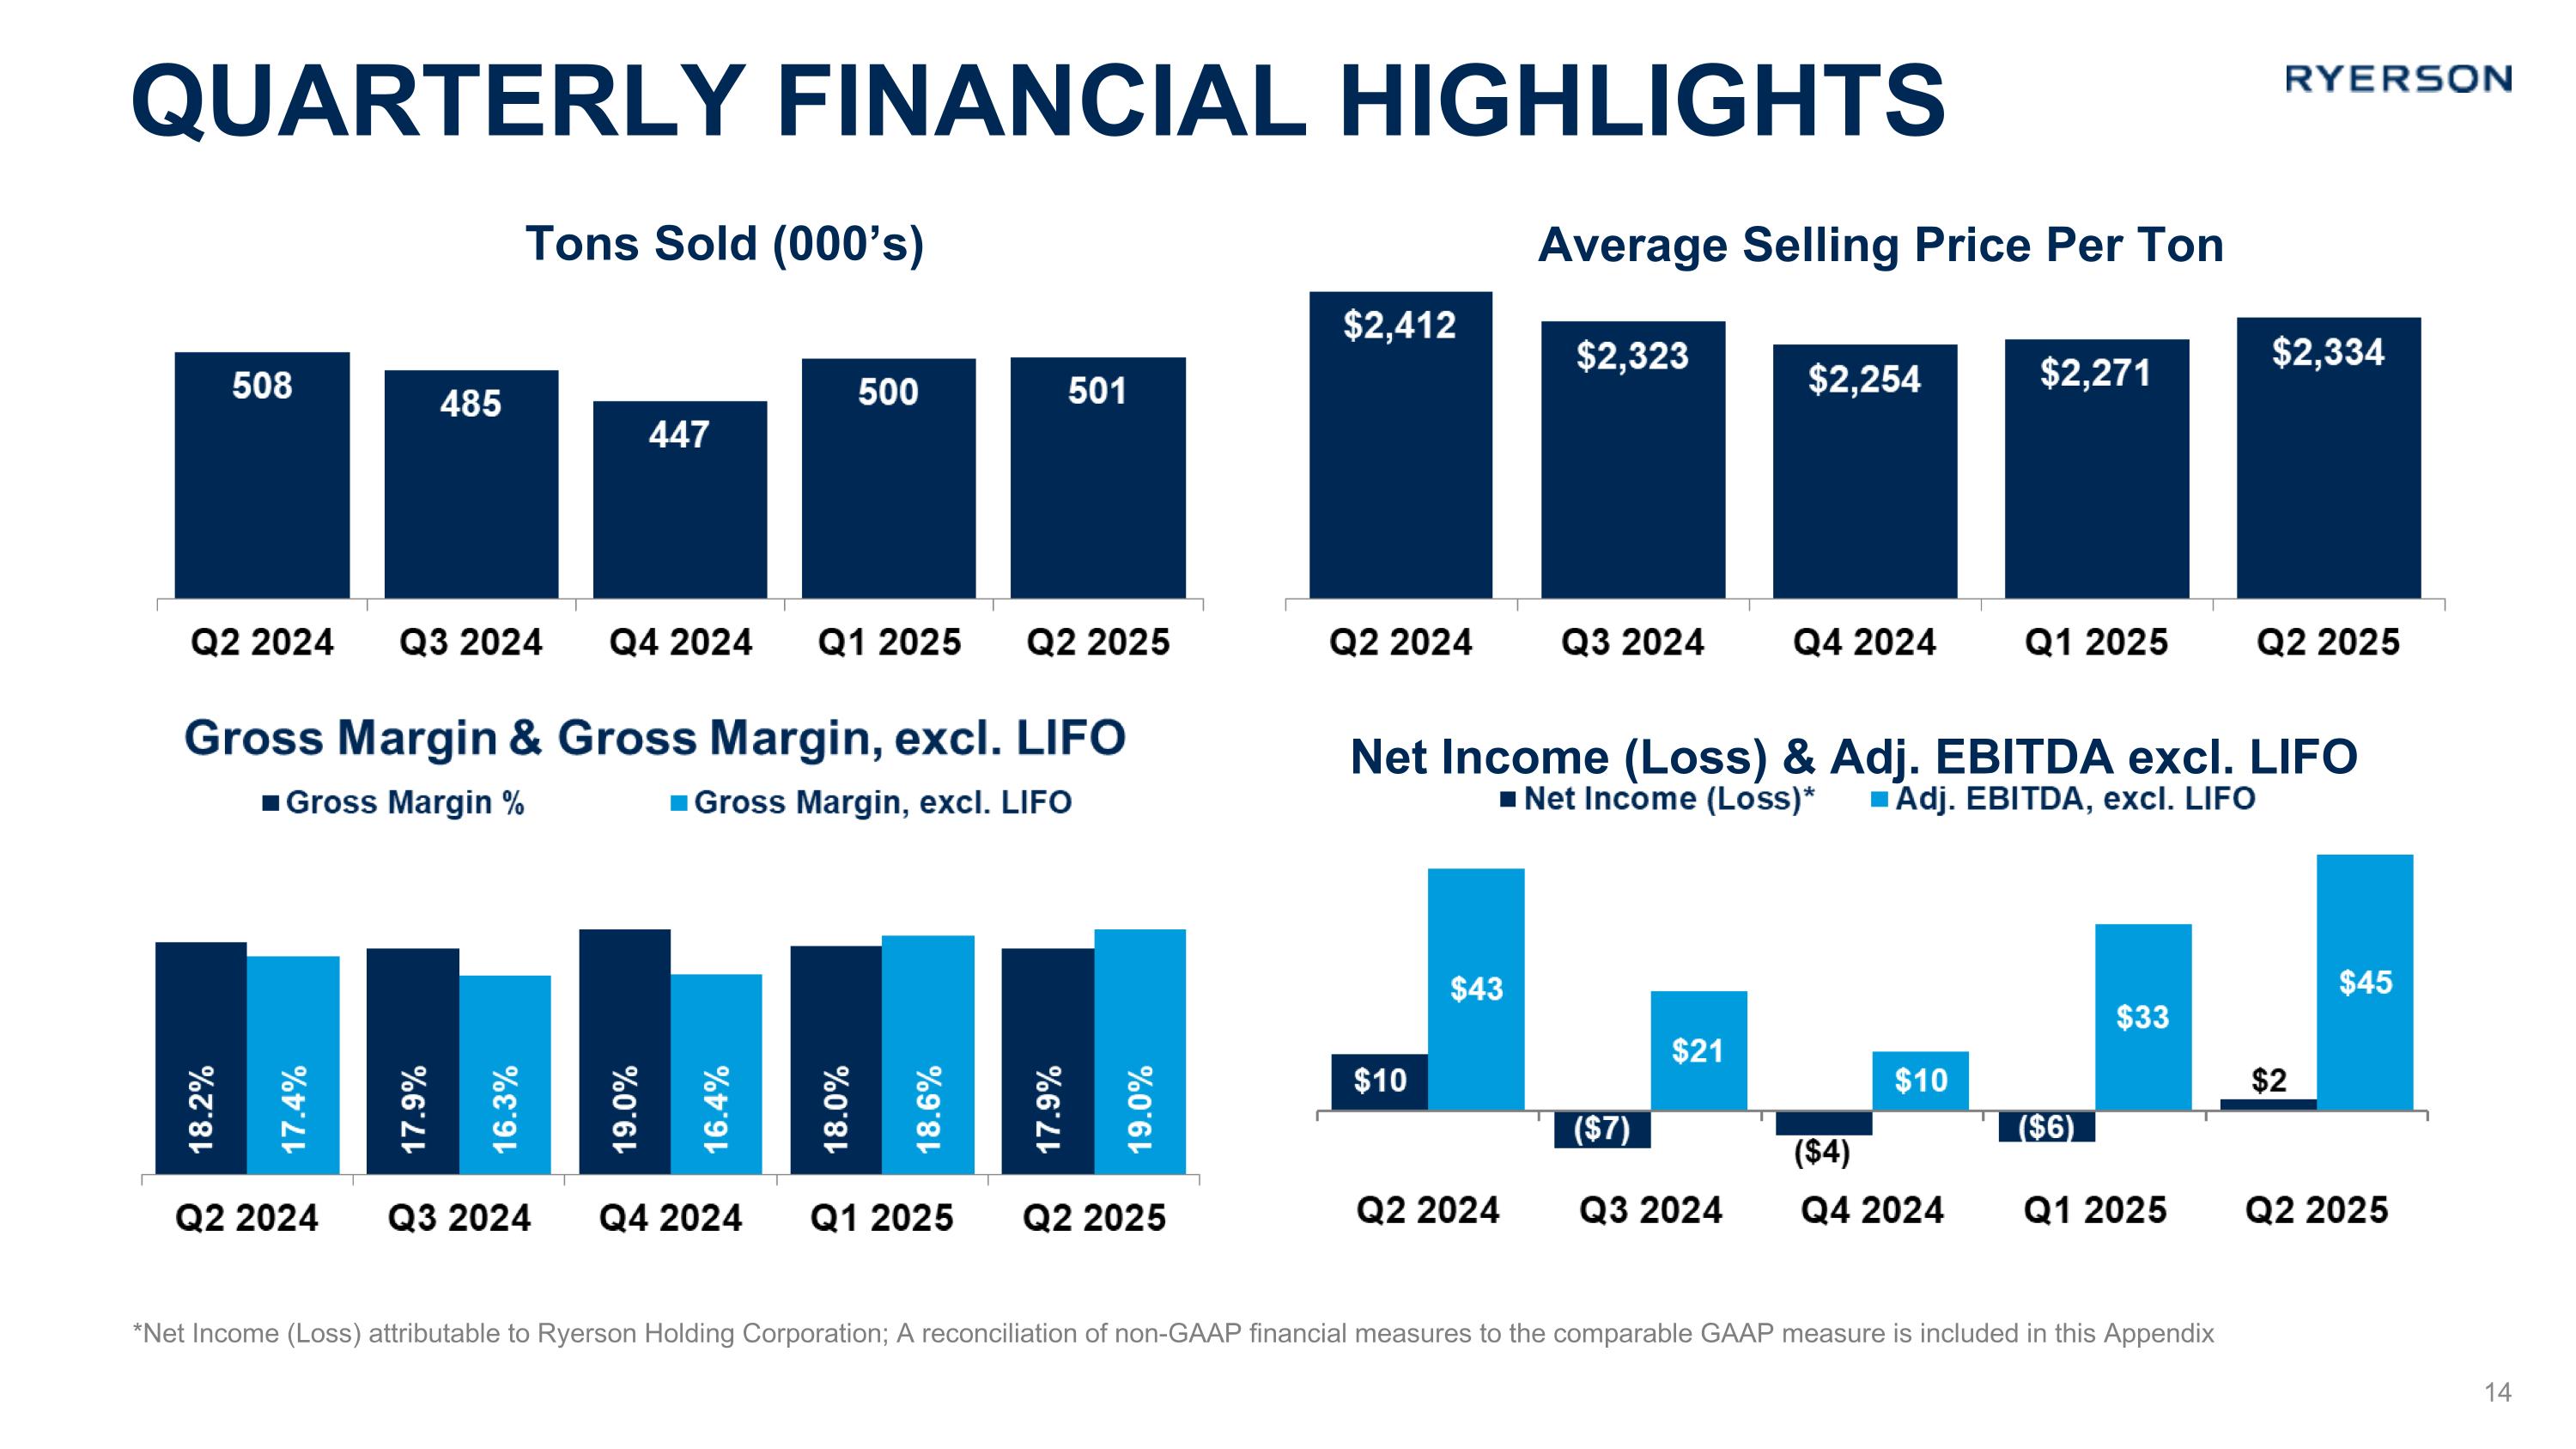
Quarterly financial highlights *Net Income (Loss) attributable to Ryerson Holding Corporation; A reconciliation of non-GAAP financial measures to the comparable GAAP measure is included in this Appendix Average Selling Price Per Ton Tons Sold (000’s) Net Income (Loss) & Adj. EBITDA excl. LIFO
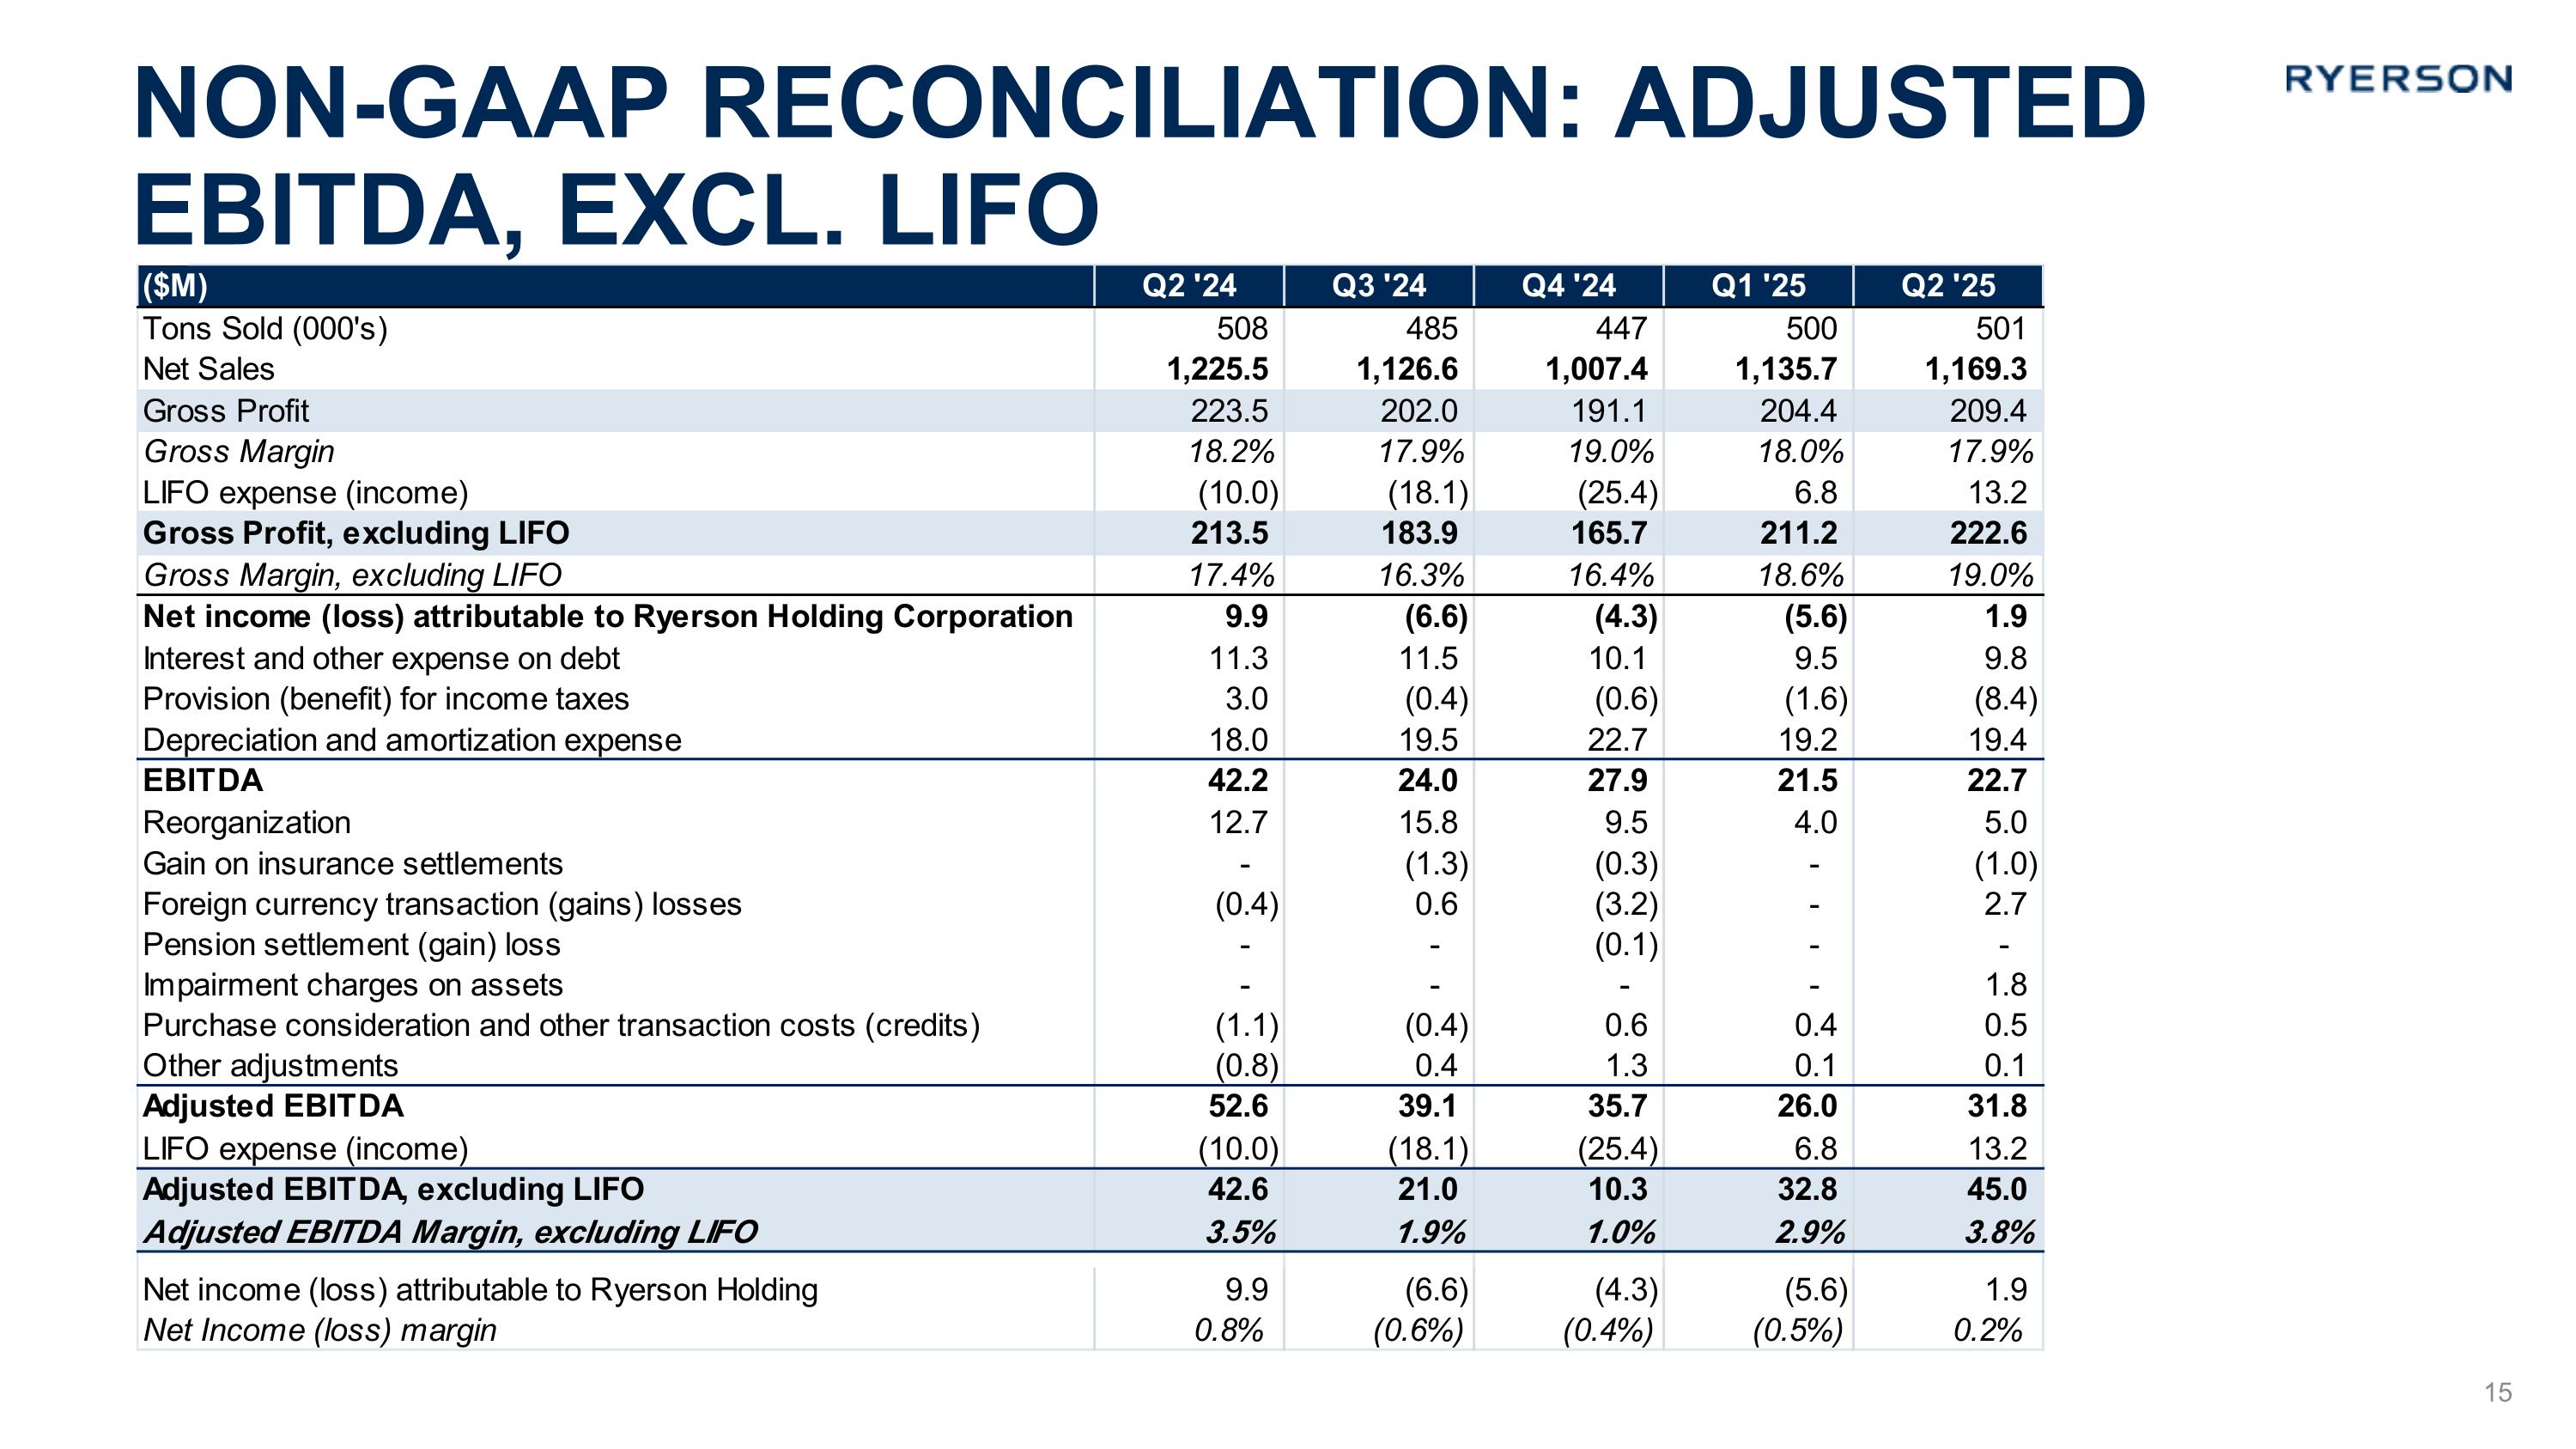
Non-GAAP Reconciliation: Adjusted EBITDA, excl. LIFO 15
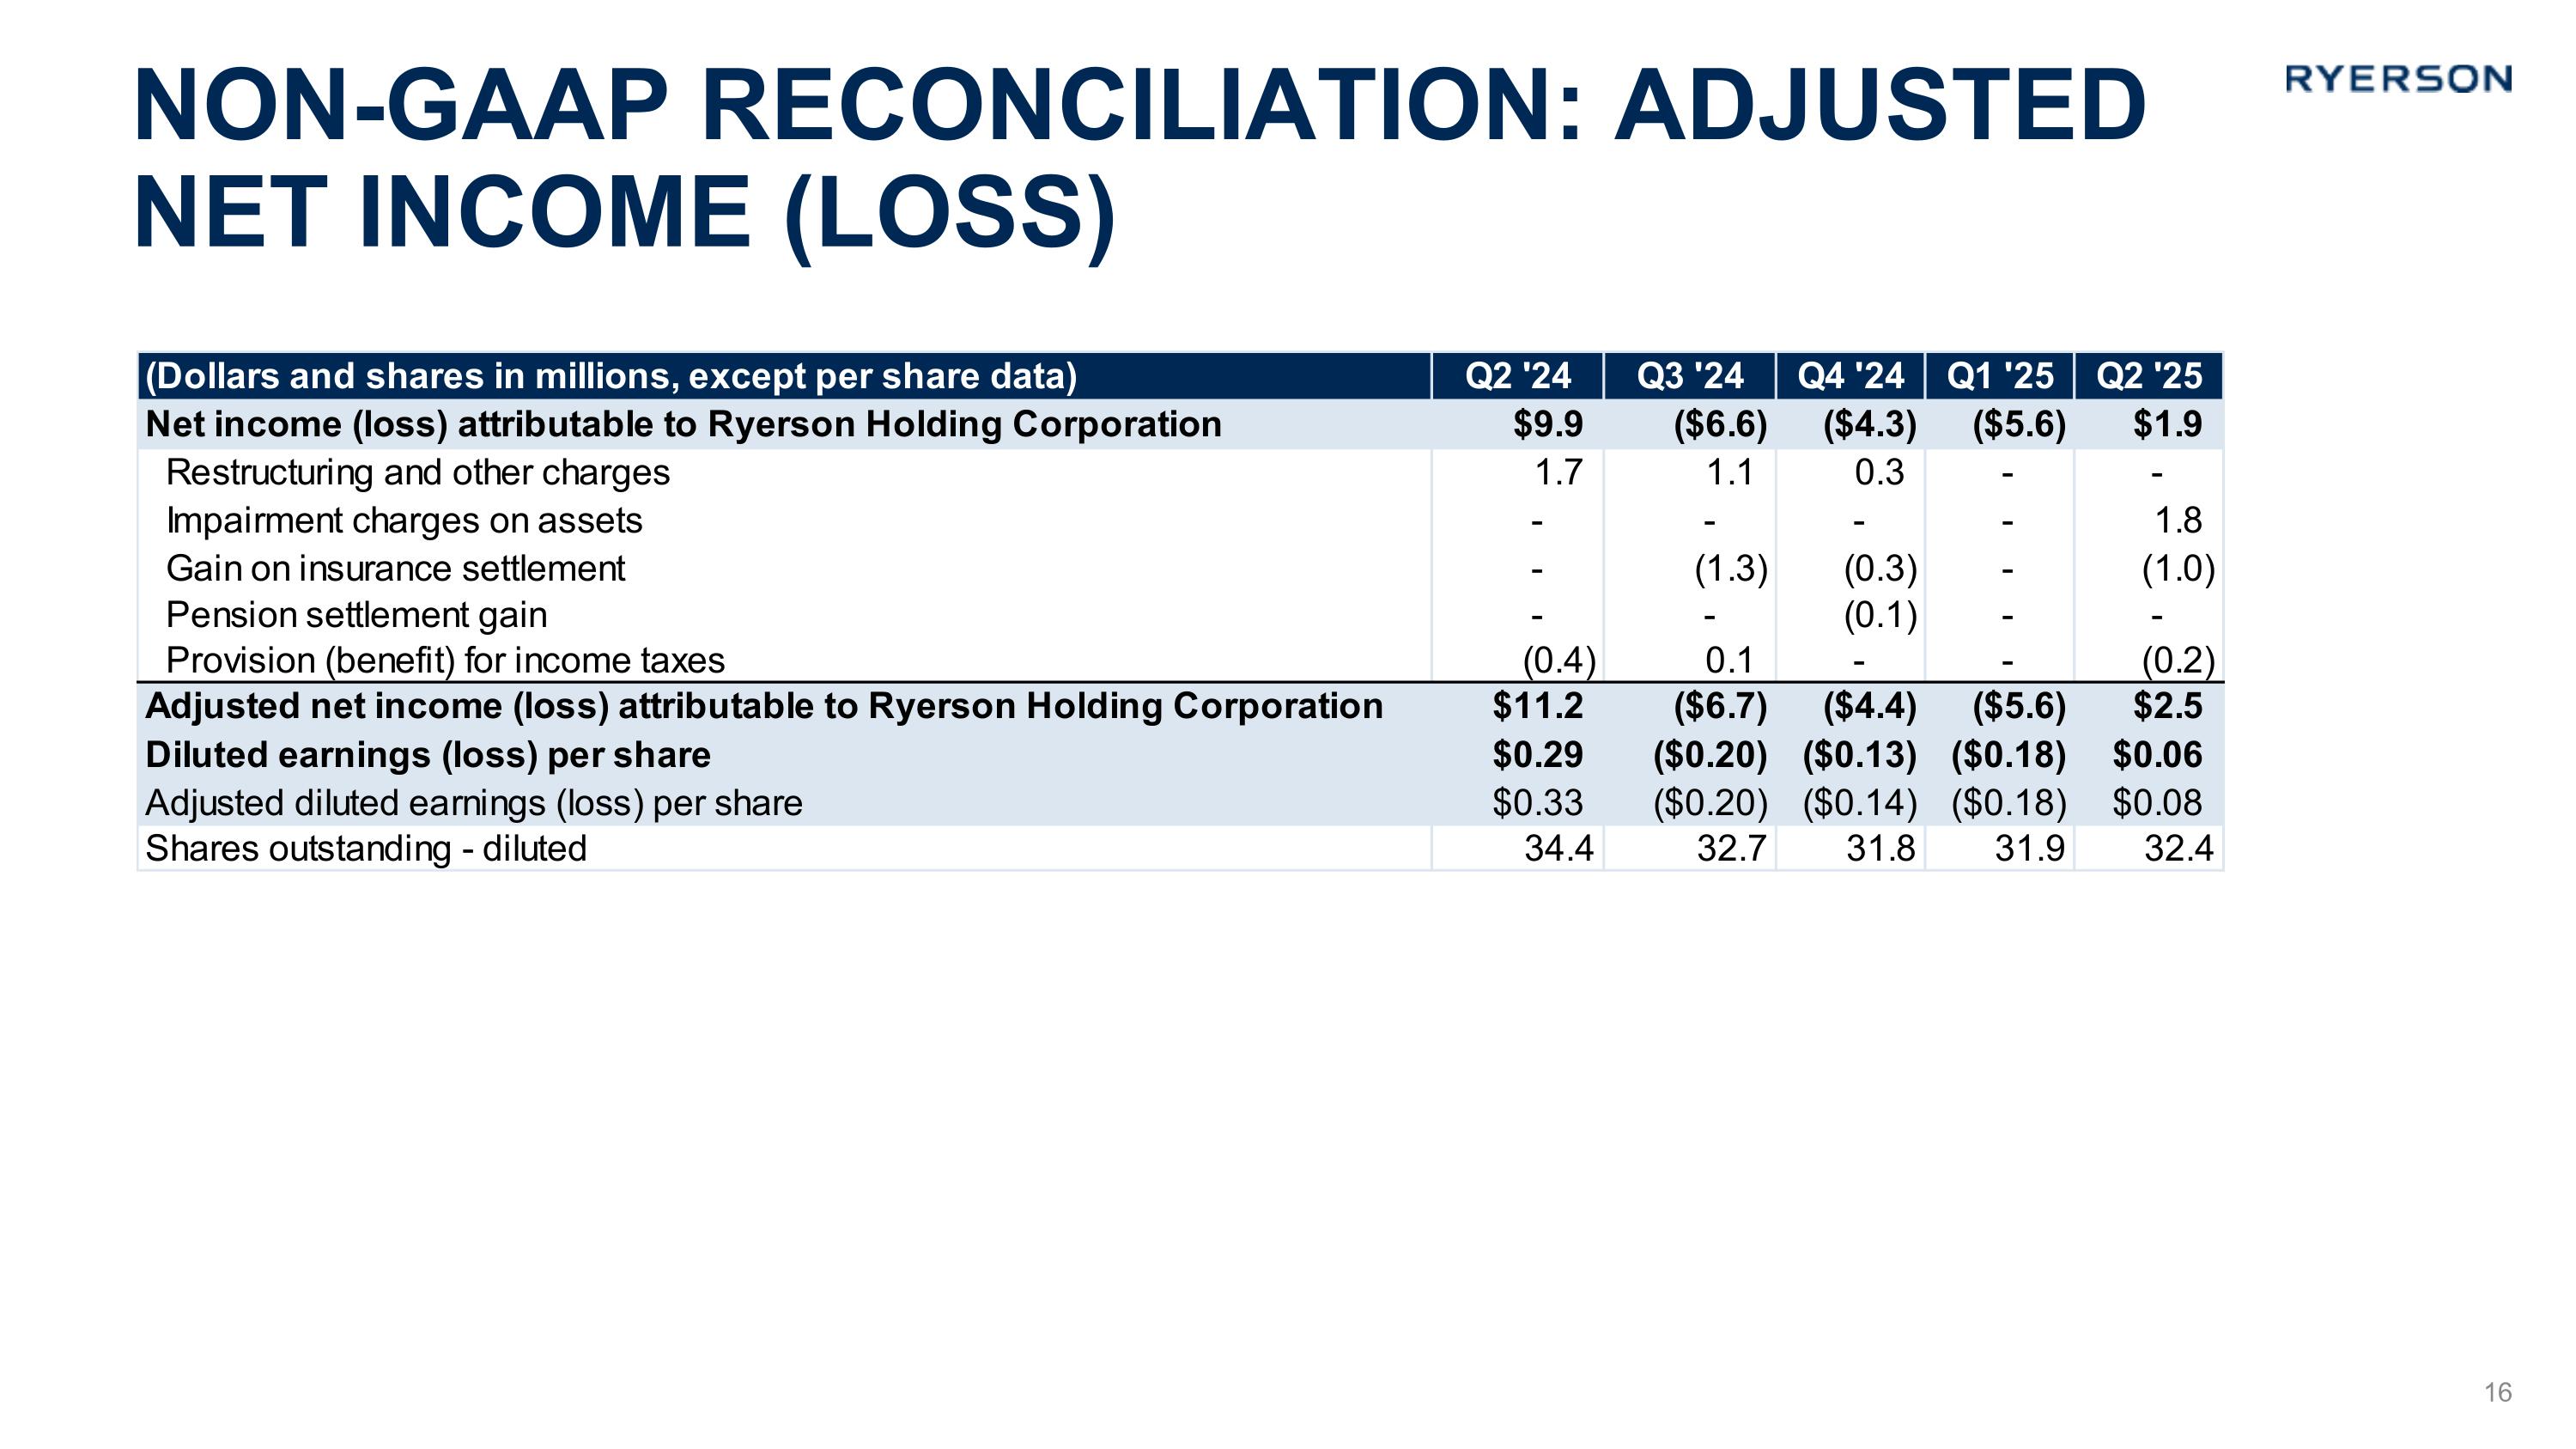
Non-GAAP Reconciliation: Adjusted Net Income (loss) 16
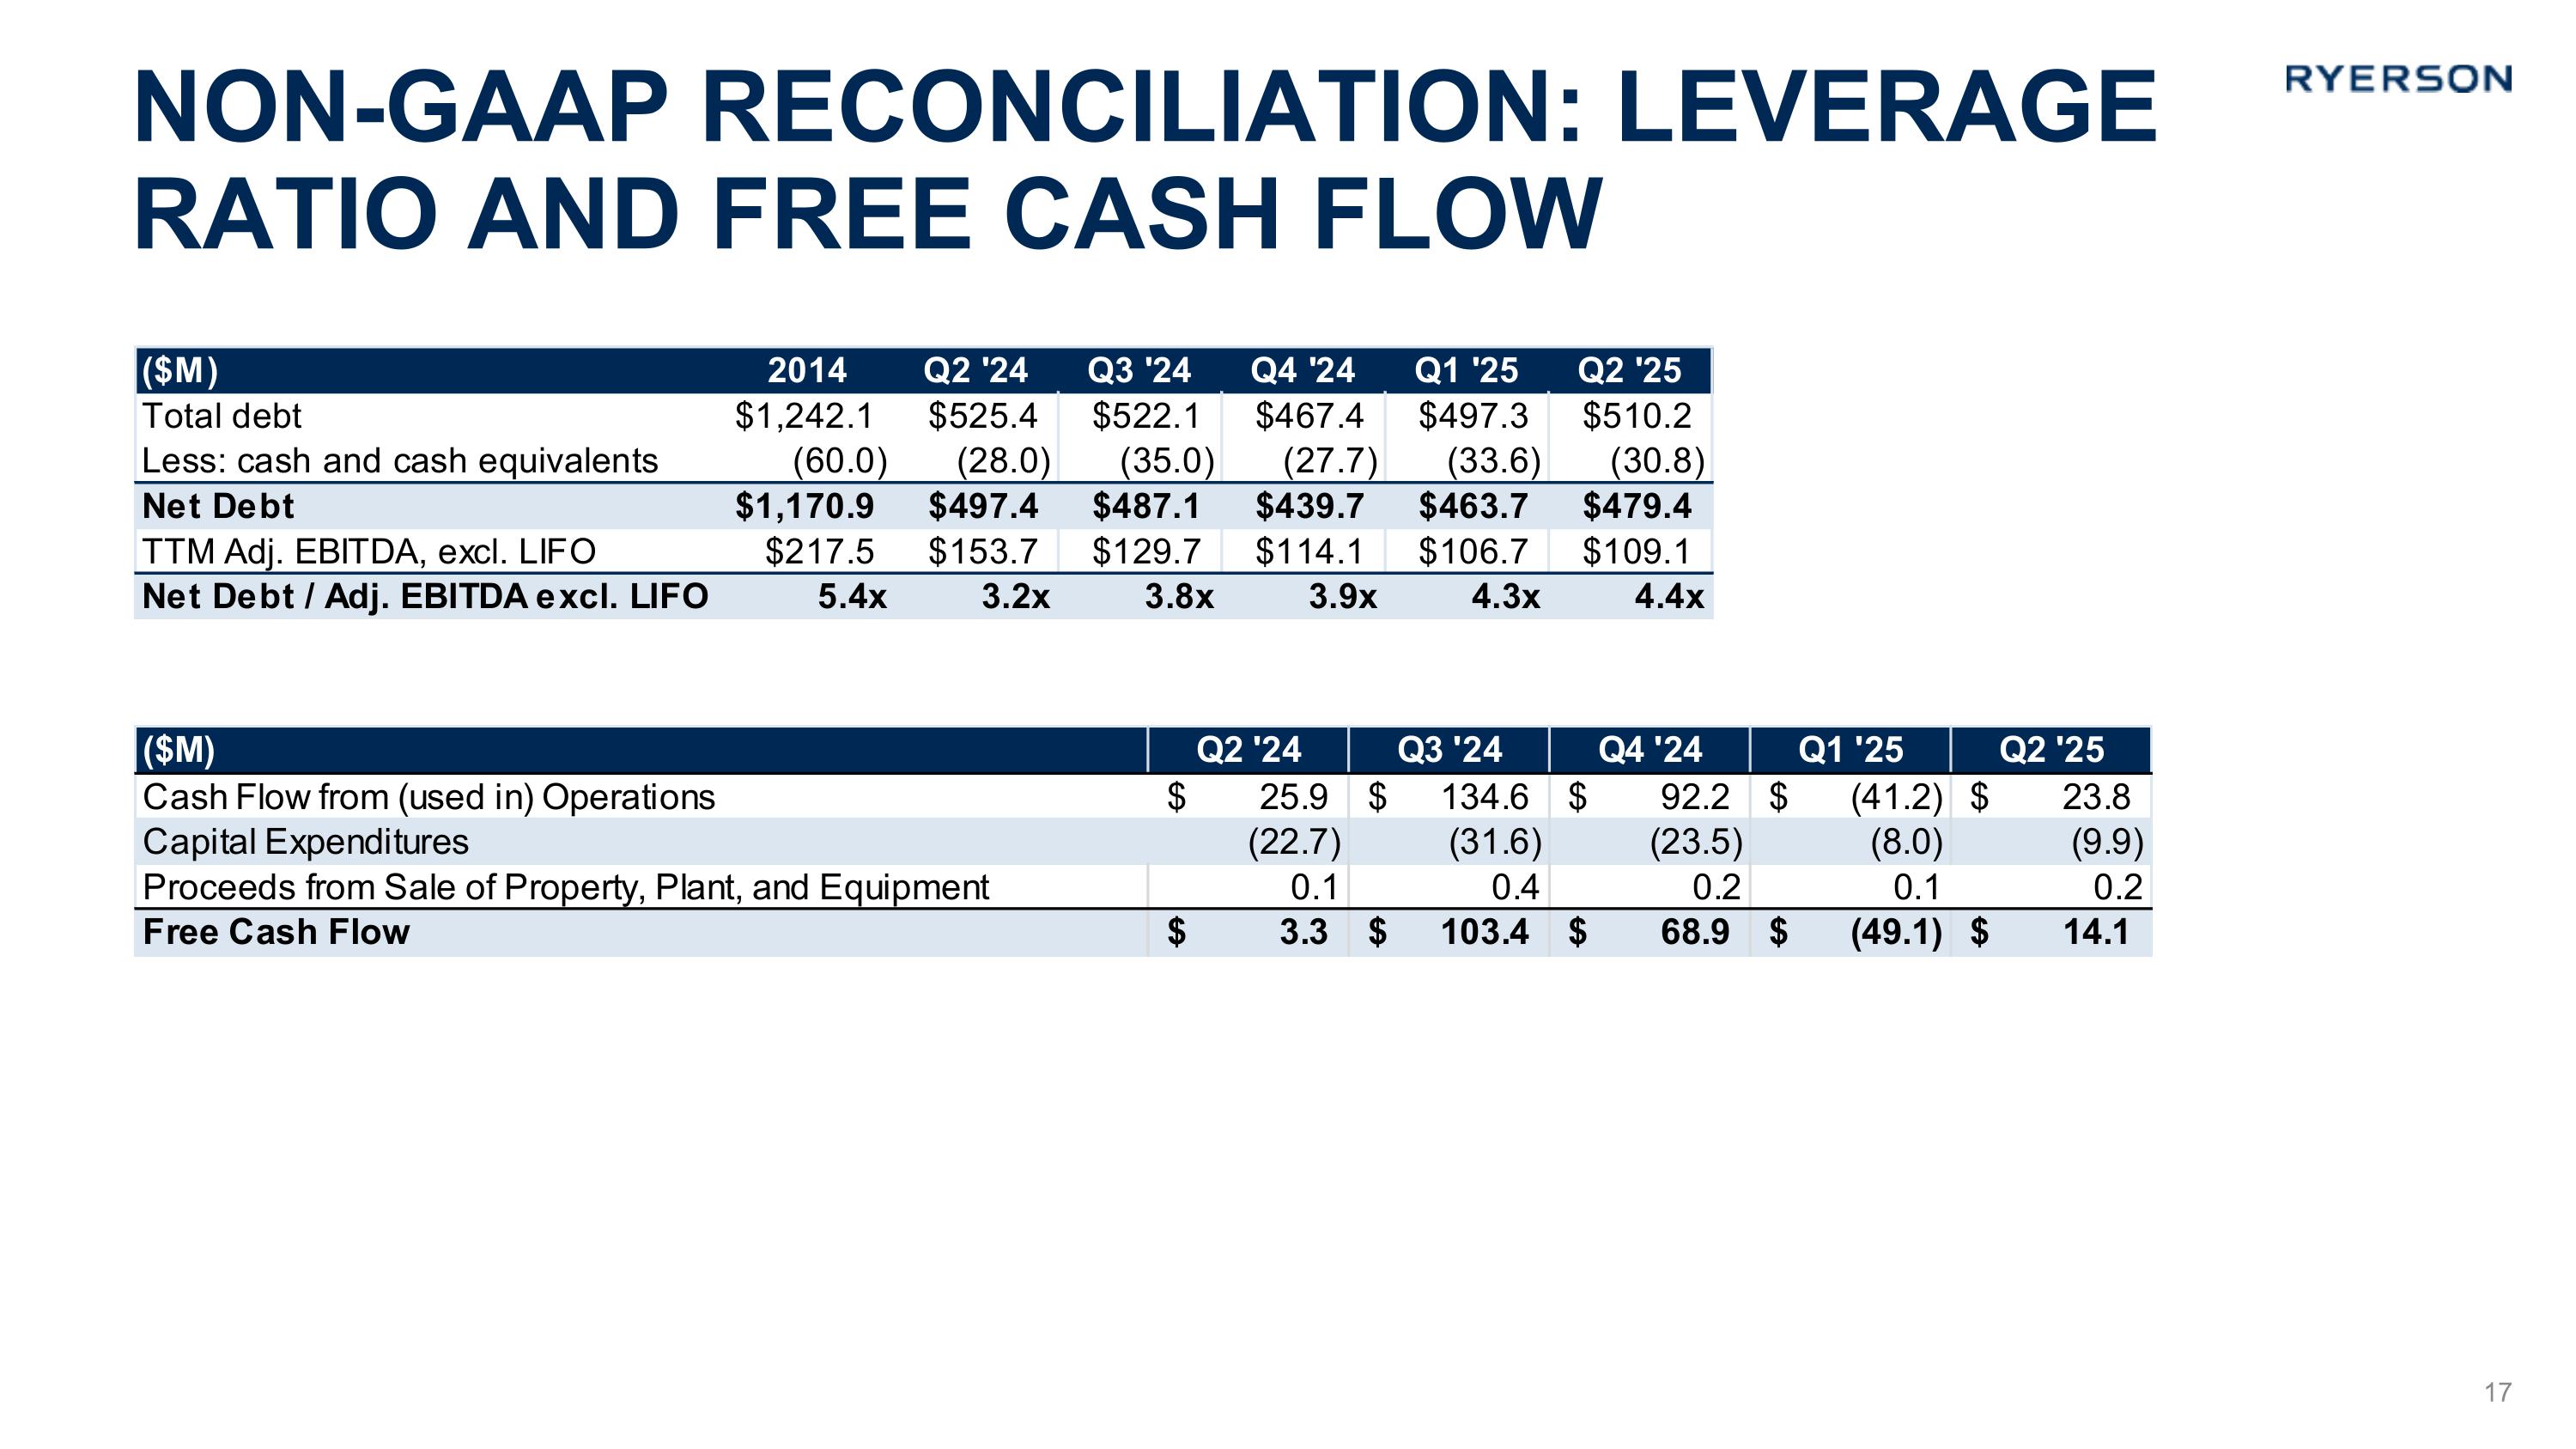
Non-GAAP Reconciliation: leverage ratio and Free cash flow 17
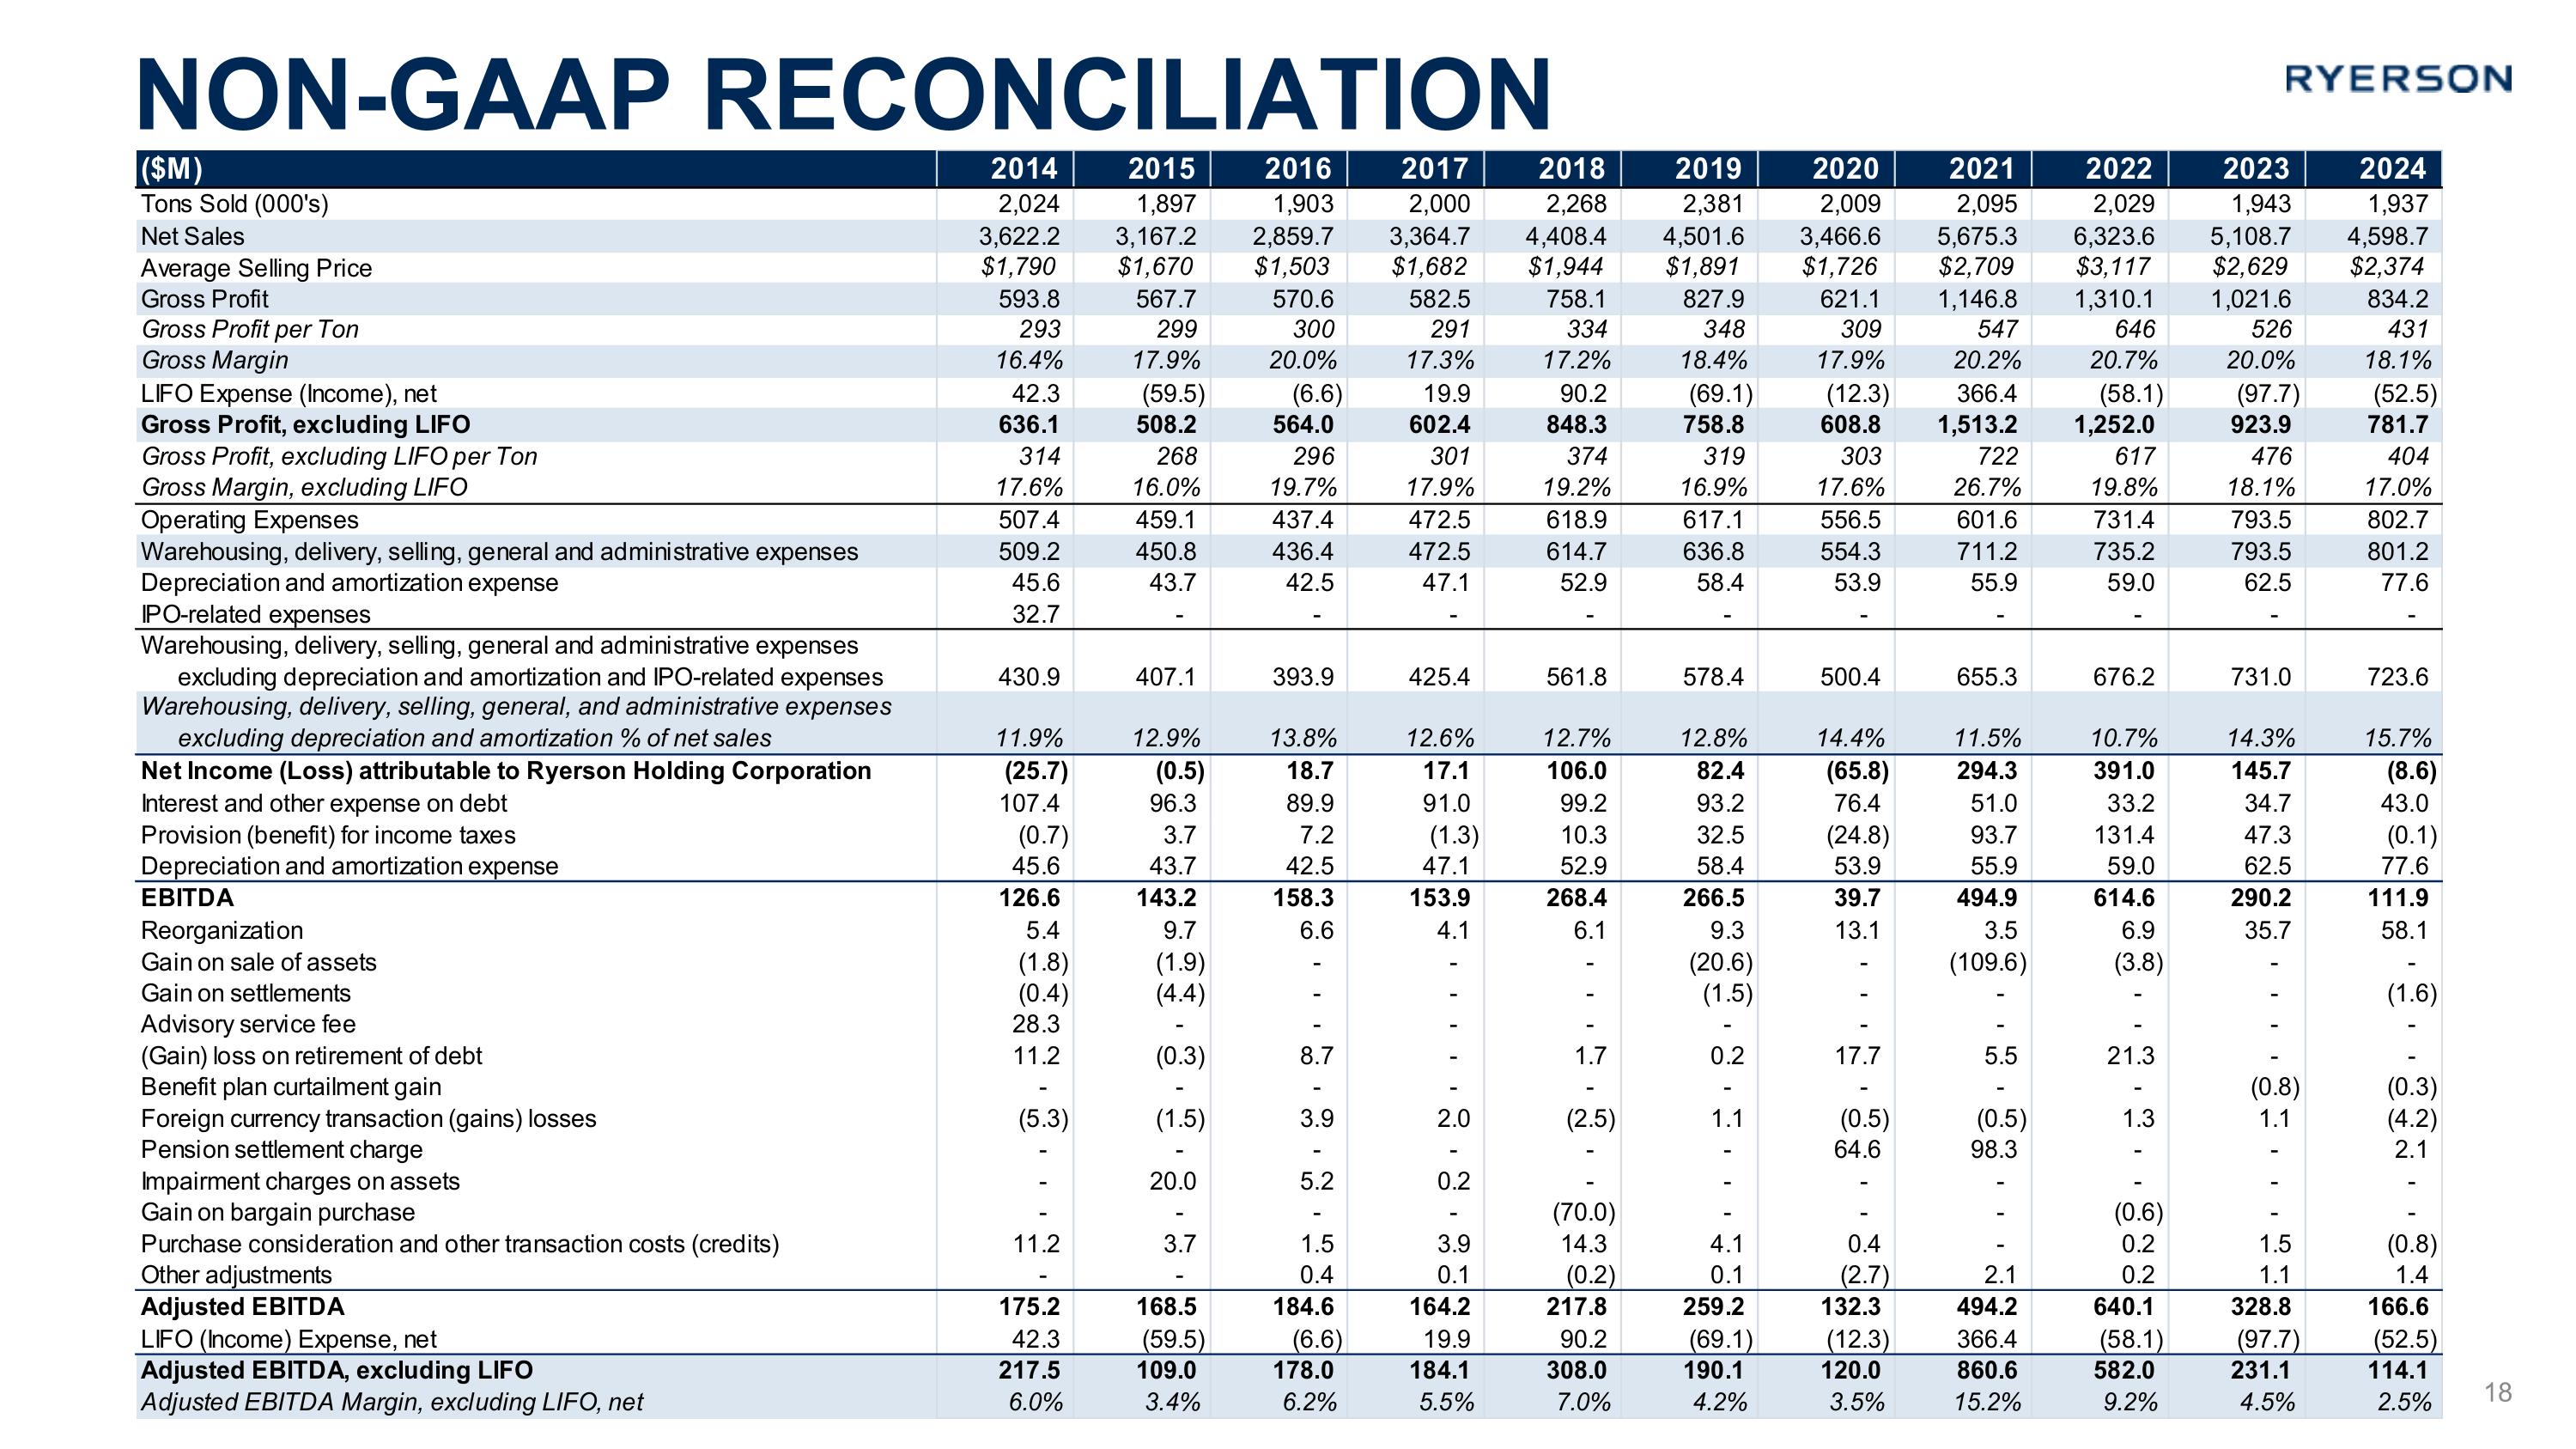
Non-GAAP Reconciliation 18
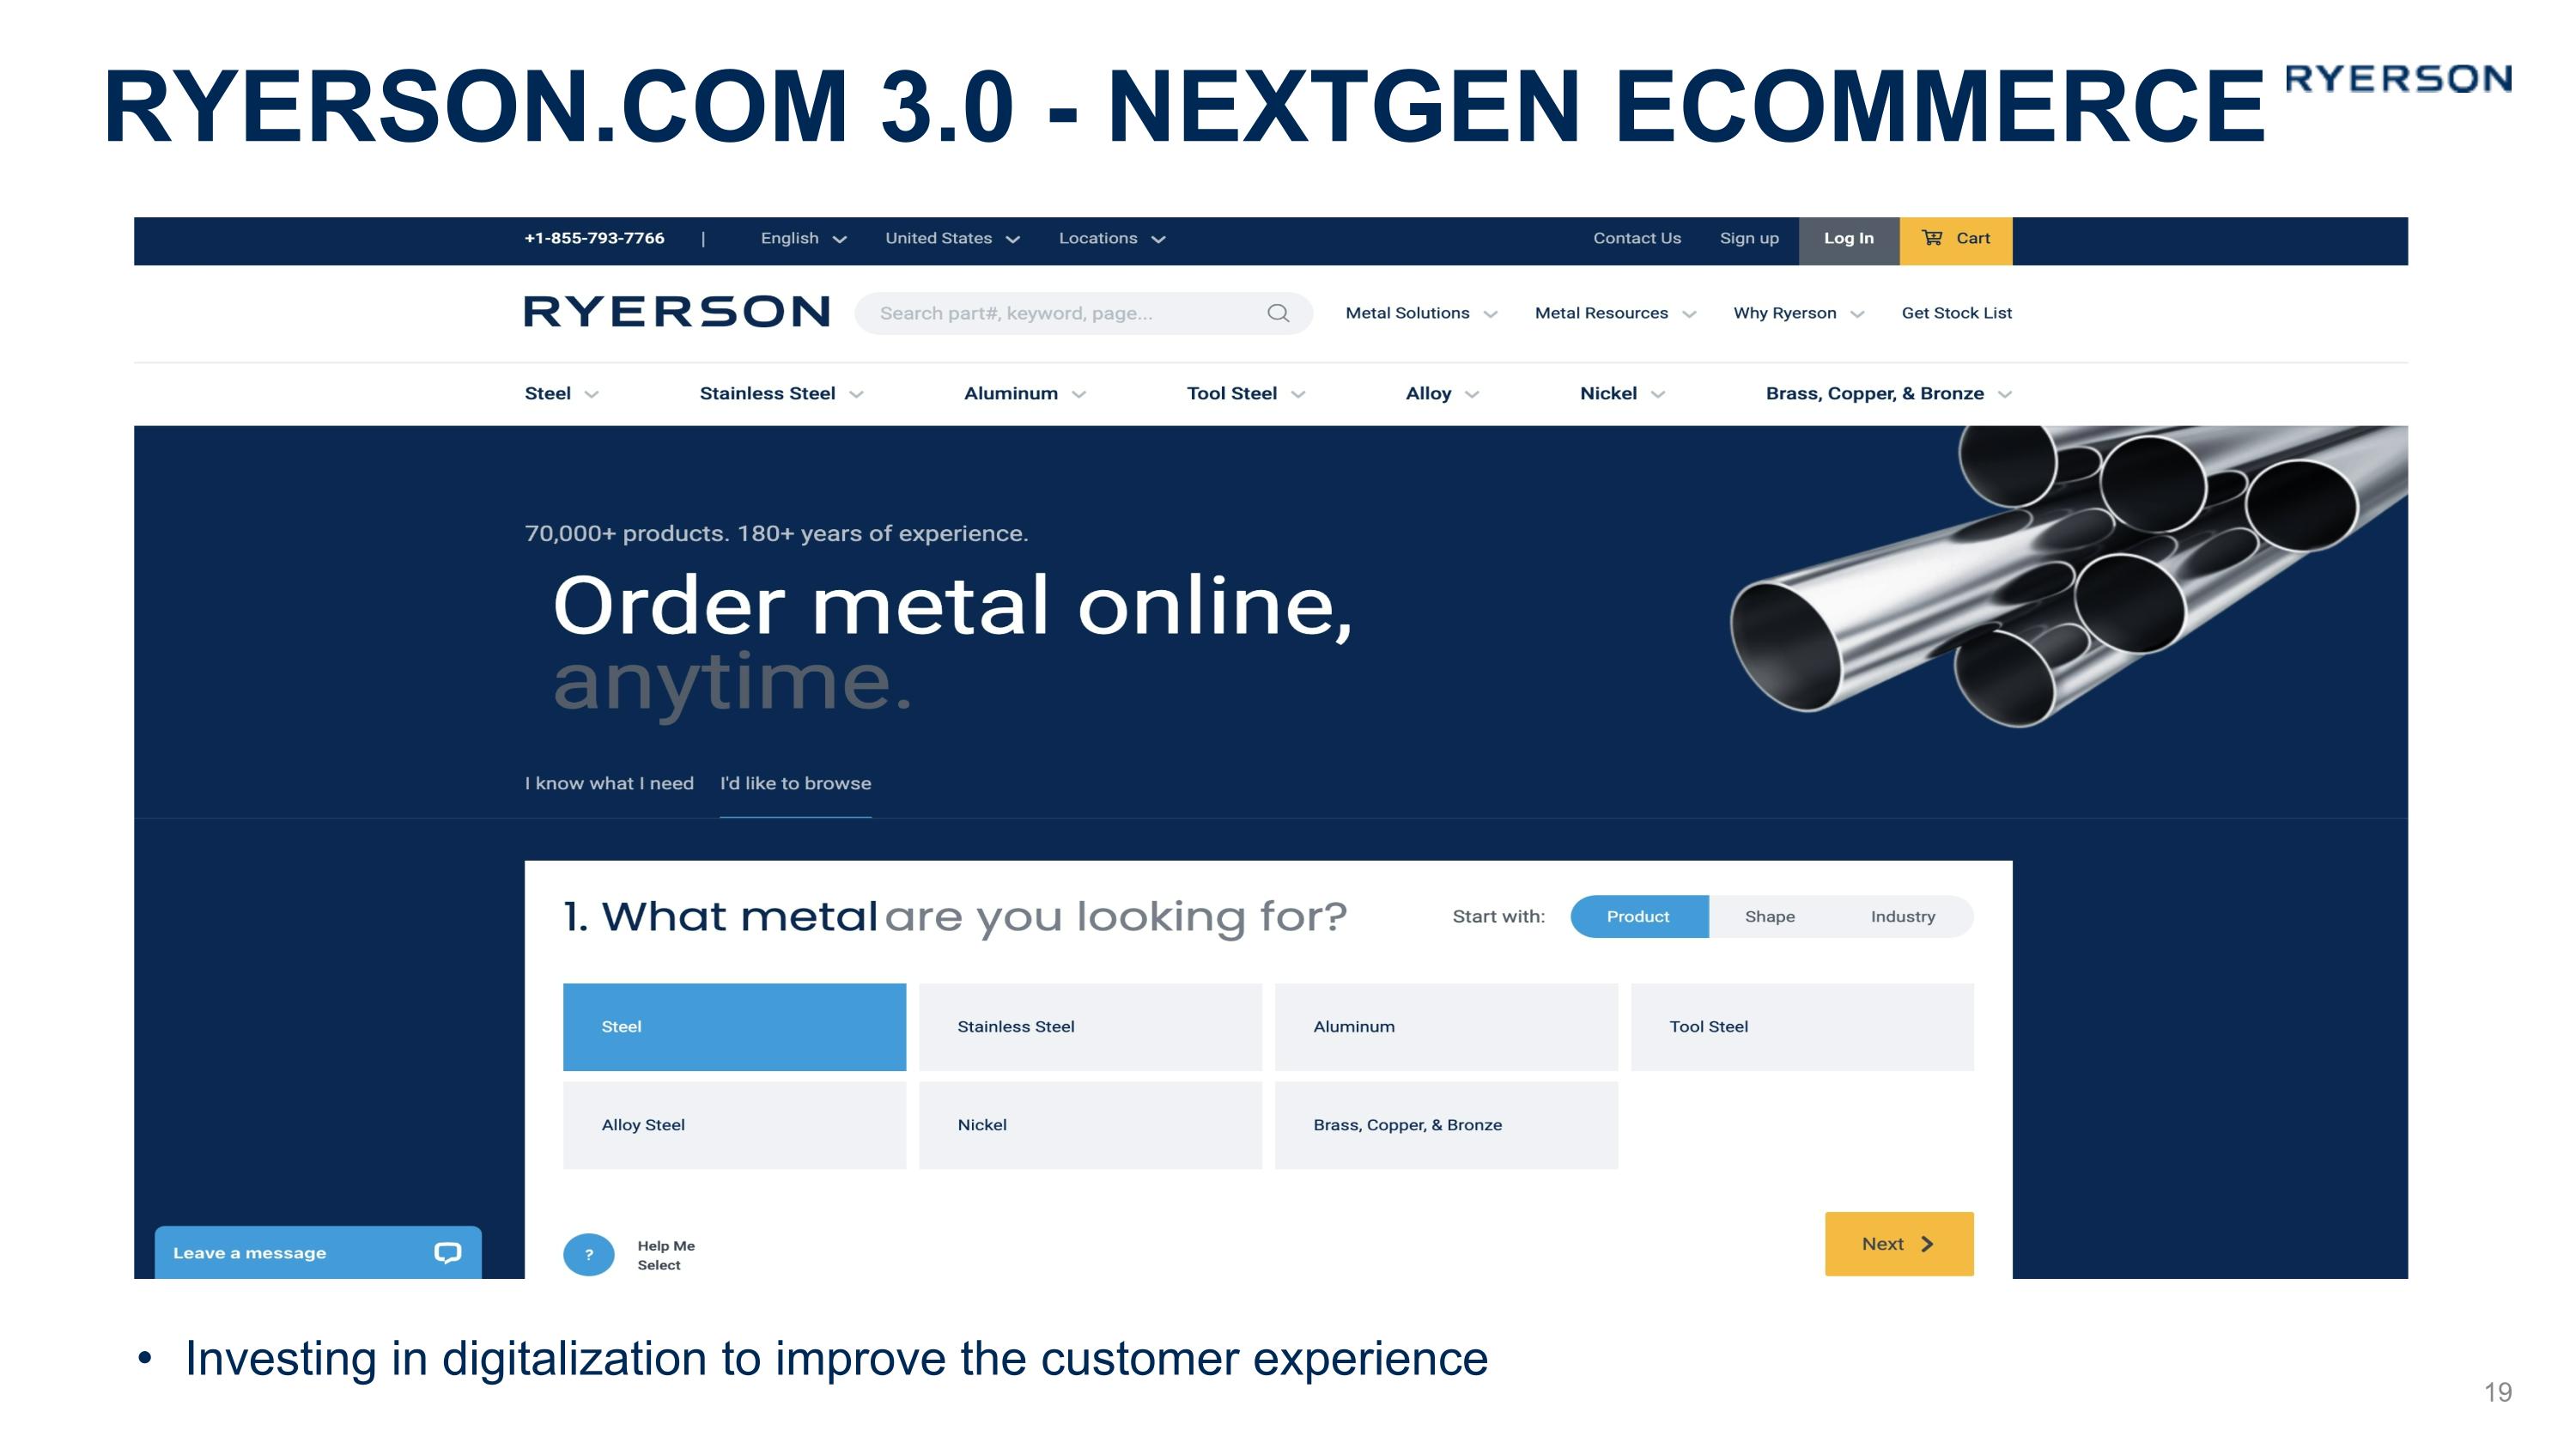
Ryerson.com 3.0 - NextGen ECommerce Investing in digitalization to improve the customer experience 19
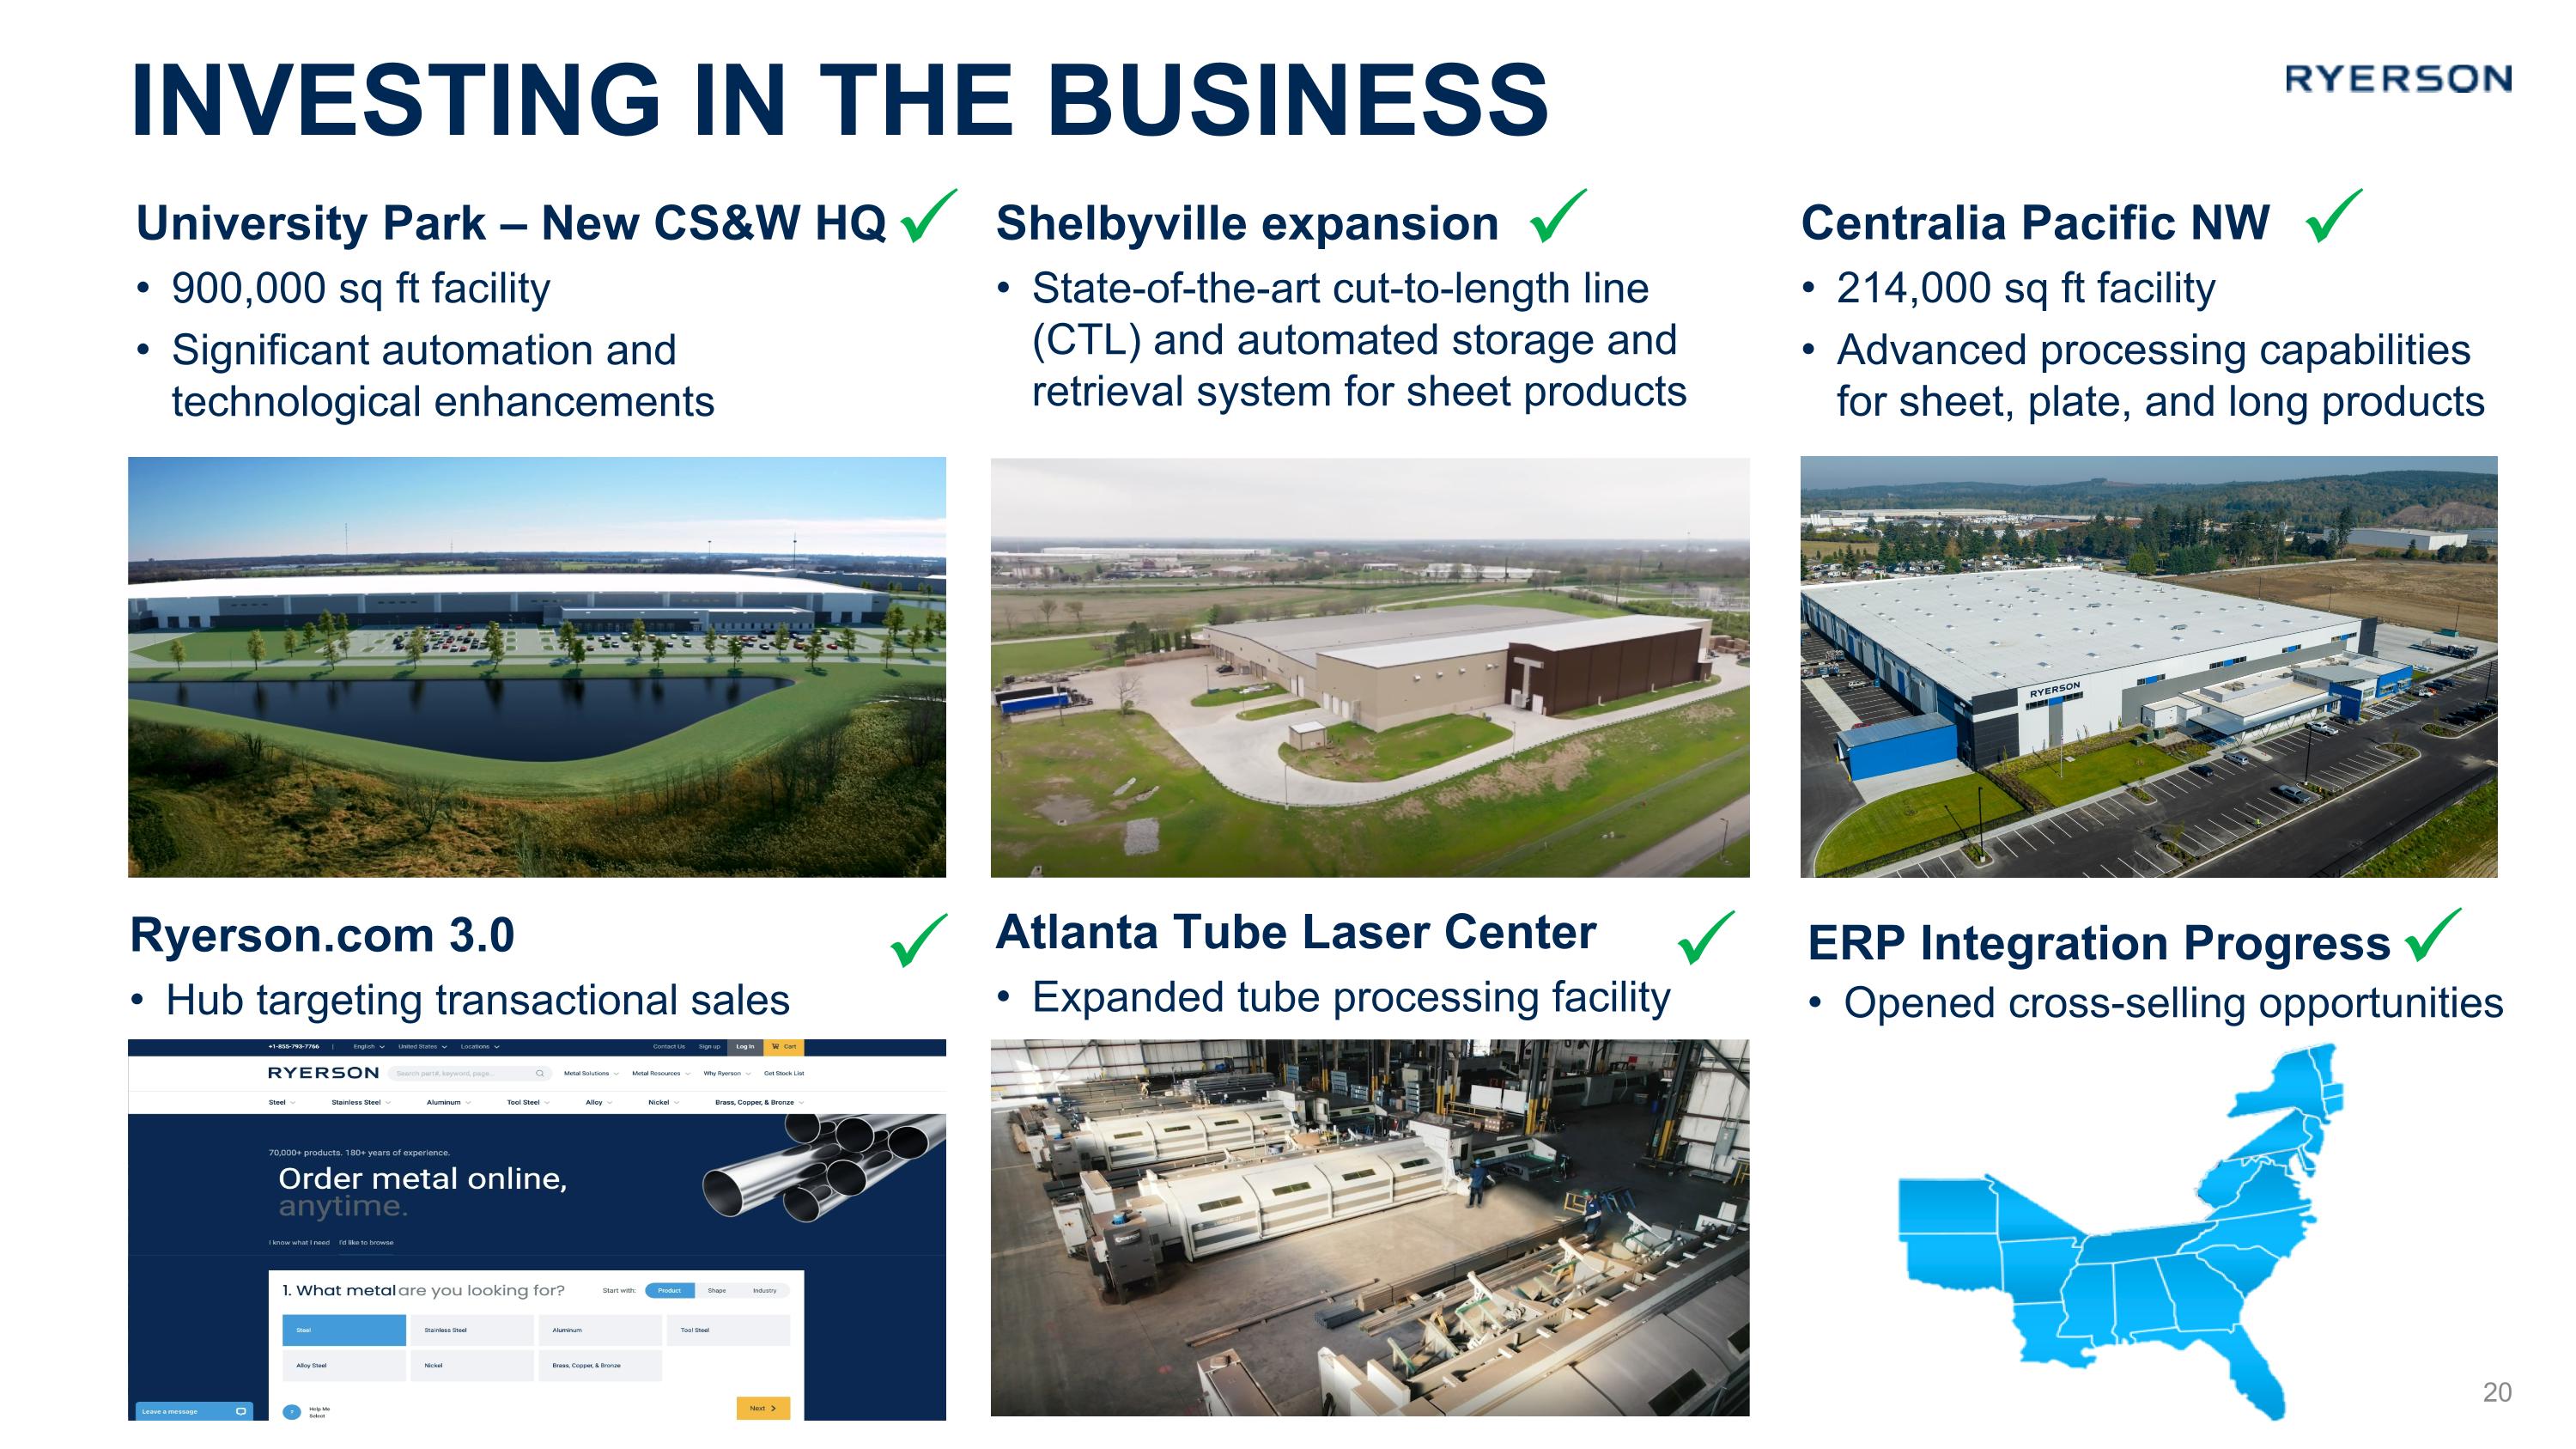
University Park – New CS&W HQ 900,000 sq ft facility Significant automation and technological enhancements Investing IN the Business West Shelbyville expansion State-of-the-art cut-to-length line (CTL) and automated storage and retrieval system for sheet products Centralia Pacific NW 214,000 sq ft facility Advanced processing capabilities for sheet, plate, and long products Ryerson.com 3.0 Hub targeting transactional sales Atlanta Tube Laser Center Expanded tube processing facility ERP Integration Progress Opened cross-selling opportunities 20
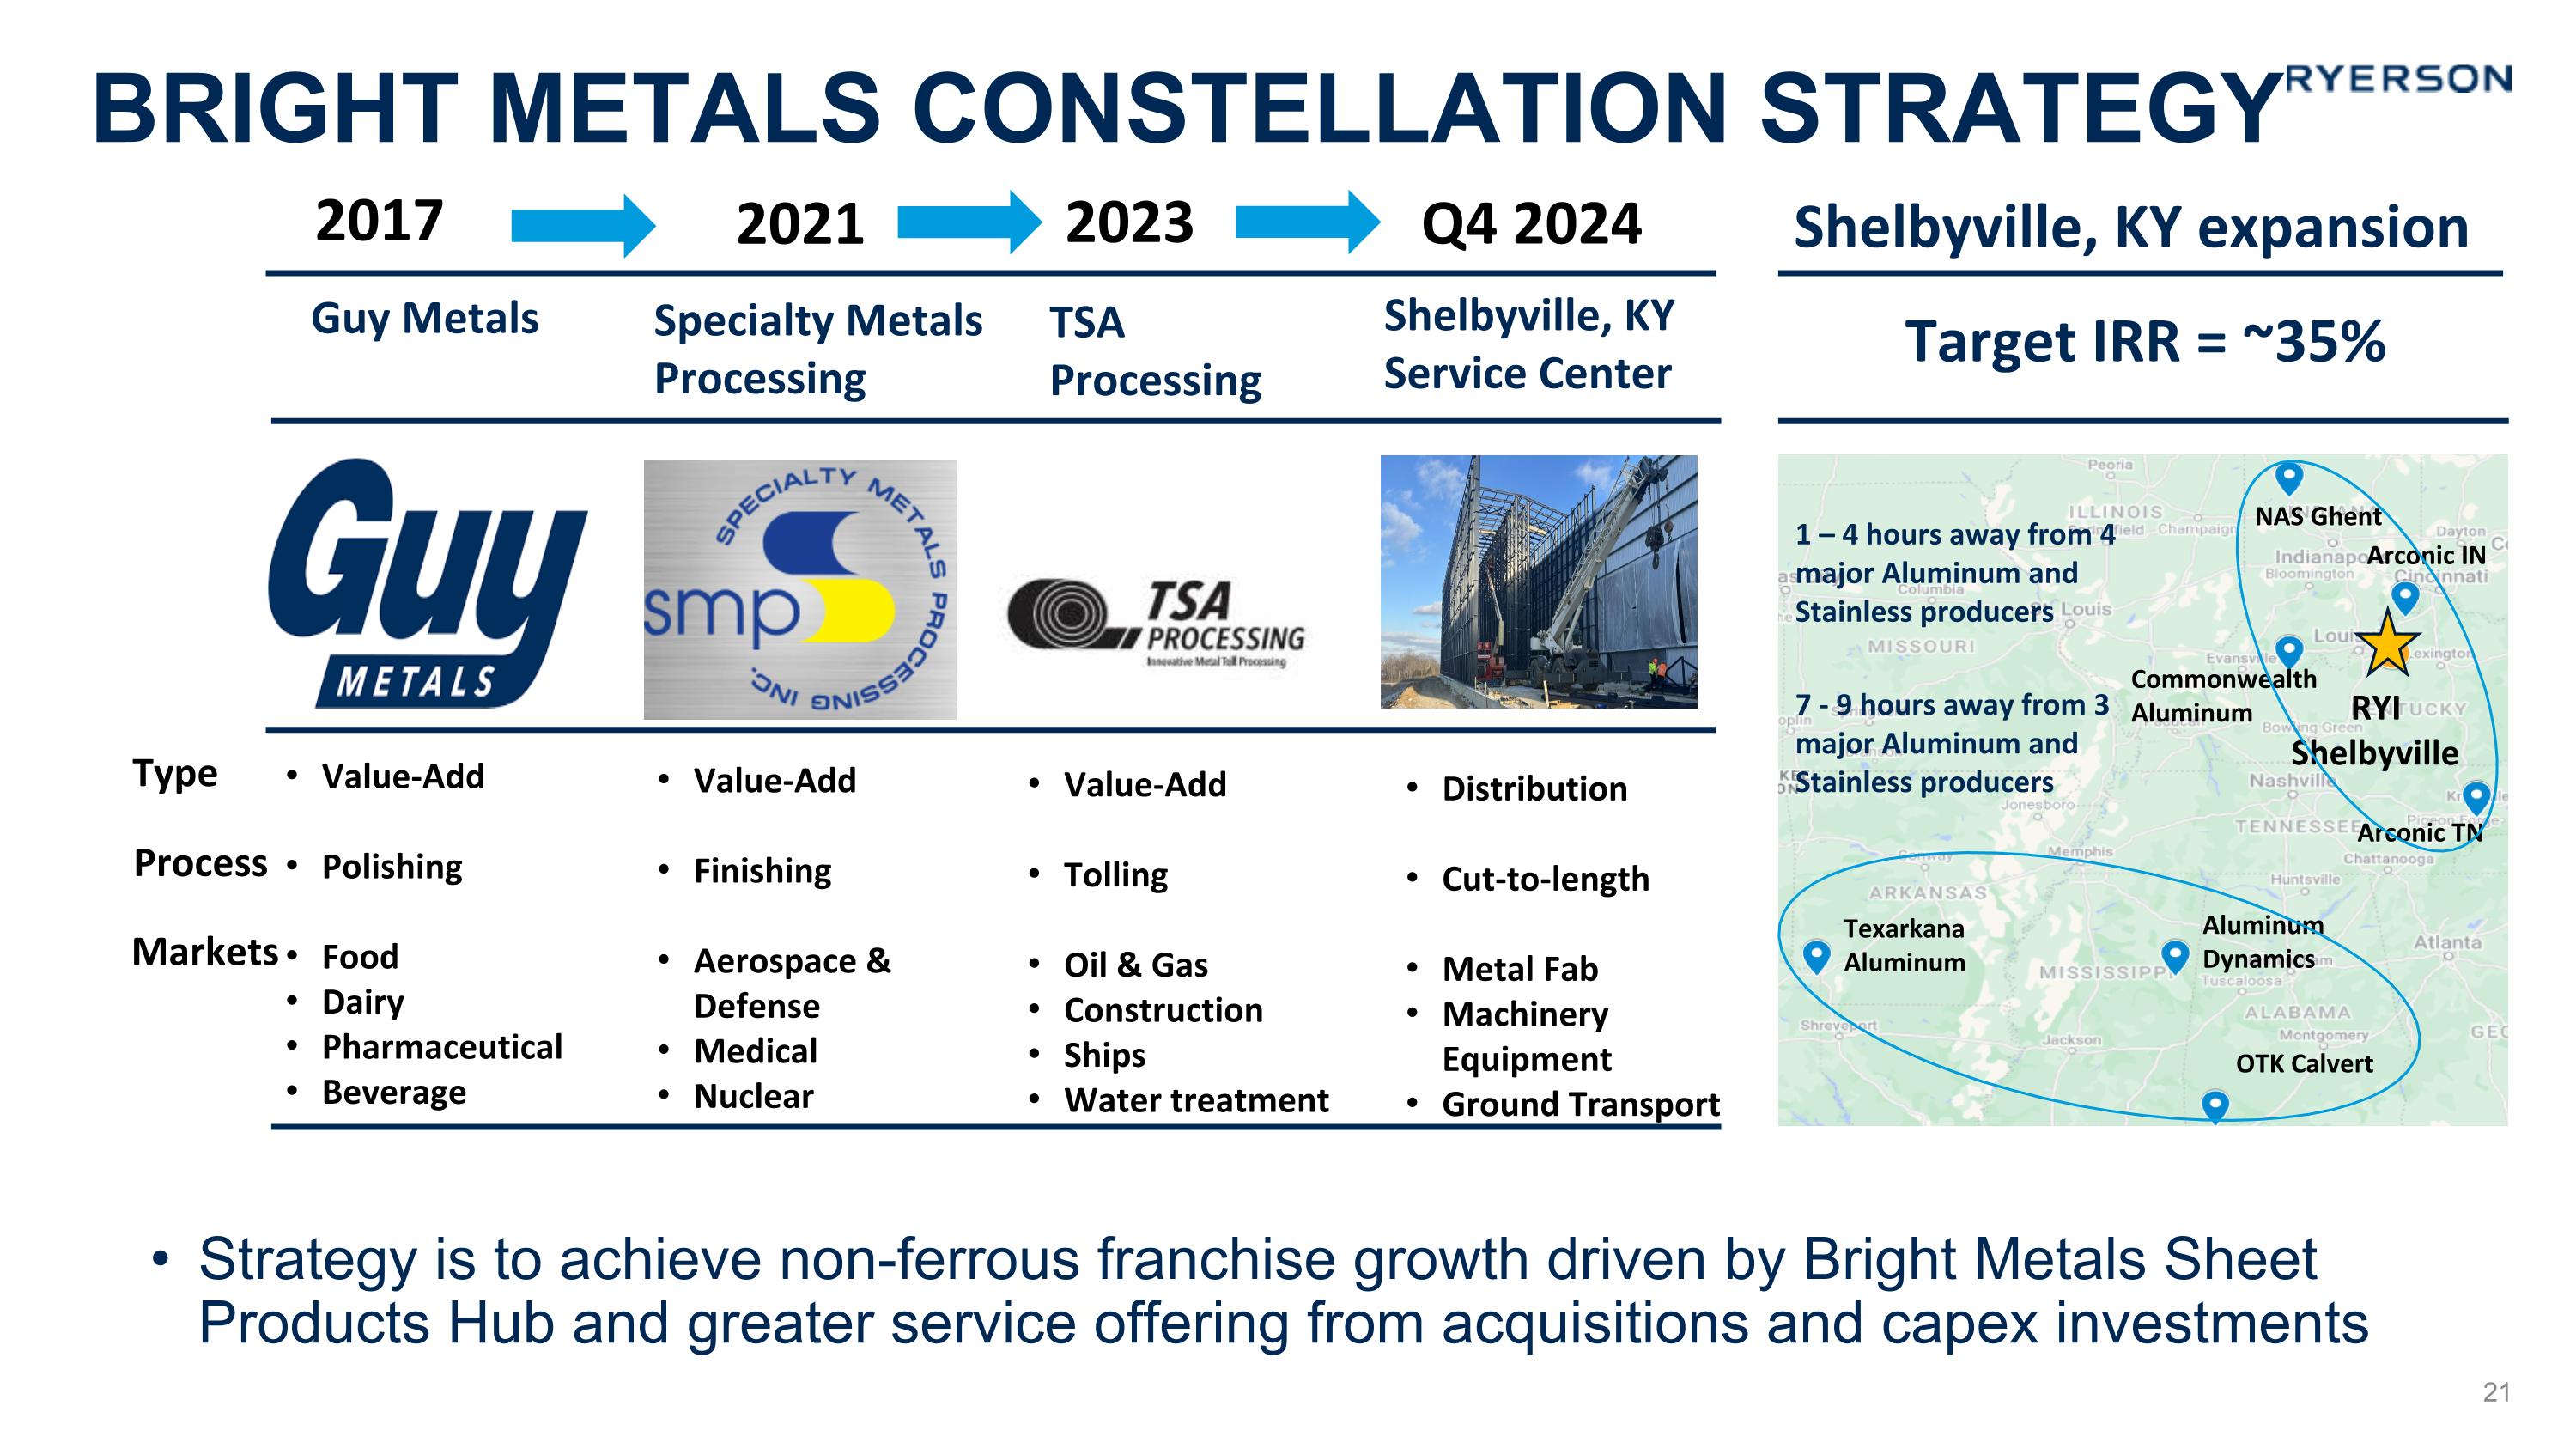
Strategy is to achieve non-ferrous franchise growth driven by Bright Metals Sheet Products Hub and greater service offering from acquisitions and capex investments Bright metals Constellation Strategy Value-Add Polishing Food Dairy Pharmaceutical Beverage 2017 2021 2023 Q4 2024 OTK Calvert NAS Ghent Arconic IN Commonwealth Aluminum RYI Shelbyville Aluminum�Dynamics Arconic TN Texarkana Aluminum 1 – 4 hours away from 4 major Aluminum and Stainless producers 7 - 9 hours away from 3 major Aluminum and Stainless producers Guy Metals Specialty Metals Processing TSA Processing Shelbyville, KY Service Center Value-Add Finishing Aerospace & Defense Medical Nuclear Value-Add Tolling Oil & Gas Construction Ships Water treatment Distribution Cut-to-length Metal Fab Machinery Equipment Ground Transport Shelbyville, KY expansion Target IRR = ~35% Process Markets Type
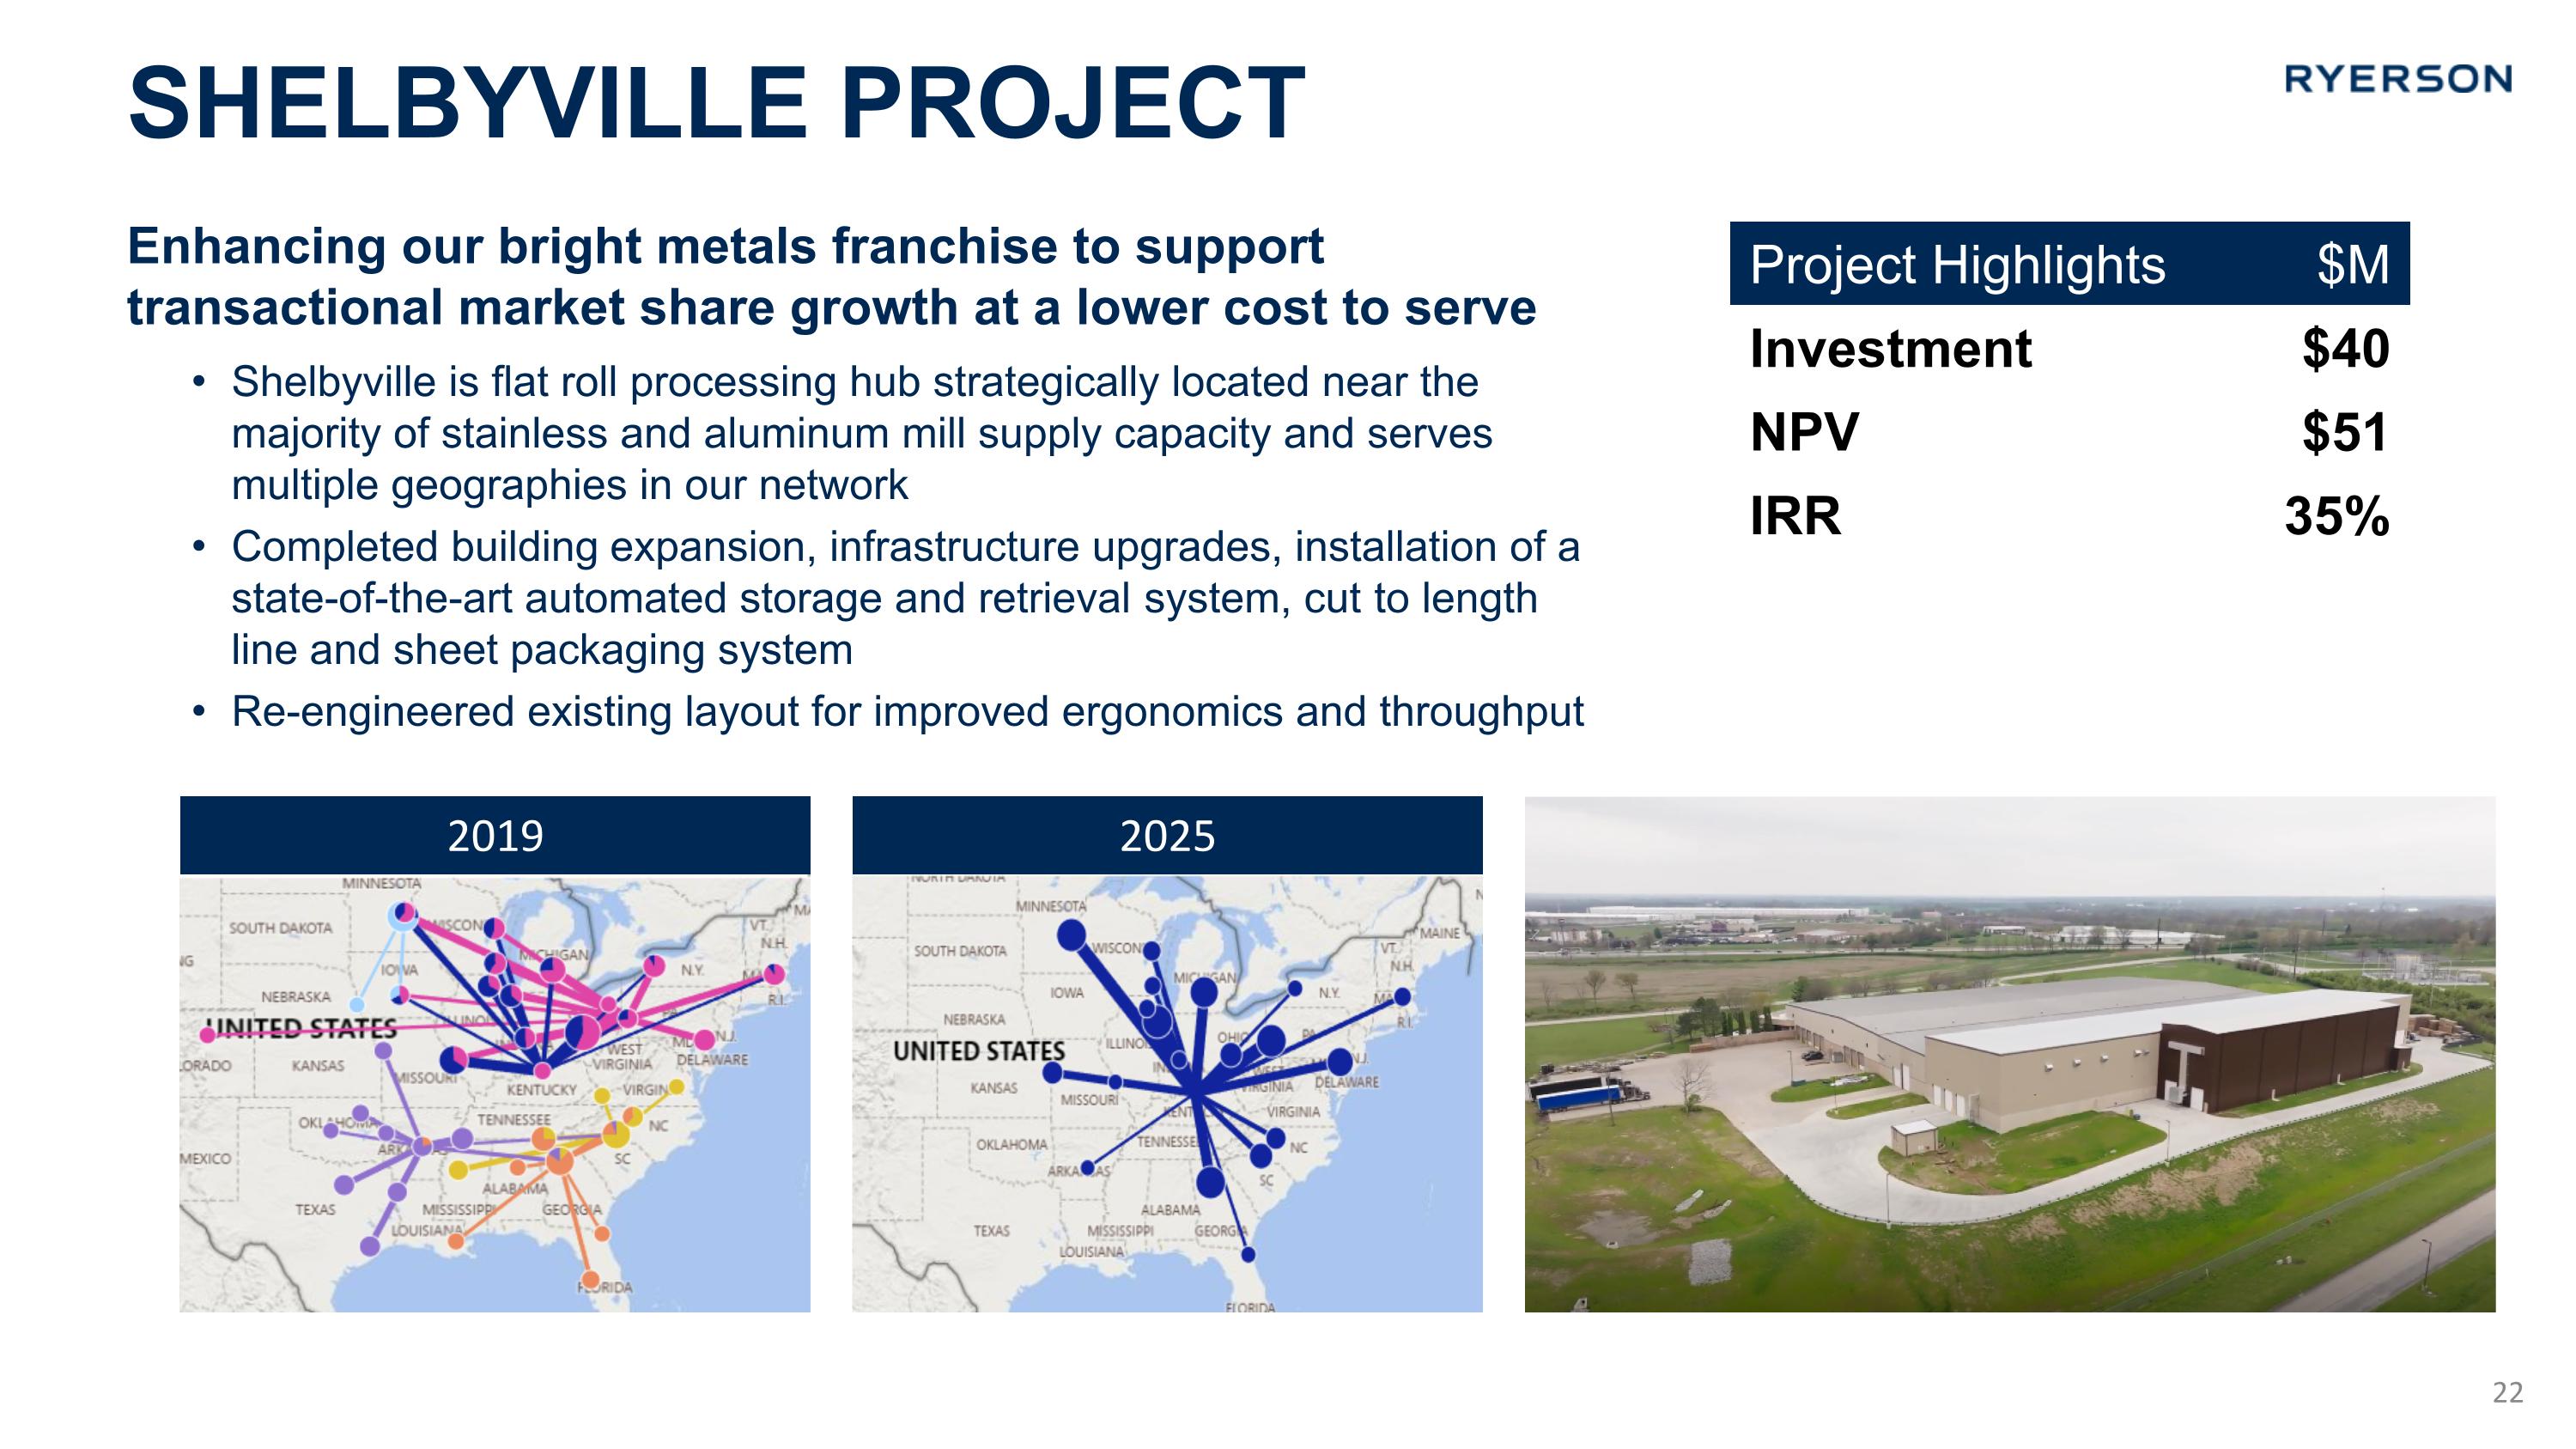
Enhancing our bright metals franchise to support transactional market share growth at a lower cost to serve Shelbyville is flat roll processing hub strategically located near the majority of stainless and aluminum mill supply capacity and serves multiple geographies in our network Completed building expansion, infrastructure upgrades, installation of a state-of-the-art automated storage and retrieval system, cut to length line and sheet packaging system Re-engineered existing layout for improved ergonomics and throughput 2019 2025 Shelbyville Project Project Highlights $M Investment $40 NPV $51 IRR 35%
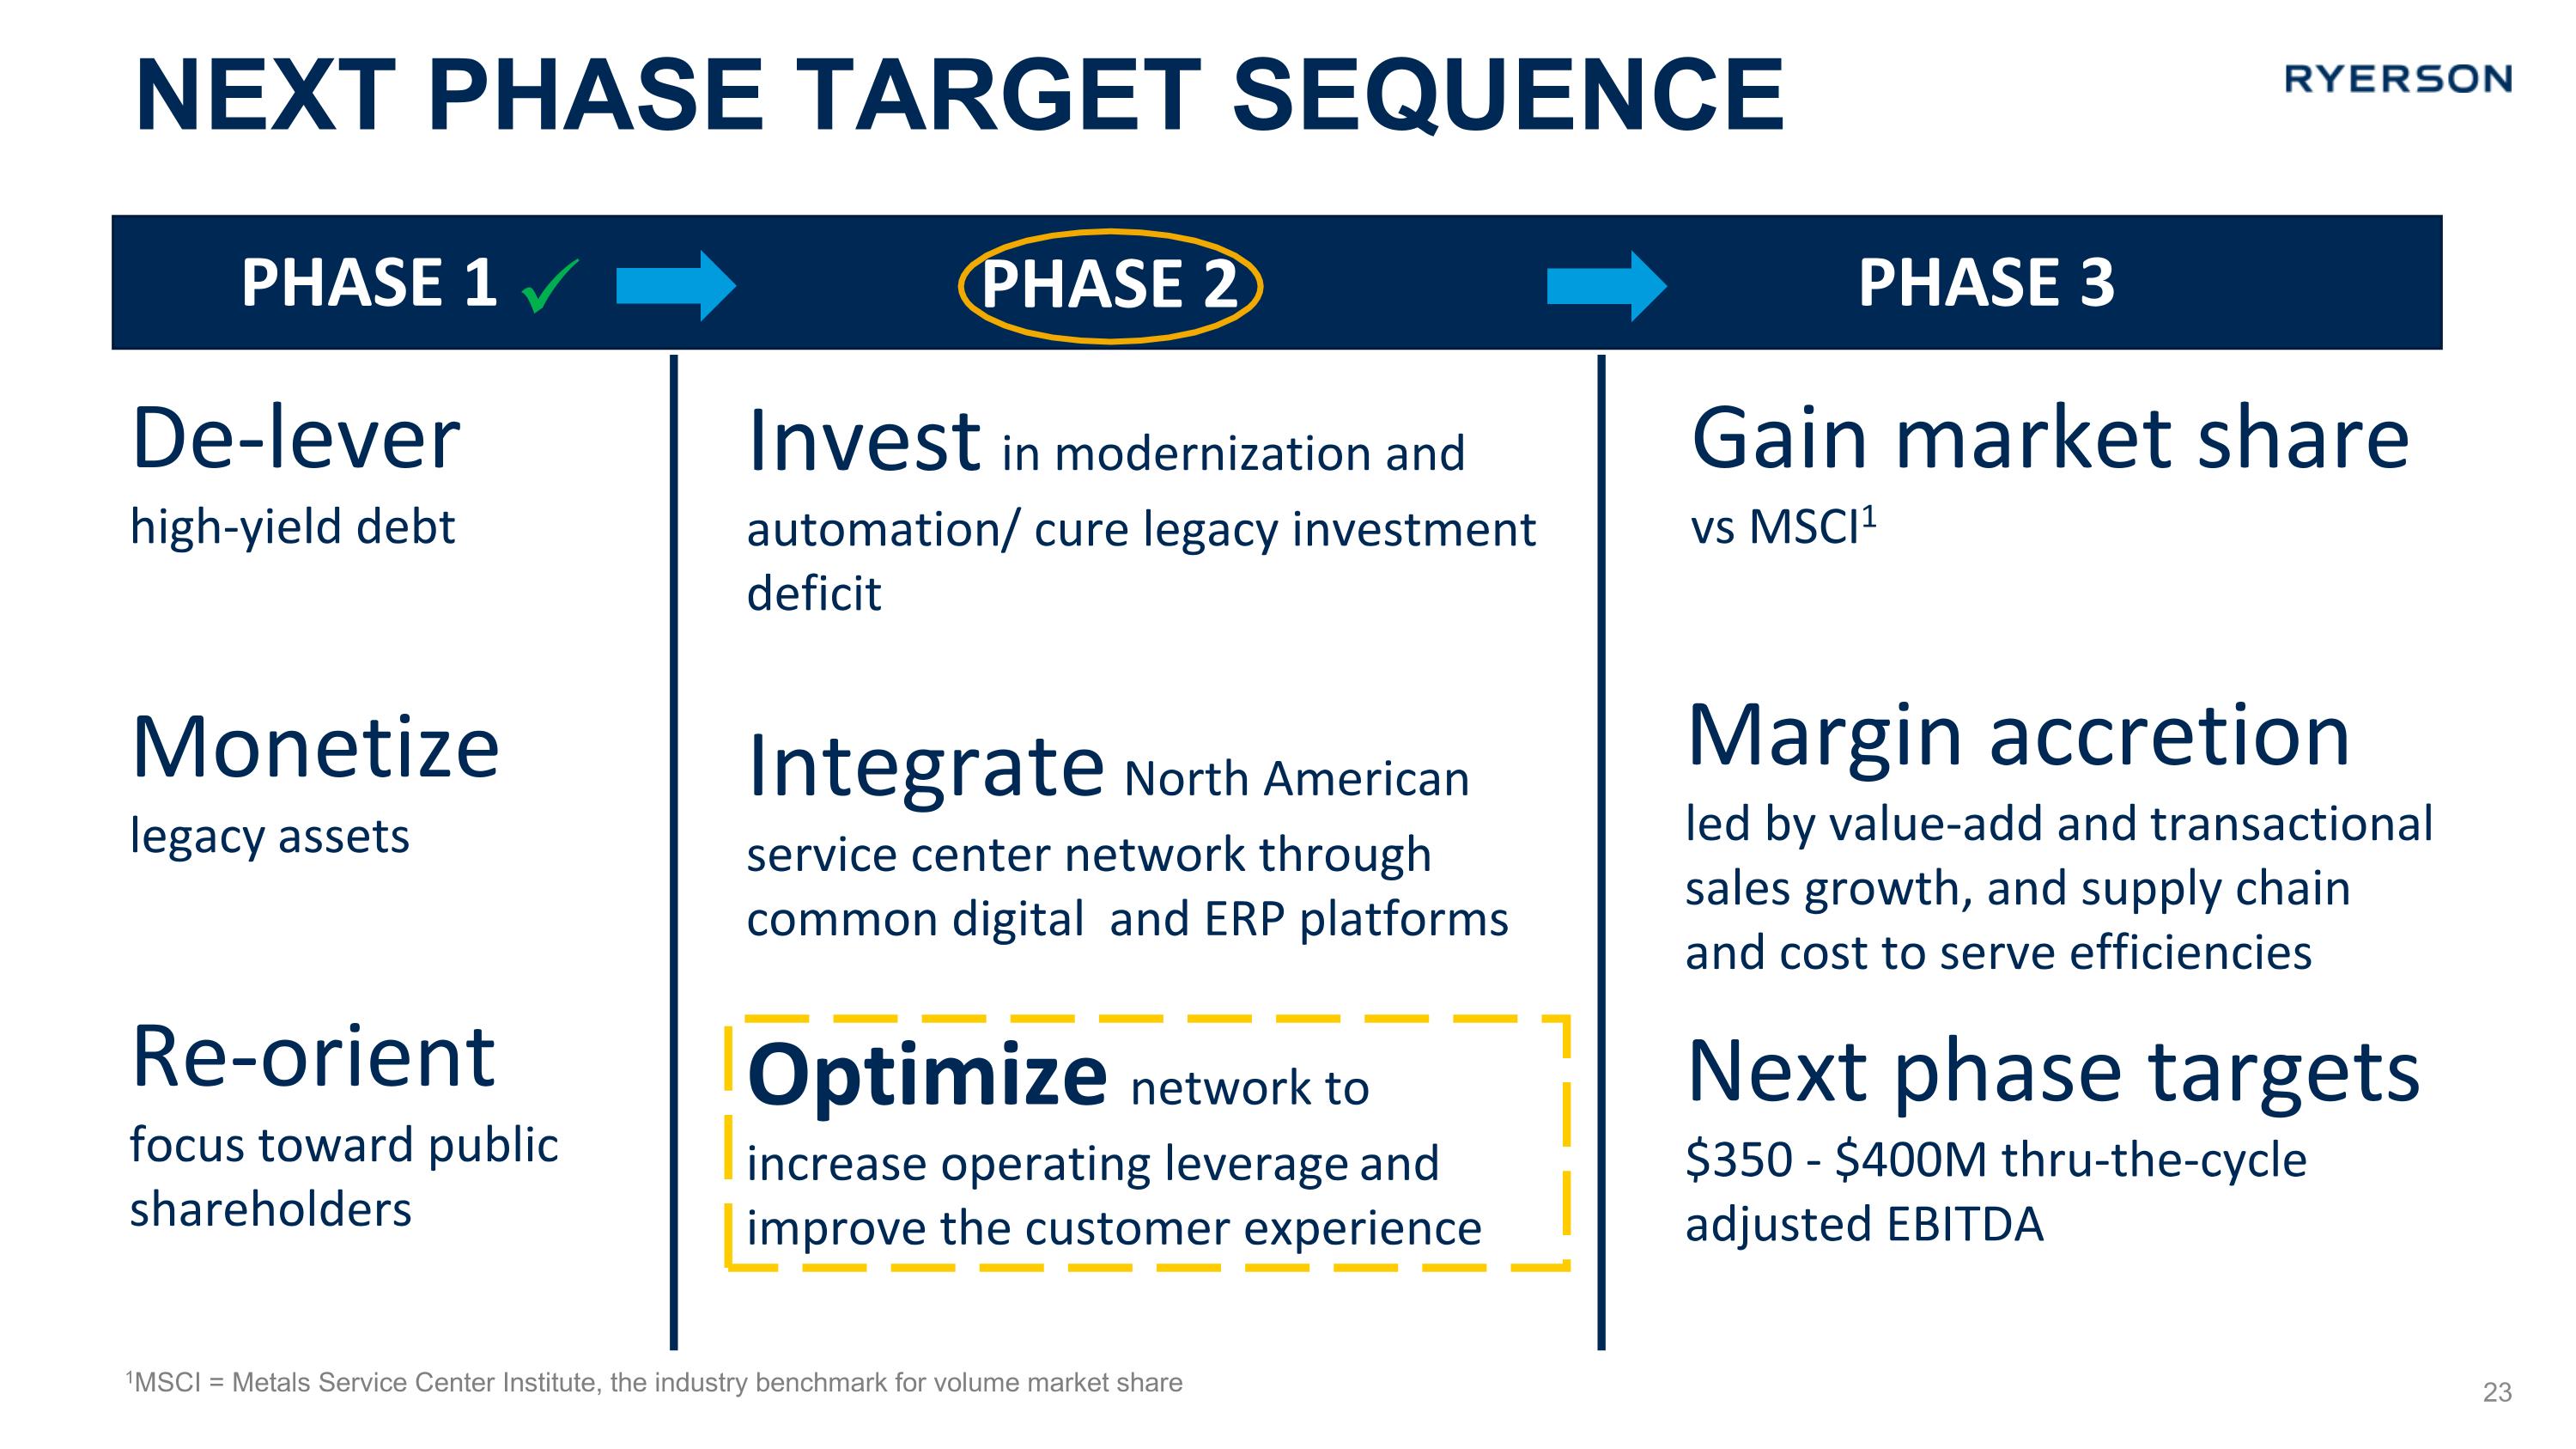
Next Phase Target sequence PHASE 1 PHASE 2 PHASE 3 Invest in modernization and automation/ cure legacy investment deficit Integrate North American service center network through common digital and ERP platforms��Optimize network to increase operating leverage and improve the customer experience De-lever�high-yield debt Monetize�legacy assets Re-orient�focus toward public shareholders Gain market share vs MSCI1 Margin accretion led by value-add and transactional sales growth, and supply chain and cost to serve efficiencies Next phase targets�$350 - $400M thru-the-cycle adjusted EBITDA 1MSCI = Metals Service Center Institute, the industry benchmark for volume market share 23
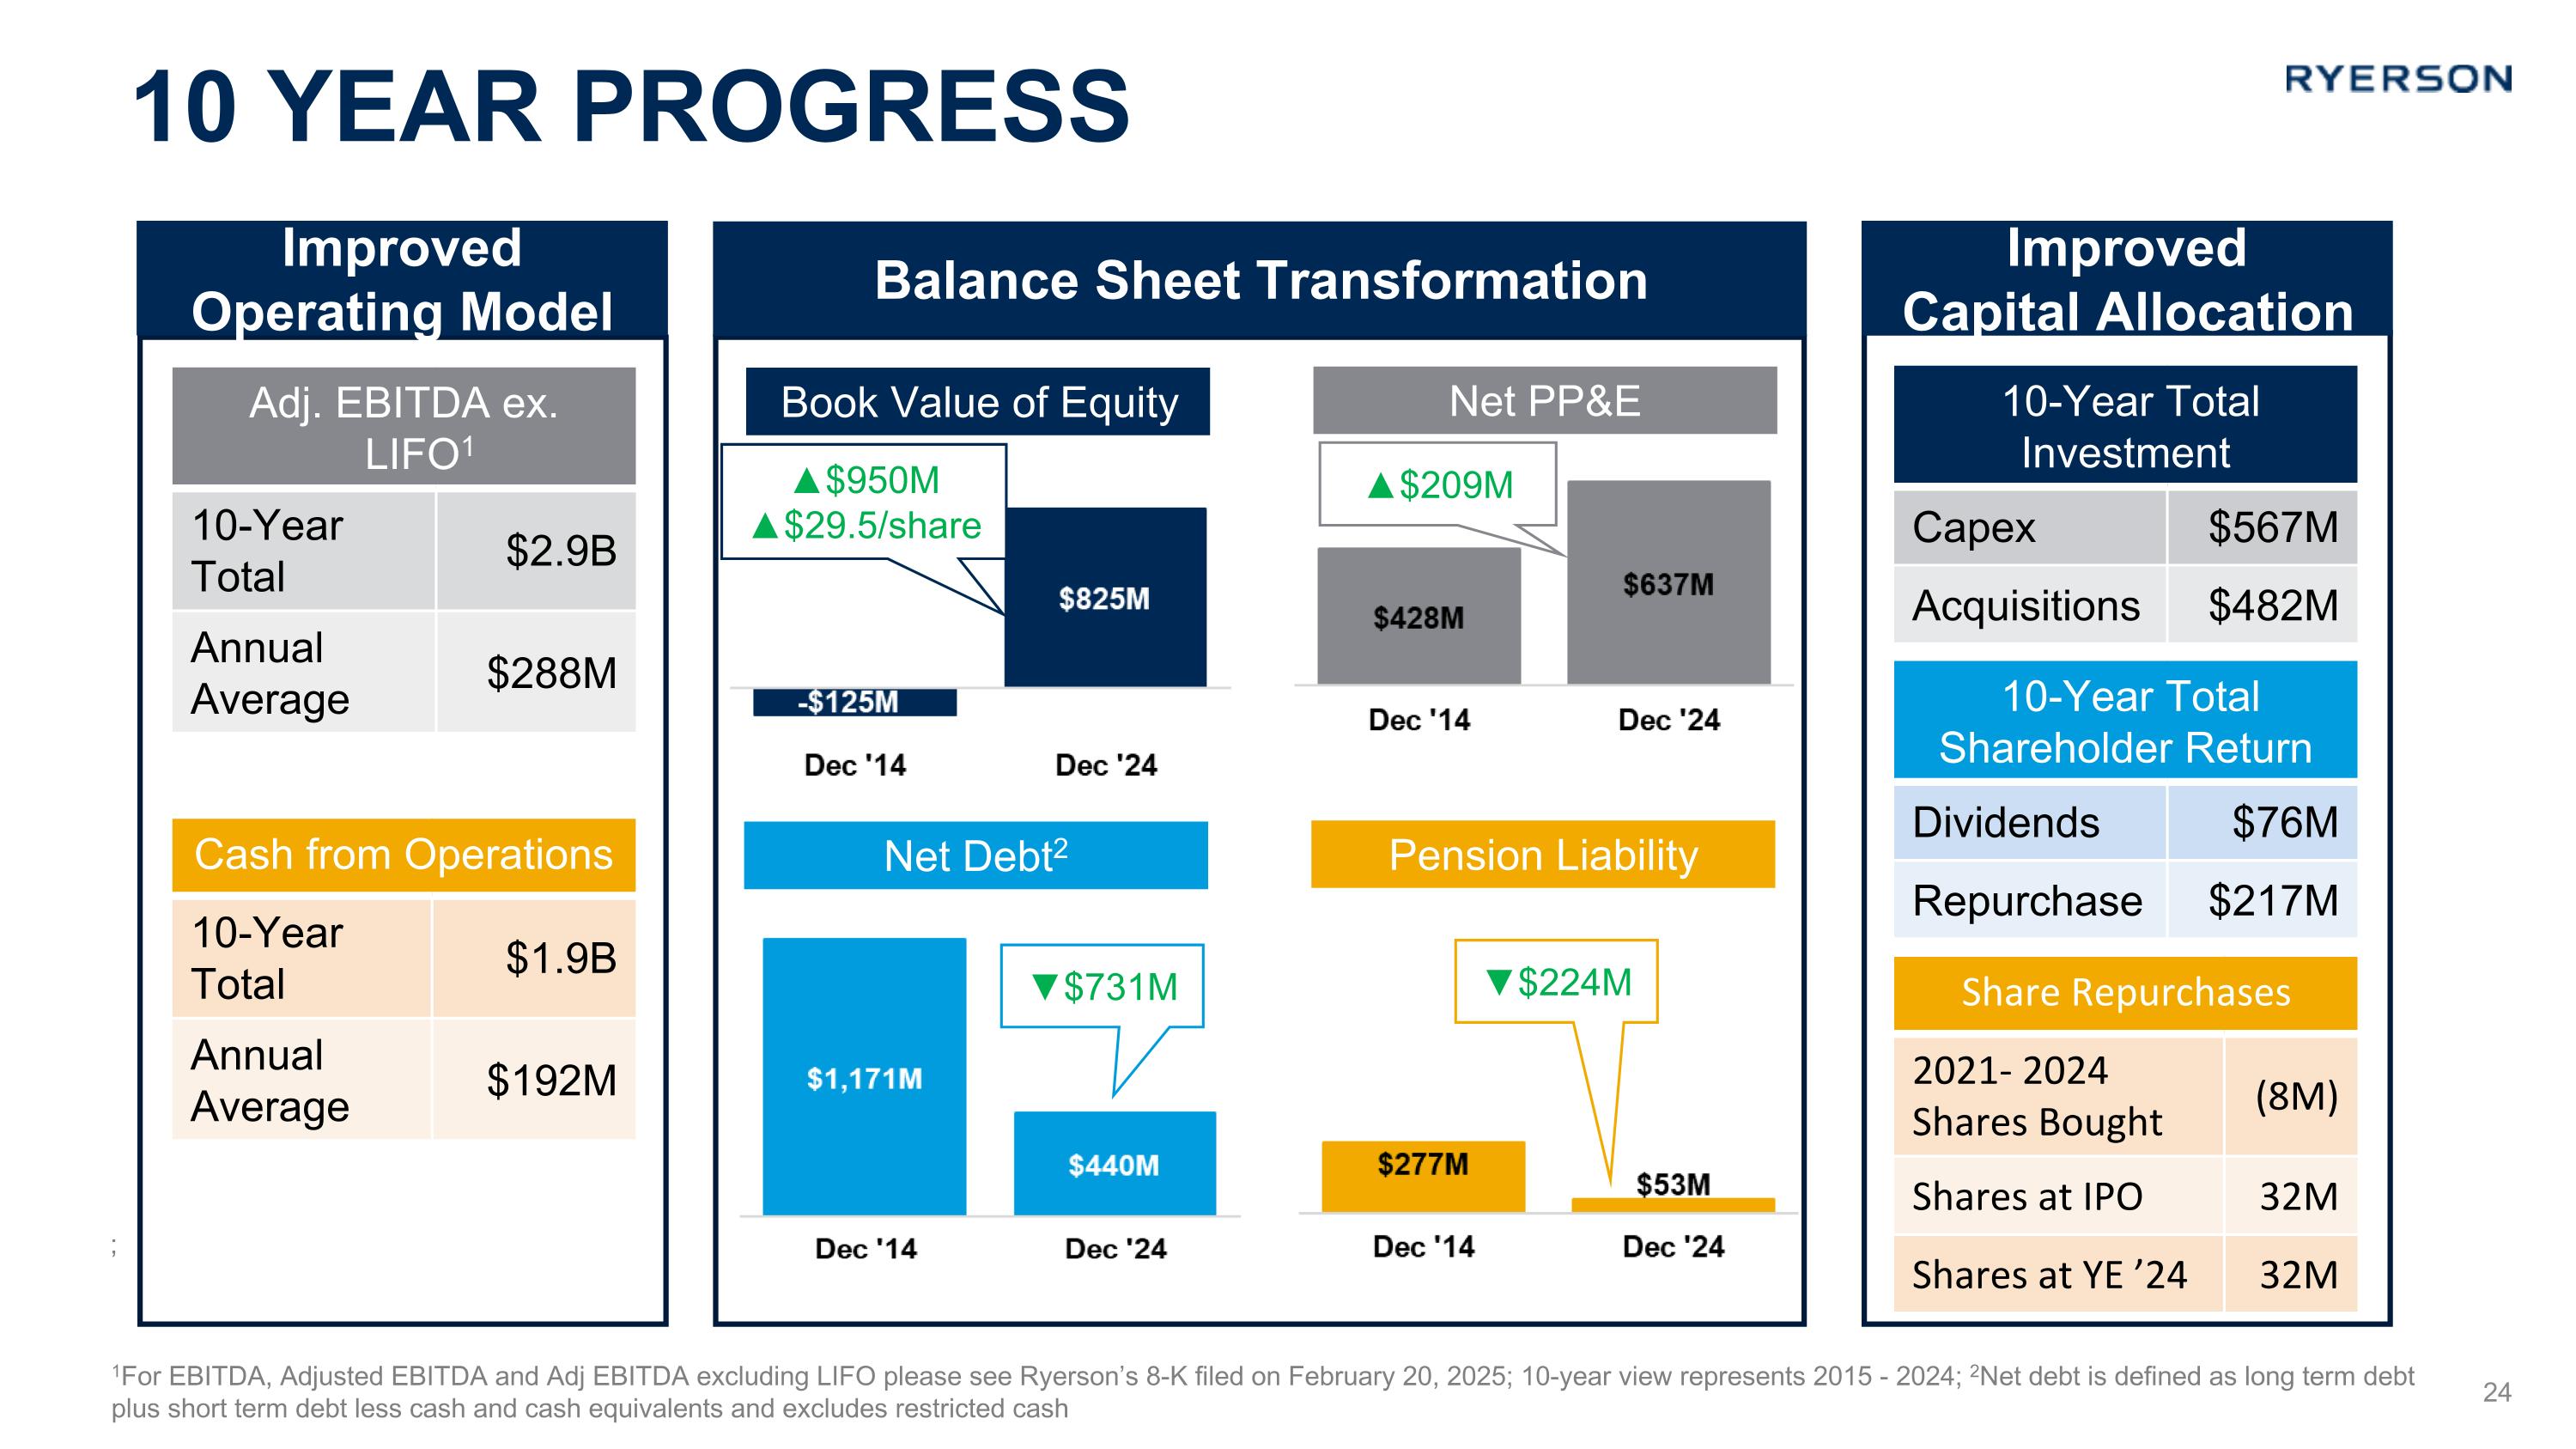
10 Year progress Net PP&E Book Value of Equity Pension Liability Net Debt2 Improved Operating Model Balance Sheet Transformation Improved Capital Allocation 1For EBITDA, Adjusted EBITDA and Adj EBITDA excluding LIFO please see Ryerson’s 8-K filed on February 20, 2025; 10-year view represents 2015 - 2024; 2Net debt is defined as long term debt plus short term debt less cash and cash equivalents and excludes restricted cash Adj. EBITDA ex. LIFO1 10-Year Total $2.9B Annual Average $288M Cash from Operations 10-Year Total $1.9B Annual Average $192M 10-Year Total Investment Capex $567M Acquisitions $482M 10-Year Total Shareholder Return Dividends $76M Repurchase $217M Share Repurchases 2021- 2024 Shares Bought (8M) Shares at IPO 32M Shares at YE ’24 32M ; ▼$731M ▼$224M ▲$209M ▲$950M ▲$29.5/share