s-20221206
0001583708FALSE00015837082022-12-062022-12-06

UNITED STATES
SECURITIES AND EXCHANGE COMMISSION
WASHINGTON, D.C. 20549
FORM 8-K
CURRENT REPORT
Pursuant to Section 13 or 15(d)
of the Securities Exchange Act of 1934
Date of Report (Date of earliest event reported): December 6, 2022
SENTINELONE, INC.
(Exact name of registrant as specified in its charter)
_____________________________________________________________________________________________
Delaware001-4053199-0385461
(State or other jurisdiction
of incorporation)
(Commission
File Number)
(IRS Employer
Identification No.)
444 Castro Street
Suite 400
Mountain ViewCalifornia94041
(Address of principal executive offices)(Zip Code)
Registrant’s telephone number, including area code: (855) 868-3733
Not Applicable
(Former name or former address, if changed since last report)
Check the appropriate box below if the Form 8-K filing is intended to simultaneously satisfy the filing obligation of the registrant under any of the following provisions (see General Instruction A.2. below):
Written communications pursuant to Rule 425 under the Securities Act (17 CFR 230.425)
Soliciting material pursuant to Rule 14a12 under the Exchange Act (17 CFR 240.14a-12)
Pre-commencement communications pursuant to Rule 14d-2(b) under the Exchange Act (17 CFR 240.14d-2(b))
Pre-commencement communications pursuant to Rule 13e-4(c) under the Exchange Act (17 CFR 240.13e-4(c))
Securities registered pursuant to Section 12(b) of the Act:
Title of each classTrading
Symbol(s)
Name of each exchange on which registered
Class A common stock, par value $0.0001SNew York Stock Exchange
Indicate by check mark whether the registrant is an emerging growth company as defined in Rule 405 of the Securities Act of 1933 (§ 230.405 of this chapter) or Rule 12b-2 of the Securities Exchange Act of 1934 (§ 240.12b-2 of this chapter).
Emerging growth company
If an emerging growth company, indicate by check mark if the registrant has elected not to use the extended transition period for complying with any new or revised financial accounting standards provided pursuant to Section 13(a) of the Exchange Act.


Item 2.02 Results of Operations and Financial Condition.

On December 6, 2022, SentinelOne, Inc. (the “Company”) announced its financial results for the third quarter of fiscal year 2023 ended October 31, 2022, by issuing a letter to shareholders and a press release. The Company also announced that it would hold a webcast to discuss its financial results for the third quarter of fiscal year 2023 ended October 31, 2022. A copy of the press release and the letter to shareholders is furnished herewith as Exhibit 99.1 and 99.2, respectively.

The Company makes reference to non-GAAP financial information in the Company’s press release, letter to shareholders and the webcast call. A reconciliation of these non-GAAP financial measures to the comparable GAAP financial measures is contained in the attached press release and letter to shareholders.

The information contained herein and in the accompanying exhibits are “furnished” and shall not be deemed “filed” for purposes of Section 18 of the Securities Exchange Act of 1934, as amended (the “Exchange Act”), or otherwise subject to the liabilities of that section, and shall not be incorporated by reference in any filing under the Exchange Act regardless of any general incorporation language in such filing, unless expressly incorporated by specific reference in such filing.


Item 7.01 Regulation FD Disclosure.

On December 6, 2022, the Company posted supplemental investor materials on the Investors Relations section of its website, available at investors.sentinelone.com. The Company announces material information to the public through filings with the Securities and Exchange Commission, the investor relations page on the Company’s website, press releases, public conference calls, webcasts, the Company’s news website, available at sentinelone.com/press and blog posts on the Company’s corporate website at sentinelone.com/blog in order to achieve broad, non-exclusionary distribution of information to the public and for complying with its disclosure obligations under Regulation FD.

The information disclosed by the foregoing channels could be deemed to be material information. As such, the Company encourages investors, the media and others to follow the channels listed above and to review the information disclosed through such channels.

Any updates to the list of disclosure channels through which the Company announces information will be posted on the investor relations page on the Company’s website.


Item 9.01    Financial Statements and Exhibits.

(d) Exhibits

Exhibit NumberExhibit Description
104Cover Page Interactive Data File (embedded within the Inline XBRL document).


SIGNATURES


Pursuant to the requirements of the Securities Exchange Act of 1934, the registrant has duly caused this report to be signed on its behalf by the undersigned hereunto duly authorized.


SENTINELONE, INC.
Date: December 6, 2022By:/s/ David Bernhardt
David Bernhardt
Chief Financial Officer


Exhibit 99.1
s1_logoxhorzxrgbxblka.jpg
SentinelOne Announces Third Quarter Fiscal Year 2023 Financial Results
Revenue increased 106% year-over-year
ARR up 106% year-over-year


MOUNTAIN VIEW, Calif. - December 6, 2022 - SentinelOne, Inc. (NYSE: S) today announced financial results for the third quarter of fiscal year 2023 ended October 31, 2022.
“We once again delivered triple digit revenue and ARR growth fueled by strong adoption of our Singularity XDR platform across endpoint, cloud, and identity. Cybersecurity is mission-critical, and our Singularity platform is purpose built for leading protection allowing us to deliver superior platform value,” said Tomer Weingarten, CEO of SentinelOne. “We’re focused on enhancing productivity and continuing to take market share in a dynamic environment.”
“We maintained the Rule of 60 again in Q3'2023. These results continue to signify our ability to maintain a balance between compelling top line growth and improved progress towards our long-term profitability targets,” said Dave Bernhardt, CFO of SentinelOne.
Letter to Shareholders
We have also published a letter to shareholders on the Investor Relations section of our website at investors.sentinelone.com. The letter provides further discussion of our results for the third quarter of fiscal year 2023 as well as our full fiscal year 2023 financial outlook.
Third Quarter Fiscal 2023 Highlights
(All metrics are compared to the third quarter of fiscal year 2022 unless otherwise noted)

Total revenue increased 106% to $115.3 million, compared to $56.0 million.

Annualized recurring revenue (ARR) increased 106% to $487.4 million as of October 31, 2022.

Total customer count grew about 55% to over 9,250 customers as of October 31, 2022. Customers with ARR over $100,000 grew nearly 100% to 827 as of October 31, 2022. Dollar-based net revenue retention rate was 134%.

Gross margin: GAAP gross margin was 64%, compared to 64%. Non-GAAP gross margin was 71%, compared to 67%.

Operating margin: GAAP operating margin was (90)%, compared to (120)%. Non-GAAP operating margin was (43)%, compared to (69)%.

Cash, cash equivalents, and investments were $1.2 billion as of October 31, 2022.


Financial Outlook
We are providing the following guidance for the fourth quarter of fiscal year 2023, and for our full fiscal year 2023 ended January 31, 2023.
Q4FY23
Guidance
Full FY2023
Guidance
Revenue$125 million$420-421 million
Non-GAAP gross margin72%71.0-71.5%
Non-GAAP operating margin(39)%(51)-(50)%
These statements are forward-looking and actual results may differ materially as a result of many factors. Refer to the below for information on the factors that could cause our actual results to differ materially from these forward-looking statements.

Guidance for non-GAAP financial measures excludes stock-based compensation expense, employer payroll tax on employee stock transactions, amortization expense of acquired intangible assets, and acquisition-related compensation costs. We have not provided the most directly comparable GAAP measures because certain items are out of our control or cannot be reasonably predicted. Accordingly, a reconciliation of non-GAAP gross margin and non-GAAP operating margin is not available without unreasonable effort.
Webcast information
We will host a live audio webcast for analysts and investors to discuss our earnings results for the third quarter of fiscal year 2023 and outlook for the fourth quarter of fiscal year 2023 and our full fiscal year 2023 today, December 6, 2022, at 2:00 p.m. Pacific time (5:00 p.m. Eastern time). The live webcast and a recording of the event will be available on the Investor Relations section of our website at investors.sentinelone.com.

We have used, and intend to continue to use, the Investor Relations section of our website at investors.sentinelone.com as a means of disclosing material nonpublic information and for complying with our disclosure obligations under Regulation FD.
Forward-looking statements
This press release contains forward-looking statements within the meaning of Section 27A of the Securities Act of 1933, as amended, and Section 21E of the Securities Exchange Act of 1934, as amended, which statements involve risks and uncertainties, including statements regarding our future growth, and future financial and operating performance, including our financial outlook for the fourth quarter of fiscal year 2023 and our full fiscal year 2023, including non-GAAP gross profit and non-GAAP operating margin; progress towards our long-term profitability targets; and general market trends. The words “believe,” “may,” “will,” “potentially,” “estimate,” “continue,” “anticipate,” “intend,” “could,” “would,” “project,” “target,” “plan,” “expect,” or the negative of these terms and similar expressions are intended to identify forward-looking statements. However, not all forward-looking statements contain these identifying words.

There are a significant number of factors that could cause our actual results to differ materially from statements made in this press release, including but not limited to: our limited operating history; our history of losses; intense competition in the market we compete in; fluctuations in our operating results; network or security incidents against us; our ability to successfully integrate acquisitions and strategic investments, including Attivo Networks, Inc. ("Attivo"); defects, errors or vulnerabilities in our platform; risks associated with managing our rapid growth; the continuing impact of the COVID-19 pandemic on our and our customers’ businesses; our ability to attract new and retain existing customers, or renew and expand our relationships with them; the ability of our platform to effectively interoperate within our customers' IT infrastructure; disruptions or other business interruptions that affect the availability of our platform; the failure to timely develop and achieve market acceptance of new products and


subscriptions as well as existing products, subscriptions and support offerings; rapidly evolving technological developments in the market for security products and subscription and support offerings; length of sales cycles; risks of securities class action litigation; general market, political, economic, and business conditions, including those related to declining macroeconomic conditions, rising interest rates and inflation, the continuing impact of COVID-19 and geopolitical uncertainty, including the effects of the recent conflict in Ukraine.

Additional risks and uncertainties that could affect our financial results are included under the captions “Risk Factors” and “Management’s Discussion and Analysis of Financial Condition and Results of Operations” set forth in our filings and reports with the Securities and Exchange Commission (“SEC”), including our most recently filed Annual Report on Form 10-K, dated April 7, 2022, subsequent Quarterly Reports on Form 10-Q and other filings and reports that we may file from time to time with the SEC, copies of which are available on our website at investors.sentinelone.com and on the SEC’s website at www.sec.gov.

You should not rely on these forward-looking statements, as actual outcomes and results may differ materially from those contemplated by these forward-looking statements as a result of such risks and uncertainties. All forward-looking statements in this press release are based on information available to us as of the date hereof, and were based on current expectations, estimates, forecasts, and projections as well as the beliefs and assumptions of management. We do not assume any obligation to update the forward-looking statements provided to reflect events that occur or circumstances that exist after the date of this press release or to reflect new information or the occurrence of unexpected events, except as required by law. We may not actually achieve the plans, intentions, or expectations disclosed in our forward-looking statements, and you should not place undue reliance on our forward-looking statements.
Non-GAAP Financial Measures
In addition to our results determined in accordance with GAAP, we believe the following non-GAAP measures are useful in evaluating our operating performance. We use the following non-GAAP financial information to evaluate our ongoing operations and for internal planning and forecasting purposes. We believe that non-GAAP financial information, when taken collectively, with the financial information presented in accordance with GAAP, may be helpful to investors because it provides consistency and comparability with past financial performance. However, non-GAAP financial information is presented for supplemental informational purposes only, has limitations as an analytical tool, and should not be considered in isolation or as a substitute for financial information presented in accordance with GAAP.

Other companies, including companies in our industry, may calculate similarly titled non-GAAP measures differently or may use other measures to evaluate their performance, all of which could reduce the usefulness of our non-GAAP financial measures as tools for comparison. In addition, the utility of free cash flow as a measure of our liquidity is limited as it does not represent the total increase or decrease in our cash balance for a given period.

Reconciliations between non-GAAP financial measures to the most directly comparable financial measure stated in accordance with GAAP are contained below. Investors are encouraged to review the related GAAP financial measures and the reconciliation of these non-GAAP financial measures to their most directly comparable GAAP financial measures and not rely on any single financial measure to evaluate our business.

As presented in the “Reconciliation of GAAP to Non-GAAP Financial Information” table below, each of the non-GAAP financial measures excludes one or more of the following items:


Stock-based compensation expense

Stock-based compensation expense is a non-cash expense that varies in amount from period to period and is dependent on market forces that are often beyond our control. As a result, management excludes this item from our internal operating forecasts and models. Management believes that non-GAAP measures adjusted for stock-based compensation expense provide investors with a basis to measure our core performance against the performance of other companies without the variability created by stock-based compensation as a result of the variety of equity awards used by other companies and the varying methodologies and assumptions used.
Employer payroll tax on employee stock transactions
Employer payroll tax expense related to employee stock transactions are tied to the vesting or exercise of underlying equity awards and the price of our common stock at the time of vesting, which varies in amount from period to period and is dependent on market forces that are often beyond our control. As a result, management excludes this item from our internal operating forecasts and models. Management believes that non-GAAP measures adjusted for employer payroll taxes on employee stock transactions provide investors with a basis to measure our core performance against the performance of other companies without the variability created by employer payroll taxes on employee stock transactions as a result of the stock price at the time of employee exercise.
Amortization of acquired intangible assets
Amortization of acquired intangible assets expense are tied to the intangible assets that were acquired in conjunction with acquisitions, which results in non‑cash expenses that may not otherwise have been incurred. Management excludes the expense associated with intangible assets from non-GAAP measures to allow for a more accurate assessment of our ongoing operations and provides investors with a better comparison of period-over-period operating results.
Acquisition-related compensation costs
Acquisition-related compensation costs include cash-based compensation expense resulting from the employment retention of certain employees established in accordance with the terms of the Attivo acquisition. Acquisition-related compensation costs have been excluded as they were specifically negotiated as part of the Attivo acquisition in order to retain such employees and relate to cash compensation that was made either in lieu of stock-based compensation or where the grant of stock-based compensation awards was not practicable. In most cases, these acquisition-related compensation costs are not factored into management's evaluation of potential acquisitions or our performance after completion of acquisitions, because they are not related to our core operating performance. In addition, the frequency and amount of such charges can vary significantly based on the size and timing of acquisitions and the maturities of the businesses being acquired. Excluding acquisition-related compensation costs from non-GAAP measures provides investors with a basis to compare our results against those of other companies without the variability caused by purchase accounting.
Income tax provision (benefit)
We believe that excluding the tax benefit associated with the partial reversal of the valuation allowance against our deferred tax assets during the second quarter of fiscal year 2023 provides our senior management as well as other users of our financial statements with a valuable perspective on the performance and health of the business. This partial reversal relates to realization of our deferred tax assets used to offset deferred tax liabilities recorded in the Attivo acquisition. This one-time benefit is not indicative of current or future operations and expenses.
Non-GAAP Cost of Revenue, Non-GAAP Gross Profit, Non-GAAP Gross Margin, Non-GAAP Loss from Operations, Non-GAAP Operating Margin, Non-GAAP Net Loss and Non-GAAP Net Loss Per Share
We define these non-GAAP financial measures as their respective GAAP measures, excluding the expenses referenced above. We use these non-GAAP financial measures as part of our overall assessment of our performance,


including the preparation of our annual operating budget and quarterly forecasts, to evaluate the effectiveness of our business strategies, and to communicate with our board of directors concerning our financial performance.
Free Cash Flow
We define free cash flow as cash used in operating activities less purchases of property and equipment and capitalized internal-use software costs. We believe free cash flow is a useful indicator of liquidity that provides our management, board of directors, and investors with information about our future ability to generate or use cash to enhance the strength of our balance sheet and further invest in our business and pursue potential strategic initiatives.
Key Business Metrics
We monitor the following key metrics to help us evaluate our business, identify trends affecting our business, formulate business plans, and make strategic decisions.
Annualized Recurring Revenue
We believe that ARR is a key operating metric to measure our business because it is driven by our ability to acquire new subscription and capacity customers and to maintain and expand our relationship with existing customers. ARR represents the annualized revenue run rate of our subscription and capacity contracts at the end of a reporting period, assuming contracts are renewed on their existing terms for customers that are under contracts with us.
Customers with ARR of $100,000 or More
We believe that our ability to increase the number of customers with ARR of $100,000 or more is an indicator of our market penetration and strategic demand for our platform. We define a customer as an entity that has an active subscription for access to our platform. We count MSPs, MSSPs, MDRs, and OEMs, who may purchase our products on behalf of multiple companies, as a single customer. We do not count our reseller or distributor channel partners as customers.
Dollar-Based Net Retention Rate
We believe that our ability to retain and expand our revenue generated from our existing customers is an indicator of the long-term value of our customer relationships and our potential future business opportunities. Dollar-based net retention rate measures the percentage change in our ARR derived from our customer base at a point in time. To calculate these metrics, we first determine Prior Period ARR, which is ARR from the population of our customers as of 12 months prior to the end of a particular reporting period. We calculate Net Retention ARR as the total ARR at the end of a particular reporting period from the set of customers that is used to determine Prior Period ARR. Net Retention ARR includes any expansion, and is net of contraction and attrition associated with that set of customers. NRR is the quotient obtained by dividing Net Retention ARR by Prior Period ARR.

Source String: SentinelOne
Category: Investors


Contact

Investor relations:
Doug Clark
E: [email protected]

Press:
Jake Schuster
fama PR for SentinelOne
P: 617-986-5000
E: [email protected]


SENTINELONE, INC.
CONDENSED CONSOLIDATED BALANCE SHEETS
(in thousands)
(unaudited)
October 31,
January 31,
2022
2022
Assets
Current assets:
Cash and cash equivalents$210,472 $1,669,304 
Short-term investments
490,812 374 
Accounts receivable, net
119,365 101,491 
Deferred contract acquisition costs, current
33,666 27,546 
Prepaid expenses and other current assets
98,186 18,939 
Total current assets
952,501 1,817,654 
Property and equipment, net
36,377 24,918 
Operating lease right-of-use assets24,267 23,884 
Long-term investments456,722 6,000 
Deferred contract acquisition costs, non-current47,194 41,022 
Intangible assets, net152,334 15,807 
Goodwill540,308 108,193 
Other assets4,978 4,703 
Total assets
$2,214,681 $2,042,181 
Liabilities and Stockholders’ Equity
Current liabilities:
Accounts payable$6,592 $9,944 
Accrued liabilities
95,283 22,657 
Accrued payroll and benefits
43,459 61,150 
Operating lease liabilities, current
4,000 4,613 
Deferred revenue, current255,501 182,957 
Total current liabilities
404,835 281,321 
Deferred revenue, non-current98,873 79,062 
Operating lease liabilities, non-current23,706 24,467 
Other liabilities5,080 6,543 
Total liabilities
532,494 391,393 
Stockholders’ equity:
Preferred stock— — 
Class A common stock
20 16 
Class B common stock11 
Additional paid-in capital2,599,279 2,271,980 
Accumulated other comprehensive income (loss)(10,449)454 
Accumulated deficit(906,671)(621,673)
Total stockholders’ equity1,682,187 1,650,788 
Total liabilities and stockholders’ equity$2,214,681 $2,042,181 


SENTINELONE, INC.
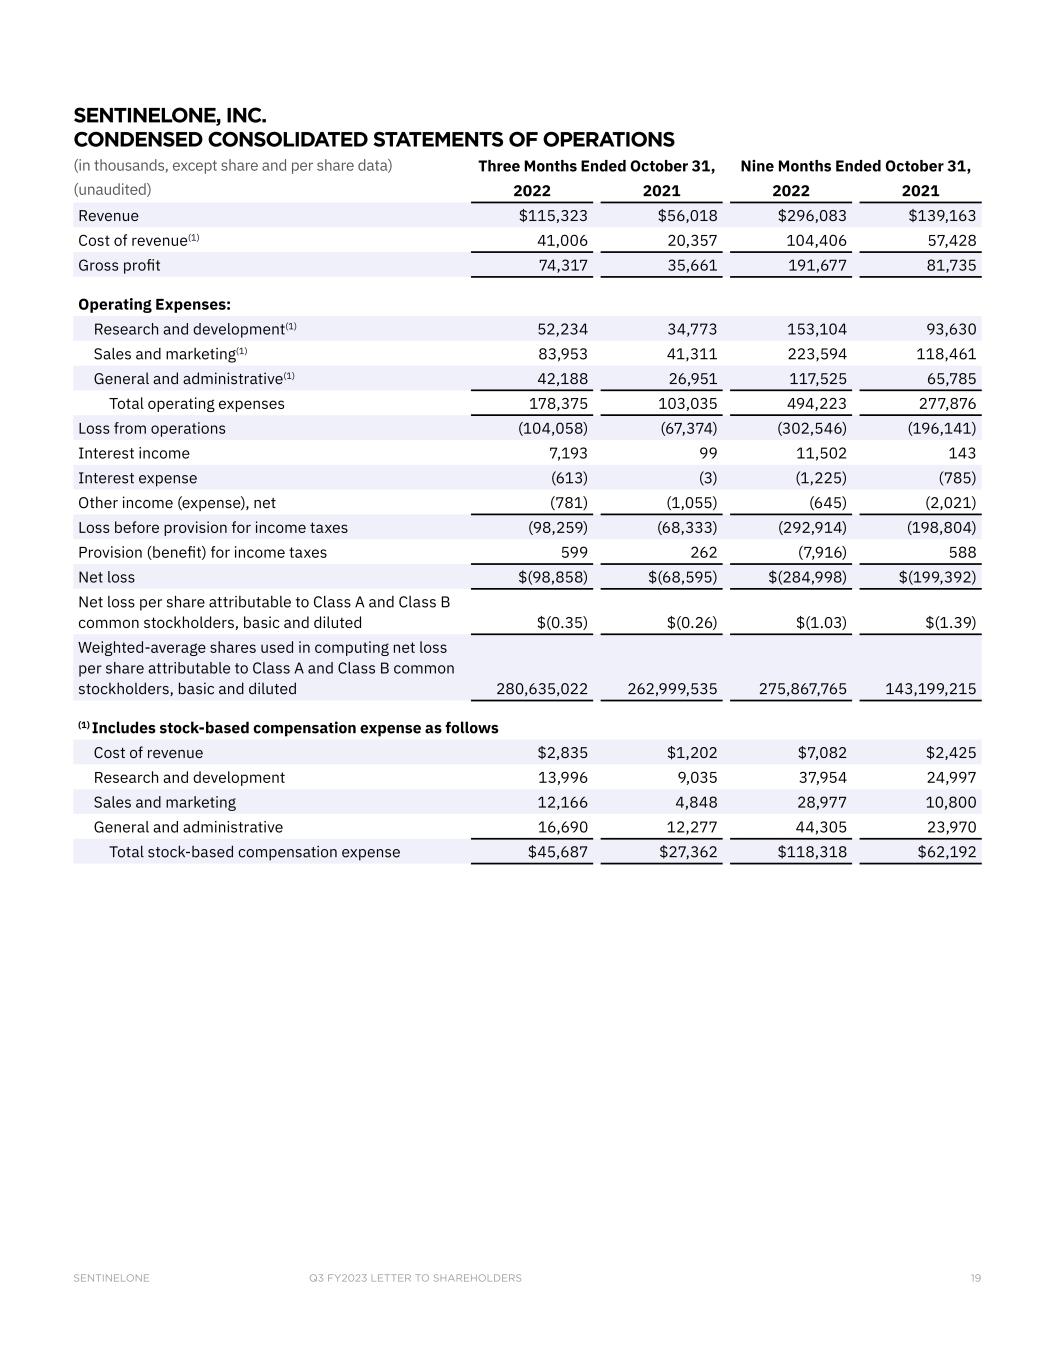
CONDENSED CONSOLIDATED STATEMENTS OF OPERATIONS
(in thousands, except share and per share data)
(unaudited)

Three Months Ended October 31,
Nine Months Ended October 31,
2022202120222021
Revenue
$115,323 $56,018 $296,083 $139,163 
Cost of revenue(1)
41,006 20,357 104,406 57,428 
Gross profit74,317 35,661 191,677 81,735 
Operating expenses:
Research and development(1)
52,234 34,773 153,104 93,630 
Sales and marketing(1)
83,953 41,311 223,594 118,461 
General and administrative(1)
42,188 26,951 117,525 65,785 
Total operating expenses
178,375 103,035 494,223 277,876 
Loss from operations(104,058)(67,374)(302,546)(196,141)
Interest income7,193 99 11,502 143 
Interest expense(613)(3)(1,225)(785)
Other income (expense), net(781)(1,055)(645)(2,021)
Loss before income taxes(98,259)(68,333)(292,914)(198,804)
Provision (benefit) for income taxes599 262 (7,916)588 
Net loss$(98,858)$(68,595)$(284,998)$(199,392)
Net loss per share attributable to Class A and Class B common stockholders, basic and diluted
$(0.35)$(0.26)$(1.03)$(1.39)
Weighted-average shares used in computing net loss per share attributable to Class A and Class B common stockholders, basic and diluted280,635,022 262,999,535 275,867,765 143,199,215 
(1) Includes stock-based compensation expense as follows:
Cost of revenue$2,835 $1,202 $7,082 $2,425 
Research and development13,996 9,035 37,954 24,997 
Sales and marketing12,166 4,848 28,977 10,800 
General and administrative16,690 12,277 44,305 23,970 
Total stock-based compensation expense$45,687 $27,362 $118,318 $62,192 


SENTINELONE, INC.
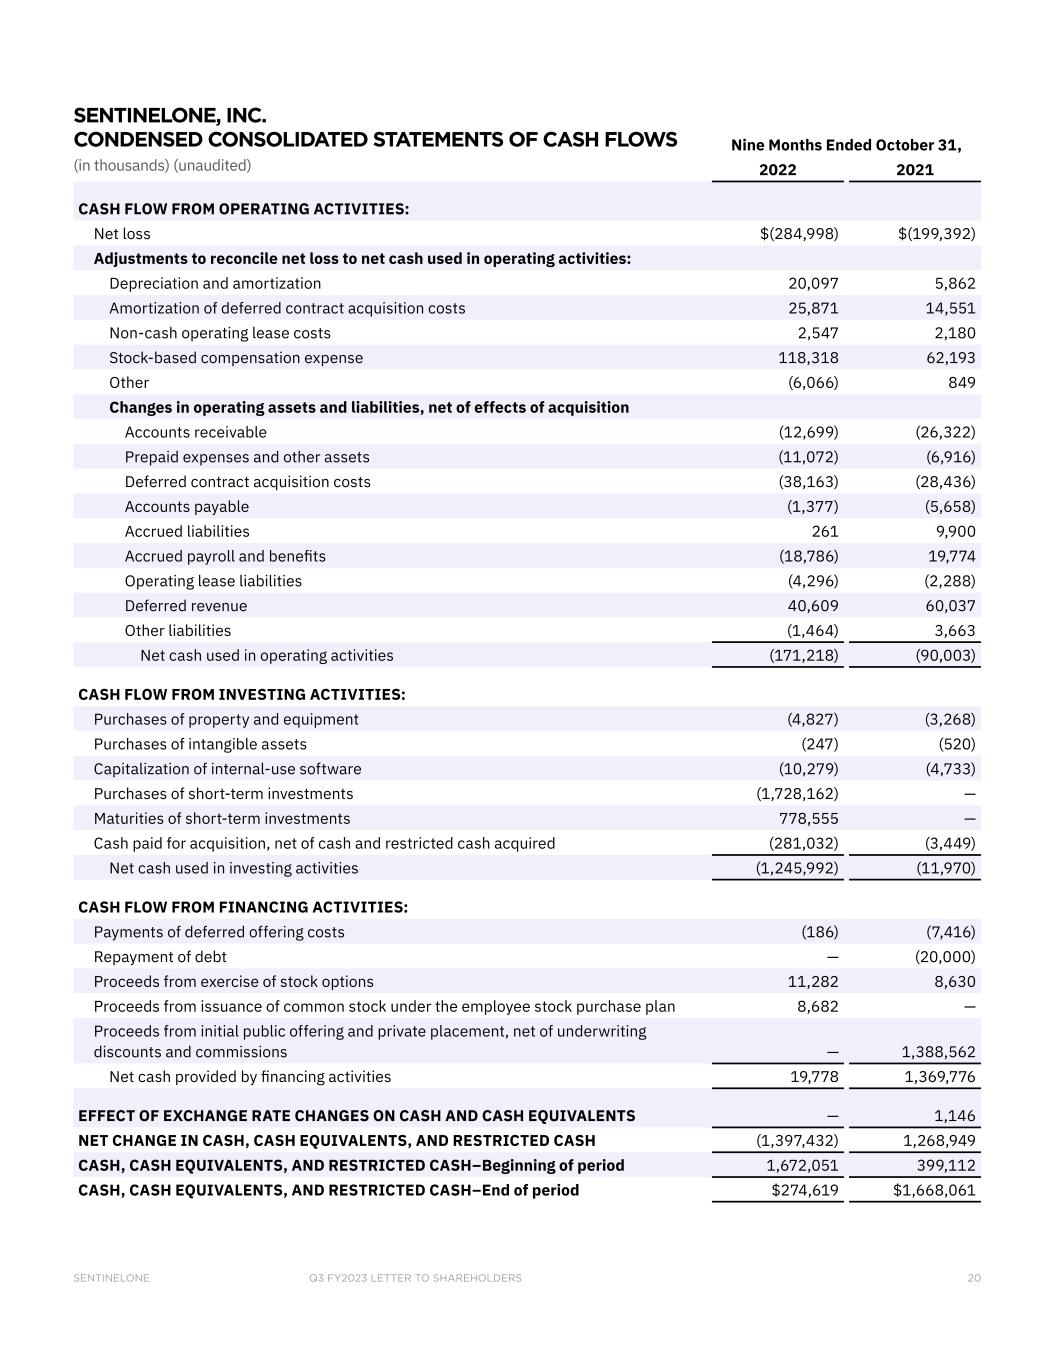
CONDENSED CONSOLIDATED STATEMENTS OF CASH FLOWS
(in thousands)
(unaudited)


Nine Months Ended October 31,
2022
2021
CASH FLOW FROM OPERATING ACTIVITIES:
Net loss$(284,998)$(199,392)
Adjustments to reconcile net loss to net cash used in operating activities:
Depreciation and amortization
20,097 5,862 
Amortization of deferred contract acquisition costs
25,871 14,551 
Non-cash operating lease costs
2,547 2,180 
Stock-based compensation expense
118,318 62,193 
Other
(6,066)849 
Changes in operating assets and liabilities, net of effects of acquisition
Accounts receivable(12,699)(26,322)
Prepaid expenses and other assets
(11,072)(6,916)
Deferred contract acquisition costs
(38,163)(28,436)
Accounts payable(1,377)(5,658)
Accrued liabilities261 9,900 
Accrued payroll and benefits
(18,786)19,774 
Operating lease liabilities(4,296)(2,288)
Deferred revenue
40,609 60,037 
Other liabilities(1,464)3,663 
Net cash used in operating activities
(171,218)(90,003)
CASH FLOW FROM INVESTING ACTIVITIES:
Purchases of property and equipment(4,827)(3,268)
Purchases of intangible assets
(247)(520)
Capitalization of internal-use software
(10,279)(4,733)
Purchases of short-term investments
(1,728,162)— 
Maturities of short-term investments778,555 — 
Cash paid for acquisition, net of cash and restricted cash acquired
(281,032)(3,449)
Net cash used in investing activities
(1,245,992)(11,970)
CASH FLOW FROM FINANCING ACTIVITIES:
Payments of deferred offering costs(186)(7,416)
Repayment of debt— (20,000)
Proceeds from exercise of stock options
11,282 8,630 
Proceeds from issuance of common stock under the employee stock purchase plan8,682 — 
Proceeds from initial public offering and private placement, net of underwriting discounts and commissions
— 1,388,562 
Net cash provided by financing activities
19,778 1,369,776 
EFFECT OF EXCHANGE RATE CHANGES ON CASH AND CASH EQUIVALENTS
— 1,146 
NET CHANGE IN CASH, CASH EQUIVALENTS, AND RESTRICTED CASH
(1,397,432)1,268,949 
CASH, CASH EQUIVALENTS, AND RESTRICTED CASH–Beginning of period
1,672,051 399,112 
CASH, CASH EQUIVALENTS, AND RESTRICTED CASH–End of period
$274,619 $1,668,061 


SENTINELONE, INC.
RECONCILIATION OF GAAP TO NON-GAAP FINANCIAL INFORMATION
(in thousands, except percentages and per share data)
(unaudited)
Three Months Ended October 31,Nine Months Ended October 31,
2022202120222021
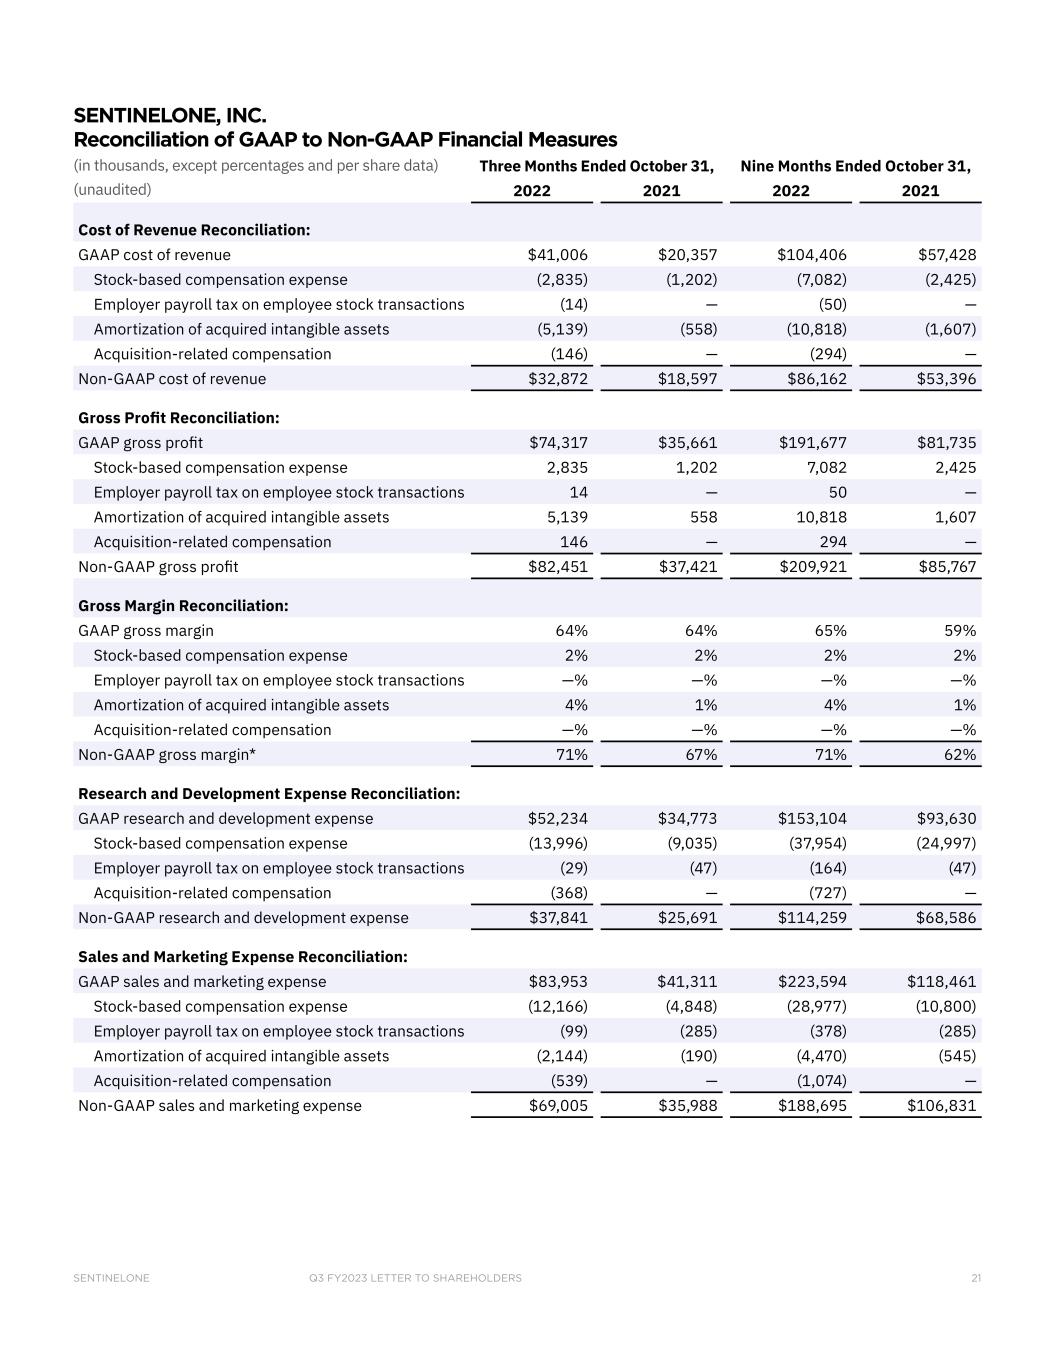
Cost of revenue reconciliation:
GAAP cost of revenue$41,006 $20,357 $104,406 $57,428 
Stock-based compensation expense(2,835)(1,202)(7,082)(2,425)
Employer payroll tax on employee stock transactions(14)— (50)— 
Amortization of acquired intangible assets(5,139)(558)(10,818)(1,607)
Acquisition-related compensation(146)— (294)— 
Non-GAAP cost of revenue$32,872 $18,597 $86,162 $53,396 
Gross profit reconciliation:
GAAP gross profit$74,317 $35,661 $191,677 $81,735 
Stock-based compensation expense2,835 1,202 7,082 2,425 
Employer payroll tax on employee stock transactions14 — 50 — 
Amortization of acquired intangible assets5,139 558 10,818 1,607 
Acquisition-related compensation146 — 294 — 
Non-GAAP gross profit$82,451 $37,421 $209,921 $85,767 
Gross margin reconciliation:
GAAP gross margin64 %64 %65 %59 %
Stock-based compensation expense%%%%
Employer payroll tax on employee stock transactions— %— %— %— %
Amortization of acquired intangible assets%%%%
Acquisition-related compensation— %— %— %— %
Non-GAAP gross margin*71 %67 %71 %62 %
Research and development expense reconciliation:
GAAP research and development expense$52,234 $34,773 $153,104 $93,630 
Stock-based compensation expense(13,996)(9,035)(37,954)(24,997)
Employer payroll tax on employee stock transactions(29)(47)(164)(47)
Acquisition-related compensation(368)— (727)— 
Non-GAAP research and development expense$37,841 $25,691 $114,259 $68,586 
Sales and marketing expense reconciliation:
GAAP sales and marketing expense$83,953 $41,311 $223,594 $118,461 
Stock-based compensation expense(12,166)(4,848)(28,977)(10,800)
Employer payroll tax on employee stock transactions(99)(285)(378)(285)
Amortization of acquired intangible assets(2,144)(190)(4,470)(545)
Acquisition-related compensation(539)— (1,074)— 
Non-GAAP sales and marketing expense$69,005 $35,988 $188,695 $106,831 


SENTINELONE, INC.
RECONCILIATION OF GAAP TO NON-GAAP FINANCIAL INFORMATION
(in thousands, except percentages and per share data)
(unaudited)
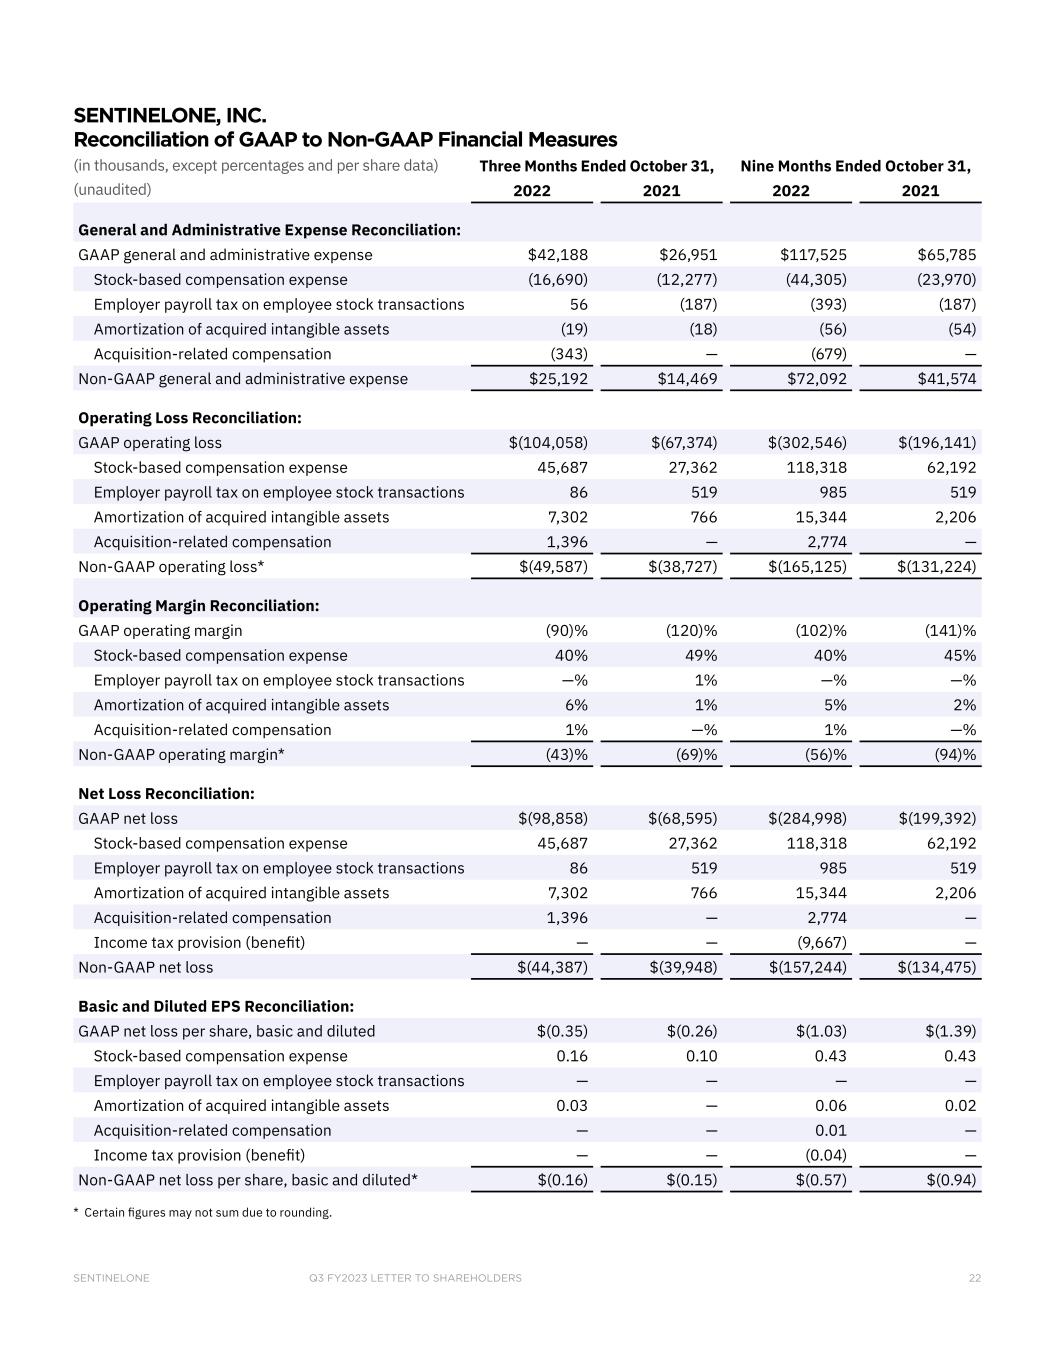
General and administrative expense reconciliation:
GAAP general and administrative expense$42,188 $26,951 $117,525 $65,785 
Stock-based compensation expense(16,690)(12,277)(44,305)(23,970)
Employer payroll tax on employee stock transactions56 (187)(393)(187)
Amortization of acquired intangible assets(19)(18)(56)(54)
Acquisition-related compensation(343)— (679)— 
Non-GAAP general and administrative expense$25,192 $14,469 $72,092 $41,574 
Operating loss reconciliation:
GAAP operating loss $(104,058)$(67,374)$(302,546)$(196,141)
Stock-based compensation expense45,687 27,362 118,318 62,192 
Employer payroll tax on employee stock transactions86 519 985 519 
Amortization of acquired intangible assets7,302 766 15,344 2,206 
Acquisition-related compensation1,396 — 2,774 — 
Non-GAAP operating loss* $(49,587)$(38,727)$(165,125)$(131,224)
Operating margin reconciliation:
GAAP operating margin(90)%(120)%(102)%(141)%
Stock-based compensation expense40 %49 %40 %45 %
Employer payroll tax on employee stock transactions— %%— %— %
Amortization of acquired intangible assets%%%%
Acquisition-related compensation%— %%— %
Non-GAAP operating margin*(43)%(69)%(56)%(94)%
Net loss reconciliation:
GAAP net loss$(98,858)$(68,595)$(284,998)$(199,392)
Stock-based compensation expense45,687 27,362 118,318 62,192 
Employer payroll tax on employee stock transactions86 519 985 519 
Amortization of acquired intangible assets7,302 766 15,344 2,206 
Acquisition-related compensation1,396 — 2,774 — 
Income tax provision (benefit)— — (9,667)— 
Non-GAAP net loss$(44,387)$(39,948)$(157,244)$(134,475)


SENTINELONE, INC.
RECONCILIATION OF GAAP TO NON-GAAP FINANCIAL INFORMATION (CONTINUED)
(in thousands, except percentages and per share data)
(unaudited)
Basic and diluted EPS reconciliation:
GAAP net loss per share, basic and diluted$(0.35)$(0.26)$(1.03)$(1.39)
Stock-based compensation expense0.16 0.10 0.43 0.43 
Employer payroll tax on employee stock transactions— — — — 
Amortization of acquired intangible assets0.03 — 0.06 0.02 
Acquisition-related compensation— — 0.01 — 
Income tax provision (benefit)— — (0.04)— 
Non-GAAP net loss per share, basic and diluted*$(0.16)$(0.15)$(0.57)$(0.94)

* Certain figures may not sum due to rounding.


SENTINELONE, INC.
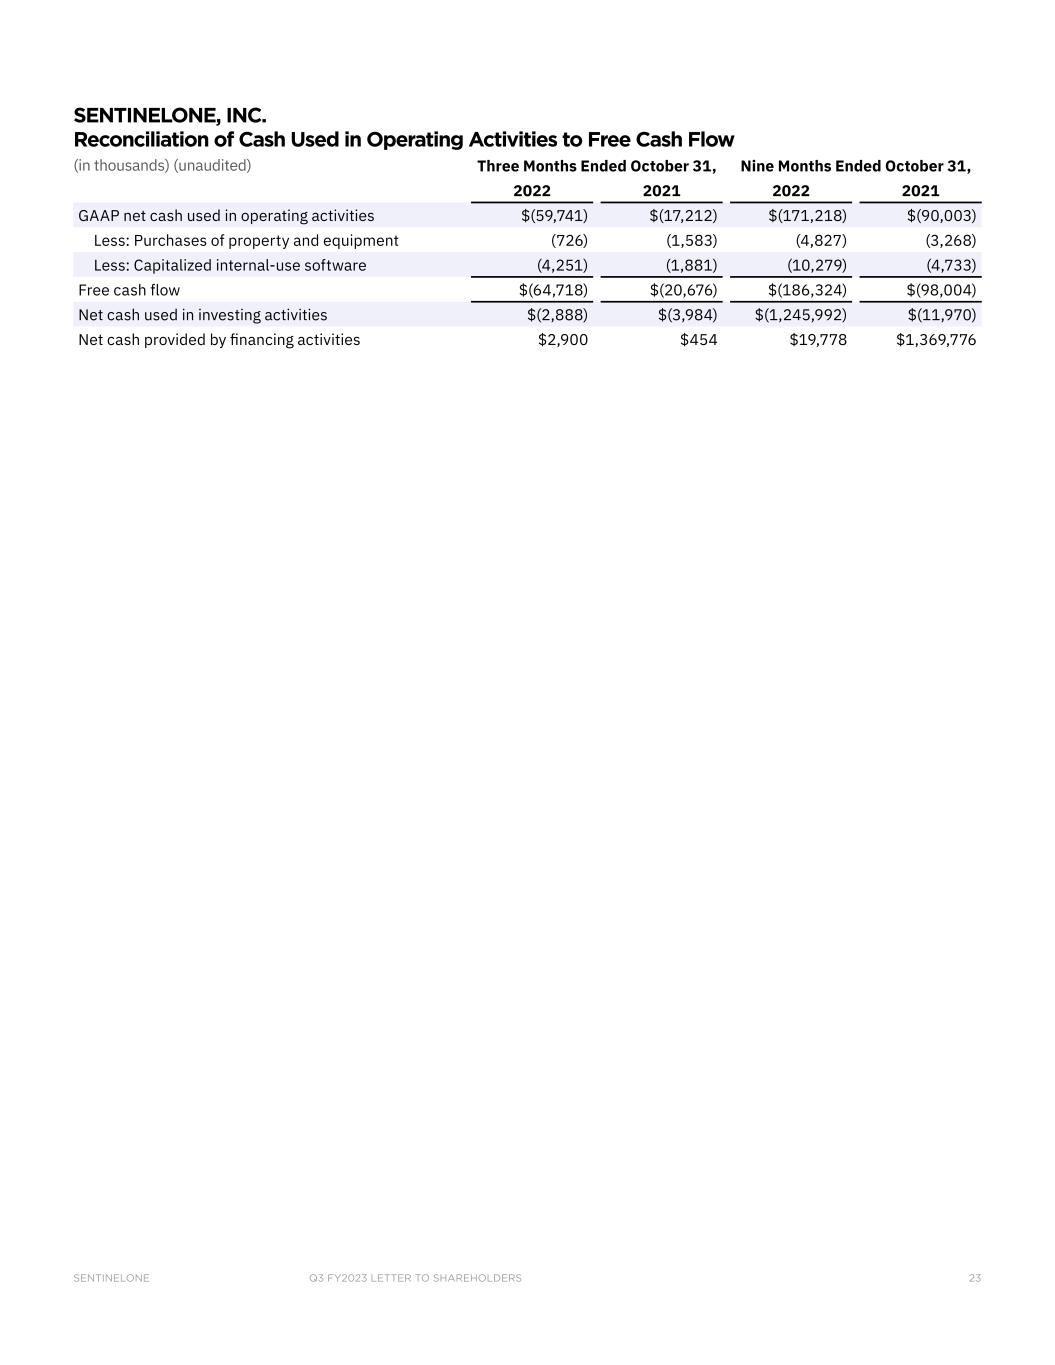
SELECTED CASH FLOW INFORMATION
(in thousands)
(unaudited)

Reconciliation of cash used in operating activities to free cash flow

Three Months Ended October 31,Nine Months Ended October 31,
2022202120222021
GAAP net cash used in operating activities$(59,741)$(17,212)$(171,218)$(90,003)
Less: Purchases of property and equipment(726)(1,583)(4,827)(3,268)
Less: Capitalized internal-use software(4,251)(1,881)(10,279)(4,733)
Free cash flow$(64,718)$(20,676)$(186,324)$(98,004)
Net cash used in investing activities$(2,888)$(3,984)$(1,245,992)$(11,970)
Net cash provided by financing activities$2,900 $454 $19,778 $1,369,776 


Se nt in el O ne Q 3 F Y 20 23 Q3 FY2023 Letter to Shareholders December 6, 2022


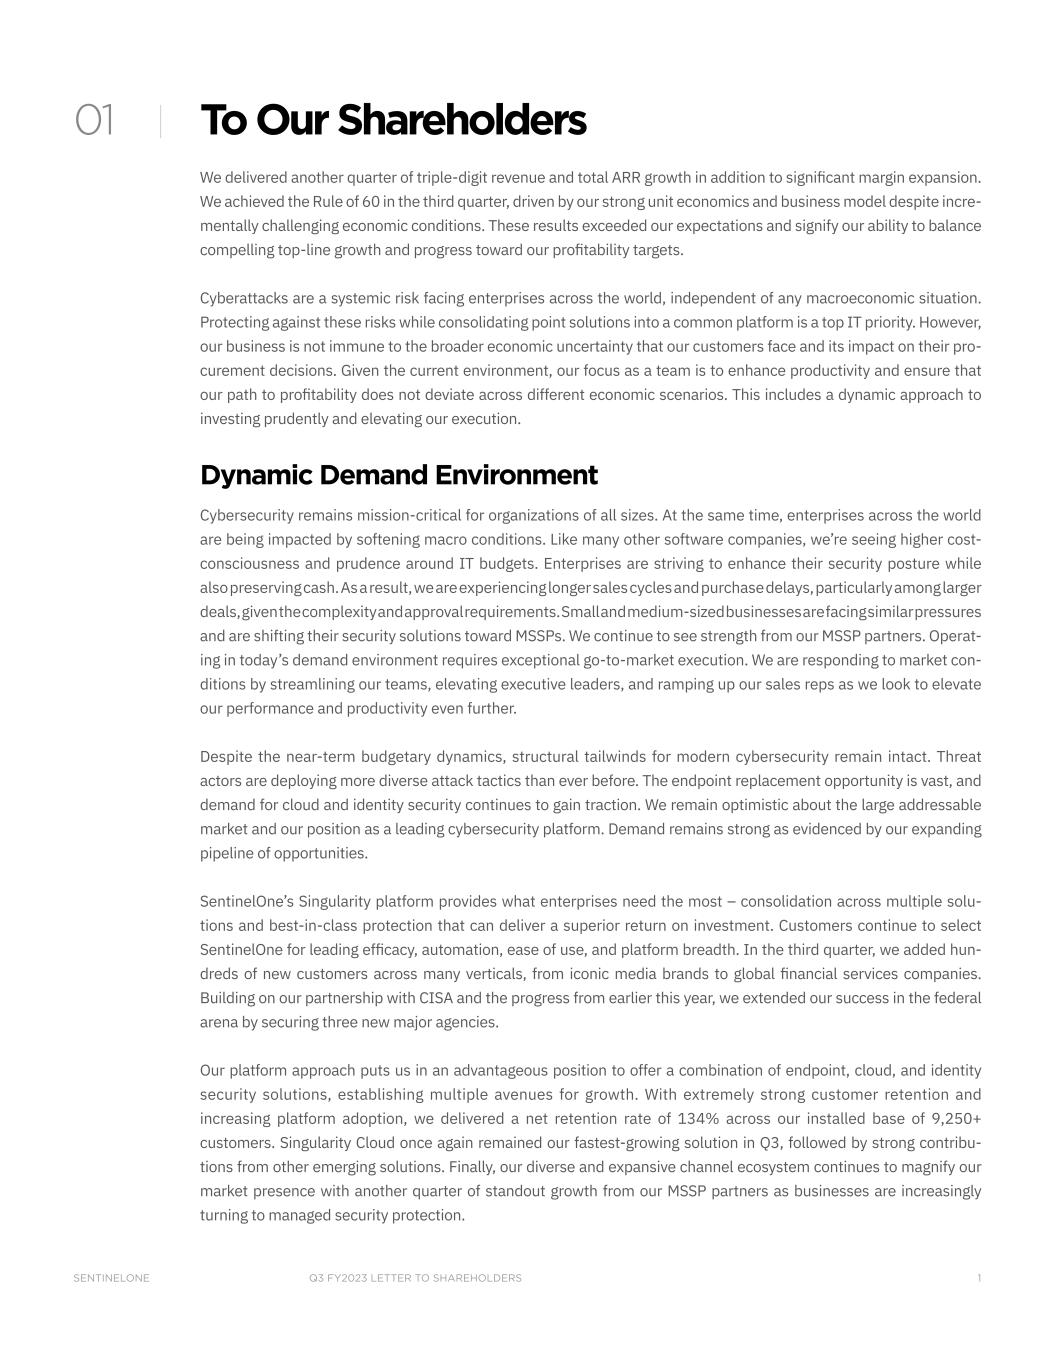
Q3 FY2023 LETTER TO SHAREHOLDERSSENTINELONE 1 To Our Shareholders We delivered another quarter of triple-digit revenue and total ARR growth in addition to significant margin expansion. We achieved the Rule of 60 in the third quarter, driven by our strong unit economics and business model despite incre- mentally challenging economic conditions. These results exceeded our expectations and signify our ability to balance compelling top-line growth and progress toward our profitability targets. Cyberattacks are a systemic risk facing enterprises across the world, independent of any macroeconomic situation. Protecting against these risks while consolidating point solutions into a common platform is a top IT priority. However, our business is not immune to the broader economic uncertainty that our customers face and its impact on their pro- curement decisions. Given the current environment, our focus as a team is to enhance productivity and ensure that our path to profitability does not deviate across different economic scenarios. This includes a dynamic approach to investing prudently and elevating our execution. Dynamic Demand Environment Cybersecurity remains mission-critical for organizations of all sizes. At the same time, enterprises across the world are being impacted by softening macro conditions. Like many other software companies, we’re seeing higher cost- consciousness and prudence around IT budgets. Enterprises are striving to enhance their security posture while also preserving cash. As a result, we are experiencing longer sales cycles and purchase delays, particularly among larger deals, given the complexity and approval requirements. Small and medium-sized businesses are facing similar pressures and are shifting their security solutions toward MSSPs. We continue to see strength from our MSSP partners. Operat- ing in today’s demand environment requires exceptional go-to-market execution. We are responding to market con- ditions by streamlining our teams, elevating executive leaders, and ramping up our sales reps as we look to elevate our performance and productivity even further. Despite the near-term budgetary dynamics, structural tailwinds for modern cybersecurity remain intact. Threat actors are deploying more diverse attack tactics than ever before. The endpoint replacement opportunity is vast, and demand for cloud and identity security continues to gain traction. We remain optimistic about the large addressable market and our position as a leading cybersecurity platform. Demand remains strong as evidenced by our expanding pipeline of opportunities. SentinelOne’s Singularity platform provides what enterprises need the most – consolidation across multiple solu- tions and best-in-class protection that can deliver a superior return on investment. Customers continue to select SentinelOne for leading efficacy, automation, ease of use, and platform breadth. In the third quarter, we added hun- dreds of new customers across many verticals, from iconic media brands to global financial services companies. Building on our partnership with CISA and the progress from earlier this year, we extended our success in the federal arena by securing three new major agencies. Our platform approach puts us in an advantageous position to offer a combination of endpoint, cloud, and identity security solutions, establishing multiple avenues for growth. With extremely strong customer retention and increasing platform adoption, we delivered a net retention rate of 134% across our installed base of 9,250+ customers. Singularity Cloud once again remained our fastest-growing solution in Q3, followed by strong contribu- tions from other emerging solutions. Finally, our diverse and expansive channel ecosystem continues to magnify our market presence with another quarter of standout growth from our MSSP partners as businesses are increasingly turning to managed security protection. 01


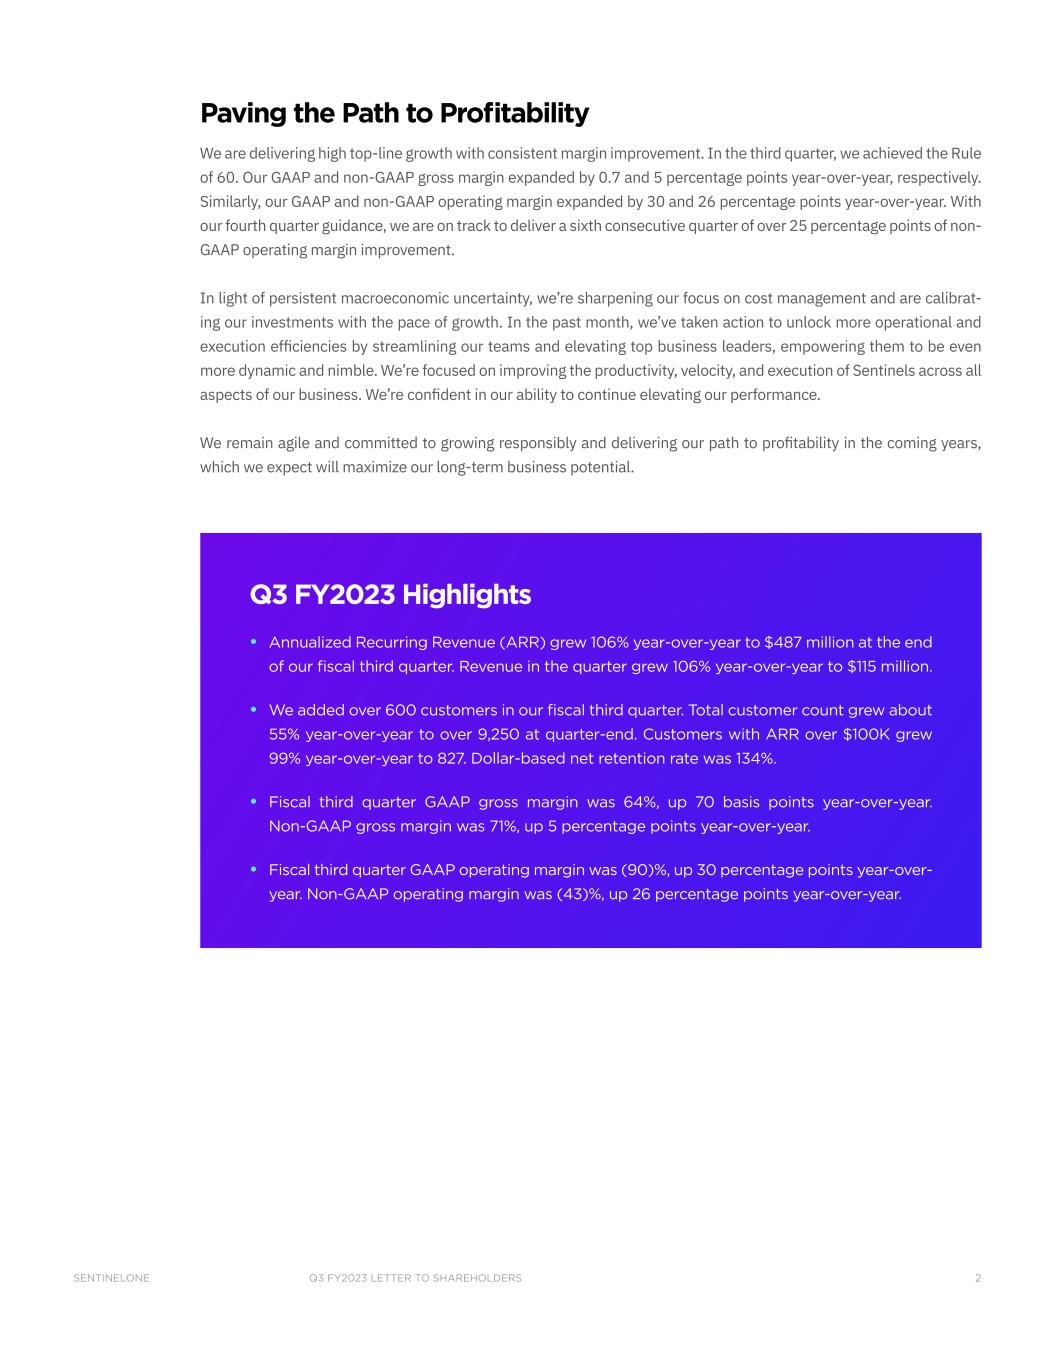
Q3 FY2023 LETTER TO SHAREHOLDERSSENTINELONE 2 Paving the Path to Profitability We are delivering high top-line growth with consistent margin improvement. In the third quarter, we achieved the Rule of 60. Our GAAP and non-GAAP gross margin expanded by 0.7 and 5 percentage points year-over-year, respectively. Similarly, our GAAP and non-GAAP operating margin expanded by 30 and 26 percentage points year-over-year. With our fourth quarter guidance, we are on track to deliver a sixth consecutive quarter of over 25 percentage points of non- GAAP operating margin improvement. In light of persistent macroeconomic uncertainty, we’re sharpening our focus on cost management and are calibrat- ing our investments with the pace of growth. In the past month, we’ve taken action to unlock more operational and execution efficiencies by streamlining our teams and elevating top business leaders, empowering them to be even more dynamic and nimble. We’re focused on improving the productivity, velocity, and execution of Sentinels across all aspects of our business. We’re confident in our ability to continue elevating our performance. We remain agile and committed to growing responsibly and delivering our path to profitability in the coming years, which we expect will maximize our long-term business potential. Q3 FY2023 Highlights • Annualized Recurring Revenue (ARR) grew 106% year-over-year to $487 million at the end of our fiscal third quarter. Revenue in the quarter grew 106% year-over-year to $115 million. • We added over 600 customers in our fiscal third quarter. Total customer count grew about 55% year-over-year to over 9,250 at quarter-end. Customers with ARR over $100K grew 99% year-over-year to 827. Dollar-based net retention rate was 134%. • Fiscal third quarter GAAP gross margin was 64%, up 70 basis points year-over-year. Non-GAAP gross margin was 71%, up 5 percentage points year-over-year. • Fiscal third quarter GAAP operating margin was (90)%, up 30 percentage points year-over- year. Non-GAAP operating margin was (43)%, up 26 percentage points year-over-year.


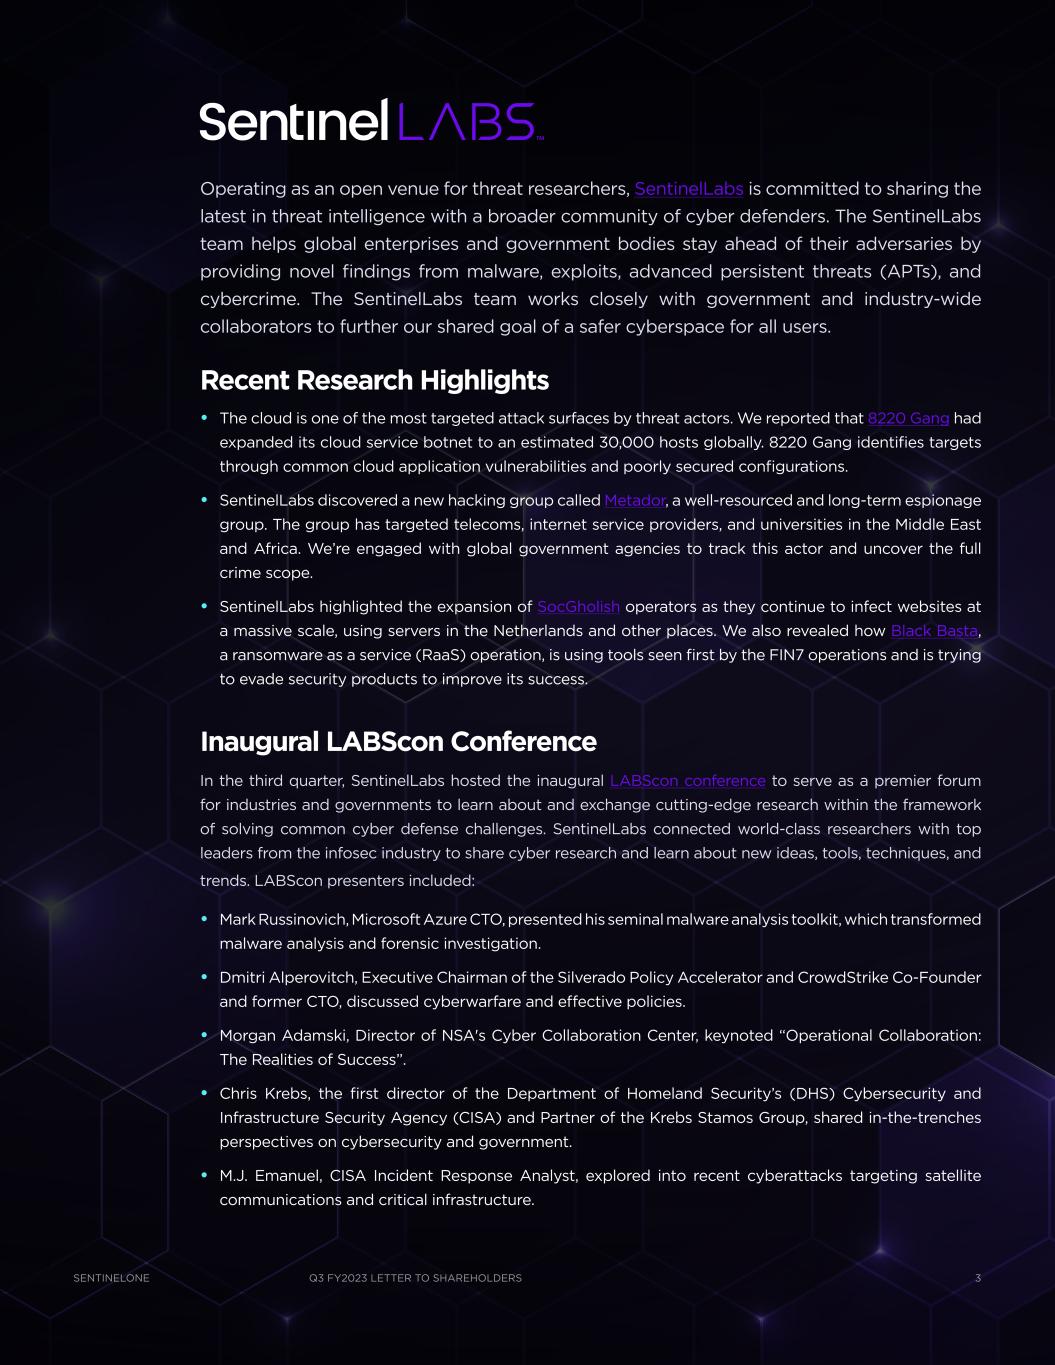
Q3 FY2023 LETTER TO SHAREHOLDERSSENTINELONE 3 Operating as an open venue for threat researchers, SentinelLabs is committed to sharing the latest in threat intelligence with a broader community of cyber defenders. The SentinelLabs team helps global enterprises and government bodies stay ahead of their adversaries by providing novel findings from malware, exploits, advanced persistent threats (APTs), and cybercrime. The SentinelLabs team works closely with government and industry-wide collaborators to further our shared goal of a safer cyberspace for all users. Recent Research Highlights • The cloud is one of the most targeted attack surfaces by threat actors. We reported that 8220 Gang had expanded its cloud service botnet to an estimated 30,000 hosts globally. 8220 Gang identifies targets through common cloud application vulnerabilities and poorly secured configurations. • SentinelLabs discovered a new hacking group called Metador, a well-resourced and long-term espionage group. The group has targeted telecoms, internet service providers, and universities in the Middle East and Africa. We’re engaged with global government agencies to track this actor and uncover the full crime scope. • SentinelLabs highlighted the expansion of SocGholish operators as they continue to infect websites at a massive scale, using servers in the Netherlands and other places. We also revealed how Black Basta, a ransomware as a service (RaaS) operation, is using tools seen first by the FIN7 operations and is trying to evade security products to improve its success. Inaugural LABScon Conference In the third quarter, SentinelLabs hosted the inaugural LABScon conference to serve as a premier forum for industries and governments to learn about and exchange cutting-edge research within the framework of solving common cyber defense challenges. SentinelLabs connected world-class researchers with top leaders from the infosec industry to share cyber research and learn about new ideas, tools, techniques, and trends. LABScon presenters included: • Mark Russinovich, Microsoft Azure CTO, presented his seminal malware analysis toolkit, which transformed malware analysis and forensic investigation. • Dmitri Alperovitch, Executive Chairman of the Silverado Policy Accelerator and CrowdStrike Co-Founder and former CTO, discussed cyberwarfare and effective policies. • Morgan Adamski, Director of NSA's Cyber Collaboration Center, keynoted “Operational Collaboration: The Realities of Success”. • Chris Krebs, the first director of the Department of Homeland Security’s (DHS) Cybersecurity and Infrastructure Security Agency (CISA) and Partner of the Krebs Stamos Group, shared in-the-trenches perspectives on cybersecurity and government. • M.J. Emanuel, CISA Incident Response Analyst, explored into recent cyberattacks targeting satellite communications and critical infrastructure.


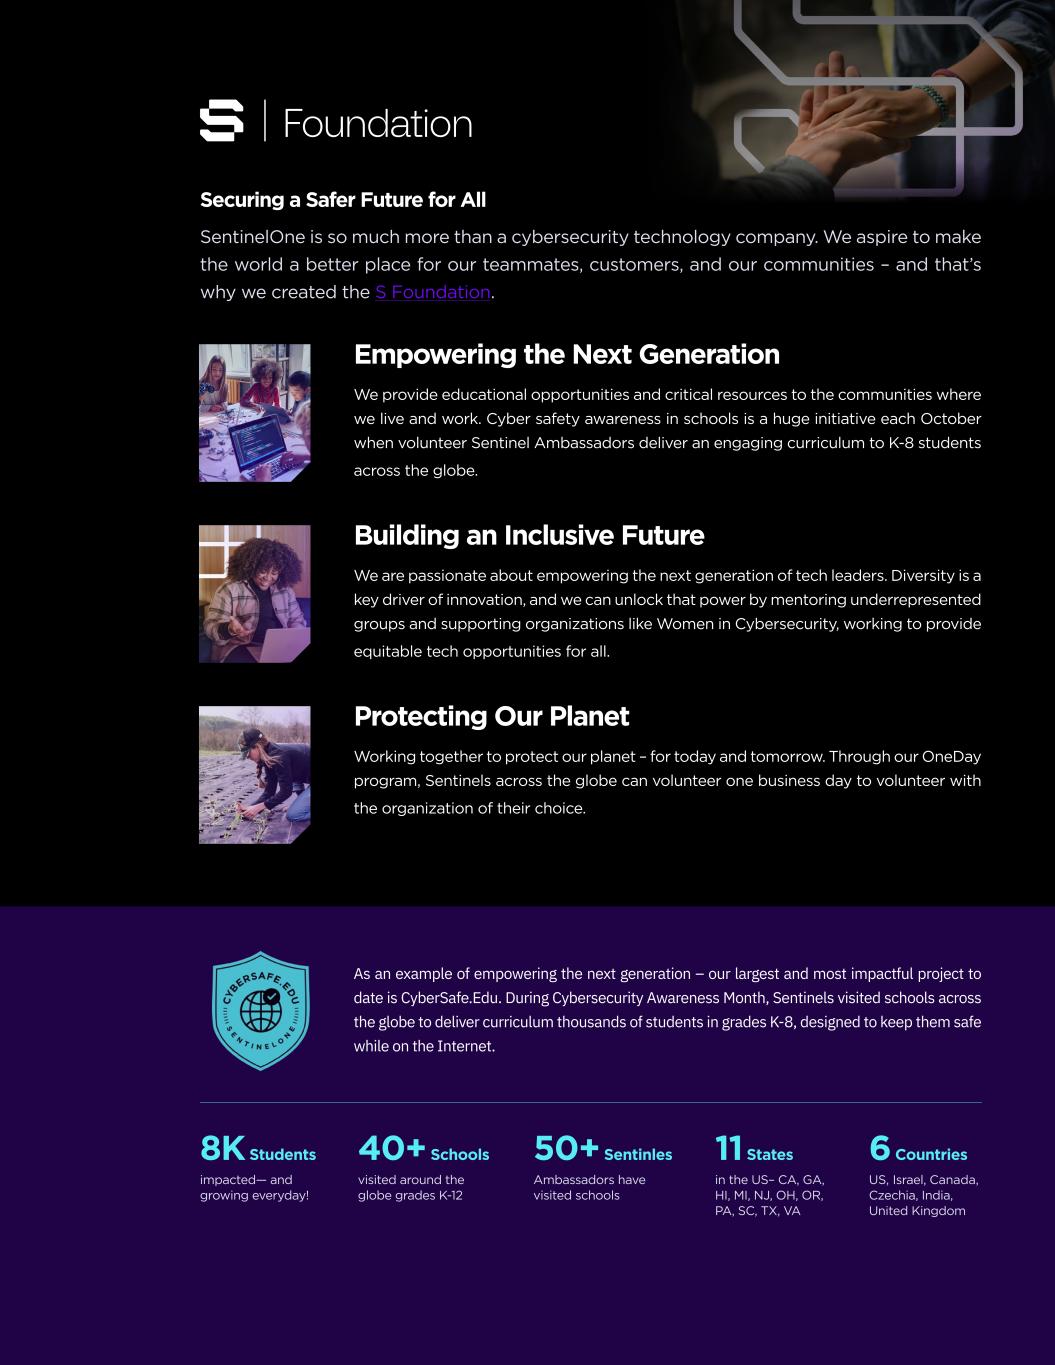
Q3 FY2023 LETTER TO SHAREHOLDERSSENTINELONE 4 Securing a Safer Future for All SentinelOne is so much more than a cybersecurity technology company. We aspire to make the world a better place for our teammates, customers, and our communities – and that’s why we created the S Foundation. Empowering the Next Generation We provide educational opportunities and critical resources to the communities where we live and work. Cyber safety awareness in schools is a huge initiative each October when volunteer Sentinel Ambassadors deliver an engaging curriculum to K-8 students across the globe. Building an Inclusive Future We are passionate about empowering the next generation of tech leaders. Diversity is a key driver of innovation, and we can unlock that power by mentoring underrepresented groups and supporting organizations like Women in Cybersecurity, working to provide equitable tech opportunities for all. Protecting Our Planet Working together to protect our planet – for today and tomorrow. Through our OneDay program, Sentinels across the globe can volunteer one business day to volunteer with the organization of their choice. As an example of empowering the next generation – our largest and most impactful project to date is CyberSafe.Edu. During Cybersecurity Awareness Month, Sentinels visited schools across the globe to deliver curriculum thousands of students in grades K-8, designed to keep them safe while on the Internet. 8K Students impacted— and growing everyday! 50+ Sentinles Ambassadors have visited schools 40+ Schools visited around the globe grades K-12 6 Countries US, Israel, Canada, Czechia, India, United Kingdom 11 States in the US– CA, GA, HI, MI, NJ, OH, OR, PA, SC, TX, VA


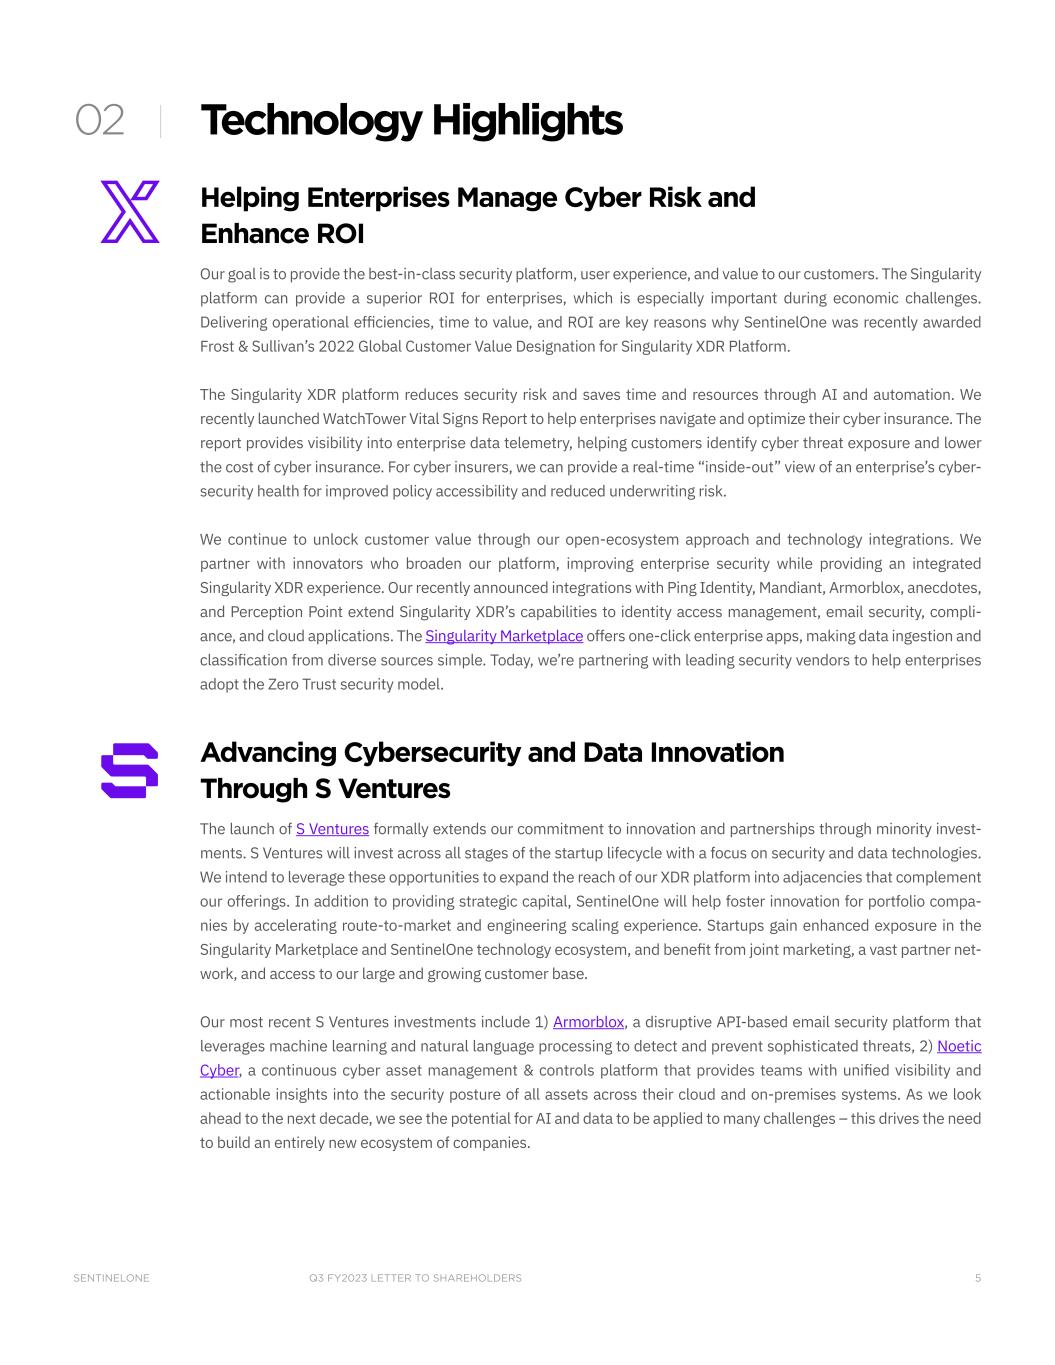
Q3 FY2023 LETTER TO SHAREHOLDERSSENTINELONE 5 Technology Highlights Helping Enterprises Manage Cyber Risk and Enhance ROI Our goal is to provide the best-in-class security platform, user experience, and value to our customers. The Singularity platform can provide a superior ROI for enterprises, which is especially important during economic challenges. Delivering operational efficiencies, time to value, and ROI are key reasons why SentinelOne was recently awarded Frost & Sullivan’s 2022 Global Customer Value Designation for Singularity XDR Platform. The Singularity XDR platform reduces security risk and saves time and resources through AI and automation. We recently launched WatchTower Vital Signs Report to help enterprises navigate and optimize their cyber insurance. The report provides visibility into enterprise data telemetry, helping customers identify cyber threat exposure and lower the cost of cyber insurance. For cyber insurers, we can provide a real-time “inside-out” view of an enterprise’s cyber- security health for improved policy accessibility and reduced underwriting risk. We continue to unlock customer value through our open-ecosystem approach and technology integrations. We partner with innovators who broaden our platform, improving enterprise security while providing an integrated Singularity XDR experience. Our recently announced integrations with Ping Identity, Mandiant, Armorblox, anecdotes, and Perception Point extend Singularity XDR’s capabilities to identity access management, email security, compli- ance, and cloud applications. The Singularity Marketplace offers one-click enterprise apps, making data ingestion and classification from diverse sources simple. Today, we’re partnering with leading security vendors to help enterprises adopt the Zero Trust security model. Advancing Cybersecurity and Data Innovation Through S Ventures The launch of S Ventures formally extends our commitment to innovation and partnerships through minority invest- ments. S Ventures will invest across all stages of the startup lifecycle with a focus on security and data technologies. We intend to leverage these opportunities to expand the reach of our XDR platform into adjacencies that complement our offerings. In addition to providing strategic capital, SentinelOne will help foster innovation for portfolio compa- nies by accelerating route-to-market and engineering scaling experience. Startups gain enhanced exposure in the Singularity Marketplace and SentinelOne technology ecosystem, and benefit from joint marketing, a vast partner net- work, and access to our large and growing customer base. Our most recent S Ventures investments include 1) Armorblox, a disruptive API-based email security platform that leverages machine learning and natural language processing to detect and prevent sophisticated threats, 2) Noetic Cyber, a continuous cyber asset management & controls platform that provides teams with unified visibility and actionable insights into the security posture of all assets across their cloud and on-premises systems. As we look ahead to the next decade, we see the potential for AI and data to be applied to many challenges – this drives the need to build an entirely new ecosystem of companies. 02


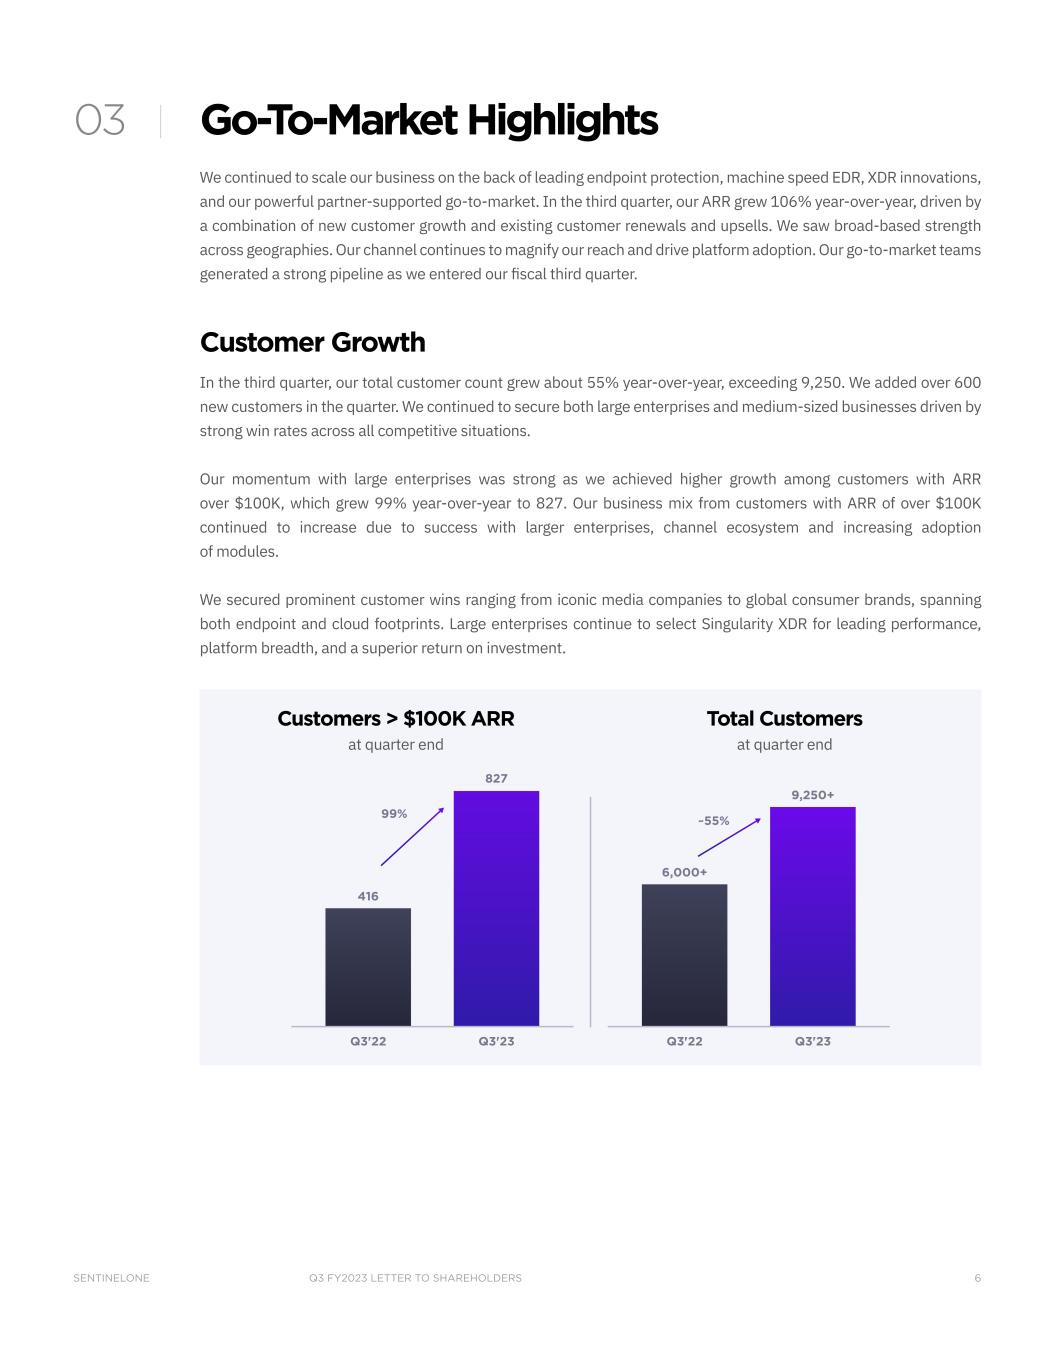
Q3 FY2023 LETTER TO SHAREHOLDERSSENTINELONE 6 Go-To-Market Highlights We continued to scale our business on the back of leading endpoint protection, machine speed EDR, XDR innovations, and our powerful partner-supported go-to-market. In the third quarter, our ARR grew 106% year-over-year, driven by a combination of new customer growth and existing customer renewals and upsells. We saw broad-based strength across geographies. Our channel continues to magnify our reach and drive platform adoption. Our go-to-market teams generated a strong pipeline as we entered our fiscal third quarter. Customer Growth In the third quarter, our total customer count grew about 55% year-over-year, exceeding 9,250. We added over 600 new customers in the quarter. We continued to secure both large enterprises and medium-sized businesses driven by strong win rates across all competitive situations. Our momentum with large enterprises was strong as we achieved higher growth among customers with ARR over $100K, which grew 99% year-over-year to 827. Our business mix from customers with ARR of over $100K continued to increase due to success with larger enterprises, channel ecosystem and increasing adoption of modules. We secured prominent customer wins ranging from iconic media companies to global consumer brands, spanning both endpoint and cloud footprints. Large enterprises continue to select Singularity XDR for leading performance, platform breadth, and a superior return on investment. Customer Growth 416 827 Q3'22 Q3'23 99% 6,000+ 9,250+ Q3'22 Q3'23 ~55% Customers > $100K ARR at quarter end Total Customers at quarter end 03


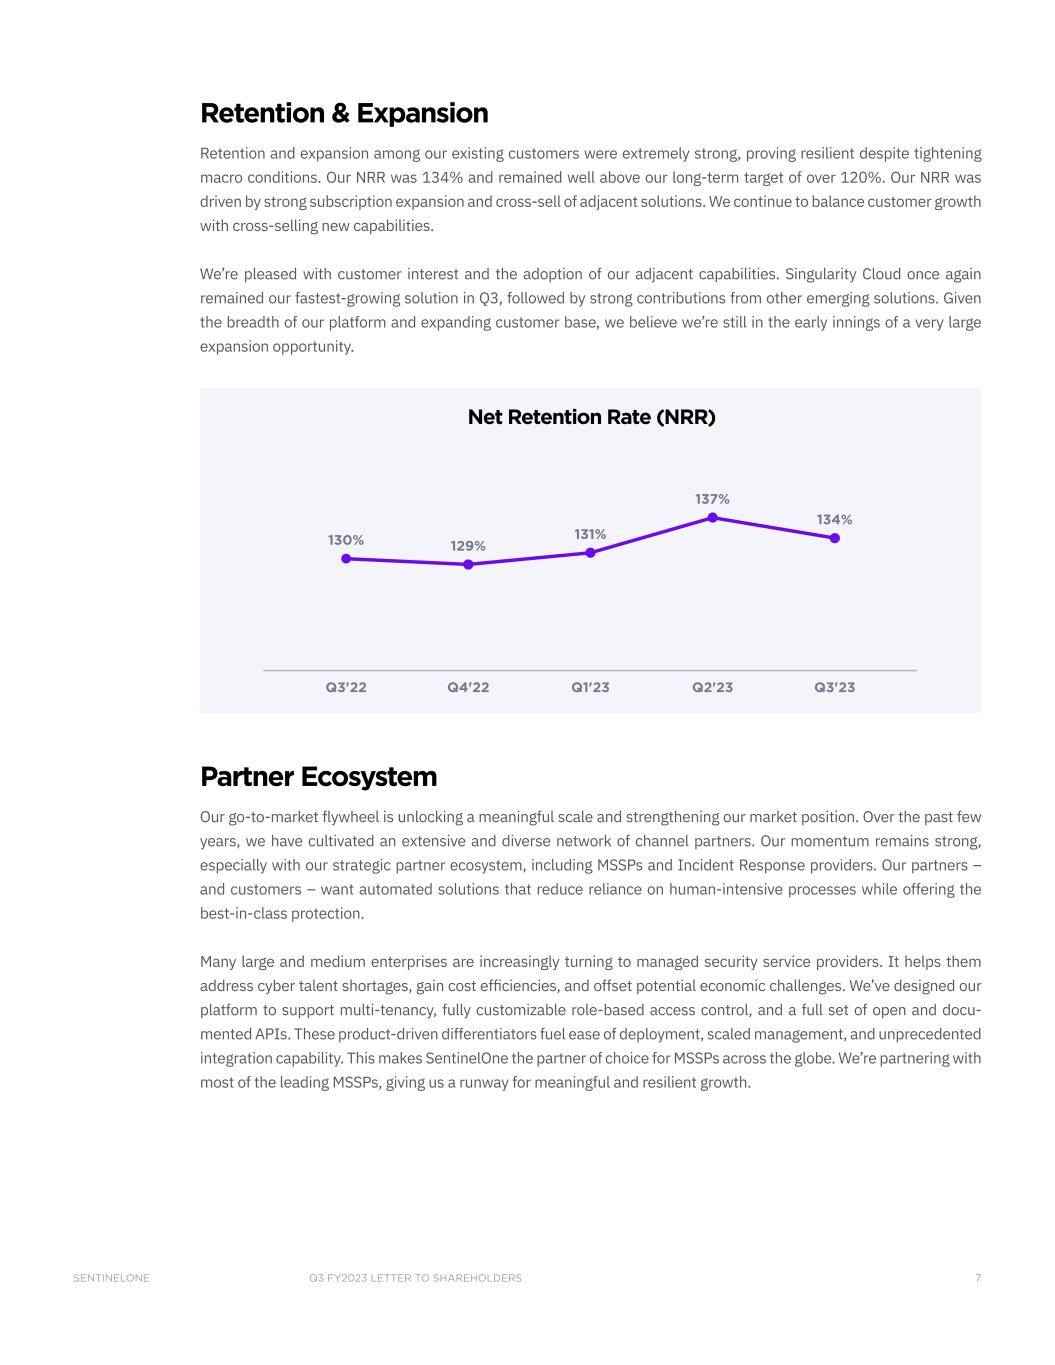
Q3 FY2023 LETTER TO SHAREHOLDERSSENTINELONE 7 Retention & Expansion Retention and expansion among our existing customers were extremely strong, proving resilient despite tightening macro conditions. Our NRR was 134% and remained well above our long-term target of over 120%. Our NRR was driven by strong subscription expansion and cross-sell of adjacent solutions. We continue to balance customer growth with cross-selling new capabilities. We’re pleased with customer interest and the adoption of our adjacent capabilities. Singularity Cloud once again remained our fastest-growing solution in Q3, followed by strong contributions from other emerging solutions. Given the breadth of our platform and expanding customer base, we believe we’re still in the early innings of a very large expansion opportunity. Q3'22 Q4'22 Q1'23 130% 131% 129% 134% Q3'23 137% Q2'23 Net Retention Rate (NRR) Partner Ecosystem Our go-to-market flywheel is unlocking a meaningful scale and strengthening our market position. Over the past few years, we have cultivated an extensive and diverse network of channel partners. Our momentum remains strong, especially with our strategic partner ecosystem, including MSSPs and Incident Response providers. Our partners – and customers – want automated solutions that reduce reliance on human-intensive processes while offering the best-in-class protection. Many large and medium enterprises are increasingly turning to managed security service providers. It helps them address cyber talent shortages, gain cost efficiencies, and offset potential economic challenges. We’ve designed our platform to support multi-tenancy, fully customizable role-based access control, and a full set of open and docu- mented APIs. These product-driven differentiators fuel ease of deployment, scaled management, and unprecedented integration capability. This makes SentinelOne the partner of choice for MSSPs across the globe. We’re partnering with most of the leading MSSPs, giving us a runway for meaningful and resilient growth.


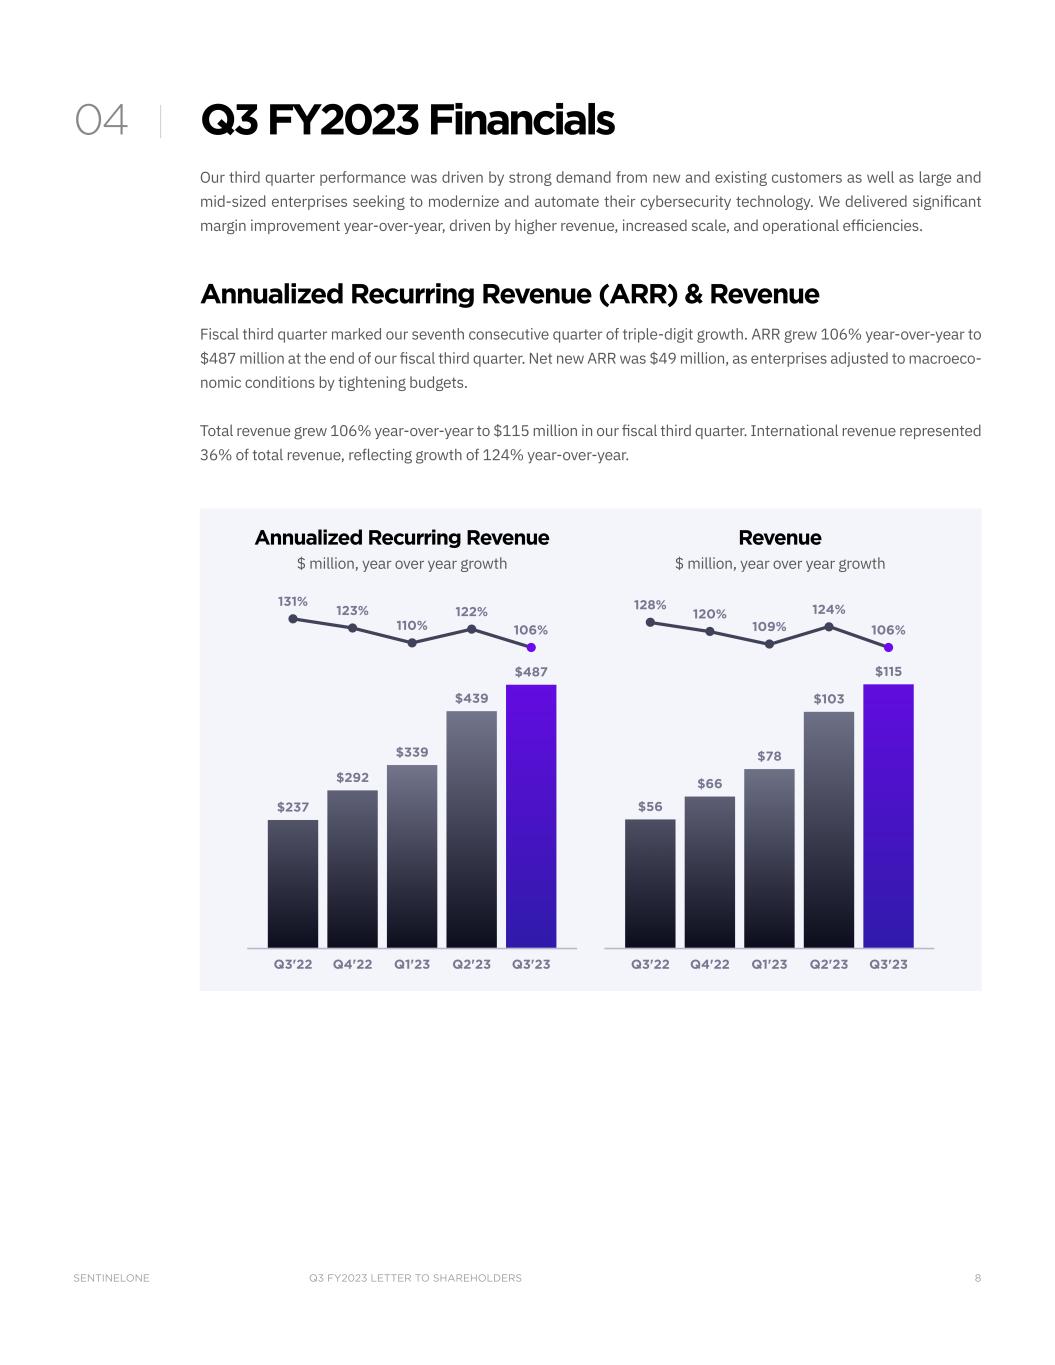
Q3 FY2023 LETTER TO SHAREHOLDERSSENTINELONE 8 Q3 FY2023 Financials Our third quarter performance was driven by strong demand from new and existing customers as well as large and mid-sized enterprises seeking to modernize and automate their cybersecurity technology. We delivered significant margin improvement year-over-year, driven by higher revenue, increased scale, and operational efficiencies. Annualized Recurring Revenue (ARR) & Revenue Fiscal third quarter marked our seventh consecutive quarter of triple-digit growth. ARR grew 106% year-over-year to $487 million at the end of our fiscal third quarter. Net new ARR was $49 million, as enterprises adjusted to macroeco- nomic conditions by tightening budgets. Total revenue grew 106% year-over-year to $115 million in our fiscal third quarter. International revenue represented 36% of total revenue, reflecting growth of 124% year-over-year. Annual Recurring Revenue Revenue $237 $292 $339 $487 131% 123% 110% $56 128% 120% 109% $115 $78 Q3'22 Q4'22 Q1'23 Q3'23Q2'23 Q3'22 Q4'22 Q1'23 Q3'23Q2'23 122% 106% $439 $66 124% 106% $103 Annualized Recurring Revenue $ million, y ar over year growth Revenue $ million, year over year growth 04


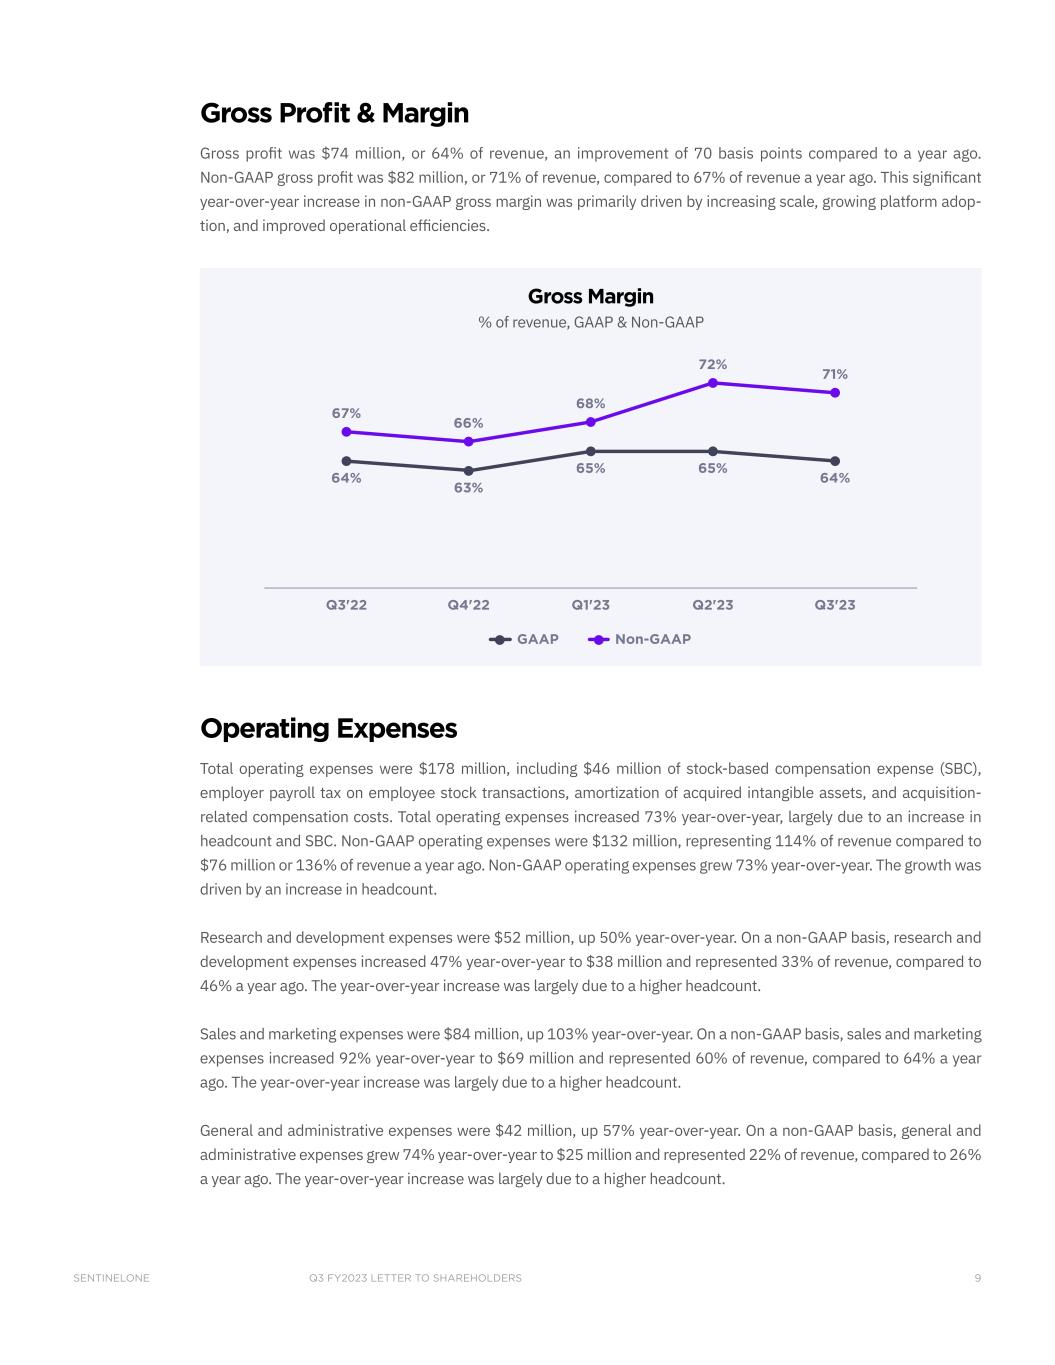
Q3 FY2023 LETTER TO SHAREHOLDERSSENTINELONE 9 Gross Profit & Margin Gross profit was $74 million, or 64% of revenue, an improvement of 70 basis points compared to a year ago. Non-GAAP gross profit was $82 million, or 71% of revenue, compared to 67% of revenue a year ago. This significant year-over-year increase in non-GAAP gross margin was primarily driven by increasing scale, growing platform adop- tion, and improved operational efficiencies. Gross Margin 63% 66% GAAP Non-GAAP 64% 67% Q3'22 Q4'22 Q1'23 Q2'23 65% 68% 65% 72% Q3'23 64% 71% Gross Margin % of revenue, GAAP & Non-GAAP Operating Expenses Total operating expenses were $178 million, including $46 million of stock-based compensation expense (SBC), employer payroll tax on employee stock transactions, amortization of acquired intangible assets, and acquisition- related compensation costs. Total operating expenses increased 73% year-over-year, largely due to an increase in headcount and SBC. Non-GAAP operating expenses were $132 million, representing 114% of revenue compared to $76 million or 136% of revenue a year ago. Non-GAAP operating expenses grew 73% year-over-year. The growth was driven by an increase in headcount. Research and development expenses were $52 million, up 50% year-over-year. On a non-GAAP basis, research and development expenses increased 47% year-over-year to $38 million and represented 33% of revenue, compared to 46% a year ago. The year-over-year increase was largely due to a higher headcount. Sales and marketing expenses were $84 million, up 103% year-over-year. On a non-GAAP basis, sales and marketing expenses increased 92% year-over-year to $69 million and represented 60% of revenue, compared to 64% a year ago. The year-over-year increase was largely due to a higher headcount. General and administrative expenses were $42 million, up 57% year-over-year. On a non-GAAP basis, general and administrative expenses grew 74% year-over-year to $25 million and represented 22% of revenue, compared to 26% a year ago. The year-over-year increase was largely due to a higher headcount.


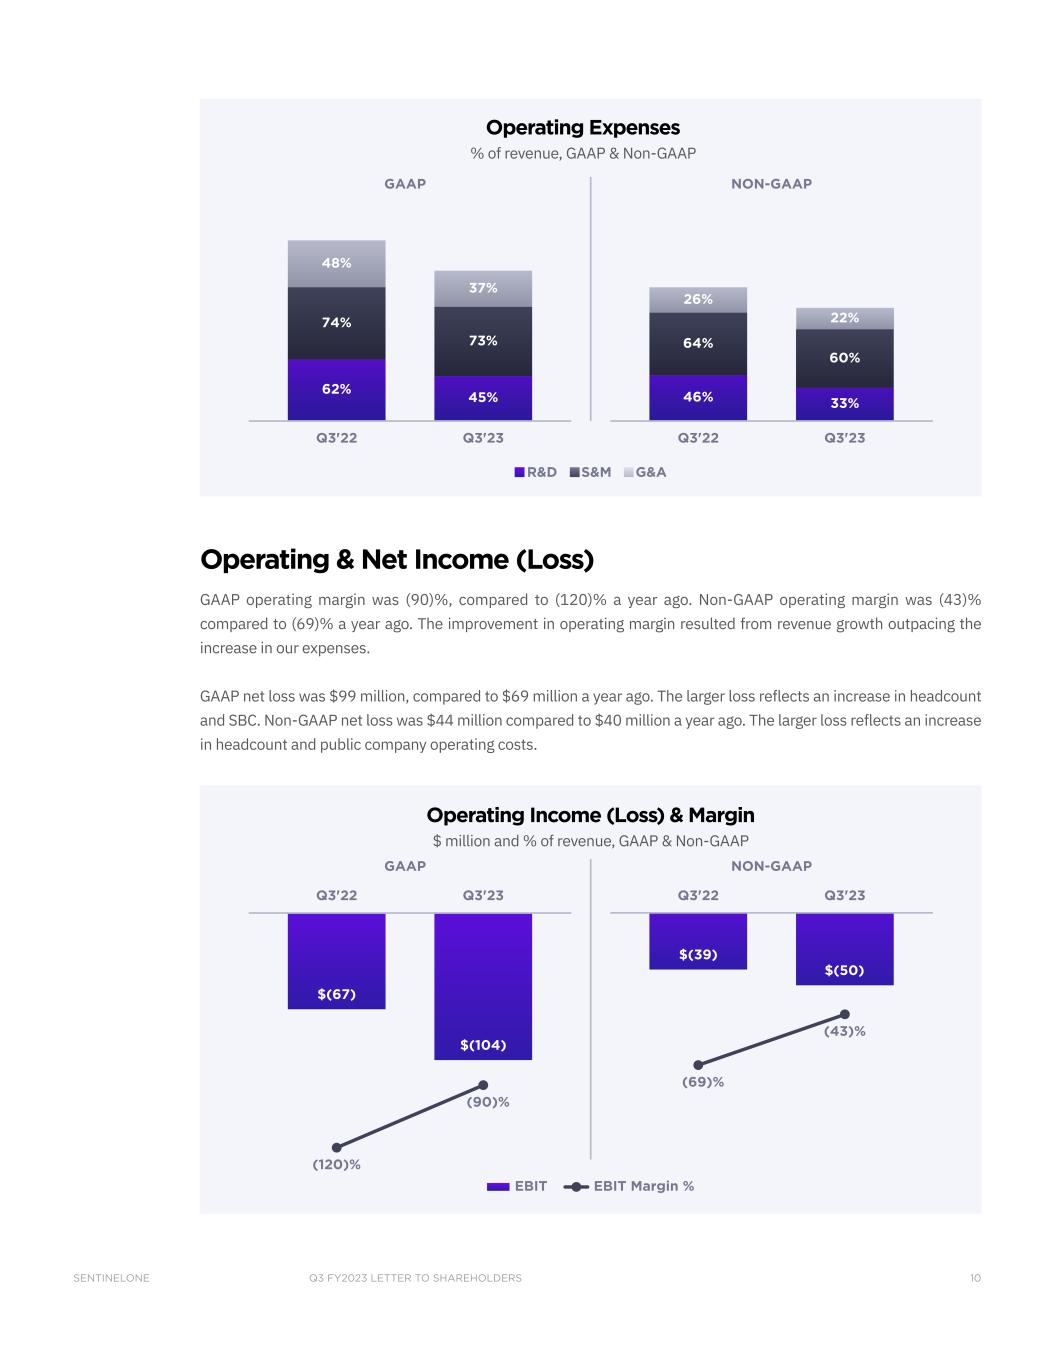
Q3 FY2023 LETTER TO SHAREHOLDERSSENTINELONE 10 GAAP NON-GAAP Q3'22 Q3'23 46% 33% 64% 60% 26% 22% Q3'22 Q3'23 62% 45% 74% 73% 48% 37% R&D S&M G&A Operating Expenses % of revenue, GAAP & Non-GAAP Operating & Net Income (Loss) GAAP operating margin was (90)%, compared to (120)% a year ago. Non-GAAP operating margin was (43)% compared to (69)% a year ago. The improvement in operating margin resulted from revenue growth outpacing the increase in our expenses. GAAP net loss was $99 million, compared to $69 million a year ago. The larger loss reflects an increase in headcount and SBC. Non-GAAP net loss was $44 million compared to $40 million a year ago. The larger loss reflects an increase in headcount and public company operating costs. $(67) $(104) Q3'22 Q3'23 EBIT EBIT Margin % $(39) $(50) Q3'22 Q3'23 GAAP NON-GAAP (69)% (43)% (90)% (120)% Operating Income (Loss) & Margin $ million and % of revenue, GAAP & Non-GAAP


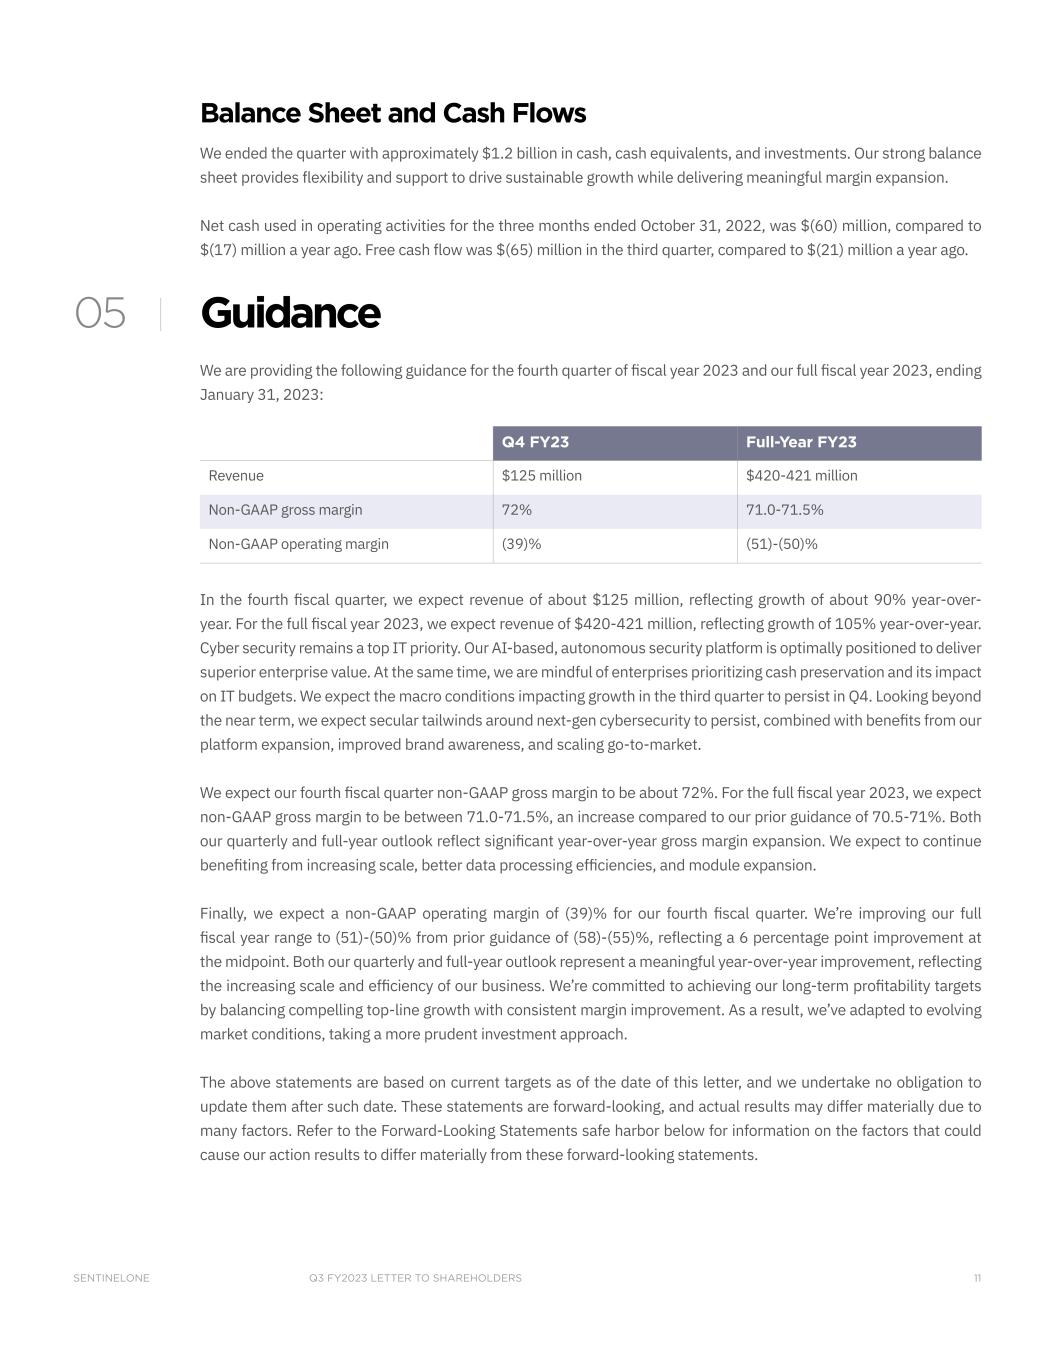
Q3 FY2023 LETTER TO SHAREHOLDERSSENTINELONE 11 Balance Sheet and Cash Flows We ended the quarter with approximately $1.2 billion in cash, cash equivalents, and investments. Our strong balance sheet provides flexibility and support to drive sustainable growth while delivering meaningful margin expansion. Net cash used in operating activities for the three months ended October 31, 2022, was $(60) million, compared to $(17) million a year ago. Free cash flow was $(65) million in the third quarter, compared to $(21) million a year ago. Guidance We are providing the following guidance for the fourth quarter of fiscal year 2023 and our full fiscal year 2023, ending January 31, 2023: Q4 FY23 Full-Year FY23 Revenue $125 million $420-421 million Non-GAAP gross margin 72% 71.0-71.5% Non-GAAP operating margin (39)% (51)-(50)% In the fourth fiscal quarter, we expect revenue of about $125 million, reflecting growth of about 90% year-over- year. For the full fiscal year 2023, we expect revenue of $420-421 million, reflecting growth of 105% year-over-year. Cyber security remains a top IT priority. Our AI-based, autonomous security platform is optimally positioned to deliver superior enterprise value. At the same time, we are mindful of enterprises prioritizing cash preservation and its impact on IT budgets. We expect the macro conditions impacting growth in the third quarter to persist in Q4. Looking beyond the near term, we expect secular tailwinds around next-gen cybersecurity to persist, combined with benefits from our platform expansion, improved brand awareness, and scaling go-to-market. We expect our fourth fiscal quarter non-GAAP gross margin to be about 72%. For the full fiscal year 2023, we expect non-GAAP gross margin to be between 71.0-71.5%, an increase compared to our prior guidance of 70.5-71%. Both our quarterly and full-year outlook reflect significant year-over-year gross margin expansion. We expect to continue benefiting from increasing scale, better data processing efficiencies, and module expansion. Finally, we expect a non-GAAP operating margin of (39)% for our fourth fiscal quarter. We’re improving our full fiscal year range to (51)-(50)% from prior guidance of (58)-(55)%, reflecting a 6 percentage point improvement at the midpoint. Both our quarterly and full-year outlook represent a meaningful year-over-year improvement, reflecting the increasing scale and efficiency of our business. We’re committed to achieving our long-term profitability targets by balancing compelling top-line growth with consistent margin improvement. As a result, we’ve adapted to evolving market conditions, taking a more prudent investment approach. The above statements are based on current targets as of the date of this letter, and we undertake no obligation to update them after such date. These statements are forward-looking, and actual results may differ materially due to many factors. Refer to the Forward-Looking Statements safe harbor below for information on the factors that could cause our action results to differ materially from these forward-looking statements. 05


Q3 FY2023 LETTER TO SHAREHOLDERSSENTINELONE 12 Guidance for non-GAAP financial measures excludes stock-based compensation expense, employer payroll tax on employee stock transactions, amortization expense of acquired intangible assets, and acquisition-related compen- sation costs. We have not provided the forward-looking, most directly comparable GAAP measures because cer- tain items are out of our control or cannot be reasonably predicted. Accordingly, a reconciliation for non-GAAP gross margin and non-GAAP operating margin is not available without unreasonable effort. However, it is important to note that material changes to reconciling items could have a significant effect on future GAAP results. We have provided a reconciliation of other GAAP to non-GAAP metrics in tables at the end of this letter. Closing We will host a conference call at 2:00pm Pacific time/5:00pm Eastern time today to discuss further details of our fiscal third-quarter results. A live webcast and replay will be available on SentinelOne’s Investor Relations website at investors.sentinelone.com. Thank you for taking the time to read our shareholder letter, and we look forward to your questions on our call this afternoon. Sincerely, Tomer Weingarten Dave Bernhardt President and CEO CFO 06


Q3 FY2023 LETTER TO SHAREHOLDERSSENTINELONE 13 Forward-Looking Statements This letter and the live webcast which will be held at 2:00 pm, EST on December 6, 2022, contain “forward-looking statements” within the meaning of Section 27A of the Securities Act of 1933, as amended, and Section 21E of the Securities Exchange Act of 1934, as amended, which statements involve risks and uncertainties, including statements regarding our future growth, and future financial and operating performance, including our financial outlook for the fourth quarter of fiscal 2023 and full-year fiscal year 2023 (including non-GAAP gross profit and non-GAAP operating margin); the impact of our integration of Attivo Networks, Inc. (“Attivo”) into our business and financial results; our total addressable market, business strategy, acquisitions, and strategic investments; our reputation and performance in the market; general market trends; and our objectives. The words “believe,” “may,” “will,” “potentially,” “estimate,” “continue,” “anticipate,” “intend,” “could,” “would,” “project,” “target,” “plan,” “expect,” or the negative of these terms and similar expressions are intended to identify forward-looking statements. However, not all forward-looking statements contain these identifying words. There are a significant number of factors that could cause our actual results to differ materially from statements made in this letter and live webcast, including but not limited to our limited operating history; our history of losses; intense competition in the market we compete in; fluctuations in our operating results; network or security incidents against us; our ability to successfully integrate any acquisitions and strategic investments, including the integra- tion of Attivo; defects, errors or vulnerabilities in our platform; risks associated with managing our rapid growth; the continuing impact of the COVID-19 pandemic on our and our customers’ businesses; our ability to attract new and retain existing customers, or renew and expand our relationships with them; the ability of our platform to effectively interoperate within our customers’ IT infrastructure; disruptions or other business interruptions that affect the availability of our platform; the failure to timely develop and achieve market acceptance of new products, and subscriptions as well as existing products, subscriptions and support offerings; rapidly evolving technological developments in the market for security products and subscription and support offerings; length of sales cycles; risks of securities class action litigation; general market, political, economic, and business conditions, including those related to declining macroeconomic conditions, rising interest rates and inflation, the continuing impact of COVID-19 and geopolitical uncertainty, including the effects of the recent conflict in Ukraine. Additional risks and uncertainties that could affect our financial results are included under the captions “Risk Factors” and “Management’s Discussion and Analysis of Financial Condition and Results of Operations” set forth in our filings and reports with the Securities and Exchange Commission (“SEC”), including our most recently filed Annual Report on Form 10-K, dated April 7, 2022, subsequent Quarterly Reports on Form 10-Q, and other filings and reports that we may file from time to time with the SEC, copies of which are available on our website at investors.sentinelone.com and on the SEC’s website at www.sec.gov. You should not rely on these forward-looking statements, as actual outcomes and results may differ materially from those contemplated by these forward-looking statements as a result of such risks and uncertainties. All forward-looking statements in this letter and the live webcast are based on information and estimates available to us at the time of this letter, and were based on current expectations, estimates, forecasts, and projections as well as the beliefs and assump- tions of management. We do not assume any obligation to update the forward-looking statements provided to reflect events that occur or circumstances that exist after the date of this letter and live webcast or to reflect new information or the occurrence of unexpected events, except as required by law. We may not actually achieve the plans, intentions, or expectations disclosed in our forward-looking statements, and you should not place undue reliance on our forward-looking statements.


Q3 FY2023 LETTER TO SHAREHOLDERSSENTINELONE 14 Non-GAAP Financial Measures In addition to our results determined in accordance with GAAP, we believe the following non-GAAP measures are useful in evaluating our operating performance. We use the following non-GAAP financial information to evaluate our ongoing operations and for internal planning and forecasting purposes. Non-GAAP financial information excludes stock-based compensation expense, employer payroll tax expense related to employee stock transactions and amor- tization of acquired intangible assets. We believe that non-GAAP financial information, when taken collectively, with the financial information presented in accordance with GAAP, may be helpful to investors because it provides con- sistency and comparability with past financial performance. However, non-GAAP financial information is presented for supplemental informational purposes only, has limitations as an analytical tool, and should not be considered in isolation or as a substitute for financial information presented in accordance with GAAP. Other companies, including companies in our industry, may calculate similarly titled non-GAAP measures differently or may use other measures to evaluate their performance, all of which could reduce the usefulness of our non-GAAP financial measures as tools for comparison. In addition, the utility of free cash flow as a measure of our liquidity is limited as it does not represent the total increase or decrease in our cash balance for a given period. Reconciliations between non-GAAP financial measures to the most directly comparable financial measure stated in accordance with GAAP are contained at the end of the earnings press release following the accompanying financial data. Investors are encouraged to review the related GAAP financial measures and the reconciliation of these non- GAAP financial measures to their most directly comparable GAAP financial measures and not rely on any single finan- cial measure to evaluate our business. Non-GAAP Gross Profit and Non-GAAP Gross Margin We define non-GAAP gross profit and non-GAAP gross margin as GAAP gross profit and GAAP gross margin, respec- tively, excluding stock-based compensation expense, employer payroll tax on employee stock transactions, and amortization of acquired intangible assets. We believe non-GAAP gross profit and non-GAAP gross margin provide our management and investors consistency and comparability with our past financial performance and facilitate peri- od-to-period comparisons of operations, as these measures eliminate the effects of certain variables unrelated to our overall operating performance. Non-GAAP Loss from Operations and Non-GAAP Operating Margin We define non-GAAP loss from operations and non-GAAP operating margin as GAAP loss from operations and GAAP operating margin, respectively, excluding stock-based compensation expense, employer payroll tax on employee stock transactions, and amortization of acquired intangible assets. We believe non-GAAP loss from operations and non-GAAP operating margin provide our management and investors consistency and comparability with our past financial performance and facilitate period-to-period comparisons of operations, as these metrics generally eliminate the effects of certain variables unrelated to our overall operating performance.


Q3 FY2023 LETTER TO SHAREHOLDERSSENTINELONE 15 Non-GAAP Net Loss and Non-GAAP Net Loss per Share, Basic and Diluted We define non-GAAP net loss as GAAP net loss excluding stock-based compensation expense, employer payroll tax on employee stock transactions, and amortization of acquired intangible assets. We define non-GAAP net loss per share, basic and diluted, as non-GAAP net loss divided by the weighted-average common shares outstanding. Since we have reported net losses for all periods presented, we have excluded all potentially dilutive securities from the calculation of net loss per share as their effect is anti-dilutive and accordingly, basic and diluted net loss per share is the same for all periods presented. We believe that excluding these items from non-GAAP net loss and non-GAAP net loss per share, diluted, provides management and investors with greater visibility into the underlying performance of our core business operating results. Free Cash Flow Free cash flow is a non-GAAP financial measure that we define as net cash provided by (used in) operating activities less cash used for purchases of property and equipment and capitalized internal-use software. We believe that free cash flow is a useful indicator of liquidity that provides information to management and investors, even if negative, as it provides useful information about the amount of cash generated (or consumed) by our operating activities that is available (or not available) to be used for other strategic initiatives. For example, if free cash flow is negative, we may need to access cash reserves or other sources of capital to invest in strategic initiatives. While we believe that free cash flow is useful in evaluating our business, free cash flow is a non-GAAP financial measure that has limitations as an analytical tool, and free cash flow should not be considered as an alternative to, or substitute for, net cash provided by (used in) operating activities in accordance with GAAP. The utility of free cash flow as a measure of our liquidity is limited as it does not represent the total increase or decrease in our cash balance for any given period and does not re- flect our future contractual commitments. In addition, other companies, including companies in our industry, may cal- culate free cash flow differently or not at all, which reduces the usefulness of free cash flow as a tool for comparison. Expenses Excluded from Non-GAAP Measures Stock-based Compensation Expense Stock-based compensation expense is a non-cash expense that varies in amount from period to period and is de- pendent on market forces that are often beyond our control. As a result, management excludes this item from our internal operating forecasts and models. Management believes that non-GAAP measures adjusted for stock-based compensation expense provide investors with a basis to measure our core performance against the performance of other companies without the variability created by stock-based compensation as a result of the variety of equity awards used by other companies and the varying methodologies and assumptions used. Employer Payroll Tax on Employee Stock Transactions Employer payroll tax expenses related to employee stock transactions are tied to the vesting or exercise of underlying equity awards and the price of our common stock at the time of vesting, which varies in amount from period to period and is dependent on market forces that are often beyond our control. As a result, management excludes this item from our internal operating forecasts and models. Management believes that non-GAAP measures adjusted for employer payroll taxes on employee stock transactions provide investors with a basis to measure our core performance against the performance of other companies without the variability created by employer payroll taxes on employee stock transactions as a result of the stock price at the time of employee exercise.


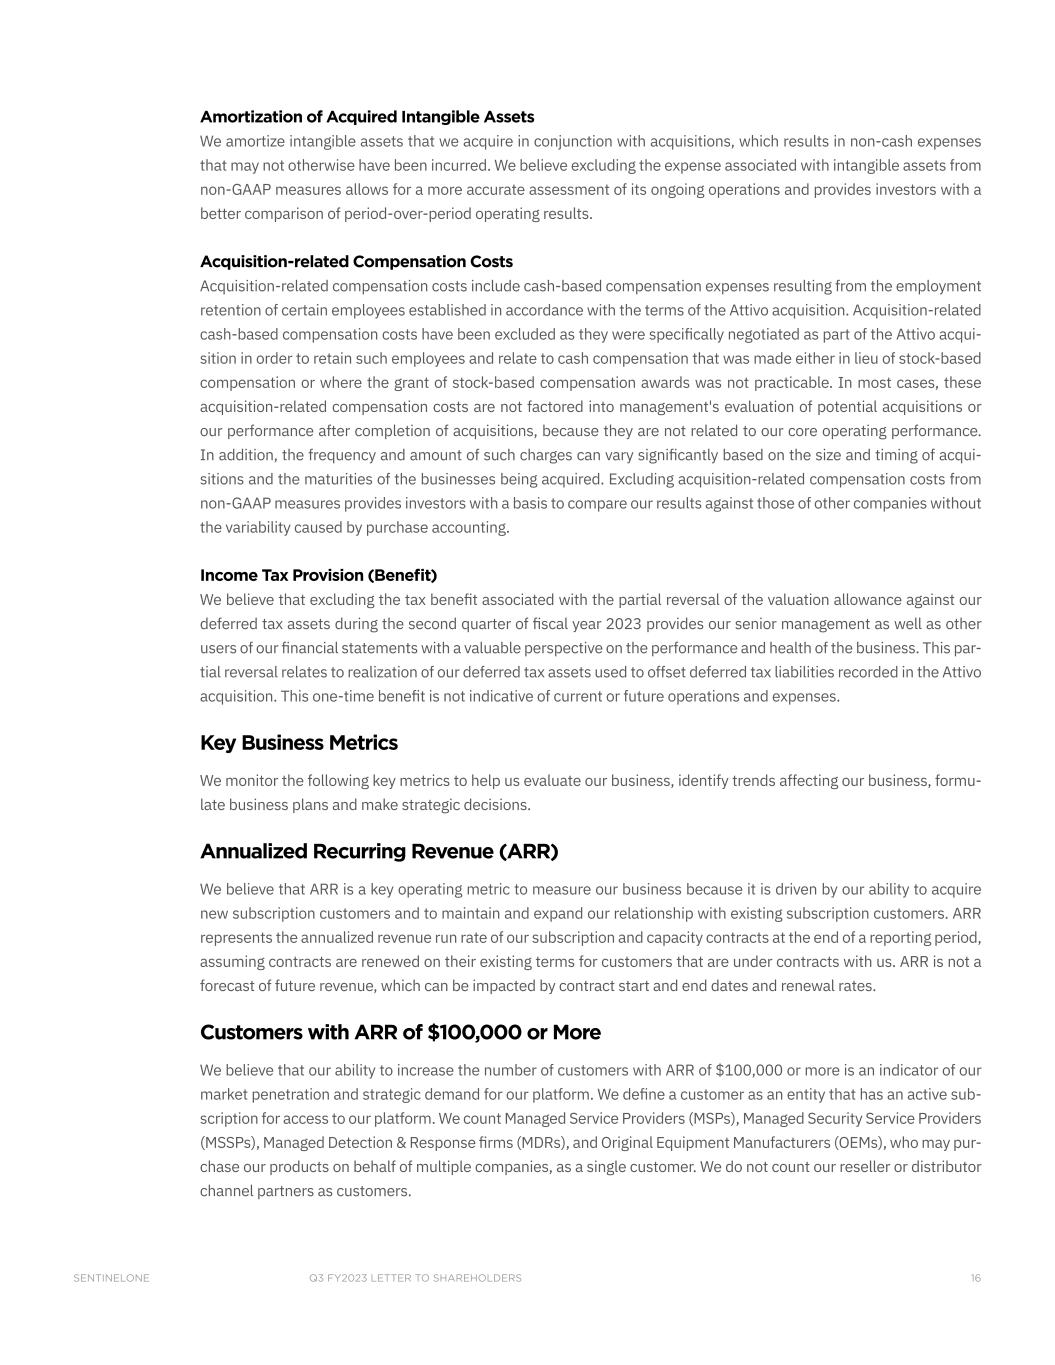
Q3 FY2023 LETTER TO SHAREHOLDERSSENTINELONE 16 Amortization of Acquired Intangible Assets We amortize intangible assets that we acquire in conjunction with acquisitions, which results in non-cash expenses that may not otherwise have been incurred. We believe excluding the expense associated with intangible assets from non-GAAP measures allows for a more accurate assessment of its ongoing operations and provides investors with a better comparison of period-over-period operating results. Acquisition-related Compensation Costs Acquisition-related compensation costs include cash-based compensation expenses resulting from the employment retention of certain employees established in accordance with the terms of the Attivo acquisition. Acquisition-related cash-based compensation costs have been excluded as they were specifically negotiated as part of the Attivo acqui- sition in order to retain such employees and relate to cash compensation that was made either in lieu of stock-based compensation or where the grant of stock-based compensation awards was not practicable. In most cases, these acquisition-related compensation costs are not factored into management's evaluation of potential acquisitions or our performance after completion of acquisitions, because they are not related to our core operating performance. In addition, the frequency and amount of such charges can vary significantly based on the size and timing of acqui- sitions and the maturities of the businesses being acquired. Excluding acquisition-related compensation costs from non-GAAP measures provides investors with a basis to compare our results against those of other companies without the variability caused by purchase accounting. Income Tax Provision (Benefit) We believe that excluding the tax benefit associated with the partial reversal of the valuation allowance against our deferred tax assets during the second quarter of fiscal year 2023 provides our senior management as well as other users of our financial statements with a valuable perspective on the performance and health of the business. This par- tial reversal relates to realization of our deferred tax assets used to offset deferred tax liabilities recorded in the Attivo acquisition. This one-time benefit is not indicative of current or future operations and expenses. Key Business Metrics We monitor the following key metrics to help us evaluate our business, identify trends affecting our business, formu- late business plans and make strategic decisions. Annualized Recurring Revenue (ARR) We believe that ARR is a key operating metric to measure our business because it is driven by our ability to acquire new subscription customers and to maintain and expand our relationship with existing subscription customers. ARR represents the annualized revenue run rate of our subscription and capacity contracts at the end of a reporting period, assuming contracts are renewed on their existing terms for customers that are under contracts with us. ARR is not a forecast of future revenue, which can be impacted by contract start and end dates and renewal rates. Customers with ARR of $100,000 or More We believe that our ability to increase the number of customers with ARR of $100,000 or more is an indicator of our market penetration and strategic demand for our platform. We define a customer as an entity that has an active sub- scription for access to our platform. We count Managed Service Providers (MSPs), Managed Security Service Providers (MSSPs), Managed Detection & Response firms (MDRs), and Original Equipment Manufacturers (OEMs), who may pur- chase our products on behalf of multiple companies, as a single customer. We do not count our reseller or distributor channel partners as customers.


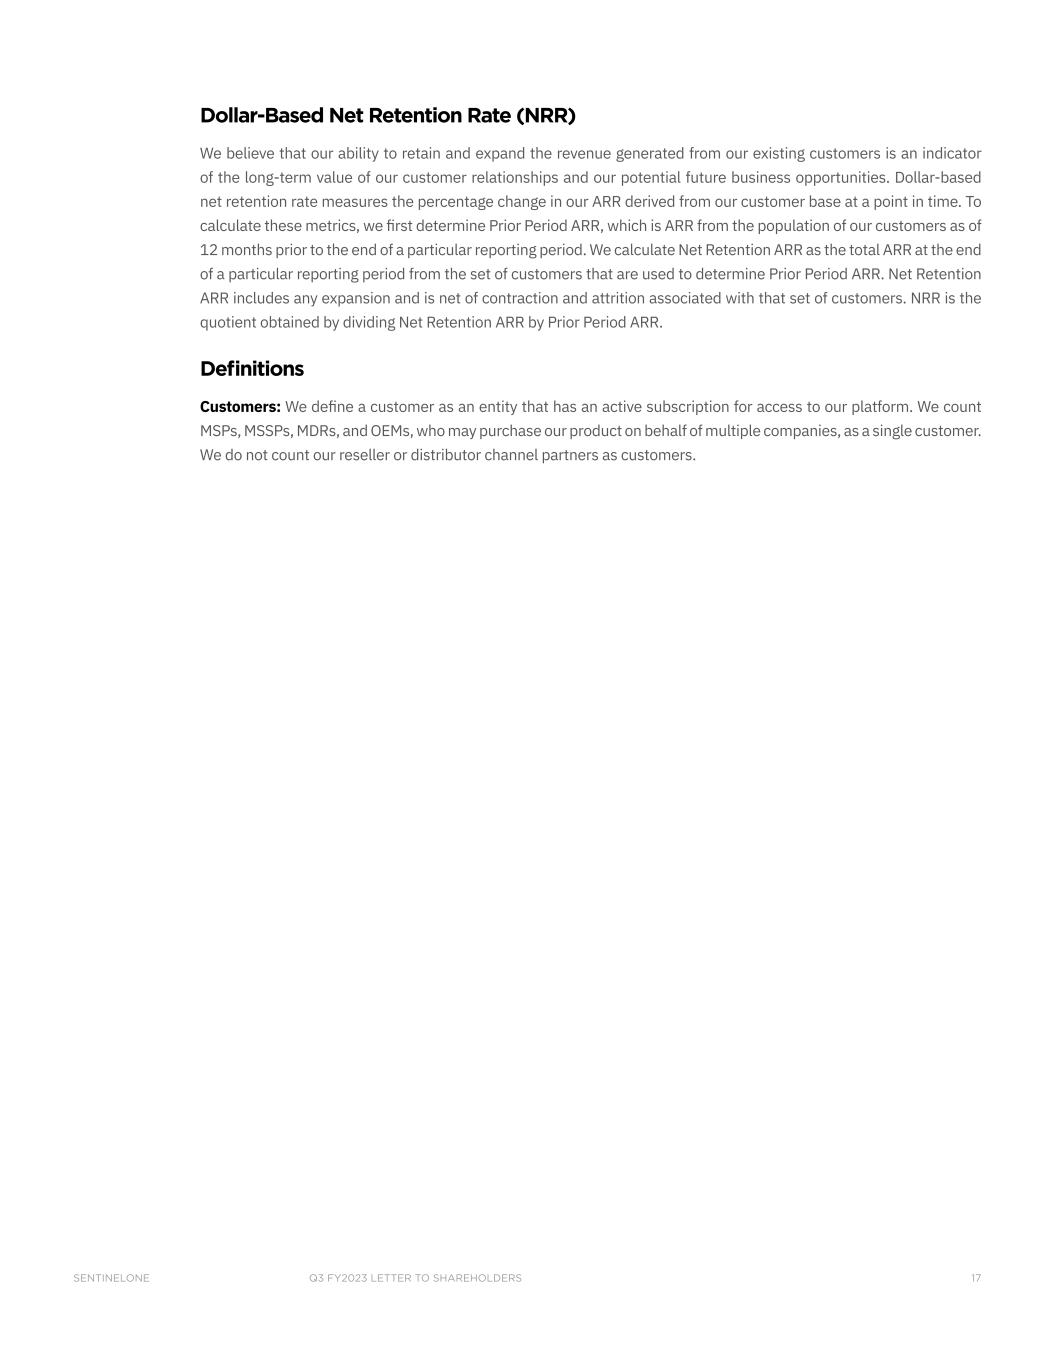
Q3 FY2023 LETTER TO SHAREHOLDERSSENTINELONE 17 Dollar-Based Net Retention Rate (NRR) We believe that our ability to retain and expand the revenue generated from our existing customers is an indicator of the long-term value of our customer relationships and our potential future business opportunities. Dollar-based net retention rate measures the percentage change in our ARR derived from our customer base at a point in time. To calculate these metrics, we first determine Prior Period ARR, which is ARR from the population of our customers as of 12 months prior to the end of a particular reporting period. We calculate Net Retention ARR as the total ARR at the end of a particular reporting period from the set of customers that are used to determine Prior Period ARR. Net Retention ARR includes any expansion and is net of contraction and attrition associated with that set of customers. NRR is the quotient obtained by dividing Net Retention ARR by Prior Period ARR. Definitions Customers: We define a customer as an entity that has an active subscription for access to our platform. We count MSPs, MSSPs, MDRs, and OEMs, who may purchase our product on behalf of multiple companies, as a single customer. We do not count our reseller or distributor channel partners as customers.


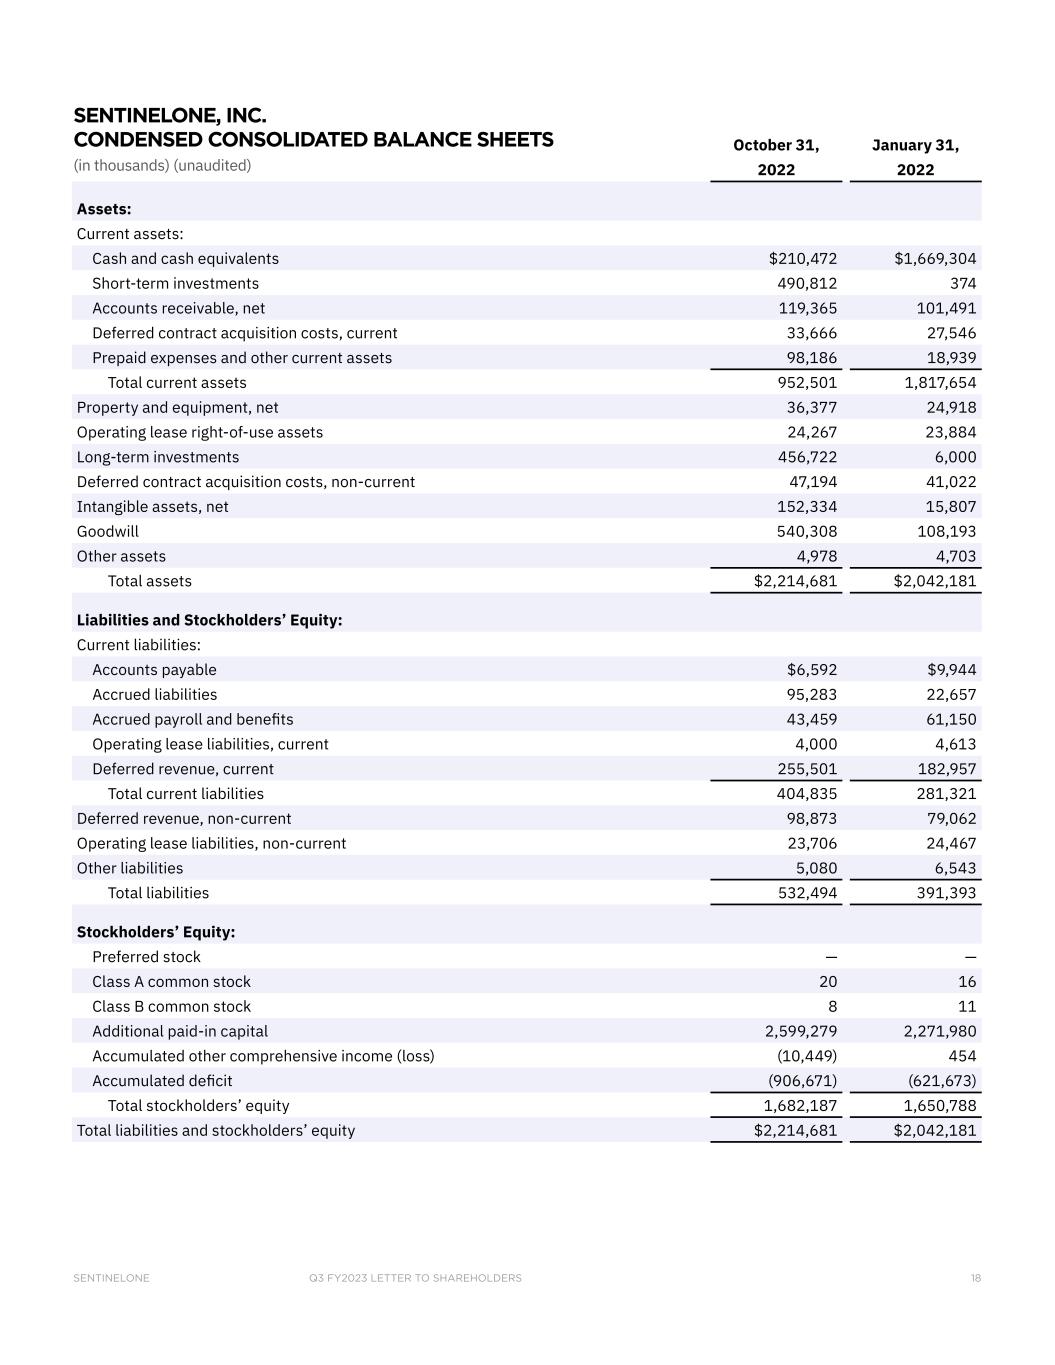
Q3 FY2023 LETTER TO SHAREHOLDERSSENTINELONE 18 October 31, January 31, 2022 2022 Assets: Current assets: Cash and cash equivalents $210,472 $1,669,304 Short-term investments 490,812 374 Accounts receivable, net 119,365 101,491 Deferred contract acquisition costs, current 33,666 27,546 Prepaid expenses and other current assets 98,186 18,939 Total current assets 952,501 1,817,654 Property and equipment, net 36,377 24,918 Operating lease right-of-use assets 24,267 23,884 Long-term investments 456,722 6,000 Deferred contract acquisition costs, non-current 47,194 41,022 Intangible assets, net 152,334 15,807 Goodwill 540,308 108,193 Other assets 4,978 4,703 Total assets $2,214,681 $2,042,181 Liabilities and Stockholders’ Equity: Current liabilities: Accounts payable $6,592 $9,944 Accrued liabilities 95,283 22,657 Accrued payroll and benefits 43,459 61,150 Operating lease liabilities, current 4,000 4,613 Deferred revenue, current 255,501 182,957 Total current liabilities 404,835 281,321 Deferred revenue, non-current 98,873 79,062 Operating lease liabilities, non-current 23,706 24,467 Other liabilities 5,080 6,543 Total liabilities 532,494 391,393 Stockholders’ Equity: Preferred stock — — Class A common stock 20 16 Class B common stock 8 11 Additional paid-in capital 2,599,279 2,271,980 Accumulated other comprehensive income (loss) (10,449) 454 Accumulated deficit (906,671) (621,673) Total stockholders’ equity 1,682,187 1,650,788 Total liabilities and stockholders’ equity $2,214,681 $2,042,181 SENTINELONE, INC. CONDENSED CONSOLIDATED BALANCE SHEETS (in thousands) (unaudited)


Q3 FY2023 LETTER TO SHAREHOLDERSSENTINELONE 19 Three Months Ended October 31, Nine Months Ended October 31, 2022 2021 2022 2021 Revenue $115,323 $56,018 $296,083 $139,163 Cost of revenue(1) 41,006 20,357 104,406 57,428 Gross profit 74,317 35,661 191,677 81,735 Operating Expenses: Research and development(1) 52,234 34,773 153,104 93,630 Sales and marketing(1) 83,953 41,311 223,594 118,461 General and administrative(1) 42,188 26,951 117,525 65,785 Total operating expenses 178,375 103,035 494,223 277,876 Loss from operations (104,058) (67,374) (302,546) (196,141) Interest income 7,193 99 11,502 143 Interest expense (613) (3) (1,225) (785) Other income (expense), net (781) (1,055) (645) (2,021) Loss before provision for income taxes (98,259) (68,333) (292,914) (198,804) Provision (benefit) for income taxes 599 262 (7,916) 588 Net loss $(98,858) $(68,595) $(284,998) $(199,392) Net loss per share attributable to Class A and Class B common stockholders, basic and diluted $(0.35) $(0.26) $(1.03) $(1.39) Weighted-average shares used in computing net loss per share attributable to Class A and Class B common stockholders, basic and diluted 280,635,022 262,999,535 275,867,765 143,199,215 (1) Includes stock-based compensation expense as follows Cost of revenue $2,835 $1,202 $7,082 $2,425 Research and development 13,996 9,035 37,954 24,997 Sales and marketing 12,166 4,848 28,977 10,800 General and administrative 16,690 12,277 44,305 23,970 Total stock-based compensation expense $45,687 $27,362 $118,318 $62,192 SENTINELONE, INC. CONDENSED CONSOLIDATED STATEMENTS OF OPERATIONS (in thousands, except share and per share data) (unaudited)


Q3 FY2023 LETTER TO SHAREHOLDERSSENTINELONE 20 Nine Months Ended October 31, 2022 2021 CASH FLOW FROM OPERATING ACTIVITIES: Net loss $(284,998) $(199,392) Adjustments to reconcile net loss to net cash used in operating activities: Depreciation and amortization 20,097 5,862 Amortization of deferred contract acquisition costs 25,871 14,551 Non-cash operating lease costs 2,547 2,180 Stock-based compensation expense 118,318 62,193 Other (6,066) 849 Changes in operating assets and liabilities, net of effects of acquisition Accounts receivable (12,699) (26,322) Prepaid expenses and other assets (11,072) (6,916) Deferred contract acquisition costs (38,163) (28,436) Accounts payable (1,377) (5,658) Accrued liabilities 261 9,900 Accrued payroll and benefits (18,786) 19,774 Operating lease liabilities (4,296) (2,288) Deferred revenue 40,609 60,037 Other liabilities (1,464) 3,663 Net cash used in operating activities (171,218) (90,003) CASH FLOW FROM INVESTING ACTIVITIES: Purchases of property and equipment (4,827) (3,268) Purchases of intangible assets (247) (520) Capitalization of internal-use software (10,279) (4,733) Purchases of short-term investments (1,728,162) — Maturities of short-term investments 778,555 — Cash paid for acquisition, net of cash and restricted cash acquired (281,032) (3,449) Net cash used in investing activities (1,245,992) (11,970) CASH FLOW FROM FINANCING ACTIVITIES: Payments of deferred offering costs (186) (7,416) Repayment of debt — (20,000) Proceeds from exercise of stock options 11,282 8,630 Proceeds from issuance of common stock under the employee stock purchase plan 8,682 — Proceeds from initial public offering and private placement, net of underwriting discounts and commissions — 1,388,562 Net cash provided by financing activities 19,778 1,369,776 EFFECT OF EXCHANGE RATE CHANGES ON CASH AND CASH EQUIVALENTS — 1,146 NET CHANGE IN CASH, CASH EQUIVALENTS, AND RESTRICTED CASH (1,397,432) 1,268,949 CASH, CASH EQUIVALENTS, AND RESTRICTED CASH–Beginning of period 1,672,051 399,112 CASH, CASH EQUIVALENTS, AND RESTRICTED CASH–End of period $274,619 $1,668,061 SENTINELONE, INC. CONDENSED CONSOLIDATED STATEMENTS OF CASH FLOWS (in thousands) (unaudited)


Q3 FY2023 LETTER TO SHAREHOLDERSSENTINELONE 21 Three Months Ended October 31, Nine Months Ended October 31, 2022 2021 2022 2021 Cost of Revenue Reconciliation: GAAP cost of revenue $41,006 $20,357 $104,406 $57,428 Stock-based compensation expense (2,835) (1,202) (7,082) (2,425) Employer payroll tax on employee stock transactions (14) — (50) — Amortization of acquired intangible assets (5,139) (558) (10,818) (1,607) Acquisition-related compensation (146) — (294) — Non-GAAP cost of revenue $32,872 $18,597 $86,162 $53,396 Gross Profit Reconciliation: GAAP gross profit $74,317 $35,661 $191,677 $81,735 Stock-based compensation expense 2,835 1,202 7,082 2,425 Employer payroll tax on employee stock transactions 14 — 50 — Amortization of acquired intangible assets 5,139 558 10,818 1,607 Acquisition-related compensation 146 — 294 — Non-GAAP gross profit $82,451 $37,421 $209,921 $85,767 Gross Margin Reconciliation: GAAP gross margin 64% 64% 65% 59% Stock-based compensation expense 2% 2% 2% 2% Employer payroll tax on employee stock transactions —% —% —% —% Amortization of acquired intangible assets 4% 1% 4% 1% Acquisition-related compensation —% —% —% —% Non-GAAP gross margin* 71% 67% 71% 62% Research and Development Expense Reconciliation: GAAP research and development expense $52,234 $34,773 $153,104 $93,630 Stock-based compensation expense (13,996) (9,035) (37,954) (24,997) Employer payroll tax on employee stock transactions (29) (47) (164) (47) Acquisition-related compensation (368) — (727) — Non-GAAP research and development expense $37,841 $25,691 $114,259 $68,586 Sales and Marketing Expense Reconciliation: GAAP sales and marketing expense $83,953 $41,311 $223,594 $118,461 Stock-based compensation expense (12,166) (4,848) (28,977) (10,800) Employer payroll tax on employee stock transactions (99) (285) (378) (285) Amortization of acquired intangible assets (2,144) (190) (4,470) (545) Acquisition-related compensation (539) — (1,074) — Non-GAAP sales and marketing expense $69,005 $35,988 $188,695 $106,831 SENTINELONE, INC. Reconciliation of GAAP to Non-GAAP Financial Measures (in thousands, except percentages and per share data) (unaudited)


Q3 FY2023 LETTER TO SHAREHOLDERSSENTINELONE 22 Three Months Ended October 31, Nine Months Ended October 31, 2022 2021 2022 2021 General and Administrative Expense Reconciliation: GAAP general and administrative expense $42,188 $26,951 $117,525 $65,785 Stock-based compensation expense (16,690) (12,277) (44,305) (23,970) Employer payroll tax on employee stock transactions 56 (187) (393) (187) Amortization of acquired intangible assets (19) (18) (56) (54) Acquisition-related compensation (343) — (679) — Non-GAAP general and administrative expense $25,192 $14,469 $72,092 $41,574 Operating Loss Reconciliation: GAAP operating loss $(104,058) $(67,374) $(302,546) $(196,141) Stock-based compensation expense 45,687 27,362 118,318 62,192 Employer payroll tax on employee stock transactions 86 519 985 519 Amortization of acquired intangible assets 7,302 766 15,344 2,206 Acquisition-related compensation 1,396 — 2,774 — Non-GAAP operating loss* $(49,587) $(38,727) $(165,125) $(131,224) Operating Margin Reconciliation: GAAP operating margin (90)% (120)% (102)% (141)% Stock-based compensation expense 40% 49% 40% 45% Employer payroll tax on employee stock transactions —% 1% —% —% Amortization of acquired intangible assets 6% 1% 5% 2% Acquisition-related compensation 1% —% 1% —% Non-GAAP operating margin* (43)% (69)% (56)% (94)% Net Loss Reconciliation: GAAP net loss $(98,858) $(68,595) $(284,998) $(199,392) Stock-based compensation expense 45,687 27,362 118,318 62,192 Employer payroll tax on employee stock transactions 86 519 985 519 Amortization of acquired intangible assets 7,302 766 15,344 2,206 Acquisition-related compensation 1,396 — 2,774 — Income tax provision (benefit) — — (9,667) — Non-GAAP net loss $(44,387) $(39,948) $(157,244) $(134,475) Basic and Diluted EPS Reconciliation: GAAP net loss per share, basic and diluted $(0.35) $(0.26) $(1.03) $(1.39) Stock-based compensation expense 0.16 0.10 0.43 0.43 Employer payroll tax on employee stock transactions — — — — Amortization of acquired intangible assets 0.03 — 0.06 0.02 Acquisition-related compensation — — 0.01 — Income tax provision (benefit) — — (0.04) — Non-GAAP net loss per share, basic and diluted* $(0.16) $(0.15) $(0.57) $(0.94) * Certain figures may not sum due to rounding. SENTINELONE, INC. Reconciliation of GAAP to Non-GAAP Financial Measures (in thousands, except percentages and per share data) (unaudited)


Q3 FY2023 LETTER TO SHAREHOLDERSSENTINELONE 23 Three Months Ended October 31, Nine Months Ended October 31, 2022 2021 2022 2021 GAAP net cash used in operating activities $(59,741) $(17,212) $(171,218) $(90,003) Less: Purchases of property and equipment (726) (1,583) (4,827) (3,268) Less: Capitalized internal-use software (4,251) (1,881) (10,279) (4,733) Free cash flow $(64,718) $(20,676) $(186,324) $(98,004) Net cash used in investing activities $(2,888) $(3,984) $(1,245,992) $(11,970) Net cash provided by financing activities $2,900 $454 $19,778 $1,369,776 SENTINELONE, INC. Reconciliation of Cash Used in Operating Activities to Free Cash Flow (in thousands) (unaudited)


sentinelone.com © SentinelOne 2022