Exhibit 99.1

SentinelOne Announces Second Quarter Fiscal Year 2026 Financial Results
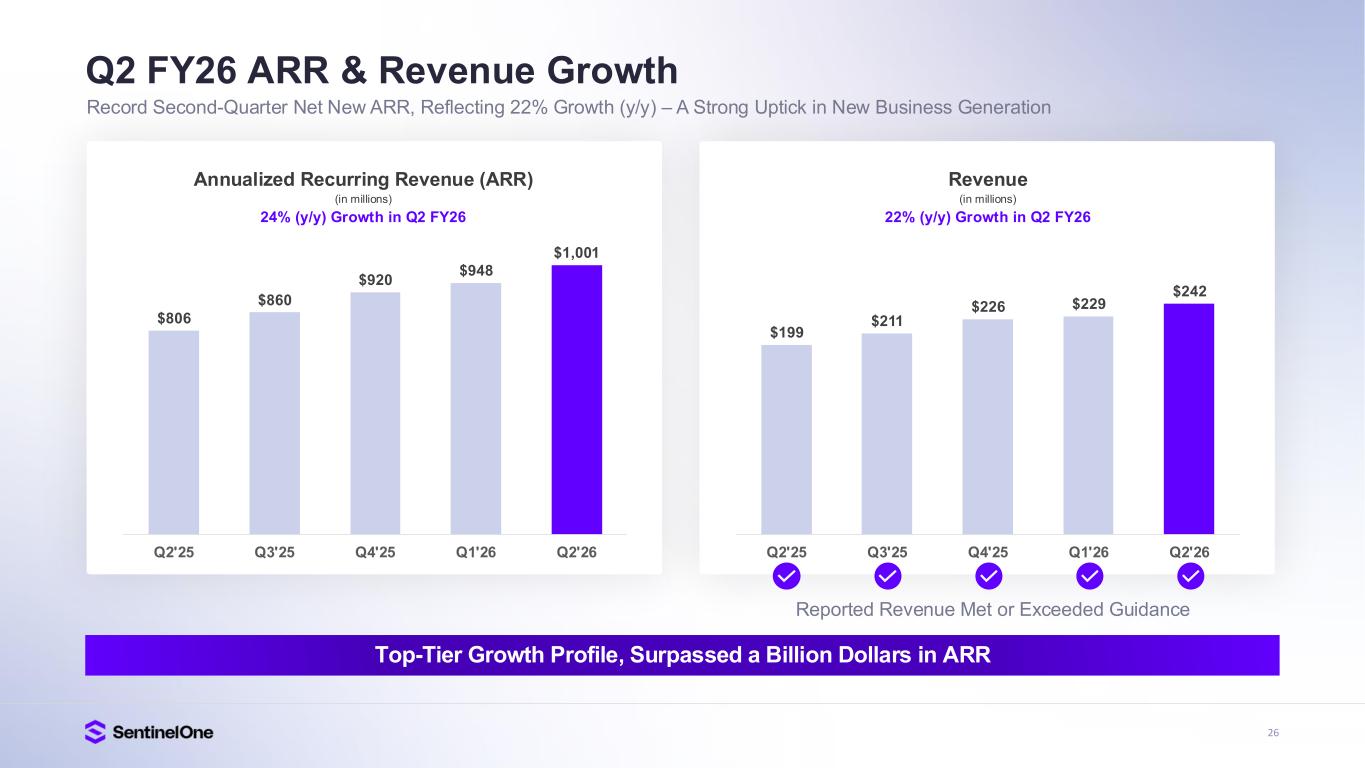
Revenue increased 22% year-over-year
ARR up 24% year-over-year
MOUNTAIN VIEW, Calif. – August 28, 2025 – SentinelOne, Inc. (NYSE: S) today announced financial results for the second quarter of fiscal year 2026 ended July 31, 2025.
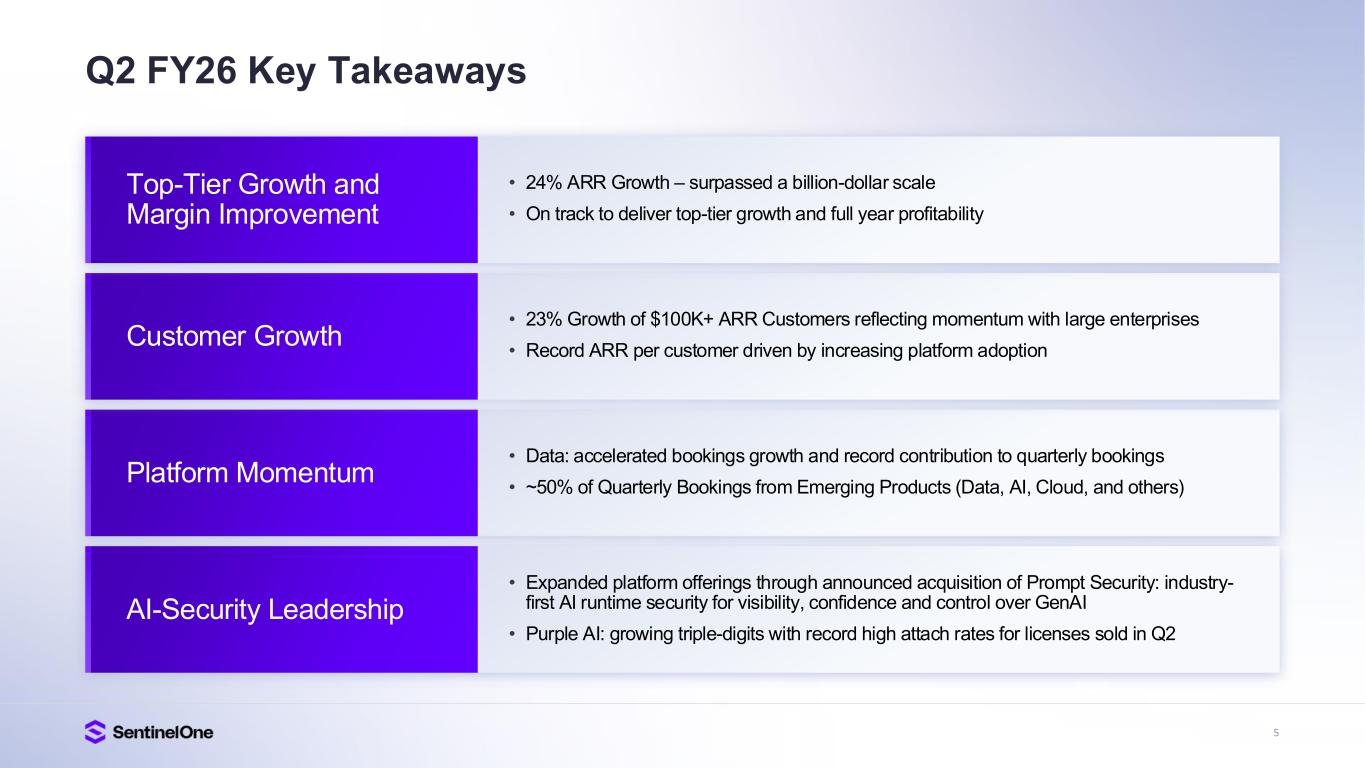
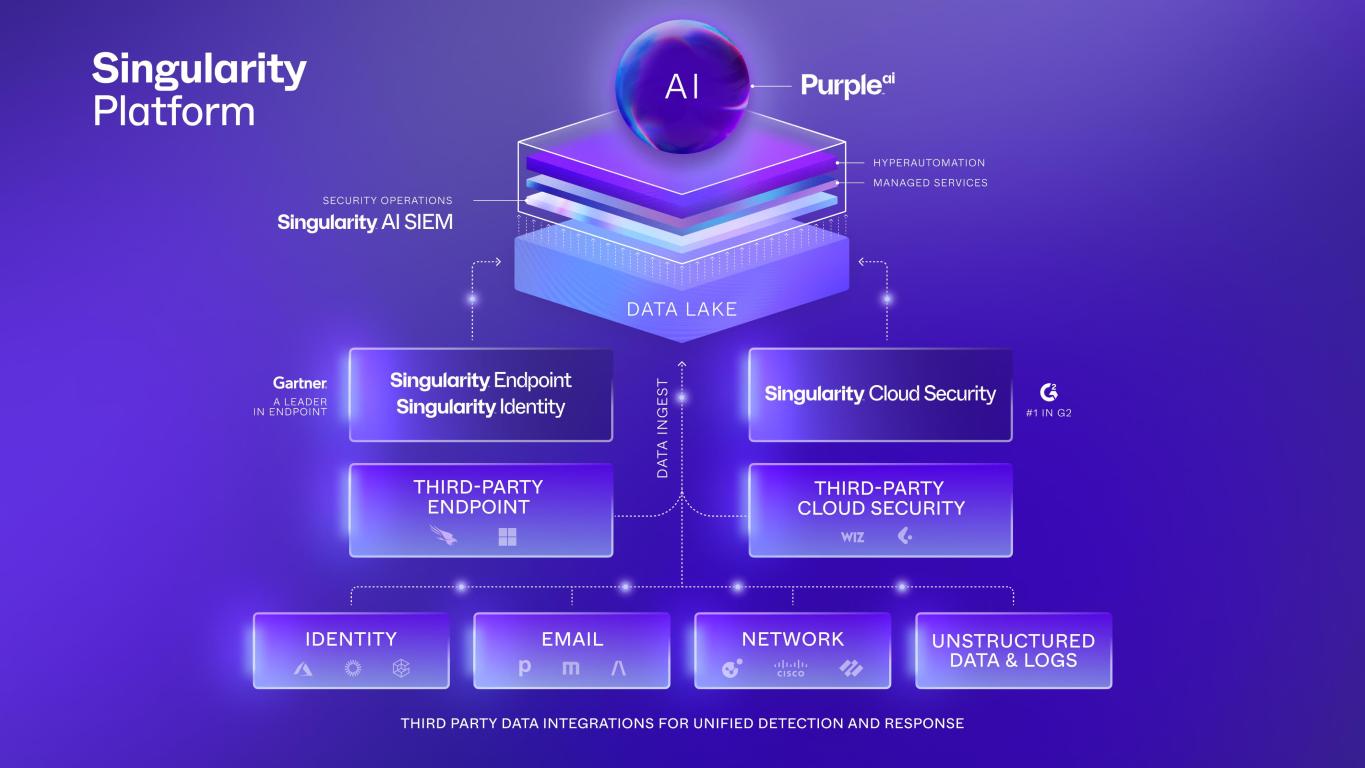
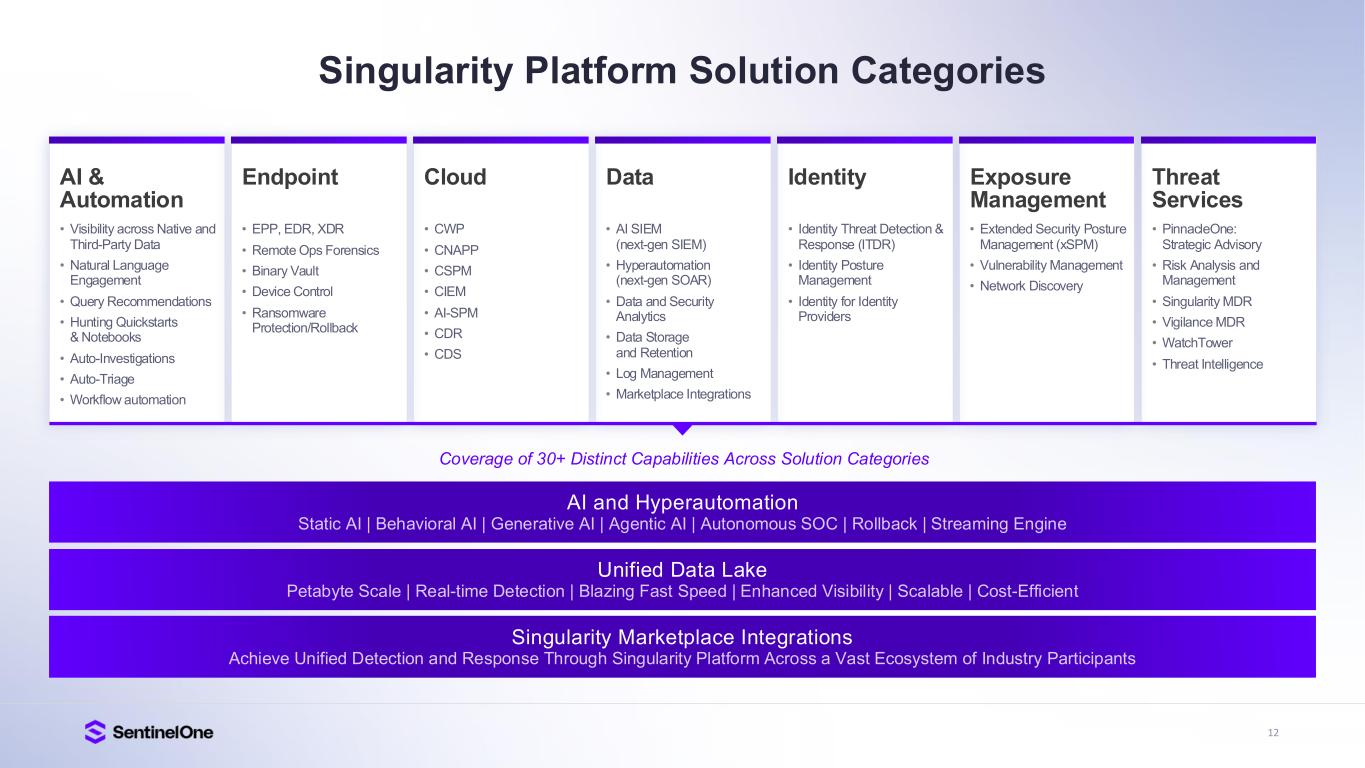
“We surpassed $1 billion in ARR and delivered record net new ARR, continuing to deliver robust growth and platform adoption across AI, data, cloud, and endpoint,” said Tomer Weingarten, CEO of SentinelOne. “Our second-quarter results highlight the momentum of our AI-powered platform, strengthening competitive position, and growing product differentiation. With relentless focus on innovations unifying AI, data, and security, SentinelOne is at the forefront of AI-powered cybersecurity – delivering high growth, driving operating leverage, and expanding our leadership in the industry.”
“We continued to deliver top-tier growth and margin expansion, underscoring the scalability of our model and operating leverage,” said Barbara Larson, CFO of SentinelOne. “Our strategic investments and focus on operational excellence position us well to deliver durable growth and sustained profitability. Based on our second-quarter outperformance and business momentum, we’re raising our full-year revenue outlook and reaffirming our commitment to full-year operating profitability and free cash flow.”
Second Quarter Fiscal Year 2026 Highlights
(All metrics are compared to the second quarter of fiscal year 2025 unless otherwise noted)
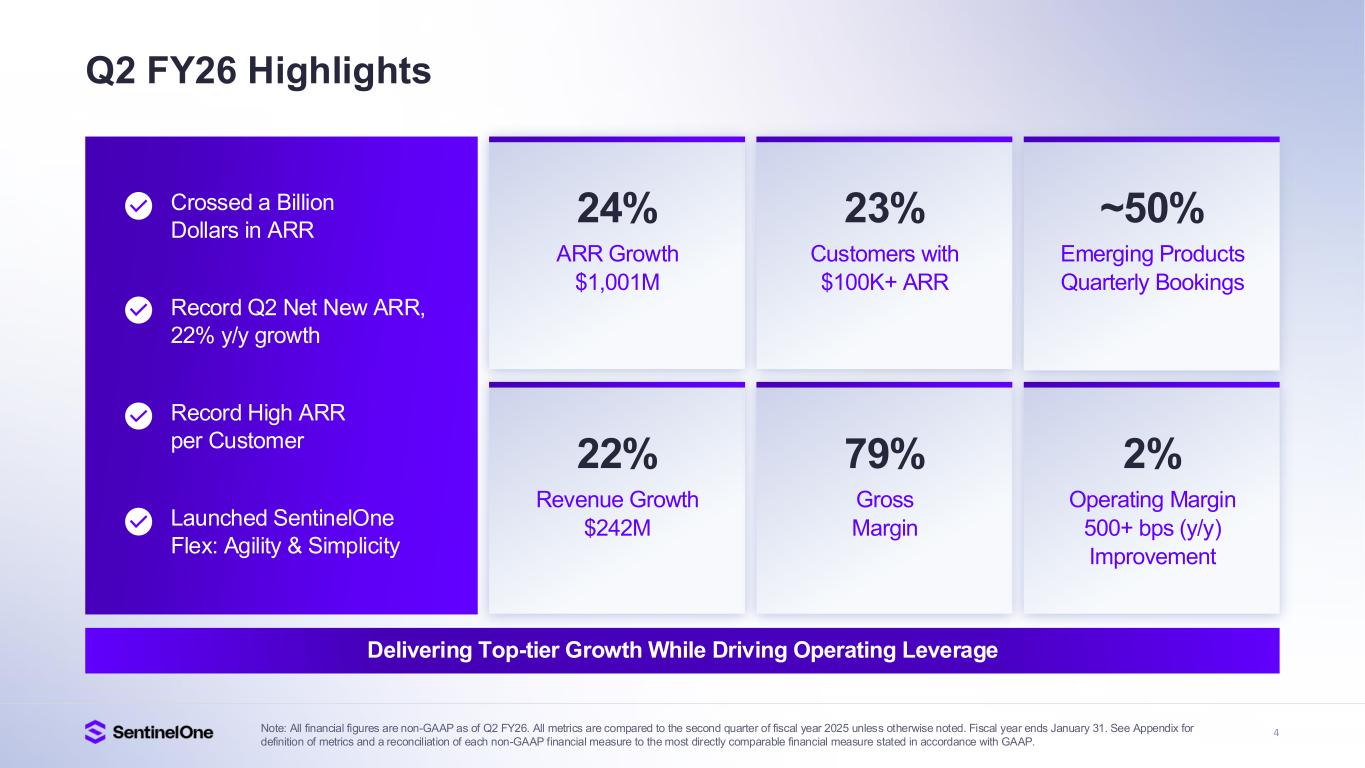
•Total revenue increased 22% to $242.2 million, compared to $198.9 million.
•Annualized recurring revenue (ARR) increased 24% to $1.0 billion as of July 31, 2025.
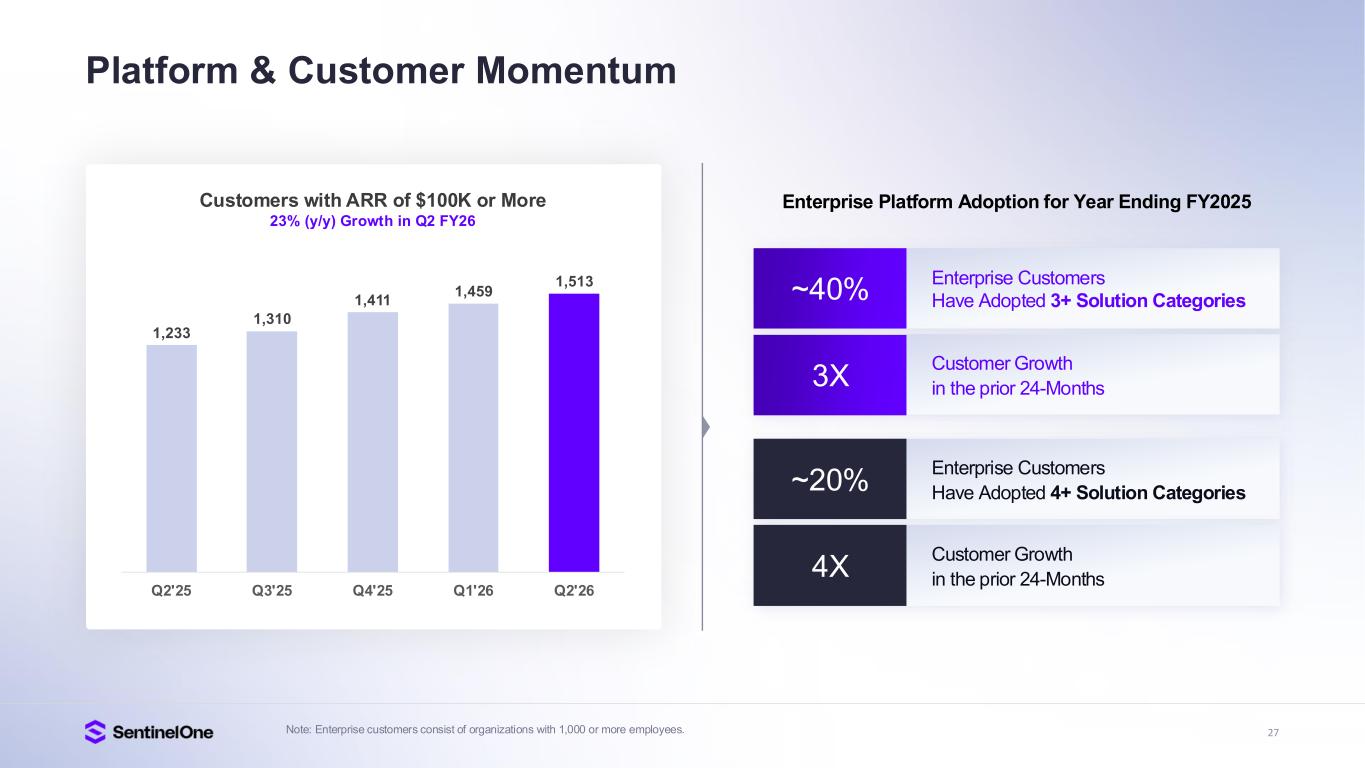
•Customers with ARR of $100,000 or more grew 23% to 1,513 as of July 31, 2025.
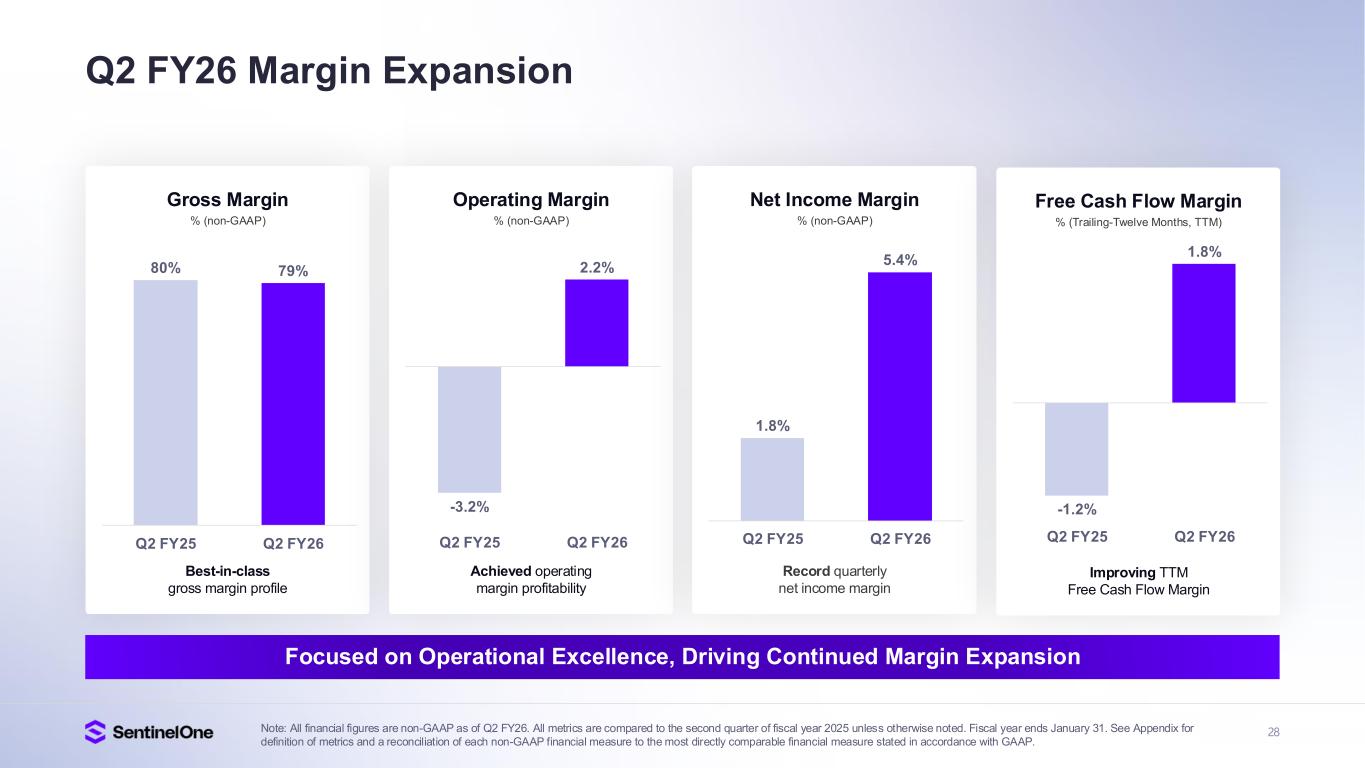
•Gross margin: GAAP gross margin was 75%, compared to 75%. Non-GAAP gross margin was 79%, compared to 80%.
•Operating margin: GAAP operating margin was (33)%, compared to (40)%. Non-GAAP operating margin was 2%, compared to (3)%.
•Net income (loss) margin: GAAP net loss margin was (30)%, compared to (35)%. Non-GAAP net income margin was 5%, compared to 2%.
•Cash flow margin: Operating cash flow margin was 0%, compared to 1%. Free cash flow margin remained consistent at (3)%. Trailing-twelve month operating cash flow margin was 4%, compared to 2%. Trailing-twelve month free cash flow margin was 2%, compared to (1)%.
•Cash, cash equivalents, and investments were $1.2 billion as of July 31, 2025.
Financial Outlook
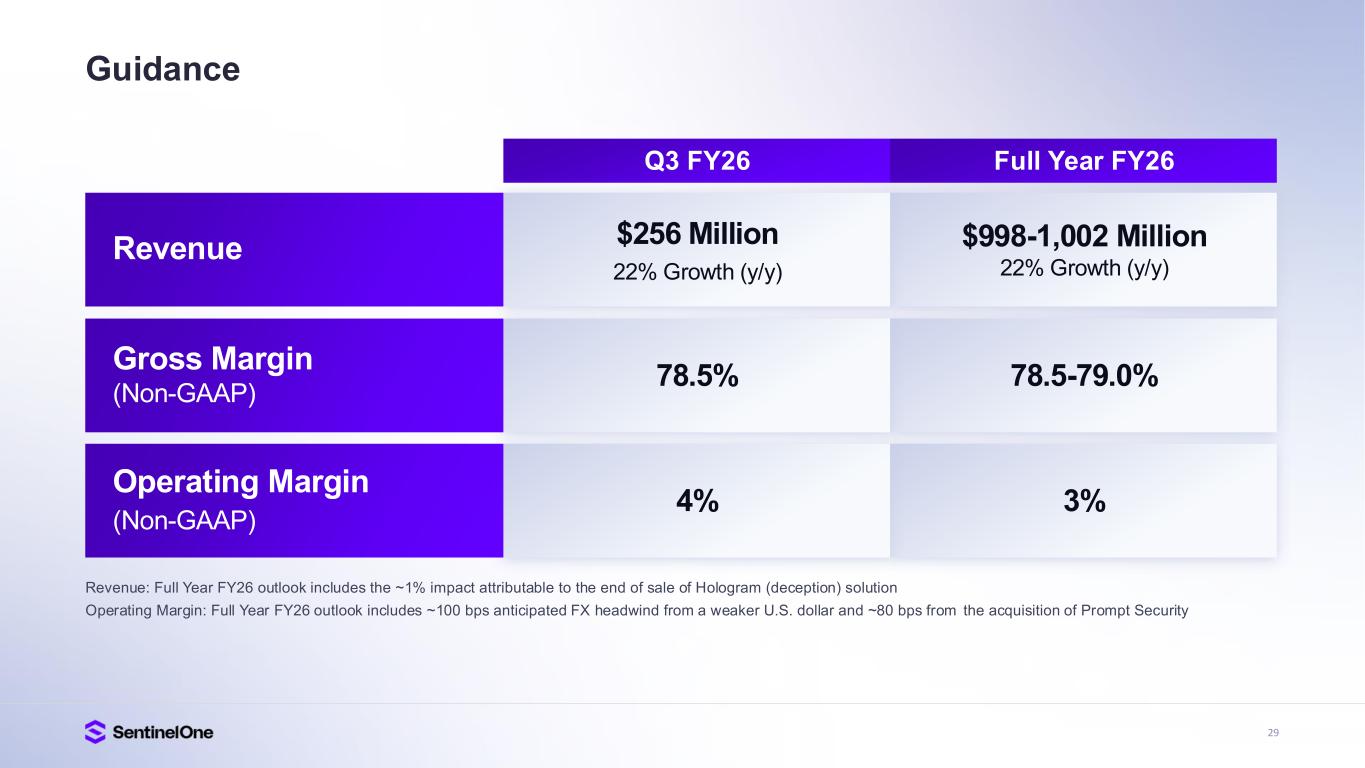
We are providing the following guidance for the third quarter of fiscal year 2026, and for fiscal year 2026 (ending January 31, 2026).
| Q3FY26 Guidance | Full FY2026 Guidance | |||||||||||||
| Revenue | $256 million | $998 - 1,002 million | ||||||||||||
| Non-GAAP gross margin | 78.5% | 78.5 - 79% | ||||||||||||
| Non-GAAP operating margin | 4% | 3% | ||||||||||||
These statements are forward-looking and actual results may differ materially as a result of many factors. Refer to the below for information on the factors that could cause our actual results to differ materially from these forward-looking statements.
Guidance for non-GAAP financial measures excludes stock-based compensation expense, employer payroll tax on employee stock transactions, amortization of acquired intangible assets, acquisition-related compensation costs, restructuring charges, gains and losses on strategic investments, and income tax provision. We have not provided the most directly comparable GAAP measures because certain items are out of our control or cannot be reasonably predicted. Accordingly, a reconciliation of non-GAAP gross margin and non-GAAP operating margin is not available without unreasonable effort.
Webcast Information
We will host a live audio webcast for analysts and investors to discuss our earnings results for the second quarter of fiscal year 2026 and outlook for third quarter of fiscal year 2026 and full fiscal year 2026 today, August 28, 2025, at 1:30 p.m. Pacific Time (4:30 p.m. Eastern Time). The live webcast and a recording of the event will be available on the Investor Relations section of our website at investors.sentinelone.com.
We have used, and intend to continue to use, the Investor Relations section of our website at investors.sentinelone.com as a means of disclosing material nonpublic information and for complying with our disclosure obligations under Regulation FD.
Forward-Looking Statements
This press release contains forward-looking statements within the meaning of Section 27A of the Securities Act of 1933, as amended, and Section 21E of the Securities Exchange Act of 1934, as amended, which statements involve risks and uncertainties, including but not limited to statements regarding our future growth, execution, product innovation and technological development, competitive position, and future financial and operating performance, including our financial outlook for the third quarter of fiscal year 2026 and our full fiscal year 2026, including non-GAAP gross margin and non-GAAP operating margin; share repurchase program; progress towards our long-term profitability targets; and general market trends. The words “believe,” “may,” “will,” “potentially,” “estimate,” “continue,” “anticipate,” “intend,” “could,” “would,” “project,” “target,” “plan,” “expect,” or the negative of these terms and similar expressions are intended to identify forward-looking statements. However, not all forward-looking statements contain these identifying words.
There are a significant number of factors that could cause our actual results to differ materially from statements made in this press release, including but not limited to: our limited operating history; our history of losses; intense competition in the market we compete in; fluctuations in our operating results; actual or perceived network or security incidents against us; actual or perceived defects, errors or vulnerabilities in our platform; our ability to successfully integrate any acquisitions and strategic investments; risks associated with managing our rapid growth; general global, political, economic, and macroeconomic climate, including but not limited to, the changes in U.S. federal spending, significant political or regulatory developments or changes in trade policy, actual or perceived instability in the banking industry; supply chain disruptions; a potential recession, inflation, and interest rate
volatility; geopolitical conflicts around the world; our ability to attract new and retain existing customers, or renew and expand our relationships with them; the ability of our platform to effectively interoperate within our customers' IT infrastructure; disruptions or other business interruptions that affect the availability of our platform including cybersecurity incidents; the failure to timely develop and achieve market acceptance of new products and subscriptions as well as existing products, subscriptions and support offerings; rapidly evolving technological developments in the market for security products and subscription and support offerings; length of sales cycles; and risks of securities class action litigation.
Additional risks and uncertainties that could affect our financial results are included under the captions “Risk Factors” and “Management’s Discussion and Analysis of Financial Condition and Results of Operations” set forth in our filings and reports with the Securities and Exchange Commission (SEC), including our most recently filed Annual Report on Form 10-K, dated March 26, 2025, subsequent Quarterly Reports on Form 10-Q and other filings and reports that we may file from time to time with the SEC, copies of which are available on our website at investors.sentinelone.com and on the SEC’s website at www.sec.gov.
You should not rely on these forward-looking statements, as actual outcomes and results may differ materially from those contemplated by these forward-looking statements as a result of such risks and uncertainties. All forward-looking statements in this press release are based on information and estimates available to us as of the date hereof, and were based on current expectations, estimates, forecasts, and projections as well as the beliefs and assumptions of management. We do not assume any obligation to update the forward-looking statements provided to reflect events that occur or circumstances that exist after the date of this press release or to reflect new information or the occurrence of unexpected events, except as required by law. We may not actually achieve the plans, intentions, or expectations disclosed in our forward-looking statements, and you should not place undue reliance on our forward-looking statements.
Non-GAAP Financial Measures
In addition to our results being determined in accordance with GAAP, we believe the following non-GAAP measures are useful in evaluating our operating performance. We use the following non-GAAP financial information to evaluate our ongoing operations and for internal planning and forecasting purposes. We believe that non-GAAP financial information, when taken collectively, with the financial information presented in accordance with GAAP, may be helpful to investors because it provides consistency and comparability with past financial performance. However, non-GAAP financial information is presented for supplemental informational purposes only, has limitations as an analytical tool, and should not be considered in isolation or as a substitute for financial information presented in accordance with GAAP.
Other companies, including companies in our industry, may calculate similarly titled non-GAAP measures differently or may use other measures to evaluate their performance, all of which could reduce the usefulness of our non-GAAP financial measures as tools for comparison. In addition, the utility of free cash flow as a measure of our liquidity is limited as it does not represent the total increase or decrease in our cash balance for a given period.
Reconciliations between non-GAAP financial measures to the most directly comparable financial measure stated in accordance with GAAP are contained below. Investors are encouraged to review the related GAAP financial measures and the reconciliation of these non-GAAP financial measures to their most directly comparable GAAP financial measures and not rely on any single financial measure to evaluate our business.
As presented in the “Reconciliation of GAAP to Non-GAAP Financial Information” table below, each of the non-GAAP financial measures excludes one or more of the following items:
Stock-based compensation expense
Stock-based compensation expense is a non-cash expense that varies in amount from period to period and is dependent on market forces that are often beyond our control. As a result, management excludes this item from our internal operating forecasts and models. Management believes that non-GAAP measures adjusted for stock-based
compensation expense provide investors with a basis to measure our core performance against the performance of other companies without the variability created by stock-based compensation as a result of the variety of equity awards used by other companies and the varying methodologies and assumptions used.
Employer payroll tax on employee stock transactions
Employer payroll tax expenses related to employee stock transactions are tied to the vesting or exercise of underlying equity awards and the price of our common stock at the time of vesting, which varies in amount from period to period and is dependent on market forces that are often beyond our control. As a result, management excludes this item from our internal operating forecasts and models. Management believes that non-GAAP measures adjusted for employer payroll taxes on employee stock transactions provide investors with a basis to measure our core performance against the performance of other companies without the variability created by employer payroll taxes on employee stock transactions as a result of the stock price at the time of employee exercise.
Amortization of acquired intangible assets
Amortization of acquired intangible asset expense is tied to the intangible assets that were acquired in conjunction with acquisitions, which results in non‑cash expenses that may not otherwise have been incurred. Management believes excluding the expense associated with intangible assets from non-GAAP measures allows for a more accurate assessment of our ongoing operations and provides investors with a better comparison of period-over-period operating results.
Acquisition-related compensation costs
Acquisition-related compensation costs include cash-based compensation expenses resulting from the employment retention of certain employees established in accordance with the terms of each acquisition. Acquisition-related cash-based compensation costs have been excluded as they were specifically negotiated as part of the acquisitions in order to retain such employees and relate to cash compensation that was made either in lieu of stock-based compensation or where the grant of stock-based compensation awards was not practicable. In most cases, these acquisition-related compensation costs are not factored into management’s evaluation of potential acquisitions or our performance after completion of acquisitions, because they are not related to our core operating performance. In addition, the frequency and amount of such charges can vary significantly based on the size and timing of acquisitions and the maturities of the businesses being acquired. Excluding acquisition-related compensation costs from non-GAAP measures provides investors with a basis to compare our results against those of other companies without the variability caused by purchase accounting.
Restructuring charges
Restructuring charges primarily relate to contract termination charges, severance payments, employee benefits, stock-based compensation and asset impairment charges related to facilities. These restructuring charges are excluded from non-GAAP financial measures because they are the result of discrete events that are not considered core-operating activities. We believe that it is appropriate to exclude restructuring charges from non-GAAP financial measures because it enables the comparison of period-over-period operating results from continuing operations.
Gains and losses on strategic investments
Gains and losses on strategic investments relate to the subsequent changes in the recorded value of our strategic investments. These gains and losses are excluded from non-GAAP financial measures because they are the result of discrete events that are not considered core-operating activities. We believe that it is appropriate to exclude gains and losses from strategic investments from non-GAAP financial measures because it enables the comparison of period-over-period net income (loss).
Income tax provision
The tax charge related to a framework for a final settlement and resolution discussed during the six months ended July 31, 2025 with the Israel Tax Authorities (ITA) as a part of the ongoing bilateral Advance Pricing Agreement negotiations with the U.S. Internal Revenue Service and ITA of $136.0 million (included in the balance sheet within other liabilities) and the $4.7 million tax benefit, related to valuation allowance release for the recording of Israeli deferred tax assets, have been excluded from our non-GAAP results because these represent discrete, non-recurring items that are not indicative of our core operating performance. These exclusions provide investors with a clearer view of our underlying financial results and facilitates meaningful comparisons across reporting periods. No finalized resolutions or agreement has been reached at this time.
Dilutive shares applying the treasury stock method
During periods in which we incur a net loss under a GAAP basis, we exclude certain potential common stock equivalents from our GAAP diluted shares because their effect would have been anti-dilutive. In periods where we have net income on a non-GAAP basis, these common stock equivalents would have been dilutive. Accordingly, we have included the impact of these common stock equivalents in the calculation of our non-GAAP diluted net income per share applying the treasury stock method.
Non-GAAP Cost of Revenue, Non-GAAP Gross Profit, Non-GAAP Gross Margin, Non-GAAP Income (Loss) from Operations, Non-GAAP Operating Margin, Non-GAAP Net Income and Non-GAAP Net Income Per Share
We define these non-GAAP financial measures as their respective GAAP measures, excluding the expenses referenced above. We use these non-GAAP financial measures as part of our overall assessment of our performance, including the preparation of our annual operating budget and quarterly forecasts, to evaluate the effectiveness of our business strategies, and to communicate with our board of directors concerning our financial performance.
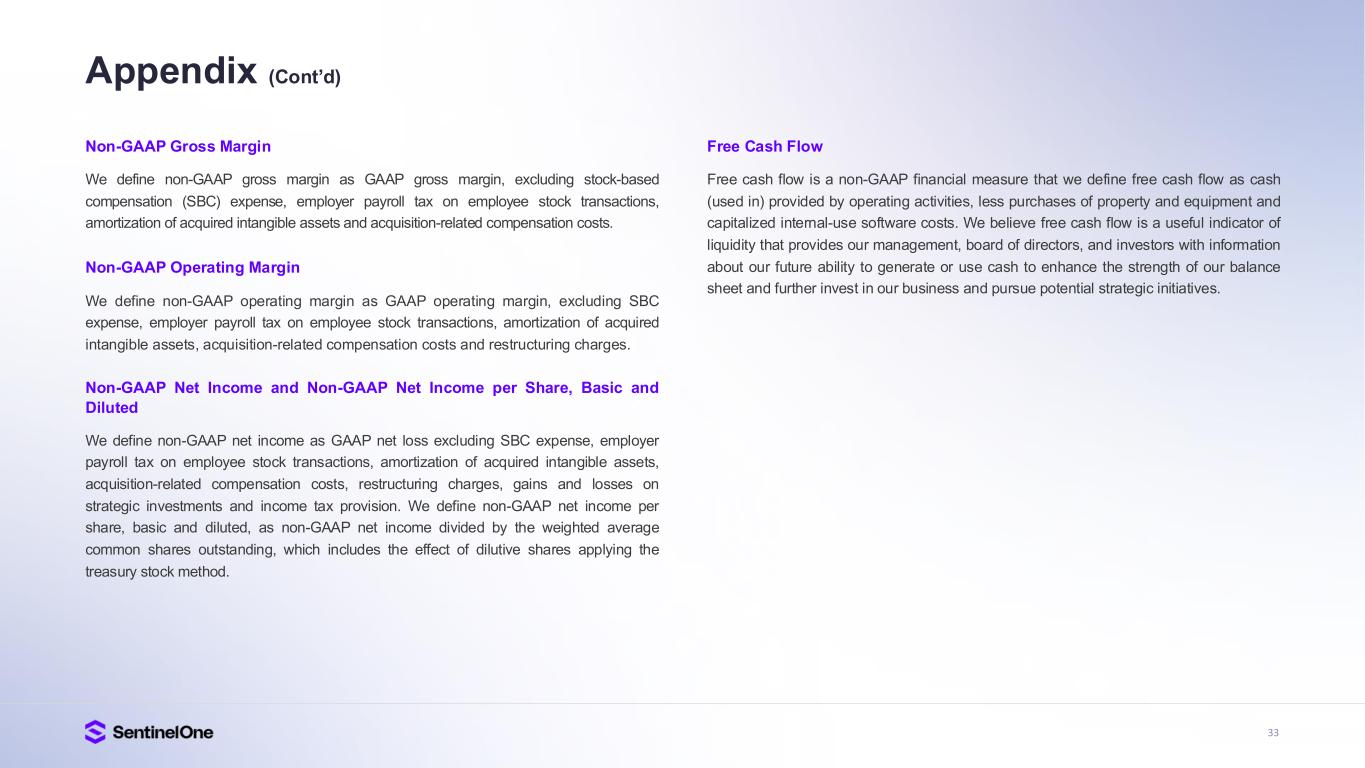
Free Cash Flow
We define free cash flow as cash (used in) provided by operating activities less purchases of property and equipment and capitalized internal-use software costs. We believe free cash flow is a useful indicator of liquidity that provides our management, board of directors, and investors with information about our future ability to generate or use cash to enhance the strength of our balance sheet and further invest in our business and pursue potential strategic initiatives.
Key Business Metrics
We monitor the following key metrics to help us evaluate our business, identify trends affecting our business, formulate business plans, and make strategic decisions.
Annualized Recurring Revenue (ARR)
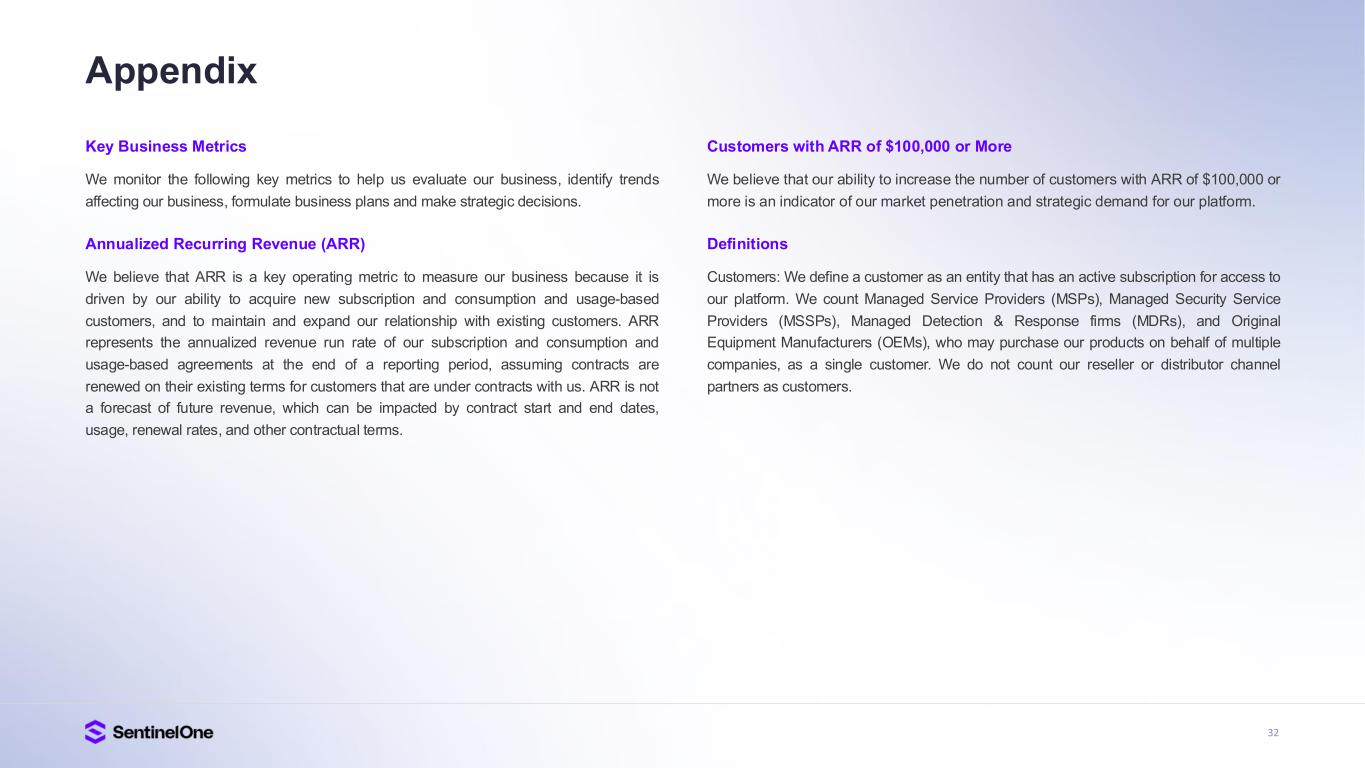
We believe that ARR is a key operating metric to measure our business because it is driven by our ability to acquire new subscription and consumption and usage-based customers, and to maintain and expand our relationship with existing customers. ARR represents the annualized revenue run rate of our subscription and consumption and usage-based agreements at the end of a reporting period, assuming contracts are renewed on their existing terms for customers that are under contracts with us. ARR is not a forecast of future revenue, which can be impacted by contract start and end dates, usage, renewal rates, and other contractual terms.
Customers with ARR of $100,000 or More
We believe that our ability to increase the number of customers with ARR of $100,000 or more is an indicator of our market penetration and strategic demand for our platform. We define a customer as an entity that has an active subscription for access to our platform. We count Managed Service Providers, Managed Security Service Providers,
Managed Detection & Response firms, and Original Equipment Manufacturers, who may purchase our products on behalf of multiple companies, as a single customer. We do not count our reseller or distributor channel partners as customers.
Source: SentinelOne
NYSE: S
Category: Investors
Contact:
Investor Relations:
Saad Nazir
Press:
Craig VerColen
SENTINELONE, INC.
CONDENSED CONSOLIDATED BALANCE SHEETS
(in thousands)
(unaudited)
| July 31, | January 31, | ||||||||||
| 2025 | 2025 | ||||||||||
Assets | |||||||||||
Current assets: | |||||||||||
| Cash and cash equivalents | $ | 278,005 | $ | 186,574 | |||||||
Short-term investments | 532,818 | 535,331 | |||||||||
Accounts receivable, net | 179,332 | 236,012 | |||||||||
Deferred contract acquisition costs, current | 65,402 | 64,782 | |||||||||
Prepaid expenses and other current assets | 37,141 | 47,023 | |||||||||
Total current assets | 1,092,698 | 1,069,722 | |||||||||
Property and equipment, net | 79,227 | 71,774 | |||||||||
| Long-term investments | 347,009 | 419,367 | |||||||||
| Deferred contract acquisition costs, non-current | 83,271 | 85,322 | |||||||||
| Intangible assets, net | 94,272 | 107,155 | |||||||||
| Goodwill | 629,636 | 629,636 | |||||||||
| Other assets | 24,371 | 23,649 | |||||||||
Total assets | $ | 2,350,484 | $ | 2,406,625 | |||||||
| Liabilities and Stockholders’ Equity | |||||||||||
Current liabilities: | |||||||||||
| Accounts payable | $ | 9,725 | $ | 8,159 | |||||||
Accrued payroll and benefits | 66,548 | 79,612 | |||||||||
Deferred revenue, current | 457,221 | 470,127 | |||||||||
| Other current liabilities | 63,282 | 55,655 | |||||||||
Total current liabilities | 596,776 | 613,553 | |||||||||
| Deferred revenue, non-current | 89,586 | 102,017 | |||||||||
| Other liabilities | 156,336 | 21,808 | |||||||||
Total liabilities | 842,698 | 737,378 | |||||||||
| Stockholders’ equity: | |||||||||||
| Preferred stock | — | — | |||||||||
Class A common stock | 32 | 31 | |||||||||
| Class B common stock | 1 | 1 | |||||||||
| Additional paid-in capital | 3,414,117 | 3,294,542 | |||||||||
| Accumulated other comprehensive income | 1,333 | 2,158 | |||||||||
| Accumulated deficit | (1,907,697) | (1,627,485) | |||||||||
| Total stockholders’ equity | 1,507,786 | 1,669,247 | |||||||||
| Total liabilities and stockholders’ equity | $ | 2,350,484 | $ | 2,406,625 | |||||||
SENTINELONE, INC. CONDENSED CONSOLIDATED STATEMENTS OF OPERATIONS (in thousands, except share and per share data) (unaudited) | ||
Three Months Ended July 31, | Six Months Ended July 31, | ||||||||||||||||||||||
| 2025 | 2024 | 2025 | 2024 | ||||||||||||||||||||
Revenue | $ | 242,183 | $ | 198,937 | $ | 471,212 | $ | 385,292 | |||||||||||||||
Cost of revenue(1) | 60,474 | 50,699 | 117,006 | 100,836 | |||||||||||||||||||
| Gross profit | 181,709 | 148,238 | 354,206 | 284,456 | |||||||||||||||||||
| Operating expenses: | |||||||||||||||||||||||
Research and development(1) | 79,091 | 63,602 | 151,344 | 121,923 | |||||||||||||||||||
Sales and marketing(1) | 127,879 | 119,617 | 261,760 | 235,447 | |||||||||||||||||||
General and administrative(1) | 51,474 | 44,400 | 100,153 | 87,067 | |||||||||||||||||||
Restructuring(1) | 3,883 | — | 9,050 | — | |||||||||||||||||||
Total operating expenses | 262,327 | 227,619 | 522,307 | 444,437 | |||||||||||||||||||
| Loss from operations | (80,618) | (79,381) | (168,101) | (159,981) | |||||||||||||||||||
| Interest income, net | 12,196 | 12,817 | 24,486 | 24,863 | |||||||||||||||||||
| Other income (expense), net | (327) | (421) | 165 | (460) | |||||||||||||||||||
| Loss before income taxes | (68,749) | (66,985) | (143,450) | (135,578) | |||||||||||||||||||
| Provision for income taxes | 3,270 | 2,199 | 136,762 | 3,711 | |||||||||||||||||||
| Net loss | $ | (72,019) | $ | (69,184) | $ | (280,212) | $ | (139,289) | |||||||||||||||
Net loss per share attributable to Class A and Class B common stockholders, basic and diluted | $ | (0.22) | $ | (0.22) | $ | (0.85) | $ | (0.45) | |||||||||||||||
| Weighted-average shares used in computing net loss per share attributable to Class A and Class B common stockholders, basic and diluted | 330,938,421 | 312,615,531 | 329,481,933 | 310,358,089 | |||||||||||||||||||
(1) Includes stock-based compensation expense as follows: | |||||||||||||||||||||||
| Cost of revenue | $ | 5,399 | $ | 5,564 | $ | 10,064 | $ | 10,433 | |||||||||||||||
| Research and development | 24,289 | 20,811 | 45,230 | 38,276 | |||||||||||||||||||
| Sales and marketing | 21,338 | 18,882 | 44,253 | 36,956 | |||||||||||||||||||
| General and administrative | 22,858 | 19,420 | 43,028 | 37,565 | |||||||||||||||||||
| Restructuring | — | — | (36) | — | |||||||||||||||||||
| Total stock-based compensation expense | $ | 73,884 | $ | 64,677 | $ | 142,539 | $ | 123,230 | |||||||||||||||
SENTINELONE, INC.
CONDENSED CONSOLIDATED STATEMENTS OF CASH FLOWS
(in thousands)
(unaudited)
Six Months Ended July 31, | |||||||||||
| 2025 | 2024 | ||||||||||
| CASH FLOW FROM OPERATING ACTIVITIES: | |||||||||||
| Net loss | $ | (280,212) | $ | (139,289) | |||||||
| Adjustments to reconcile net loss to net cash provided by operating activities: | |||||||||||
| Depreciation and amortization | 23,117 | 21,110 | |||||||||
| Amortization of deferred contract acquisition costs | 37,507 | 31,252 | |||||||||
| Non-cash operating lease costs | 2,120 | 1,939 | |||||||||
| Stock-based compensation expense | 142,539 | 123,230 | |||||||||
| Accretion of discounts, and amortization of premiums on investments, net | (4,856) | (7,420) | |||||||||
| Asset impairment charges | 2,176 | 1,429 | |||||||||
| Other | 280 | 113 | |||||||||
| Changes in operating assets and liabilities, net of effects of acquisitions | |||||||||||
| Accounts receivable | 56,409 | 59,258 | |||||||||
| Prepaid expenses and other assets | 3,159 | 8,942 | |||||||||
| Deferred contract acquisition costs | (36,076) | (34,901) | |||||||||
| Accounts payable | 1,547 | 10 | |||||||||
| Accrued and other liabilities | 144,040 | 4,658 | |||||||||
| Accrued payroll and benefits | (13,063) | (10,645) | |||||||||
| Operating lease liabilities | (2,119) | (2,800) | |||||||||
| Deferred revenue | (25,337) | (12,583) | |||||||||
| Net cash provided by operating activities | 51,231 | 44,303 | |||||||||
| CASH FLOW FROM INVESTING ACTIVITIES: | |||||||||||
| Purchases of property and equipment | (410) | (1,439) | |||||||||
| Purchases of intangible assets | (100) | (133) | |||||||||
| Capitalization of internal-use software | (12,525) | (14,544) | |||||||||
| Purchases of investments | (208,090) | (442,629) | |||||||||
| Proceeds from sales, maturities and return of capital of investments | 286,767 | 404,677 | |||||||||
| Cash paid for acquisitions, net of cash acquired | — | (61,553) | |||||||||
| Net cash provided by (used in) investing activities | 65,642 | (115,621) | |||||||||
| CASH FLOW FROM FINANCING ACTIVITIES: | |||||||||||
| Repurchases of common stock | (52,693) | — | |||||||||
| Repurchase of early exercised stock options | — | (21) | |||||||||
| Proceeds from exercise of stock options | 15,229 | 12,813 | |||||||||
| Proceeds from issuance of common stock under the employee stock purchase plan | 9,065 | 8,800 | |||||||||
| Net cash (used in) provided by financing activities | (28,399) | 21,592 | |||||||||
| NET CHANGE IN CASH, CASH EQUIVALENTS, AND RESTRICTED CASH | 88,474 | (49,726) | |||||||||
| CASH, CASH EQUIVALENTS, AND RESTRICTED CASH–Beginning of period | 193,302 | 322,086 | |||||||||
| CASH, CASH EQUIVALENTS, AND RESTRICTED CASH–End of period | $ | 281,776 | $ | 272,360 | |||||||
SENTINELONE, INC.
RECONCILIATION OF GAAP TO NON-GAAP FINANCIAL INFORMATION
(in thousands, except percentages and per share data)
(unaudited)
| Three Months Ended July 31, | Six Months Ended July 31, | ||||||||||||||||||||||
| 2025 | 2024 | 2025 | 2024 | ||||||||||||||||||||
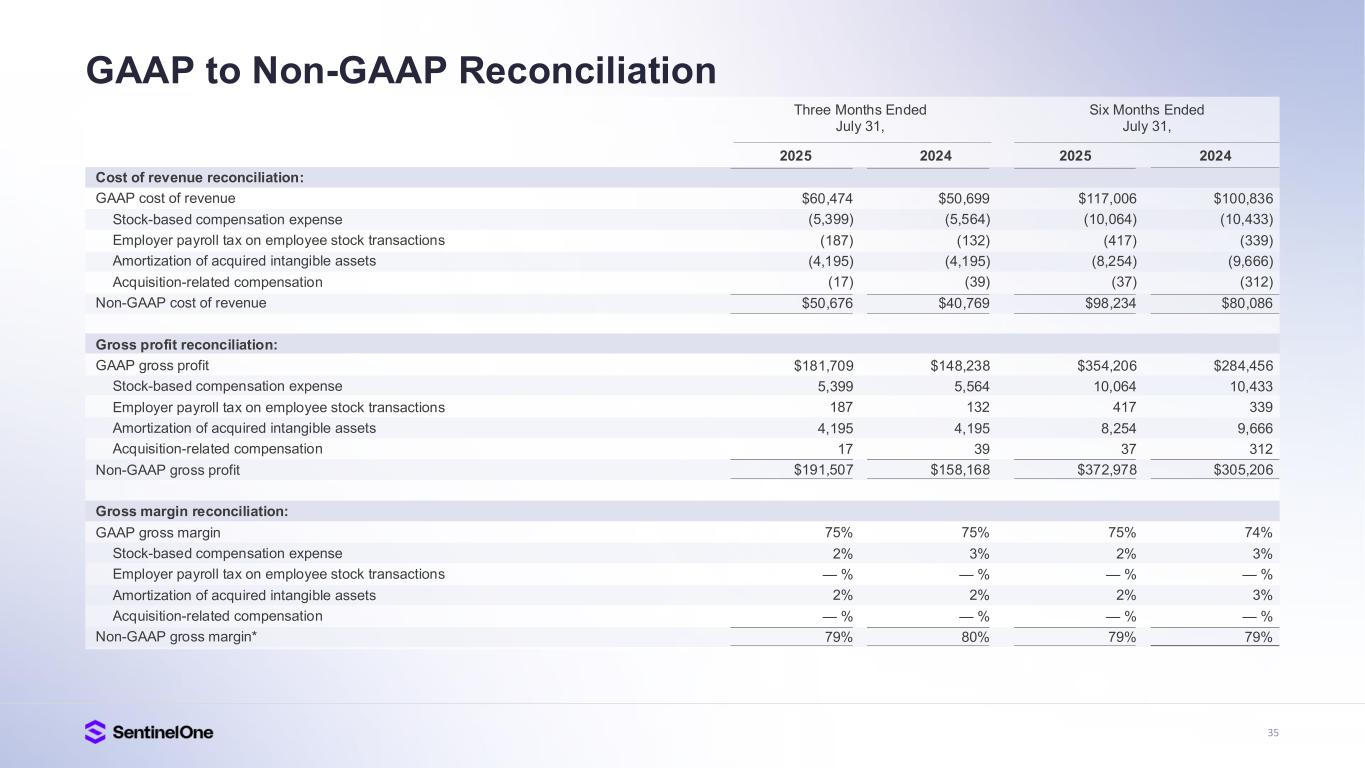
| Cost of revenue reconciliation: | |||||||||||||||||||||||
| GAAP cost of revenue | $ | 60,474 | $ | 50,699 | $ | 117,006 | $ | 100,836 | |||||||||||||||
| Stock-based compensation expense | (5,399) | (5,564) | (10,064) | (10,433) | |||||||||||||||||||
| Employer payroll tax on employee stock transactions | (187) | (132) | (417) | (339) | |||||||||||||||||||
| Amortization of acquired intangible assets | (4,195) | (4,195) | (8,254) | (9,666) | |||||||||||||||||||
| Acquisition-related compensation | (17) | (39) | (37) | (312) | |||||||||||||||||||
| Non-GAAP cost of revenue | $ | 50,676 | $ | 40,769 | $ | 98,234 | $ | 80,086 | |||||||||||||||
| Gross profit reconciliation: | |||||||||||||||||||||||
| GAAP gross profit | $ | 181,709 | $ | 148,238 | $ | 354,206 | $ | 284,456 | |||||||||||||||
| Stock-based compensation expense | 5,399 | 5,564 | 10,064 | 10,433 | |||||||||||||||||||
| Employer payroll tax on employee stock transactions | 187 | 132 | 417 | 339 | |||||||||||||||||||
| Amortization of acquired intangible assets | 4,195 | 4,195 | 8,254 | 9,666 | |||||||||||||||||||
| Acquisition-related compensation | 17 | 39 | 37 | 312 | |||||||||||||||||||
| Non-GAAP gross profit | $ | 191,507 | $ | 158,168 | $ | 372,978 | $ | 305,206 | |||||||||||||||
| Gross margin reconciliation: | |||||||||||||||||||||||
| GAAP gross margin | 75 | % | 75 | % | 75 | % | 74 | % | |||||||||||||||
| Stock-based compensation expense | 2 | % | 3 | % | 2 | % | 3 | % | |||||||||||||||
| Employer payroll tax on employee stock transactions | — | % | — | % | — | % | — | % | |||||||||||||||
| Amortization of acquired intangible assets | 2 | % | 2 | % | 2 | % | 3 | % | |||||||||||||||
| Acquisition-related compensation | — | % | — | % | — | % | — | % | |||||||||||||||
Non-GAAP gross margin* | 79 | % | 80 | % | 79 | % | 79 | % | |||||||||||||||
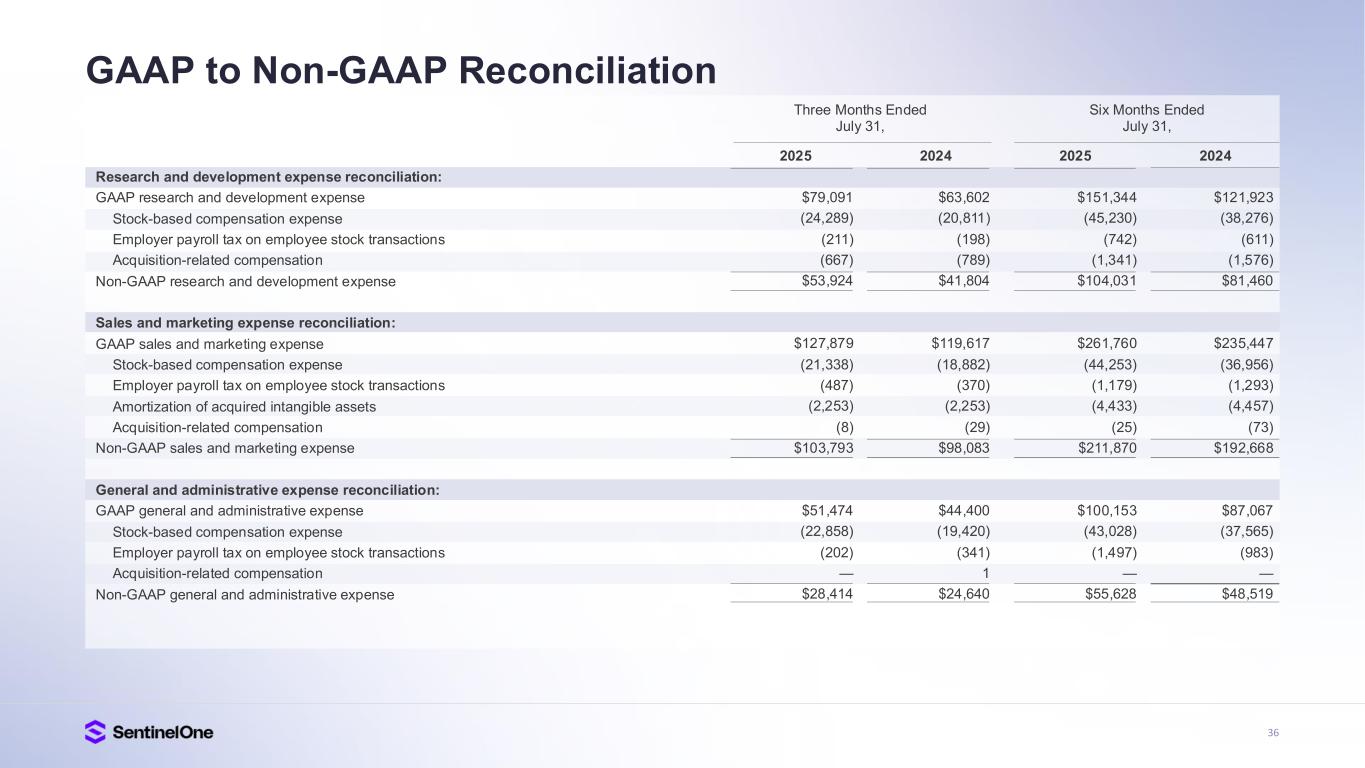
| Research and development expense reconciliation: | |||||||||||||||||||||||
| GAAP research and development expense | $ | 79,091 | $ | 63,602 | $ | 151,344 | $ | 121,923 | |||||||||||||||
| Stock-based compensation expense | (24,289) | (20,811) | (45,230) | (38,276) | |||||||||||||||||||
| Employer payroll tax on employee stock transactions | (211) | (198) | (742) | (611) | |||||||||||||||||||
| Acquisition-related compensation | (667) | (789) | (1,341) | (1,576) | |||||||||||||||||||
| Non-GAAP research and development expense | $ | 53,924 | $ | 41,804 | $ | 104,031 | $ | 81,460 | |||||||||||||||
| Sales and marketing expense reconciliation: | |||||||||||||||||||||||
| GAAP sales and marketing expense | $ | 127,879 | $ | 119,617 | $ | 261,760 | $ | 235,447 | |||||||||||||||
| Stock-based compensation expense | (21,338) | (18,882) | (44,253) | (36,956) | |||||||||||||||||||
| Employer payroll tax on employee stock transactions | (487) | (370) | (1,179) | (1,293) | |||||||||||||||||||
| Amortization of acquired intangible assets | (2,253) | (2,253) | (4,433) | (4,457) | |||||||||||||||||||
| Acquisition-related compensation | (8) | (29) | (25) | (73) | |||||||||||||||||||
| Non-GAAP sales and marketing expense | $ | 103,793 | $ | 98,083 | $ | 211,870 | $ | 192,668 | |||||||||||||||
| General and administrative expense reconciliation: | |||||||||||||||||||||||
| GAAP general and administrative expense | $ | 51,474 | $ | 44,400 | $ | 100,153 | $ | 87,067 | |||||||||||||||
| Stock-based compensation expense | (22,858) | (19,420) | (43,028) | (37,565) | |||||||||||||||||||
SENTINELONE, INC.
RECONCILIATION OF GAAP TO NON-GAAP FINANCIAL INFORMATION
(in thousands, except percentages and per share data)
(unaudited)
| Employer payroll tax on employee stock transactions | (202) | (341) | (1,497) | (983) | |||||||||||||||||||
| Acquisition-related compensation | — | 1 | — | — | |||||||||||||||||||
| Non-GAAP general and administrative expense | $ | 28,414 | $ | 24,640 | $ | 55,628 | $ | 48,519 | |||||||||||||||
| Restructuring expense reconciliation: | |||||||||||||||||||||||
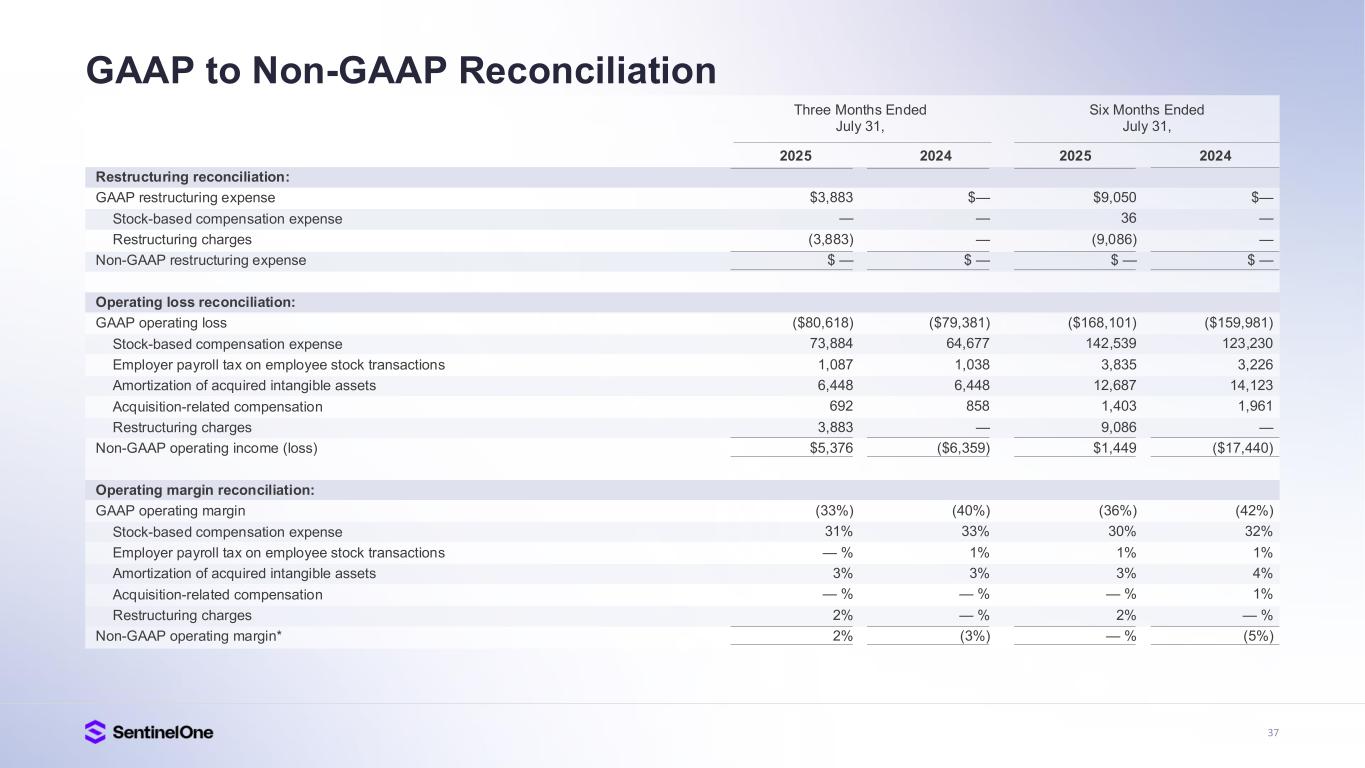
| GAAP restructuring expense | $ | 3,883 | $ | — | $ | 9,050 | $ | — | |||||||||||||||
| Stock-based compensation | — | — | 36 | — | |||||||||||||||||||
Restructuring charges | (3,883) | — | (9,086) | — | |||||||||||||||||||
| Non-GAAP restructuring expense | $ | — | $ | — | $ | — | $ | — | |||||||||||||||
| Operating loss reconciliation: | |||||||||||||||||||||||
| GAAP operating loss | $ | (80,618) | $ | (79,381) | $ | (168,101) | $ | (159,981) | |||||||||||||||
| Stock-based compensation expense | 73,884 | 64,677 | 142,539 | 123,230 | |||||||||||||||||||
| Employer payroll tax on employee stock transactions | 1,087 | 1,038 | 3,835 | 3,226 | |||||||||||||||||||
| Amortization of acquired intangible assets | 6,448 | 6,448 | 12,687 | 14,123 | |||||||||||||||||||
| Acquisition-related compensation | 692 | 858 | 1,403 | 1,961 | |||||||||||||||||||
Restructuring charges | 3,883 | — | 9,086 | — | |||||||||||||||||||
Non-GAAP operating income (loss) | $ | 5,376 | $ | (6,359) | $ | 1,449 | $ | (17,440) | |||||||||||||||
| Operating margin reconciliation: | |||||||||||||||||||||||
| GAAP operating margin | (33) | % | (40) | % | (36) | % | (42) | % | |||||||||||||||
| Stock-based compensation expense | 31 | % | 33 | % | 30 | % | 32 | % | |||||||||||||||
| Employer payroll tax on employee stock transactions | — | % | 1 | % | 1 | % | 1 | % | |||||||||||||||
| Amortization of acquired intangible assets | 3 | % | 3 | % | 3 | % | 4 | % | |||||||||||||||
| Acquisition-related compensation | — | % | — | % | — | % | 1 | % | |||||||||||||||
Restructuring charges | 2 | % | — | % | 2 | % | — | % | |||||||||||||||
| Non-GAAP operating margin* | 2 | % | (3) | % | — | % | (5) | % | |||||||||||||||
| Net income (loss) reconciliation: | |||||||||||||||||||||||
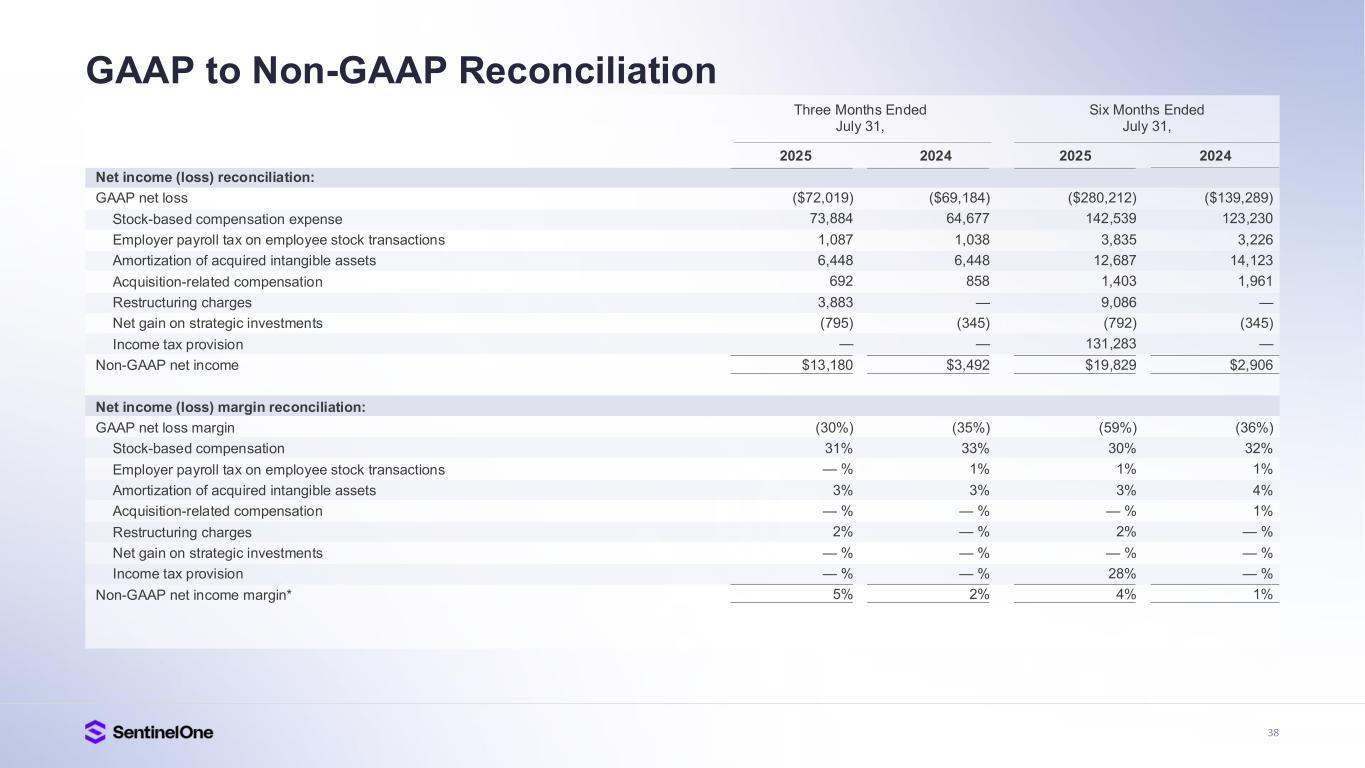
| GAAP net loss | $ | (72,019) | $ | (69,184) | $ | (280,212) | $ | (139,289) | |||||||||||||||
| Stock-based compensation expense | 73,884 | 64,677 | 142,539 | 123,230 | |||||||||||||||||||
| Employer payroll tax on employee stock transactions | 1,087 | 1,038 | 3,835 | 3,226 | |||||||||||||||||||
| Amortization of acquired intangible assets | 6,448 | 6,448 | 12,687 | 14,123 | |||||||||||||||||||
| Acquisition-related compensation | 692 | 858 | 1,403 | 1,961 | |||||||||||||||||||
Restructuring charges | 3,883 | — | 9,086 | — | |||||||||||||||||||
| Net gain on strategic investments | (795) | (345) | (792) | (345) | |||||||||||||||||||
| Income tax provision | — | — | 131,283 | — | |||||||||||||||||||
Non-GAAP net income | $ | 13,180 | $ | 3,492 | $ | 19,829 | $ | 2,906 | |||||||||||||||
| Net income (loss) margin reconciliation: | |||||||||||||||||||||||
GAAP net loss margin | (30) | % | (35) | % | (59) | % | (36) | % | |||||||||||||||
| Stock-based compensation | 31 | % | 33 | % | 30 | % | 32 | % | |||||||||||||||
| Employer payroll tax on employee stock transactions | — | % | 1 | % | 1 | % | 1 | % | |||||||||||||||
| Amortization of acquired intangible assets | 3 | % | 3 | % | 3 | % | 4 | % | |||||||||||||||
SENTINELONE, INC.
RECONCILIATION OF GAAP TO NON-GAAP FINANCIAL INFORMATION (CONTINUED)
(in thousands, except percentages and per share data)
(unaudited)
| Acquisition-related compensation | — | % | — | % | — | % | 1 | % | |||||||||||||||
Restructuring charges | 2 | % | — | % | 2 | % | — | % | |||||||||||||||
| Net gain on strategic investments | — | % | — | % | — | % | — | % | |||||||||||||||
| Income tax provision | — | % | — | % | 28 | % | — | % | |||||||||||||||
Non-GAAP net income margin* | 5 | % | 2 | % | 4 | % | 1 | % | |||||||||||||||
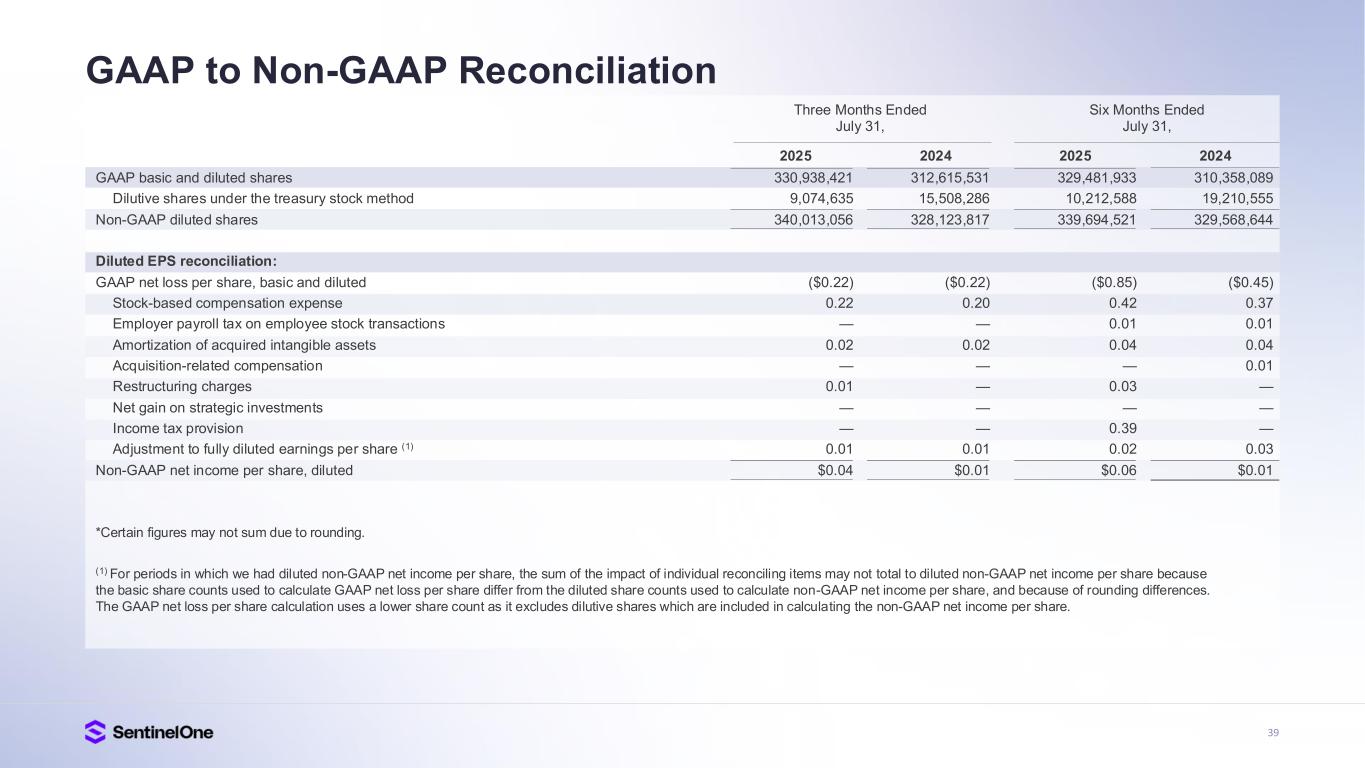
| GAAP basic and diluted shares | 330,938,421 | 312,615,531 | 329,481,933 | 310,358,089 | |||||||||||||||||||
| Dilutive shares under the treasury stock method | 9,074,635 | 15,508,286 | 10,212,588 | 19,210,555 | |||||||||||||||||||
| Non-GAAP diluted shares | 340,013,056 | 328,123,817 | 339,694,521 | 329,568,644 | |||||||||||||||||||
| Diluted EPS reconciliation: | |||||||||||||||||||||||
| GAAP net loss per share, basic and diluted | $ | (0.22) | $ | (0.22) | $ | (0.85) | $ | (0.45) | |||||||||||||||
| Stock-based compensation expense | 0.22 | 0.20 | 0.42 | 0.37 | |||||||||||||||||||
| Employer payroll tax on employee stock transactions | — | — | 0.01 | 0.01 | |||||||||||||||||||
| Amortization of acquired intangible assets | 0.02 | 0.02 | 0.04 | 0.04 | |||||||||||||||||||
| Acquisition-related compensation | — | — | — | 0.01 | |||||||||||||||||||
| Restructuring charges | 0.01 | — | 0.03 | — | |||||||||||||||||||
| Net gain on strategic investments | — | — | — | — | |||||||||||||||||||
| Income tax provision | — | — | 0.39 | — | |||||||||||||||||||
Adjustment to fully diluted earnings per share (1) | 0.01 | 0.01 | 0.02 | 0.03 | |||||||||||||||||||
| Non-GAAP net income per share, diluted | $ | 0.04 | $ | 0.01 | $ | 0.06 | $ | 0.01 | |||||||||||||||
*Certain figures may not sum due to rounding.
(1) For periods in which we had diluted non-GAAP net income per share, the sum of the impact of individual reconciling items may not total to diluted non-GAAP net income per share because the basic share counts used to calculate GAAP net loss per share differ from the diluted share counts used to calculate non-GAAP net income per share, and because of rounding differences. The GAAP net loss per share calculation uses a lower share count as it excludes dilutive shares which are included in calculating the non-GAAP net income per share.
SENTINELONE, INC.
SELECTED CASH FLOW INFORMATION
(in thousands)
(unaudited)
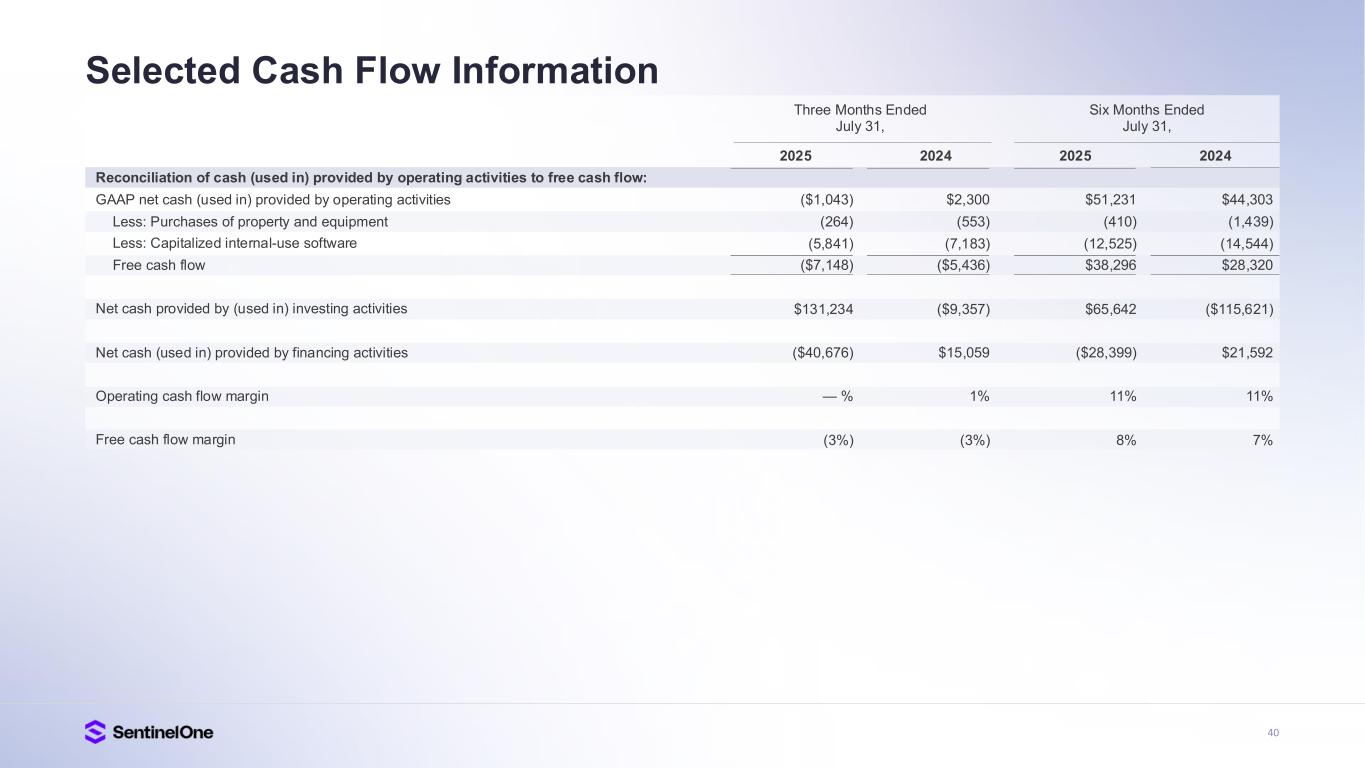
Reconciliation of cash (used in) provided by operating activities to free cash flow
| Three Months Ended July 31, | Six Months Ended July 31, | ||||||||||||||||||||||
| 2025 | 2024 | 2025 | 2024 | ||||||||||||||||||||
GAAP net cash (used in) provided by operating activities | $ | (1,043) | $ | 2,300 | $ | 51,231 | $ | 44,303 | |||||||||||||||
| Less: Purchases of property and equipment | (264) | (553) | (410) | (1,439) | |||||||||||||||||||
| Less: Capitalized internal-use software | (5,841) | (7,183) | (12,525) | (14,544) | |||||||||||||||||||
| Free cash flow | $ | (7,148) | $ | (5,436) | $ | 38,296 | $ | 28,320 | |||||||||||||||
Net cash provided by (used in) investing activities | $ | 131,234 | $ | (9,357) | $ | 65,642 | $ | (115,621) | |||||||||||||||
Net cash (used in) provided by financing activities | $ | (40,676) | $ | 15,059 | $ | (28,399) | $ | 21,592 | |||||||||||||||
Operating cash flow margin | — | % | 1 | % | 11 | % | 11 | % | |||||||||||||||
Free cash flow margin | (3) | % | (3) | % | 8 | % | 7 | % | |||||||||||||||