Se nt in el O ne Q 3 F Y 20 22 Q3 FY2022 Letter to Shareholders December 7, 2021
Q3 FY2022 LETTER TO SHAREHOLDERSSENTINELONE 1 To Our Shareholders Cybersecurity is indispensable to our digital way of life, with millions of cyber attacks occurring every year resulting in trillions of dollars in damages. We are in the midst of a generational shift in cybersecurity, ushered in by the ongoing digital transformation of the enterprise. Attacks can inflict damages spanning operational disruption, leadership change, loss of customer trust, intellectual property theft, among others. The rise and persistence of cyber attacks clearly show that there is a long way to go from here. Enterprises must deploy solutions that enable them to stay one step ahead of attackers and address intrusion attempts in real-time at machine speed - empowering human operators with the speed, scale, and precision of technology. At SentinelOne, our mission is to protect against every attack every second of every day. We harness machine learning, data analytics, and automation to protect the world and our way of life from cyber attacks. The generational overhaul underway in security extends beyond just endpoint detection and response. This is why we believe it is essential to protect other parts of the digital enterprise such as IoT, cloud workloads, and the data itself with cybersecurity that is autonomous. Our approach is resonating with our customers. We received the highest overall rating in the 2021 Gartner ‘Voice of the Customer’ Report for Endpoint Protection Platforms where 97% of reviewers recommend the SentinelOne Singularity XDR platform. Executing Against Our Growth Strategy In the fiscal third quarter, we continued to make progress across all aspects of our growth strategy outlined during our initial public offering (IPO). Our results demonstrate execution against our strategy and the strength of our innovative Singularity XDR platform. We detail this progress below. 01 Q3 FY2022 Highlights • Annualized Recurring Revenue (ARR) grew 131% year-over-year to $237 million at the end of our fiscal third quarter, compared to 127% year-over-year growth in the prior quarter. Our quarterly revenue grew 128% year-over-year to $56 million. • Our growth was driven by a combination of new and existing customers. We added over 600 customers sequentially in our fiscal third quarter. Our total customer count grew by more than 75% year-over-year to over 6,000 at quarter-end. Customers with ARR over $100K grew 140% year-over-year to 416. Our dollar-based net revenue retention rate reached a new record of 130%. • Our fiscal third quarter GAAP gross margin was 64%, up 6 percentage points year-over-year. Our non-GAAP gross margin was 67%, up 9 percentage points year-over-year. • Our fiscal third quarter GAAP operating margin was (120)%, improving both on a year-over- year and quarter-over-quarter basis. Our non-GAAP operating margin was (69)%, improving both on a year-over-year and quarter-over-quarter basis.
Q3 FY2022 LETTER TO SHAREHOLDERSSENTINELONE 2 We continue to innovate and enhance our cybersecurity and data platform. We automate security capabilities to counter instantaneous cyber attacks and enable under-resourced IT teams. Last quarter, we introduced Storyline Active Response (STAR) for customized detection and response rules. This quarter, we began offering Remote Script Orchestration (RSO) to investigate and triage threats on multiple endpoints across entire organizations remotely. And finally, we just announced Singularity Mobile, offering customers the ability to manage mobile device security alongside endpoint, cloud workloads, and IoT devices. We added over 600 new customers sequentially in the third quarter. We’re protecting more enterprises than ever before. We grew our total customer count by more than 75% year-over-year to over 6,000 in our fiscal third quarter. Customers with ARR over $100K grew 140%, and we continue to see our business mix increasingly towards larger enterprises. In addition to expanding our global presence through direct sales teams, our channel remains a source of scalable growth and differentiation. We’re further expanding our success and scale with Incident Response (IR) and Managed Security Service Provider (MSSP) partners. We drove further product adoption within our existing customer base. Our net retention rate (NRR) for our fiscal third quarter reached a new record of 130%, driven by agent expansion, platform upgrades, and module attachments. While early, we’re encouraged by customer interest and adoption of our modules. Our emerging products are all growing well into the triple digits, including Ranger, cloud workload protection (CWP), and data capabilities. Our CWP module delivered the highest growth during the quarter, a testament to the demand for our real-time runtime protection for cloud workloads and containers. We expanded our global footprint. Revenue from international markets grew 159% year-over-year, representing 33% of total revenue in Q3. As an example, we secured a European conglomerate by replacing over 20 different anti-virus products. This shows how our platform approach can help with agent consolidation while also delivering leading performance. We’re further expanding our international sales coverage, channel presence, and are hiring talent in our new R&D center in the Czech Republic. We are well-positioned to expand our addressable market through both acquisitions and strategic investments. We evaluate acquisition prospects that align with our product, customer, and strategic market opportunities. We intend to use these opportunities to extend the reach of our XDR platform into adjacencies that complement our core offerings. In addition, strategic minority investments in emerging technologies will allow us to further enhance the SentinelOne platform in areas that may be of future interest to us. For example, we recently participated in the Series A funding for Laminar, an API and data security company, and the Series B funding for Torq, an automation platform focused on APIs and workflows. Long-term, we are committed to innovation, automation, and securing data wherever it resides with a front-row seat into cutting-edge cybersecurity technologies. Recognized for XDR Capabilities At SentinelOne, we believe a true XDR platform must provide visibility, prevention, detection, and response – automated – across all enterprise attack surfaces. It is necessary to have an open architecture that integrates, orchestrates, and automates a holistic zero trust approach. XDR replaces siloed security and helps organizations address cybersecurity challenges from a unified standpoint. With a single pool of raw data comprising information from across the entire ecosystem, XDR allows faster, deeper, and more effective threat detection and response than EDR, collecting and collating data from a wider range of sources. According to The Forrester New Wave™: Extended Detection and Response’s (XDR) Providers, Q4 2021 ‘New Wave’ report, SentinelOne’s Singularity XDR platform “is the best fit for companies that want customizability and to grow into XDR.”
Q3 FY2022 LETTER TO SHAREHOLDERSSENTINELONE 3 Fostering a Dynamic and Inclusive Culture We believe that our people and our culture are an important competitive advantage. In the past year, we have rapidly grown our headcount from about 600 to over 1,080 at the end of the third fiscal quarter. Our ability to succeed is dependent on fostering a dynamic and inclusive culture. We received a series of awards during the quarter that recognize our workplace culture, including Comparably awards, Great Place To Work, and Dunn’s 100 Best High Tech Companies To Work For. As part of the 2021 Great Place to Work certification, 96% of responses from employees said SentinelOne is a great place to work. • Even the largest and most mission-critical systems in the world can face risks. Our research team has identified dozens of vulnerabilities affecting Amazon’s cloud services, which are used by millions of customers worldwide. These vulnerabilities allow attackers to escalate privileges enabling them to disable security products, overwrite system components, corrupt the operating system, or perform malicious operations unimpeded. We have followed a responsible disclosure policy and worked closely with Amazon and other vendors to fix these security gaps. • We discovered a high severity flaw in HP OMEN Gaming Hub, a software product that comes preinstalled on millions of HP OMEN desktops and laptops worldwide. This software can be used to control and optimize settings such as device GPU, fan speeds, CPU overclocking, memory and more. With this level of access, attackers would have been able to disable security products, overwrite system components, corrupt the OS, or perform malicious operations unimpeded. We reported this finding to HP, and HP has released a security update to its customers to address this vulnerability. At SentinelLabs, our advanced threat research division, we perform threat research, discover vulnerabilities, and monitor emerging threat trends to share with the market. We help both customers and the broader cybersecurity defense community understand cyber risk and stay ahead of adversaries.
Q3 FY2022 LETTER TO SHAREHOLDERSSENTINELONE 4 Platform Highlights Automation Automation is key to threat detection and response at scale – neutralizing threats effectively and in real time. Yet, legacy tools and point products still require people to manually execute commands on each machine across the network individually. Enterprise security teams need help triaging and remediating incidents at speed and scale to stay ahead of the threat landscape. Automated response workflow dramatically reduces the time to remediation and the impact of attacks – it is the equivalent of always having a security analyst on every endpoint. We designed and built SentinelOne Remote Script Orchestration (RSO), a powerful endpoint management tool for both IR partners and enterprises that goes beyond cybersecurity use cases. Our customers and partners can remotely evaluate an entire enterprise footprint regardless of where the endpoint resides. With RSO, security analysts can efficiently run scripts across any number of endpoints simultaneously to collect anything needed for an investigation with a click of a button. This platform capability solves widespread aggregation and enforcement challenges, as it enables consolidating workflows and capabilities to the Singularity XDR platform. With RSO, we limit the need for manual, time-intensive tasks and legacy tools, empowering security analysts to up level their approach to incident response and forensic collection with speed, scale, and simplicity – a step forward for the XDR era. SentinelOne RSO is the only remote orchestration solution on the market that, in the same platform as an industry-leading EPP, EDR, and XDR, supports macOS, Windows, and Linux environments. Our customers and partners are already realizing the benefits of machine speed automation with RSO. XDR The prevalence of hybrid work and bring your own device (BYOD) policies has created a slew of new targets for attackers. Our Singularity XDR Platform secures endpoint, cloud, IoT, and now mobile assets to deliver autonomous cybersecurity. Singularity XDR delivers leading protection, visibility, and response across the distributed enterprise including Windows, Mac, Linux, and cloud workloads. Singularity Mobile, in partnership with Zimperium, delivers AI-powered mobile threat defense to iOS, Android, and ChromeOS. With industry leading on-device behavioral AI de- tecting and protecting against mobile malware, phishing, exploits, and man-in-the-middle (MiTM) attacks, Singularity Mobile provides security and data privacy to support end-to-end zero trust without cloud connection dependency. Zero Trust Protecting the ever-expanding digital infrastructure requires a shift to Zero Trust architecture that integrates best- of-breed solutions to fill security gaps across device, cloud, and user. Accordingly, an open ecosystem is critical for a Zero Trust security environment. To protect our customers, we have developed Singularity XDR to be an open and ecosystem-friendly platform. In the third quarter, we further expanded our partner ecosystem with leading identity providers, like Microsoft, and network vendors, like Arista Networks and others. We’re committed to delivering joint technology solutions that serve customers with the best-of-breed Zero Trust security model. To advance the Zero Trust journey of our customers, we introduced an endpoint-centric Conditional Policy Engine called Singularity Conditional Policy. Organizations can choose what their security configuration for healthy endpoints should be and select a different configuration for risky endpoints. With this capability, we empower organizations to dynamically change security configurations based on an endpoint’s risk level. Singularity Conditional Policy helps reduce the attack surface and prevent potential further damage. 02
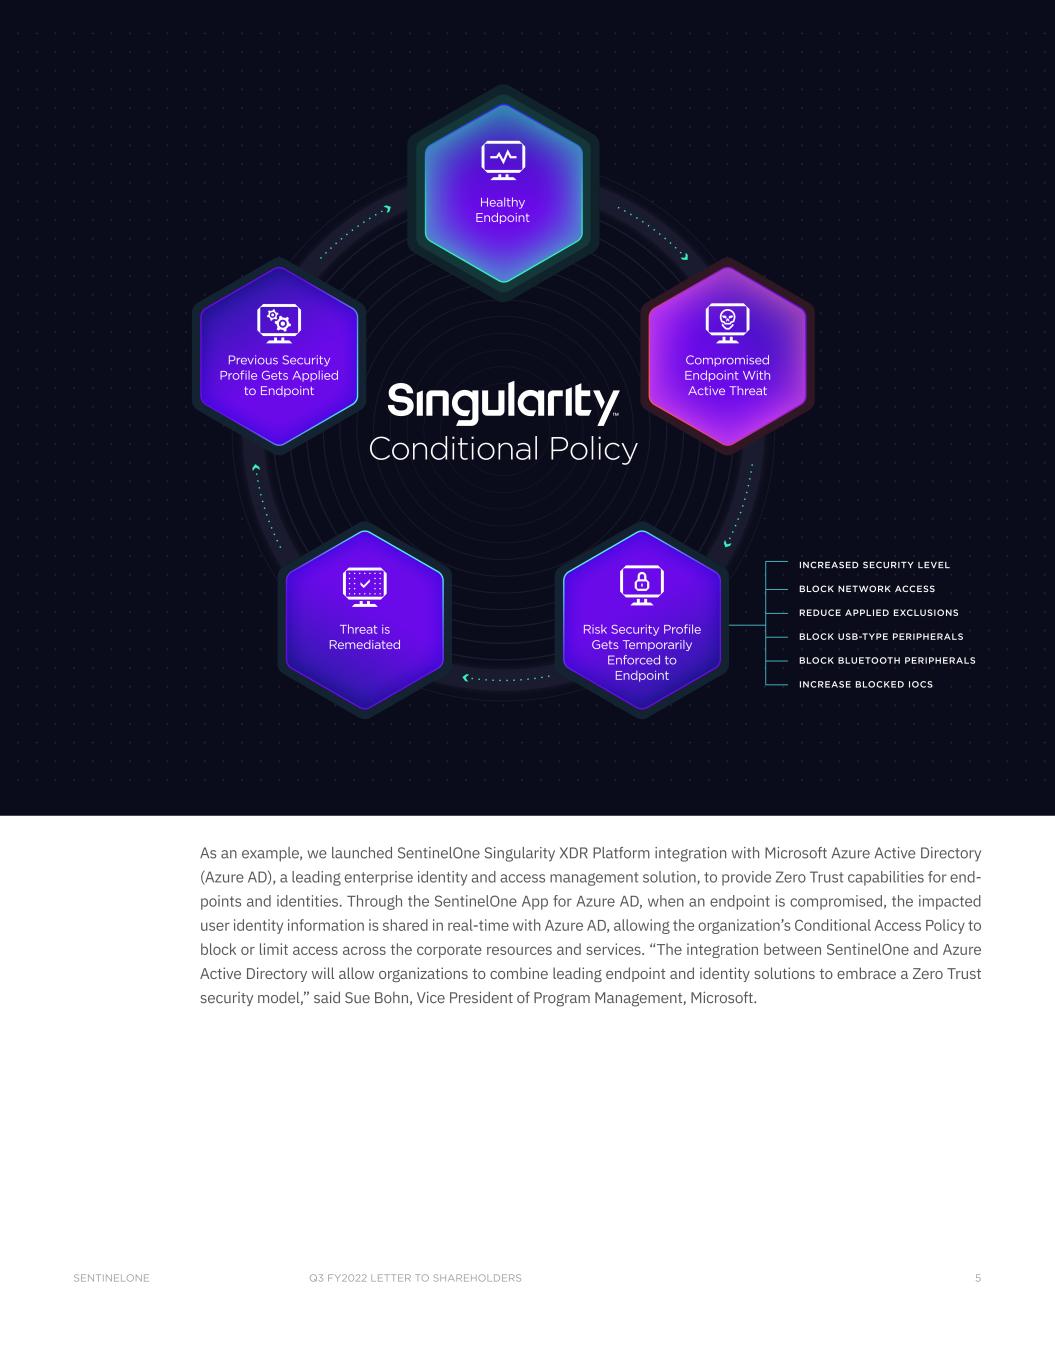
Q3 FY2022 LETTER TO SHAREHOLDERSSENTINELONE 5 As an example, we launched SentinelOne Singularity XDR Platform integration with Microsoft Azure Active Directory (Azure AD), a leading enterprise identity and access management solution, to provide Zero Trust capabilities for end- points and identities. Through the SentinelOne App for Azure AD, when an endpoint is compromised, the impacted user identity information is shared in real-time with Azure AD, allowing the organization’s Conditional Access Policy to block or limit access across the corporate resources and services. “The integration between SentinelOne and Azure Active Directory will allow organizations to combine leading endpoint and identity solutions to embrace a Zero Trust security model,” said Sue Bohn, Vice President of Program Management, Microsoft. Healthy Endpoint Compromised Endpoint With Active Threat Risk Security Profile Gets Temporarily Enforced to Endpoint Threat is Remediated Previous Security Profile Gets Applied to Endpoint Conditional Policy INCREASE BLOCKED IOCS BLOCK BLUETOOTH PERIPHERALS BLOCK USB-TYPE PERIPHERALS REDUCE APPLIED EXCLUSIONS BLOCK NETWORK ACCESS INCREASED SECURITY LEVEL
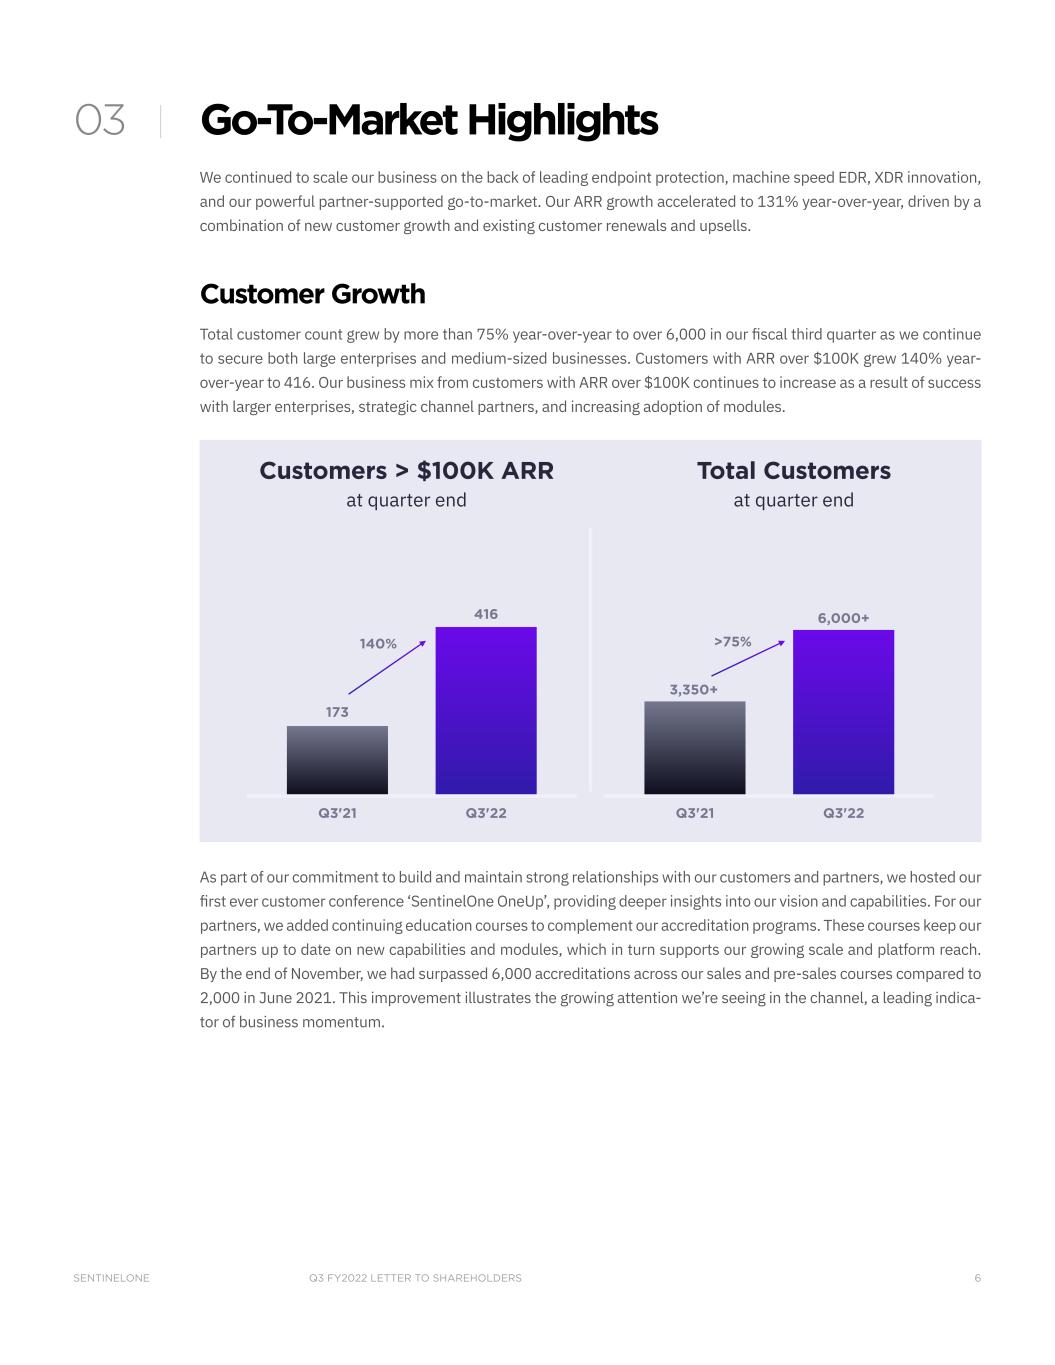
Q3 FY2022 LETTER TO SHAREHOLDERSSENTINELONE 6 Go-To-Market Highlights We continued to scale our business on the back of leading endpoint protection, machine speed EDR, XDR innovation, and our powerful partner-supported go-to-market. Our ARR growth accelerated to 131% year-over-year, driven by a combination of new customer growth and existing customer renewals and upsells. Customer Growth Total customer count grew by more than 75% year-over-year to over 6,000 in our fiscal third quarter as we continue to secure both large enterprises and medium-sized businesses. Customers with ARR over $100K grew 140% year- over-year to 416. Our business mix from customers with ARR over $100K continues to increase as a result of success with larger enterprises, strategic channel partners, and increasing adoption of modules. 173 416 Q3'21 Q3'22 140% 3,350+ 6,000+ Q3'21 Q3'22 >75% Customers > $100K ARR at quarter end Total Customers at quarter end As part of our commitment to build and maintain strong relationships with our customers and partners, we hosted our first ever customer conference ‘SentinelOne OneUp’, providing deeper insights into our vision and capabilities. For our partners, we added continuing education courses to complement our accreditation programs. These courses keep our partners up to date on new capabilities and modules, which in turn supports our growing scale and platform reach. By the end of November, we had surpassed 6,000 accreditations across our sales and pre-sales courses compared to 2,000 in June 2021. This improvement illustrates the growing attention we’re seeing in the channel, a leading indica- tor of business momentum. 03
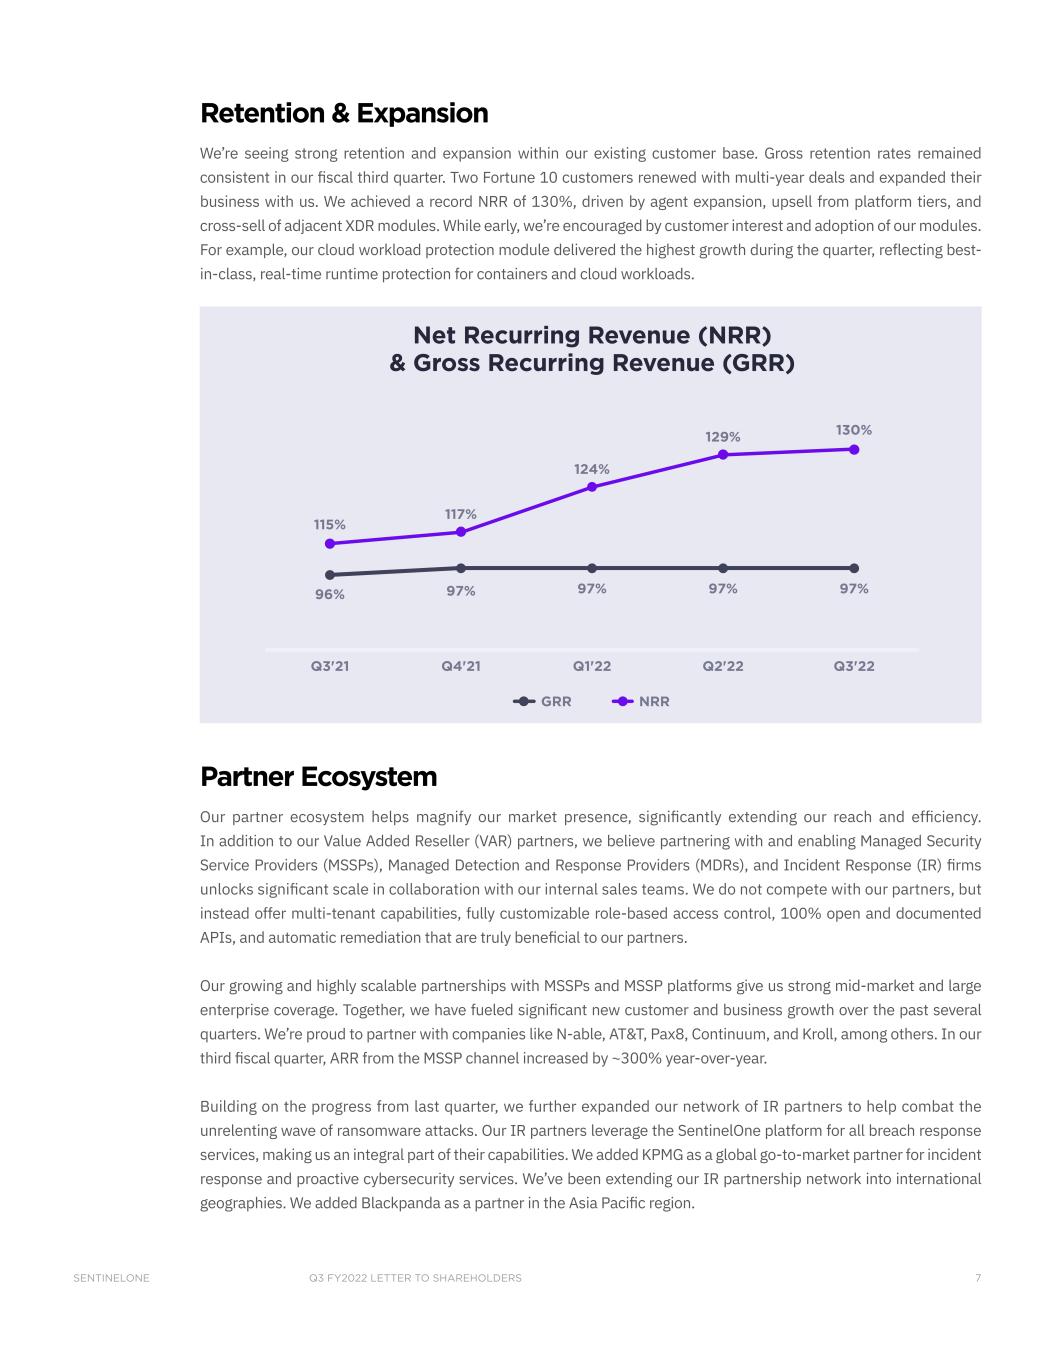
Q3 FY2022 LETTER TO SHAREHOLDERSSENTINELONE 7 Retention & Expansion We’re seeing strong retention and expansion within our existing customer base. Gross retention rates remained consistent in our fiscal third quarter. Two Fortune 10 customers renewed with multi-year deals and expanded their business with us. We achieved a record NRR of 130%, driven by agent expansion, upsell from platform tiers, and cross-sell of adjacent XDR modules. While early, we’re encouraged by customer interest and adoption of our modules. For example, our cloud workload protection module delivered the highest growth during the quarter, reflecting best- in-class, real-time runtime protection for containers and cloud workloads. Q3'21 Q4'21 Q1'22 Q2'22 Q3'22 115% 117% 124% 129% 130% 96% 97% 97% 97% 97% GRR NRR Net Recurring Revenue (NRR) & Gross Recurring Revenue (GRR) Partner Ecosystem Our partner ecosystem helps magnify our market presence, significantly extending our reach and efficiency. In addition to our Value Added Reseller (VAR) partners, we believe partnering with and enabling Managed Security Service Providers (MSSPs), Managed Detection and Response Providers (MDRs), and Incident Response (IR) firms unlocks significant scale in collaboration with our internal sales teams. We do not compete with our partners, but instead offer multi-tenant capabilities, fully customizable role-based access control, 100% open and documented APIs, and automatic remediation that are truly beneficial to our partners. Our growing and highly scalable partnerships with MSSPs and MSSP platforms give us strong mid-market and large enterprise coverage. Together, we have fueled significant new customer and business growth over the past several quarters. We’re proud to partner with companies like N-able, AT&T, Pax8, Continuum, and Kroll, among others. In our third fiscal quarter, ARR from the MSSP channel increased by ~300% year-over-year. Building on the progress from last quarter, we further expanded our network of IR partners to help combat the unrelenting wave of ransomware attacks. Our IR partners leverage the SentinelOne platform for all breach response services, making us an integral part of their capabilities. We added KPMG as a global go-to-market partner for incident response and proactive cybersecurity services. We’ve been extending our IR partnership network into international geographies. We added Blackpanda as a partner in the Asia Pacific region.
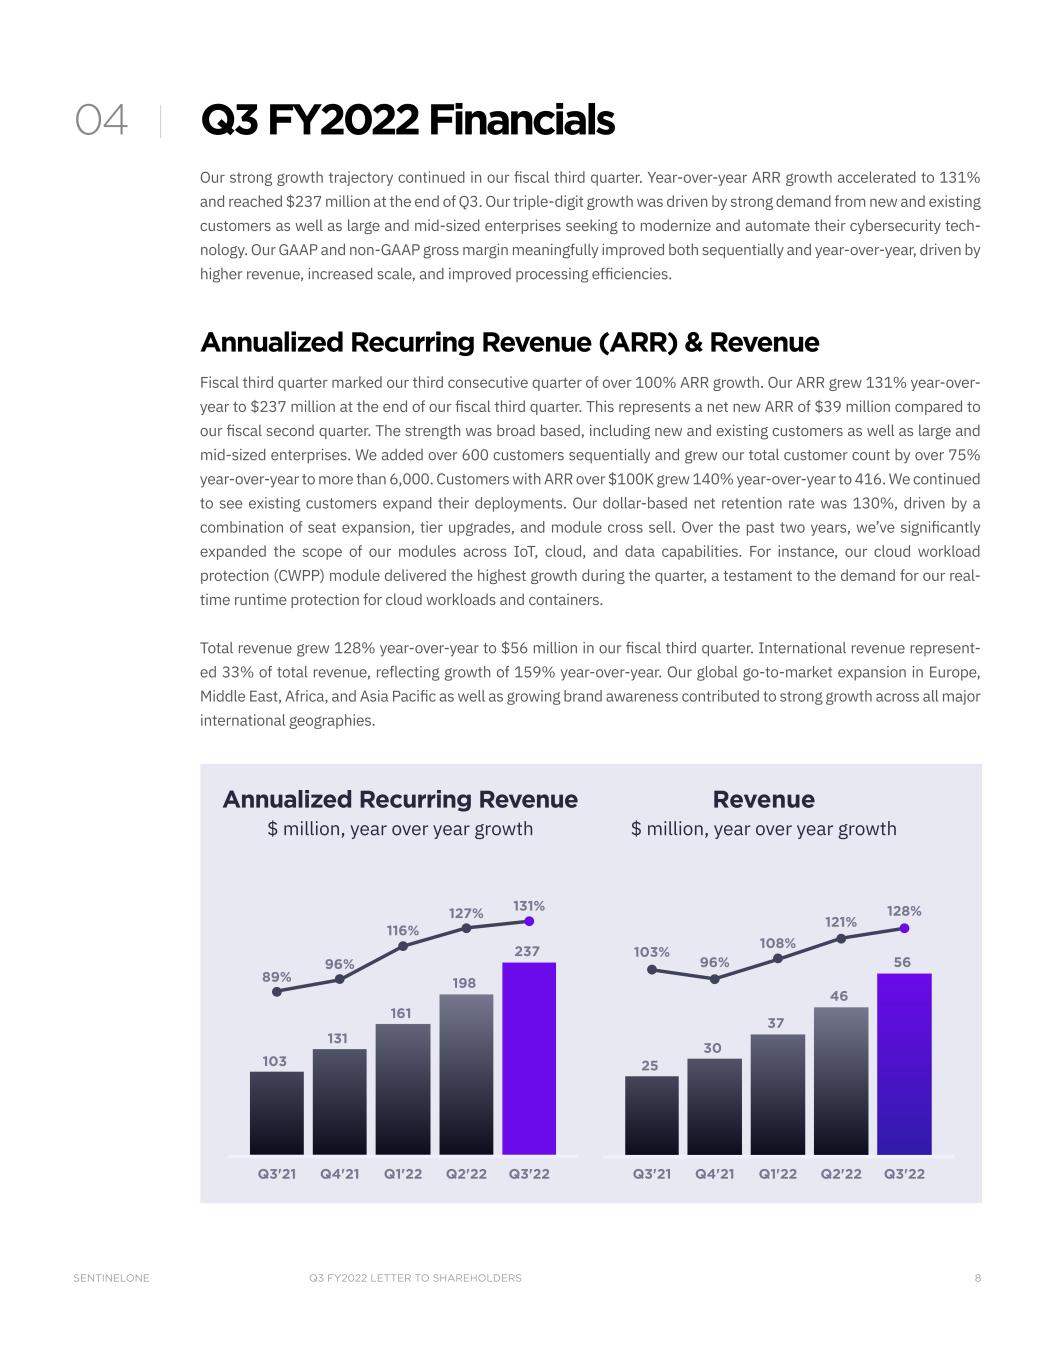
Q3 FY2022 LETTER TO SHAREHOLDERSSENTINELONE 8 Q3 FY2022 Financials Our strong growth trajectory continued in our fiscal third quarter. Year-over-year ARR growth accelerated to 131% and reached $237 million at the end of Q3. Our triple-digit growth was driven by strong demand from new and existing customers as well as large and mid-sized enterprises seeking to modernize and automate their cybersecurity tech- nology. Our GAAP and non-GAAP gross margin meaningfully improved both sequentially and year-over-year, driven by higher revenue, increased scale, and improved processing efficiencies. Annualized Recurring Revenue (ARR) & Revenue Fiscal third quarter marked our third consecutive quarter of over 100% ARR growth. Our ARR grew 131% year-over- year to $237 million at the end of our fiscal third quarter. This represents a net new ARR of $39 million compared to our fiscal second quarter. The strength was broad based, including new and existing customers as well as large and mid-sized enterprises. We added over 600 customers sequentially and grew our total customer count by over 75% year-over-year to more than 6,000. Customers with ARR over $100K grew 140% year-over-year to 416. We continued to see existing customers expand their deployments. Our dollar-based net retention rate was 130%, driven by a combination of seat expansion, tier upgrades, and module cross sell. Over the past two years, we’ve significantly expanded the scope of our modules across IoT, cloud, and data capabilities. For instance, our cloud workload protection (CWPP) module delivered the highest growth during the quarter, a testament to the demand for our real- time runtime protection for cloud workloads and containers. Total revenue grew 128% year-over-year to $56 million in our fiscal third quarter. International revenue represent- ed 33% of total revenue, reflecting growth of 159% year-over-year. Our global go-to-market expansion in Europe, Middle East, Africa, and Asia Pacific as well as growing brand awareness contributed to strong growth across all major international geographies. 87 103 103 131 161 198 237 89% 96% 116% 127% 131% 25 30 37 46 56 103% 96% 108% 121% 128% Q3'21 Q4'21 Q1'22 Q2'22 Q3'22 Q3'21 Q4'21 Q1'22 Q2'22 Q3'22 Annualized Recurring Revenue $ million, year over year growth Revenue $ million, year over year growth 04
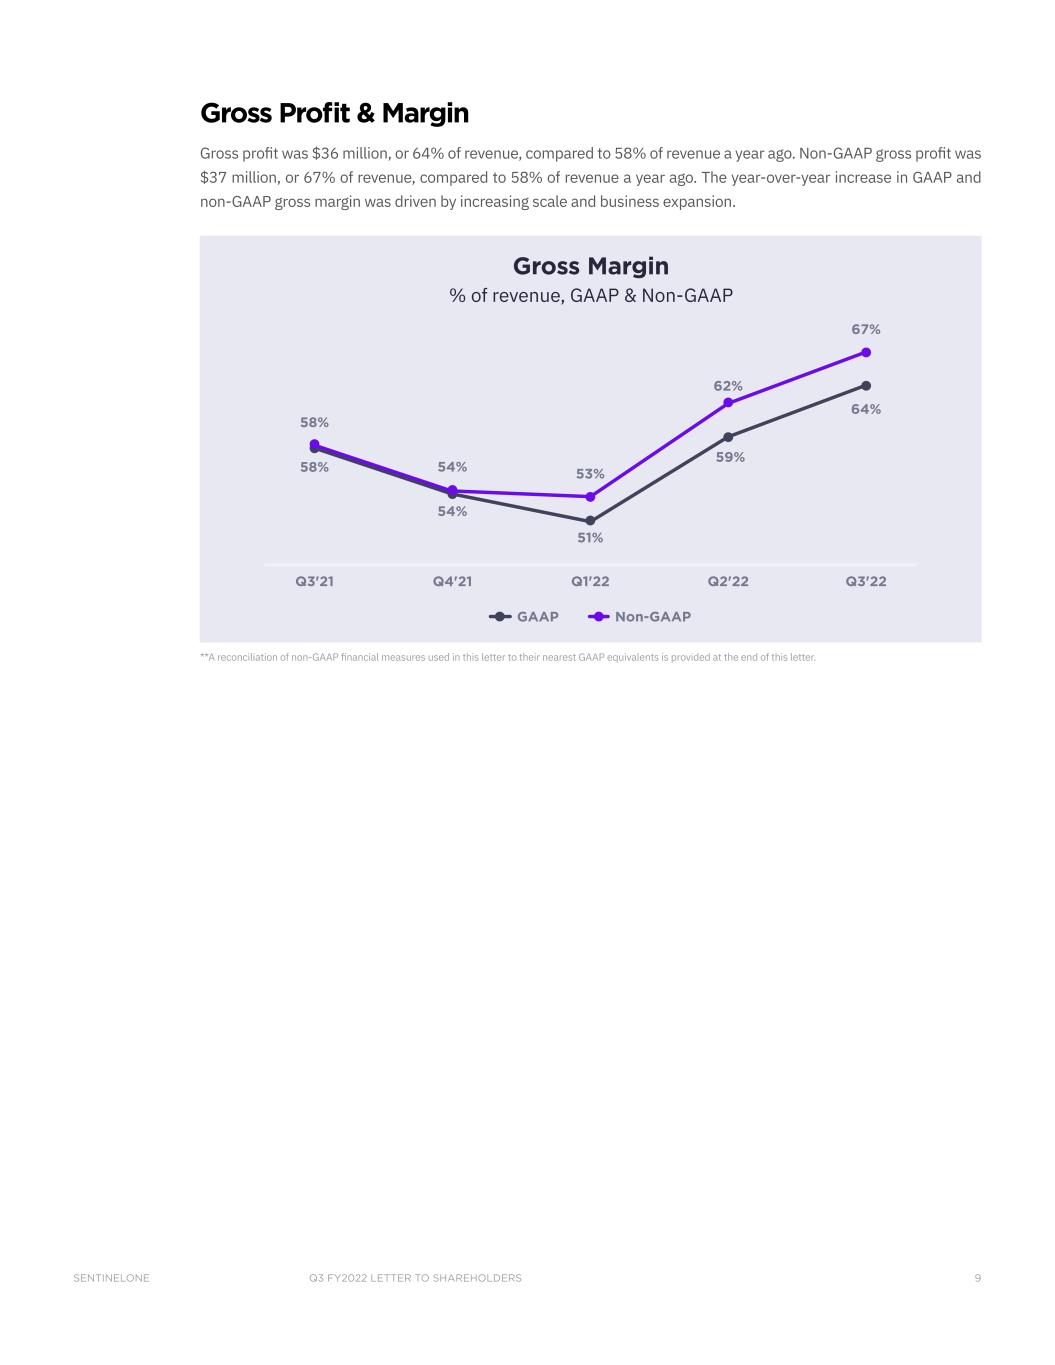
Q3 FY2022 LETTER TO SHAREHOLDERSSENTINELONE 9 Gross Profit & Margin Gross profit was $36 million, or 64% of revenue, compared to 58% of revenue a year ago. Non-GAAP gross profit was $37 million, or 67% of revenue, compared to 58% of revenue a year ago. The year-over-year increase in GAAP and non-GAAP gross margin was driven by increasing scale and business expansion. Q3'21 Q4'21 Q1'22 Q2'22 Q3'22 GAAP Non-GAAP 58% 54% 51% 59% 64% 58% 54% 53% 62% 67% Gross Margin % of revenue, GAAP & Non-GAAP **A reconciliation of non-GAAP financial measures used in this letter to their nearest GAAP equivalents is provided at the end of this letter.
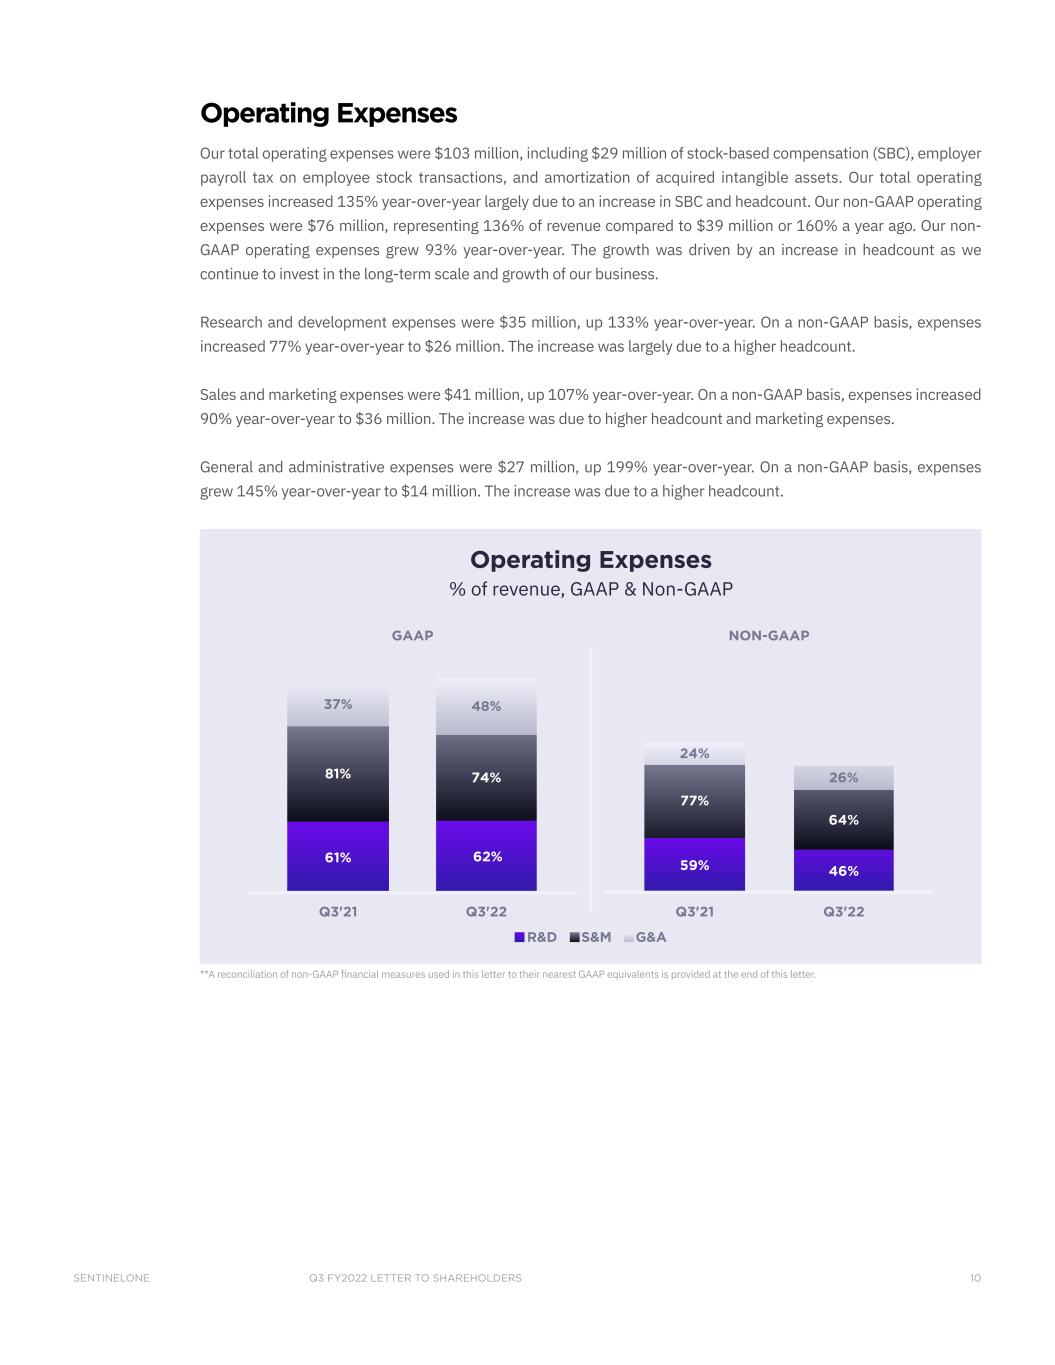
Q3 FY2022 LETTER TO SHAREHOLDERSSENTINELONE 10 Operating Expenses Our total operating expenses were $103 million, including $29 million of stock-based compensation (SBC), employer payroll tax on employee stock transactions, and amortization of acquired intangible assets. Our total operating expenses increased 135% year-over-year largely due to an increase in SBC and headcount. Our non-GAAP operating expenses were $76 million, representing 136% of revenue compared to $39 million or 160% a year ago. Our non- GAAP operating expenses grew 93% year-over-year. The growth was driven by an increase in headcount as we continue to invest in the long-term scale and growth of our business. Research and development expenses were $35 million, up 133% year-over-year. On a non-GAAP basis, expenses increased 77% year-over-year to $26 million. The increase was largely due to a higher headcount. Sales and marketing expenses were $41 million, up 107% year-over-year. On a non-GAAP basis, expenses increased 90% year-over-year to $36 million. The increase was due to higher headcount and marketing expenses. General and administrative expenses were $27 million, up 199% year-over-year. On a non-GAAP basis, expenses grew 145% year-over-year to $14 million. The increase was due to a higher headcount. GAAP NON-GAAP R&D S&M G&A Q3'21 Q3'22 59% 46% 77% 64% 24% 26% Q3'21 Q3'22 61% 62% 81% 74% 37% 48% Operating Expenses % of revenue, GAAP & Non-GAAP **A reconciliation of non-GAAP financial measures used in this letter to their nearest GAAP equivalents is provided at the end of this letter.
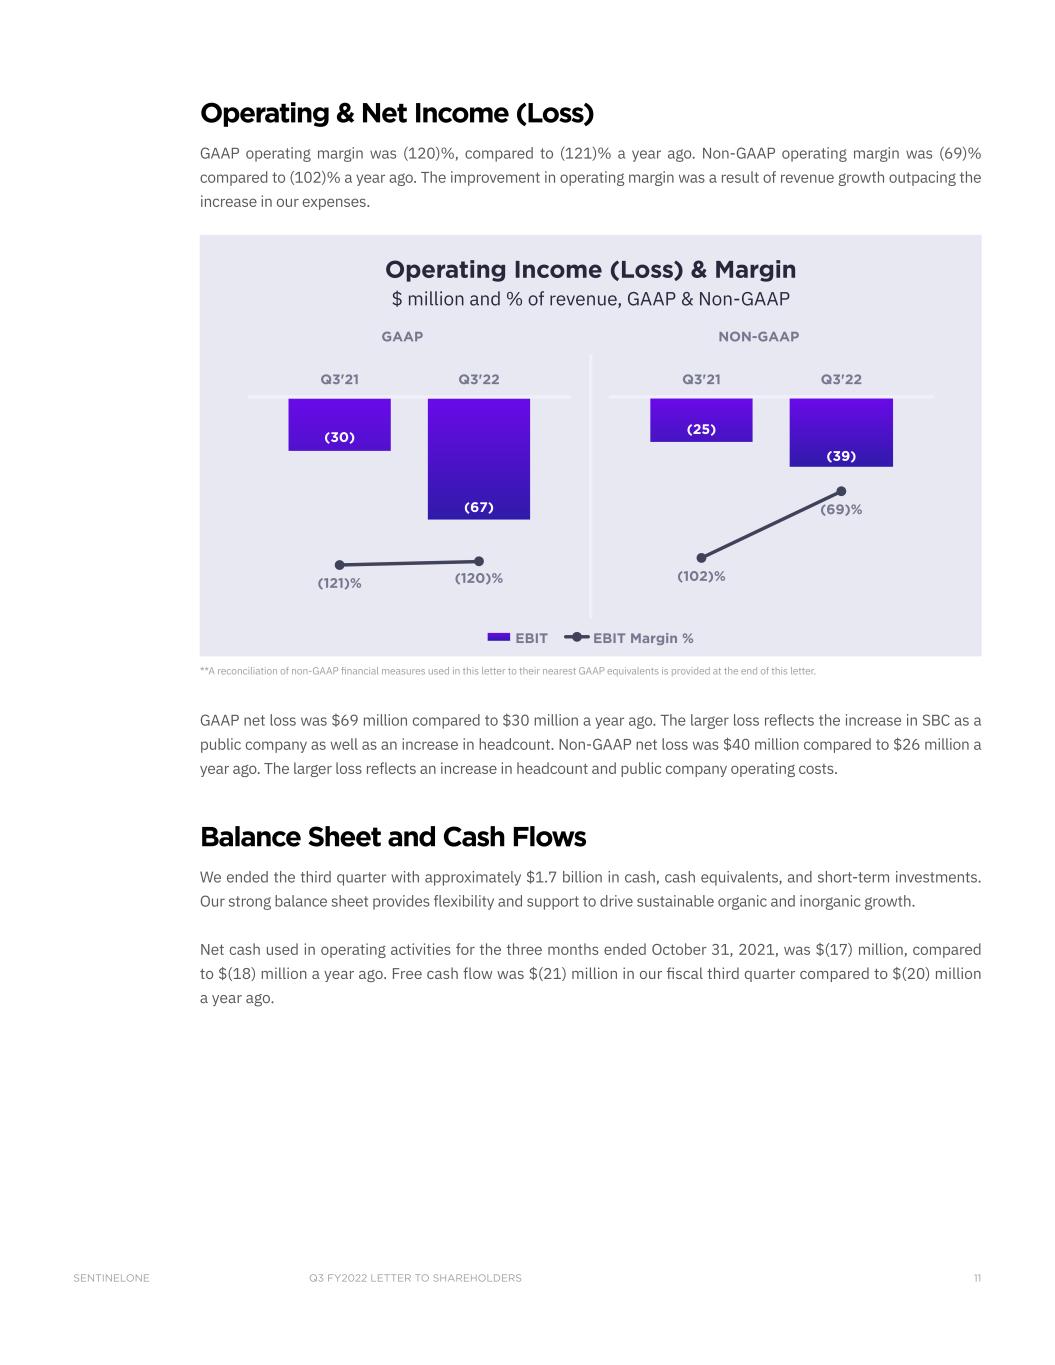
Q3 FY2022 LETTER TO SHAREHOLDERSSENTINELONE 11 Operating & Net Income (Loss) GAAP operating margin was (120)%, compared to (121)% a year ago. Non-GAAP operating margin was (69)% compared to (102)% a year ago. The improvement in operating margin was a result of revenue growth outpacing the increase in our expenses. (30) (67) Q3'21 Q3'22 EBIT EBIT Margin % (25) (39) Q3'21 Q3'22 GAAP NON-GAAP (102)% (69)% (121)% (120)% Operating Income (Loss) & Margin $ million and % of revenue, GAAP & Non-GAAP **A reconciliation of non-GAAP financial measures used in this letter to their nearest GAAP equivalents is provided at the end of this letter. GAAP net loss was $69 million compared to $30 million a year ago. The larger loss reflects the increase in SBC as a public company as well as an increase in headcount. Non-GAAP net loss was $40 million compared to $26 million a year ago. The larger loss reflects an increase in headcount and public company operating costs. Balance Sheet and Cash Flows We ended the third quarter with approximately $1.7 billion in cash, cash equivalents, and short-term investments. Our strong balance sheet provides flexibility and support to drive sustainable organic and inorganic growth. Net cash used in operating activities for the three months ended October 31, 2021, was $(17) million, compared to $(18) million a year ago. Free cash flow was $(21) million in our fiscal third quarter compared to $(20) million a year ago.
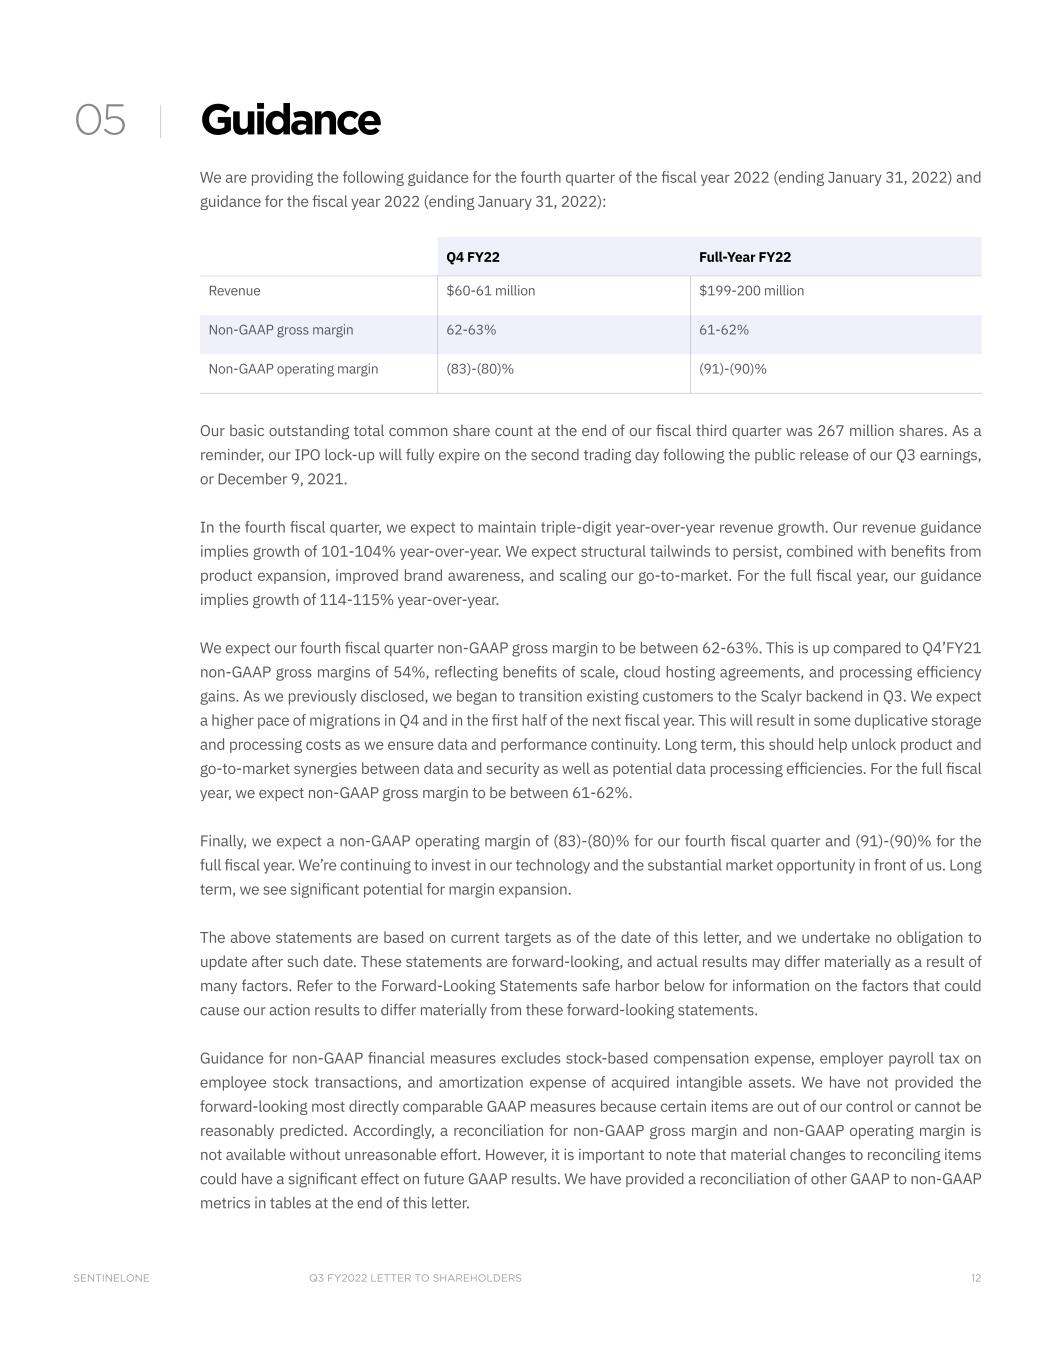
Q3 FY2022 LETTER TO SHAREHOLDERSSENTINELONE 12 Guidance We are providing the following guidance for the fourth quarter of the fiscal year 2022 (ending January 31, 2022) and guidance for the fiscal year 2022 (ending January 31, 2022): Q4 FY22 Full-Year FY22 Revenue $60-61 million $199-200 million Non-GAAP gross margin 62-63% 61-62% Non-GAAP operating margin (83)-(80)% (91)-(90)% Our basic outstanding total common share count at the end of our fiscal third quarter was 267 million shares. As a reminder, our IPO lock-up will fully expire on the second trading day following the public release of our Q3 earnings, or December 9, 2021. In the fourth fiscal quarter, we expect to maintain triple-digit year-over-year revenue growth. Our revenue guidance implies growth of 101-104% year-over-year. We expect structural tailwinds to persist, combined with benefits from product expansion, improved brand awareness, and scaling our go-to-market. For the full fiscal year, our guidance implies growth of 114-115% year-over-year. We expect our fourth fiscal quarter non-GAAP gross margin to be between 62-63%. This is up compared to Q4’FY21 non-GAAP gross margins of 54%, reflecting benefits of scale, cloud hosting agreements, and processing efficiency gains. As we previously disclosed, we began to transition existing customers to the Scalyr backend in Q3. We expect a higher pace of migrations in Q4 and in the first half of the next fiscal year. This will result in some duplicative storage and processing costs as we ensure data and performance continuity. Long term, this should help unlock product and go-to-market synergies between data and security as well as potential data processing efficiencies. For the full fiscal year, we expect non-GAAP gross margin to be between 61-62%. Finally, we expect a non-GAAP operating margin of (83)-(80)% for our fourth fiscal quarter and (91)-(90)% for the full fiscal year. We’re continuing to invest in our technology and the substantial market opportunity in front of us. Long term, we see significant potential for margin expansion. The above statements are based on current targets as of the date of this letter, and we undertake no obligation to update after such date. These statements are forward-looking, and actual results may differ materially as a result of many factors. Refer to the Forward-Looking Statements safe harbor below for information on the factors that could cause our action results to differ materially from these forward-looking statements. Guidance for non-GAAP financial measures excludes stock-based compensation expense, employer payroll tax on employee stock transactions, and amortization expense of acquired intangible assets. We have not provided the forward-looking most directly comparable GAAP measures because certain items are out of our control or cannot be reasonably predicted. Accordingly, a reconciliation for non-GAAP gross margin and non-GAAP operating margin is not available without unreasonable effort. However, it is important to note that material changes to reconciling items could have a significant effect on future GAAP results. We have provided a reconciliation of other GAAP to non-GAAP metrics in tables at the end of this letter. 05
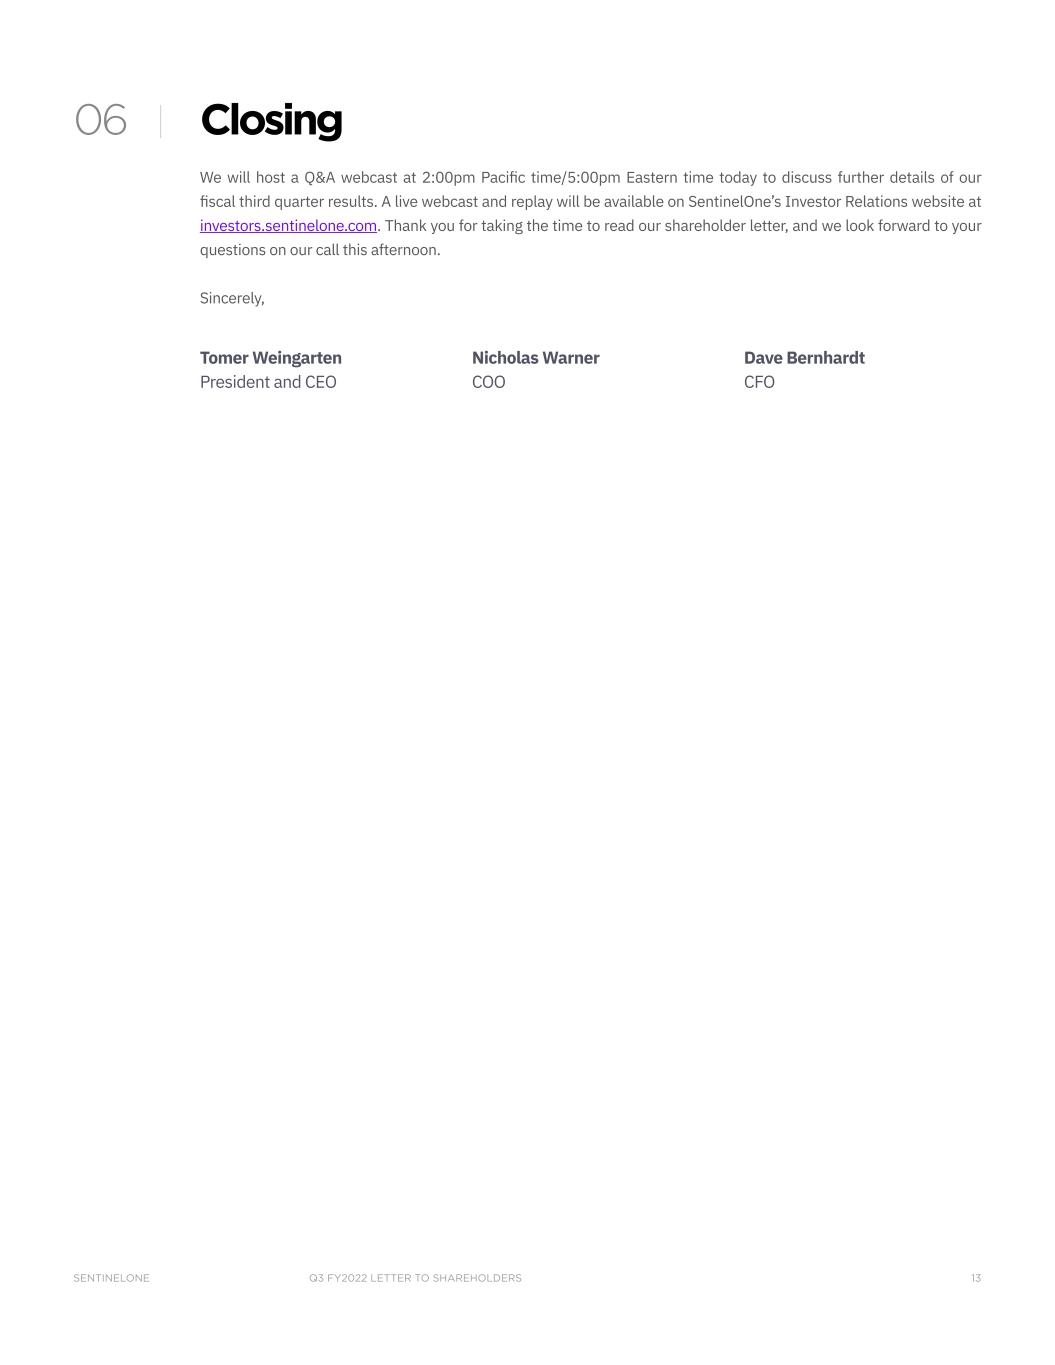
Q3 FY2022 LETTER TO SHAREHOLDERSSENTINELONE 13 Closing We will host a Q&A webcast at 2:00pm Pacific time/5:00pm Eastern time today to discuss further details of our fiscal third quarter results. A live webcast and replay will be available on SentinelOne’s Investor Relations website at investors.sentinelone.com. Thank you for taking the time to read our shareholder letter, and we look forward to your questions on our call this afternoon. Sincerely, Tomer Weingarten President and CEO Nicholas Warner COO Dave Bernhardt CFO 06
Q3 FY2022 LETTER TO SHAREHOLDERSSENTINELONE 14 Forward-Looking Statements This letter and the live webcast which will be held at 2:00 pm, EST on December 7, 2021, contain “forward-look- ing statements” within the meaning of Section 27A of the Securities Act of 1933, as amended, and Section 21E of the Securities Exchange Act of 1934, as amended, which statements involve risks and uncertainties, including statements regarding our future growth, and future financial and operating performance, including our financial outlook for the fourth quarter of fiscal 2022 and full-year fiscal 2022, including non-GAAP gross profit and non-GAAP operating margin, business strategy, acquisitions, and strategic investments, the COVID-19 pandemic, our reputation and performance in the market, general market trends, and our objectives are forward-looking statements. These forward-looking statements are made as of the date they were first issued and were based on current expectations, estimates, forecasts, and projections as well as the beliefs and assumptions of management. The words “believe,” “may,” “will,” “potentially,” “estimate,” “continue,” “anticipate,” “intend,” “could,” “would,” “project,” “target,” “plan,” “expect,” or the negative of these terms and similar expressions are intended to identify forward-looking statements. However, not all forward-looking statements contain these identifying words. There are a significant number of factors that could cause our actual results to differ materially from statements made in this letter and live webcast, including: our limited operating history; our history of losses; intense competition in the market we compete in; fluctuations in our operating results; network or security incidents against us; our ability to successfully integrate any acquisitions and strategic investments; defects, errors or vulnerabilities in our platform; risks associated with managing our rapid growth; the continuing impact of the COVID-19 pandemic on our and our customers’ business; our ability to attract new and retain existing customers, or renew and expand our relationships with them; the ability of our platform to effectively interoperate within our customers IT; disruptions or other business interruptions that affect the availability of our platform; the failure to timely develop and achieve market acceptance of new products, and subscriptions as well as existing products, subscriptions and support offerings; rapidly evolving technological developments in the market for security products and subscription and support offerings; length of sales cycles; risks of securities class action litigation; general market, political, economic, and business conditions, including those related to the continuing impact of COVID-19. Additional risks and uncertainties that could affect our financial results are included under the captions “Risk Factors” and “Management’s Discussion and Analysis of Financial Condition and Results of Operations” set in our filings and reports with the SEC, including our final prospectus filed with the SEC pursuant to Rule 424(b), dated June 29, 2021, our Quarterly Report on Form 10-Q for our second fiscal quarter, dated September 10, 2021, our Quarterly Report on Form 10-Q that will be filed for our third fiscal quarter, and other filings and reports that we may file from time to time with the SEC, copies of which are available on our website at investors.sentinelone.com and on the SEC’s website at www.sec.gov. You should not rely on these forward-looking statements, as actual outcomes and results may differ materially from those contemplated by these forward-looking statements as a result of such risks and uncertainties. All forward-look- ing statements in this letter and the live webcast are based on information and estimates available to us at the time of this letter, and we do not assume any obligation to update the forward-looking statements provided to reflect events that occur or circumstances that exist after the date of this letter and live webcast or to reflect new information or the occurrence of unexpected events, except as required by law. We may not actually achieve the plans, intentions, or expectations disclosed in our forward-looking statements, and you should not place undue reliance on our for- ward-looking statements.
Q3 FY2022 LETTER TO SHAREHOLDERSSENTINELONE 15 Non-GAAP Financial Measures In addition to our results determined in accordance with GAAP, we believe the following non-GAAP measures are useful in evaluating our operating performance. We use the following non-GAAP financial information to evaluate our ongoing operations and for internal planning and forecasting purposes. Non-GAAP financial information excludes stock-based compensation expense, employer payroll tax expense related to employee stock transactions and amortization of acquired intangible assets. We believe that non-GAAP financial information, when taken collectively, with the financial information presented in accordance with GAAP, may be helpful to investors because it provides consistency and comparability with past financial performance. However, non-GAAP financial information is present- ed for supplemental informational purposes only, has limitations as an analytical tool, and should not be considered in isolation or as a substitute for financial information presented in accordance with GAAP. Other companies, including companies in our industry, may calculate similarly titled non-GAAP measures differently or may use other measures to evaluate their performance, all of which could reduce the usefulness of our non-GAAP financial measures as tools for comparison. In addition, the utility of free cash flow as a measure of our liquidity is limited as it does not represent the total increase or decrease in our cash balance for a given period. Reconciliations between non-GAAP financial measures to the most directly comparable financial measure stated in accordance with GAAP are contained at the end of this press release following the accompanying financial data. Investors are encouraged to review the related GAAP financial measures and the reconciliation of these non-GAAP financial measures to their most directly comparable GAAP financial measures and not rely on any single financial measure to evaluate our business. Non-GAAP Gross Profit and Non-GAAP Gross Margin We define non-GAAP gross profit and non-GAAP gross margin as GAAP gross profit and GAAP gross margin, respec- tively, excluding expenses related to stock-based compensation expense, employer payroll tax on employee stock transactions, and amortization of acquired intangible assets. We believe non-GAAP gross profit and non-GAAP gross margin provide our management and investors consistency and comparability with our past financial performance and facilitate period-to-period comparisons of operations, as these measures eliminate the effects of certain varia- bles unrelated to our overall operating performance. Non-GAAP Loss from Operations and Non-GAAP Operating Margin We define non-GAAP loss from operations and non-GAAP operating margin as GAAP loss from operations and GAAP operating margin, respectively, excluding stock-based compensation expense, employer payroll tax on employee stock transactions, and amortization of acquired intangible assets. We believe non-GAAP loss from operations and non-GAAP operating margin provide our management and investors consistency and comparability with our past financial performance and facilitate period-to-period comparisons of operations, as these metrics generally eliminate the effects of certain variables unrelated to our overall operating performance. Non-GAAP Net Loss and Non-GAAP Net Loss per Share, Basic and Diluted We define non-GAAP net loss as GAAP net loss excluding stock-based compensation expense, employer payroll tax on employee stock transactions, and amortization of acquired intangible assets. We define non-GAAP net loss per share, basic and diluted, as non-GAAP net loss divided by the weighted-average common shares outstanding. Since we have reported net losses for all periods presented, we have excluded all potentially dilutive securities from the calculation of net loss per share as their effect is anti-dilutive and accordingly, basic and diluted net loss per share is
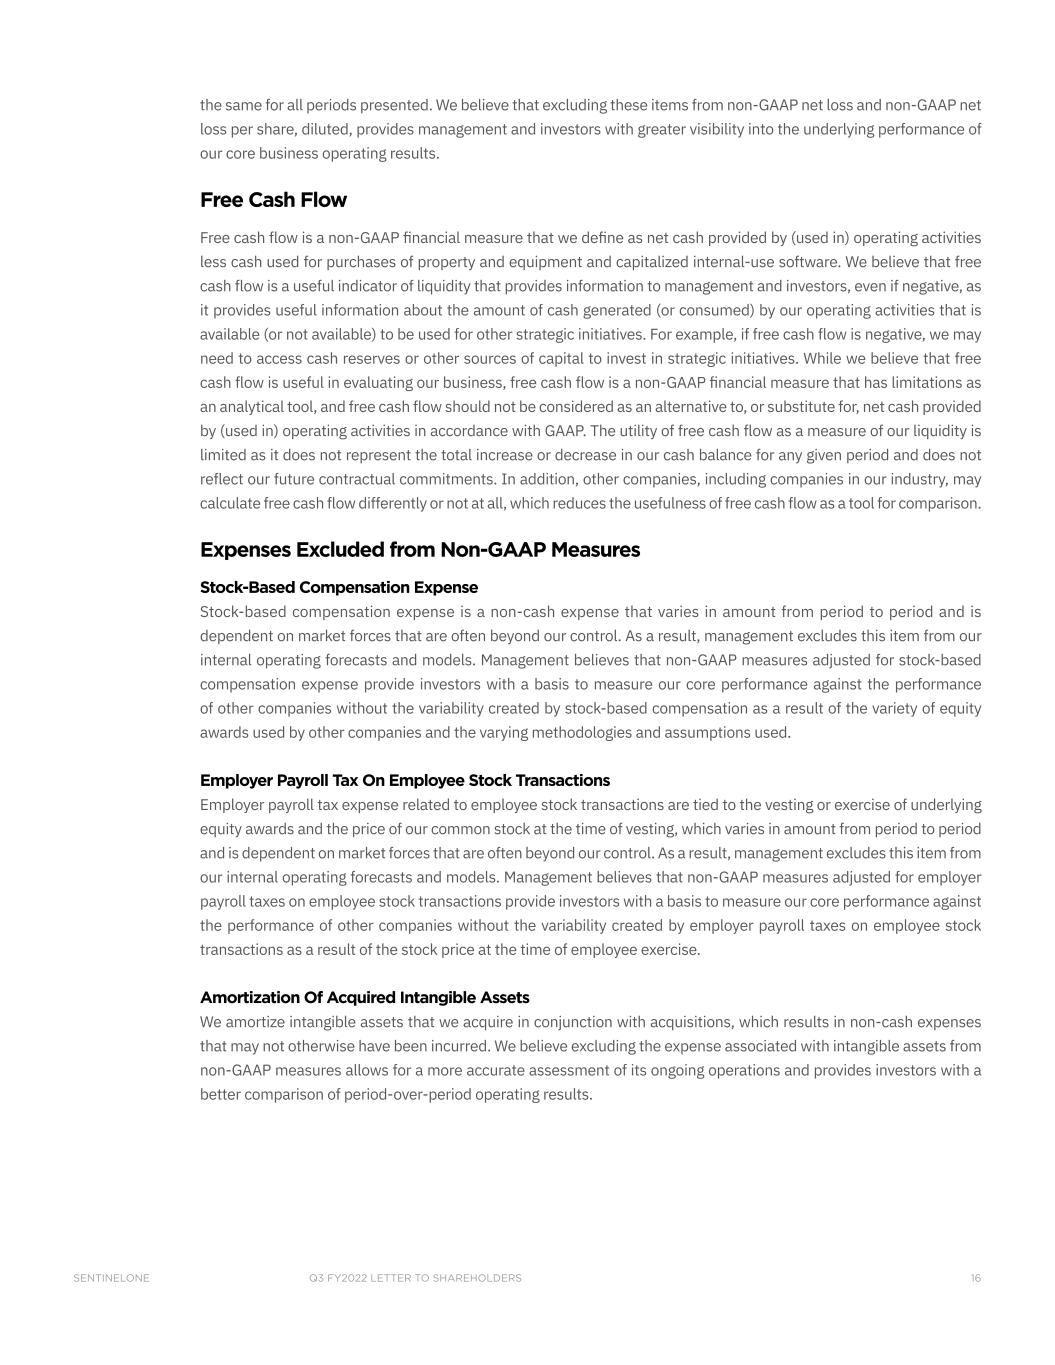
Q3 FY2022 LETTER TO SHAREHOLDERSSENTINELONE 16 the same for all periods presented. We believe that excluding these items from non-GAAP net loss and non-GAAP net loss per share, diluted, provides management and investors with greater visibility into the underlying performance of our core business operating results. Free Cash Flow Free cash flow is a non-GAAP financial measure that we define as net cash provided by (used in) operating activities less cash used for purchases of property and equipment and capitalized internal-use software. We believe that free cash flow is a useful indicator of liquidity that provides information to management and investors, even if negative, as it provides useful information about the amount of cash generated (or consumed) by our operating activities that is available (or not available) to be used for other strategic initiatives. For example, if free cash flow is negative, we may need to access cash reserves or other sources of capital to invest in strategic initiatives. While we believe that free cash flow is useful in evaluating our business, free cash flow is a non-GAAP financial measure that has limitations as an analytical tool, and free cash flow should not be considered as an alternative to, or substitute for, net cash provided by (used in) operating activities in accordance with GAAP. The utility of free cash flow as a measure of our liquidity is limited as it does not represent the total increase or decrease in our cash balance for any given period and does not reflect our future contractual commitments. In addition, other companies, including companies in our industry, may calculate free cash flow differently or not at all, which reduces the usefulness of free cash flow as a tool for comparison. Expenses Excluded from Non-GAAP Measures Stock-Based Compensation Expense Stock-based compensation expense is a non-cash expense that varies in amount from period to period and is dependent on market forces that are often beyond our control. As a result, management excludes this item from our internal operating forecasts and models. Management believes that non-GAAP measures adjusted for stock-based compensation expense provide investors with a basis to measure our core performance against the performance of other companies without the variability created by stock-based compensation as a result of the variety of equity awards used by other companies and the varying methodologies and assumptions used. Employer Payroll Tax On Employee Stock Transactions Employer payroll tax expense related to employee stock transactions are tied to the vesting or exercise of underlying equity awards and the price of our common stock at the time of vesting, which varies in amount from period to period and is dependent on market forces that are often beyond our control. As a result, management excludes this item from our internal operating forecasts and models. Management believes that non-GAAP measures adjusted for employer payroll taxes on employee stock transactions provide investors with a basis to measure our core performance against the performance of other companies without the variability created by employer payroll taxes on employee stock transactions as a result of the stock price at the time of employee exercise. Amortization Of Acquired Intangible Assets We amortize intangible assets that we acquire in conjunction with acquisitions, which results in non-cash expenses that may not otherwise have been incurred. We believe excluding the expense associated with intangible assets from non-GAAP measures allows for a more accurate assessment of its ongoing operations and provides investors with a better comparison of period-over-period operating results.
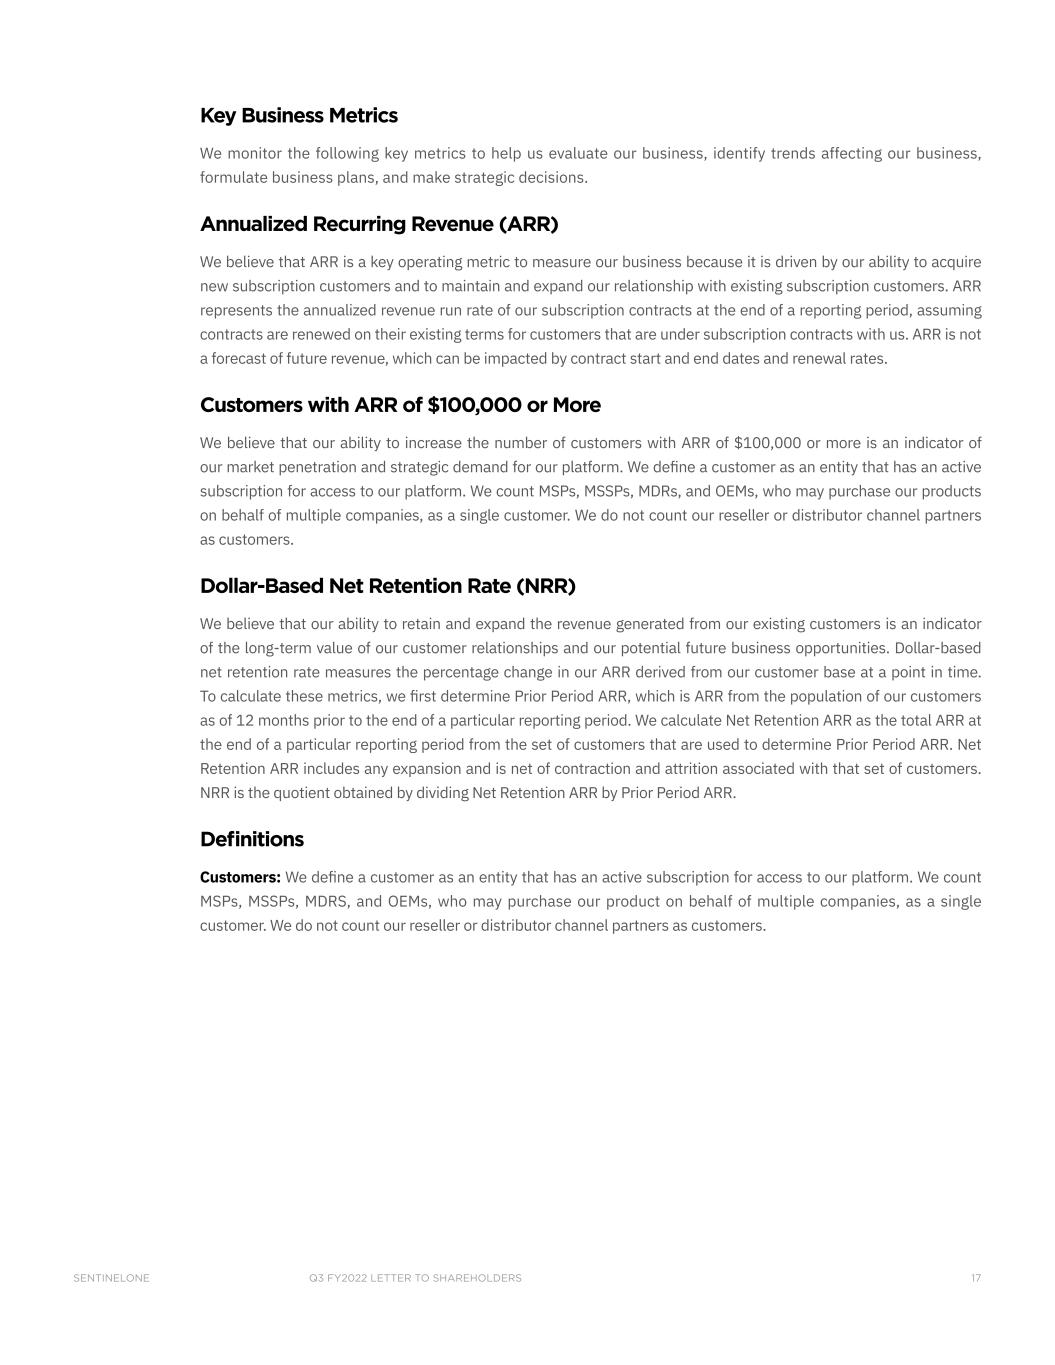
Q3 FY2022 LETTER TO SHAREHOLDERSSENTINELONE 17 Key Business Metrics We monitor the following key metrics to help us evaluate our business, identify trends affecting our business, formulate business plans, and make strategic decisions. Annualized Recurring Revenue (ARR) We believe that ARR is a key operating metric to measure our business because it is driven by our ability to acquire new subscription customers and to maintain and expand our relationship with existing subscription customers. ARR represents the annualized revenue run rate of our subscription contracts at the end of a reporting period, assuming contracts are renewed on their existing terms for customers that are under subscription contracts with us. ARR is not a forecast of future revenue, which can be impacted by contract start and end dates and renewal rates. Customers with ARR of $100,000 or More We believe that our ability to increase the number of customers with ARR of $100,000 or more is an indicator of our market penetration and strategic demand for our platform. We define a customer as an entity that has an active subscription for access to our platform. We count MSPs, MSSPs, MDRs, and OEMs, who may purchase our products on behalf of multiple companies, as a single customer. We do not count our reseller or distributor channel partners as customers. Dollar-Based Net Retention Rate (NRR) We believe that our ability to retain and expand the revenue generated from our existing customers is an indicator of the long-term value of our customer relationships and our potential future business opportunities. Dollar-based net retention rate measures the percentage change in our ARR derived from our customer base at a point in time. To calculate these metrics, we first determine Prior Period ARR, which is ARR from the population of our customers as of 12 months prior to the end of a particular reporting period. We calculate Net Retention ARR as the total ARR at the end of a particular reporting period from the set of customers that are used to determine Prior Period ARR. Net Retention ARR includes any expansion and is net of contraction and attrition associated with that set of customers. NRR is the quotient obtained by dividing Net Retention ARR by Prior Period ARR. Definitions Customers: We define a customer as an entity that has an active subscription for access to our platform. We count MSPs, MSSPs, MDRS, and OEMs, who may purchase our product on behalf of multiple companies, as a single customer. We do not count our reseller or distributor channel partners as customers.
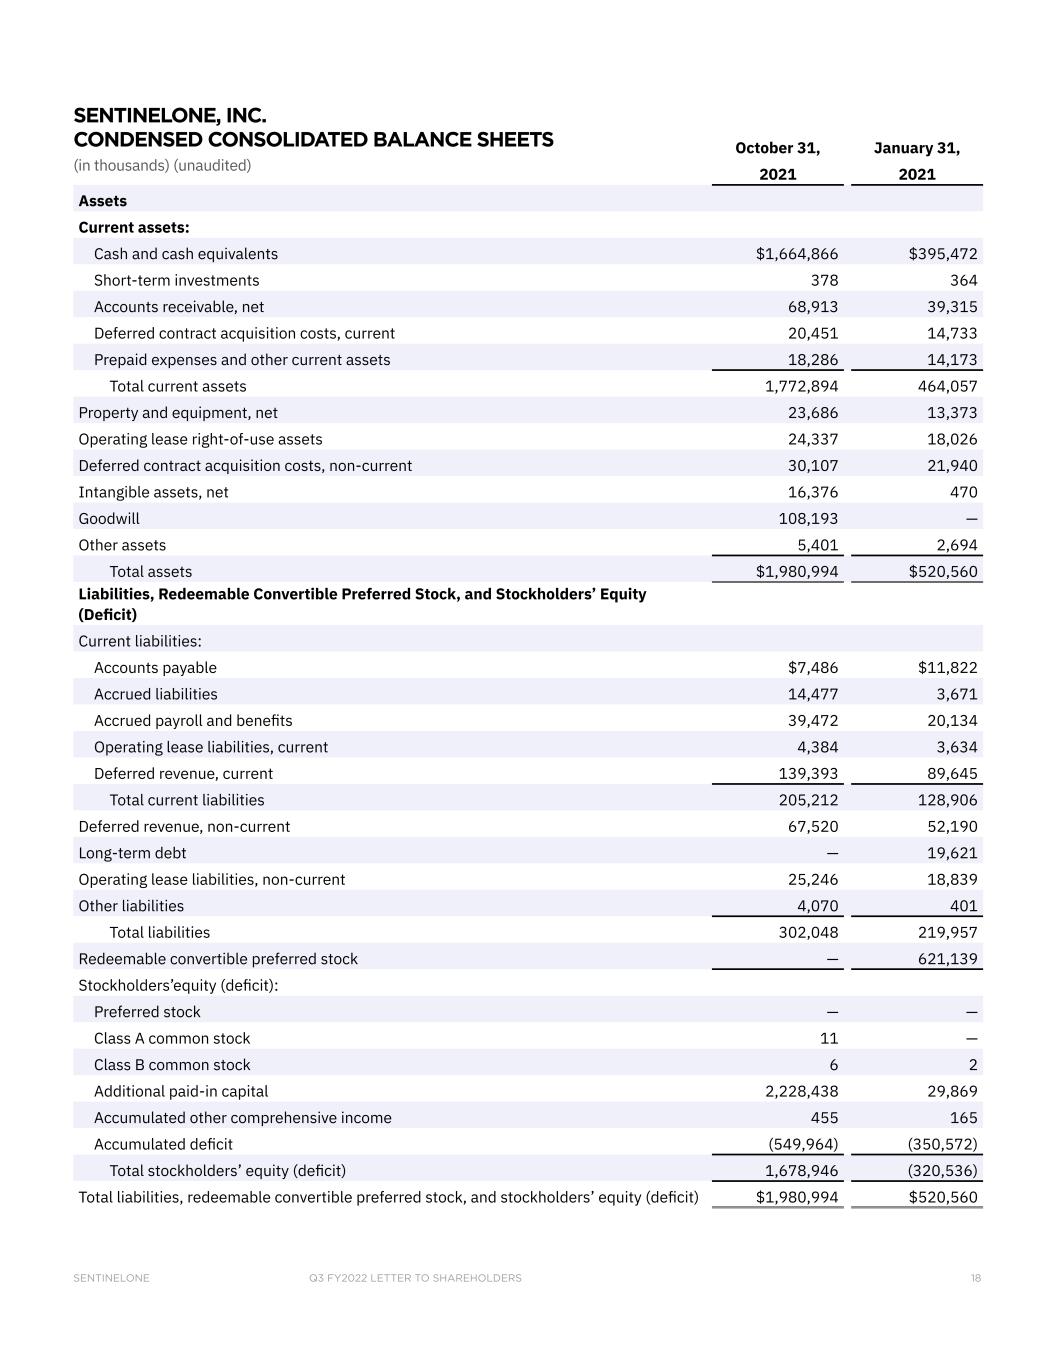
Q3 FY2022 LETTER TO SHAREHOLDERSSENTINELONE 18 October 31, January 31, 2021 2021 Assets Current assets: Cash and cash equivalents $1,664,866 $395,472 Short-term investments 378 364 Accounts receivable, net 68,913 39,315 Deferred contract acquisition costs, current 20,451 14,733 Prepaid expenses and other current assets 18,286 14,173 Total current assets 1,772,894 464,057 Property and equipment, net 23,686 13,373 Operating lease right-of-use assets 24,337 18,026 Deferred contract acquisition costs, non-current 30,107 21,940 Intangible assets, net 16,376 470 Goodwill 108,193 — Other assets 5,401 2,694 Total assets $1,980,994 $520,560 Liabilities, Redeemable Convertible Preferred Stock, and Stockholders’ Equity (Deficit) Current liabilities: Accounts payable $7,486 $11,822 Accrued liabilities 14,477 3,671 Accrued payroll and benefits 39,472 20,134 Operating lease liabilities, current 4,384 3,634 Deferred revenue, current 139,393 89,645 Total current liabilities 205,212 128,906 Deferred revenue, non-current 67,520 52,190 Long-term debt — 19,621 Operating lease liabilities, non-current 25,246 18,839 Other liabilities 4,070 401 Total liabilities 302,048 219,957 Redeemable convertible preferred stock — 621,139 Stockholders’equity (deficit): Preferred stock — — Class A common stock 11 — Class B common stock 6 2 Additional paid-in capital 2,228,438 29,869 Accumulated other comprehensive income 455 165 Accumulated deficit (549,964) (350,572) Total stockholders’ equity (deficit) 1,678,946 (320,536) Total liabilities, redeemable convertible preferred stock, and stockholders’ equity (deficit) $1,980,994 $520,560 SENTINELONE, INC. CONDENSED CONSOLIDATED BALANCE SHEETS (in thousands) (unaudited)
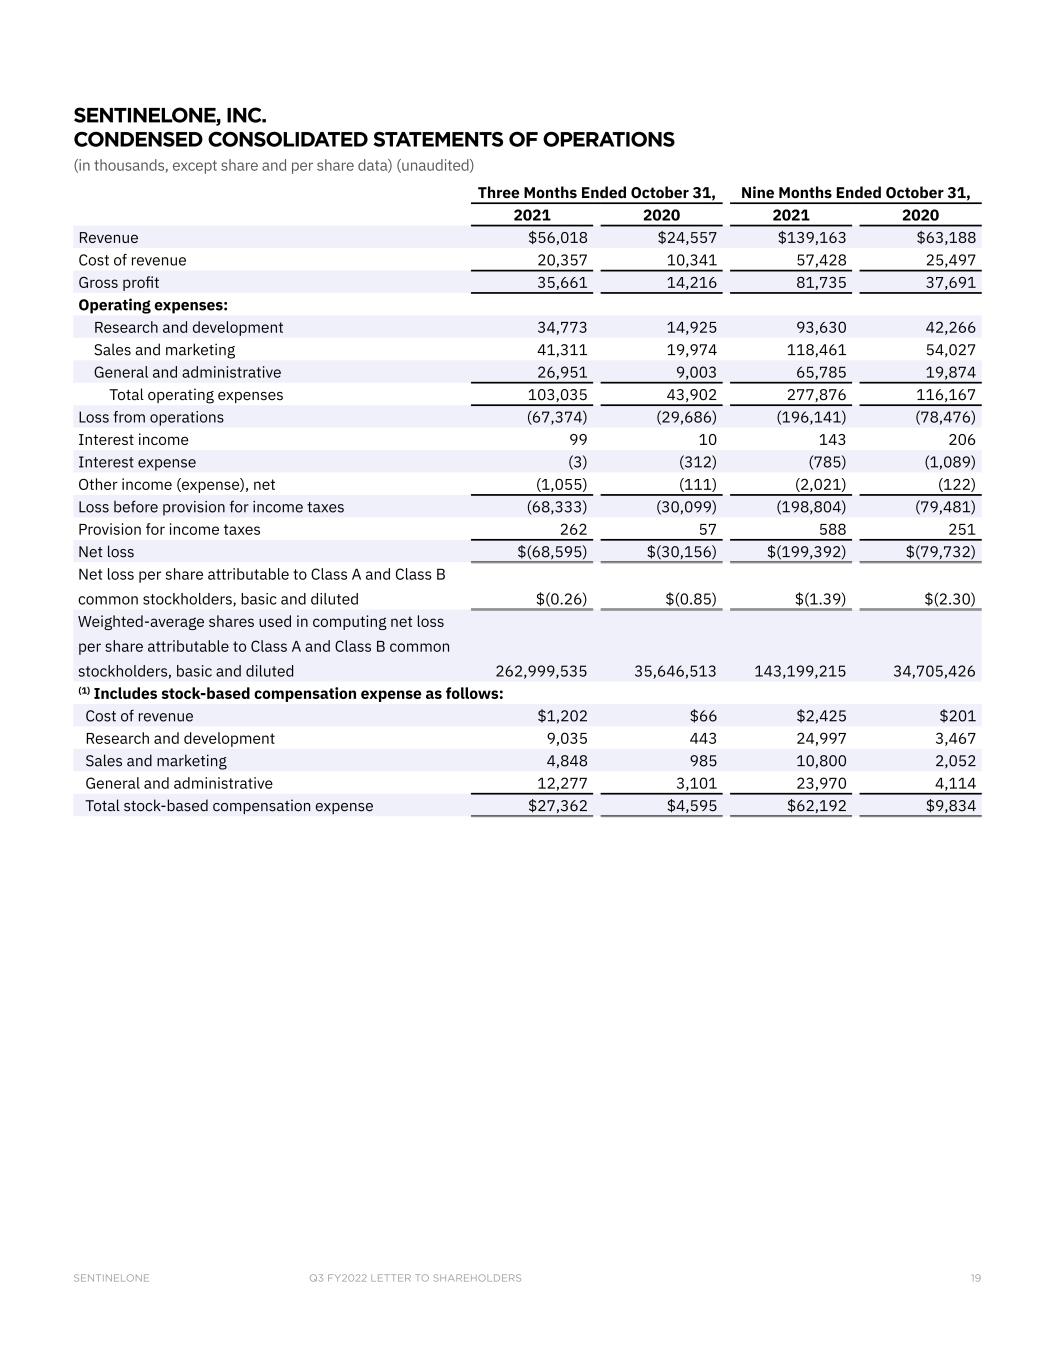
Q3 FY2022 LETTER TO SHAREHOLDERSSENTINELONE 19 Three Months Ended October 31, Nine Months Ended October 31, 2021 2020 2021 2020 Revenue $56,018 $24,557 $139,163 $63,188 Cost of revenue 20,357 10,341 57,428 25,497 Gross profit 35,661 14,216 81,735 37,691 Operating expenses: Research and development 34,773 14,925 93,630 42,266 Sales and marketing 41,311 19,974 118,461 54,027 General and administrative 26,951 9,003 65,785 19,874 Total operating expenses 103,035 43,902 277,876 116,167 Loss from operations (67,374) (29,686) (196,141) (78,476) Interest income 99 10 143 206 Interest expense (3) (312) (785) (1,089) Other income (expense), net (1,055) (111) (2,021) (122) Loss before provision for income taxes (68,333) (30,099) (198,804) (79,481) Provision for income taxes 262 57 588 251 Net loss $(68,595) $(30,156) $(199,392) $(79,732) Net loss per share attributable to Class A and Class B common stockholders, basic and diluted $(0.26) $(0.85) $(1.39) $(2.30) Weighted-average shares used in computing net loss per share attributable to Class A and Class B common stockholders, basic and diluted 262,999,535 35,646,513 143,199,215 34,705,426 (1) Includes stock-based compensation expense as follows: Cost of revenue $1,202 $66 $2,425 $201 Research and development 9,035 443 24,997 3,467 Sales and marketing 4,848 985 10,800 2,052 General and administrative 12,277 3,101 23,970 4,114 Total stock-based compensation expense $27,362 $4,595 $62,192 $9,834 SENTINELONE, INC. CONDENSED CONSOLIDATED STATEMENTS OF OPERATIONS (in thousands, except share and per share data) (unaudited)
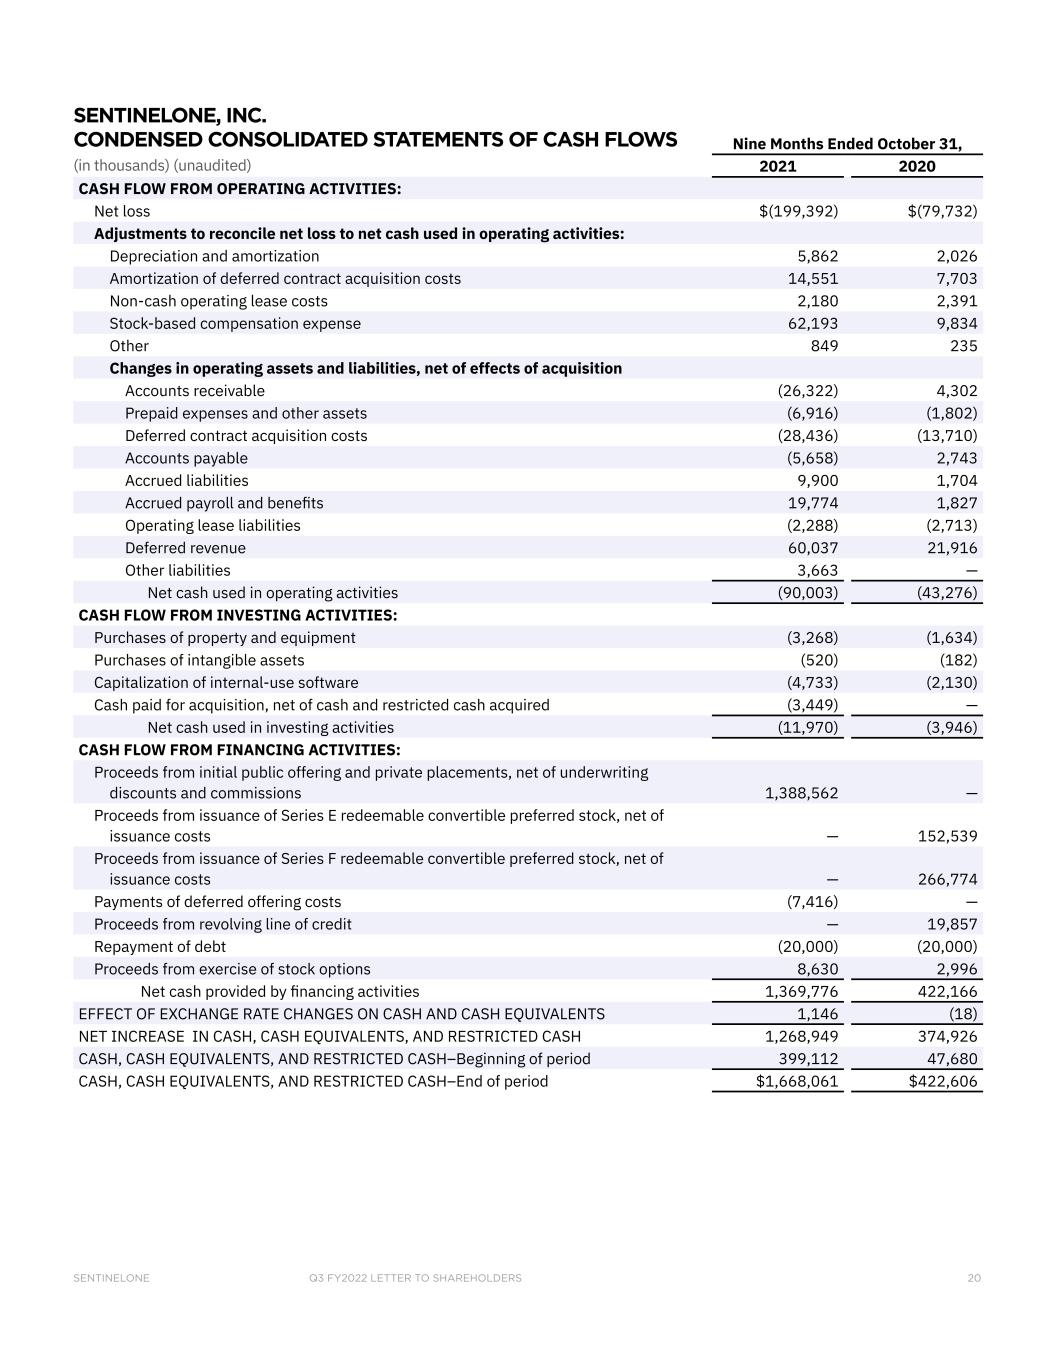
Q3 FY2022 LETTER TO SHAREHOLDERSSENTINELONE 20 Nine Months Ended October 31, 2021 2020 CASH FLOW FROM OPERATING ACTIVITIES: Net loss $(199,392) $(79,732) Adjustments to reconcile net loss to net cash used in operating activities: Depreciation and amortization 5,862 2,026 Amortization of deferred contract acquisition costs 14,551 7,703 Non-cash operating lease costs 2,180 2,391 Stock-based compensation expense 62,193 9,834 Other 849 235 Changes in operating assets and liabilities, net of effects of acquisition Accounts receivable (26,322) 4,302 Prepaid expenses and other assets (6,916) (1,802) Deferred contract acquisition costs (28,436) (13,710) Accounts payable (5,658) 2,743 Accrued liabilities 9,900 1,704 Accrued payroll and benefits 19,774 1,827 Operating lease liabilities (2,288) (2,713) Deferred revenue 60,037 21,916 Other liabilities 3,663 — Net cash used in operating activities (90,003) (43,276) CASH FLOW FROM INVESTING ACTIVITIES: Purchases of property and equipment (3,268) (1,634) Purchases of intangible assets (520) (182) Capitalization of internal-use software (4,733) (2,130) Cash paid for acquisition, net of cash and restricted cash acquired (3,449) — Net cash used in investing activities (11,970) (3,946) CASH FLOW FROM FINANCING ACTIVITIES: Proceeds from initial public offering and private placements, net of underwriting discounts and commissions 1,388,562 — Proceeds from issuance of Series E redeemable convertible preferred stock, net of issuance costs — 152,539 Proceeds from issuance of Series F redeemable convertible preferred stock, net of issuance costs — 266,774 Payments of deferred offering costs (7,416) — Proceeds from revolving line of credit — 19,857 Repayment of debt (20,000) (20,000) Proceeds from exercise of stock options 8,630 2,996 Net cash provided by financing activities 1,369,776 422,166 EFFECT OF EXCHANGE RATE CHANGES ON CASH AND CASH EQUIVALENTS 1,146 (18) NET INCREASE IN CASH, CASH EQUIVALENTS, AND RESTRICTED CASH 1,268,949 374,926 CASH, CASH EQUIVALENTS, AND RESTRICTED CASH–Beginning of period 399,112 47,680 CASH, CASH EQUIVALENTS, AND RESTRICTED CASH–End of period $1,668,061 $422,606 SENTINELONE, INC. CONDENSED CONSOLIDATED STATEMENTS OF CASH FLOWS (in thousands) (unaudited)
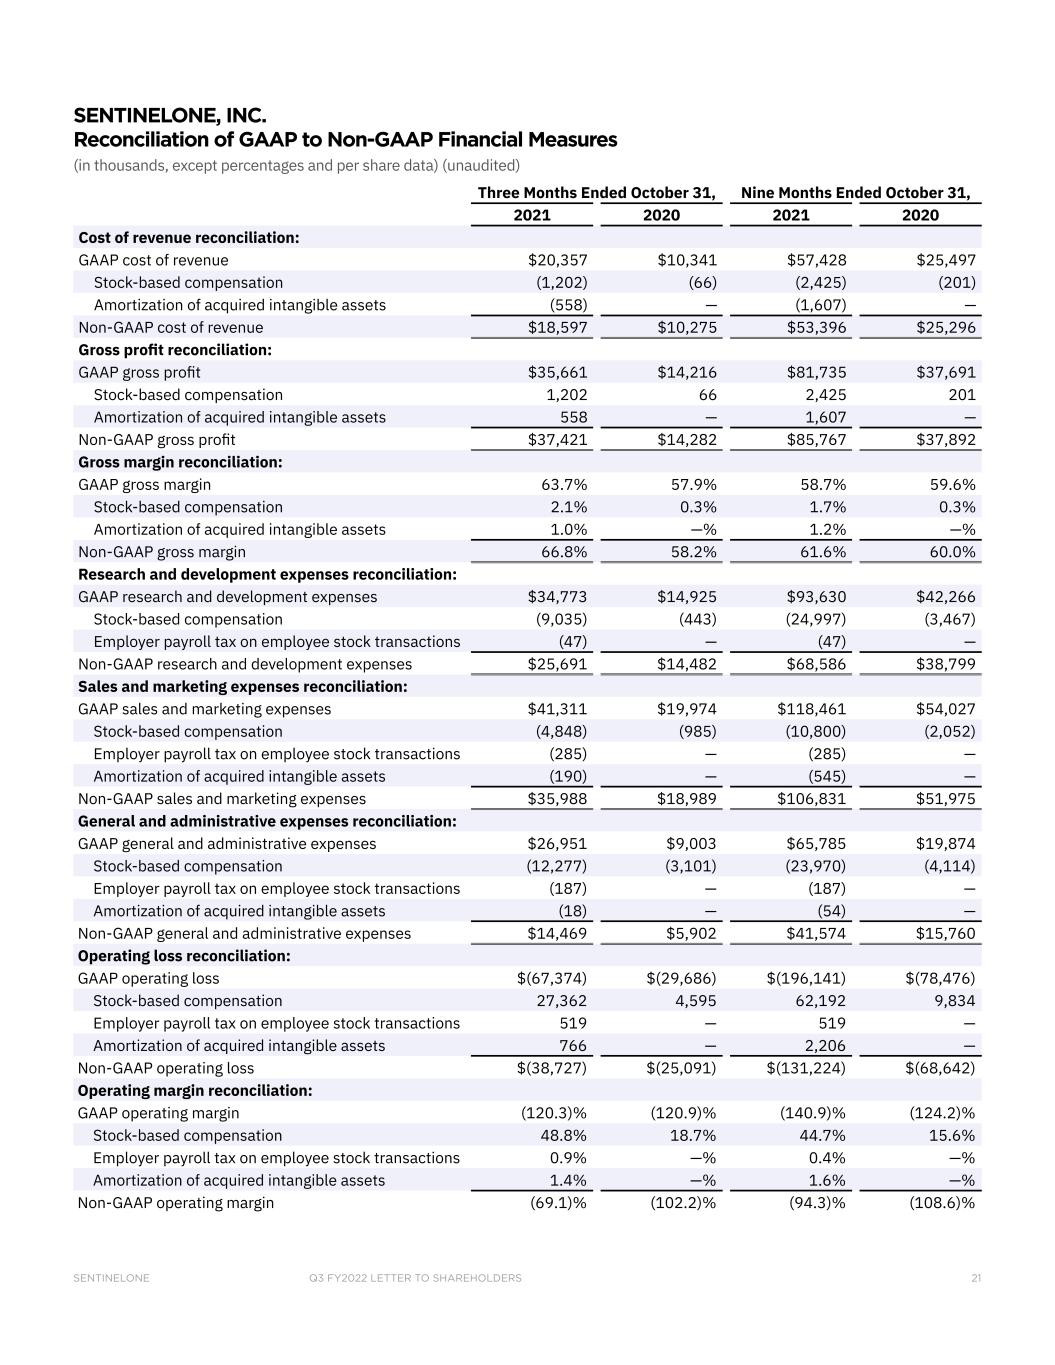
Q3 FY2022 LETTER TO SHAREHOLDERSSENTINELONE 21 Three Months Ended October 31, Nine Months Ended October 31, 2021 2020 2021 2020 Cost of revenue reconciliation: GAAP cost of revenue $20,357 $10,341 $57,428 $25,497 Stock-based compensation (1,202) (66) (2,425) (201) Amortization of acquired intangible assets (558) — (1,607) — Non-GAAP cost of revenue $18,597 $10,275 $53,396 $25,296 Gross profit reconciliation: GAAP gross profit $35,661 $14,216 $81,735 $37,691 Stock-based compensation 1,202 66 2,425 201 Amortization of acquired intangible assets 558 — 1,607 — Non-GAAP gross profit $37,421 $14,282 $85,767 $37,892 Gross margin reconciliation: GAAP gross margin 63.7% 57.9% 58.7% 59.6% Stock-based compensation 2.1% 0.3% 1.7% 0.3% Amortization of acquired intangible assets 1.0% —% 1.2% —% Non-GAAP gross margin 66.8% 58.2% 61.6% 60.0% Research and development expenses reconciliation: GAAP research and development expenses $34,773 $14,925 $93,630 $42,266 Stock-based compensation (9,035) (443) (24,997) (3,467) Employer payroll tax on employee stock transactions (47) — (47) — Non-GAAP research and development expenses $25,691 $14,482 $68,586 $38,799 Sales and marketing expenses reconciliation: GAAP sales and marketing expenses $41,311 $19,974 $118,461 $54,027 Stock-based compensation (4,848) (985) (10,800) (2,052) Employer payroll tax on employee stock transactions (285) — (285) — Amortization of acquired intangible assets (190) — (545) — Non-GAAP sales and marketing expenses $35,988 $18,989 $106,831 $51,975 General and administrative expenses reconciliation: GAAP general and administrative expenses $26,951 $9,003 $65,785 $19,874 Stock-based compensation (12,277) (3,101) (23,970) (4,114) Employer payroll tax on employee stock transactions (187) — (187) — Amortization of acquired intangible assets (18) — (54) — Non-GAAP general and administrative expenses $14,469 $5,902 $41,574 $15,760 Operating loss reconciliation: GAAP operating loss $(67,374) $(29,686) $(196,141) $(78,476) Stock-based compensation 27,362 4,595 62,192 9,834 Employer payroll tax on employee stock transactions 519 — 519 — Amortization of acquired intangible assets 766 — 2,206 — Non-GAAP operating loss $(38,727) $(25,091) $(131,224) $(68,642) Operating margin reconciliation: GAAP operating margin (120.3)% (120.9)% (140.9)% (124.2)% Stock-based compensation 48.8% 18.7% 44.7% 15.6% Employer payroll tax on employee stock transactions 0.9% —% 0.4% —% Amortization of acquired intangible assets 1.4% —% 1.6% —% Non-GAAP operating margin (69.1)% (102.2)% (94.3)% (108.6)% SENTINELONE, INC. Reconciliation of GAAP to Non-GAAP Financial Measures (in thousands, except percentages and per share data) (unaudited)
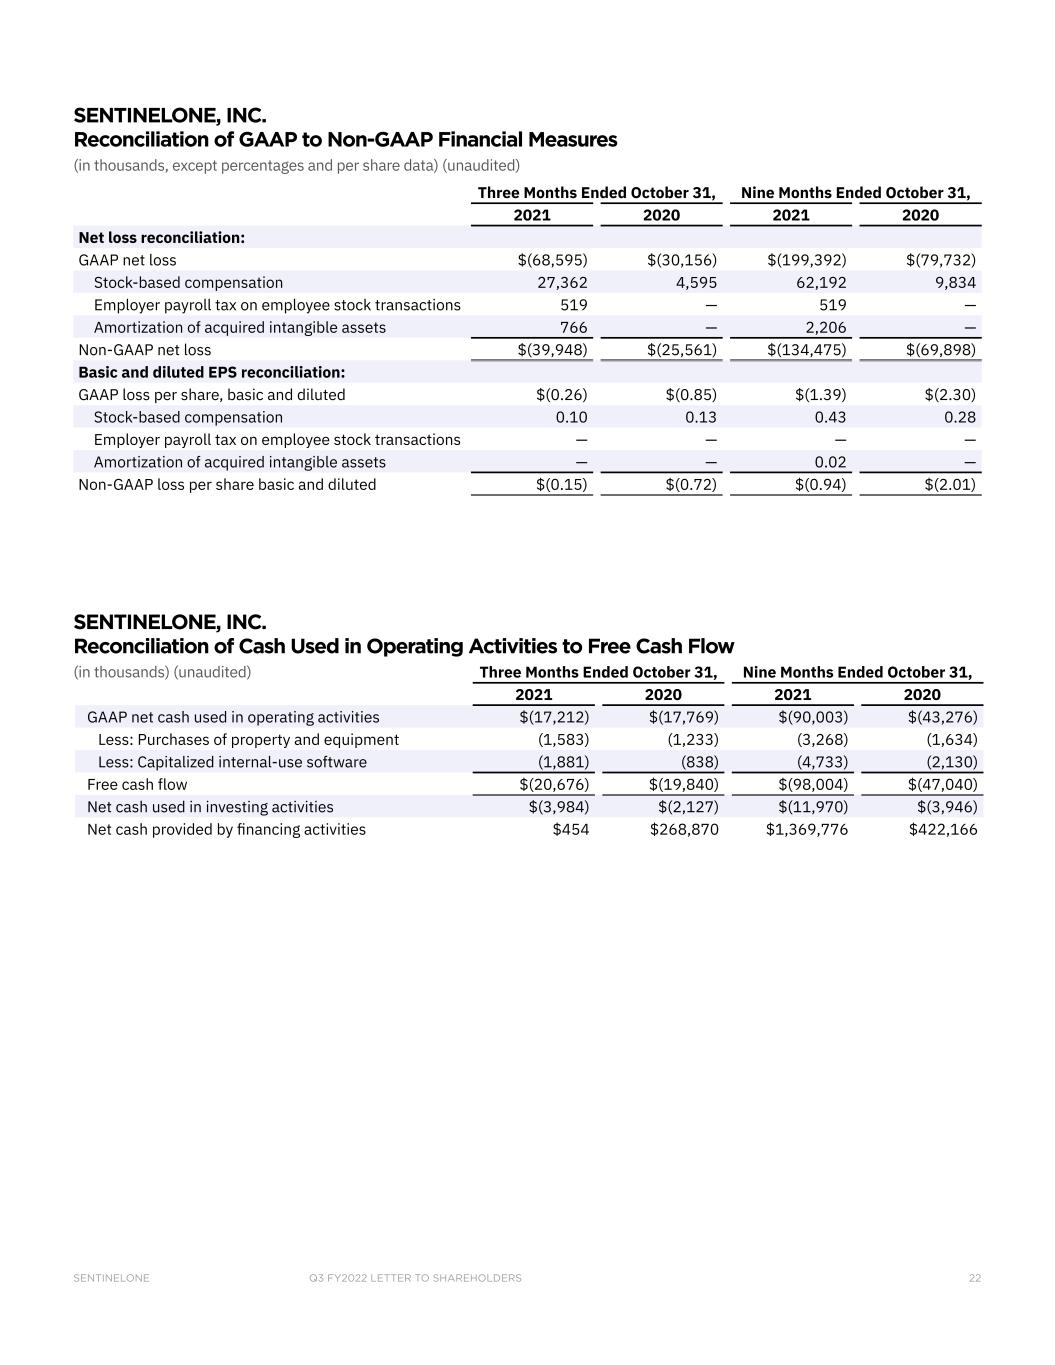
Q3 FY2022 LETTER TO SHAREHOLDERSSENTINELONE 22 Three Months Ended October 31, Nine Months Ended October 31, 2021 2020 2021 2020 Net loss reconciliation: GAAP net loss $(68,595) $(30,156) $(199,392) $(79,732) Stock-based compensation 27,362 4,595 62,192 9,834 Employer payroll tax on employee stock transactions 519 — 519 — Amortization of acquired intangible assets 766 — 2,206 — Non-GAAP net loss $(39,948) $(25,561) $(134,475) $(69,898) Basic and diluted EPS reconciliation: GAAP loss per share, basic and diluted $(0.26) $(0.85) $(1.39) $(2.30) Stock-based compensation 0.10 0.13 0.43 0.28 Employer payroll tax on employee stock transactions — — — — Amortization of acquired intangible assets — — 0.02 — Non-GAAP loss per share basic and diluted $(0.15) $(0.72) $(0.94) $(2.01) Three Months Ended October 31, Nine Months Ended October 31, 2021 2020 2021 2020 GAAP net cash used in operating activities $(17,212) $(17,769) $(90,003) $(43,276) Less: Purchases of property and equipment (1,583) (1,233) (3,268) (1,634) Less: Capitalized internal-use software (1,881) (838) (4,733) (2,130) Free cash flow $(20,676) $(19,840) $(98,004) $(47,040) Net cash used in investing activities $(3,984) $(2,127) $(11,970) $(3,946) Net cash provided by financing activities $454 $268,870 $1,369,776 $422,166 SENTINELONE, INC. Reconciliation of GAAP to Non-GAAP Financial Measures (in thousands, except percentages and per share data) (unaudited) SENTINELONE, INC. Reconciliation of Cash Used in Operating Activities to Free Cash Flow (in thousands) (unaudited)

sentinelone.com © SentinelOne 2021
