Exhibit 99.2


UNITED STATES
SECURITIES AND EXCHANGE COMMISSION
WASHINGTON, D.C. 20549
FORM
CURRENT REPORT
Pursuant to Section 13 or 15(d) of the Securities Exchange Act of 1934
Date of Report (Date of earliest event reported):
(Exact name of Registrant as Specified in Its Charter)
(State or Other Jurisdiction of Incorporation) |
(Commission
File Number) |
(IRS Employer Identification No.) |
| (Address of Principal Executive Offices) | (Zip Code) |
Registrant’s Telephone Number, Including Area Code: (
Not Applicable
(Former Name or Former Address, if Changed Since Last Report)
Check the appropriate box below if the Form 8-K filing is intended to simultaneously satisfy the filing obligation of the registrant under any of the following provisions:
| Written communications pursuant to Rule 425 under the Securities Act (17 CFR 230.425) | |
| Soliciting material pursuant to Rule 14a-12 under the Exchange Act (17 CFR 240.14a-12) | |
| Pre-commencement communications pursuant to Rule 14d-2(b) under the Exchange Act (17 CFR 240.14d-2(b)) | |
| Pre-commencement communications pursuant to Rule 13e-4(c) under the Exchange Act (17 CFR 240.13e-4(c)) |
Securities registered pursuant to Section 12(b) of the Act:
Title of each class |
Trading Symbol(s) |
Name of each exchange on which registered | ||
Indicate by check mark whether the registrant is an emerging growth company as defined in Rule 405 of the Securities Act of 1933 (§ 230.405 of this chapter) or Rule 12b-2 of the Securities Exchange Act of 1934 (§ 240.12b-2 of this chapter).
Emerging growth
company
If
an emerging growth company, indicate by check mark if the registrant has elected not to use the extended transition period for complying
with any new or revised financial accounting standards provided pursuant to Section 13(a) of the Exchange Act.
Item 2.02 Results of Operations and Financial Condition.
On March 27, 2026, SBC Medical Group Holdings Incorporated (the “Company”), issued a press release announcing its fourth quarter and full year 2025 financial results. The press release is attached as Exhibit 99.1 and is incorporated herein by reference.
The information furnished under Item 2.02, including Exhibit 99.1, shall not be deemed “filed” for purposes of Section 18 of the Securities Exchange Act of 1934, as amended (the “Exchange Act”), or otherwise subject to the liabilities under that section and shall not be deemed to be incorporated by reference into any filing under the Securities Act of 1933, as amended (the “Securities Act”), or the Exchange Act, except as otherwise expressly stated by specific reference in any such filing.
Item 7.01 Regulation FD Disclosure.
Additionally, on March 27, 2026, the Company posted an investor presentation to its website, entitled “Group Business,” which provides an overview of its business (https://sbc-holdings.com/en/ir/ir-presentation). From time to time, the Company uses its website (https://sbc-holdings.com/en) to distribute company information and makes available free of charge a variety of information for investors, including its filings with the Securities and Exchange Commission (“SEC”), as soon as reasonably practicable after electronically filing that material with, or furnishing it, to the SEC. The information that the Company posts on its website may be deemed material. Accordingly, investors should monitor the Company’s website, in addition to following its press releases, filings with the SEC, and public conference calls and webcasts. Investors may opt in to automatically receive email alerts and other information about the Company when enrolling their email address by visiting the “Email Alerts” section under the “Resources” tab on its website. The Company does not incorporate the information contained on, or accessible through, its website or related social media channels into this Current Report on Form 8-K.
The information furnished under this Item 7.01 shall not be deemed “filed” for purposes of Section 18 of the Exchange Act, or otherwise subject to the liabilities under that section and shall not be deemed to be incorporated by reference into any filing under the Securities Act, or the Exchange Act, except as otherwise expressly stated by specific reference in any such filing.
Item 8.01 Other Events.
On March 27, 2026, in connection with the Company’s announcements described in this Current Report on Form 8-K, the Company announced certain updates to its business strategy and capital policy, as summarized in Exhibit 99.2 hereto, which is incorporated herein by reference.
Item 9.01 Financial Statements and Exhibits.
(d) Exhibits.
Exhibit No. |
Description | |
| 99.1 | Press Release, dated March 27, 2026, entitled “SBC Medical Group Holdings Announces Fourth Quarter and Full Year 2025 Financial Results” | |
| 99.2 | ||
| 104 | Cover Page Interactive Data File (embedded within the Inline XBRL document) |
SIGNATURES
Pursuant to the requirements of the Securities Exchange Act of 1934, the registrant has duly caused this report to be signed on its behalf by the undersigned hereunto duly authorized.
| SBC Medical Group Holdings Incorporated | |||
| Date: | March 27, 2026 | By: | /s/ Yuya Yoshida |
| Name: | Yuya Yoshida | ||
| Title: | Chief Financial Officer and Chief Operating Officer | ||
Exhibit 99.1
Q4 EPS more than doubles to $0.14 as profitability improves significantly year over year
Fourth Quarter 2025 Highlights
| ● | Total revenues were $40 million, representing an 11% year-over-year decrease. | |
| ● | Net Income attributable to SBC Medical Group was $14 million, representing a 117% year-over-year increase. | |
| ● | Earnings per share, which is defined as net income attributable to the Company divided by the weighted average number of outstanding shares, was $0.14 for the three months ended December 31, 2025, representing 133% year-over-year increase. | |
| ● | EBITDA1, which is calculated by adding depreciation and amortization expense and impairment loss on intangible assets to income from operations was $14 million, representing a 35% year-over-year decrease. EBITDA margin1 was 34% for the fourth quarter of 2025, representing a year-over-year decrease of 12 percentage points. | |
| ● | Return on equity, which is defined as net income attributable to the Company divided by the average shareholder’s equity as of December 31, 2025, was 23% representing a year-over-year increase of 9.8 percentage points. | |
| ● | Number of Franchise Locations2 was 283 as of December 31, 2025, representing an increase of 34 locations from December 31, 2024. | |
| ● | Number of customers3 in the last twelve months ended December 31, 2025, was 6.6 million, representing a 12% year-over-year increase. | |
| ● | Repeat rate for customers4 who visited franchisee’s clinics twice or more was 72%. |
1 EBITDA and EBITDA Margin are non-GAAP financial measures. For more information on non-GAAP financial measures, please see the section “Use of Non-GAAP Financial Measures” and the table captioned “Unaudited Reconciliations of GAAP and Non-GAAP Results.”
2 The figures take into accounts of the franchising of SBC brand clinics, Rize Clinic, Gorilla Clinic, AHH, JUN CLINIC
3 The customer count includes customers of SBC brand clinics, Rize Clinic, Gorilla Clinic, AHH Clinic, and JUN CLINIC. The applicable periods are from January 1, 2025, to December 31, 2025.
4 The figures include franchising of SBC brand clinics, Rize Clinic, and Gorilla Clinic, but does not take account of customers of AHH clinics and JUN CLINIC excluding free counseling. The percentage of customers who visited our franchisee’s clinics twice or more.
Full Year 2025 Highlights
| ● | Total revenues were $174 million, representing a 15% year-over-year decrease. | |
| ● | Net Income attributable to SBC Medical Group was $51 million, representing a 9% year-over-year increase. | |
| ● | Earnings per share, which is defined as net income attributable to the Company divided by the weighted average number of outstanding shares, was $0.50 for the year ended December 31, 2025, representing a 4% year-over-year increase. | |
| ● | EBITDA1, which is calculated by adding depreciation and amortization expense and impairment loss on intangible assets to income from operations was $70 million, representing a 21% year-over-year decrease. EBITDA margin was 40% for the full year 2025, representing a year-over-year decrease of 3 percentage points. |
Yoshiyuki Aikawa, Chairman and Chief Executive Officer of SBC Medical, commented: “Our full-year 2025 results reflect a business in transition. Revenue declined 15% to $174 million, primarily due to two structural changes: the business restructuring undertaken in 2024, and the revision of franchise fee arrangements implemented in April 2025. These were deliberate steps to build a more sustainable business foundation, and their financial impact is now largely behind us.
Beneath the revenue decline, our underlying profitability strengthened considerably. Full-year net income attributable to SBC Medical Group grew 9% to $51 million, with earnings per share of $0.50. Our net income margin expanded from 23% to 29%, as the IPO-related stock-based compensation and impairment losses that weighed on our prior-year results did not recur. EBITDA margin normalized modestly from 43% to 40%, which we view as a more sustainable run-rate going forward.
In the fourth quarter specifically, we saw encouraging operational momentum. Average revenue per customer recovered to $316, an 11% increase year over year — a meaningful inflection after a period of gradual decline, and one that we believe reflects the early impact of our pricing and customer engagement initiatives. We closed the year with 283 clinic locations and 6.63 million annual customer visits.
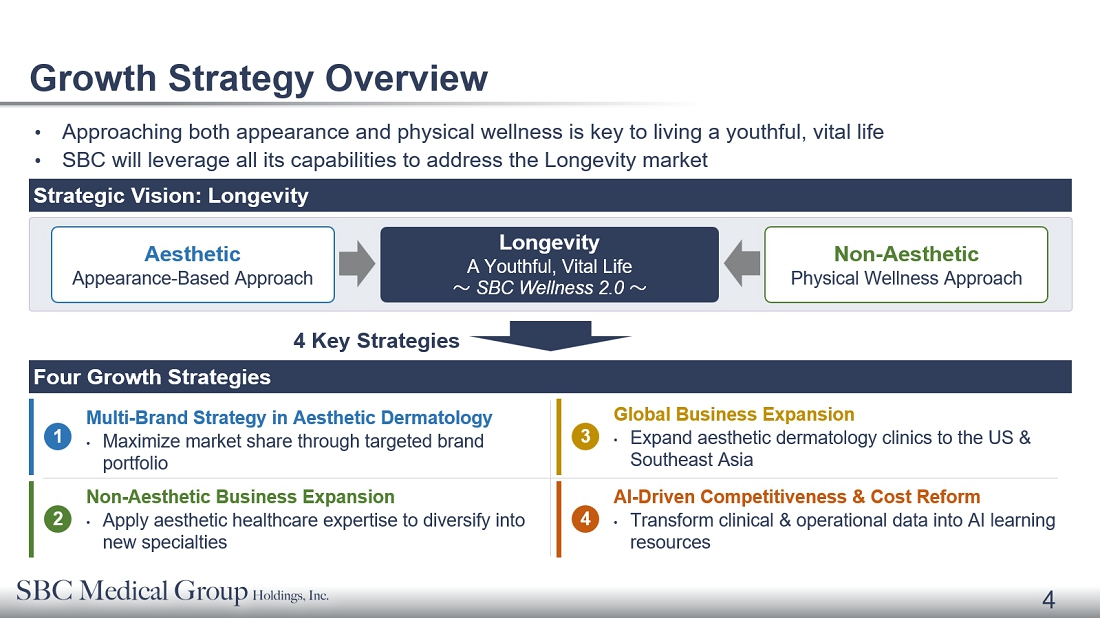
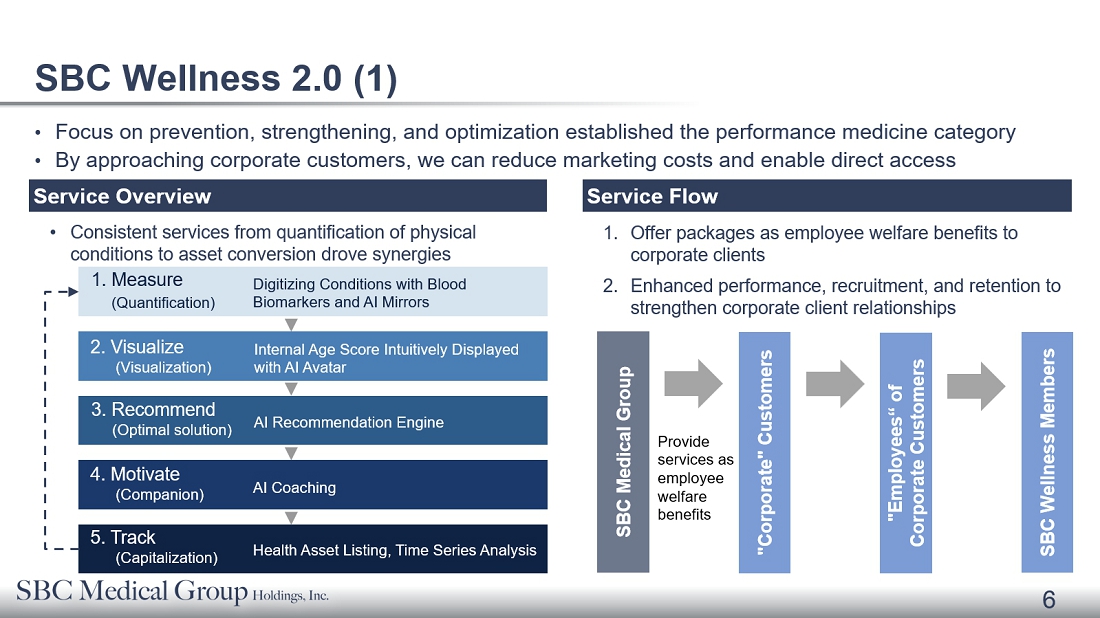
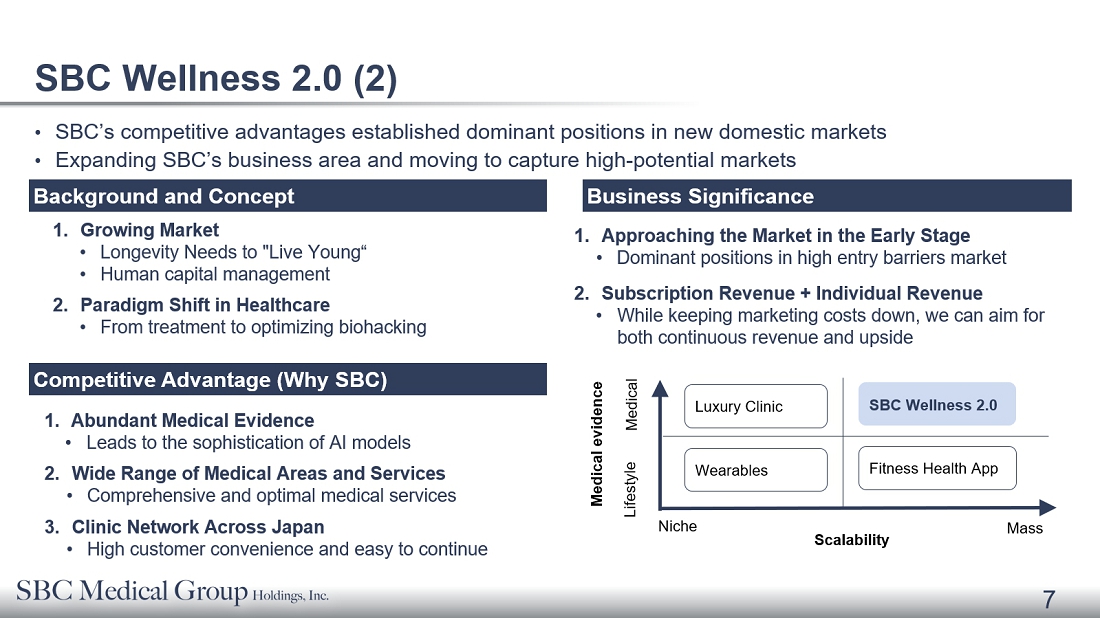
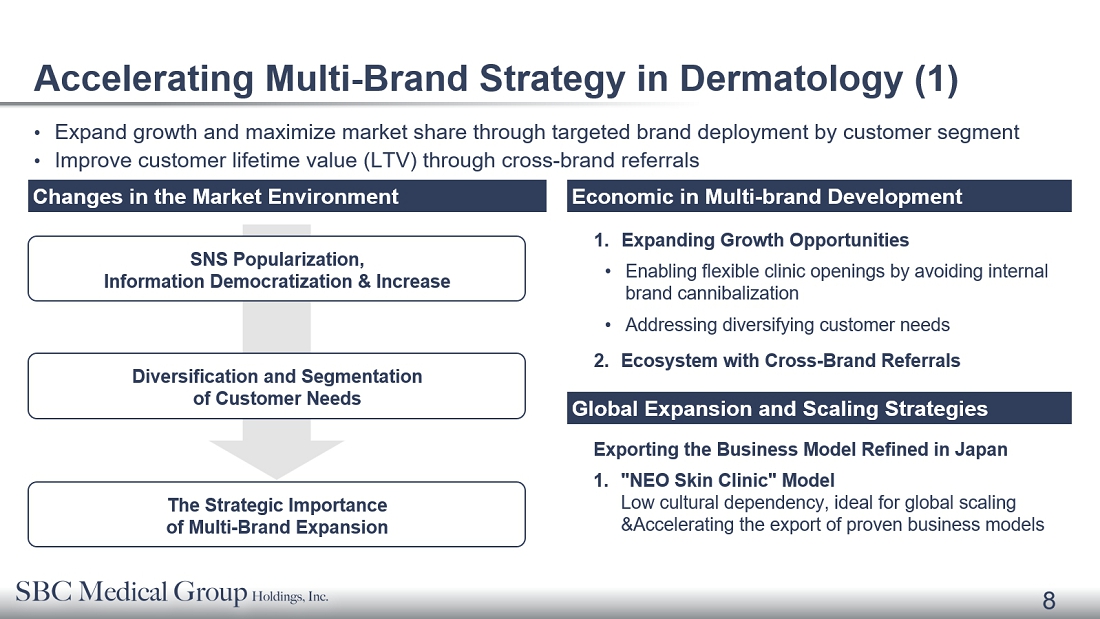
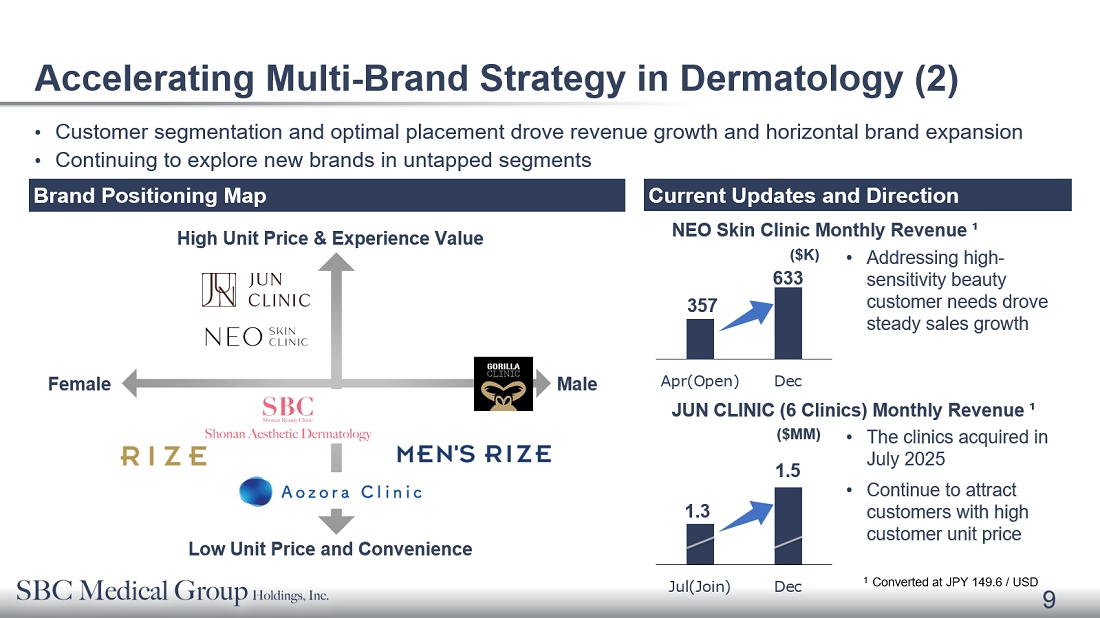
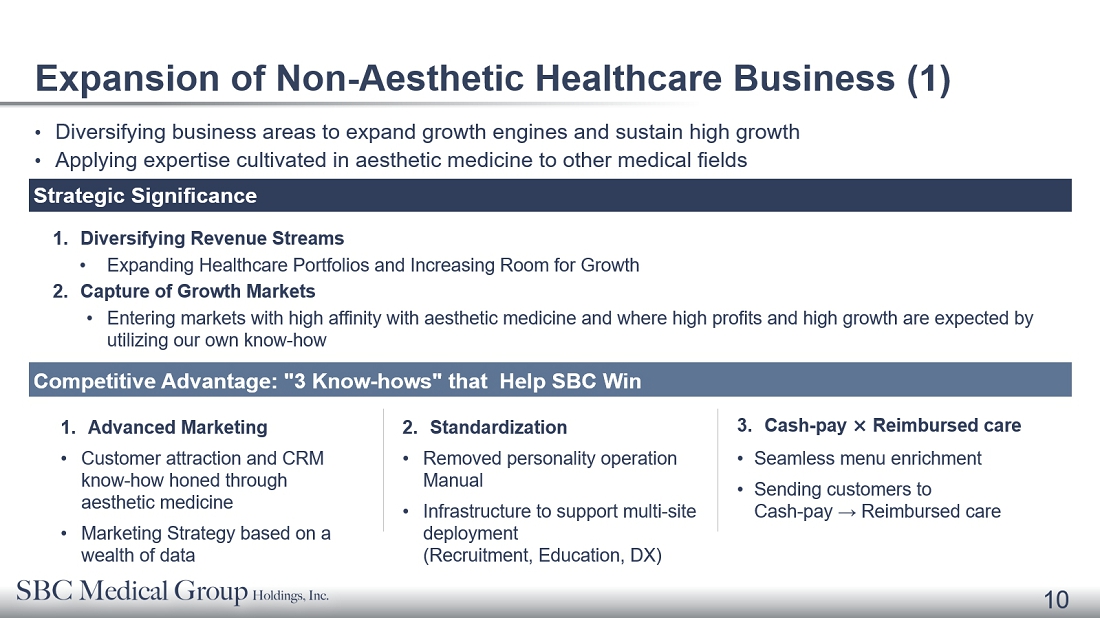
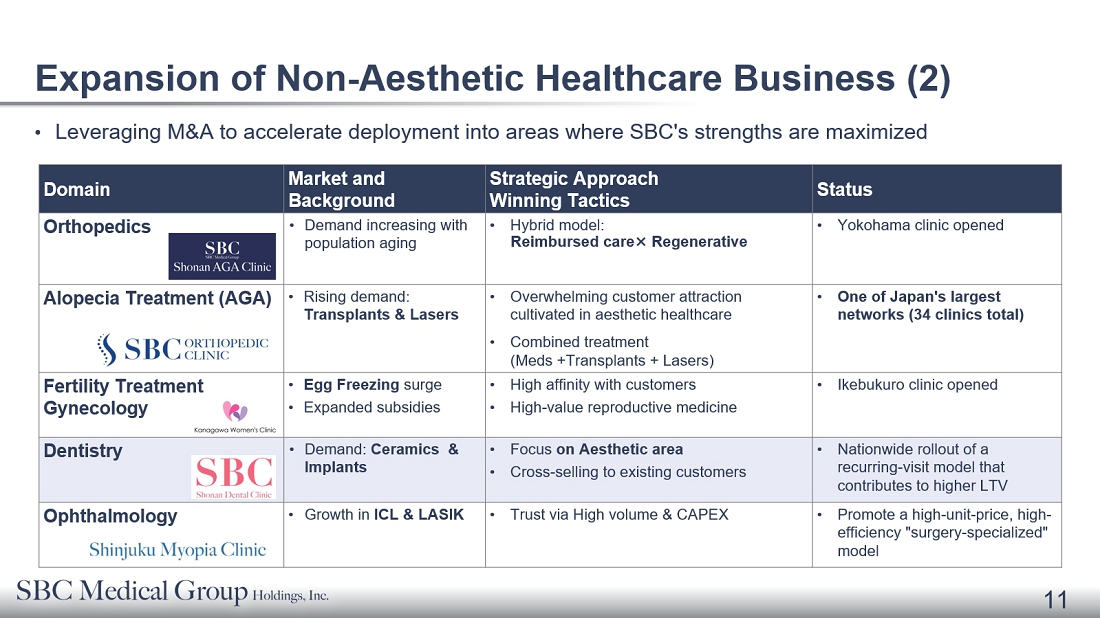
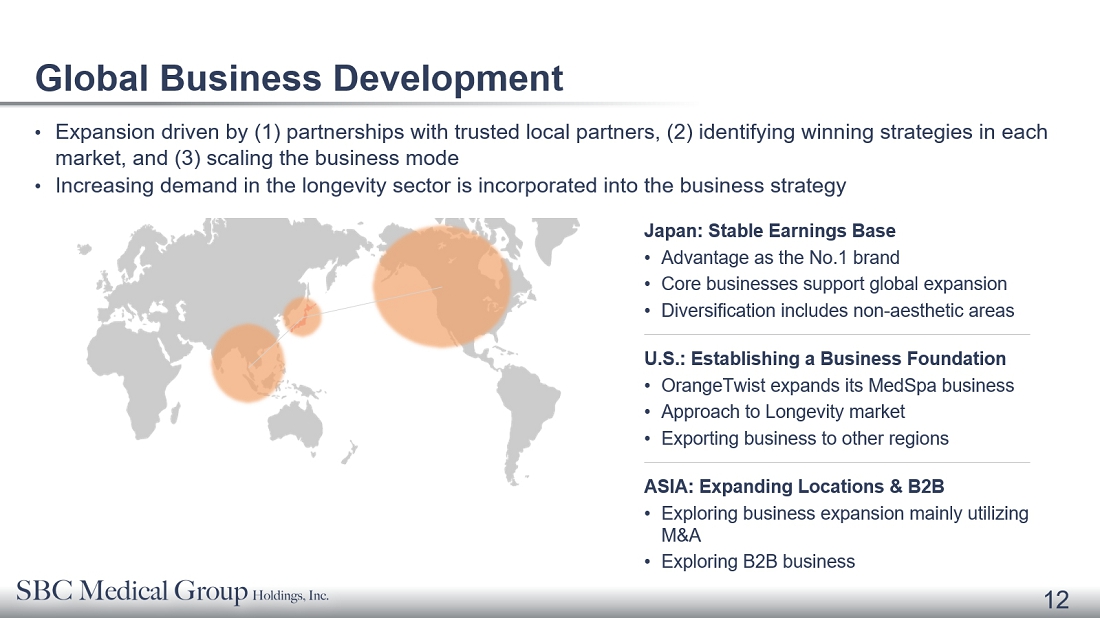
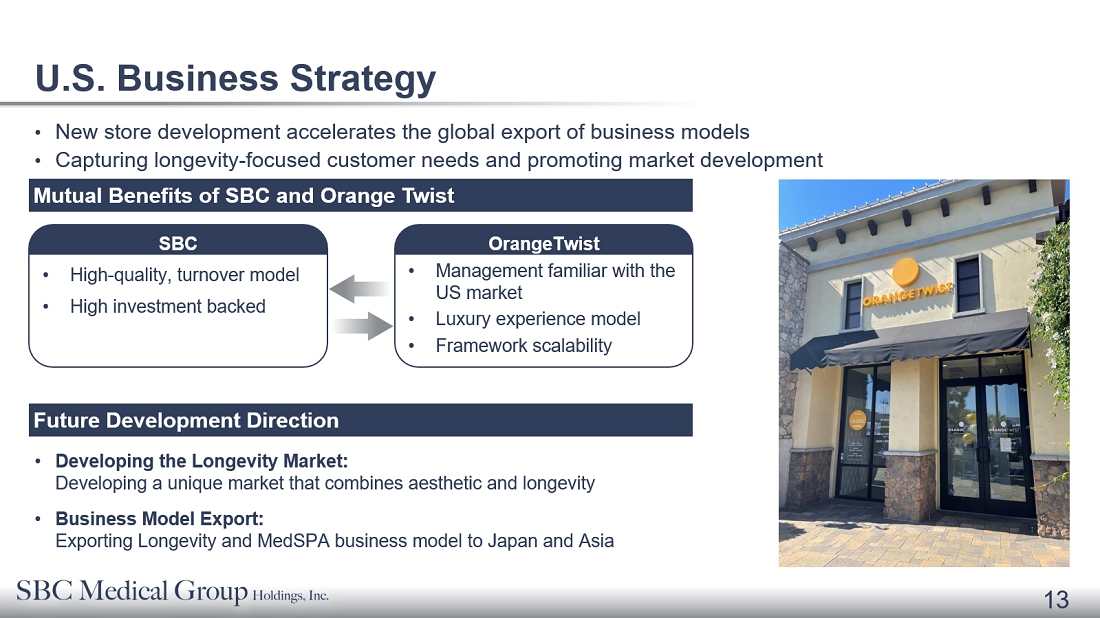
As we enter 2026, we are focused on three priorities: advancing our multi-brand strategy in the dermatology segment, expanding our non-aesthetic healthcare portfolio, and building a stronger foundation in international markets. With the structural headwinds of the past two years now largely behind us, we are well-positioned to return to sustainable top-line growth.”
Conference Call
The Company will hold a conference call on Friday, March 27, 2026 at 8:30 am Eastern Time (or Friday, March 27, 2026 at 10:30 pm Japan Time) to discuss the financial results and take questions live.
Please register in advance of the conference using the link provided below.
https://zoom.us/webinar/register/WN_d1mfdSBSThST4BIiID88aQ
It will automatically direct you to the registration page of “Q4 2025 and Full Year Financial Results”. Please follow the steps to enter your registration details, then click “Submit.”.
Additionally, the earnings release, accompanying slides, and an archived webcast of this conference call will be available at the Company’s Investor Relations website at https://ir.sbc-holdings.com/
About SBC Medical
SBC Medical Group Holdings Incorporated is a Management Services Organization operating a wide range of franchise businesses across diverse medical fields, including advanced aesthetic healthcare, dermatology, orthopedics, fertility treatment, gynecology, dentistry, alopecia treatment (AGA), and ophthalmology. The Company manages a diverse portfolio of clinic brands and is actively expanding its global presence, particularly in the United States and Asia, through both direct operations and medical tourism initiatives. In September 2024, the Company was listed on Nasdaq, and in June 2025, it was selected for inclusion in the Russell 3000® Index, a broad benchmark of the U.S. equity market. Guided by its Group Purpose “Contributing to the well-being of people around the world through medical innovation,” SBC Medical Group Holdings Incorporated continues to provide safe, trusted, and high-quality medical services while further strengthening its international reputation for quality and trust in medical care.
For more information, visit https://sbc-holdings.com/
Use of Non-GAAP Financial Measures
The Company uses non-GAAP measures, such as EBITDA and EBITDA margin, in evaluating its operating results and for financial and operational decision-making purposes. The Company believes that the non-GAAP financial measures help identify underlying trends in its business. The Company believes that the non-GAAP financial measures provide useful information about the Company’s results of operations, enhance the overall understanding of the Company’s past performance and future prospects and allow for greater visibility with respect to key metrics used by the Company’s management in its financial and operational decision-making.
The non-GAAP financial measures are not defined under U.S. GAAP and are not presented in accordance with U.S. GAAP. The non-GAAP financial measures have limitations as analytical tools, and when assessing the Company’s operating performance, cash flows or liquidity, investors should not consider them in isolation, or as a substitute for net loss, cash flows provided by operating activities or other consolidated statements of operations and cash flows data prepared in accordance with U.S. GAAP.
The Company mitigates these limitations by reconciling the non-GAAP financial measures to the most comparable U.S. GAAP performance measures, all of which should be considered when evaluating the Company’s performance.
For more information on the non-GAAP financial measures, please see the table captioned “Unaudited Reconciliations of GAAP and Non-GAAP Results.”
Forward-Looking Statements
This press release contains forward-looking statements. Forward-looking statements are not historical facts or statements of current conditions, but instead represent only the Company’s beliefs regarding future events and performance, many of which, by their nature, are inherently uncertain and outside of the Company’s control. These forward-looking statements reflect the Company’s current views with respect to, among other things, the Company’s financial performance; growth in revenue and earnings; business prospects and opportunities; and capital deployment plans and liquidity. In some cases, forward-looking statements can be identified by the use of words such as “may,” “should,” “expects,” “anticipates,” “contemplates,” “estimates,” “believes,” “plans,” “projected,” “predicts,” “potential,” or “hopes” or the negative of these or similar terms. The Company cautions readers not to place undue reliance upon any forward-looking statements, which are current only as of the date of this release and are subject to various risks, uncertainties, assumptions, or changes in circumstances that are difficult to predict or quantify. The forward-looking statements are based on management’s current expectations and are not guarantees of future performance. The Company does not undertake or accept any obligation to release publicly any updates or revisions to any forward-looking statements to reflect any change in its expectations or any change in events, conditions, or circumstances on which any such statement is based, except as required by law. Factors that may cause actual results to differ materially from current expectations may emerge from time to time, and it is not possible for the Company to predict all of them; such factors include, among other things, changes in global, regional, or local economic, business, competitive, market and regulatory conditions, and those listed under the heading “Risk Factors” and elsewhere in the Company’s filings with the U.S. Securities and Exchange Commission (the “SEC”), which are accessible on the SEC’s website at www.sec.gov.
SBC MEDICAL GROUP HOLDINGS INCORPORATED
CONSOLIDATED BALANCE SHEETS
| December 31, 2025 | December 31, 2024 | |||||||
| ASSETS | ||||||||
| Current assets: | ||||||||
| Cash and cash equivalents | $ | 163,773,838 | $ | 125,044,092 | ||||
| Accounts receivable | 2,388,021 | 1,413,433 | ||||||
| Accounts receivable – related parties | 27,511,730 | 28,846,680 | ||||||
| Inventories | 2,792,617 | 1,494,891 | ||||||
| Short-term investments – related parties | 319,193 | — | ||||||
| Finance lease receivables, current – related parties | 12,832,355 | 5,992,585 | ||||||
| Income tax recoverable | 1,175,510 | — | ||||||
| Customer loans receivable, current | 8,705,999 | 10,382,537 | ||||||
| Prepaid expenses and other current assets | 11,724,852 | 11,276,802 | ||||||
| Total current assets | 231,224,115 | 184,451,020 | ||||||
| Non-current assets: | ||||||||
| Property and equipment, net | 7,539,392 | 8,771,902 | ||||||
| Intangible assets, net | 47,742,888 | 1,590,052 | ||||||
| Long-term investments, net | 1,299,366 | 3,049,972 | ||||||
| Equity method investments | 20,312,642 | — | ||||||
| Goodwill, net | 15,432,061 | 4,613,784 | ||||||
| Finance lease receivables, non-current – related parties | 13,746,513 | 8,397,582 | ||||||
| Operating lease right-of-use assets | 8,366,569 | 5,267,056 | ||||||
| Finance lease right-of-use assets | 450,874 | — | ||||||
| Deferred tax assets | 4,014,294 | 9,798,071 | ||||||
| Customer loans receivable, non-current | 4,824,977 | 5,023,551 | ||||||
| Long-term prepayments | 393,270 | 1,745,801 | ||||||
| Long-term investments in MCs – related parties | 17,837,293 | 17,820,910 | ||||||
| Other assets | 7,263,692 | 15,553,453 | ||||||
| Total non-current assets | 149,223,831 | 81,632,134 | ||||||
| Total assets | $ | 380,447,946 | $ | 266,083,154 | ||||
| LIABILITIES AND STOCKHOLDERS’ EQUITY | ||||||||
| Current liabilities: | ||||||||
| Accounts payable | $ | 16,988,384 | $ | 13,875,179 | ||||
| Accounts payable – related parties | 651,463 | 659,044 | ||||||
| Bank and other borrowings, current | 9,099,046 | 96,824 | ||||||
| Notes payables, current – related parties | — | 26,255 | ||||||
| Advances from customers | 1,415,762 | 820,898 | ||||||
| Advances from customers – related parties | 5,357,221 | 11,739,533 | ||||||
| Income tax payable | 8,821,853 | 18,705,851 | ||||||
| Operating lease liabilities, current | 4,416,960 | 4,341,522 | ||||||
| Finance lease liabilities, current | 132,946 | — | ||||||
| Accrued liabilities and other current liabilities | 11,544,695 | 8,103,194 | ||||||
| Due to related party | 2,692,673 | 2,823,590 | ||||||
| Total current liabilities | 61,121,003 | 61,191,890 | ||||||
| Non-current liabilities: | ||||||||
| Bank and other borrowings, non-current | 33,734,438 | 6,502,682 | ||||||
| Notes payables, non-current – related parties | — | 5,334 | ||||||
| Deferred tax liabilities | 16,374,832 | 926,023 | ||||||
| Operating lease liabilities, non-current | 4,136,257 | 1,241,526 | ||||||
| Finance lease liabilities, non-current | 116,527 | — | ||||||
| Other liabilities | 1,660,183 | 1,193,541 | ||||||
| Total non-current liabilities | 56,022,237 | 9,869,106 | ||||||
| Total liabilities | 117,143,240 | 71,060,996 | ||||||
| Stockholders’ equity: | ||||||||
| Preferred stock ($0.0001 par value, 20,000,000 shares authorized; no shares issued and outstanding as of December 31, 2025 and 2024) | — | — | ||||||
| Common stock ($0.0001 par value, 400,000,000 shares authorized, 103,881,251 and 103,020,816 shares issued, 102,576,943 and 102,750,816 shares outstanding as of December 31, 2025 and 2024, respectively) | 10,388 | 10,302 | ||||||
| Additional paid-in capital | 72,867,424 | 62,513,923 | ||||||
| Treasury stock (at cost, 1,304,308 and 270,000 shares as of December 31, 2025 and December 31, 2024, respectively) | (7,749,997 | ) | (2,700,000 | ) | ||||
| Retained earnings | 240,448,620 | 189,463,007 | ||||||
| Accumulated other comprehensive loss | (57,294,239 | ) | (54,178,075 | ) | ||||
| Total SBC Medical Group Holdings Incorporated stockholders’ equity | 248,282,196 | 195,109,157 | ||||||
| Non-controlling interests | 15,022,510 | (86,999 | ) | |||||
| Total stockholders’ equity | 263,304,706 | 195,022,158 | ||||||
| Total liabilities and stockholders’ equity | $ | 380,447,946 | $ | 266,083,154 | ||||
SBC MEDICAL GROUP HOLDINGS INCORPORATED
CONSOLIDATED STATEMENTS OF OPERATIONS AND COMPREHENSIVE INCOME
| For the Three Months Ended December 31, | For the Ended December 31, | |||||||||||||||
| 2025 | 2024 | 2025 | 2024 | |||||||||||||
| Revenues, net – related parties | $ | 35,041,379 | $ | 42,455,401 | $ | 158,860,970 | $ | 195,173,889 | ||||||||
| Revenues, net | 4,525,327 | 1,965,136 | 14,746,519 | 10,241,653 | ||||||||||||
| Total revenues, net | 39,566,706 | 44,420,537 | 173,607,489 | 205,415,542 | ||||||||||||
| Cost of revenues | 10,638,132 | 10,548,170 | 46,323,767 | 49,365,035 | ||||||||||||
| Gross profit | 28,928,574 | 33,872,367 | 127,283,722 | 156,050,507 | ||||||||||||
| Operating expenses: | ||||||||||||||||
| Selling, general and administrative expenses | 16,079,682 | 13,880,503 | 59,797,324 | 57,665,140 | ||||||||||||
| Stock-based compensation | — | 215,237 | — | 13,022,692 | ||||||||||||
| Impairment loss on intangible asset | — | 15,058,965 | — | 15,058,965 | ||||||||||||
| Total operating expenses | 16,079,682 | 29,154,705 | 59,797,324 | 85,746,797 | ||||||||||||
| Income from operations | 12,848,892 | 4,717,662 | 67,486,398 | 70,303,710 | ||||||||||||
| Other income (expenses): | ||||||||||||||||
| Interest income | (284 | ) | (17,340 | ) | 198,315 | 19,943 | ||||||||||
| Interest expense | (56,090 | ) | (12,402 | ) | (160,583 | ) | (28,300 | ) | ||||||||
| Foreign currency exchange gain, net | 2,907,364 | 800,643 | 2,002,789 | 895,711 | ||||||||||||
| Other income | 3,287,471 | 5,113,637 | 3,914,297 | |||||||||||||
| Other expenses | (317,263 | ) | (2,716,703 | ) | (1,321,064 | ) | (5,463,153 | ) | ||||||||
| Gain on redemption of life insurance policies | — | — | 8,746,138 | — | ||||||||||||
| Gain on disposal of subsidiary | — | — | — | 3,813,609 | ||||||||||||
| Total other income | 5,718,106 | 1,341,669 | 14,579,232 | 3,152,107 | ||||||||||||
| Income before income taxes | 18,566,998 | 6,059,331 | 82,065,630 | 73,455,817 | ||||||||||||
| Income tax expense | 4,287,103 | (488,553 | ) | 31,020,607 | 26,765,925 | |||||||||||
| Net income | 14,279,895 | 6,547,884 | 51,045,023 | 46,689,892 | ||||||||||||
| Less: net income attributable to non-controlling interests | 79,604 | 8,663 | 59,410 | 75,617 | ||||||||||||
| Net income attributable to SBC Medical Group Holdings Incorporated | $ | 14,200,291 | $ | 6,539,221 | $ | 50,985,613 | $ | 46,614,275 | ||||||||
| Other comprehensive loss: | ||||||||||||||||
| Foreign currency translation adjustment | $ | (14,589,478 | ) | $ | (18,100,852 | ) | $ | (2,949,843 | ) | $ | (16,557,607 | ) | ||||
| Total comprehensive income (loss) | (309,583 | ) | (11,552,968 | ) | 48,095,180 | 30,132,285 | ||||||||||
| Less: comprehensive income attributable to non-controlling interests | 67,823 | 7,737 | 225,731 | 117,830 | ||||||||||||
| Comprehensive income (loss) attributable to SBC Medical Group Holdings Incorporated | $ | (377,406 | ) | $ | (11,560,705 | ) | $ | 47,869,449 | $ | 30,014,455 | ||||||
| Net income per share attributable to SBC Medical Group Holdings Incorporated | ||||||||||||||||
| Basic and diluted | $ | 0.14 | $ | 0.06 | $ | 0.50 | $ | 0.48 | ||||||||
| Weighted average shares outstanding | ||||||||||||||||
| Basic and diluted | 102,750,816 | 102,997,967 | 96,561,041 | |||||||||||||
SBC MEDICAL GROUP HOLDINGS INCORPORATED
CONSOLIDATED STATEMENTS OF CASH FLOWS
| For the Ended December 31, | ||||||||
| 2025 | 2024 | |||||||
| CASH FLOWS FROM OPERATING ACTIVITIES | ||||||||
| Net income | $ | 51,045,023 | $ | 46,689,892 | ||||
| Adjustments to reconcile net income to net cash provided by operating activities: | ||||||||
| Depreciation and amortization expense | 2,684,300 | 3,799,377 | ||||||
| Non-cash lease expense | 4,698,731 | 3,870,198 | ||||||
| Provision for (reversal of) credit losses | 302,949 | (402,196 | ) | |||||
| Stock-based compensation | — | 13,022,692 | ||||||
| Impairment loss on intangible asset | — | 15,058,965 | ||||||
| Impairment loss on long-term investments | 133,513 | 529,596 | ||||||
| Fair value change of long-term investments | (247,514 | ) | 2,617,435 | |||||
| Gain on disposal of subsidiary | — | (3,813,609 | ) | |||||
| Gain on redemption of life insurance policies | (8,746,138 | ) | — | |||||
| Loss (gain) on disposal of property and equipment and intangible assets | (3,179,200 | ) | 511,947 | |||||
| Gain on previously held equity interest | (815,328 | ) | — | |||||
| Deferred income taxes | 5,326,982 | (14,417,087 | ) | |||||
| Changes in operating assets and liabilities: | ||||||||
| Accounts receivable | (160,963 | ) | (733,219 | ) | ||||
| Accounts receivable - related parties | 1,552,477 | 1,350,413 | ||||||
| Inventories | (170,174 | ) | 1,124,805 | |||||
| Finance lease receivables - related parties | (12,746,857 | ) | (5,991,486 | ) | ||||
| Customer loans receivable | 15,821,375 | 18,477,327 | ||||||
| Prepaid expenses and other current assets | 332,264 | (2,268,209 | ) | |||||
| Long-term prepayments | 318,470 | 1,910,274 | ||||||
| Other assets | (195,846 | ) | (1,692,642 | ) | ||||
| Accounts payable | 2,675,066 | (9,588,067 | ) | |||||
| Accounts payable - related parties | (8,571 | ) | 682,320 | |||||
| Notes payables - related parties | (14,252,502 | ) | (34,756,754 | ) | ||||
| Advances from customers | 604,072 | (1,476,240 | ) | |||||
| Advances from customers - related parties | (6,693,127 | ) | (9,144,031 | ) | ||||
| Income tax payable | (11,662,531 | ) | 11,228,429 | |||||
| Operating lease liabilities | (4,927,460 | ) | (3,950,587 | ) | ||||
| Accrued liabilities and other current liabilities | 2,968,513 | (12,096,825 | ) | |||||
| Other liabilities | 10,972 | 40,215 | ||||||
| NET CASH PROVIDED BY OPERATING ACTIVITIES | 24,668,496 | 20,582,933 | ||||||
| CASH FLOWS FROM INVESTING ACTIVITIES | ||||||||
| Purchase of property and equipment | (1,401,012 | ) | (2,564,643 | ) | ||||
| Purchase of convertible note | — | (1,700,000 | ) | |||||
| Prepayments for property and equipment | (968,848 | ) | (843,740 | ) | ||||
| Advances to related parties | — | (622,804 | ) | |||||
| Payments made on behalf of related parties | (1,840,801 | ) | (5,572,564 | ) | ||||
| Purchase of short-term investments - related parties | (334,173 | ) | — | |||||
| Purchase of long-term investments | (654,070 | ) | (331,496 | ) | ||||
| (424,250 | ) | — | ||||||
| Proceeds from disposal of cryptocurrencies | 457,828 | — | ||||||
| Purchase of equity method investments | (20,062,642 | ) | — | |||||
| Cash paid for acquisition of subsidiaries, net of cash acquired | (22,941,701 | ) | (4,236,009 | ) | ||||
| Long-term loans to others | (14,514 | ) | (172,411 | ) | ||||
| Repayments from related parties | 1,914,454 | 6,597,564 | ||||||
| Repayment from others | 83,677 | 176,109 | ||||||
| Proceeds from redemption of life insurance policies | 17,735,717 | — | ||||||
| Disposal of subsidiaries, net of cash disposed of | — | (832,416 | ) | |||||
| Proceeds from disposal of property and equipment | 7,478,783 | — | ||||||
| NET CASH PROVIDED USED IN INVESTING ACTIVITIES | (20,971,552 | ) | (10,102,410 | ) | ||||
| CASH FLOWS FROM FINANCING ACTIVITIES | ||||||||
| Borrowings from bank and others | 34,753,946 | 6,603,253 | ||||||
| Borrowings from related parties | 15,000 | 5,481,787 | ||||||
| Proceeds from reverse recapitalization, net of transaction costs | — | 11,707,417 | ||||||
| Proceeds from exercise of stock warrants | — | 31,374 | ||||||
| Repayments of bank and other borrowings | (1,353,071 | ) | (119,017 | ) | ||||
| Repayments of finance lease liabilities | (331,365 | ) | — | |||||
| Repayments to related parties | (145,917 | ) | (739,414 | ) | ||||
| Repurchase of common stock | (4,999,997 | ) | — | |||||
| Deemed contribution in connection with price modification on disposal of property and equipment | 10,353,587 | — | ||||||
| NET CASH PROVIDED BY FINANCING ACTIVITIES | 38,292,183 | 22,965,400 | ||||||
| Effect of exchange rate changes | (3,259,381 | ) | (11,424,763 | ) | ||||
| NET CHANGE IN CASH AND CASH EQUIVALENTS | 38,729,746 | 22,021,160 | ||||||
| CASH AND CASH EQUIVALENTS AS OF THE BEGINNING OF THE YEAR | 125,044,092 | 103,022,932 | ||||||
| CASH AND CASH EQUIVALENTS AS OF THE END OF THE YEAR | $ | 163,773,838 | $ | 125,044,092 | ||||
| SUPPLEMENTAL DISCLOSURE OF CASH FLOW INFORMATION | ||||||||
| Cash paid for interest expense | $ | 160,583 | $ | 28,300 | ||||
| Cash paid for income | $ | 37,190,188 | $ | 30,239,002 | ||||
| NON-CASH INVESTING AND FINANCING ACTIVITIES | ||||||||
| Property and equipment transferred from long-term prepayments | $ | 1,493,450 | $ | 597,602 | ||||
| Operating lease right-of-use assets obtained in exchange for operating lease liabilities | $ | 1,322,455 | $ | — | ||||
| Finance lease right-of-use assets obtained in exchange for finance lease liabilities | $ | 612,466 | $ | — | ||||
| Remeasurement of operating lease liabilities and right-of-use assets due to lease modifications | $ | 5,302,043 | $ | 2,908,554 | ||||
| Payables to related parties in connection with loan services provided | $ | 14,219,401 | $ | 20,524,499 | ||||
| Issuance of common stock as incentive shares | $ | 86 | $ | — | ||||
| Issuance of common stock from conversion of convertible note | $ | — | $ | 2,700,000 | ||||
| Deemed contribution in connection with disposal of subsidiaries | $ | — | $ | 1,473,571 | ||||
RECONCILIATION OF GAAP TO NON-GAAP FINANCIAL MEASURES
SBC MEDICAL GROUP HOLDINGS INCORPORATED
Unaudited Reconciliations of GAAP and Non-GAAP Results
| For the Three Months Ended December 31, | For the December 31, | |||||||||||||||
| 2025 | 2024 | 2025 | 2024 | |||||||||||||
| Total Revenues, net | $ | 39,566,706 | $ | 44,420,537 | $ | 173,607,489 | $ | 205,415,542 | ||||||||
| Income from operations | 12,848,892 | 4,717,662 | 67,486,398 | 70,303,710 | ||||||||||||
| Depreciation and amortization expense | 673,684 | 931,596 | 2,684,300 | 3,799,377 | ||||||||||||
| Impairment loss | — | 15,058,965 | — | 15,058,965 | ||||||||||||
| EBITDA | 13,522,576 | 20,708,223 | 70,170,698 | 89,162,052 | ||||||||||||
| EBITDA margin | 34 | % | 47 | % | 40 | % | 43 | % | ||||||||
| Net income margin | 36 | % | 15 | % | 29 | % | 23 | % | ||||||||
Contacts
SBC Medical Group Holdings Incorporated
Hikaru Fukui / Head of IR Department E-mail: [email protected]
Exhibit 99.2