Exhibit 99.1
SBC Medical Group Holdings Announces Third Quarter 2025 Financial Results
IRVINE, Calif. --SBC Medical Group Holdings Incorporated (Nasdaq: SBC) (“SBC Medical” or the “Company”), a global provider of comprehensive consulting and management services to the medical corporations and their clinics, today announced its financial results for the third quarter of fiscal year 2025 (three months ended September 30, 2025) and for the third quarter cumulative of fiscal year 2025 (Year-to-Date 2025, nine months ended September 30, 2025)
Third Quarter 2025 Highlights
•Total revenues were $43 million, representing an 18% year-over-year decrease.
•Income from operations was $16 million, representing a 15% year-over-year increase.
•Net Income attributable to SBC Medical Group was $13 million , representing an 353% year-over-year increase.
•Earnings per share, which is defined as net income attributable to the Company divided by the weighted average number of outstanding shares, was $0.12 for the three months ended September 30, 2025, compared to $0.03 in the same period of 2024.
•EBITDA1, which is calculated by adding depreciation and amortization expense and impairment loss to income from operations was $17 million, representing a 12% year-over-year increase. EBITDA margin1 was 38% for the third quarter of 2025, compared to 28% for third quarter of 2024.
•Return on equity, which is defined as net income attributable to the Company divided by the average shareholder’s equity as of September 30, 2025, was 23% representing a year-over-year increase of 17 percentage points.
•Number of Franchise Locations2 was 258 as of September 30, 2025, representing an increase of 34 locations from September 30, 2024.
•Number of customers3 in the last twelve months ended September 30, 2025, was 6.5 million, representing a 14% year-over-year increase.
•Repeat rate for customers4 who visited franchisee’s clinics twice or more was 72%.
1 EBITDA and EBITDA Margin are non-GAAP financial measures. For more information on non-GAAP financial measures, please see the section “Use of Non-GAAP Financial Measures” and the table captioned “Unaudited Reconciliations of GAAP and Non-GAAP Results.”
2 The figures take into accounts of the franchising of SBC brand clinics, Rize Clinic, Gorilla Clinic, AHH, JUN CLINIC
3 The customer count includes customers of SBC brand clinics, Rize Clinic, Gorilla Clinic, AHH Clinic, and JUN CLINIC. The applicable periods are from October 1, 2024, to September 30, 2025.
4 The figures include franchising of SBC brand clinics, Rize Clinic, and Gorilla Clinic, but does not take account of customers of AHH clinics and JUN CLINIC excluding free counseling. The percentage of customers who visited our franchisee’s clinics twice or more.
Year-to-Date 2025 Highlights
•Total revenues were $134 million, representing a 17% year-over-year decrease.
•Income from operations was $55 million, representing a 17% year-over-year decrease.
•Net Income attributable to SBC Medical Group was $37 million, representing a 8% year-over-year decrease.
•Earnings per share, which is defined as net income attributable to the Company divided by the weighted average number of outstanding shares, was $0.36 for the nine months ended September 30, 2025, compared to $0.42 in the same period of 2024.
•EBITDA1, which is calculated by adding depreciation and amortization expense and impairment loss to income from operations was $57 million, representing a 17% year-over-year decrease. EBITDA margin was 42% for the first nine months of 2025, compared to 43% for the same period in 2024.
Yoshiyuki Aikawa, Chairman and Chief Executive Officer of SBC Medical, said, "In Q3 2025, SBC Medical’s revenue decreased by 18% year over year. This decline primarily reflects the impact of our past business restructuring initiatives, including the revision of franchise fees and the deconsolidation of certain group entities. Meanwhile, rental revenue remained solid, supported by the renewal of medical equipment, and the consolidation of AHH contributed positively to overall performance.
Profitability improved significantly during the quarter. Income from operations increased by 15% year over year, net profit rose by 353%, and income from operations margin strengthened to 37%. These improvements were mainly driven by the absence of IPO-related and stock-based compensation expenses recorded in the prior year, indicating that our cost structure is normalizing toward a sustainable level.
Looking ahead, we will continue to pursue sustainable growth toward 2026 by focusing on delivering high-quality solutions, advancing multi-brand initiatives in the dermatology segment, and building a stronger business foundation in overseas markets.”
Third Quarter 2025 Financial Results
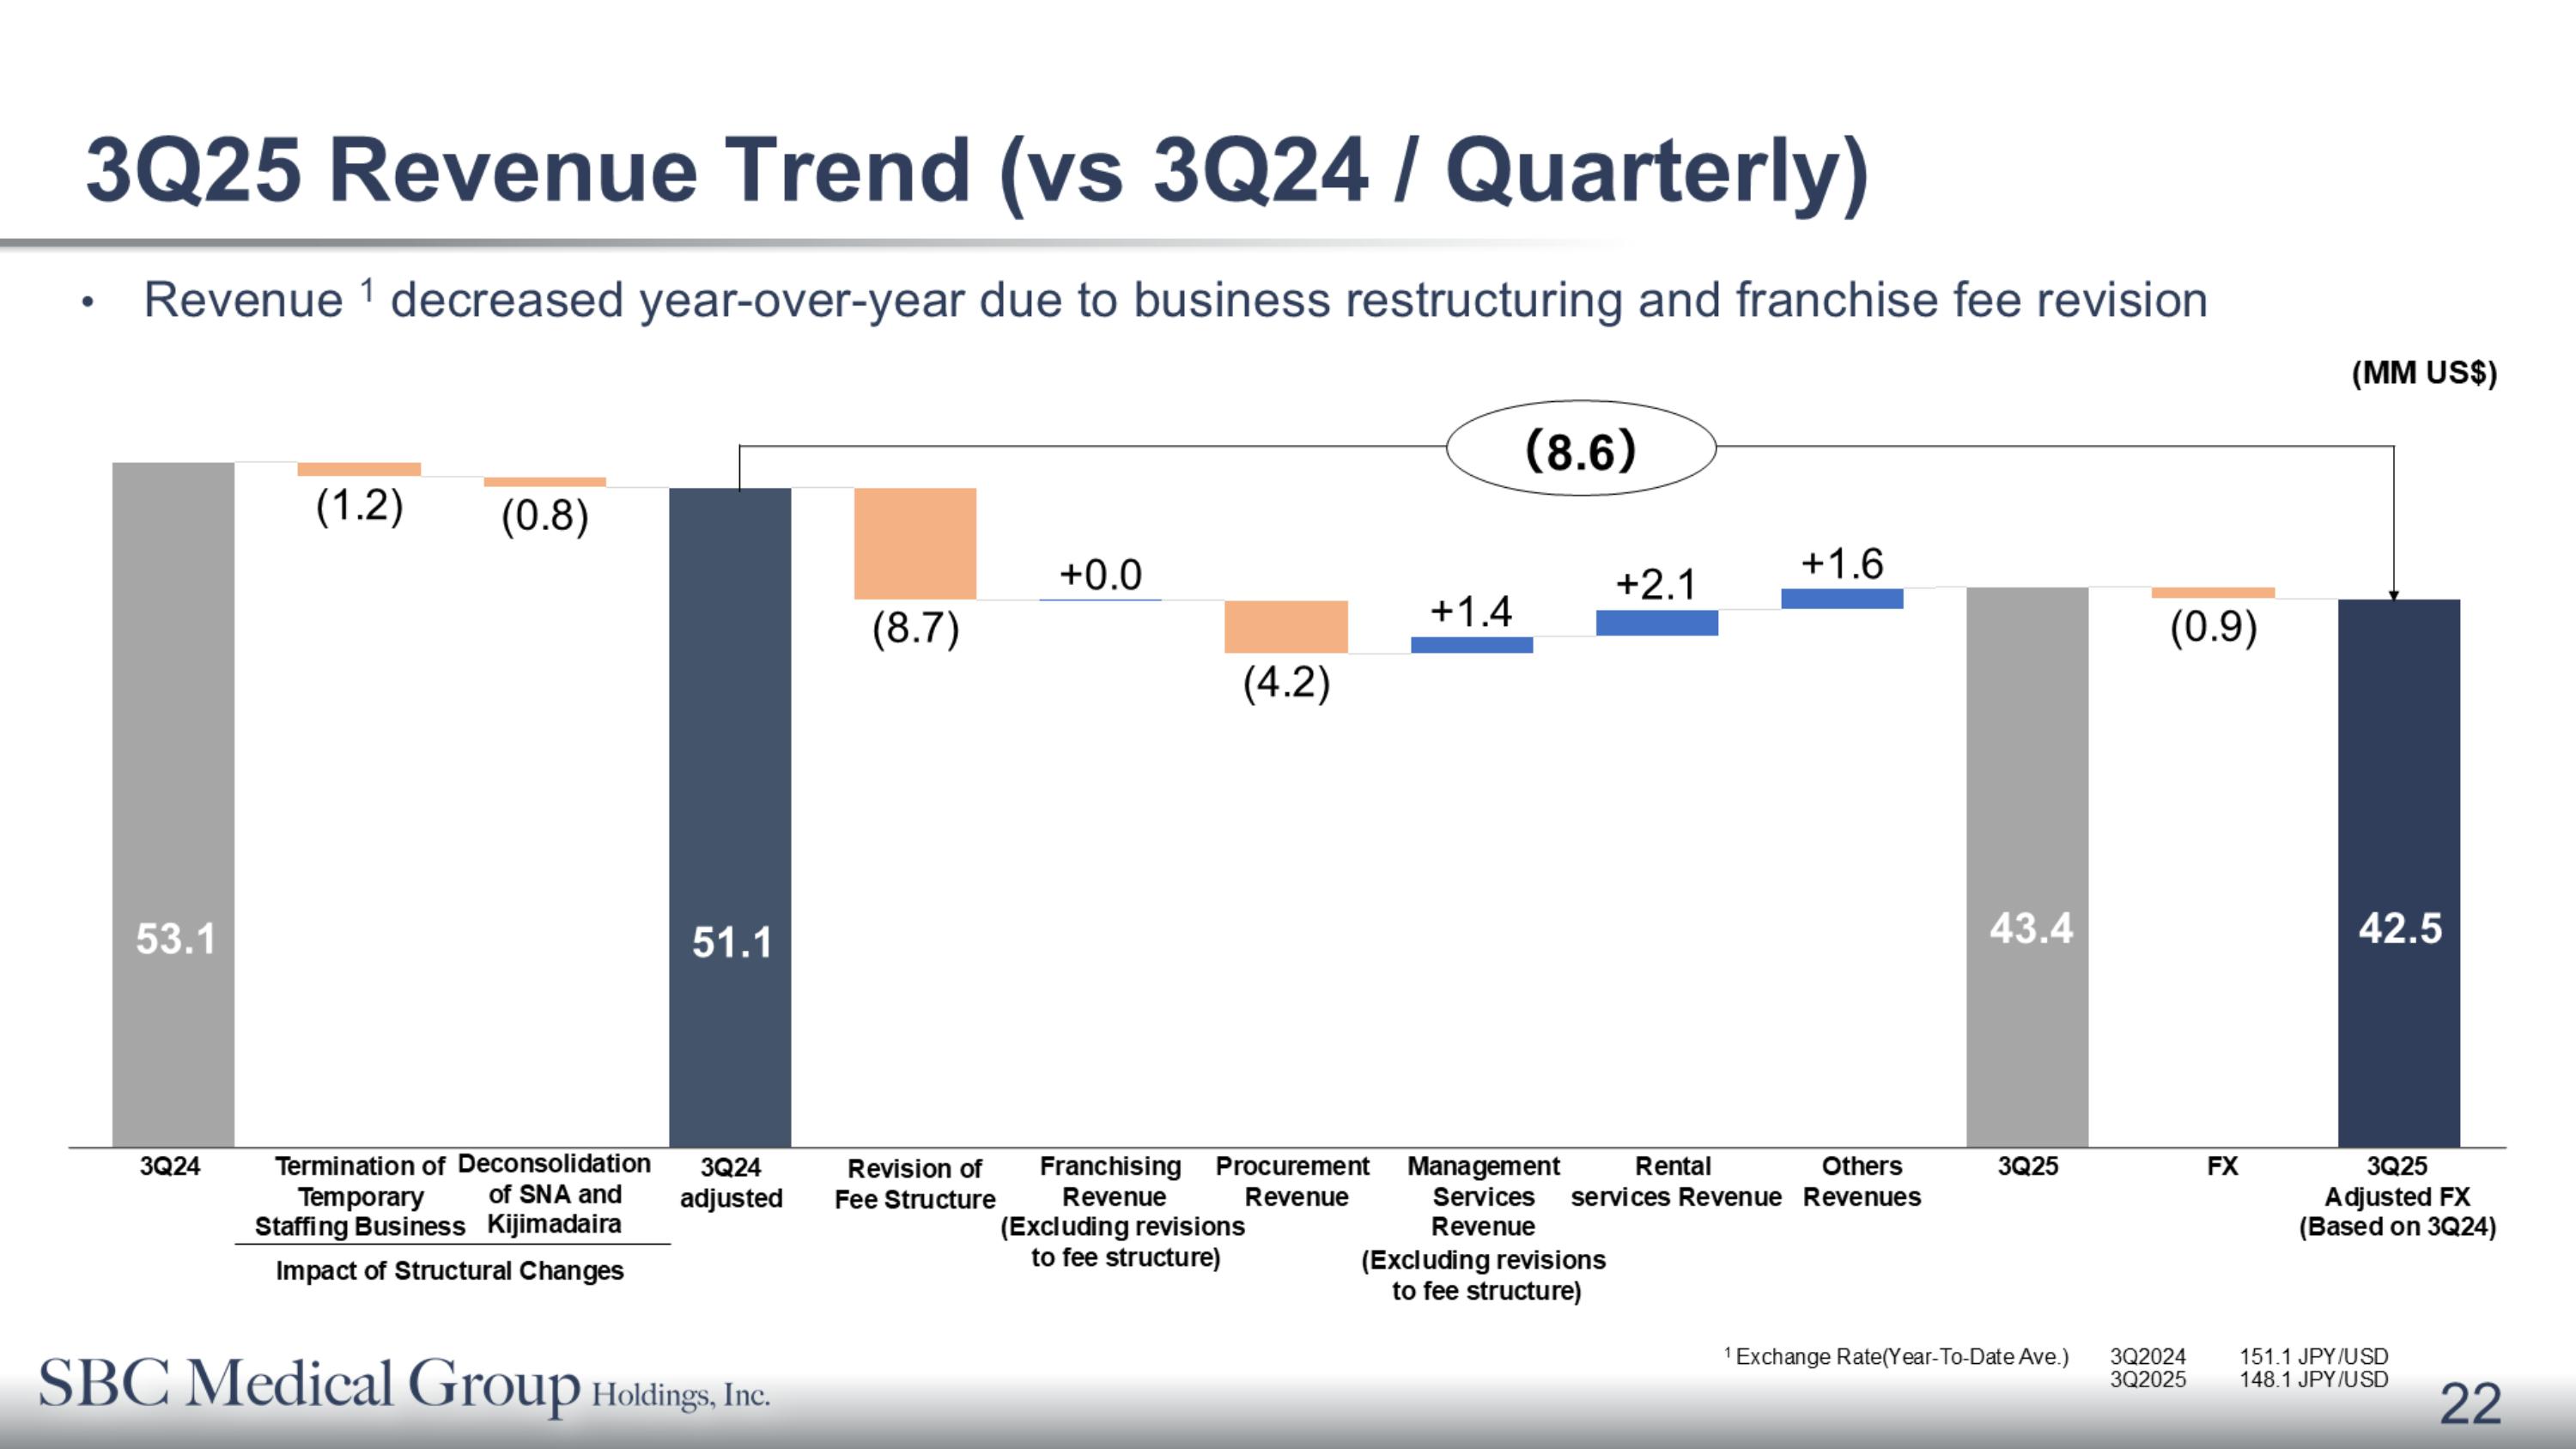
Total revenues were $43 million, representing a decrease of 18% year-over-year. The decrease was primarily driven by a revised fee structure for clinic services that reduced franchising revenue, combined with decreased procurement revenue due to reduced orders for medical materials and lower management services revenue due to the discontinuation of clinic operation staff supporting services.
Net income attributable to SBC Medical Group for the three months ended September 30, 2025 was $13 million, compared to $3 million in the same period of 2024. The increase was primarily due to substantially lower operating expenses due to the absence of stock-based compensation costs related to the prior year's listing process and reduced income tax expense from the absence of non-deductible stock-based compensation.
EBITDA1 was $17 million, an increase of 12% , primarily due to the lower operating expenses offsetting the decrease in revenue from the termination of staffing services, deconsolidation of Kijimadairakanko Inc. and Skynet Academy Co., Ltd., and fee structure revision.
Conference Call
The Company will hold a conference call on Monday, November 17, 2025 at 5 pm Eastern Time (or Monday, November 18, 2025 at 7 am Japan Time) to discuss the financial results and take questions live.
Please register in advance of the conference using the link provided below.
https://edge.media-server.com/mmc/p/e2znwqtx/
It will automatically direct you to the registration page of “Q3 2025 Financial Results”. Please follow the steps to enter your registration details, then click “Submit.”. Upon registration, you will be able to access the dedicated Conference Call viewing site. In addition to viewing the conference call, this site provides access to information about the speakers as well as past investor relations materials.
Starting 10 minutes before the conference call begins, you will be able to view the earnings presentation materials on the site. The materials will also be available for download.
A replay of the conference call will be accessible until November 17, 2026.
Additionally, the earnings release, accompanying slides, and an archived webcast of this conference call will be available at the Company’s Investor Relations website at https://ir.sbc-holdings.com/
About SBC Medical
SBC Medical Group Holdings Incorporated is a comprehensive medical group operating a wide range of franchise businesses across diverse medical fields, including advanced aesthetic medicine, dermatology, orthopedics, fertility treatment, dentistry, AGA (hair restoration), and ophthalmology. The Company manages a diverse portfolio of clinic brands and is actively expanding its global presence, particularly in the United States and Asia, through both direct operations and medical tourism initiatives.
In September 2024, the Company was listed on Nasdaq, and in June 2025, it was selected for inclusion in the Russell 3000® Index, a broad benchmark of the U.S. equity market. Guided by its Group Purpose “Contributing to the well-being of people around the world through medical innovation,” SBC Medical Group Holdings Incorporated continues to provide safe, trusted, and high-quality medical services while steadily expanding its global network.
For more information, visit https://sbc-holdings.com/
Use of Non-GAAP Financial Measures
The Company uses non-GAAP measures, such as EBITDA and EBITDA margin, in evaluating its operating results and for financial and operational decision-making purposes. The Company believes that the non-GAAP financial measures help identify underlying trends in its business. The Company believes that the non-GAAP financial measures provide useful information about the Company’s results of operations, enhance the overall understanding of the Company’s past performance and future prospects and allow for greater visibility with respect to key metrics used by the Company’s management in its financial and operational decision-making.
The non-GAAP financial measures are not defined under U.S. GAAP and are not presented in accordance with U.S. GAAP. The non-GAAP financial measures have limitations as analytical tools, and when assessing the Company’s operating performance, cash flows or liquidity, investors should not consider them in isolation, or as a substitute for net loss, cash flows provided by operating activities or other consolidated statements of operations and cash flows data prepared in accordance with U.S. GAAP.
The Company mitigates these limitations by reconciling the non-GAAP financial measures to the most comparable U.S. GAAP performance measures, all of which should be considered when evaluating the Company’s performance.
For more information on the non-GAAP financial measures, please see the table captioned “Unaudited Reconciliations of GAAP and Non-GAAP Results.”
Forward Looking Statements
This press release contains forward-looking statements. Forward-looking statements are not historical facts or statements of current conditions, but instead represent only the Company’s beliefs regarding future events and performance, many of which, by their nature, are inherently uncertain and outside of the Company’s control. These forward-looking statements reflect the Company’s current views with respect to, among other things, the Company’s financial performance; growth in revenue and earnings; business prospects and opportunities; and capital deployment plans and liquidity. In some cases, forward-looking statements can be identified by the use of words such as “may,” “should,” “expects,” “anticipates,” “contemplates,” “estimates,” “believes,” “plans,” “projected,” “predicts,” “potential,” or “hopes” or the negative of these or similar terms. The Company cautions readers not to place undue reliance upon any forward-looking statements, which are current only as of the date of this release and are subject to various risks, uncertainties, assumptions, or changes in circumstances that are difficult to predict or quantify. The forward-looking statements are based on management’s current expectations and are not guarantees of future performance. The Company does not undertake or accept any obligation to release publicly any updates or revisions to any forward-looking statements to reflect any change in its expectations or any change in events, conditions, or circumstances on which any such statement is based, except as required by law. Factors that may cause actual results to differ materially from current expectations may emerge from time to time, and it is not possible for the Company to predict all of them; such factors include, among other things, changes in global, regional, or local economic, business, competitive, market and regulatory conditions, and those listed under the heading “Risk Factors” and elsewhere in the Company’s filings with the U.S. Securities and Exchange Commission (the “SEC”), which are accessible on the SEC’s website at www.sec.gov.
SBC MEDICAL GROUP HOLDINGS INCORPORATED
UNAUDITED CONSOLIDATED BALANCE SHEETS
|
|
|
|
|
|
|
|
|
|
|
September 30,
2025 |
|
|
December 31,
2024 |
|
ASSETS |
|
|
|
|
|
|
Current assets: |
|
|
|
|
|
|
Cash and cash equivalents |
|
$ |
127,431,318 |
|
|
$ |
125,044,092 |
|
Accounts receivable |
|
|
2,609,108 |
|
|
|
1,413,433 |
|
Accounts receivable – related parties |
|
|
58,585,273 |
|
|
|
28,846,680 |
|
Inventories |
|
|
1,677,668 |
|
|
|
1,494,891 |
|
Finance lease receivables, current – related parties |
|
|
9,757,901 |
|
|
|
5,992,585 |
|
Income tax recoverable |
|
|
841,677 |
|
|
|
— |
|
Customer loans receivable, current |
|
|
11,593,195 |
|
|
|
10,382,537 |
|
Prepaid expenses and other current assets |
|
|
14,707,082 |
|
|
|
11,276,802 |
|
Total current assets |
|
|
227,203,222 |
|
|
|
184,451,020 |
|
|
|
|
|
|
|
|
Non-current assets: |
|
|
|
|
|
|
Property and equipment, net |
|
|
6,995,263 |
|
|
|
8,771,902 |
|
Intangible assets, net |
|
|
23,302,796 |
|
|
|
1,590,052 |
|
Long-term investments, net |
|
|
4,608,439 |
|
|
|
3,049,972 |
|
Goodwill, net |
|
|
4,924,699 |
|
|
|
4,613,784 |
|
Cryptocurrencies |
|
|
570,286 |
|
|
|
— |
|
Finance lease receivables, non-current – related parties |
|
|
14,709,715 |
|
|
|
8,397,582 |
|
Operating lease right-of-use assets |
|
|
4,886,486 |
|
|
|
5,267,056 |
|
Finance lease right-of-use assets |
|
|
478,742 |
|
|
|
— |
|
Deferred tax assets |
|
|
607,731 |
|
|
|
9,798,071 |
|
Customer loans receivable, non-current |
|
|
6,553,611 |
|
|
|
5,023,551 |
|
Long-term prepayments |
|
|
396,242 |
|
|
|
1,745,801 |
|
Long-term investments in MCs – related parties |
|
|
18,869,390 |
|
|
|
17,820,910 |
|
Other assets |
|
|
7,256,463 |
|
|
|
15,553,453 |
|
Total non-current assets |
|
|
94,159,863 |
|
|
|
81,632,134 |
|
Total assets |
|
$ |
321,363,085 |
|
|
$ |
266,083,154 |
|
|
|
|
|
|
|
|
LIABILITIES AND STOCKHOLDERS’ EQUITY |
|
|
|
|
|
|
|
|
|
|
|
|
|
Current liabilities: |
|
|
|
|
|
|
Accounts payable |
|
$ |
17,258,372 |
|
|
$ |
13,875,179 |
|
Accounts payable – related parties |
|
|
2,842,877 |
|
|
|
659,044 |
|
Current portion of long-term loans |
|
|
3,044,470 |
|
|
|
96,824 |
|
Notes and other payables, current – related parties |
|
|
1,637,370 |
|
|
|
26,255 |
|
Advances from customers |
|
|
1,030,416 |
|
|
|
820,898 |
|
Advances from customers – related parties |
|
|
6,957,477 |
|
|
|
11,739,533 |
|
Income tax payable |
|
|
766,796 |
|
|
|
18,705,851 |
|
Operating lease liabilities, current |
|
|
3,545,667 |
|
|
|
4,341,522 |
|
Finance lease liabilities, current |
|
|
147,603 |
|
|
|
— |
|
Accrued liabilities and other current liabilities |
|
|
4,561,978 |
|
|
|
8,103,194 |
|
Due to related party |
|
|
2,791,808 |
|
|
|
2,823,590 |
|
Total current liabilities |
|
|
44,584,834 |
|
|
|
61,191,890 |
|
|
|
|
|
|
|
|
Non-current liabilities: |
|
|
|
|
|
|
Long-term loans |
|
|
18,078,324 |
|
|
|
6,502,682 |
|
Notes and other payables, non-current – related parties |
|
|
— |
|
|
|
5,334 |
|
Deferred tax liabilities |
|
|
7,769,090 |
|
|
|
926,023 |
|
Operating lease liabilities, non-current |
|
|
1,564,370 |
|
|
|
1,241,526 |
|
Finance lease liabilities, non-current |
|
|
136,677 |
|
|
|
— |
|
Other liabilities |
|
|
1,170,589 |
|
|
|
1,193,541 |
|
Total non-current liabilities |
|
|
28,719,050 |
|
|
|
9,869,106 |
|
Total liabilities |
|
|
73,303,884 |
|
|
|
71,060,996 |
|
SBC MEDICAL GROUP HOLDINGS INCORPORATED
UNAUDITED CONSOLIDATED BALANCE SHEETS — (Continued)
|
|
|
|
|
|
|
|
|
|
|
September 30,
2025 |
|
|
December 31,
2024 |
|
|
|
|
|
|
|
|
Stockholders’ equity: |
|
|
|
|
|
|
Preferred stock ($0.0001 par value, 20,000,000 shares authorized; no shares issued and outstanding as of September 30, 2025 and December 31, 2024) |
|
|
— |
|
|
|
— |
|
Common stock ($0.0001 par value, 400,000,000 shares authorized, 103,881,251 and 103,020,816 shares issued, 102,576,943 and 102,750,816 shares outstanding as of September 30, 2025 and December 31, 2024, respectively) |
|
|
10,388 |
|
|
|
10,302 |
|
Additional paid-in capital |
|
|
72,196,114 |
|
|
|
62,513,923 |
|
Treasury stock (at cost, 1,304,308 and 270,000 shares as of September 30, 2025 and December 31, 2024, respectively) |
|
|
(7,749,997 |
) |
|
|
(2,700,000 |
) |
Retained earnings |
|
|
226,248,329 |
|
|
|
189,463,007 |
|
Accumulated other comprehensive loss |
|
|
(42,716,542 |
) |
|
|
(54,178,075 |
) |
Total SBC Medical Group Holdings Incorporated stockholders’ equity |
|
|
247,988,292 |
|
|
|
195,109,157 |
|
Non-controlling interests |
|
|
70,909 |
|
|
|
(86,999 |
) |
Total stockholders’ equity |
|
|
248,059,201 |
|
|
|
195,022,158 |
|
Total liabilities and stockholders’ equity |
|
$ |
321,363,085 |
|
|
$ |
266,083,154 |
|
The accompanying notes are an integral part of these unaudited consolidated financial statements.
SBC MEDICAL GROUP HOLDINGS INCORPORATED
UNAUDITED CONSOLIDATED STATEMENTS OF OPERATIONS AND COMPREHENSIVE INCOME
|
|
|
|
|
|
|
|
|
|
|
|
|
|
|
|
|
|
|
For the Three Months
Ended September 30, |
|
|
For the Nine Months
Ended September 30, |
|
|
|
2025 |
|
|
2024 |
|
|
2025 |
|
|
2024 |
|
Revenues, net – related parties |
|
$ |
39,617,548 |
|
|
$ |
51,209,243 |
|
|
$ |
123,819,591 |
|
|
$ |
152,718,488 |
|
Revenues, net |
|
|
3,735,687 |
|
|
|
1,875,640 |
|
|
|
10,221,192 |
|
|
|
8,276,517 |
|
Total revenues, net |
|
|
43,353,235 |
|
|
|
53,084,883 |
|
|
|
134,040,783 |
|
|
|
160,995,005 |
|
Cost of revenues (including cost of revenues from related parties of $4,018,377 and $2,039,492 for the three months ended September 30, 2025 and 2024, and $12,144,907 and $7,452,954 for the nine months ended September 30, 2025 and 2024, respectively) |
|
|
12,741,748 |
|
|
|
9,845,793 |
|
|
|
35,685,635 |
|
|
|
38,816,865 |
|
Gross profit |
|
|
30,611,487 |
|
|
|
43,239,090 |
|
|
|
98,355,148 |
|
|
|
122,178,140 |
|
|
|
|
|
|
|
|
|
|
|
|
|
|
Operating expenses: |
|
|
|
|
|
|
|
|
|
|
|
|
Selling, general and administrative expenses (including selling, general and administrative expenses from related parties of $154,063 and nil for the three months ended September 30, 2025 and 2024, and $569,830 and nil for the nine months ended September 30, 2025 and 2024, respectively) |
|
|
14,730,247 |
|
|
|
16,597,032 |
|
|
|
43,717,642 |
|
|
|
43,784,637 |
|
Stock-based compensation |
|
|
— |
|
|
|
12,807,455 |
|
|
|
— |
|
|
|
12,807,455 |
|
Total operating expenses |
|
|
14,730,247 |
|
|
|
29,404,487 |
|
|
|
43,717,642 |
|
|
|
56,592,092 |
|
|
|
|
|
|
|
|
|
|
|
|
|
|
Income from operations |
|
|
15,881,240 |
|
|
|
13,834,603 |
|
|
|
54,637,506 |
|
|
|
65,586,048 |
|
|
|
|
|
|
|
|
|
|
|
|
|
|
Other income (expenses): |
|
|
|
|
|
|
|
|
|
|
|
|
Interest income |
|
|
120,384 |
|
|
|
7,950 |
|
|
|
198,599 |
|
|
|
37,283 |
|
Interest expense |
|
|
(48,635 |
) |
|
|
(5,466 |
) |
|
|
(104,493 |
) |
|
|
(15,898 |
) |
Other income (including other income from related party of $3,069 and nil for the three months ended September 30, 2025 and 2024, and $3,069 and nil for the nine months ended September 30, 2025 and 2024, respectively) |
|
|
2,526,035 |
|
|
|
65,922 |
|
|
|
2,711,134 |
|
|
|
721,894 |
|
Other expenses |
|
|
(6,564 |
) |
|
|
(795,158 |
) |
|
|
(2,836,288 |
) |
|
|
(2,746,450 |
) |
Gain on redemption of life insurance policies |
|
|
— |
|
|
|
— |
|
|
|
8,746,138 |
|
|
|
— |
|
Change in fair value of cryptocurrencies |
|
|
34,404 |
|
|
|
— |
|
|
|
146,036 |
|
|
|
— |
|
Gain on disposal of subsidiary |
|
|
— |
|
|
|
— |
|
|
|
— |
|
|
|
3,813,609 |
|
Total other income (expenses) |
|
|
2,625,624 |
|
|
|
(726,752 |
) |
|
|
8,861,126 |
|
|
|
1,810,438 |
|
|
|
|
|
|
|
|
|
|
|
|
|
|
Income before income taxes |
|
|
18,506,864 |
|
|
|
13,107,851 |
|
|
|
63,498,632 |
|
|
|
67,396,486 |
|
|
|
|
|
|
|
|
|
|
|
|
|
|
Income tax expense |
|
|
5,673,538 |
|
|
|
10,273,384 |
|
|
|
26,733,504 |
|
|
|
27,254,478 |
|
|
|
|
|
|
|
|
|
|
|
|
|
|
Net income |
|
|
12,833,326 |
|
|
|
2,834,467 |
|
|
|
36,765,128 |
|
|
|
40,142,008 |
|
Less: net income (loss) attributable to non-controlling interests |
|
|
8,690 |
|
|
|
1,573 |
|
|
|
(20,194 |
) |
|
|
66,954 |
|
Net income attributable to SBC Medical Group Holdings Incorporated |
|
$ |
12,824,636 |
|
|
$ |
2,832,894 |
|
|
$ |
36,785,322 |
|
|
$ |
40,075,054 |
|
|
|
|
|
|
|
|
|
|
|
|
|
|
Other comprehensive income (loss): |
|
|
|
|
|
|
|
|
|
|
|
|
Foreign currency translation adjustment |
|
$ |
(6,791,961 |
) |
|
$ |
20,783,646 |
|
|
$ |
11,639,635 |
|
|
$ |
1,543,245 |
|
Total comprehensive income |
|
|
6,041,365 |
|
|
|
23,618,113 |
|
|
|
48,404,763 |
|
|
|
41,685,253 |
|
Less: comprehensive income attributable to non-controlling interests |
|
|
10,329 |
|
|
|
180,093 |
|
|
|
157,908 |
|
|
|
110,093 |
|
Comprehensive income attributable to SBC Medical Group Holdings Incorporated |
|
$ |
6,031,036 |
|
|
$ |
23,438,020 |
|
|
$ |
48,246,855 |
|
|
$ |
41,575,160 |
|
|
|
|
|
|
|
|
|
|
|
|
|
|
Net income per share attributable to SBC Medical Group Holdings Incorporated |
|
|
|
|
|
|
|
|
|
|
|
|
Basic and diluted |
|
$ |
0.12 |
|
|
$ |
0.03 |
|
|
$ |
0.36 |
|
|
$ |
0.42 |
|
Weighted average shares outstanding |
|
|
|
|
|
|
|
|
|
|
|
|
Basic and diluted |
|
|
102,642,634 |
|
|
|
95,095,144 |
|
|
|
103,139,851 |
|
|
|
94,495,533 |
|
The accompanying notes are an integral part of these unaudited consolidated financial statements.
SBC MEDICAL GROUP HOLDINGS INCORPORATED
UNAUDITED CONSOLIDATED STATEMENTS OF CASH FLOWS
|
|
|
|
|
|
|
|
|
|
|
For the Nine Months
Ended September 30, |
|
|
|
2025 |
|
|
2024 |
|
CASH FLOWS FROM OPERATING ACTIVITIES |
|
|
|
|
|
|
Net income |
|
$ |
36,765,128 |
|
|
$ |
40,142,008 |
|
Adjustments to reconcile net income to net cash provided by (used in) operating activities: |
|
|
|
|
|
|
Depreciation and amortization expense |
|
|
2,010,616 |
|
|
|
2,867,781 |
|
Non-cash lease expense |
|
|
3,436,789 |
|
|
|
2,908,990 |
|
Provision for (reversal of) credit losses |
|
|
305,963 |
|
|
|
(127,196 |
) |
Stock-based compensation |
|
|
— |
|
|
|
12,807,455 |
|
Fair value change of long-term investments |
|
|
(724,476 |
) |
|
|
1,682,282 |
|
Gain on disposal of subsidiary |
|
|
— |
|
|
|
(3,813,609 |
) |
Gain on redemption of life insurance policies |
|
|
(8,746,138 |
) |
|
|
— |
|
Loss (gain) on disposal of property and equipment and intangible assets |
|
|
(414,167 |
) |
|
|
185,284 |
|
Change in fair value of cryptocurrencies |
|
|
(146,036 |
) |
|
|
— |
|
Deferred income taxes |
|
|
9,104,235 |
|
|
|
(2,154,837 |
) |
Changes in operating assets and liabilities: |
|
|
|
|
|
|
Accounts receivable |
|
|
(1,084,316 |
) |
|
|
(804,000 |
) |
Accounts receivable - related parties |
|
|
(28,031,690 |
) |
|
|
4,971,911 |
|
Inventories |
|
|
265,052 |
|
|
|
763,075 |
|
Finance lease receivables - related parties |
|
|
(9,227,612 |
) |
|
|
(3,430,267 |
) |
Customer loans receivable |
|
|
12,153,263 |
|
|
|
12,860,220 |
|
Prepaid expenses and other current assets |
|
|
(2,180,695 |
) |
|
|
902,230 |
|
Long-term prepayments |
|
|
281,666 |
|
|
|
432,380 |
|
Other assets |
|
|
77,609 |
|
|
|
(348,178 |
) |
Accounts payable |
|
|
2,549,938 |
|
|
|
(10,511,619 |
) |
Accounts payable - related parties |
|
|
2,144,314 |
|
|
|
— |
|
Notes and other payables - related parties |
|
|
(12,759,536 |
) |
|
|
(14,030,092 |
) |
Advances from customers |
|
|
161,165 |
|
|
|
(1,401,437 |
) |
Advances from customers - related parties |
|
|
(5,470,844 |
) |
|
|
(3,565,778 |
) |
Income tax payable |
|
|
(19,936,155 |
) |
|
|
(549,446 |
) |
Operating lease liabilities |
|
|
(3,639,887 |
) |
|
|
(2,971,946 |
) |
Accrued liabilities and other current liabilities |
|
|
(4,096,471 |
) |
|
|
(9,010,270 |
) |
Other liabilities |
|
|
(93,141 |
) |
|
|
81,290 |
|
NET CASH PROVIDED BY (USED IN) OPERATING ACTIVITIES |
|
|
(27,295,426 |
) |
|
|
27,886,231 |
|
|
|
|
|
|
|
|
CASH FLOWS FROM INVESTING ACTIVITIES |
|
|
|
|
|
|
Purchase of property and equipment |
|
|
(603,484 |
) |
|
|
(1,974,285 |
) |
Purchase of convertible note |
|
|
— |
|
|
|
(1,700,000 |
) |
Prepayments for property and equipment |
|
|
(838,568 |
) |
|
|
(843,740 |
) |
Advances to related parties |
|
|
— |
|
|
|
(617,804 |
) |
Payments made on behalf of related parties |
|
|
(1,840,801 |
) |
|
|
(5,245,990 |
) |
Purchase of long-term investments |
|
|
(654,070 |
) |
|
|
(331,496 |
) |
Purchase of cryptocurrencies |
|
|
(424,250 |
) |
|
|
— |
|
Cash paid for acquisition of subsidiary, net of cash acquired |
|
|
(14,861,858 |
) |
|
|
— |
|
Long-term loans to others |
|
|
(14,514 |
) |
|
|
(80,793 |
) |
Repayments from related parties |
|
|
1,911,440 |
|
|
|
5,990,990 |
|
Repayments from others |
|
|
73,928 |
|
|
|
62,927 |
|
Proceeds from redemption of life insurance policies |
|
|
17,735,717 |
|
|
|
— |
|
Disposal of subsidiary, net of cash disposed of |
|
|
— |
|
|
|
(815,819 |
) |
Proceeds from disposal of property and equipment |
|
|
2,755,983 |
|
|
|
1,971 |
|
NET CASH PROVIDED BY (USED IN) INVESTING ACTIVITIES |
|
|
3,239,523 |
|
|
|
(5,554,039 |
) |
|
|
|
|
|
|
|
SBC MEDICAL GROUP HOLDINGS INCORPORATED
UNAUDITED CONSOLIDATED STATEMENTS OF CASH FLOWS — (Continued)
|
|
|
|
|
|
|
|
|
|
|
For the Nine Months
Ended September 30, |
|
CASH FLOWS FROM FINANCING ACTIVITIES |
|
|
|
|
|
|
Borrowings from long-term loans |
|
|
14,851,980 |
|
|
|
— |
|
Borrowings from related parties |
|
|
15,000 |
|
|
|
— |
|
Proceeds from reverse recapitalization, net of transaction costs |
|
|
— |
|
|
|
11,707,417 |
|
Proceeds from exercise of stock warrants |
|
|
— |
|
|
|
31,374 |
|
Repayments of long-term loans |
|
|
(721,874 |
) |
|
|
(89,448 |
) |
Repayments of finance lease liabilities |
|
|
(310,603 |
) |
|
|
— |
|
Repayments to related parties |
|
|
(46,782 |
) |
|
|
(65,305 |
) |
Repurchase of common stock |
|
|
(4,999,997 |
) |
|
|
— |
|
Deemed contribution in connection with price modification on disposal of property and equipment |
|
|
9,682,277 |
|
|
|
— |
|
NET CASH PROVIDED BY FINANCING ACTIVITIES |
|
|
18,470,001 |
|
|
|
11,584,038 |
|
|
|
|
|
|
|
|
Effect of exchange rate changes |
|
|
7,973,128 |
|
|
|
453,908 |
|
|
|
|
|
|
|
|
NET CHANGE IN CASH AND CASH EQUIVALENTS |
|
|
2,387,226 |
|
|
|
34,370,138 |
|
CASH AND CASH EQUIVALENTS AS OF THE BEGINNING OF THE PERIOD |
|
|
125,044,092 |
|
|
|
103,022,932 |
|
CASH AND CASH EQUIVALENTS AS OF THE END OF THE PERIOD |
|
$ |
127,431,318 |
|
|
$ |
137,393,070 |
|
|
|
|
|
|
|
|
SUPPLEMENTAL DISCLOSURE OF CASH FLOW INFORMATION |
|
|
|
|
|
|
Cash paid for interest expense |
|
$ |
104,493 |
|
|
$ |
15,898 |
|
Cash paid for income taxes, net |
|
$ |
37,555,740 |
|
|
$ |
31,332,123 |
|
|
|
|
|
|
|
|
NON-CASH INVESTING AND FINANCING ACTIVITIES |
|
|
|
|
|
|
Property and equipment transferred from long-term prepayments |
|
$ |
1,428,254 |
|
|
$ |
164,781 |
|
Operating lease right-of-use assets obtained in exchange for operating lease liabilities |
|
$ |
105,556 |
|
|
$ |
— |
|
Finance lease right-of-use assets obtained in exchange for finance lease liabilities |
|
$ |
612,466 |
|
|
$ |
— |
|
Remeasurement of operating lease liabilities and right-of-use assets due to lease modifications |
|
$ |
2,646,028 |
|
|
$ |
2,408,752 |
|
Payables to related parties in connection with loan services provided |
|
$ |
14,362,902 |
|
|
$ |
20,398,301 |
|
Issuance of common stock as incentive shares |
|
$ |
86 |
|
|
$ |
— |
|
Issuance of common stock from conversion of convertible note |
|
$ |
— |
|
|
$ |
2,700,000 |
|
The accompanying notes are an integral part of these unaudited consolidated financial statements.
RECONCILIATION OF GAAP TO NON-GAAP FINANCIAL MEASURES
SBC MEDICAL GROUP HOLDINGS INCORPORATED
Unaudited Reconciliations of GAAP and Non-GAAP Results
|
|
|
|
|
|
|
|
|
|
|
|
|
|
|
|
|
|
|
|
|
|
|
|
|
|
For the Three Months Ended
September 30, |
|
|
|
|
For the Nine Months Ended
September 30, |
|
|
|
|
2025 |
|
|
|
|
2024 |
|
|
|
|
2025 |
|
|
|
2024 |
|
Total Revenues, net |
|
|
$ |
43,353,235 |
|
|
|
|
$ |
53,084,883 |
|
|
|
|
$ |
134,040,783 |
|
|
|
$ |
160,995,005 |
|
Income form operations |
|
|
|
15,881,240 |
|
|
|
|
|
13,834,603 |
|
|
|
|
|
54,637,506 |
|
|
|
|
65,586,048 |
|
Depreciation and amortization expense |
|
|
|
746,211 |
|
|
|
|
|
1,018,359 |
|
|
|
|
|
2,010,616 |
|
|
|
|
2,867,781 |
|
EBITDA |
|
|
|
16,627,451 |
|
|
|
|
|
14,852,962 |
|
|
|
|
|
56,648,122 |
|
|
|
|
68,453,829 |
|
EBITDA margin |
|
|
|
38 |
% |
|
|
|
|
28 |
% |
|
|
|
|
42 |
% |
|
|
|
43 |
% |
The accompanying notes are an integral part of these unaudited consolidated financial statements.
Contacts
SBC Medical Group Holdings Incorporated (Asia)
Hikaru Fukui / Head of IR Department E-mail: [email protected]
ICR LLC (In the US)
Bill Zima / Managing Partner E-mail: [email protected]

Investor Presentation November 2025 3Q2025 Exhibit 99.2
Disclaimer This presentation contains forward-looking statements. Forward-looking statements are not historical facts or statements of current conditions but instead represent only the Company’s beliefs regarding future events and performance, many of which, by their nature, are inherently uncertain and outside of the Company’s control. These forward-looking statements reflect the Company’s current views with respect to, among other things, the Company’s financial performance; growth in revenue and earnings; business prospects and opportunities; and capital deployment plans and liquidity. In some cases, forward-looking statements can be identified by the use of words such as “may,” “should,” “expects,” “anticipates,” “contemplates,” “estimates,” “believes,” “plans,” “projected,” “predicts,” “potential,” or “hopes” or the negative of these or similar terms. The Company cautions readers not to place undue reliance upon any forward-looking statements, which are current only as of the date of this presentation and are subject to various risks, uncertainties, assumptions, or changes in circumstances that are difficult to predict or quantify. The forward-looking statements are based on management’s current expectations and are not guarantees of future performance. The Company does not undertake or accept any obligation to release publicly any updates or revisions to any forward-looking statements to reflect any change in its expectations or any change in events, conditions, or circumstances on which any such statement is based, except as required by law. Factors that may cause actual results to differ materially from current expectations may emerge from time to time, and it is not possible for the Company to predict all of them; such factors include, among other things, changes in global, regional, or local economic, business, competitive, market and regulatory conditions, and those listed under the heading “Risk Factors” and elsewhere in the Company’s filings with the U.S. Securities and Exchange Commission (the “SEC”), which are accessible on the SEC’s website at www.sec.gov.The Company uses non-GAAP measures, such as EBITDA, in evaluating its operating results and for financial and operational decision-making purposes. The Company believes that the non-GAAP financial measures help identify underlying trends in its business. The Company believes that the non-GAAP financial measures provide useful information about the Company’s results of operations, enhance the overall understanding of the Company’s past performance and future prospects and allow for greater visibility with respect to key metrics used by the Company’s management in its financial and operational decision-making. The non-GAAP financial measures are not defined under U.S. GAAP and are not presented in accordance with U.S. GAAP. The non-GAAP financial measures have limitations as analytical tools, and when assessing the Company’s operating performance, cash flows or liquidity, investors should not consider them in isolation, or as a substitute for net loss, cash flows provided by operating activities or other consolidated statements of operations and cash flows data prepared in accordance with U.S. GAAP. The Company mitigates these limitations by reconciling the non-GAAP financial measures to the most comparable U.S. GAAP performance measures, all of which should be considered when evaluating the Company’s performance. For more information on the non-GAAP financial measures, please see the table captioned “Reconciliation Table on Non-GAAP Financials” on the slide titled “Non-GAAP Financial Measure.”
Table of Contents Ⅰ. Franchise Clinic Performance Highlights P4 Ⅱ. Financial Performance P8 Ⅲ. Business Strategies Update P11 Ⅳ. Use of Assets and Capital Strategies P14 Appendix. P17
Ⅰ. Franchise Clinic Performance Highlights
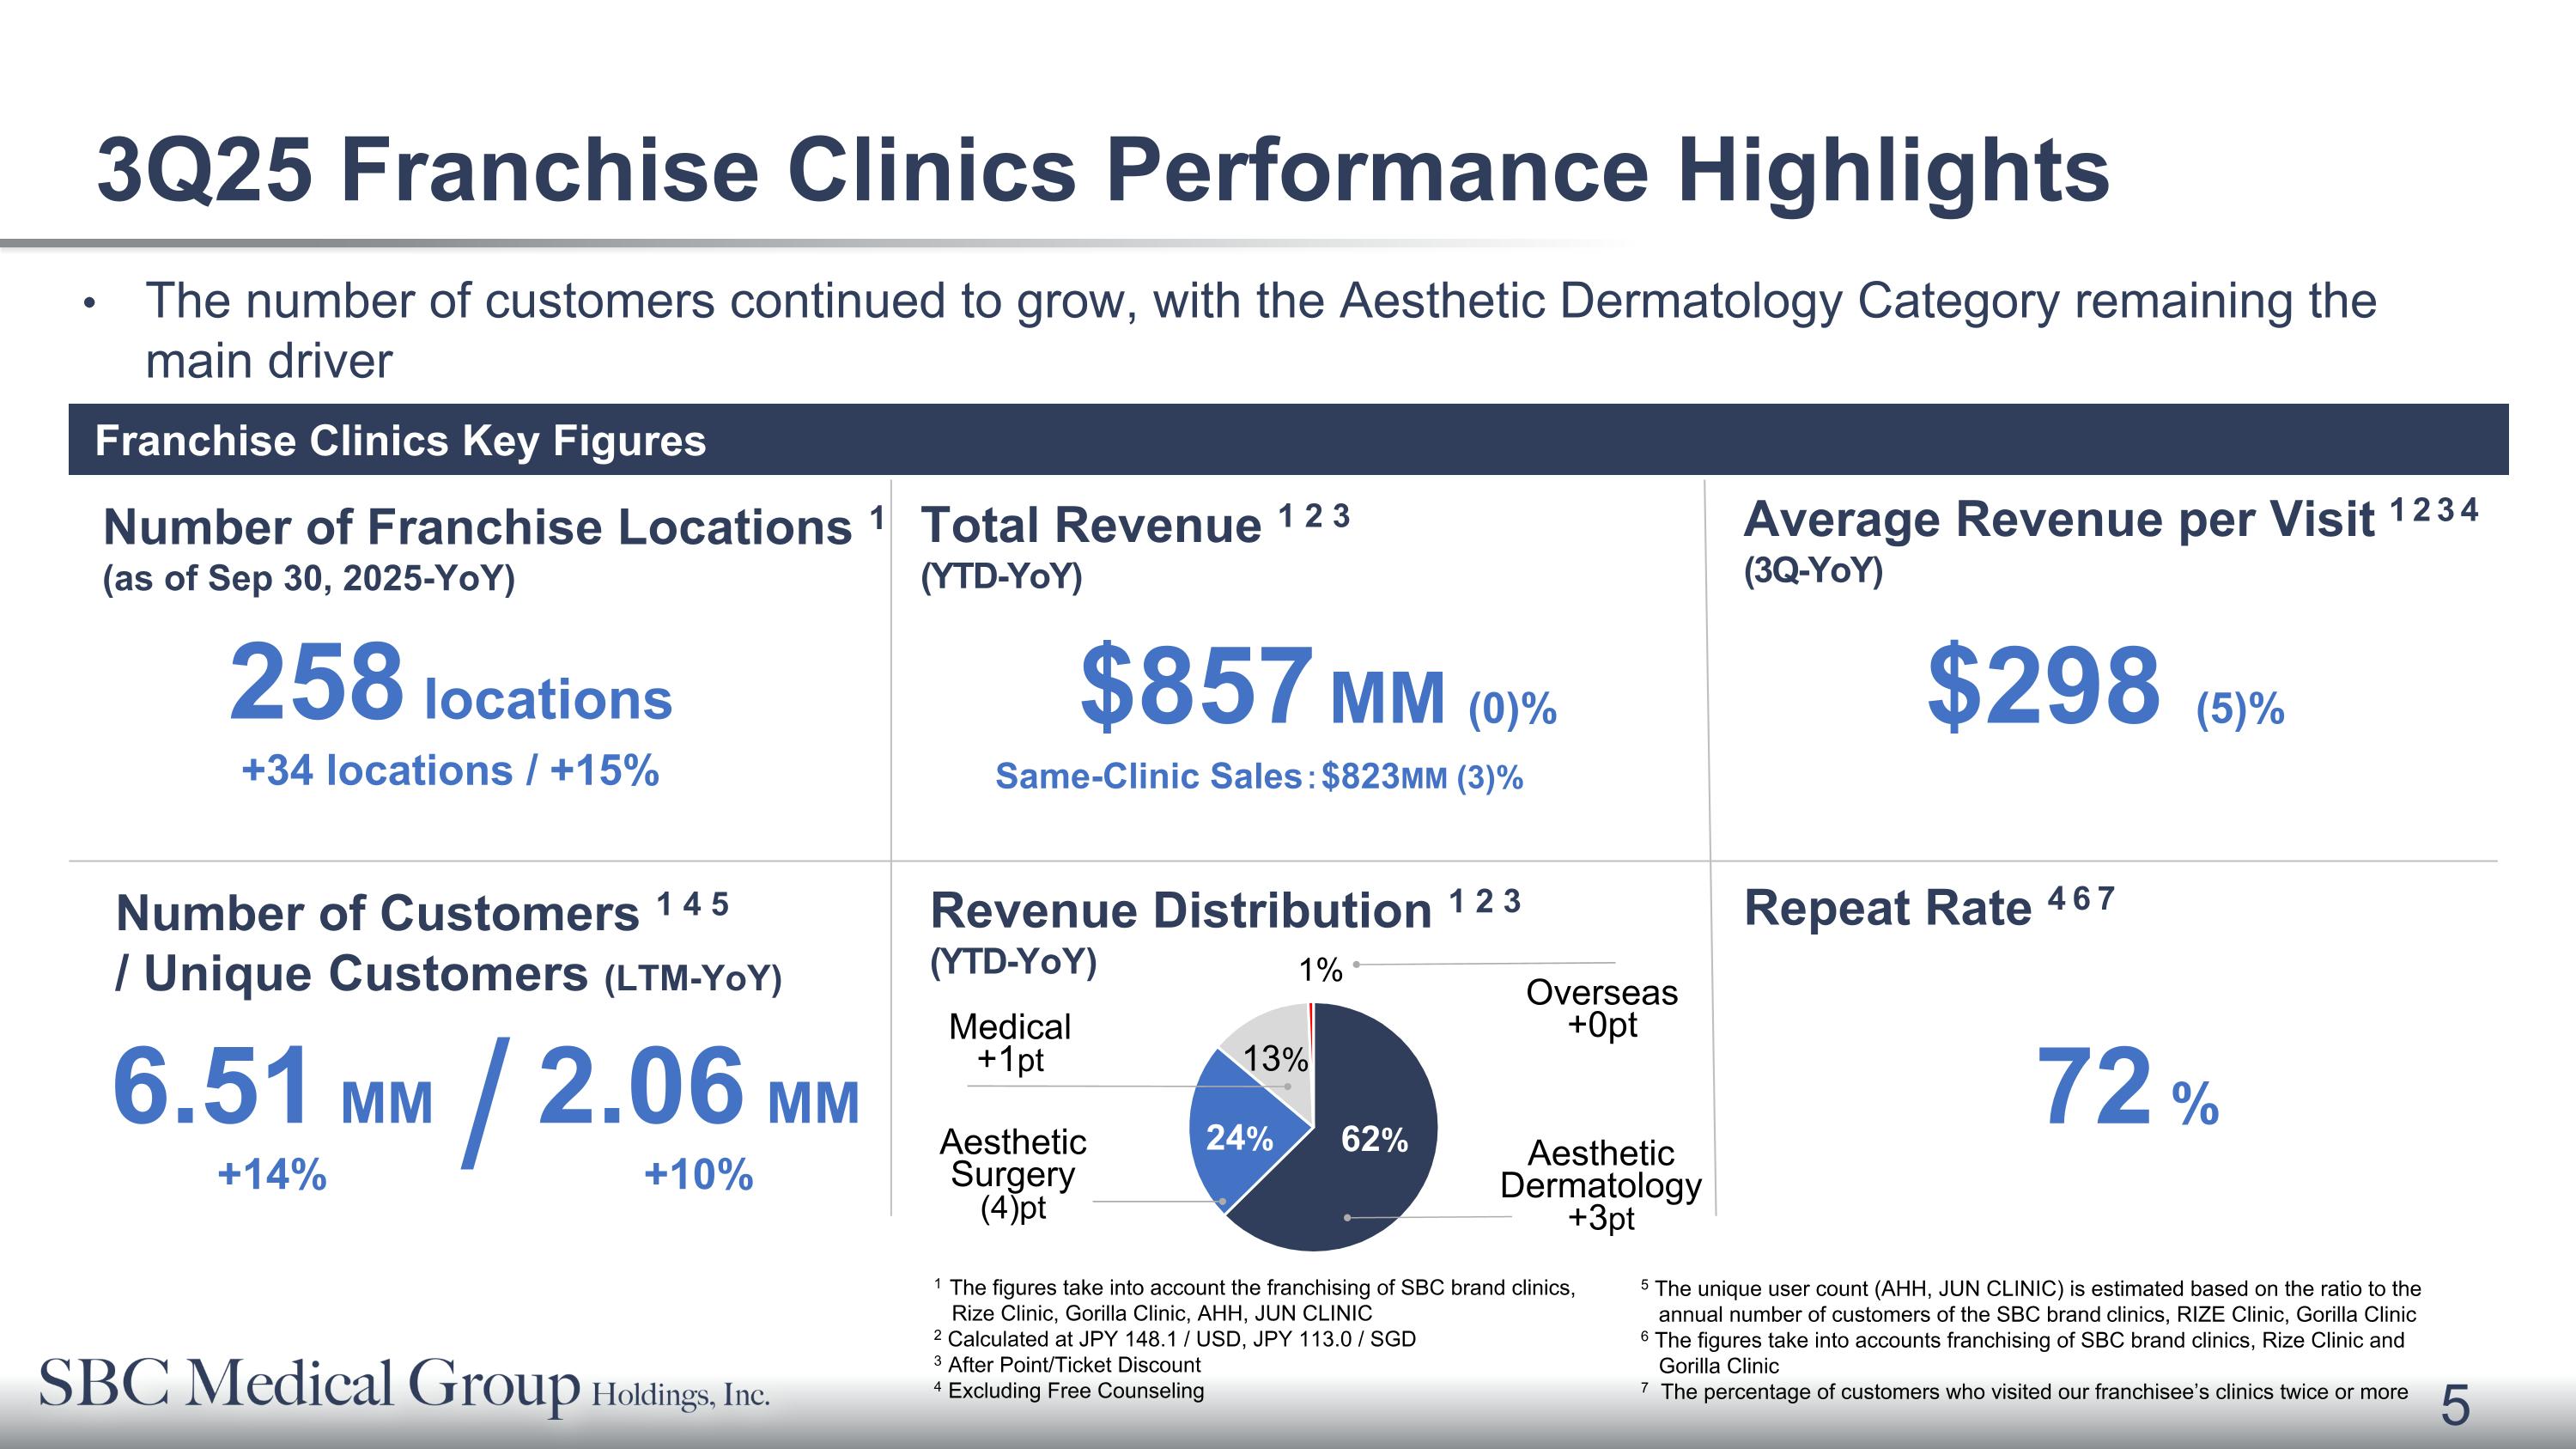
Franchise Clinics Key Figures The number of customers continued to grow, with the Aesthetic Dermatology Category remaining the main driver Repeat Rate 4 6 7 Number of Customers 1 4 5 / Unique Customers (LTM-YoY) 258 locations +34 locations / +15% 6.51 MM +14% Number of Franchise Locations 1 (as of Sep 30, 2025-YoY) Revenue Distribution 1 2 3�(YTD-YoY) Total Revenue 1 2 3 �(YTD-YoY) 2.06 MM +10% / Average Revenue per Visit 1 2 3 4 �(3Q-YoY) $298 (5)% 1 The figures take into account the franchising of SBC brand clinics, � Rize Clinic, Gorilla Clinic, AHH, JUN CLINIC 2 Calculated at JPY 148.1 / USD, JPY 113.0 / SGD 3 After Point/Ticket Discount 4 Excluding Free Counseling $857 MM (0)% Same-Clinic Sales:$823MM (3)% 72 % 62% 24% 13% 1% Medical�+1pt Aesthetic Surgery (4)pt Aesthetic Dermatology�+3pt Overseas�+0pt 5 The unique user count (AHH, JUN CLINIC) is estimated based on the ratio to the annual number of customers of the SBC brand clinics, RIZE Clinic, Gorilla Clinic 6 The figures take into accounts franchising of SBC brand clinics, Rize Clinic and Gorilla Clinic 7 The percentage of customers who visited our franchisee’s clinics twice or more 3Q25 Franchise Clinics Performance Highlights
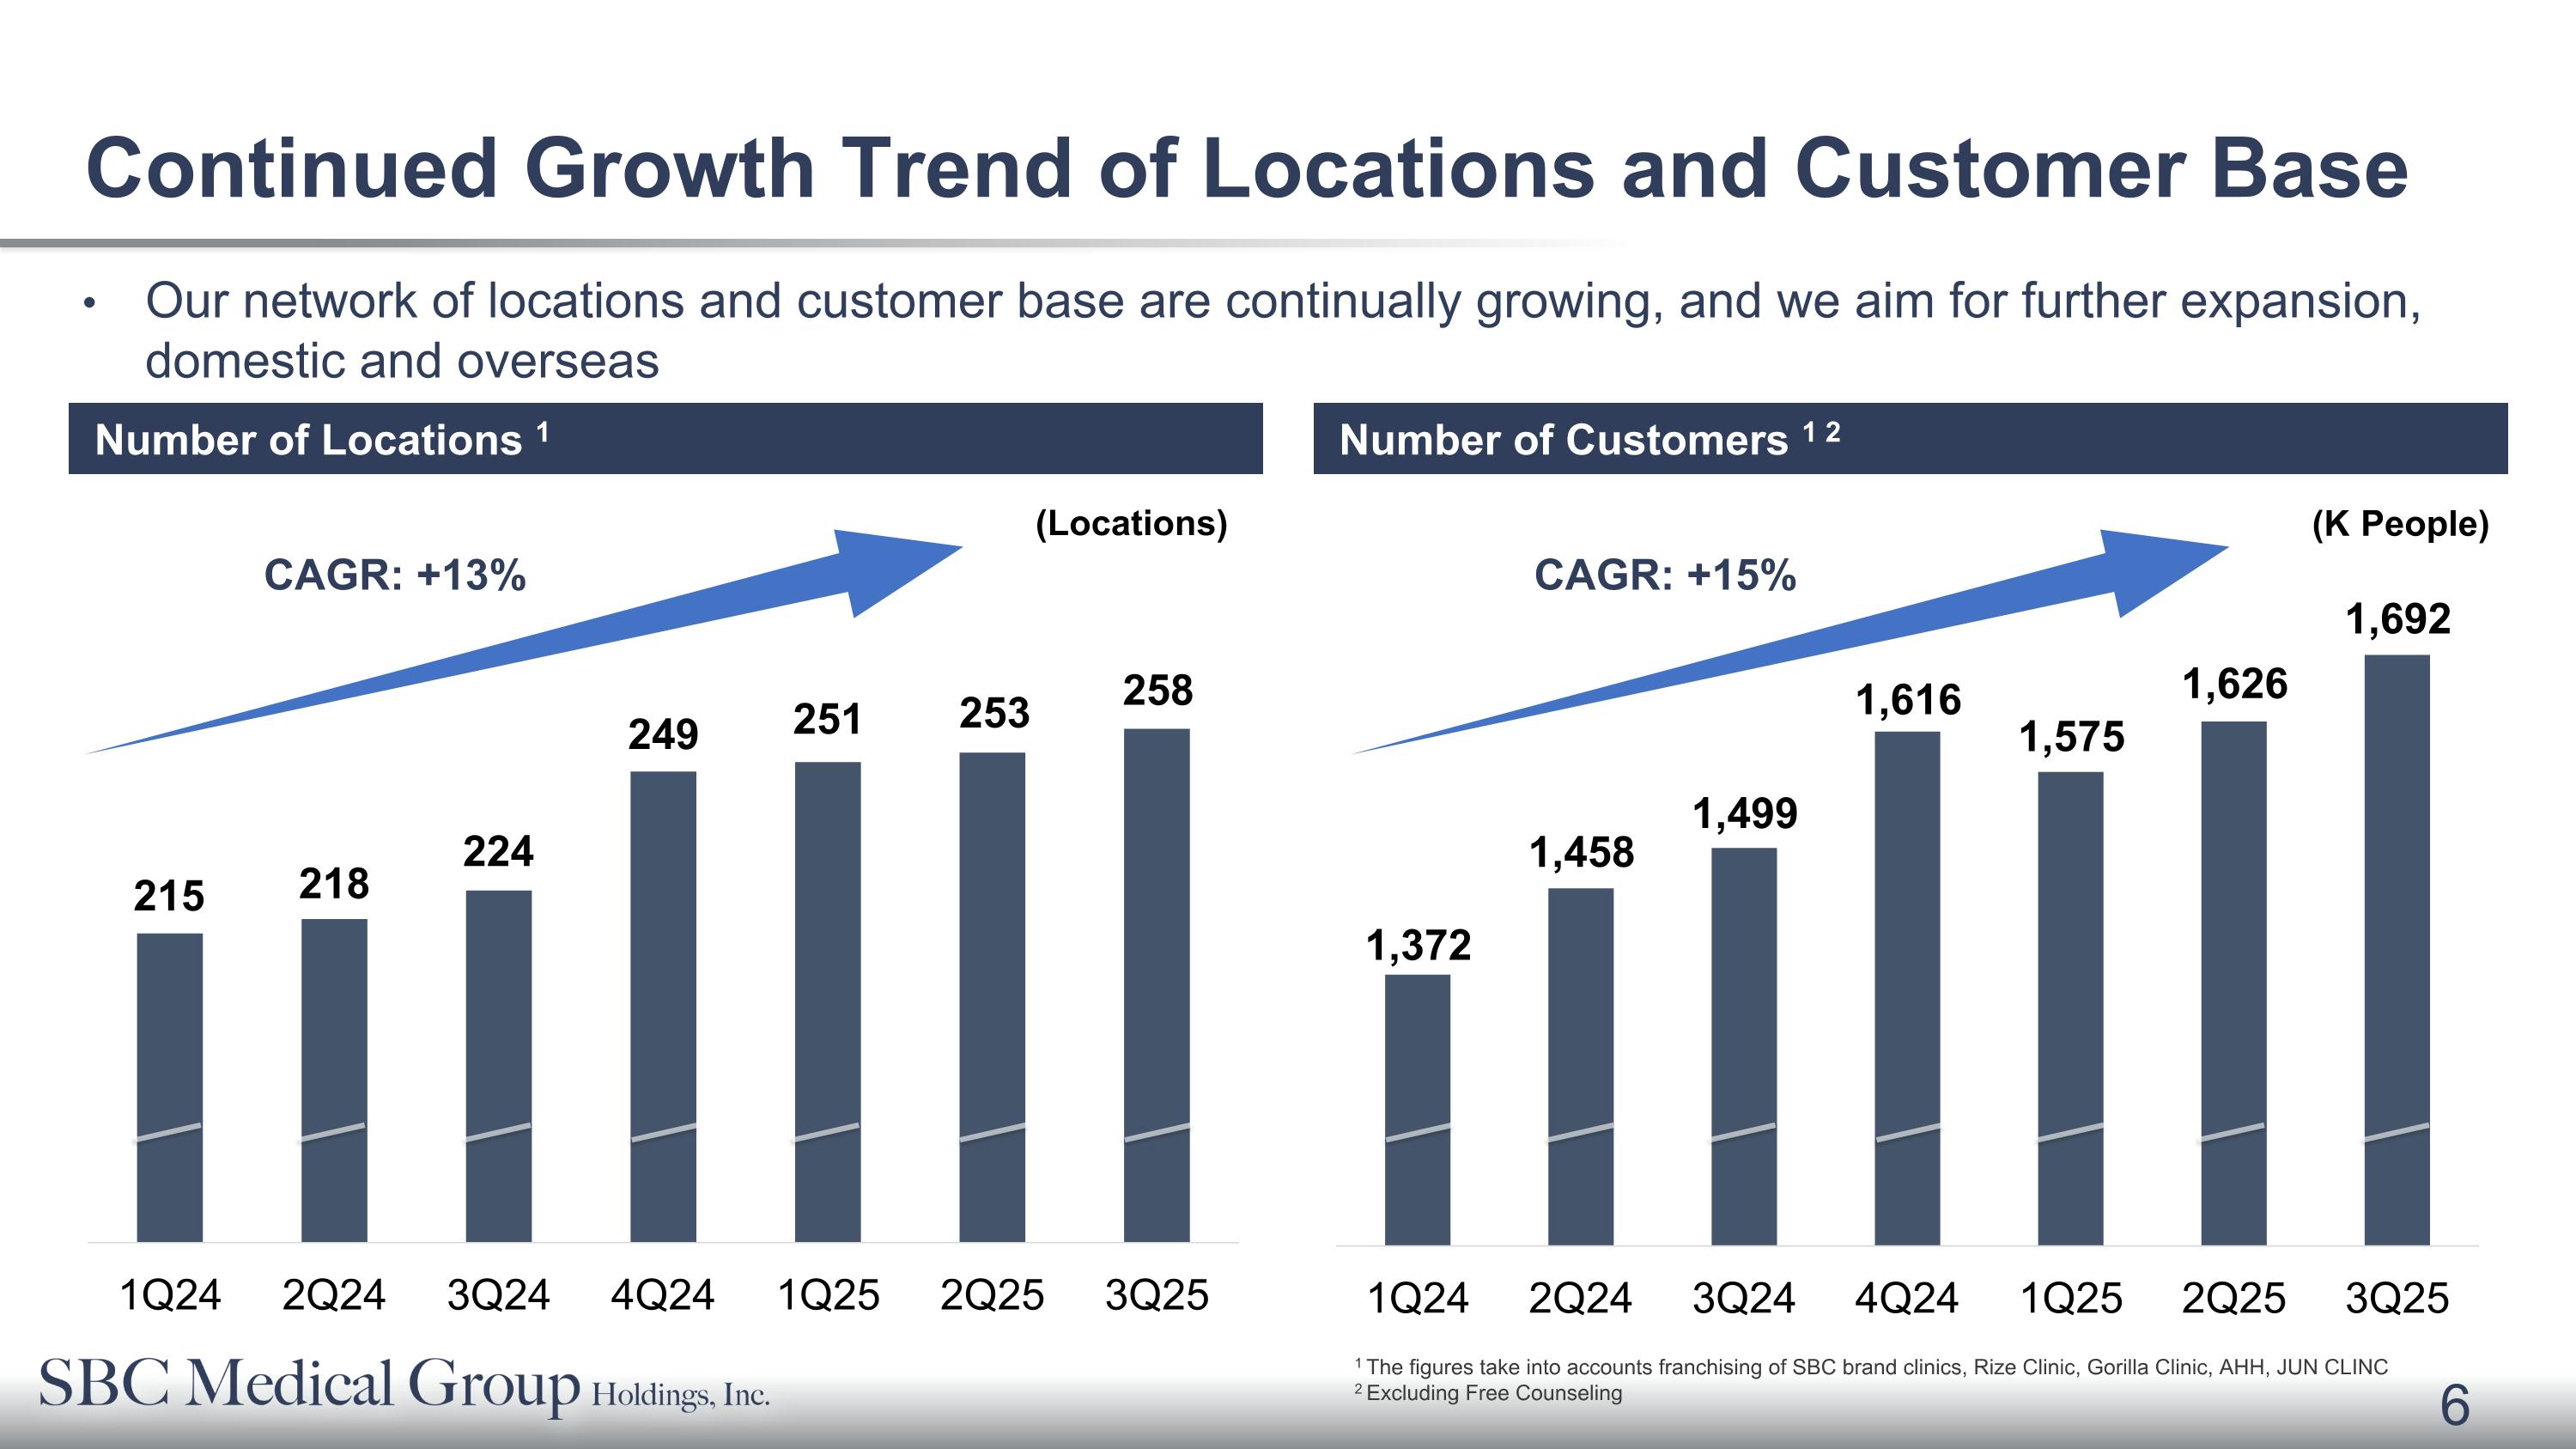
Continued Growth Trend of Locations and Customer Base 1 The figures take into accounts franchising of SBC brand clinics, Rize Clinic, Gorilla Clinic, AHH, JUN CLINC 2 Excluding Free Counseling (Locations) (K People) 215 251 253 249 224 218 258 CAGR: +13% CAGR: +15% Our network of locations and customer base are continually growing, and we aim for further expansion, domestic and overseas Number of Locations 1 Number of Customers 1 2
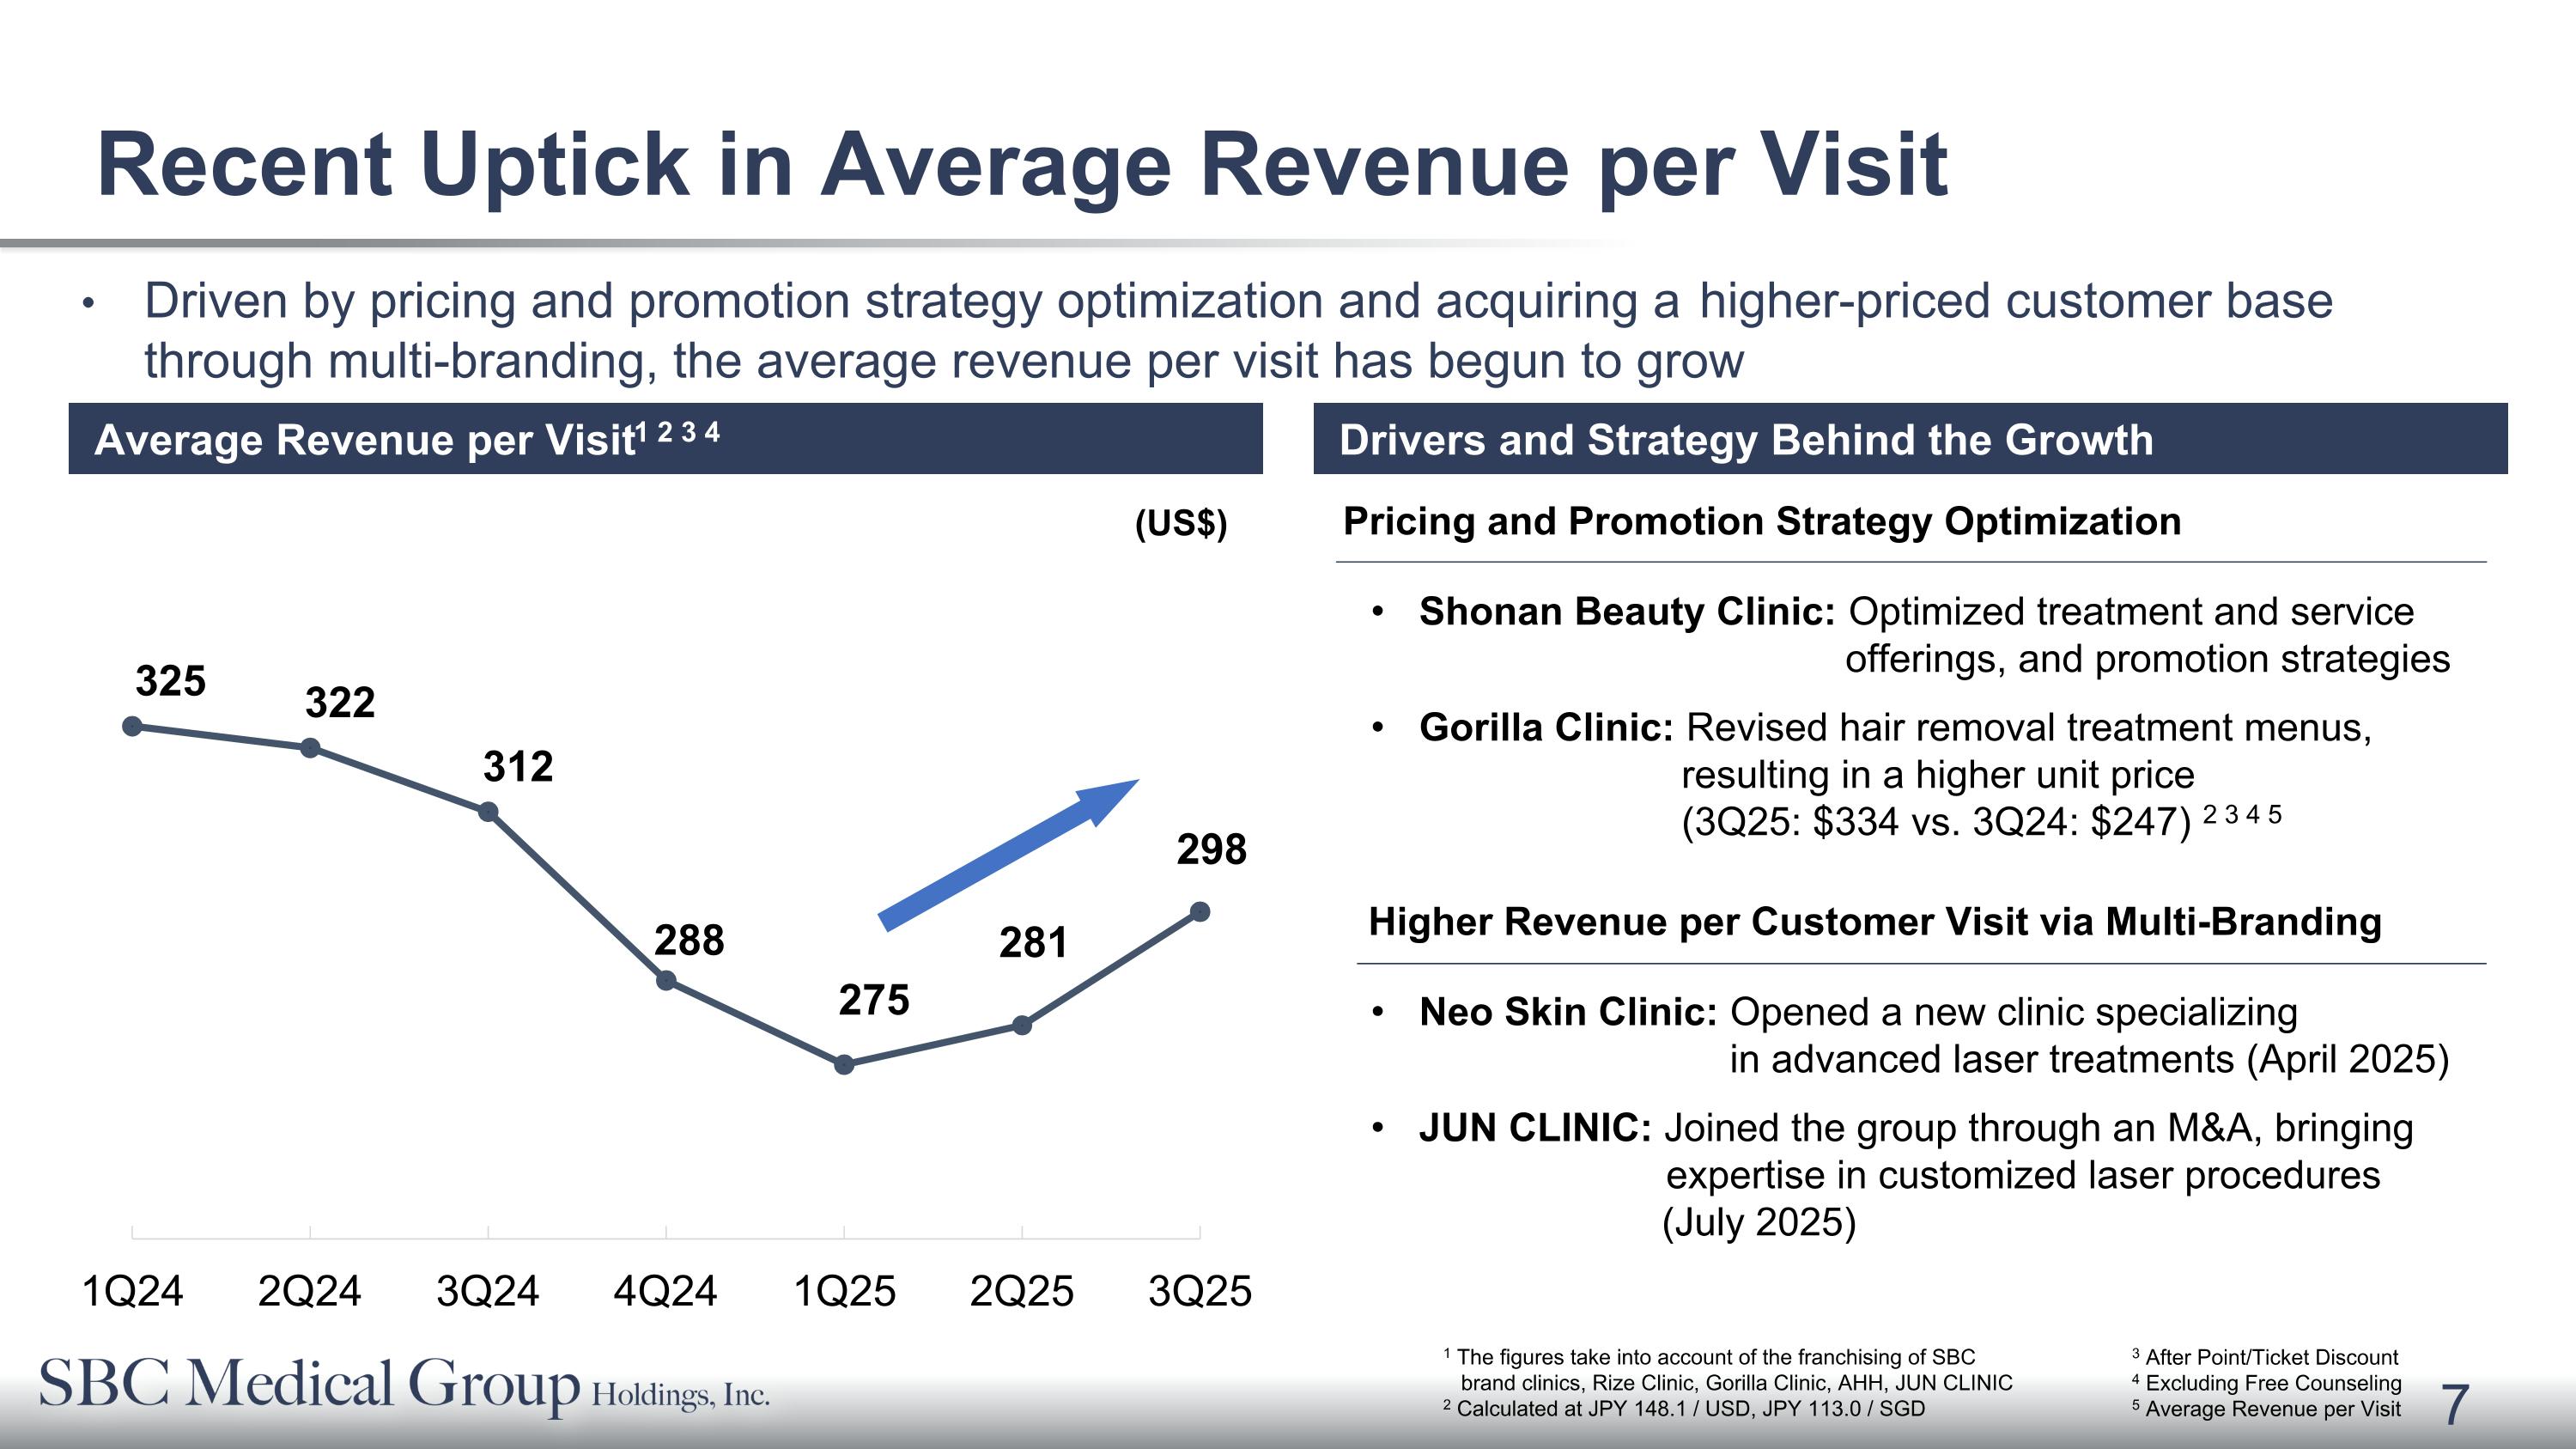
Driven by pricing and promotion strategy optimization and acquiring a higher-priced customer base through multi-branding, the average revenue per visit has begun to grow Recent Uptick in Average Revenue per Visit Pricing and Promotion Strategy Optimization Shonan Beauty Clinic: Optimized treatment and service� offerings, and promotion strategies Gorilla Clinic: Revised hair removal treatment menus, � resulting in a higher unit price � (3Q25: $334 vs. 3Q24: $247) 2 3 4 5 Higher Revenue per Customer Visit via Multi-Branding Neo Skin Clinic: Opened a new clinic specializing � in advanced laser treatments (April 2025) JUN CLINIC: Joined the group through an M&A, bringing expertise in customized laser procedures� (July 2025) 1 The figures take into account of the franchising of SBC brand clinics, Rize Clinic, Gorilla Clinic, AHH, JUN CLINIC 2 Calculated at JPY 148.1 / USD, JPY 113.0 / SGD 3 After Point/Ticket Discount 4 Excluding Free Counseling 5 Average Revenue per Visit (US$) Average Revenue per Visit1 2 3 4 Drivers and Strategy Behind the Growth
Ⅱ. Financial Performance
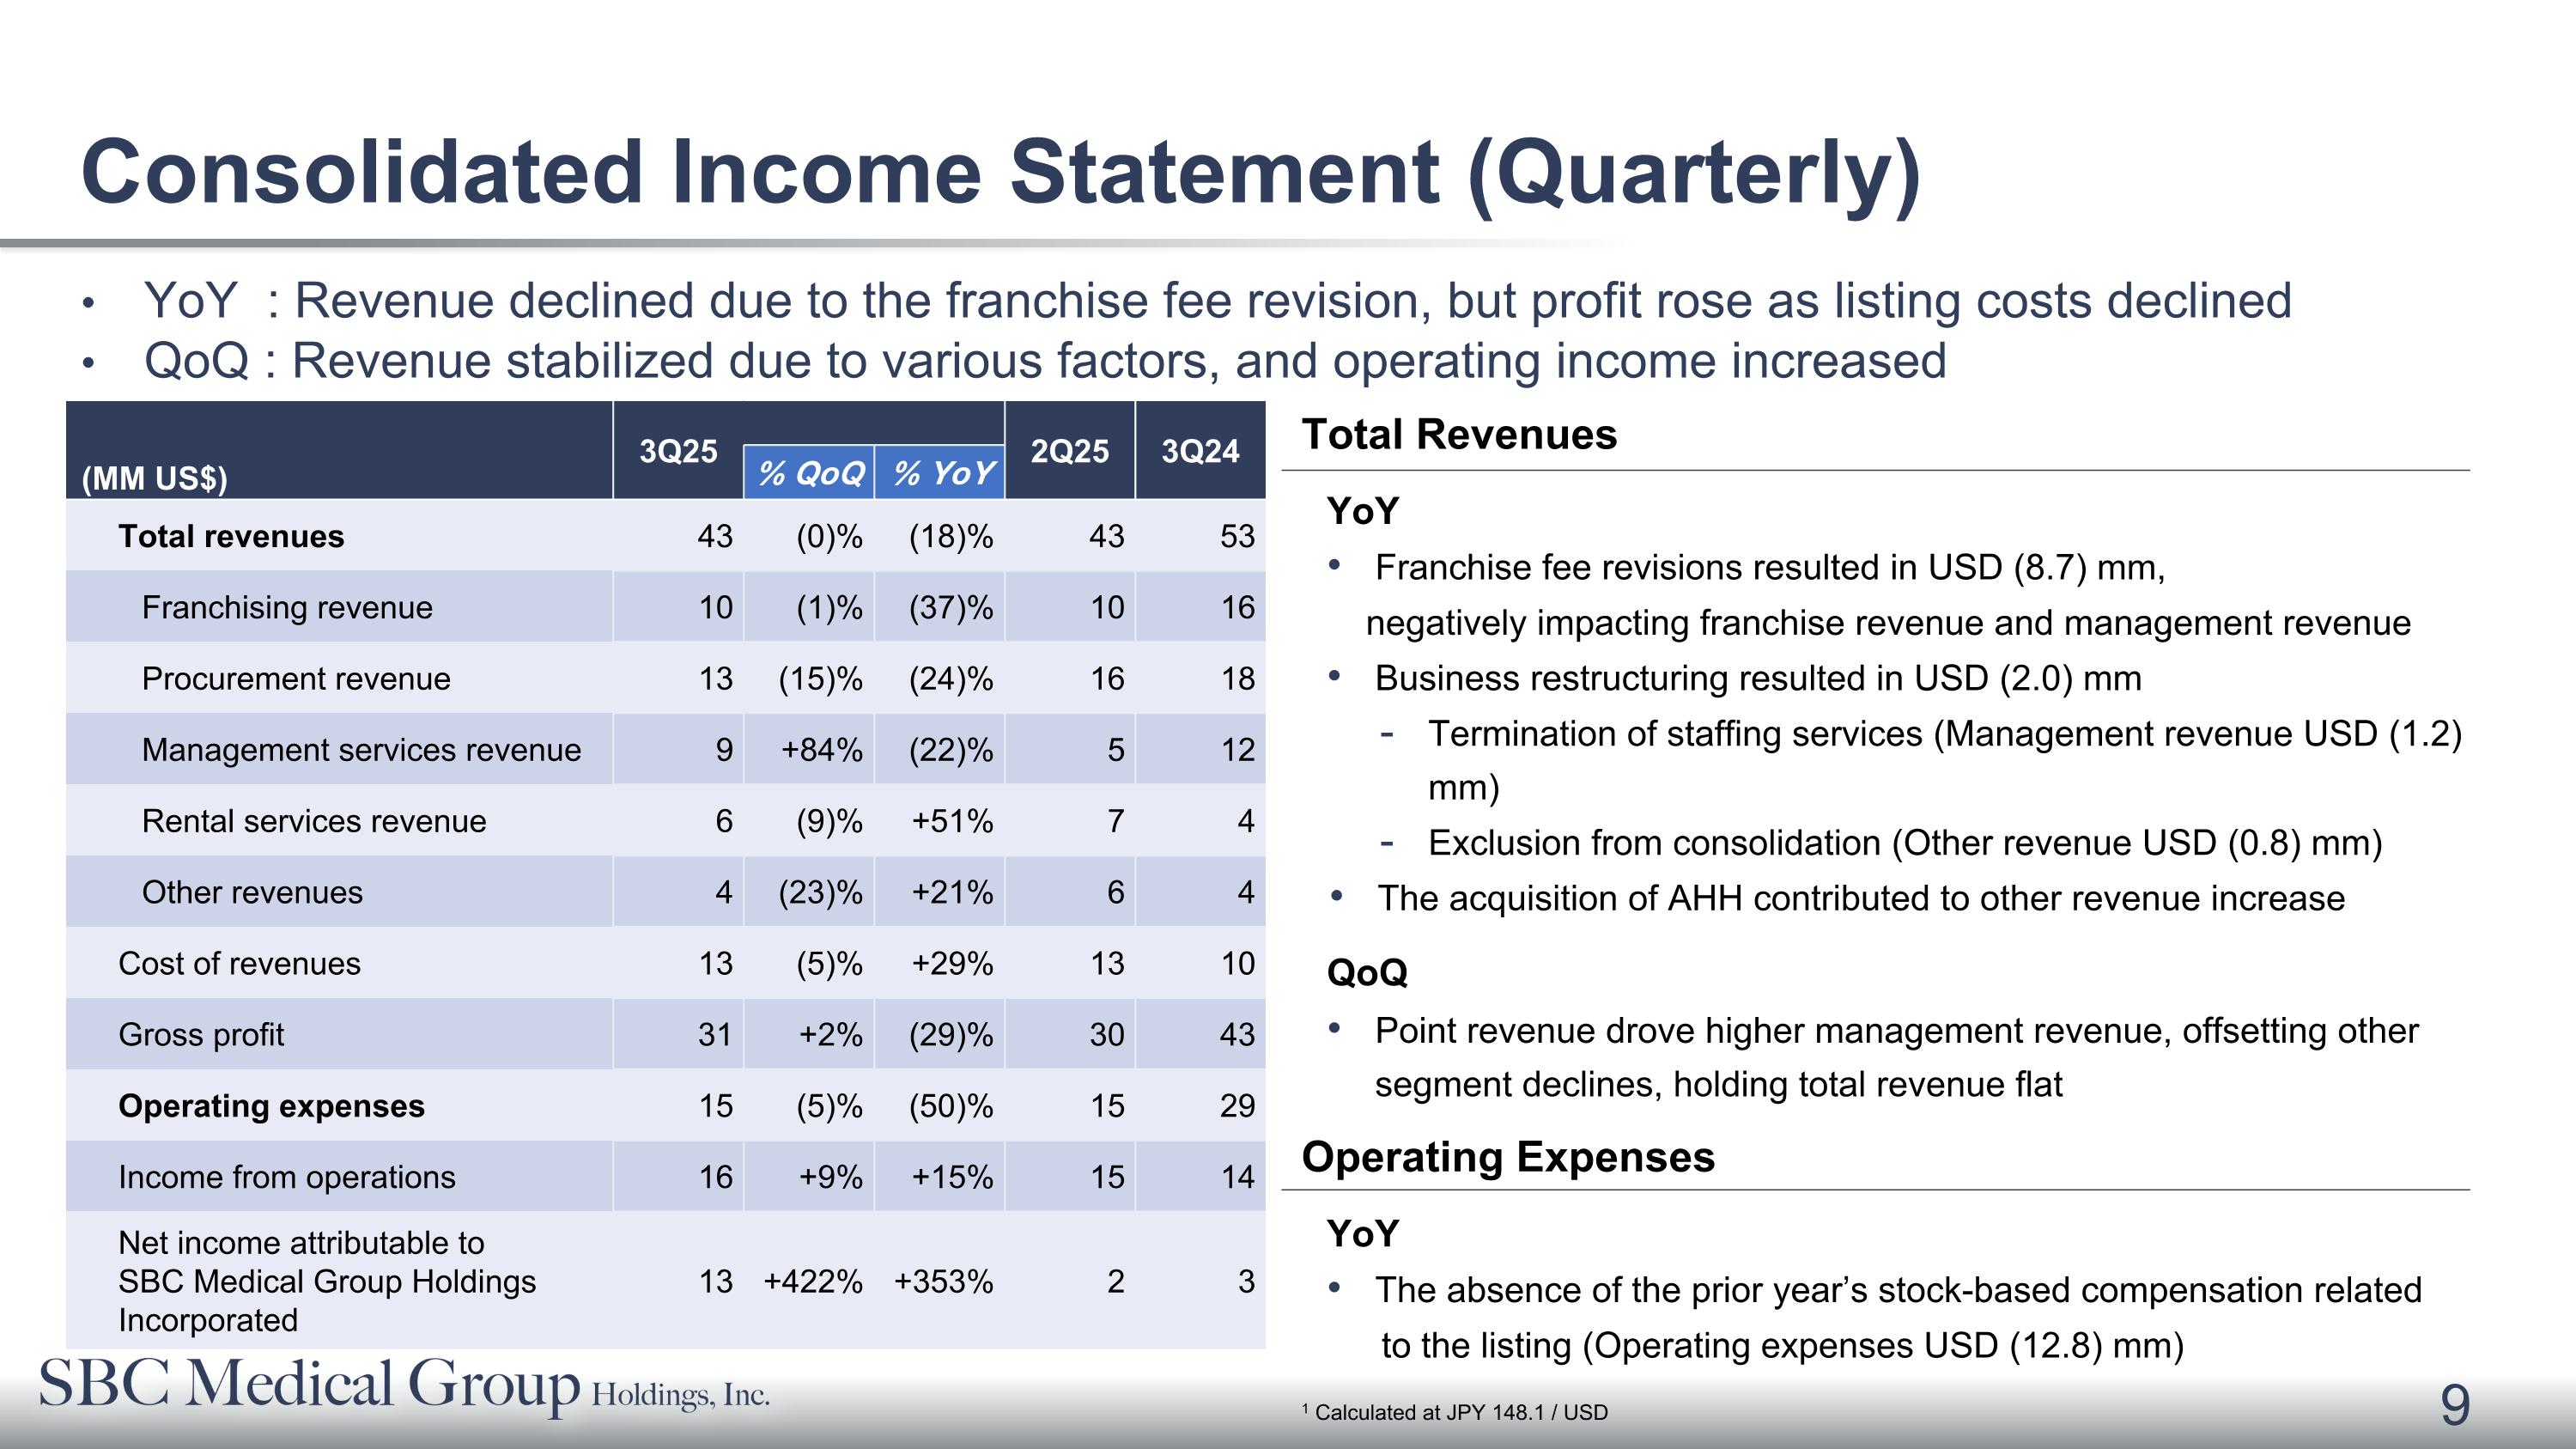
Total Revenues YoY Franchise fee revisions resulted in USD (8.7) mm, negatively impacting franchise revenue and management revenue Business restructuring resulted in USD (2.0) mm Termination of staffing services (Management revenue USD (1.2) mm) Exclusion from consolidation (Other revenue USD (0.8) mm) The acquisition of AHH contributed to other revenue increase QoQ Point revenue drove higher management revenue, offsetting other segment declines, holding total revenue flat Operating Expenses YoY The absence of the prior year’s stock-based compensation related to the listing (Operating expenses USD (12.8) mm) Consolidated Income Statement (Quarterly) 1 Calculated at JPY 148.1 / USD (MM US$) 3Q25 2Q25 3Q24 % QoQ % YoY Total revenues 43 (0)% (18)% 43 53 Franchising revenue 10 (1)% (37)% 10 16 Procurement revenue 13 (15)% (24)% 16 18 Management services revenue 9 +84% (22)% 5 12 Rental services revenue 6 (9)% +51% 7 4 Other revenues 4 (23)% +21% 6 4 Cost of revenues 13 (5)% +29% 13 10 Gross profit 31 +2% (29)% 30 43 Operating expenses 15 (5)% (50)% 15 29 Income from operations 16 +9% +15% 15 14 Net income attributable to SBC Medical Group Holdings Incorporated 13 +422% +353% 2 3 YoY : Revenue declined due to the franchise fee revision, but profit rose as listing costs declined QoQ : Revenue stabilized due to various factors, and operating income increased 9
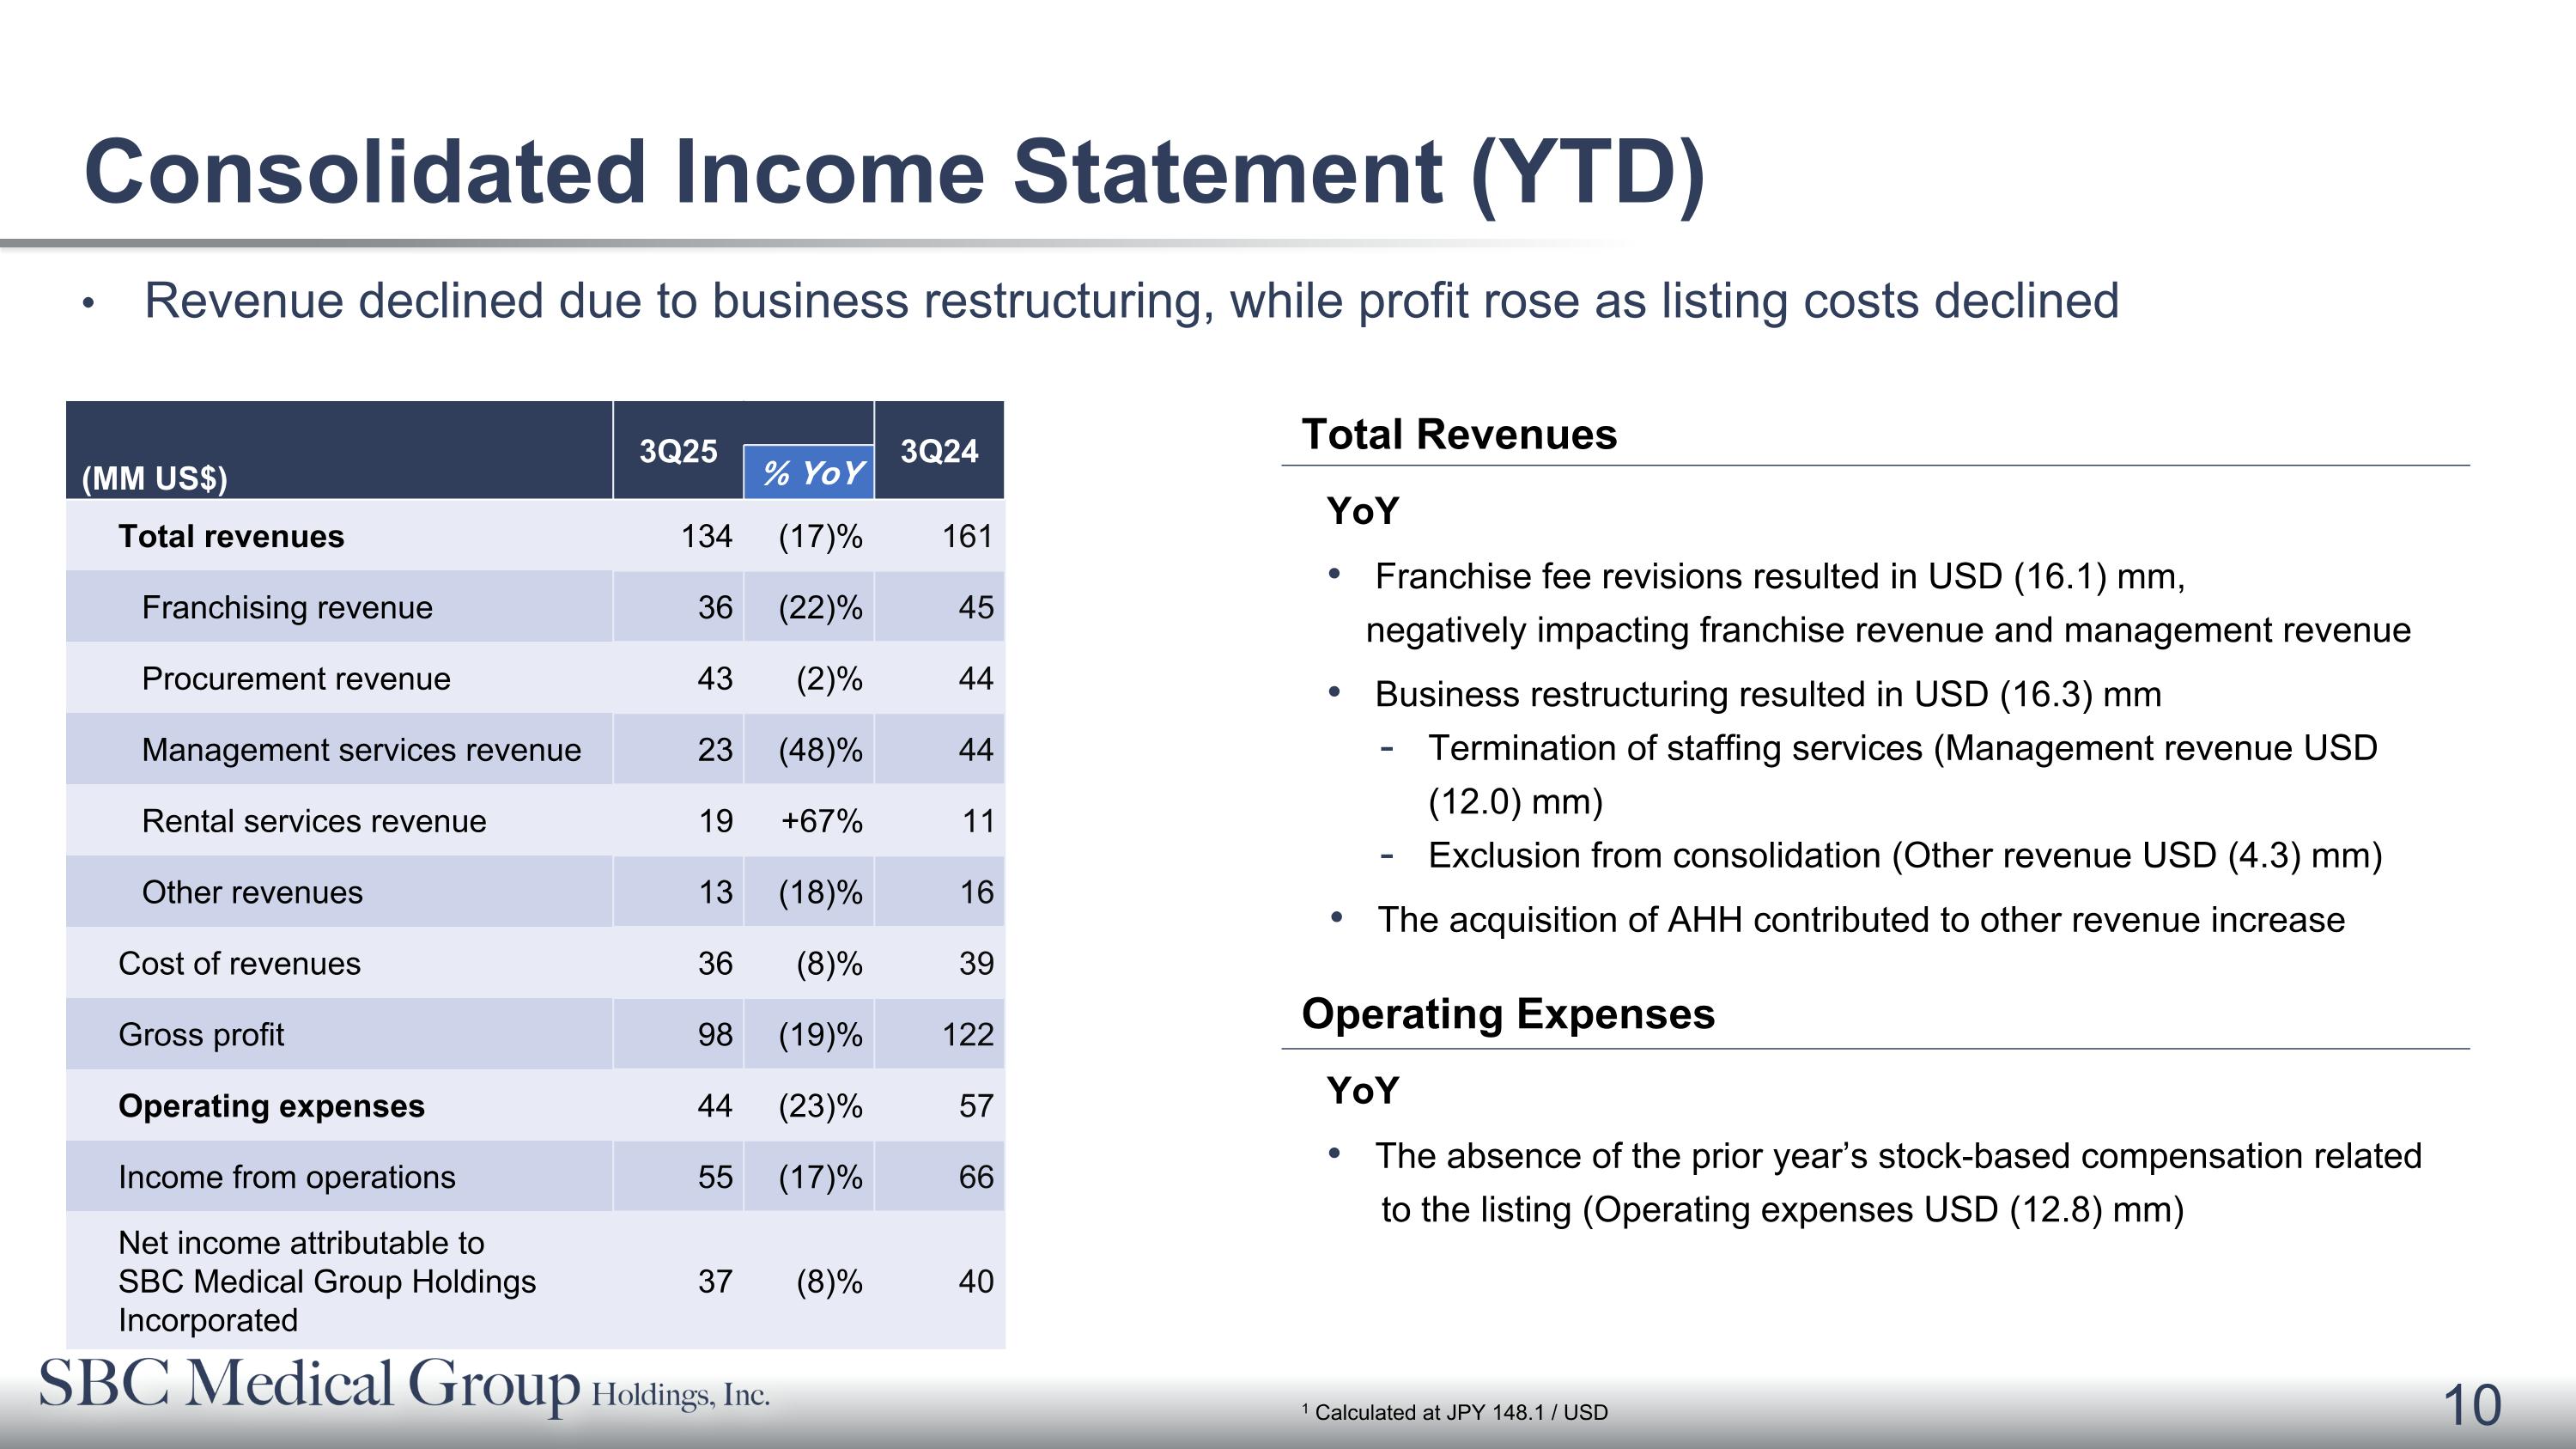
Total Revenues YoY Franchise fee revisions resulted in USD (16.1) mm, negatively impacting franchise revenue and management revenue Business restructuring resulted in USD (16.3) mm Termination of staffing services (Management revenue USD (12.0) mm) Exclusion from consolidation (Other revenue USD (4.3) mm) The acquisition of AHH contributed to other revenue increase Operating Expenses YoY The absence of the prior year’s stock-based compensation related to the listing (Operating expenses USD (12.8) mm) Consolidated Income Statement (YTD) Revenue declined due to business restructuring, while profit rose as listing costs declined (MM US$) 3Q25 3Q24 % YoY Total revenues 134 (17)% 161 Franchising revenue 36 (22)% 45 Procurement revenue 43 (2)% 44 Management services revenue 23 (48)% 44 Rental services revenue 19 +67% 11 Other revenues 13 (18)% 16 Cost of revenues 36 (8)% 39 Gross profit 98 (19)% 122 Operating expenses 44 (23)% 57 Income from operations 55 (17)% 66 Net income attributable to SBC Medical Group Holdings Incorporated 37 (8)% 40 1 Calculated at JPY 148.1 / USD
Ⅲ. Business Strategies Update
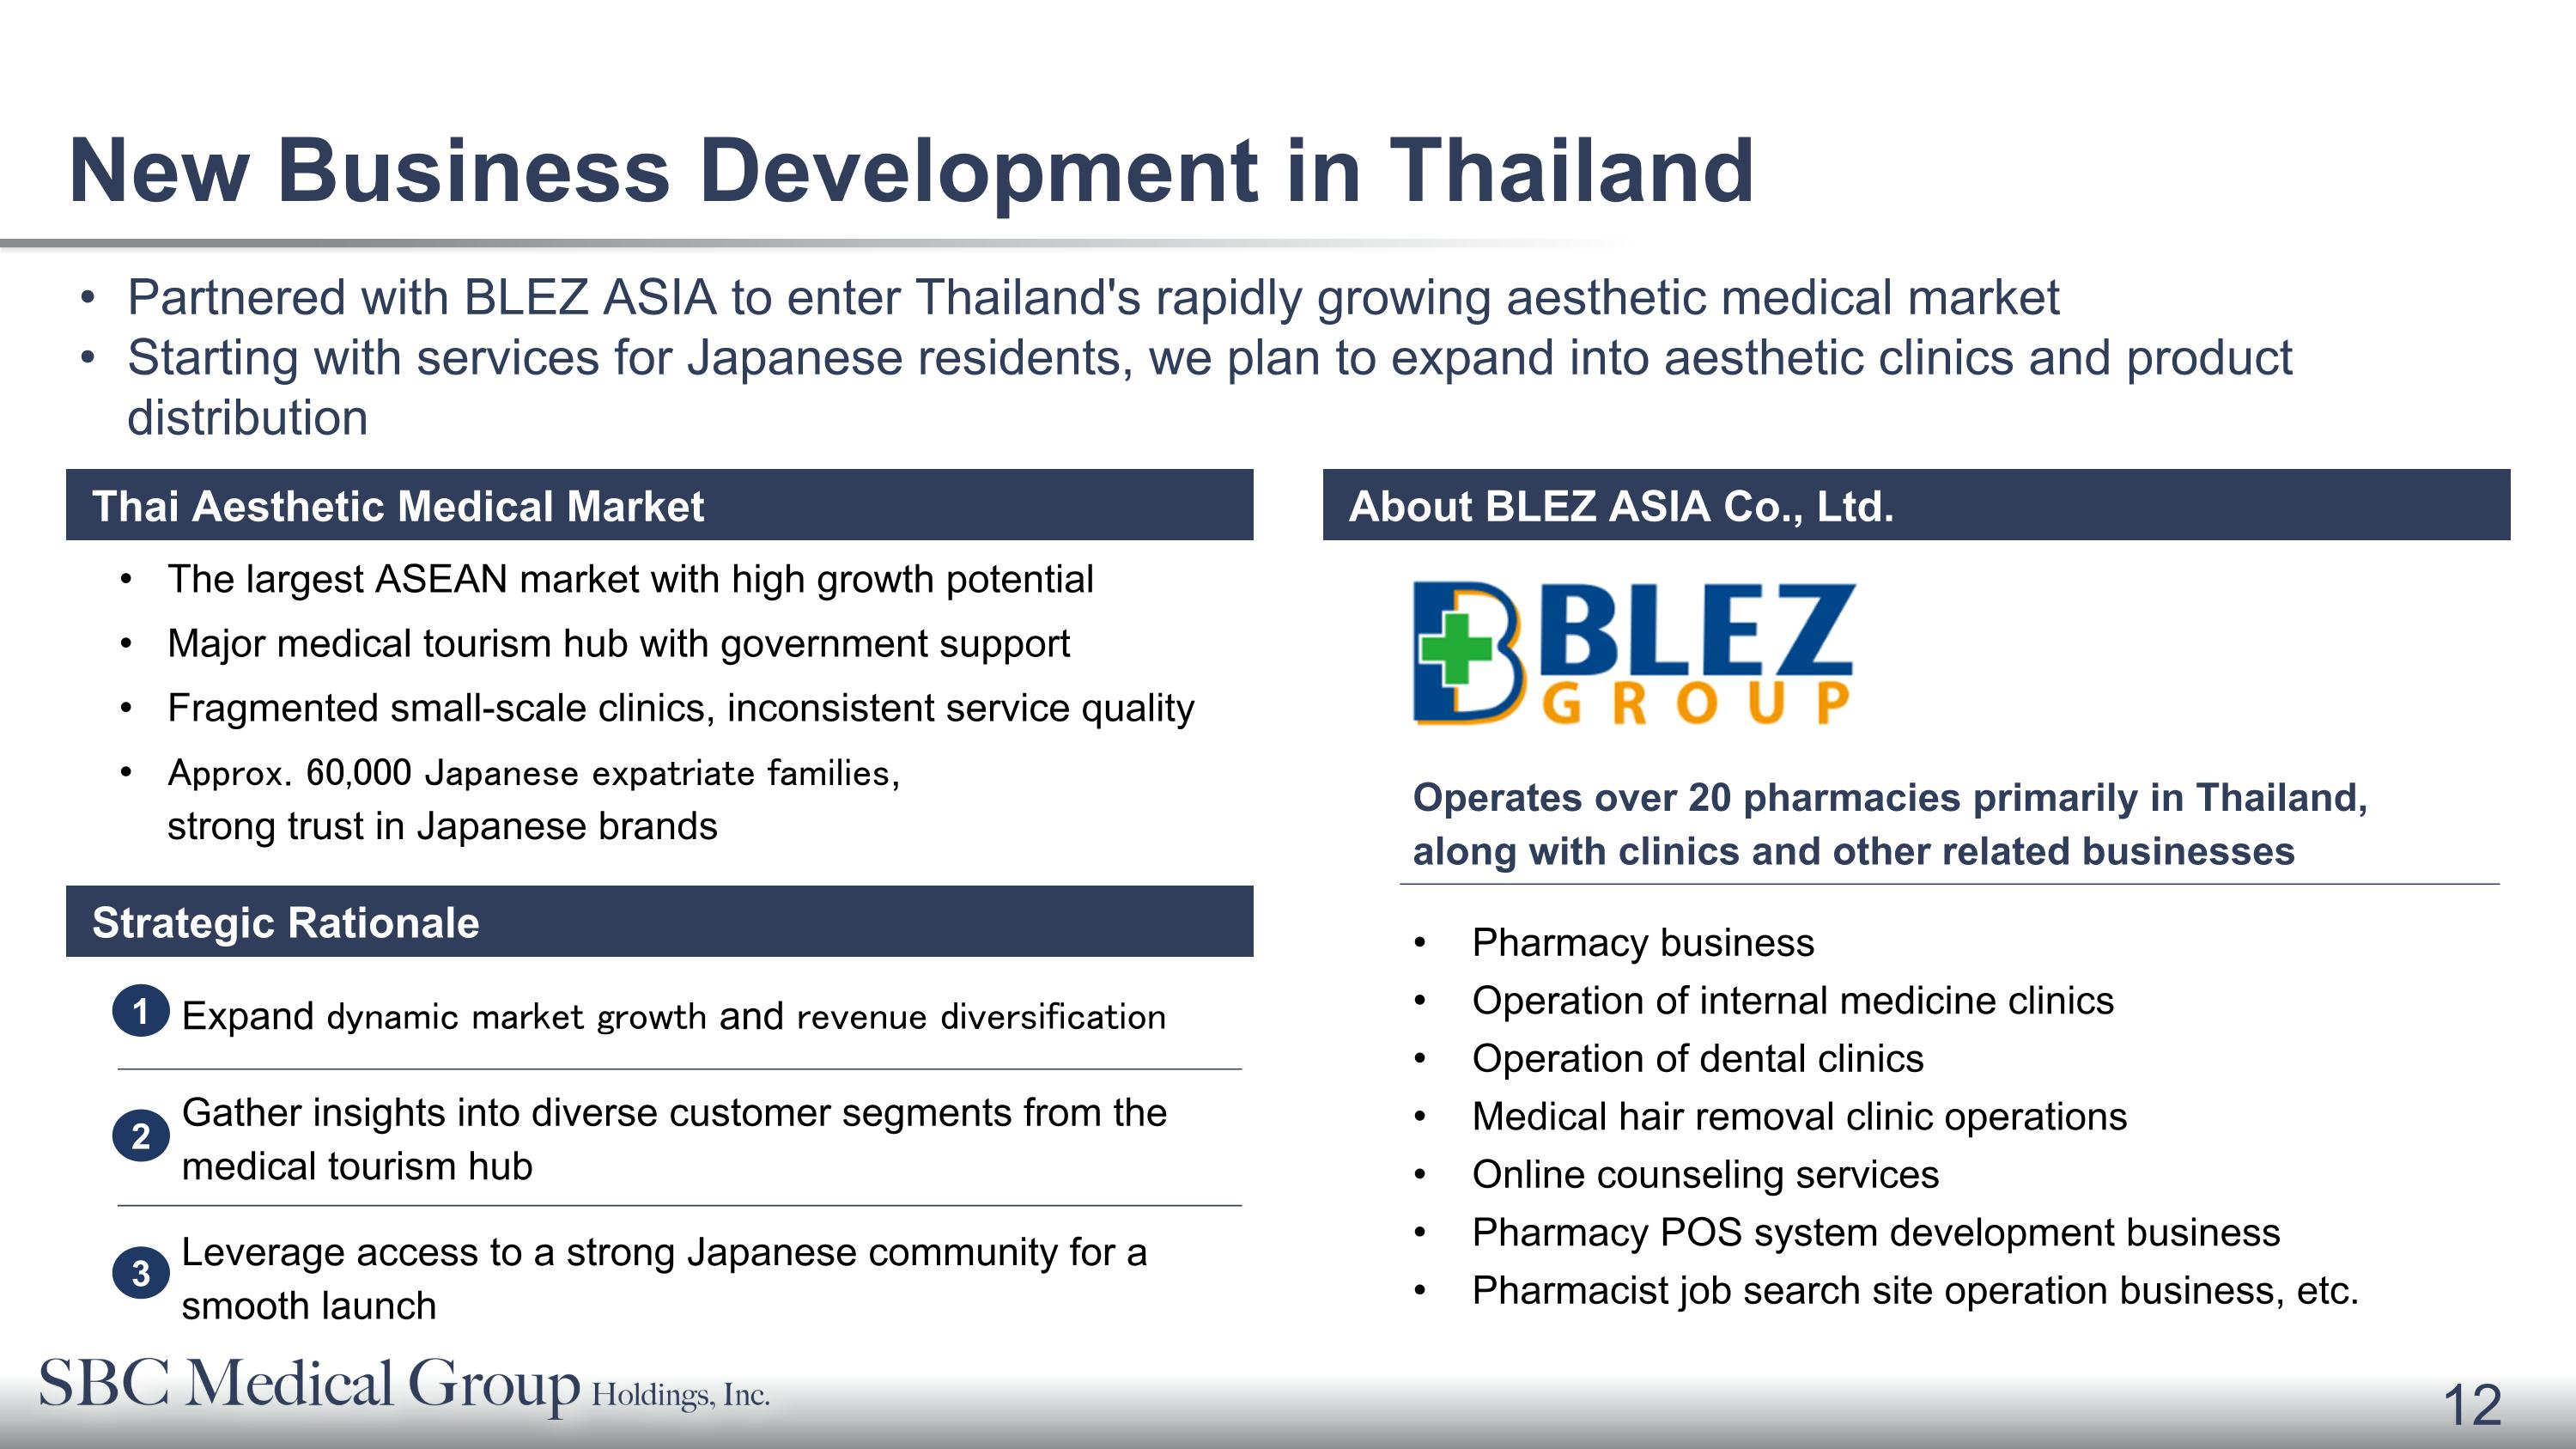
New Business Development in Thailand The largest ASEAN market with high growth potential Major medical tourism hub with government support Fragmented small-scale clinics, inconsistent service quality Approx. 60,000 Japanese expatriate families, �strong trust in Japanese brands Expand dynamic market growth and revenue diversification Gather insights into diverse customer segments from the medical tourism hub Leverage access to a strong Japanese community for a smooth launch 1 3 2 Operates over 20 pharmacies primarily in Thailand, �along with clinics and other related businesses Pharmacy business Operation of internal medicine clinics Operation of dental clinics Medical hair removal clinic operations Online counseling services Pharmacy POS system development business Pharmacist job search site operation business, etc. Partnered with BLEZ ASIA to enter Thailand's rapidly growing aesthetic medical market Starting with services for Japanese residents, we plan to expand into aesthetic clinics and product distribution Thai Aesthetic Medical Market About BLEZ ASIA Co., Ltd. Strategic Rationale
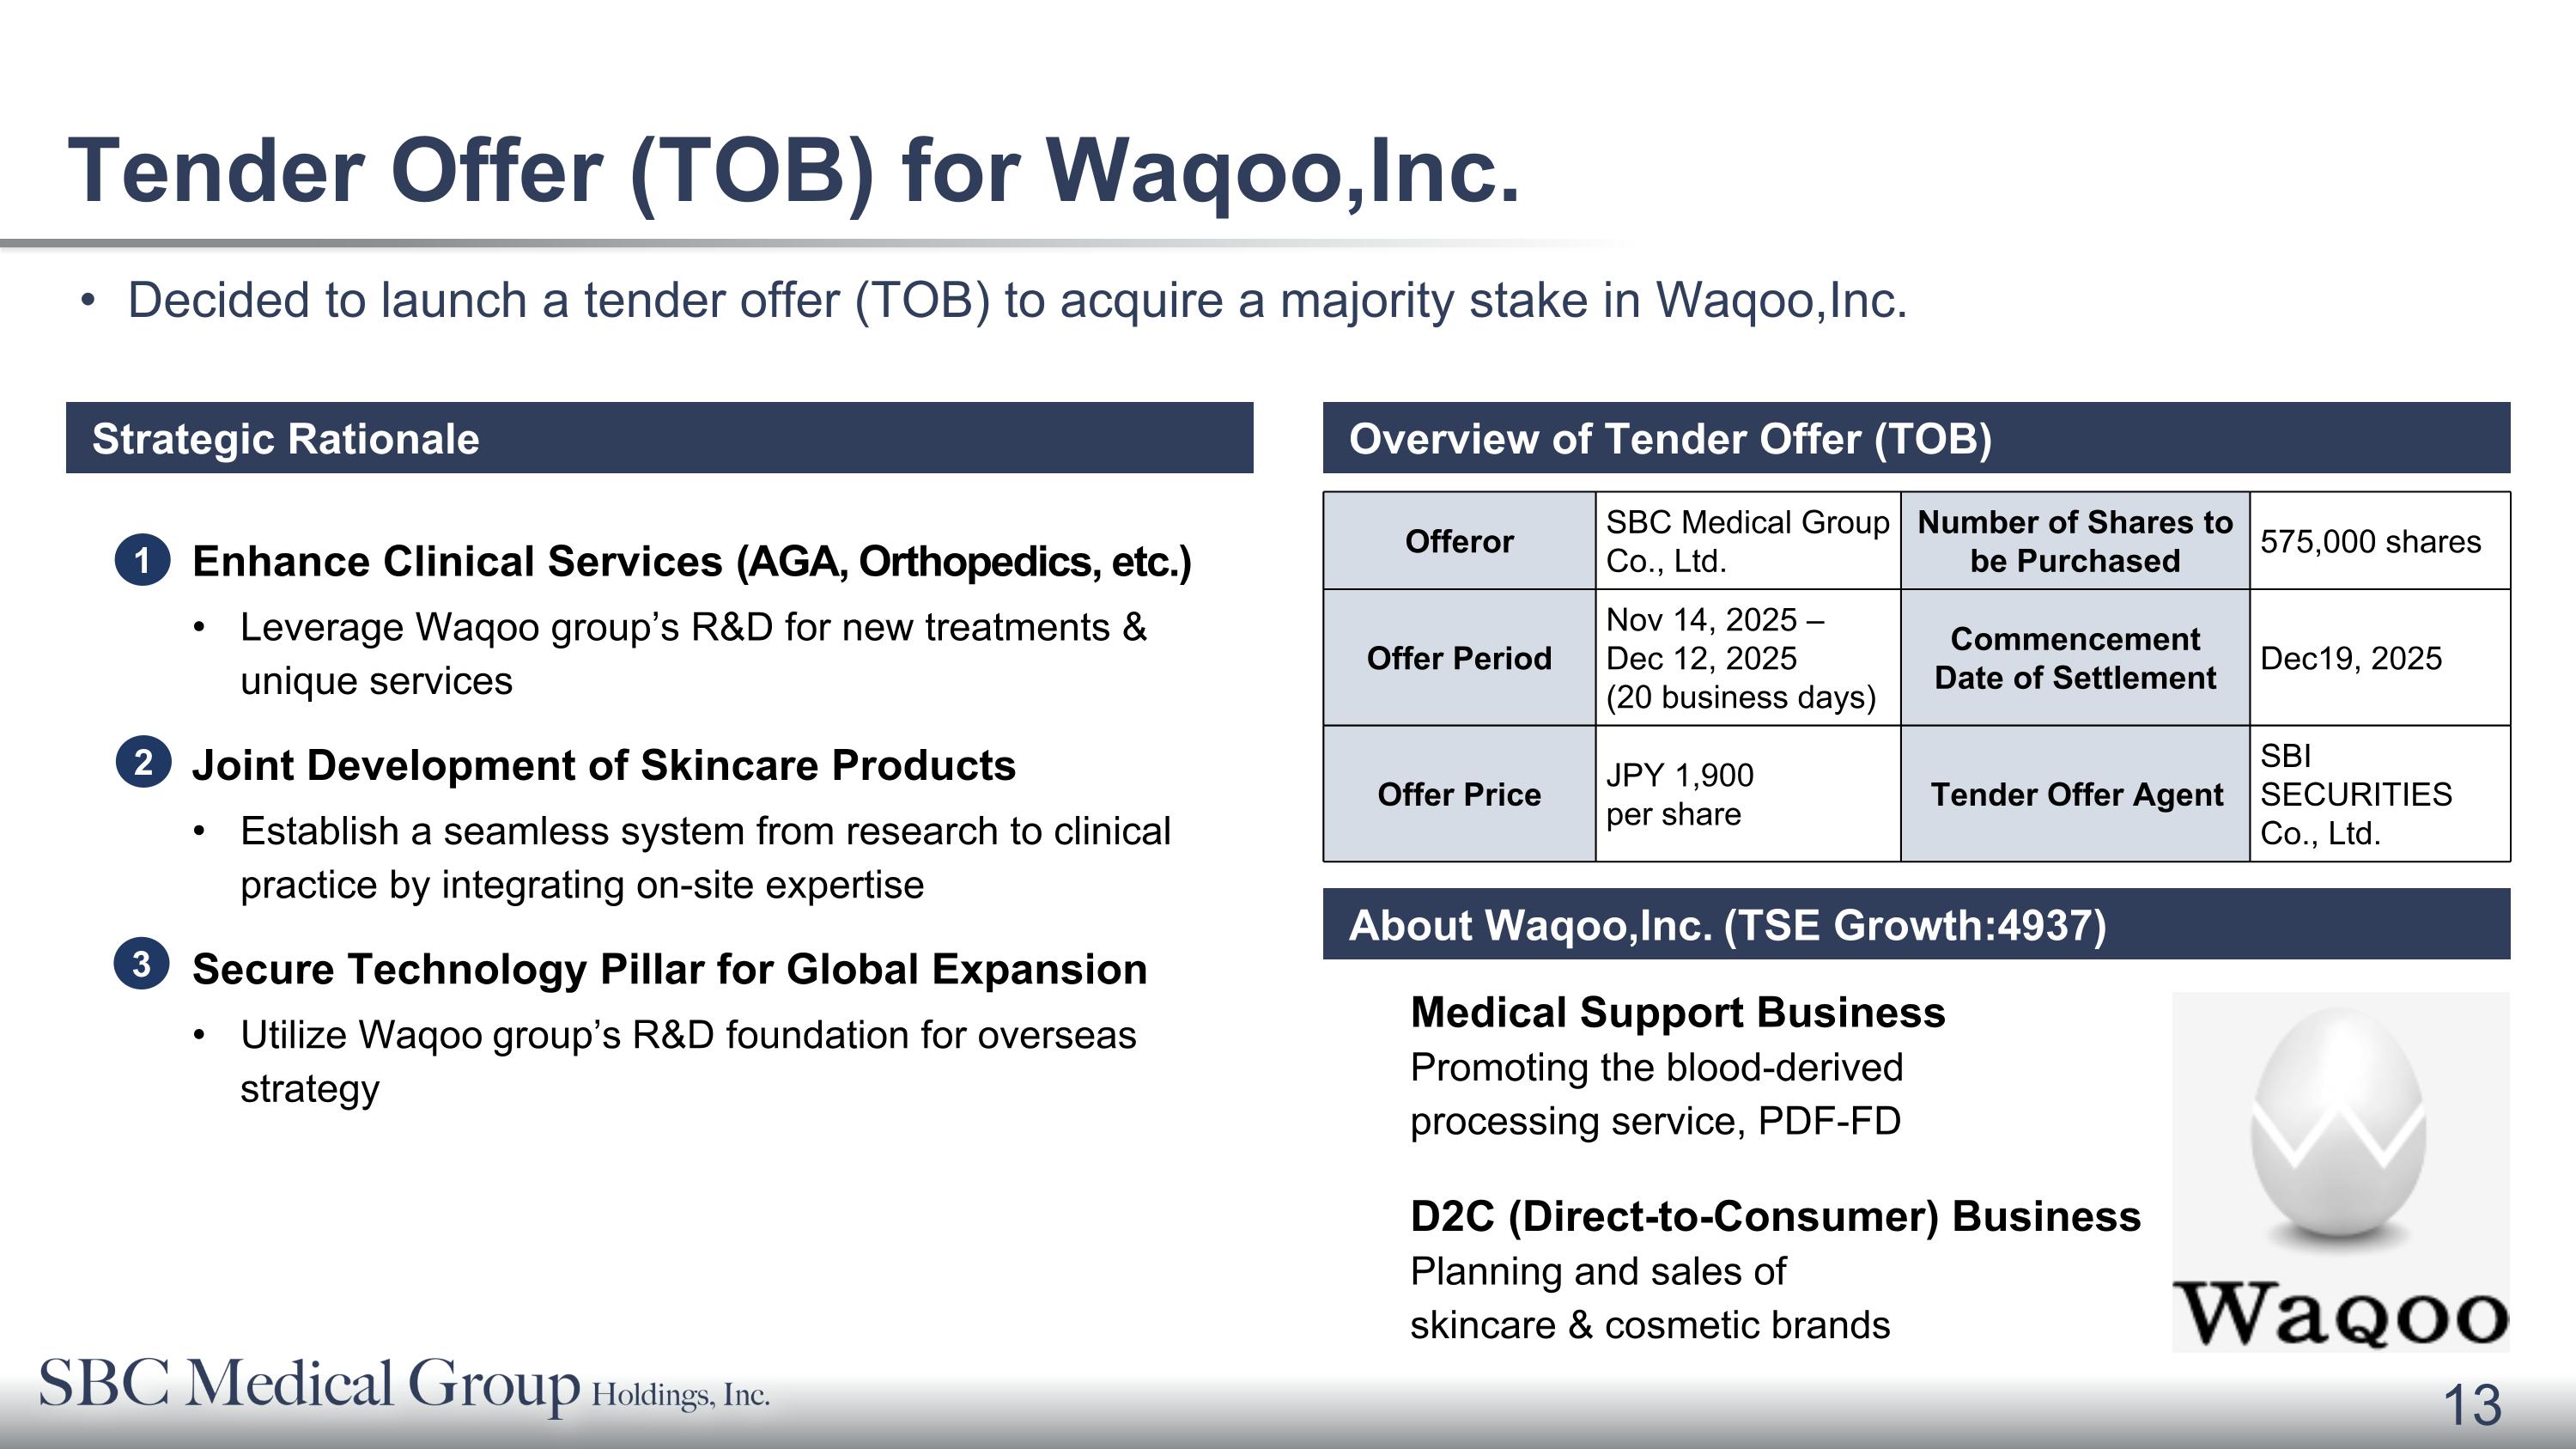
Medical Support Business Promoting the blood-derived�processing service, PDF-FD D2C (Direct-to-Consumer) Business Planning and sales of �skincare & cosmetic brands Tender Offer (TOB) for Waqoo,Inc. Enhance Clinical Services (AGA, Orthopedics, etc.) Leverage Waqoo group’s R&D for new treatments & unique services Joint Development of Skincare Products Establish a seamless system from research to clinical practice by integrating on-site expertise Secure Technology Pillar for Global Expansion Utilize Waqoo group’s R&D foundation for overseas strategy Offeror SBC Medical Group Co., Ltd. Number of Shares to be Purchased 575,000 shares Offer Period Nov 14, 2025 – Dec 12, 2025 �(20 business days) Commencement Date of Settlement Dec19, 2025 Offer Price JPY 1,900 �per share Tender Offer Agent SBI SECURITIES Co., Ltd. Decided to launch a tender offer (TOB) to acquire a majority stake in Waqoo,Inc. 1 3 2 Strategic Rationale Overview of Tender Offer (TOB) About Waqoo,Inc. (TSE Growth:4937)

14 Ⅳ. Use of Assets and Capital Strategies
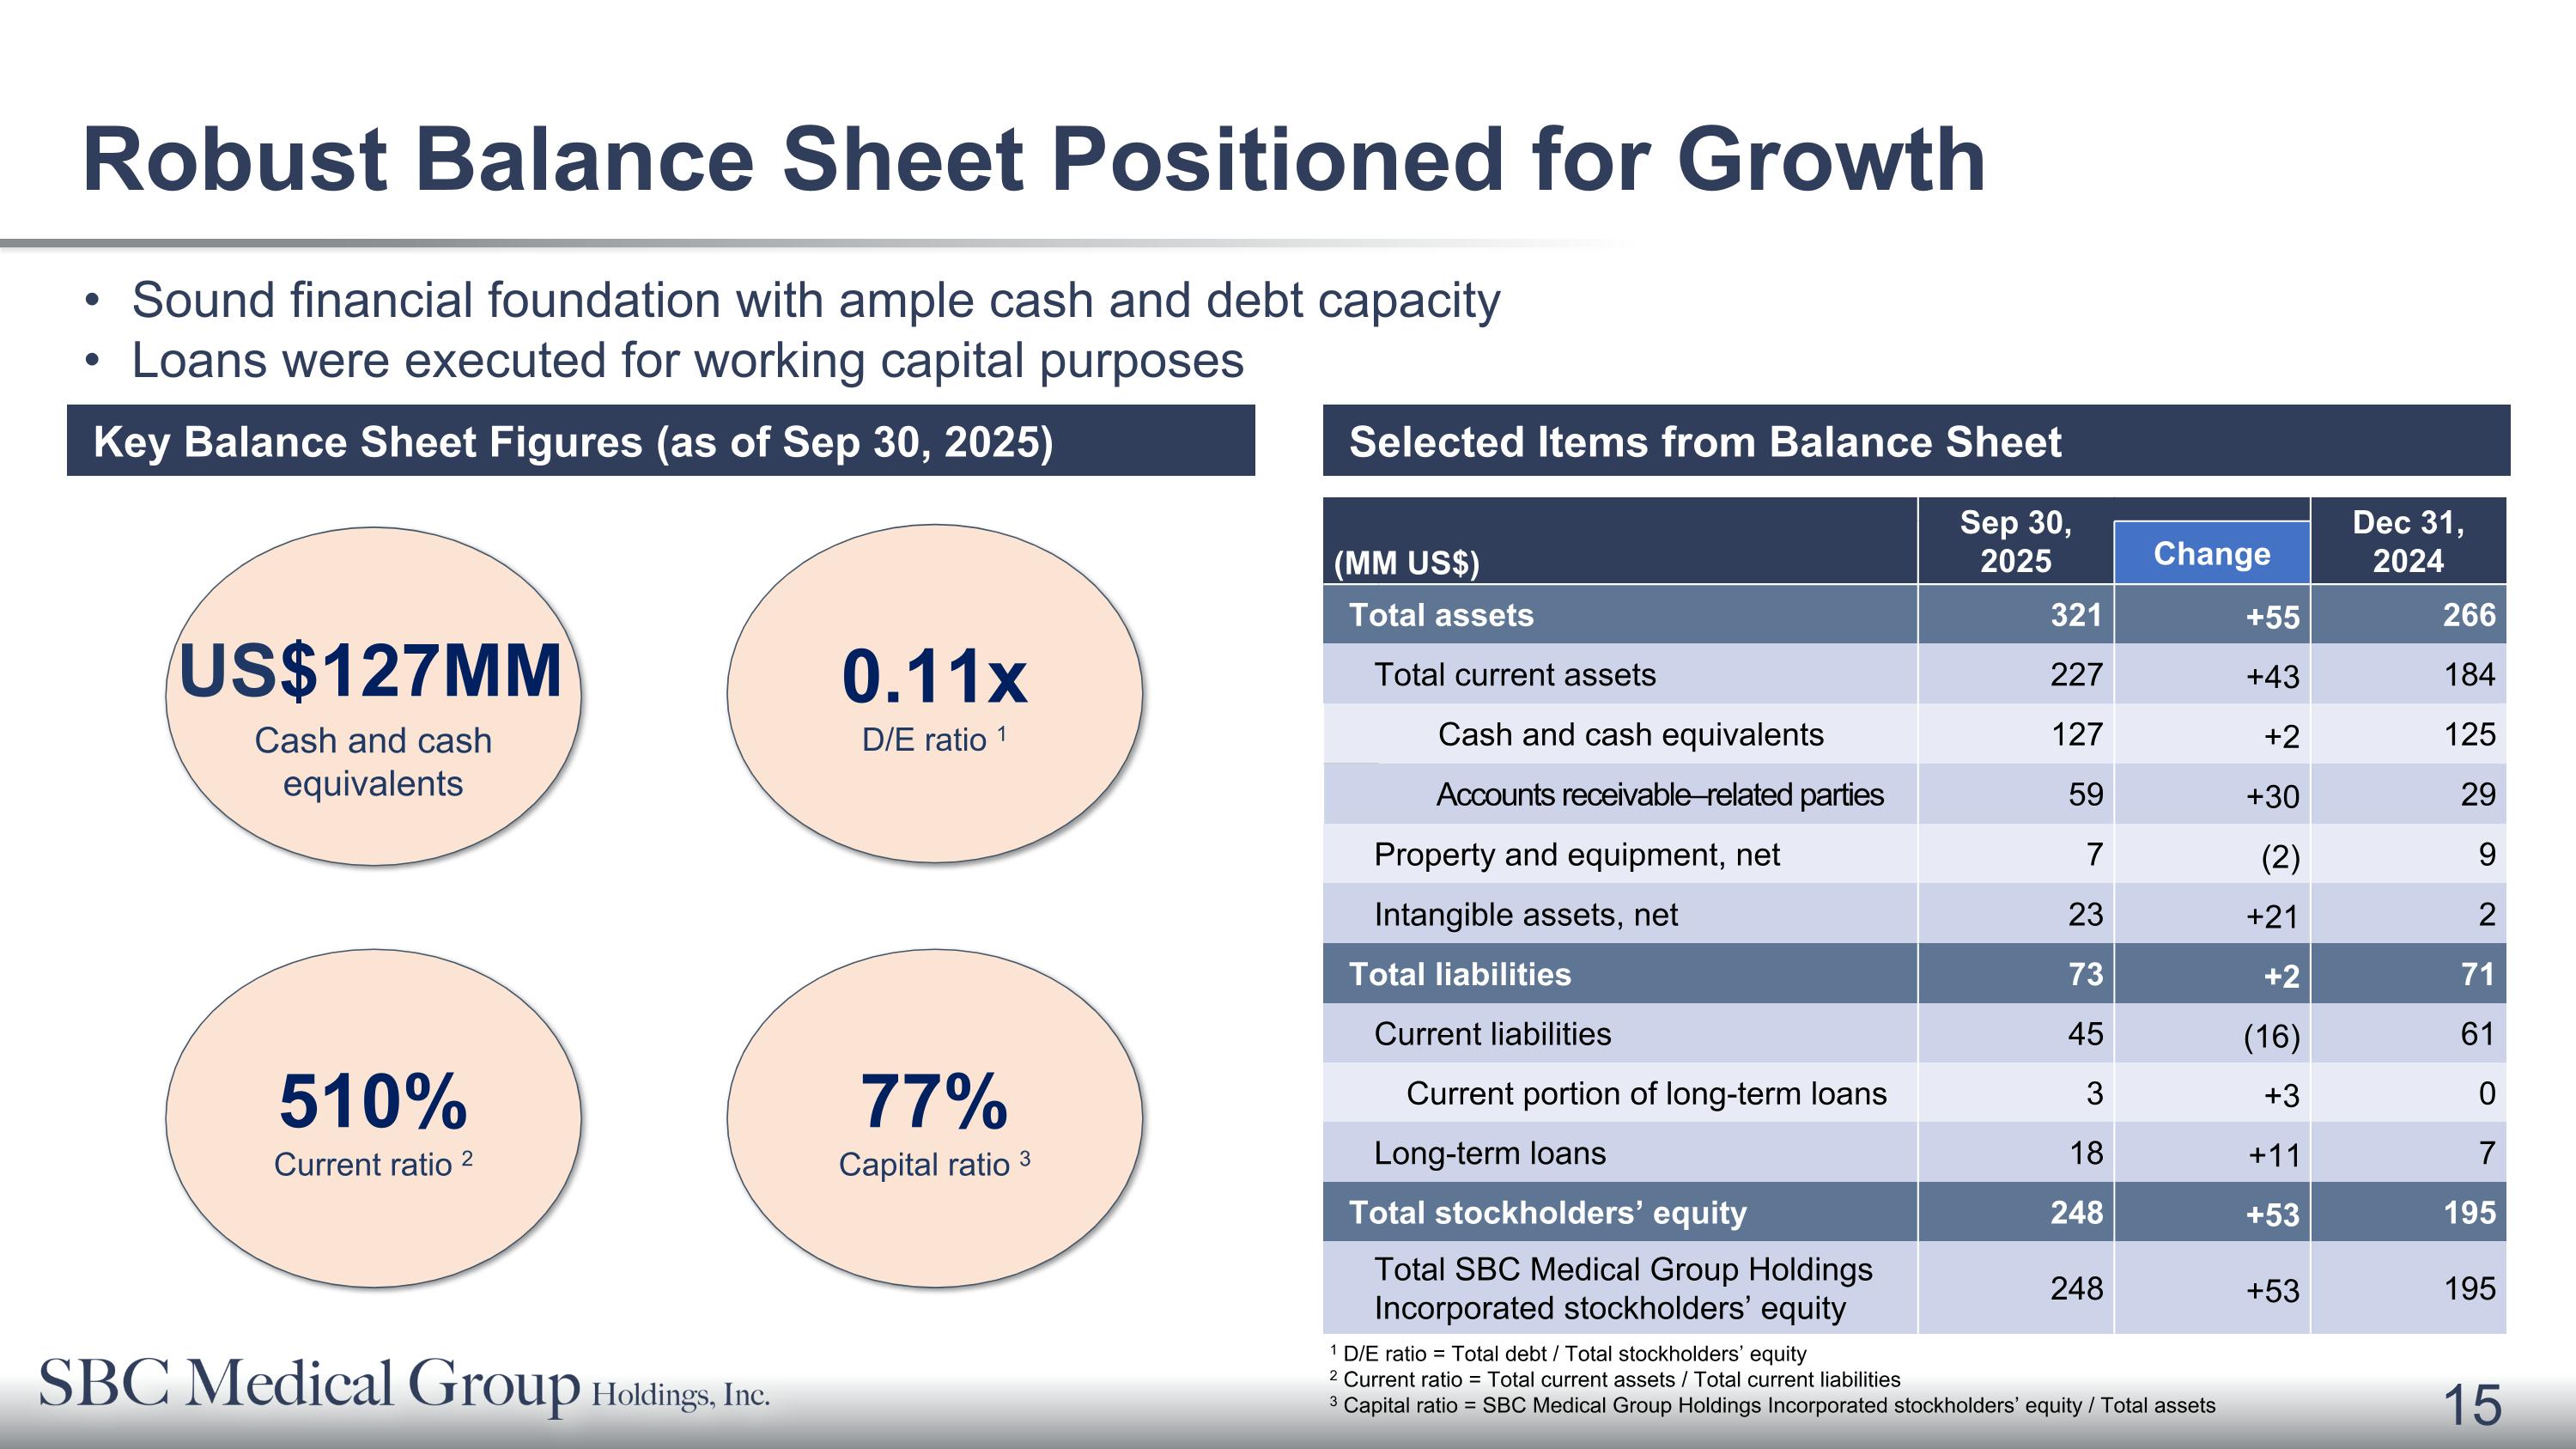
Robust Balance Sheet Positioned for Growth Cash and cash equivalents Key Balance Sheet Figures (as of Sep 30, 2025) 510% Current ratio 2 77% Capital ratio 3 0.11x D/E ratio 1 US$127MM 1 D/E ratio = Total debt / Total stockholders’ equity 2 Current ratio = Total current assets / Total current liabilities 3 Capital ratio = SBC Medical Group Holdings Incorporated stockholders’ equity / Total assets (MM US$) Sep 30, 2025 Dec 31, 2024 Change Total assets 321 +55 266 Total current assets 227 +43 184 Cash and cash equivalents 127 +2 125 Accounts receivable–related parties 59 +30 29 Property and equipment, net 7 (2) 9 Intangible assets, net 23 +21 2 Total liabilities 73 +2 71 Current liabilities 45 (16) 61 Current portion of long-term loans 3 +3 0 Long-term loans 18 +11 7 Total stockholders’ equity 248 +53 195 Total SBC Medical Group Holdings Incorporated stockholders’ equity 248 +53 195 Sound financial foundation with ample cash and debt capacity Loans were executed for working capital purposes Selected Items from Balance Sheet
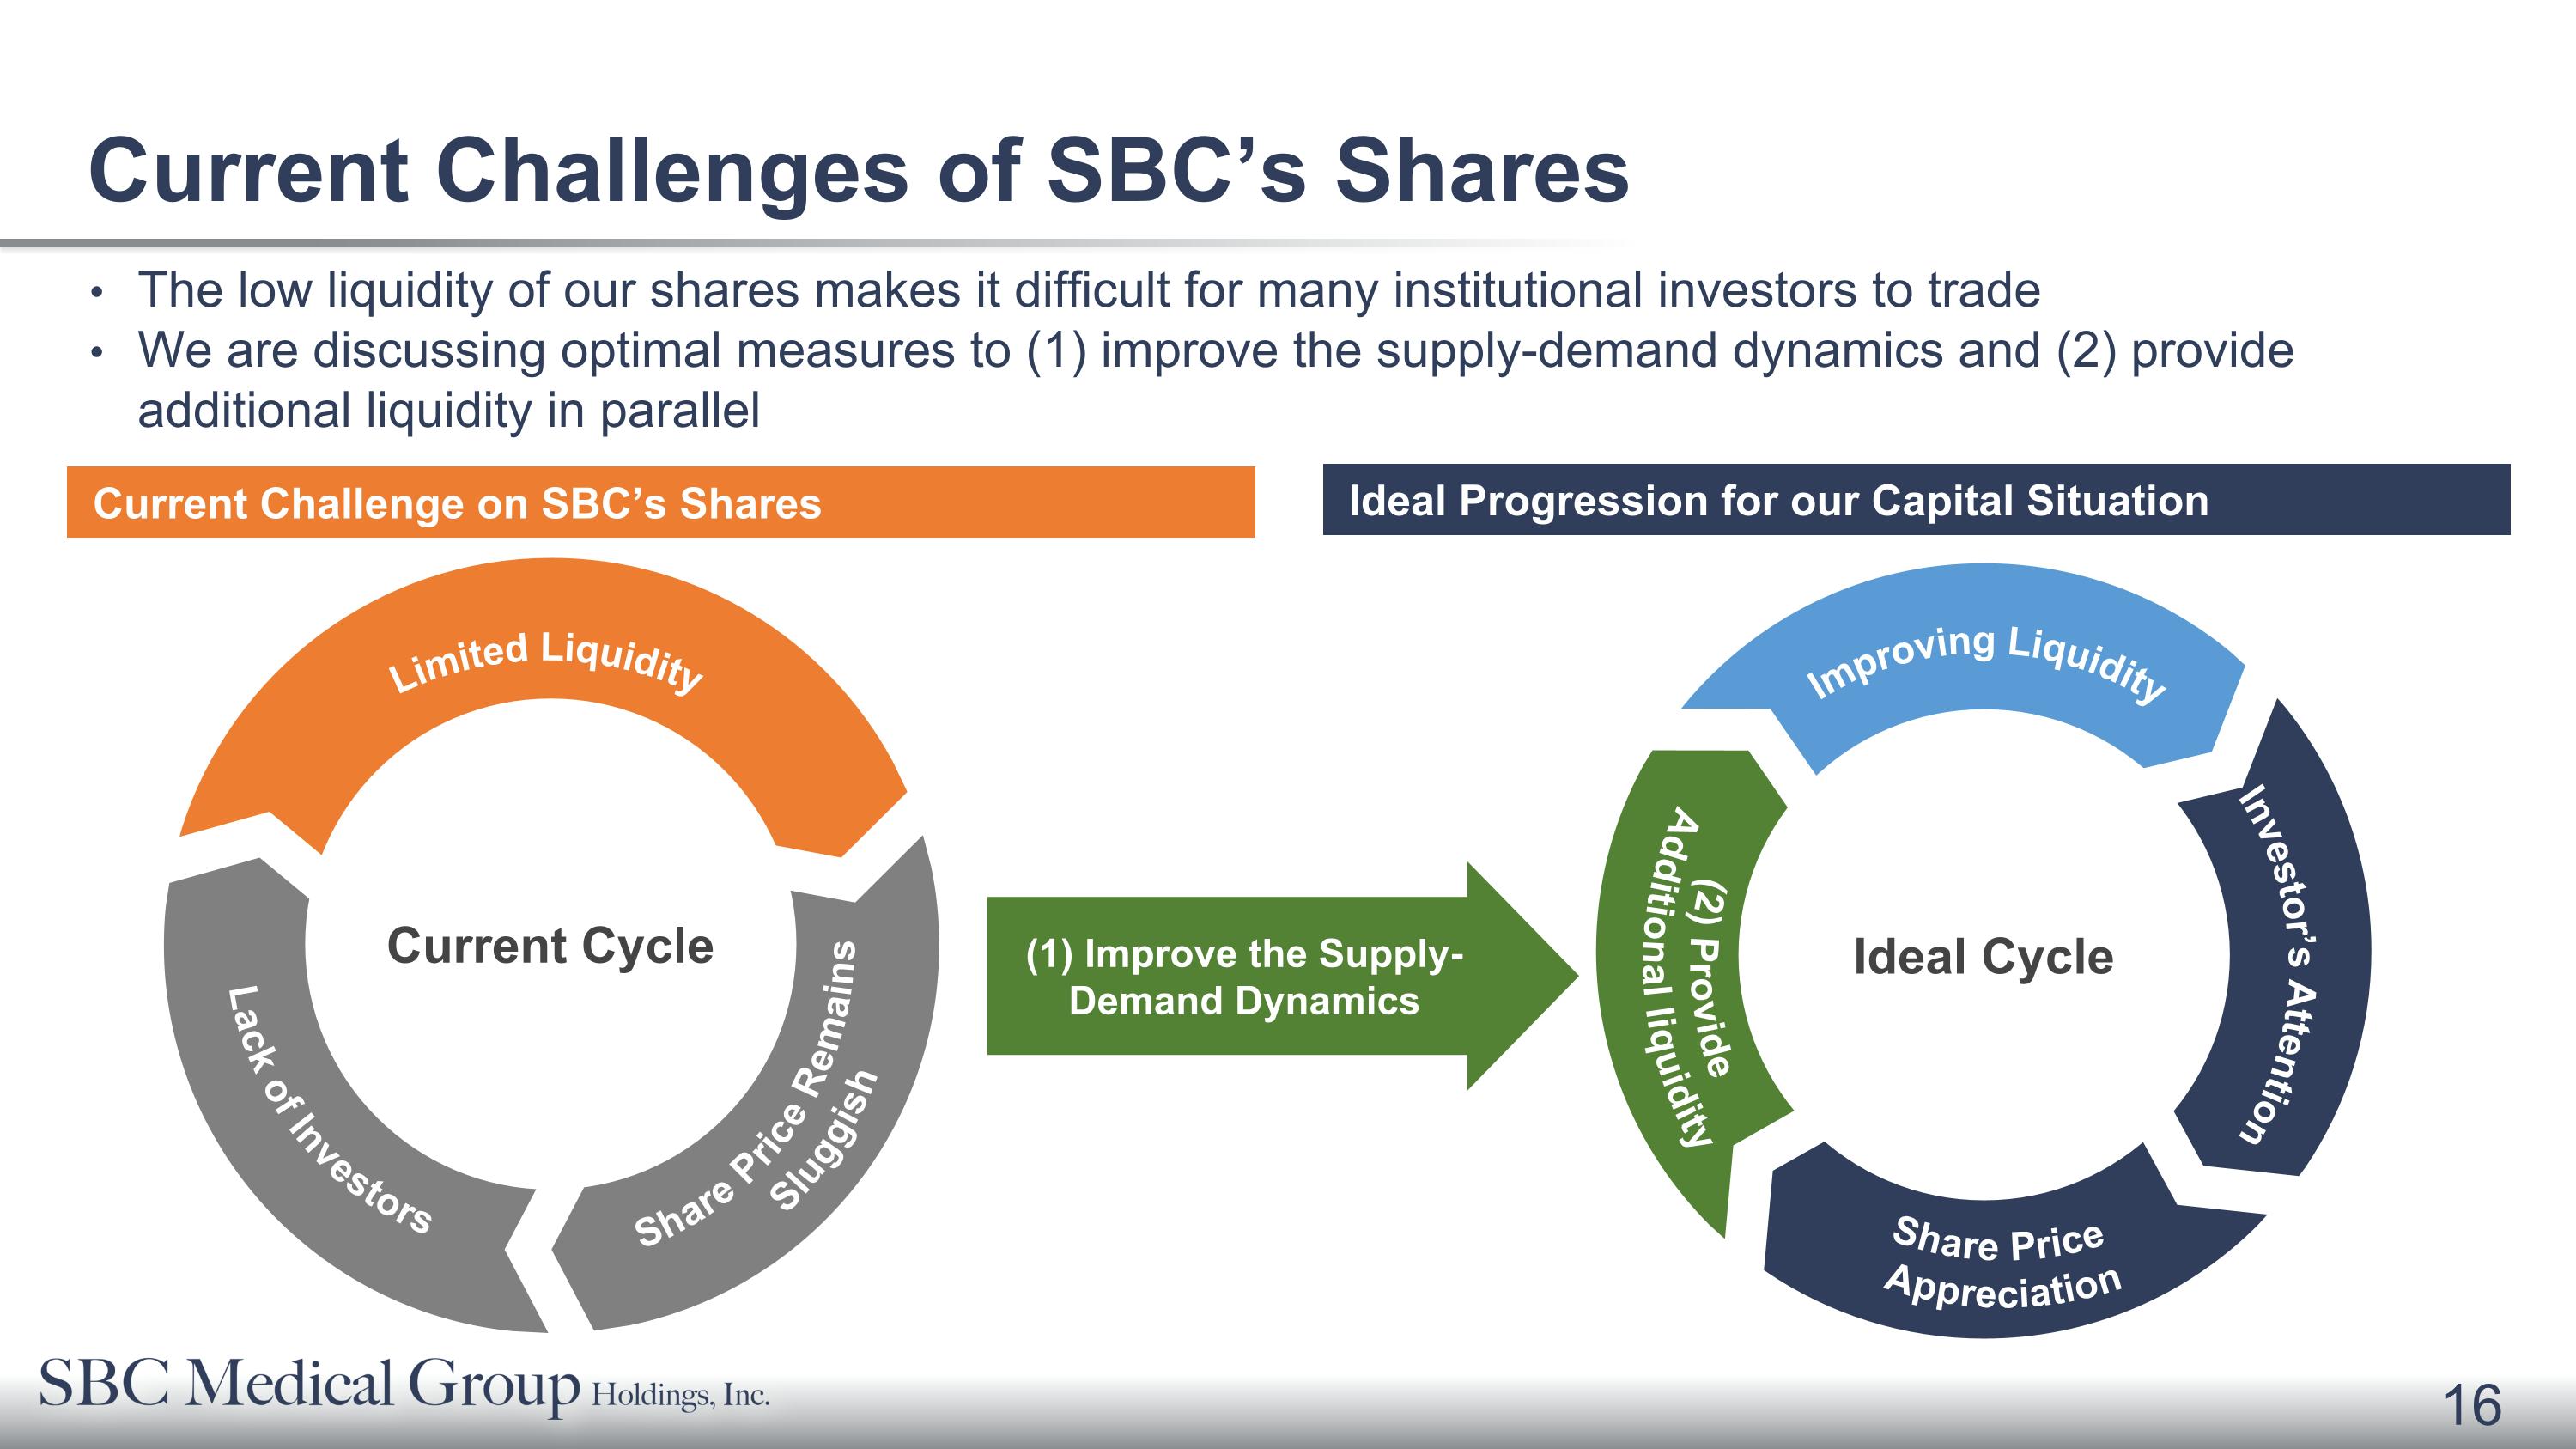
Current Challenges of SBC’s Shares The low liquidity of our shares makes it difficult for many institutional investors to trade We are discussing optimal measures to (1) improve the supply-demand dynamics and (2) provide additional liquidity in parallel (1) Improve the Supply-Demand Dynamics Improving Liquidity Investor’s Attention Share Price �Appreciation (2) Provide Additional liquidity Ideal Cycle Limited Liquidity Lack of Investors Share Price Remains �Sluggish Current Cycle Current Challenge on SBC’s Shares Ideal Progression for our Capital Situation
17 Appendix.
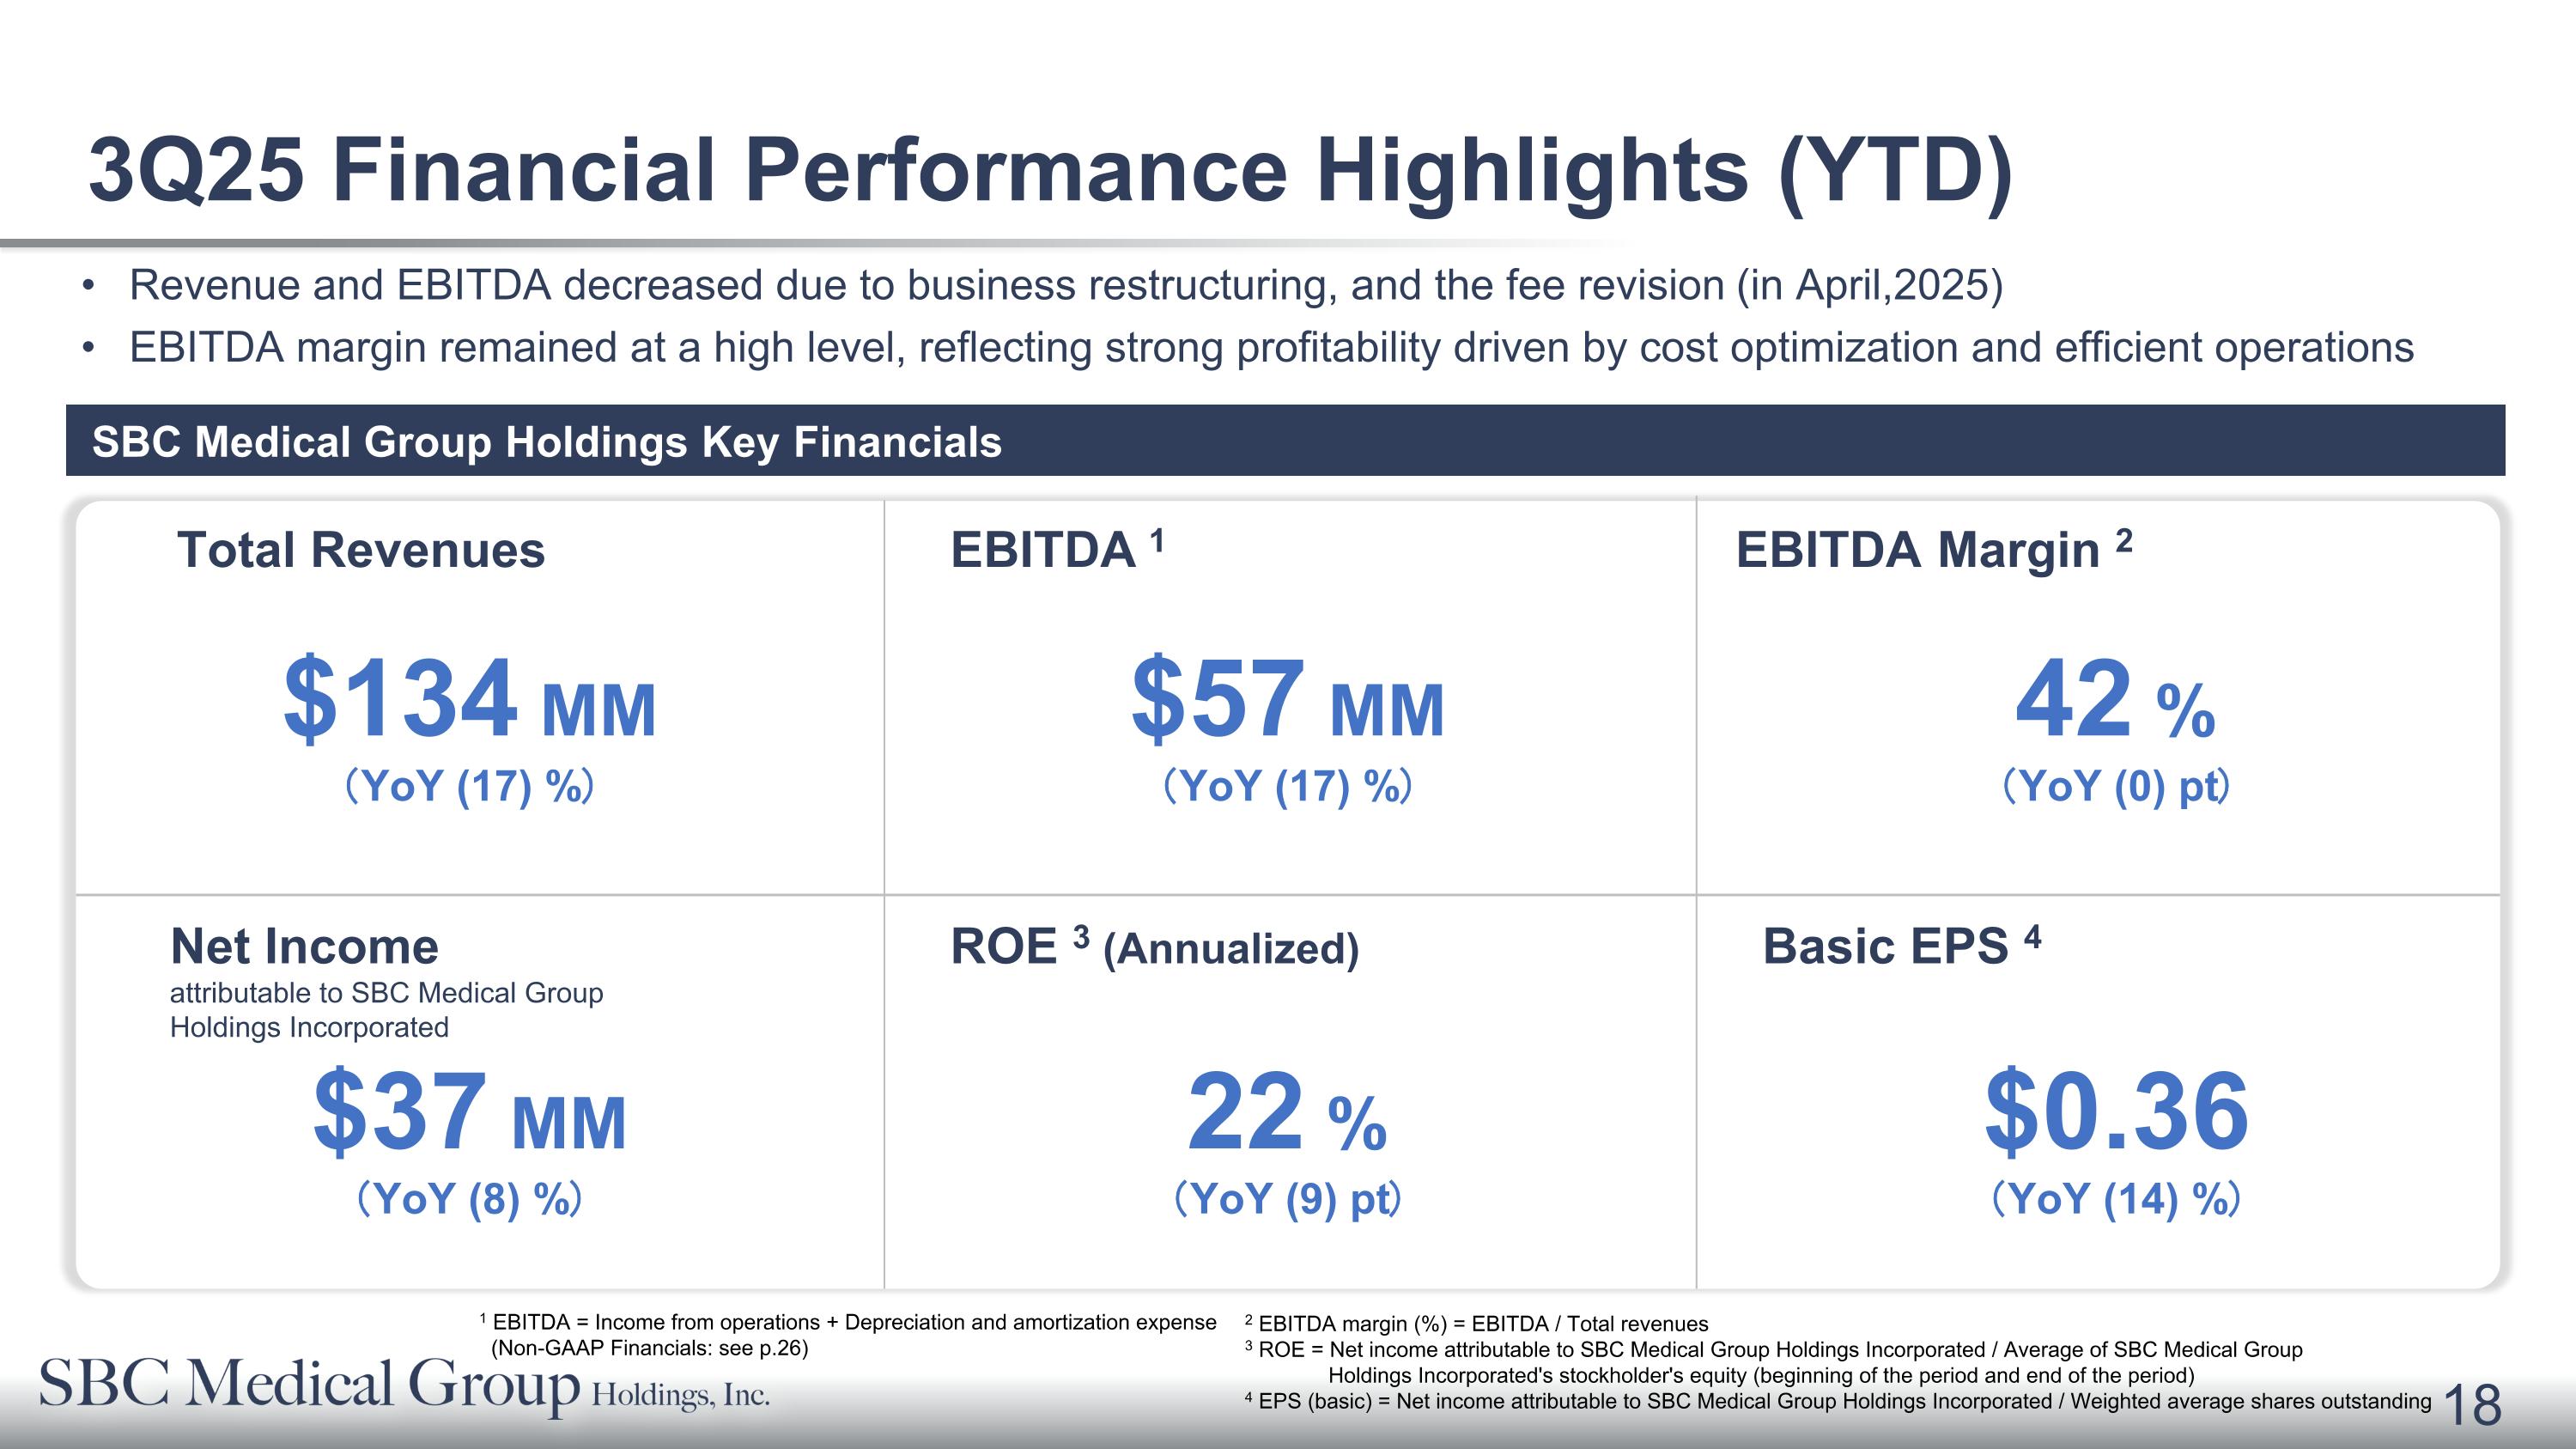
SBC Medical Group Holdings Key Financials 3Q25 Financial Performance Highlights (YTD) 42 % (YoY (0) pt) ROE 3 (Annualized) Basic EPS 4 $0.36 (YoY (14) %) $134 MM (YoY (17) %) $57 MM (YoY (17) %) Net Income�attributable to SBC Medical Group Holdings Incorporated $37 MM (YoY (8) %) Revenue and EBITDA decreased due to business restructuring, and the fee revision (in April,2025) EBITDA margin remained at a high level, reflecting strong profitability driven by cost optimization and efficient operations 1 EBITDA = Income from operations + Depreciation and amortization expense (Non-GAAP Financials: see p.26) 2 EBITDA margin (%) = EBITDA / Total revenues 3 ROE = Net income attributable to SBC Medical Group Holdings Incorporated / Average of SBC Medical Group Holdings Incorporated's stockholder's equity (beginning of the period and end of the period) 4 EPS (basic) = Net income attributable to SBC Medical Group Holdings Incorporated / Weighted average shares outstanding 22 % (YoY (9) pt) Total Revenues EBITDA 1 EBITDA Margin 2
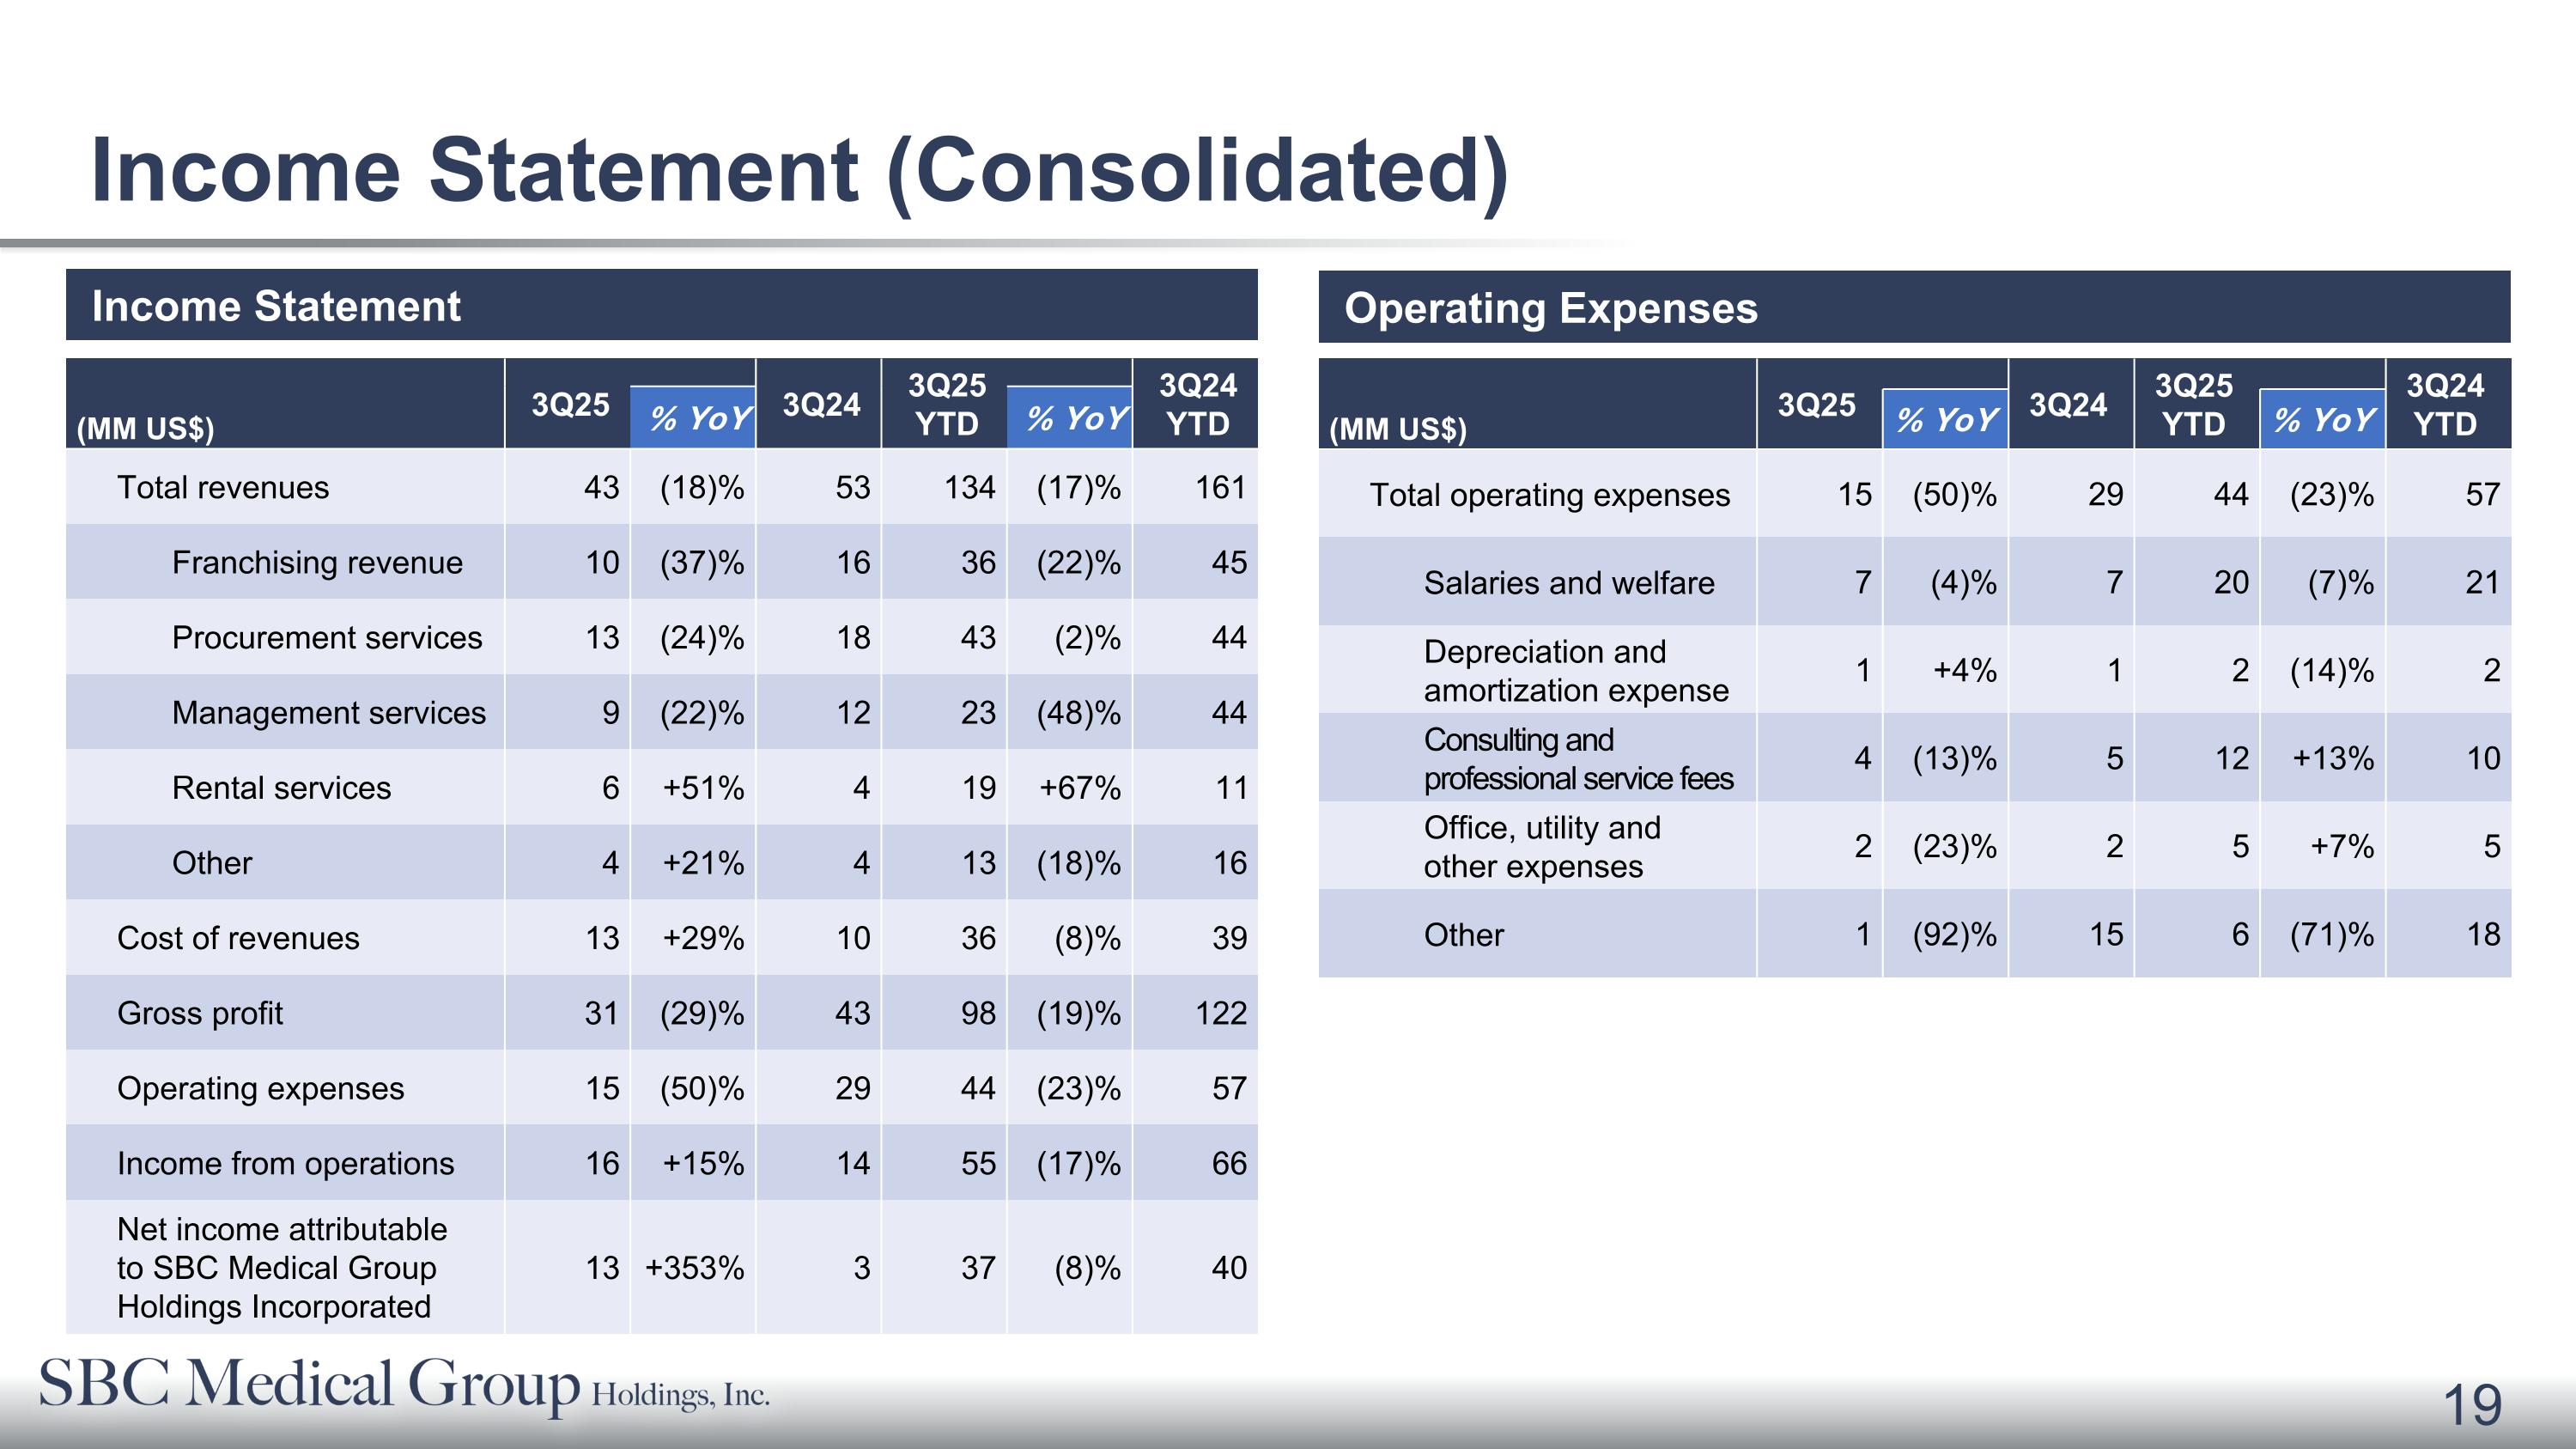
(MM US$) 3Q25 3Q24 3Q25 YTD 3Q24 YTD % YoY % YoY Total revenues 43 (18)% 53 134 (17)% 161 Franchising revenue 10 (37)% 16 36 (22)% 45 Procurement services 13 (24)% 18 43 (2)% 44 Management services 9 (22)% 12 23 (48)% 44 Rental services 6 +51% 4 19 +67% 11 Other 4 +21% 4 13 (18)% 16 Cost of revenues 13 +29% 10 36 (8)% 39 Gross profit 31 (29)% 43 98 (19)% 122 Operating expenses 15 (50)% 29 44 (23)% 57 Income from operations 16 +15% 14 55 (17)% 66 Net income attributable �to SBC Medical Group Holdings Incorporated 13 +353% 3 37 (8)% 40 Income Statement Income Statement (Consolidated) Operating Expenses (MM US$) 3Q25 3Q24 3Q25 YTD 3Q24 YTD % YoY % YoY Total operating expenses 15 (50)% 29 44 (23)% 57 Salaries and welfare 7 (4)% 7 20 (7)% 21 Depreciation and amortization expense 1 +4% 1 2 (14)% 2 Consulting and professional service fees 4 (13)% 5 12 +13% 10 Office, utility and �other expenses 2 (23)% 2 5 +7% 5 Other 1 (92)% 15 6 (71)% 18
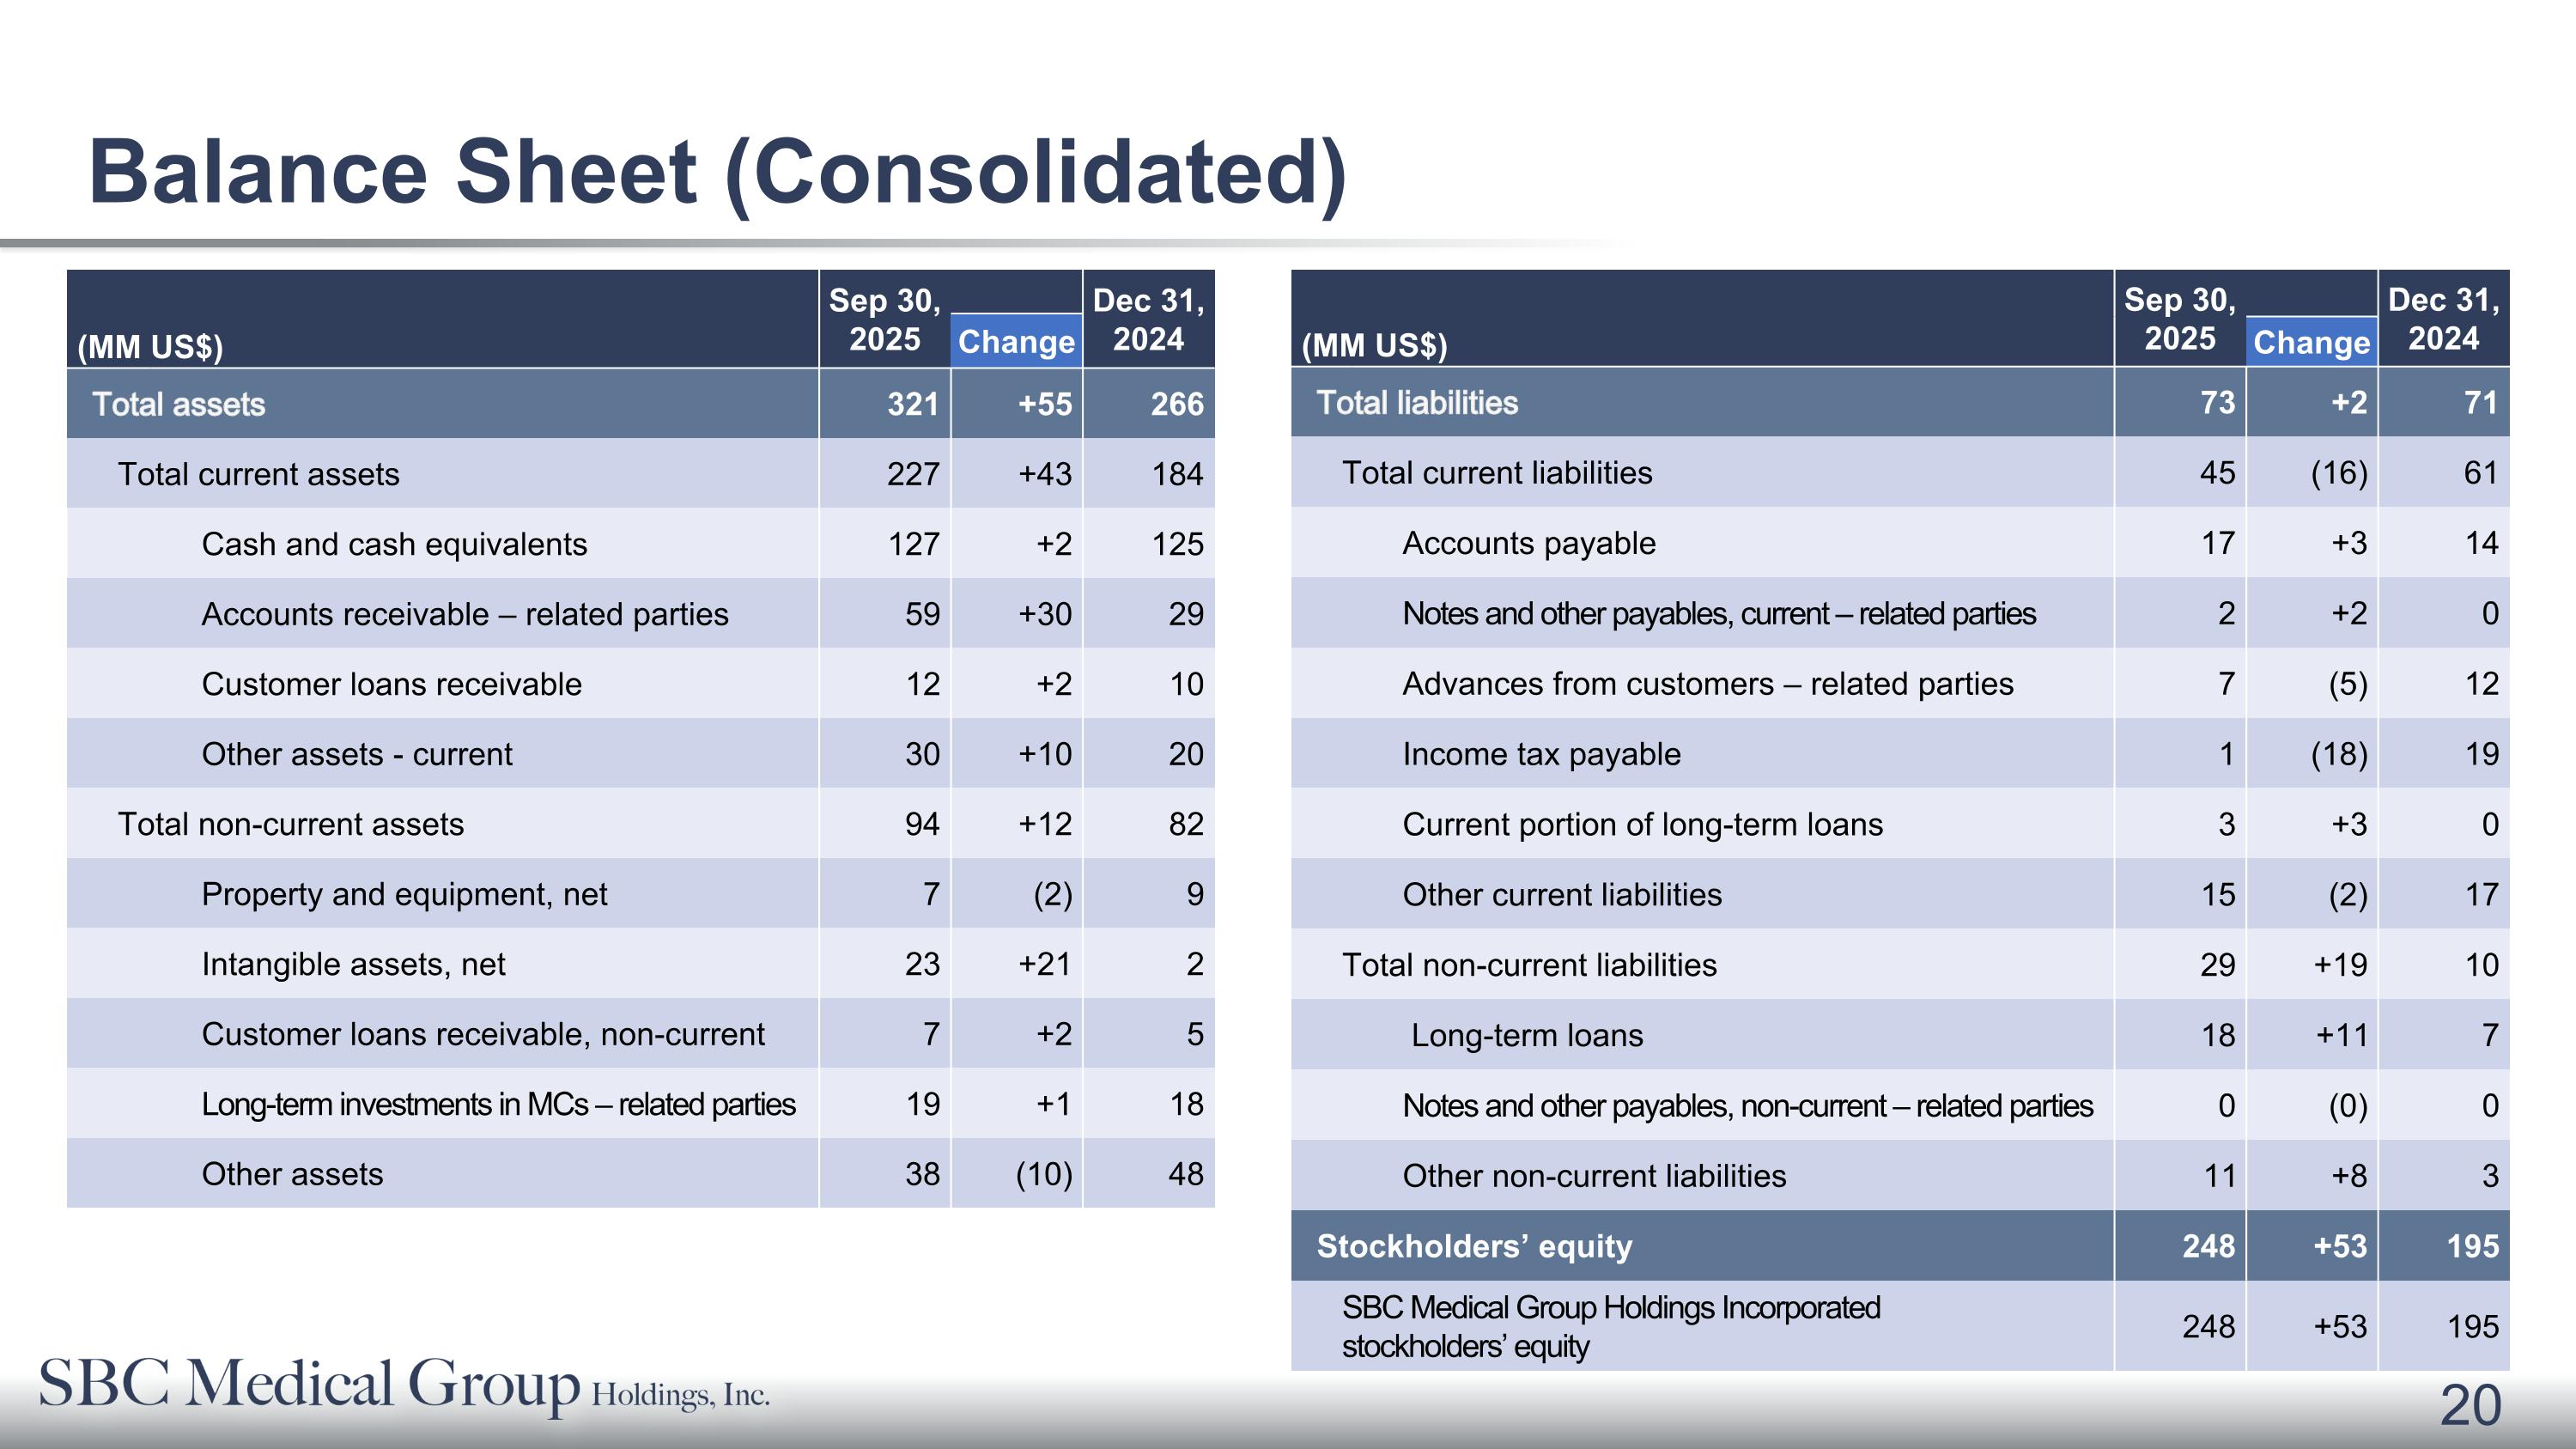
Balance Sheet (Consolidated) (MM US$) Sep 30, 2025 Dec 31, 2024 Change Total liabilities 73 +2 71 Total current liabilities 45 (16) 61 Accounts payable 17 +3 14 Notes and other payables, current – related parties 2 +2 0 Advances from customers – related parties 7 (5) 12 Income tax payable 1 (18) 19 Current portion of long-term loans 3 +3 0 Other current liabilities 15 (2) 17 Total non-current liabilities 29 +19 10 Long-term loans 18 +11 7 Notes and other payables, non-current – related parties 0 (0) 0 Other non-current liabilities 11 +8 3 Stockholders’ equity 248 +53 195 SBC Medical Group Holdings Incorporated �stockholders’ equity 248 +53 195 (MM US$) Sep 30, 2025 Dec 31, 2024 Change Total assets 321 +55 266 Total current assets 227 +43 184 Cash and cash equivalents 127 +2 125 Accounts receivable – related parties 59 +30 29 Customer loans receivable 12 +2 10 Other assets - current 30 +10 20 Total non-current assets 94 +12 82 Property and equipment, net 7 (2) 9 Intangible assets, net 23 +21 2 Customer loans receivable, non-current 7 +2 5 Long-term investments in MCs – related parties 19 +1 18 Other assets 38 (10) 48
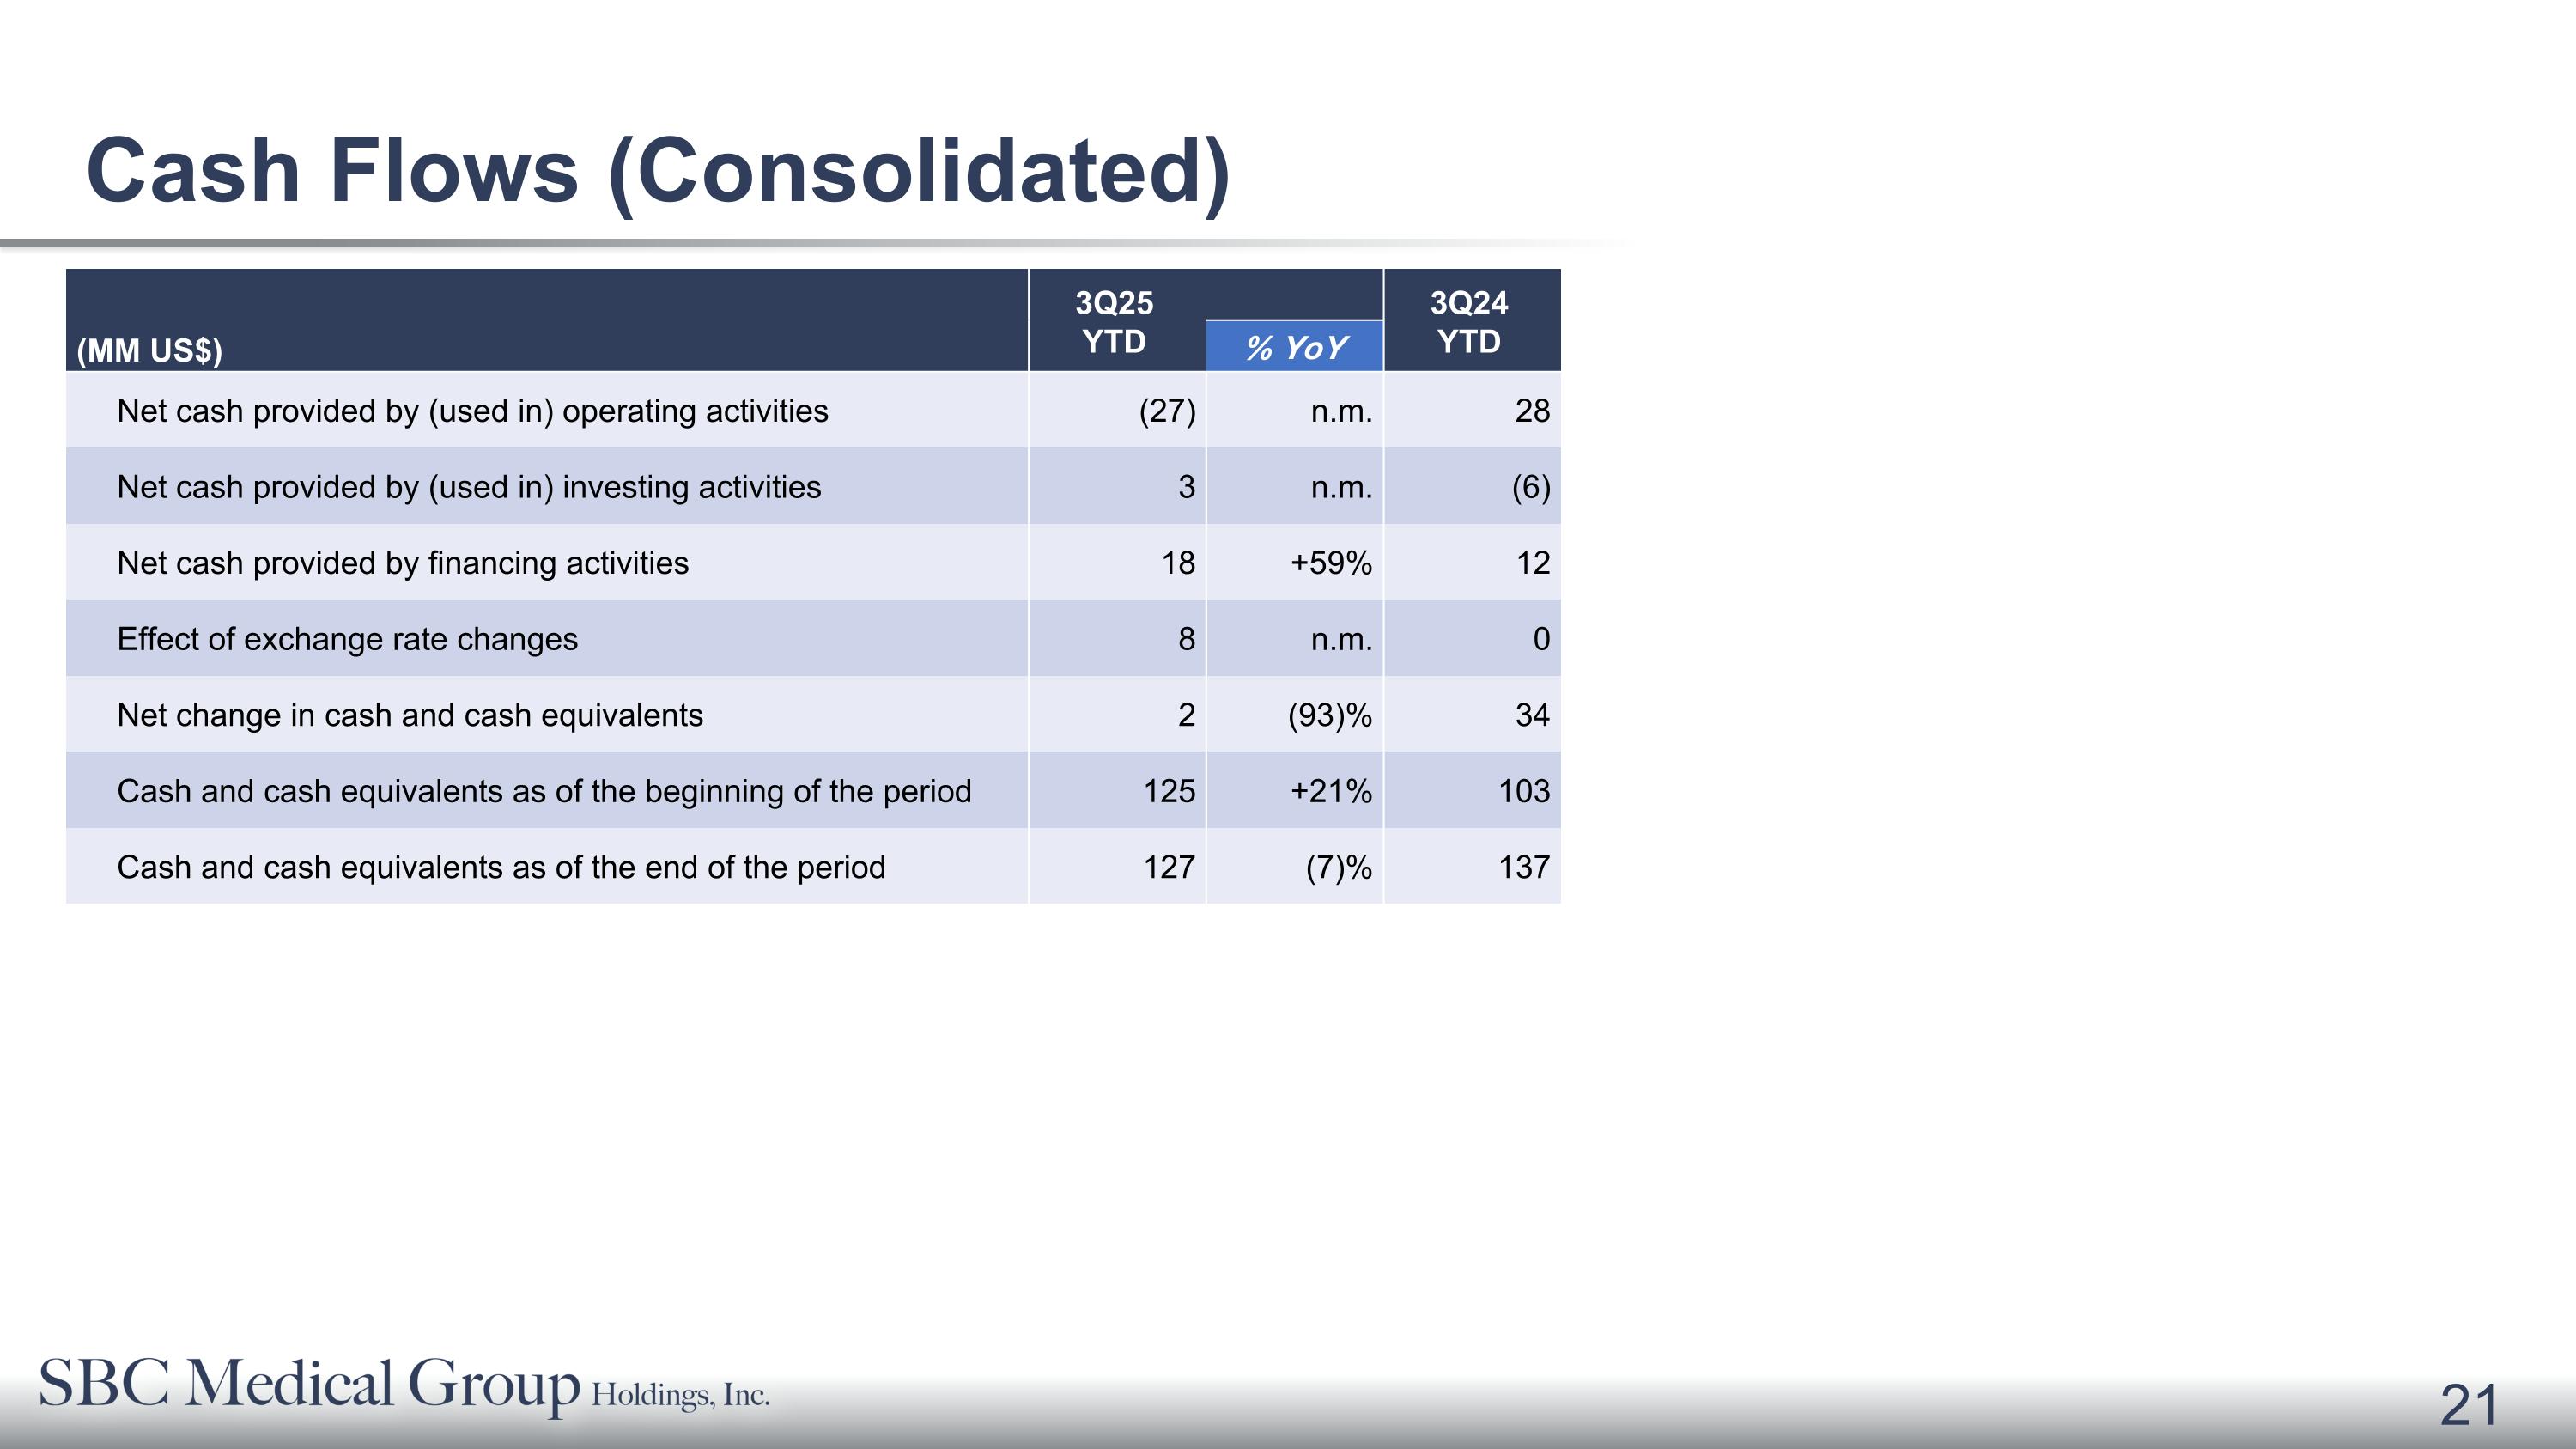
Cash Flows (Consolidated) (MM US$) 3Q25 YTD 3Q24 YTD % YoY Net cash provided by (used in) operating activities (27) n.m. 28 Net cash provided by (used in) investing activities 3 n.m. (6) Net cash provided by financing activities 18 +59% 12 Effect of exchange rate changes 8 n.m. 0 Net change in cash and cash equivalents 2 (93)% 34 Cash and cash equivalents as of the beginning of the period 125 +21% 103 Cash and cash equivalents as of the end of the period 127 (7)% 137
53.1 13,094 51.1 43.4 42.5 Revision of Fee Structure (Excluding revisions to fee structure) 3Q25 Others
Revenues FX Rental
services Revenue Management Services Revenue Procurement
Revenue Franchising
Revenue 3Q24 adjusted Termination of Temporary
Staffing Business Deconsolidation of SNA and Kijimadaira 3Q24 (Excluding revisions to fee structure) 3Q25 Adjusted FX (Based on 3Q24) 1 Exchange Rate(Year-To-Date Ave.) 3Q2024 151.1 JPY/USD 3Q2025 148.1 JPY/USD Impact of Structural Changes (8.6) Revenue 1 decreased year-over-year due to business restructuring and franchise fee revision (MM US$) 3Q25 Revenue Trend (vs 3Q24 / Quarterly)
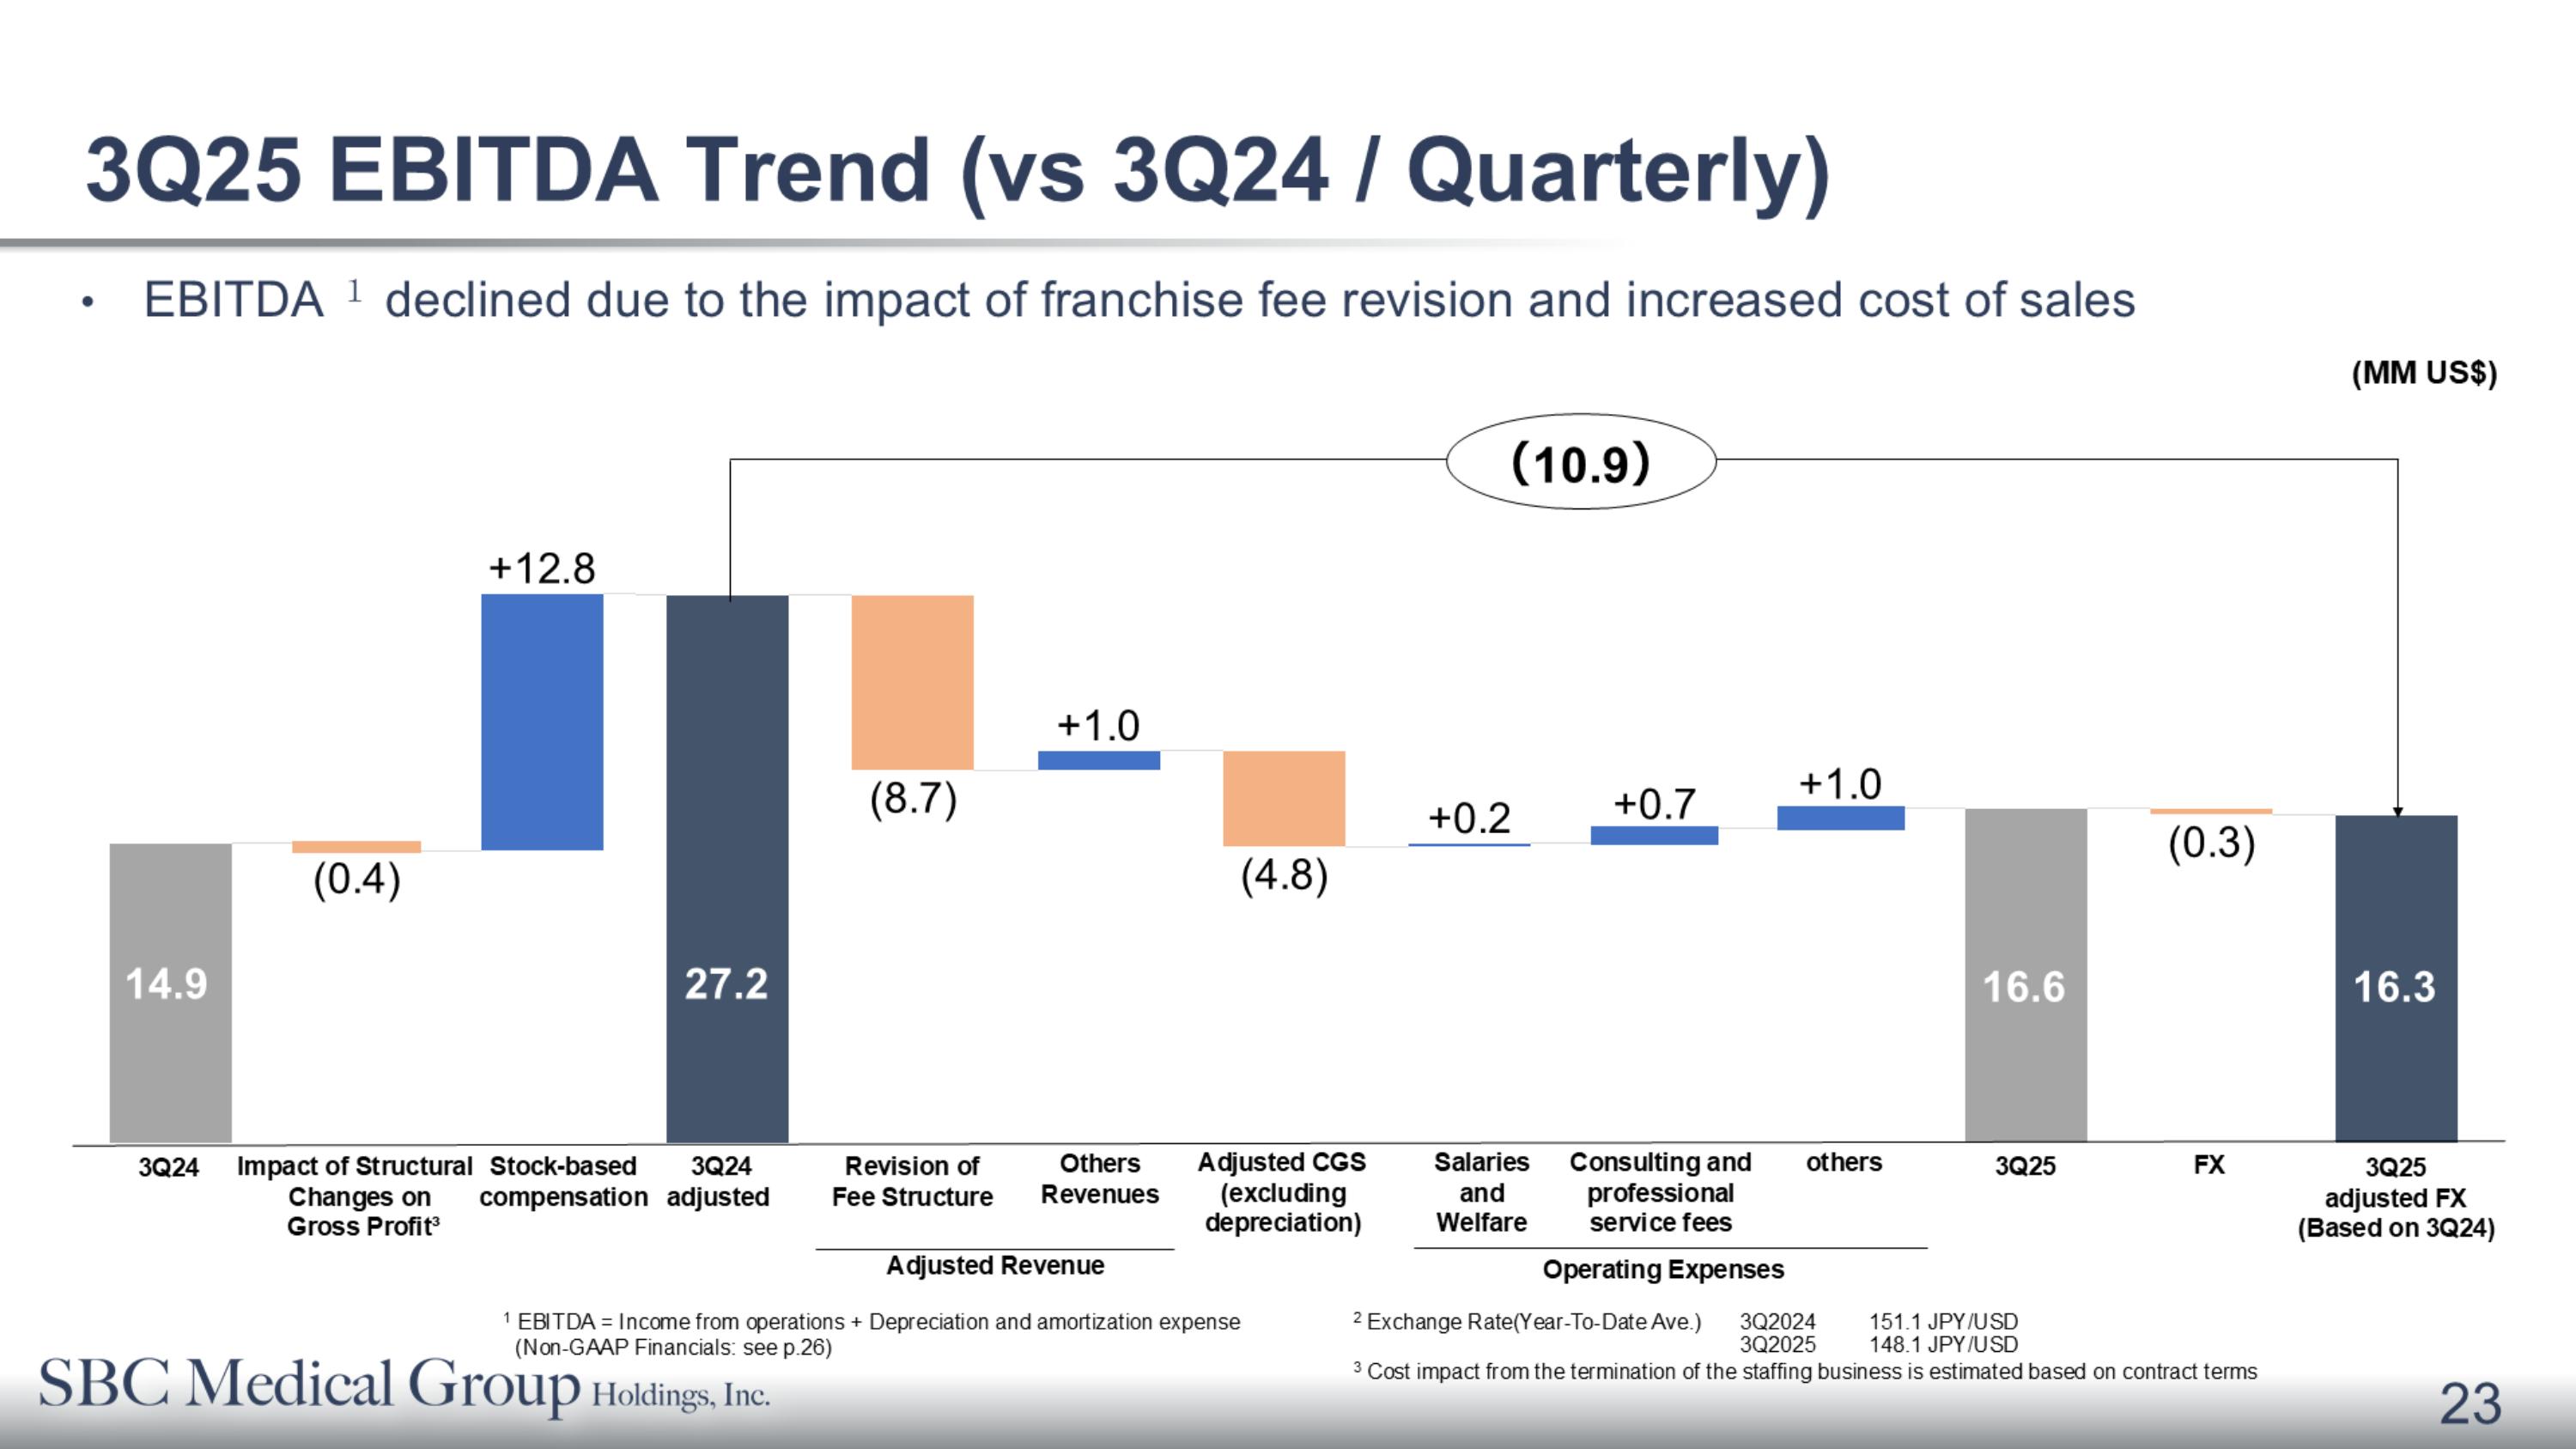
14.9 27.2 16.6 16.3 3Q24 Impact of Structural Changes on Gross Profit³ Adjusted CGS (excluding depreciation) 3Q25 FX 3Q24 adjusted Others
Revenues Salaries and Welfare Consulting and professional service fees others 3Q25 adjusted FX (Based on 3Q24) 1 EBITDA = Income from operations + Depreciation and amortization expense (Non-GAAP Financials: see p.26) 2 Exchange Rate(Year-To-Date Ave.) 3Q2024 151.1 JPY/USD 3Q2025 148.1 JPY/USD 3 Cost impact from the termination of the staffing business is estimated based on contract terms Revision of Fee Structure Adjusted Revenue Operating Expenses Stock-based compensation (10.9) EBITDA 1 declined due to the impact of franchise fee revision and increased cost of sales (MM US$) 23 3Q25 EBITDA Trend (vs 3Q24 / Quarterly)
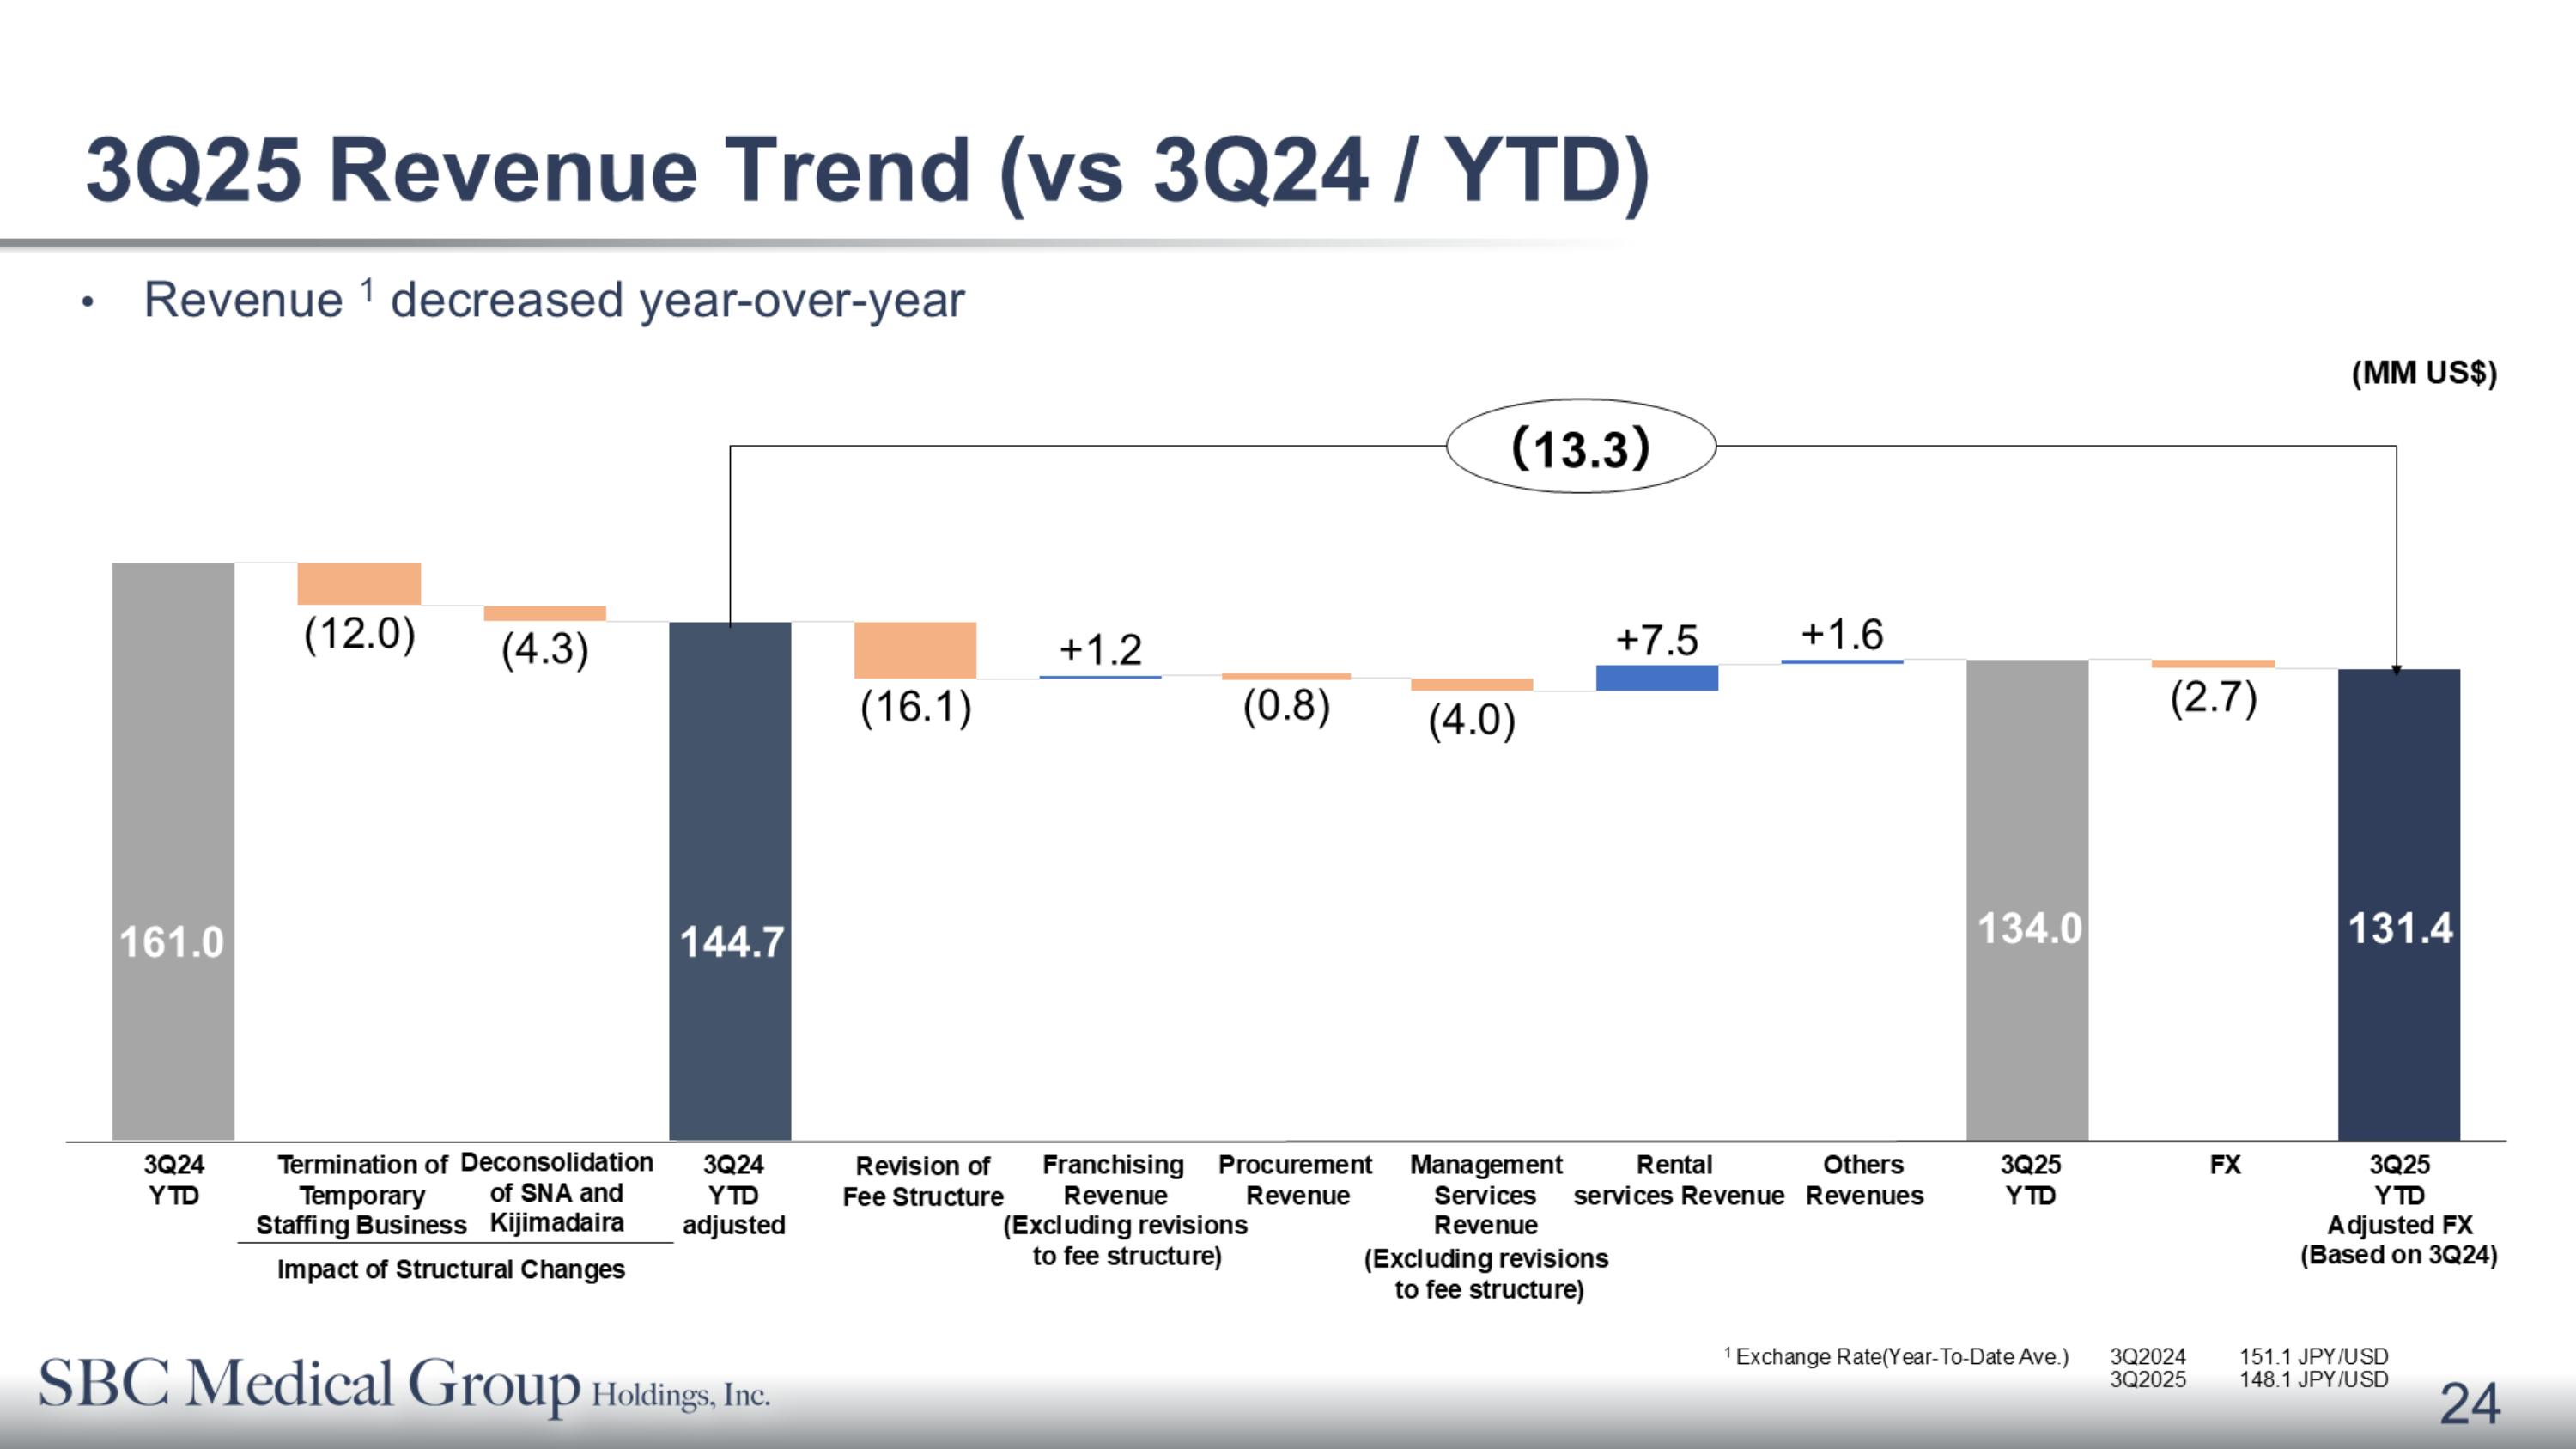
13,094 Revision of Fee Structure (Excluding revisions to fee structure) 3Q25 YTD Others
Revenues FX Rental
services Revenue Management Services Revenue Procurement
Revenue Franchising
Revenue 3Q24 YTD adjusted Termination of Temporary
Staffing Business Deconsolidation of SNA and Kijimadaira 3Q24 YTD (Excluding revisions to fee structure) 3Q25 YTD Adjusted FX (Based on 3Q24) Impact of Structural Changes 161.0 144.7 134.0 131.4 (13.3) Revenue 1 decreased year-over-year (MM US$) 3Q25 Revenue Trend (vs 3Q24 / YTD) 1 Exchange Rate(Year-To-Date Ave.) 3Q2024 151.1 JPY/USD 3Q2025 148.1 JPY/USD
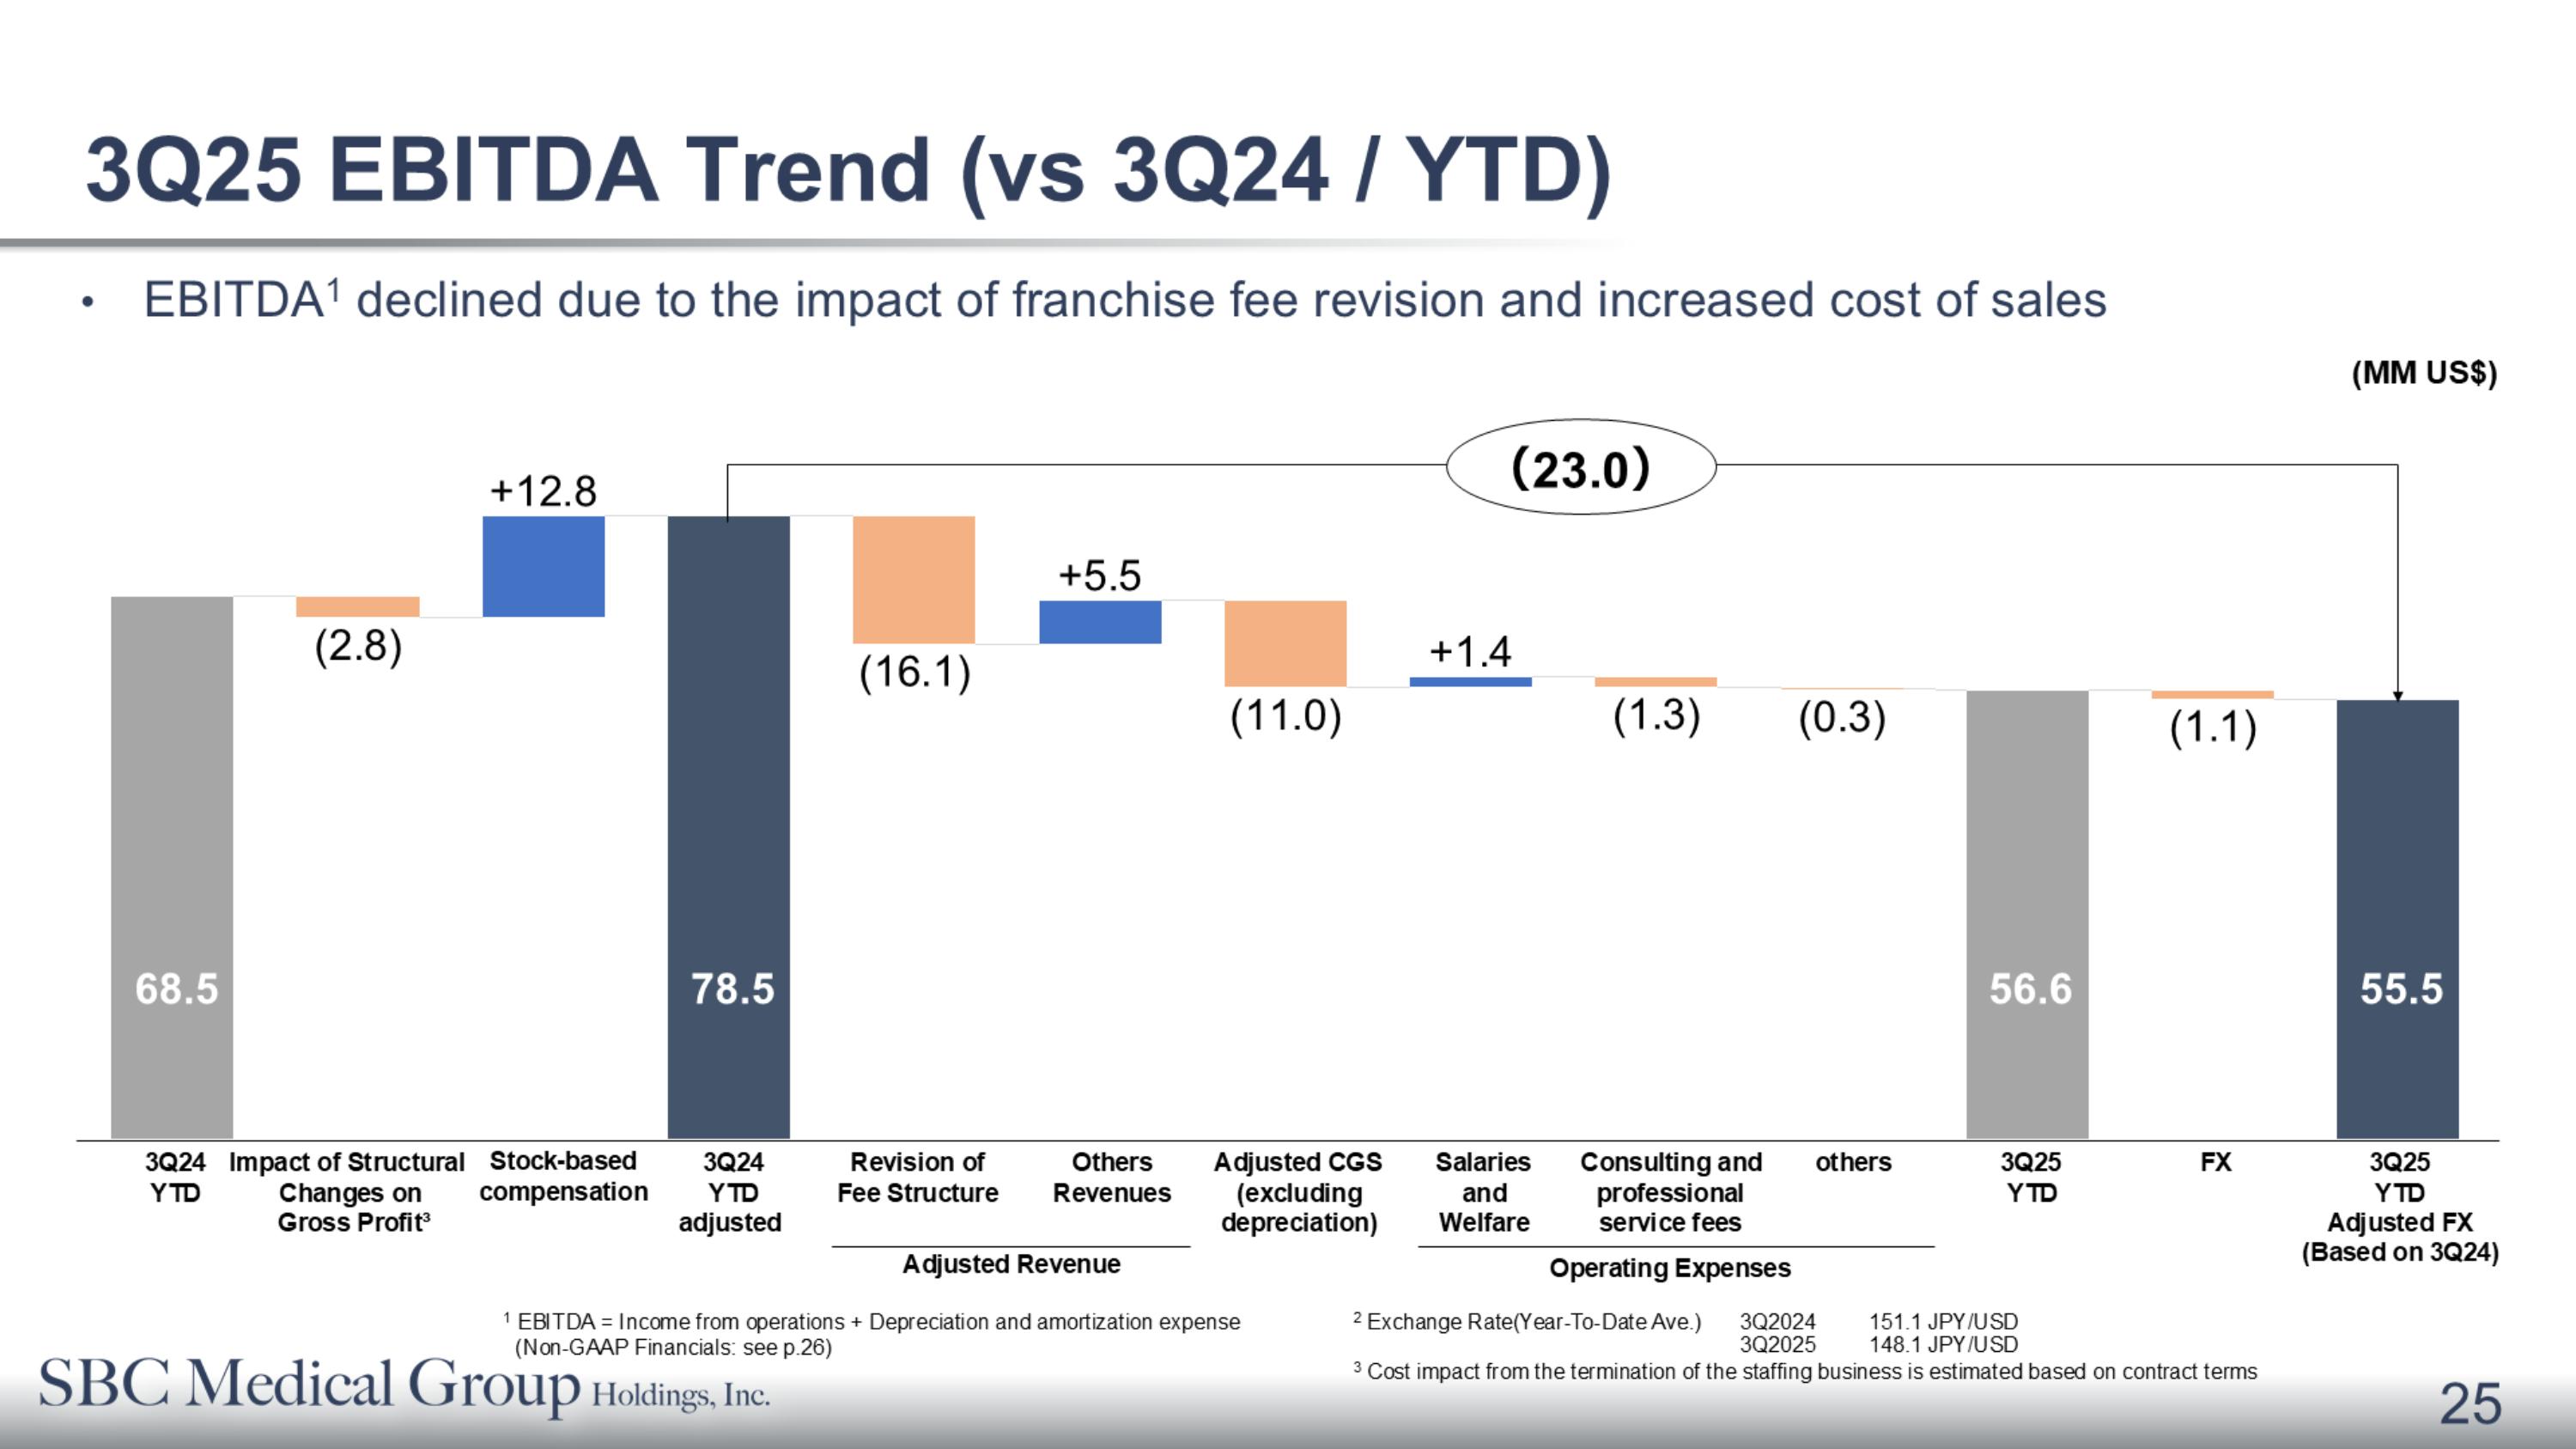
27.3 3Q24 YTD Impact of Structural Changes on Gross Profit³ Adjusted CGS (excluding depreciation) 3Q25 YTD FX 3Q24 YTD adjusted Others
Revenues Salaries and Welfare Consulting and professional service fees others 3Q25 YTD Adjusted FX (Based on 3Q24) Revision of Fee Structure (23.0) (MM US$) Adjusted Revenue Operating Expenses 68.5 78.5 56.6 55.5 Stock-based compensation EBITDA1 declined due to the impact of franchise fee revision and increased cost of sales 1 EBITDA = Income from operations + Depreciation and amortization expense (Non-GAAP Financials: see p.26) 25 3Q25 EBITDA Trend (vs 3Q24 / YTD) 2 Exchange Rate(Year-To-Date Ave.) 3Q2024 151.1 JPY/USD 3Q2025 148.1 JPY/USD 3 Cost impact from the termination of the staffing business is estimated based on contract terms
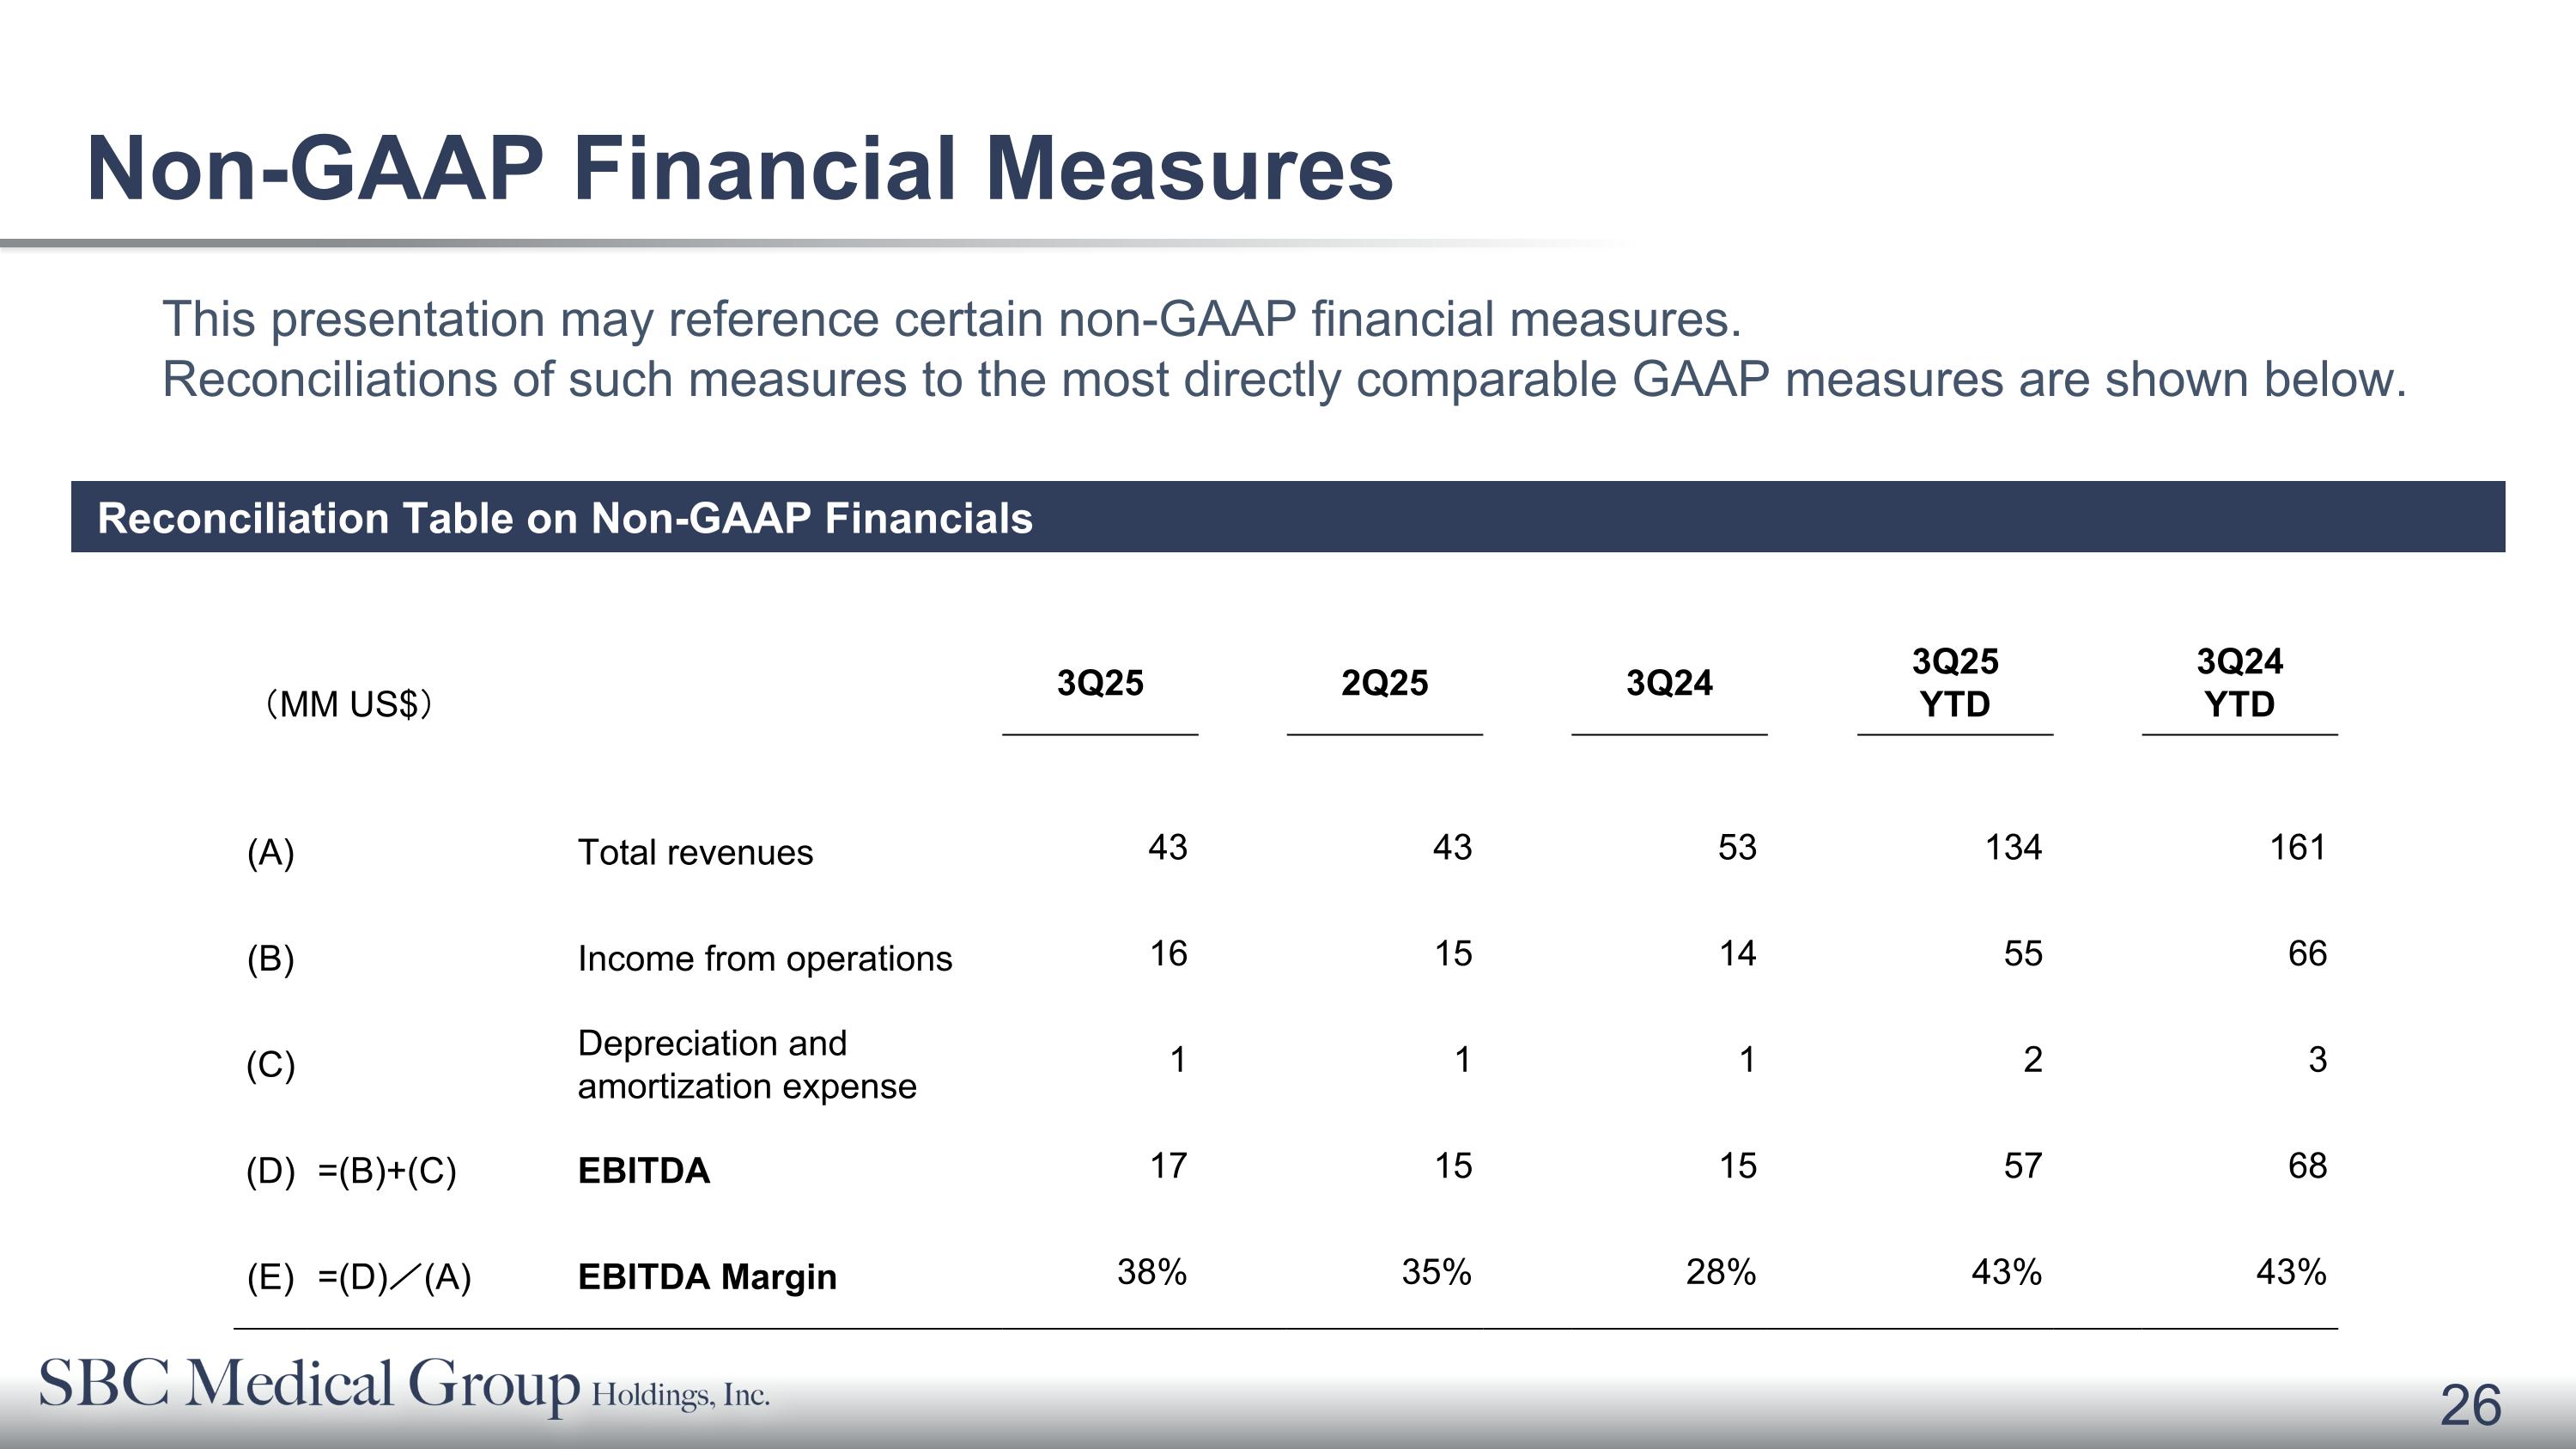
Non-GAAP Financial Measures (MM US$) 3Q25 2Q25 3Q24 3Q25 YTD 3Q24 YTD (A) Total revenues 43 43 53 134 161 (B) Income from operations 16 15 14 55 66 (C) Depreciation and amortization expense 1 1 1 2 3 (D) =(B)+(C) EBITDA 17 15 15 57 68 (E) =(D)/(A) EBITDA Margin 38% 35% 28% 43% 43% This presentation may reference certain non-GAAP financial measures. �Reconciliations of such measures to the most directly comparable GAAP measures are shown below. Reconciliation Table on Non-GAAP Financials

Thank you SBC Medical Group Holdings Incorporated / [email protected] ICR, LLC / US Investor Contact / +1 (646) 277 1200 /[email protected]