sbra-20211103
false000149229800014922982021-11-032021-11-03

  
UNITED STATES
SECURITIES AND EXCHANGE COMMISSION
WASHINGTON, D.C. 20549
FORM 8-K
CURRENT REPORT
PURSUANT TO SECTION 13 OR 15(d) OF THE
SECURITIES EXCHANGE ACT OF 1934
Date of Report (Date of earliest event reported): November 3, 2021
SABRA HEALTH CARE REIT, INC.
(Exact name of registrant as specified in its charter)
 
Maryland 001-34950 27-2560479
(State of
Incorporation)
 (Commission
File Number)
 (I.R.S. Employer
Identification No.)
 
18500 Von Karman AvenueSuite 550
Irvine
CA
92612
(Address of principal executive offices)(Zip Code)
Registrant's telephone number including area code: (888393-8248  
(Former name or former address, if changed since last report.)
Check the appropriate box below if the Form 8-K filing is intended to simultaneously satisfy the filing obligation of the registrant under any of the following provisions:  
Written communications pursuant to Rule 425 under the Securities Act (17 CFR 230.425)
Soliciting material pursuant to Rule 14a-12 under the Exchange Act (17 CFR 240.14a-12)
Pre-commencement communications pursuant to Rule 14d-2(b) under the Exchange Act (17 CFR 240.14d-2(b))
Pre-commencement communications pursuant to Rule 13e-4(c) under the Exchange Act (17 CFR 240.13e-4(c))

Securities registered pursuant to Section 12(b) of the Act:
Title of each classTrading symbol(s)Name of each exchange on which registered
Common stock, $0.01 par valueSBRAThe Nasdaq Stock Market LLC

Indicate by check mark whether the registrant is an emerging growth company as defined in Rule 405 of the Securities Act of 1933 (§230.405 of this chapter) or Rule 12b-2 of the Securities Exchange Act of 1934 (§240.12b-2 of this chapter).
Emerging growth company
If an emerging growth company, indicate by check mark if the registrant has elected not to use the extended transition period for complying with any new or revised financial accounting standards provided pursuant to Section 13(a) of the Exchange Act.


Item 2.02Results of Operations and Financial Condition.
On November 3, 2021, Sabra Health Care REIT, Inc. (“Sabra”) issued a press release reporting its results of operations for the three month period ended September 30, 2021. The press release refers to the Reconciliations of Non-GAAP Financial Measures that is available on the Investors section of Sabra’s website, free of charge, at www.sabrahealth.com. The text of the press release and the Reconciliations of Non-GAAP Financial Measures are furnished herewith as Exhibits 99.1 and 99.3, respectively, and are specifically incorporated by reference herein.
Item 7.01Regulation FD Disclosure.
The press release furnished herewith as Exhibit 99.1 refers to a supplemental information package that is available on the Investors section of Sabra’s website, free of charge, at www.sabrahealth.com. The text of the supplemental information package is furnished herewith as Exhibit 99.2 and is specifically incorporated by reference herein.
The information in Items 2.02 and 7.01 of this Form 8-K and the information in Exhibits 99.1, 99.2 and 99.3 attached hereto shall not be deemed “filed” for purposes of Section 18 of the Securities Exchange Act of 1934, as amended (the “Exchange Act”), or otherwise subject to the liabilities of that section and shall not be incorporated by reference into any filing of Sabra under the Securities Act of 1933, as amended, or the Exchange Act, regardless of any general incorporation language in such filing, except as shall be expressly set forth by specific reference in any such filing.
Item 9.01Financial Statements and Exhibits.
 
(d)Exhibits.
99.1
99.2
99.3
104Cover Page Interactive Data File (embedded within the Inline XBRL document).


SIGNATURES
Pursuant to the requirements of the Securities Exchange Act of 1934, the Registrant has duly caused this report to be signed on its behalf by the undersigned hereunto duly authorized.
 
SABRA HEALTH CARE REIT, INC.
/S/    HAROLD W. ANDREWS, JR.
Name: Harold W. Andrews, Jr.
Title: Executive Vice President, Chief Financial
Officer and Secretary
Date: November 3, 2021


sabralogo21.jpg
Exhibit 99.1
FOR IMMEDIATE RELEASE

SABRA REPORTS THIRD QUARTER 2021 RESULTS; PROVIDES BUSINESS UPDATE; REAFFIRMS 2021 NFFO AND NAFFO GUIDANCE

IRVINE, CA, November 3, 2021 — Sabra Health Care REIT, Inc. (“Sabra,” the “Company” or “we”) (Nasdaq: SBRA) today announced its results of operations for the third quarter of 2021. In addition, the Company provided a business update, reaffirmed its full-year 2021 guidance for Normalized FFO and Normalized AFFO and provided updates to previously issued 2021 per share guidance for net loss, FFO and AFFO.

THIRD QUARTER 2021 RESULTS AND RECENT EVENTS

Following are the highlights of our results for the third quarter of 2021 and recent events:
For the third quarter of 2021, net income, FFO, Normalized FFO, AFFO and Normalized AFFO per diluted common share were $0.05, $0.27, $0.38, $0.38 and $0.38, respectively. Included in net income and FFO is the write-off of $25.2 million ($0.11 per diluted common share) of straight-line rent receivables related to our lease with the Avamere Family of Companies (“Avamere”). As noted in our September 13, 2021 business update, Avamere has experienced cash flow constraints over the past several months and as a result, we subsequently determined that this lease should no longer be accounted for on an accrual basis and wrote off its straight-line rent receivable balance. This write-off is reflected as a reduction of our rental revenues for the third quarter of 2021. See further discussion on Avamere under “Business Update.”
EBITDARM Coverage for our Skilled Nursing/Transitional Care and Specialty Hospitals and Other portfolios were 1.78x and 3.86x, respectively. Together, our Aggregate Acute/Post Acute and Other facilities reported EBITDARM Coverage of 2.09x, 0.02x higher than the third quarter of 2020 and 0.18x lower than the second quarter of 2021. See further discussion on EBITDARM Coverage trends under “Business Update.”
From the beginning of the COVID-19 pandemic through October 2021, we have collected 99.7% of our forecasted rents. This includes drawing on a letter of credit to fund $7.9 million of rent for September and October of 2021 due from Avamere.
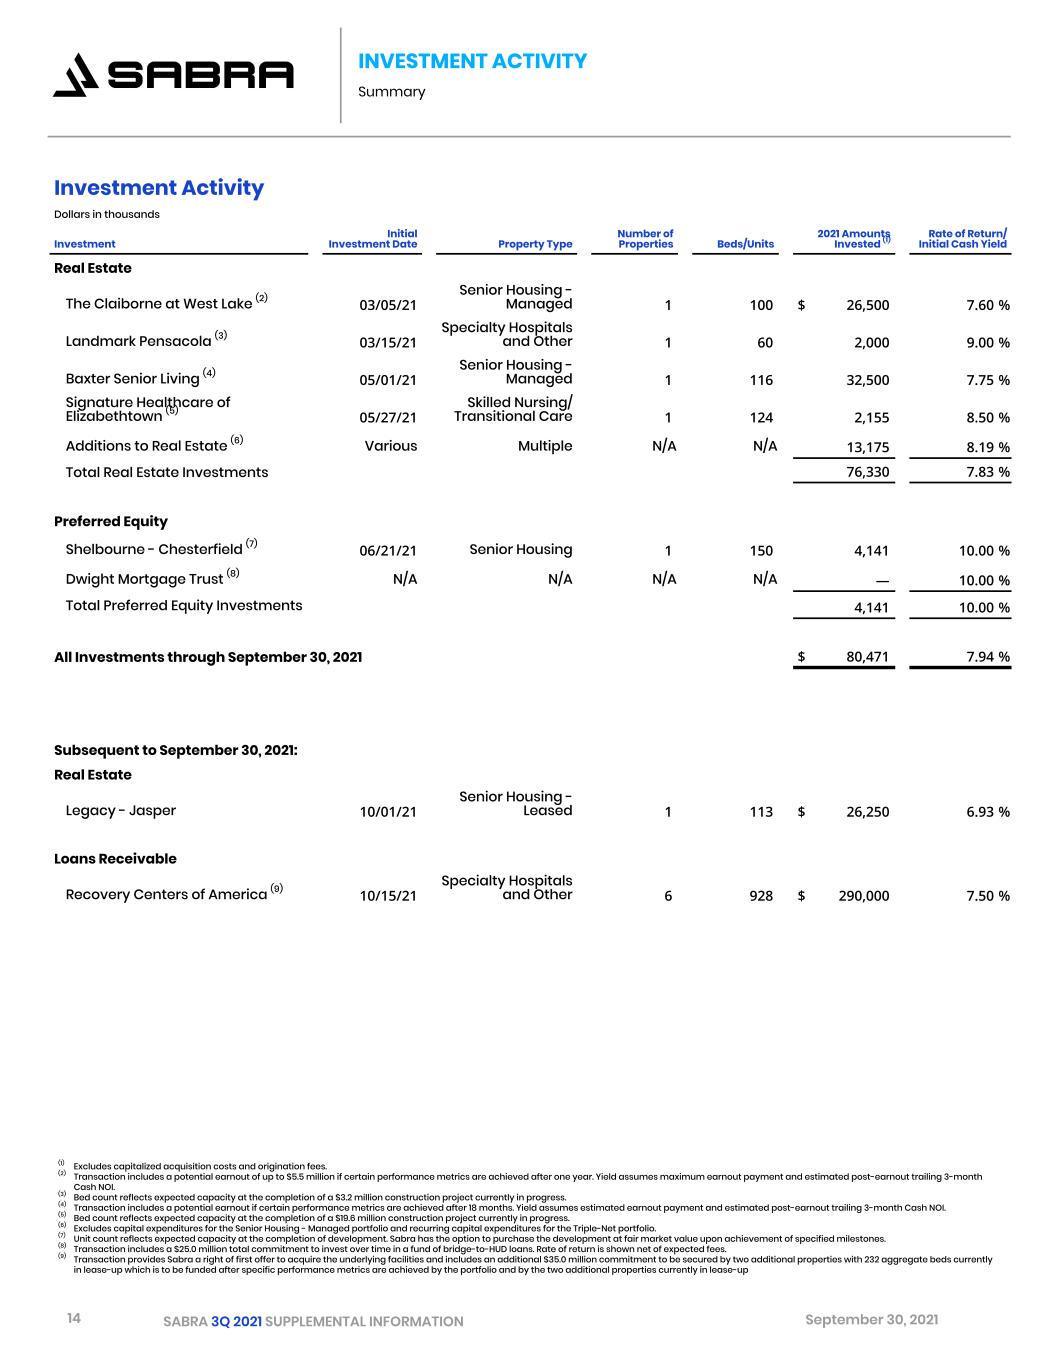
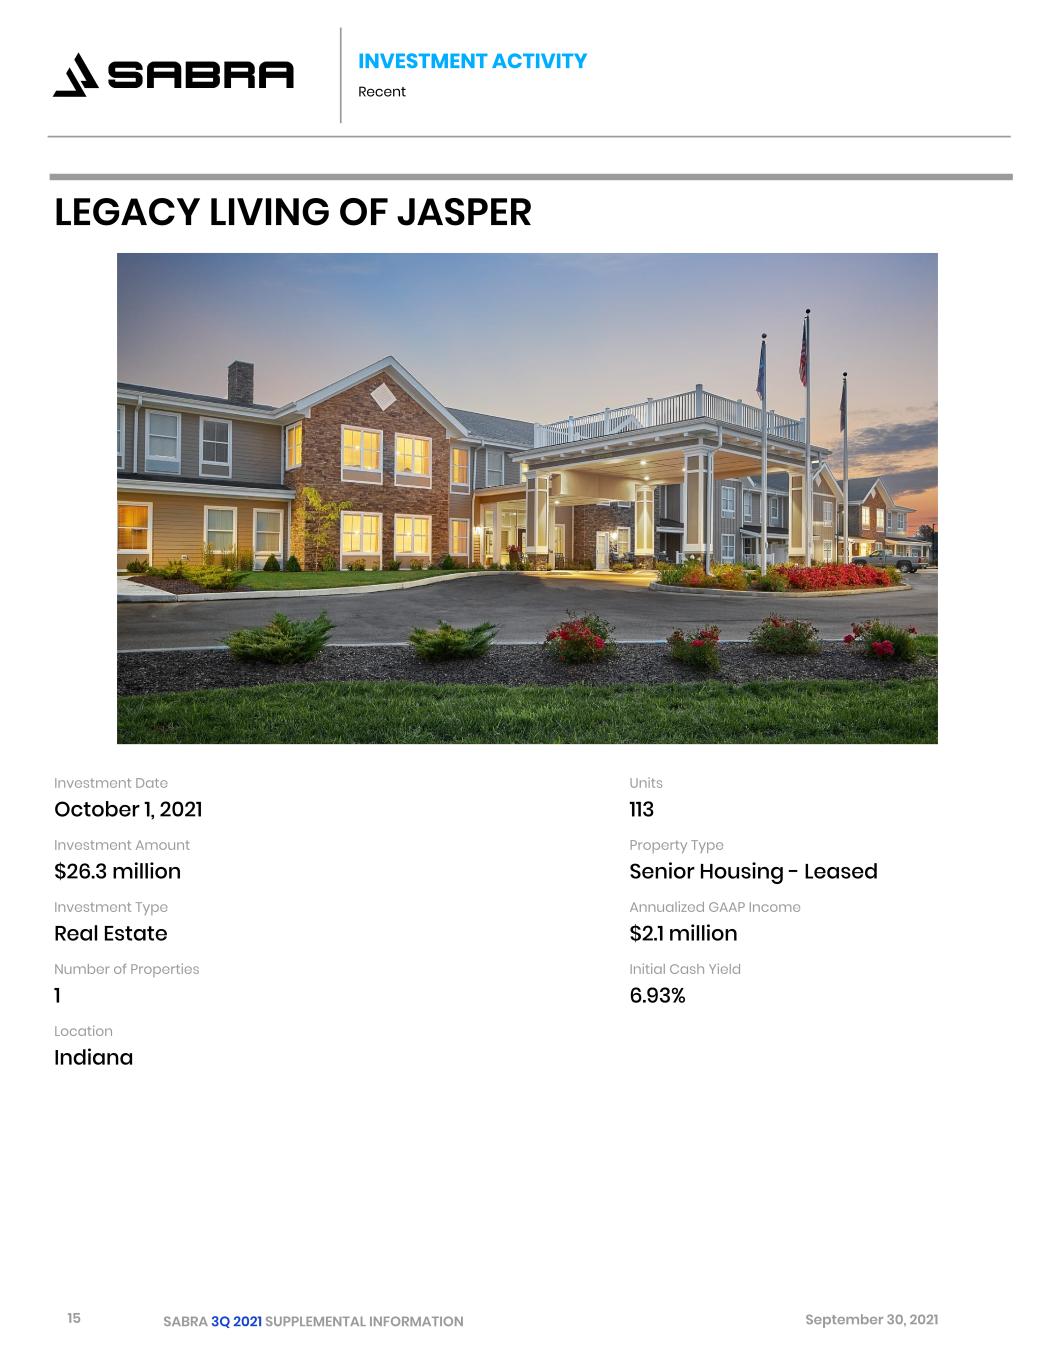
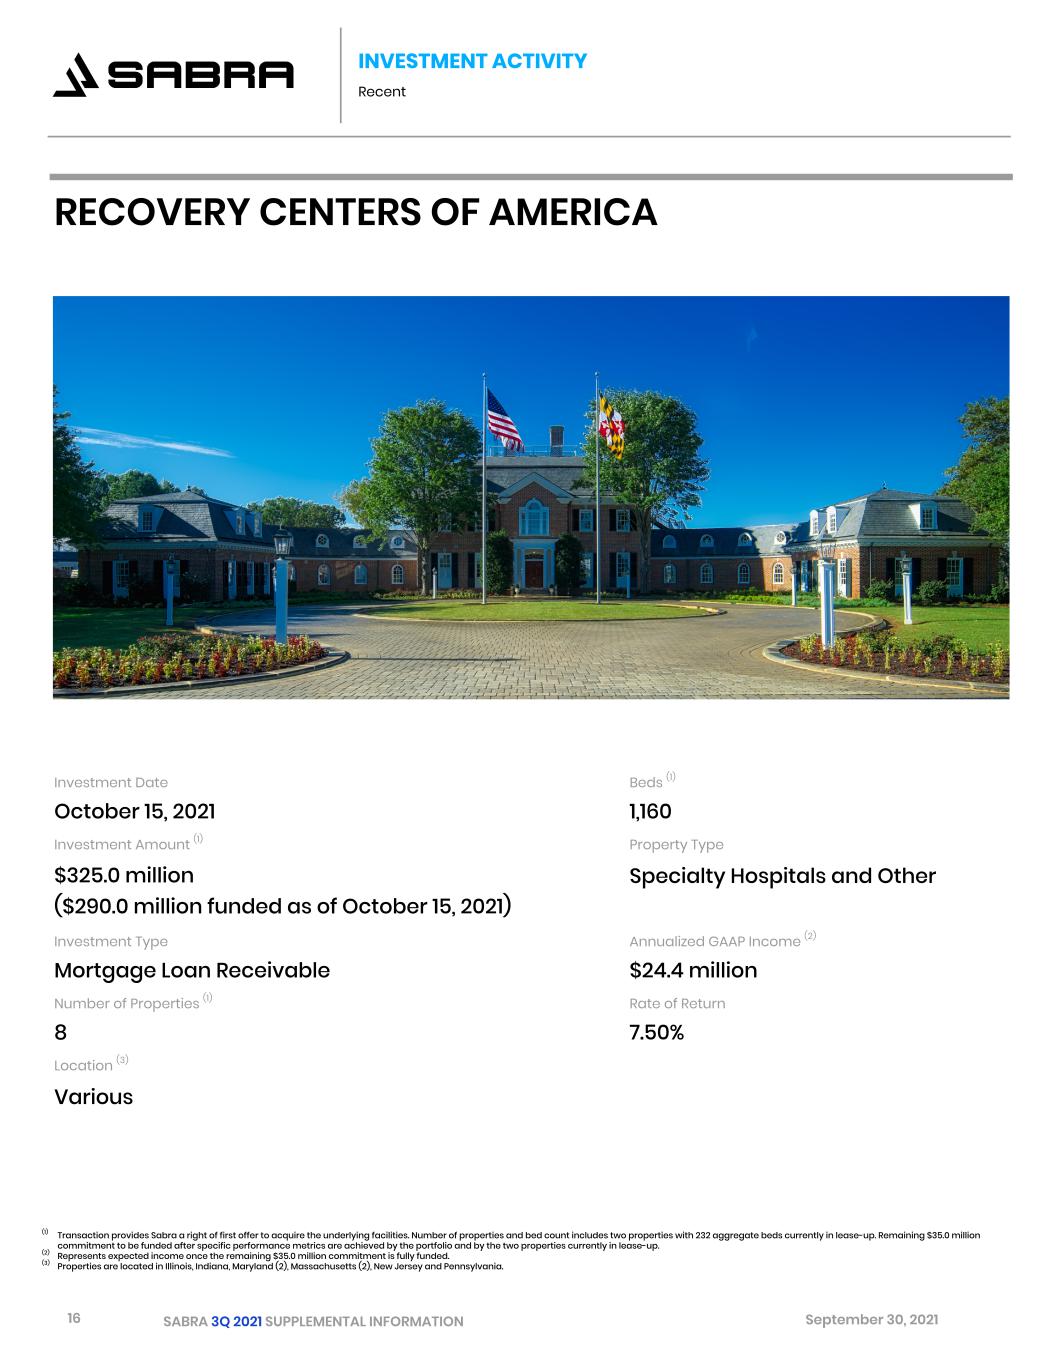
Subsequent to September 30, 2021, Sabra closed on the first tranche of the previously announced $325 million mortgage loan, that when fully funded, will be secured by eight inpatient addiction treatment centers operated by Recovery Centers of America Holdings, LLC (“RCA”) located in the Northeast and Midwest regions of the United States (the “RCA Mortgage Loan”). The first tranche, totaling $290 million, is secured by mortgages on six of the eight addiction treatment centers. Funding of the $35 million second tranche is contingent upon the portfolio and the remaining two centers achieving specific performance metrics. In addition, we acquired one Senior Housing - Leased community for a purchase price of $26.3 million with an estimated cash yield of 6.93%.
Our year-to-date investment activity totals $396.7 million with a weighted average estimated stabilized cash yield of 7.55%.
During the third quarter of 2021, we completed the sale of four Senior Housing communities for aggregate net sales proceeds of $6.7 million. These four facilities did not generate any Cash NOI during 2021.
Subsequent to September 30, 2021, we completed the sale of four Skilled Nursing/Transitional Care facilities and one Senior Housing community for net sales proceeds of $16.1 million, inclusive of the repayment of an aggregate $9.9 million of HUD-insured mortgage debt encumbering two of the facilities. These facilities generated $2.5 million of Annualized Cash NOI, and annual interest expense on the HUD-insured mortgage debt was $0.3 million.
On September 30, 2021, we issued $800.0 million of 3.20% senior unsecured notes due in 2031. The net proceeds were used to repay $345.0 million of our U.S. dollar term loans, redeem all $300.0 million of our outstanding 4.80%
sabralogo21.jpg
1


senior unsecured notes due in 2024 (which redemption occurred on October 7, 2021) and to fund a portion of the RCA Mortgage Loan.
On October 15, 2021, we completed an underwritten public offering of 7.8 million newly issued shares of our common stock at a price of $14.40 per share and received net proceeds, before expenses, of $112.6 million. These proceeds were used to fund a portion of the RCA Mortgage Loan.
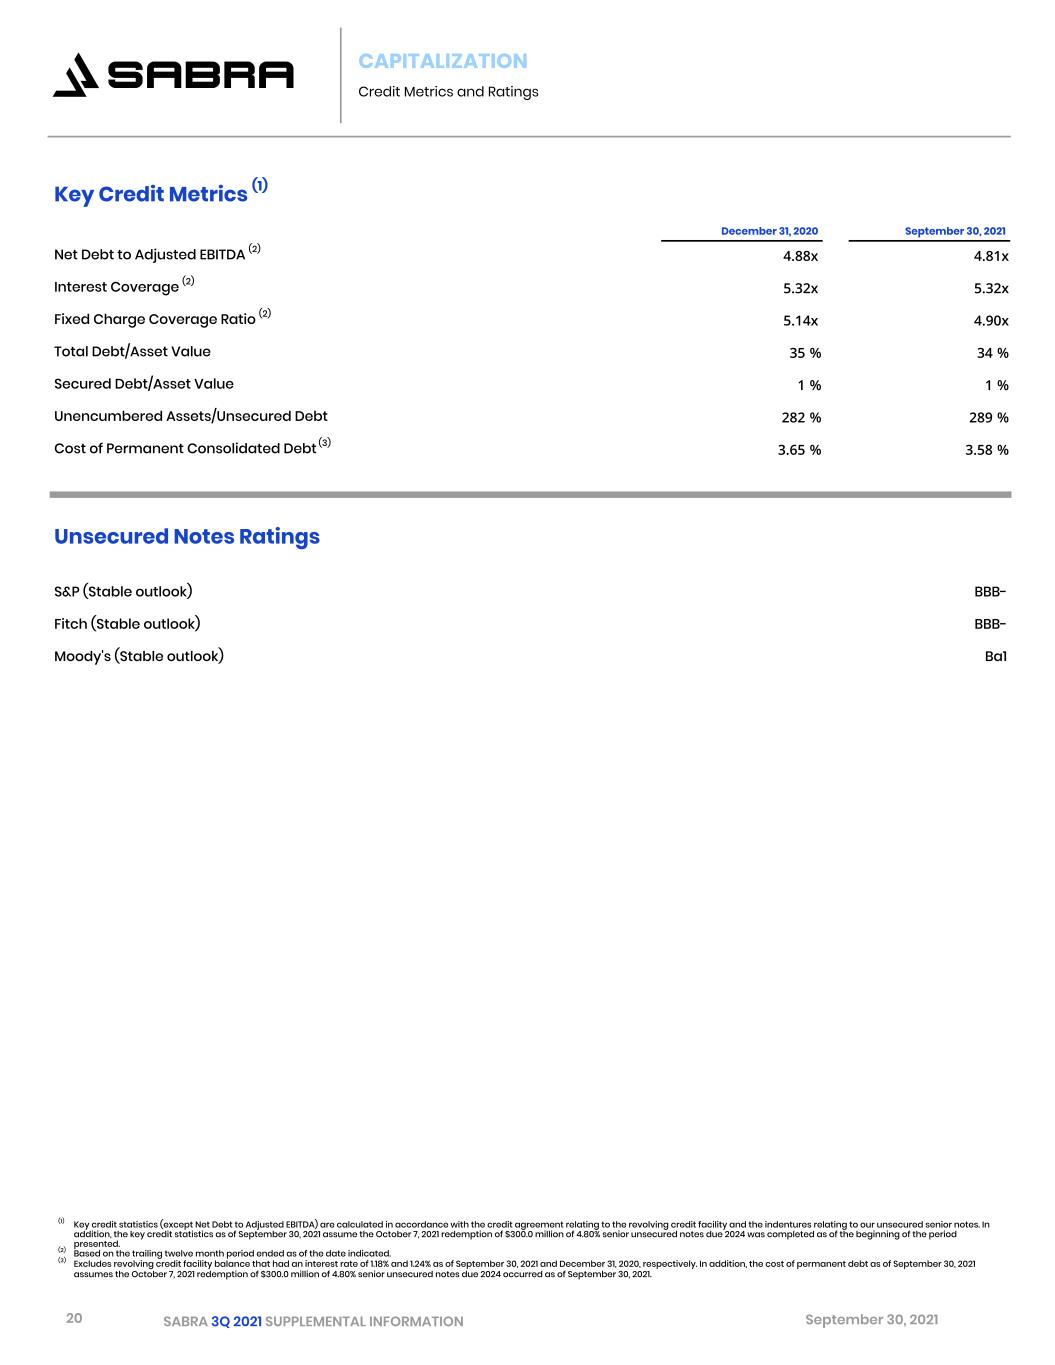
We continue to maintain a strong Net Debt to Adjusted EBITDA ratio of 4.81x.
On November 3, 2021, our Board of Directors declared a quarterly cash dividend of $0.30 per share of common stock. The dividend will be paid on November 30, 2021 to common stockholders of record as of the close of business on November 16, 2021. The dividend represents a payout of 79% of our Normalized AFFO per share of $0.38.

BUSINESS UPDATE — IMPACT OF THE COVID-19 PANDEMIC ON OUR PORTFOLIO

Avamere
As noted in our September 13, 2021 business update, Avamere has experienced cash flow constraints over the past several months from census declines as a result of a spike in COVID-19 cases in Oregon, Colorado and Washington together with admissions limitations in these states, as well as from increased labor pressure. To date, we have drawn $7.9 million from Avamere’s letter of credit to fund rental obligations for September and October 2021 and expect to use most of the remaining balance of the letter of credit to fund Avamere’s rental obligations for November 2021. Avamere currently leases 27 facilities from us under a triple-net master lease for a total annual rent of $44.1 million. The lease with Avamere expires on May 31, 2031. We have evaluated the impact of these recent events, and the mitigation efforts that Avamere has advised us it is taking or expects to take, on Avamere’s ability to pay its lease obligations for the remaining term of its lease and concluded that this lease should no longer be accounted for on an accrual basis. We consequently wrote off $25.2 million of non-cash rent receivable balances related to this lease. If the lease is amended in the future, the terms of any such amendment may result in us writing off or accelerating the amortization on all or a portion of the above-market lease intangible asset associated with the Avamere lease, which totaled $19.1 million as of September 30, 2021.

Average Occupancy and Skilled Mix Census — Triple-Net Portfolio
Average occupancy in our portfolio continues to recover despite the surge of the Delta variant in the broader population during the third quarter. Vaccine uptake has been high among patients and residents across the acuity spectrum and infection and mortality rates have remained low despite the rise in COVID-19 cases in the general community. Average occupancy for our Skilled Nursing/Transitional Care portfolio hit a trough in the final weeks of December 2020 and has improved materially since then but the pace of recovery decelerated in the summer as the Delta variant emerged. Our top eight Skilled Nursing operators, which comprise 68% of our Skilled Nursing rent, saw increased average occupancy of 536 basis points from the late-December 2020 low point through mid-October 2021. Excluding Avamere, which has experienced a 274 basis point decrease in census since late-December 2020, average occupancy for our remaining top seven skilled nursing operators has increased 701 basis points since late-December 2020. Avamere’s occupancy dropped to as low as 67% in the first half of October 2021 as a result of admission restrictions in the states they operate in, but currently occupancy is at 71%, primarily reflecting occupancy benefits from the establishment of new COVID-specific units in the state of Oregon.
Skilled Mix census in our Skilled Nursing/Transitional Care portfolio stands 48 basis points higher as of mid-October 2021 compared to February 2020 pre-pandemic levels, but is down from the prior quarter due to the number of COVID patients materially decreasing.
Average occupancy for our same-store Senior Housing - Leased portfolio bottomed out during the first half of February 2021 and has increased 465 basis points through mid-October 2021, an increase of 100 basis points from mid-July 2021.
Excluding one non-stabilized facility, average occupancy from February 2020 through mid-October 2021 for our Specialty Hospitals and Other portfolio increased 125 basis points and has remained strong throughout the pandemic.

sabralogo21.jpg
2


Same-Store Senior Housing - Managed REVPOR
REVPOR in our Senior Housing - Managed portfolio held up during the pandemic despite pressure on occupancy and significant discounting by some competing operators.
3Q 20212Q 20211Q 20214Q 20203Q 2020YoY Change
Assisted living$6,066 $6,028 $5,952 $6,062 $5,962 
Sequential Change0.6 %1.3 %(1.8)%1.7 %1.7 %
Independent living$2,532 $2,545 $2,553 $2,529 $2,544 
Sequential Change(0.5)%(0.3)%0.9 %(0.6)%(0.5)%

Same-Store Senior Housing - Managed Occupancy and NOI
Since the roll-out of the vaccines, we continue to see a greater occupancy recovery in higher-acuity communities where pent-up demand is most apparent. Assisted living and memory care communities lost more occupancy than independent living communities prior to the distribution of vaccines. Through mid-October, our same-store managed assisted living portfolio had recovered 586 basis points of occupancy since its low in the second half of March 2021. Our same-store managed independent living portfolio had recovered 168 basis points in occupancy through mid-October since its low in the first half of May 2021. The emergence of the Delta variant in late summer and early fall has had little impact on the occupancy recovery in our Senior Housing - Managed portfolio.
Our largest senior housing operators began implementing vaccine mandates for their staffs last quarter and have seen limited incremental attrition from doing so. Labor shortages are impacting all industries, and the cost of labor, whether direct or through the use of contract labor, has increased as a result.
Cash NOI and margin both decreased in the managed portfolio during the third quarter of 2021 despite an increase in revenue. This change is a result of the lack of federal grant income during the third quarter of 2021 as well as increased labor costs in our higher acuity properties.
3Q 20212Q 20211Q 20214Q 20203Q 2020
Occupancy - AL73.5 %70.8 %68.8 %77.9 %80.5 %
Sequential Change2.7 %2.0 %(9.1)%(2.6)%
Occupancy - IL79.8 %78.6 %79.0 %80.5 %81.9 %
Sequential Change1.2 %(0.4)%(1.5)%(1.4)%
Resident fees and services$37,008 $36,642 $35,682 $38,349 $39,691 
Sequential Change$366 $960 $(2,667)$(1,342)
Cash NOI 1
$8,248 $9,318 $6,947 $10,201 $11,671 
Sequential Change$(1,070)$2,371 $(3,254)$(1,470)
1    Resident fees and services and Cash NOI balances include $0.5 million, $0.6 million and $1.2 million of Grant Income for 2Q 2021, 4Q 2020 and 3Q 2020, respectively.

EBITDARM Coverage
The reported trailing twelve-month EBITDARM Coverages for the third quarter of 2021 (presented one quarter in arrears) include approximately $119 million received from the CARES Act Provider Relief Fund as reported by our tenants. Excluding these amounts, the above EBITDARM Coverages for our Skilled Nursing/Transitional Care and Senior Housing - Leased portfolios would be 1.34x and 1.05x, respectively. This represents a decrease of 0.09x and 0.03x, respectively, compared to the EBITDARM Coverages reported for the second quarter of 2021 (presented one quarter in arrears) excluding amounts received from the CARES Act Provider Relief Fund (“PRF”), with the decrease being due to higher labor costs. Also, despite recent increases in census, the trailing twelve-month census declined sequentially with 2Q 2020 being replaced with 2Q 2021, which also contributed to the lower EBITDARM. We estimate that our tenants have received approximately $250 million from the PRF. To date, our tenants have recognized approximately $200 million of the $250 million in their operating results. Recognition of the remaining $50 million is dependent on demonstration of need and application to allowable expenses or lost revenues within the applicable “Period of Availability”, and any such unused amounts may be required to be returned to the federal
sabralogo21.jpg
3


government. Based on the conditions of such recognition, we estimate that up to $30 million of the remaining $50 million is subject to return.
The decline in reported trailing twelve-month EBITDARM Coverage for our Skilled Nursing/Transitional Care portfolio can be largely attributed to a decrease of approximately $30 million in operator-recognized revenue from the PRF coupled with an increase in reported nursing contract labor expense of approximately $9 million, each as compared with the trailing twelve-month period reported in the second quarter of 2021.
For the most recent stand-alone quarter, and excluding the benefit of amounts received from the PRF, trailing three-month EBITDARM Coverage for the third quarter of 2021 (presented one quarter in arrears), would be 1.47x and 1.00x for our Skilled Nursing/Transitional Care and Senior Housing - Leased portfolios, respectively, compared to 1.51x and 0.90x for the stand-alone second quarter of 2021 (presented one quarter in arrears).

COVID-19 Mitigation
In addition to the $20 million to $50 million that we estimate may still be recognized in earnings by our tenants from funds they have already received from the PRF, we expect our tenants to receive additional funding to help support their operations. On September 10, 2021, the U.S. Department of Health and Human Services (“HHS”) announced that it is making $25.5 billion in new funding available for health care providers affected by the COVID-19 pandemic. This funding includes $8.5 billion in American Rescue Plan resources for providers who serve rural Medicaid, Children’s Health Insurance Program, or Medicare patients, and an additional $17 billion for Phase 4 of the PRF for a broad range of providers who can document revenue loss and increased expenses associated with the pandemic. We do not yet know how much our tenants will be receiving from the PRF Phase 4 distribution but expect funds to be distributed by the end of 2021. After the distribution of the aforementioned announced funding, there is an estimated $28 billion remaining to be disbursed from the PRF in addition to any previously distributed funds having been or required to be returned by an assortment of health care providers. Further, HHS recently extended the COVID-19 Public Health Emergency for another 90 days, effective October 18, 2021, which allows HHS to continue providing temporary regulatory waivers, including the waiver of the three-day hospital stay requirement, and new rules to equip skilled nursing facilities and some assisted living operators with flexibility to respond to the COVID-19 pandemic. Lastly, suspension of the Medicare sequestration is effective through December 31, 2021, and the FMAP funding increase to the states is effective through March 31, 2022.
For additional information on aggregate amounts reported as being received or otherwise available to our operators under the CARES Act through September 30, 2021, please refer to the Top 10 Relationships and COVID-19 Mitigation Summary section of our Supplemental Report, available in the Investor Relations section of our website at http://www.sabrahealth.com/investors/financials/reports-presentations.

2021 GUIDANCE
We reaffirm our previously issued per diluted common share guidance for Normalized FFO and Normalized AFFO for the year ending December 31, 2021. However, our previously issued guidance did not include the impact of two matters that affect our full year 2021 per diluted common share guidance for net loss, FFO and AFFO as set forth below:
Per Share Impact on
Net LossFFOAFFO
Avamere straight-line rent receivable write-off$(0.11)$(0.11)$— 
Debt extinguishment costs related to redemption of senior unsecured notes due 2024$(0.17)$(0.17)$(0.16)
The impact of these two matters are added back in arriving at Normalized FFO and Normalized AFFO.

Commenting on the third quarter results, Rick Matros, CEO and Chair, said, “The portfolio continues to recover from the COVID-19 pandemic. The vaccination uptake for the workforce continues to improve and the mandate should help that. We have seen how effective the vaccines have been materially limiting the impact of the Delta variant on patients, residents and staff. With workforce vaccine uptake improving, there could effectively be a protective wall around the facilities as we expect that we will be living with some level of the virus in communities going forward. With that said, workforce shortages continue to be one of the most significant impediments left to a more speedy operational recovery. With the holiday season coming shortly, we are hopeful we will see more of the workforce returning, if not by year end, then shortly thereafter. We are not seeing a material impact on our tenants and operators, at this time, from supply chain issues. Our investment pipeline is robust,
sabralogo21.jpg
4


and our acquisition team continues to source and close accretive investments, completing approximately $400 million in investments at a weighted average yield of 7.55%. Our balance sheet is strong and FFO growth remains our top priority.”
LIQUIDITY
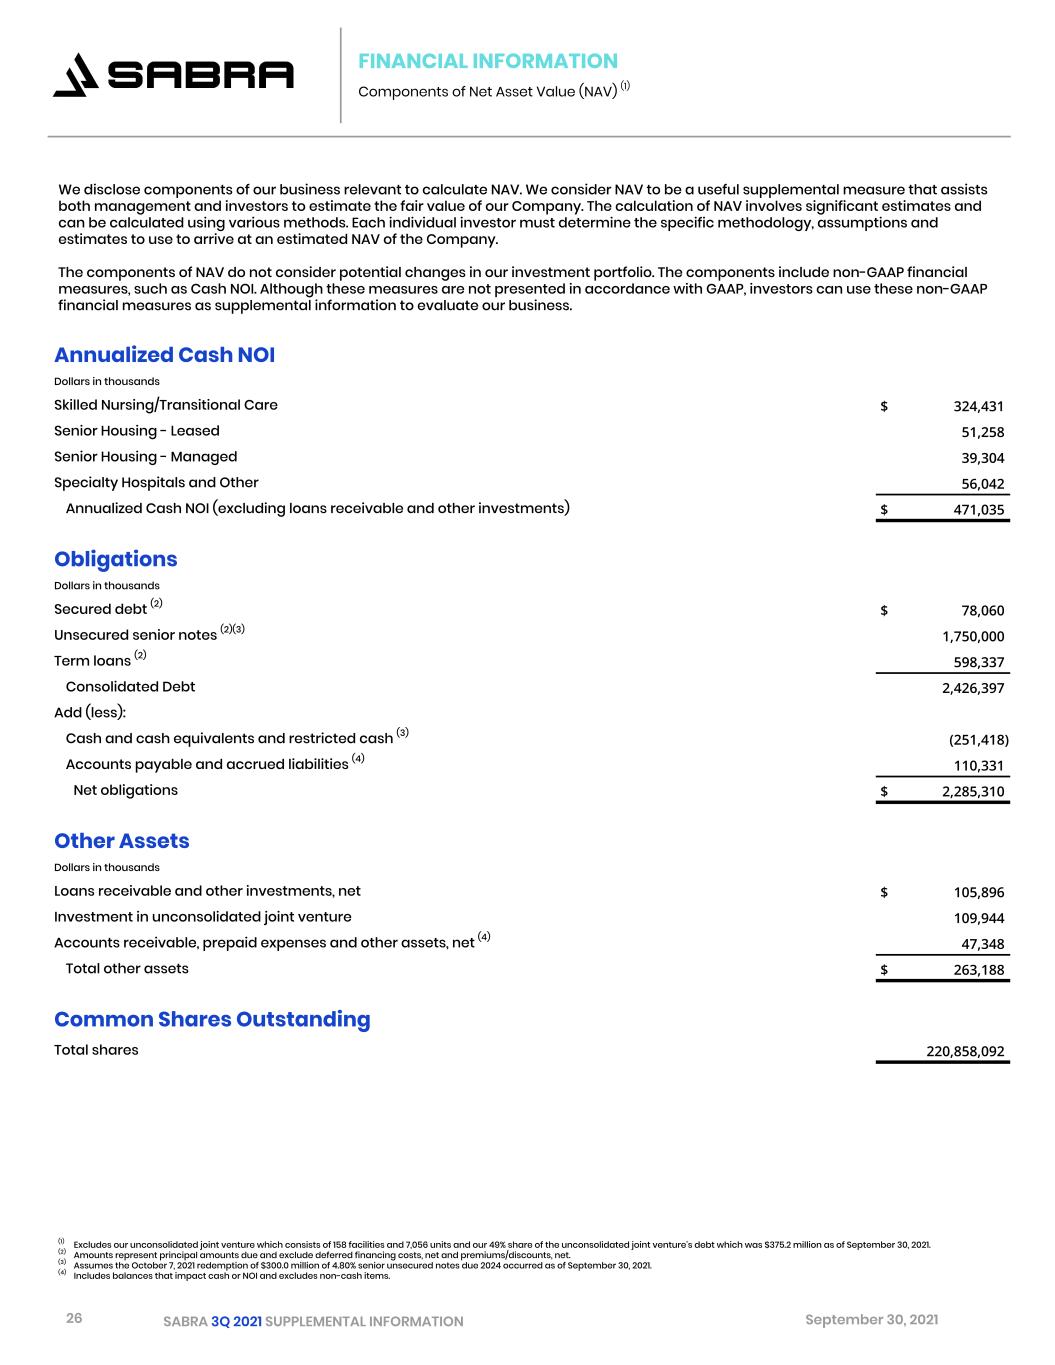
Pro forma for the October 7, 2021 redemption of $300.0 million of 4.80% senior unsecured notes due 2024, as of September 30, 2021, we had approximately $1.2 billion of liquidity, consisting of unrestricted cash and cash equivalents of $246.6 million and available borrowings of $1.0 billion under our revolving credit facility. As of September 30, 2021, we also had $497.3 million available under the ATM Program.
CONFERENCE CALL AND COMPANY INFORMATION
A conference call with a simultaneous webcast to discuss the 2021 third quarter results will be held on Thursday, November 4, 2021 at 10:00 am Pacific Time. The dial-in number for U.S. participants is (844) 862-3710. For participants outside the U.S., the dial-in number is (612) 979-9902. The conference ID number is 2558322. The webcast URL is https://edge.media-server.com/mmc/p/xt9n4b8b. A digital replay of the call will be available on the Company’s website at www.sabrahealth.com. The Company’s supplemental information package for the third quarter will also be available on the Company’s website in the “Investors” section.
ABOUT SABRA
As of September 30, 2021, Sabra’s investment portfolio included 421 real estate properties held for investment (consisting of (i) 282 Skilled Nursing/Transitional Care facilities, (ii) 61 Senior Housing communities (“Senior Housing - Leased”), (iii) 49 Senior Housing communities operated by third-party property managers pursuant to property management agreements (“Senior Housing - Managed”) and (iv) 29 Specialty Hospitals and Other facilities), one asset held for sale, one investment in a sales-type lease, 17 investments in loans receivable (consisting of (i) one mortgage loan, (ii) one construction loan and (iii) 15 other loans), eight preferred equity investments and one investment in an unconsolidated joint venture. As of September 30, 2021, Sabra’s real estate properties held for investment included 41,692 beds/units, spread across the United States and Canada.
FORWARD-LOOKING STATEMENTS SAFE HARBOR
This release contains “forward-looking” statements as defined in the Private Securities Litigation Reform Act of 1995. These statements may be identified, without limitation, by the use of “expects,” “believes,” “intends,” “should” or comparable terms or the negative thereof. Examples of forward-looking statements include all statements regarding our expectations regarding the impact of the COVID-19 pandemic on our tenants, operators and Senior Housing - Managed communities; our expectations regarding the potential mitigating effects of the state and federal assistance programs available to our tenants, operators and Senior Housing - Managed communities; our expectations regarding the timing and extent of the recovery in occupancy and improvements in operating results at our facilities; our expectations regarding the positive impact of a vaccinated workforce on the health and safety of the facilities operated by our tenants and operators; our expectations regarding improvements to workforce shortages and labor costs; and our other expectations regarding our future financial position, results of operations (including our earnings guidance for 2021, as well as the assumptions set forth therein, and our leverage expectations), cash flows, liquidity, business strategy, growth opportunities, potential investments and dispositions, and plans and objectives for future operations and capital raising activity.
Our actual results may differ materially from those projected or contemplated by our forward-looking statements as a result of various factors, including, among others, the following: the ongoing COVID-19 pandemic, including the risk of additional surges of COVID-19 infections due to the rate of public acceptance and efficacy of COVID-19 vaccines or to new and more contagious and/or vaccine resistant variants, and measures intended to prevent its spread, and the related impact on our tenants, operators and Senior Housing - Managed communities; our dependence on the operating success of our tenants; the potential variability of our reported rental and related revenues following the adoption of Accounting Standards Update (“ASU”) 2016-02, Leases, as amended by subsequent ASUs, on January 1, 2019; operational risks with respect to our Senior Housing - Managed communities; the effect of our tenants declaring bankruptcy or becoming insolvent; our ability to find replacement tenants and the impact of unforeseen costs in acquiring new properties; the impact of litigation and rising insurance costs on the business of our tenants; changes in healthcare regulation and political or economic conditions; the impact of required regulatory approvals of transfers of healthcare properties; competitive conditions in our industry; our concentration in the healthcare property sector, particularly in skilled nursing/transitional care facilities and senior housing communities, which makes our profitability more vulnerable to a downturn in a specific sector than if we were investing in multiple industries; the significant amount of and our ability to service our indebtedness; covenants in our debt agreements that may restrict our ability
sabralogo21.jpg
5


to pay dividends, make investments, incur additional indebtedness and refinance indebtedness on favorable terms; increases in market interest rates; the phasing out of the London Interbank Offered Rate (“LIBOR”) benchmark beginning after 2021; our ability to raise capital through equity and debt financings; risks associated with our investment in the Enlivant Joint Venture; changes in foreign currency exchange rates; the relatively illiquid nature of real estate investments; the loss of key management personnel; uninsured or underinsured losses affecting our properties and the possibility of environmental compliance costs and liabilities; the impact of a failure or security breach of information technology in our operations; our ability to maintain our status as a real estate investment trust (“REIT”) under the federal tax laws; changes in tax laws and regulations affecting REITs (including the potential effects of the Tax Cuts and Jobs Act); compliance with REIT requirements and certain tax and tax regulatory matters related to our status as a REIT; and the ownership limits and takeover defenses in our governing documents and under Maryland law, which may restrict change of control or business combination opportunities. 
Additional information concerning risks and uncertainties that could affect our business can be found in our filings with the Securities and Exchange Commission (the “SEC”), including in Part I, Item 1A of our Annual Report on Form 10-K for the year ended December 31, 2020. We do not intend, and we undertake no obligation, to update any forward-looking information to reflect events or circumstances after the date of this release or to reflect the occurrence of unanticipated events, unless required by law to do so.
TENANT AND BORROWER INFORMATION
This release includes information regarding certain of our tenants that lease properties from us and our borrowers, most of which are not subject to SEC reporting requirements. The information related to our tenants and borrowers that is provided in this release has been provided by, or derived from information provided by, such tenants and borrowers. We have not independently verified this information. We have no reason to believe that such information is inaccurate in any material respect. We are providing this data for informational purposes only.
NOTE REGARDING NON-GAAP FINANCIAL MEASURES
This release includes the following financial measures defined as non-GAAP financial measures by the SEC: Adjusted EBITDA, cash net operating income (“Cash NOI”), Annualized Cash NOI, funds from operations (“FFO”), Normalized FFO, Adjusted FFO (“AFFO”), Normalized AFFO, FFO per diluted common share, Normalized FFO per diluted common share, AFFO per diluted common share and Normalized AFFO per diluted common share. These measures may be different than non-GAAP financial measures used by other companies, and the presentation of these measures is not intended to be considered in isolation or as a substitute for financial information prepared and presented in accordance with U.S. generally accepted accounting principles. An explanation of these non-GAAP financial measures is included under “Reporting Definitions” in this release, and reconciliations of these non-GAAP financial measures to the GAAP financial measures we consider most comparable are included on the Investors section of our website at http://www.sabrahealth.com/investors/financials/reports-presentations/non-gaap.
CONTACT
Investor & Media Inquiries: (888) 393-8248 or [email protected]
sabralogo21.jpg
6


SABRA HEALTH CARE REIT, INC.
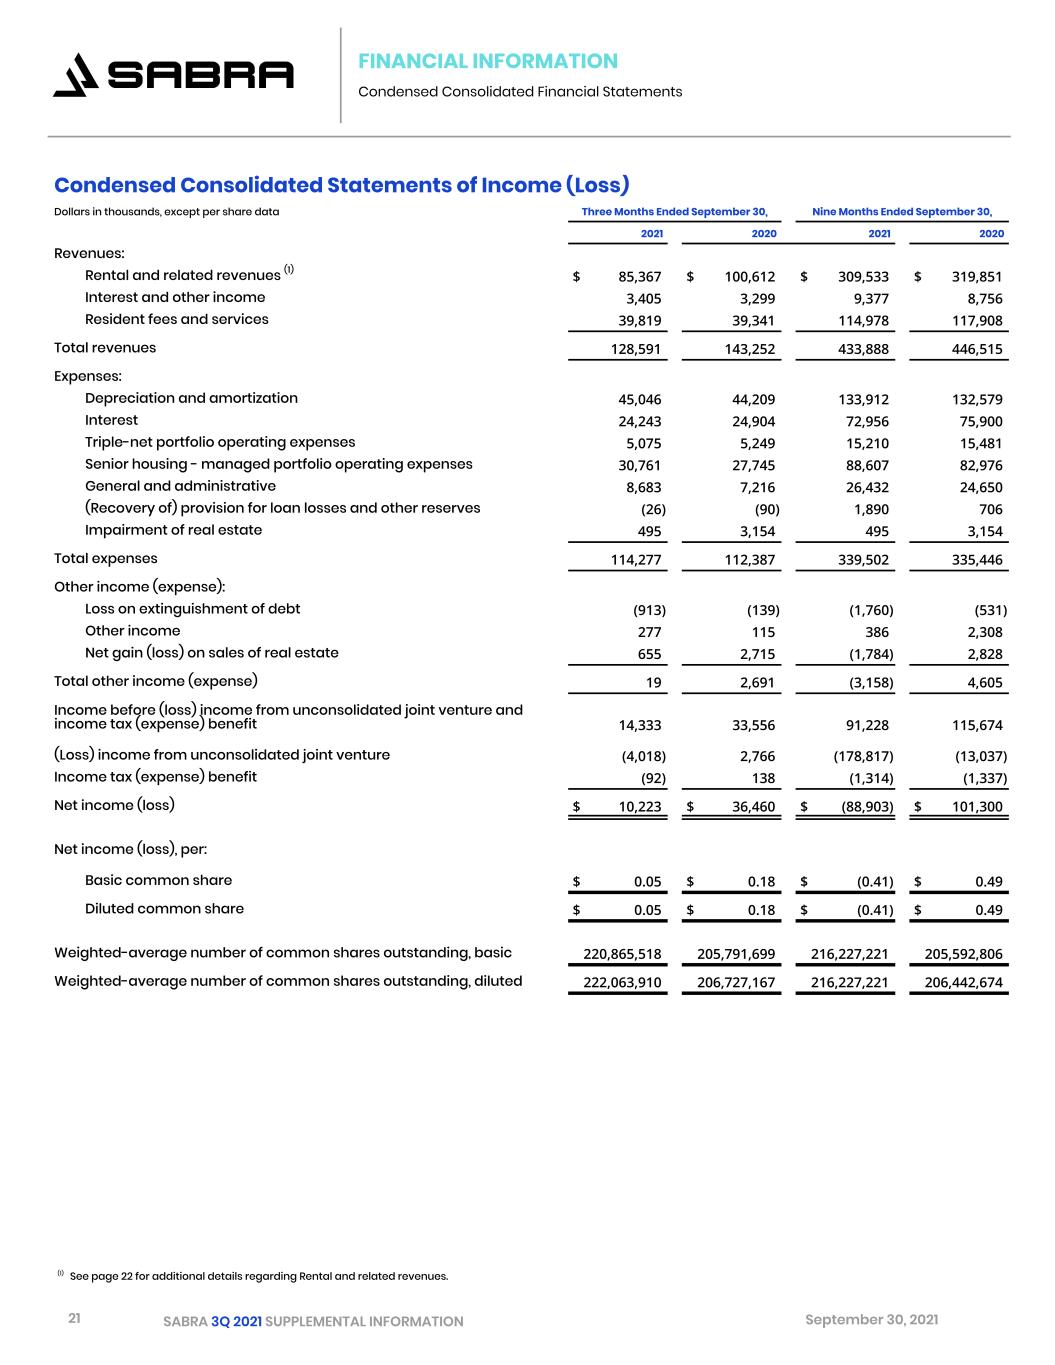
CONDENSED CONSOLIDATED STATEMENTS OF INCOME (LOSS)
(dollars in thousands, except per share data)

Three Months Ended September 30,Nine Months Ended September 30,
 2021202020212020
Revenues:
Rental and related revenues (1)
$85,367 $100,612 $309,533 $319,851 
Interest and other income3,405 3,299 9,377 8,756 
Resident fees and services39,819 39,341 114,978 117,908 
   
Total revenues128,591 143,252 433,888 446,515 
  
Expenses:
Depreciation and amortization45,046 44,209 133,912 132,579 
Interest24,243 24,904 72,956 75,900 
Triple-net portfolio operating expenses5,075 5,249 15,210 15,481 
Senior housing - managed portfolio operating expenses30,761 27,745 88,607 82,976 
General and administrative8,683 7,216 26,432 24,650 
(Recovery of) provision for loan losses and other reserves(26)(90)1,890 706 
Impairment of real estate495 3,154 495 3,154 
   
Total expenses114,277 112,387 339,502 335,446 
  
Other income (expense):
Loss on extinguishment of debt(913)(139)(1,760)(531)
Other income277 115 386 2,308 
Net gain (loss) on sales of real estate655 2,715 (1,784)2,828 
Total other income (expense)19 2,691 (3,158)4,605 
Income before (loss) income from unconsolidated joint venture and income tax (expense) benefit14,333 33,556 91,228 115,674 
(Loss) income from unconsolidated joint venture(4,018)2,766 (178,817)(13,037)
Income tax (expense) benefit(92)138 (1,314)(1,337)
Net income (loss)$10,223 $36,460 $(88,903)$101,300 
  
Net income (loss), per:
Basic common share$0.05 $0.18 $(0.41)$0.49 
    
Diluted common share$0.05 $0.18 $(0.41)$0.49 
    
Weighted-average number of common shares outstanding, basic220,865,518 205,791,699 216,227,221 205,592,806 
 
Weighted-average number of common shares outstanding, diluted222,063,910 206,727,167 216,227,221 206,442,674 


(1)    See page 8 for additional details regarding Rental and related revenues.
sabralogo21.jpg
7


SABRA HEALTH CARE REIT, INC.
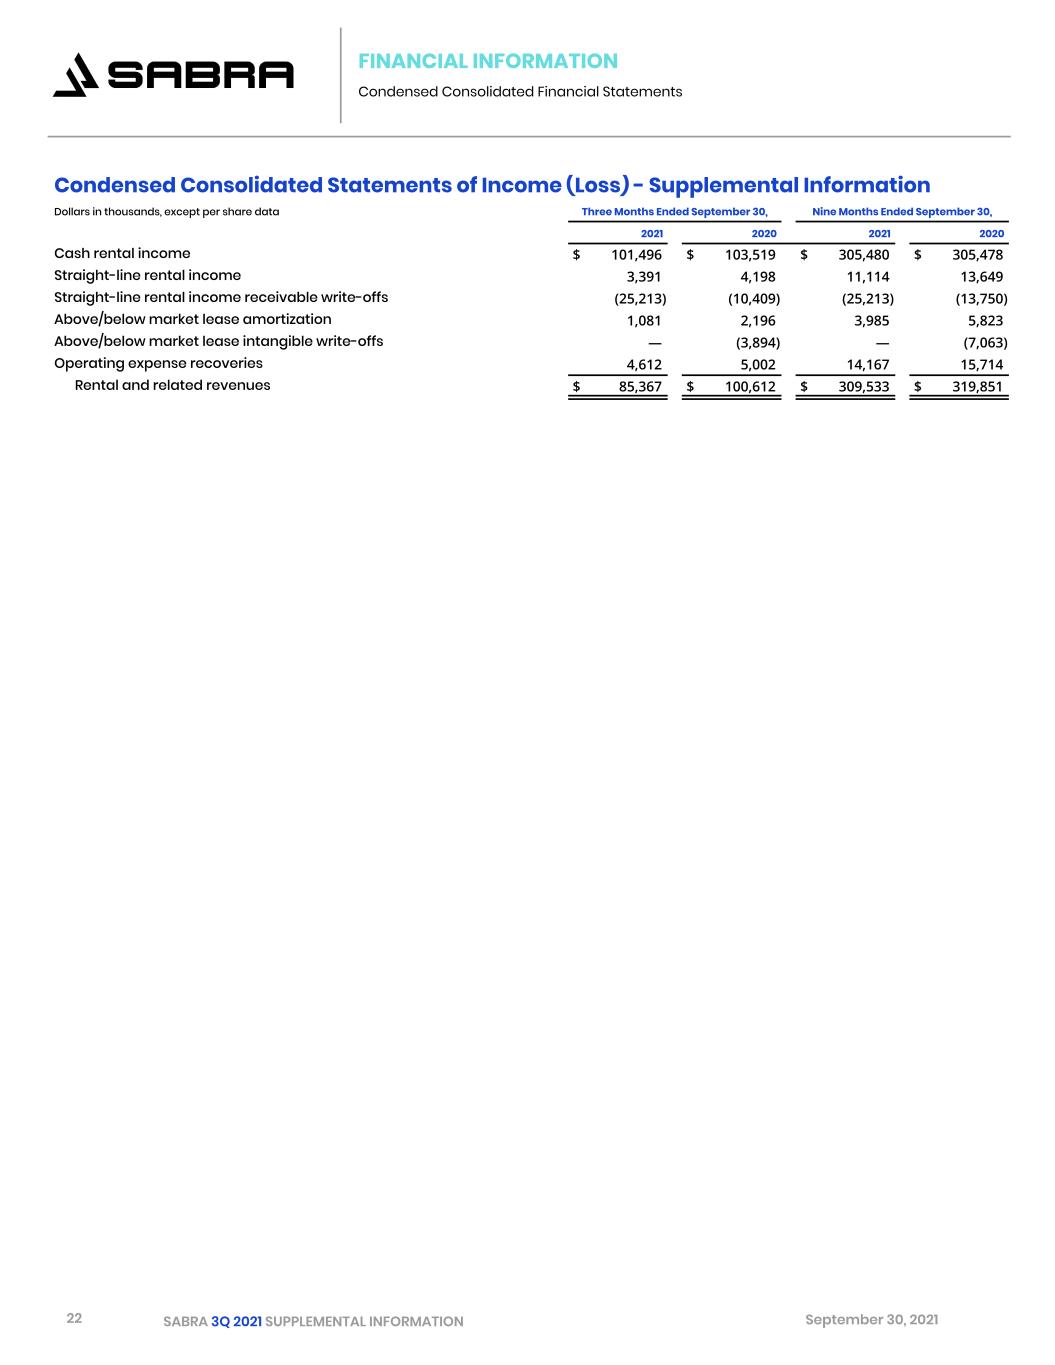
CONDENSED CONSOLIDATED STATEMENTS OF INCOME (LOSS) - SUPPLEMENTAL INFORMATION
(dollars in thousands, except per share data)

Three Months Ended September 30,Nine Months Ended September 30,
 2021202020212020
Cash rental income$101,496 $103,519 $305,480 $305,478 
Straight-line rental income3,391 4,198 11,114 13,649 
Straight-line rental income receivable write-offs(25,213)(10,409)(25,213)(13,750)
Above/below market lease amortization1,081 2,196 3,985 5,823 
Above/below market lease intangible write-offs— (3,894)— (7,063)
Operating expense recoveries4,612 5,002 14,167 15,714 
Rental and related revenues$85,367 $100,612 $309,533 $319,851 
sabralogo21.jpg
8


SABRA HEALTH CARE REIT, INC.
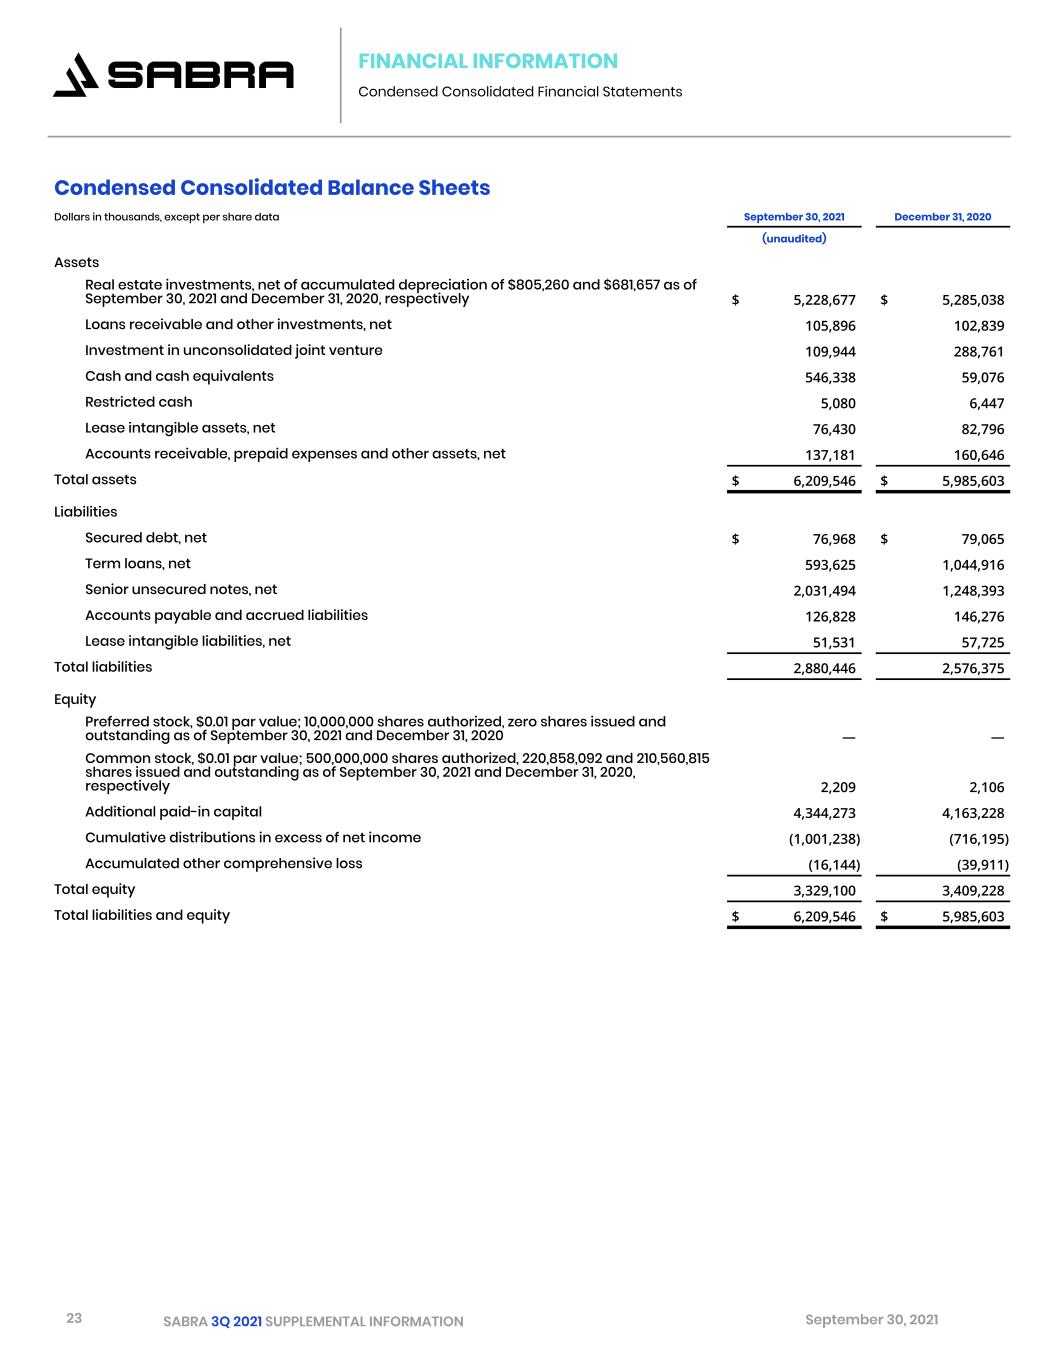
CONDENSED CONSOLIDATED BALANCE SHEETS
(dollars in thousands, except per share data)  
 
September 30, 2021December 31, 2020
 (unaudited) 
Assets
Real estate investments, net of accumulated depreciation of $805,260 and $681,657 as of September 30, 2021 and December 31, 2020, respectively$5,228,677 $5,285,038 
Loans receivable and other investments, net105,896 102,839 
Investment in unconsolidated joint venture109,944 288,761 
Cash and cash equivalents546,338 59,076 
Restricted cash5,080 6,447 
Lease intangible assets, net76,430 82,796 
Accounts receivable, prepaid expenses and other assets, net137,181 160,646 
Total assets$6,209,546 $5,985,603 
Liabilities
Secured debt, net$76,968 $79,065 
Term loans, net593,625 1,044,916 
Senior unsecured notes, net2,031,494 1,248,393 
Accounts payable and accrued liabilities126,828 146,276 
Lease intangible liabilities, net51,531 57,725 
Total liabilities2,880,446 2,576,375 
Equity
Preferred stock, $0.01 par value; 10,000,000 shares authorized, zero shares issued and outstanding as of September 30, 2021 and December 31, 2020— — 
Common stock, $0.01 par value; 500,000,000 shares authorized, 220,858,092 and 210,560,815 shares issued and outstanding as of September 30, 2021 and December 31, 2020, respectively2,209 2,106 
Additional paid-in capital4,344,273 4,163,228 
Cumulative distributions in excess of net income(1,001,238)(716,195)
Accumulated other comprehensive loss(16,144)(39,911)
Total equity3,329,100 3,409,228 
Total liabilities and equity$6,209,546 $5,985,603 


sabralogo21.jpg
9


SABRA HEALTH CARE REIT, INC.
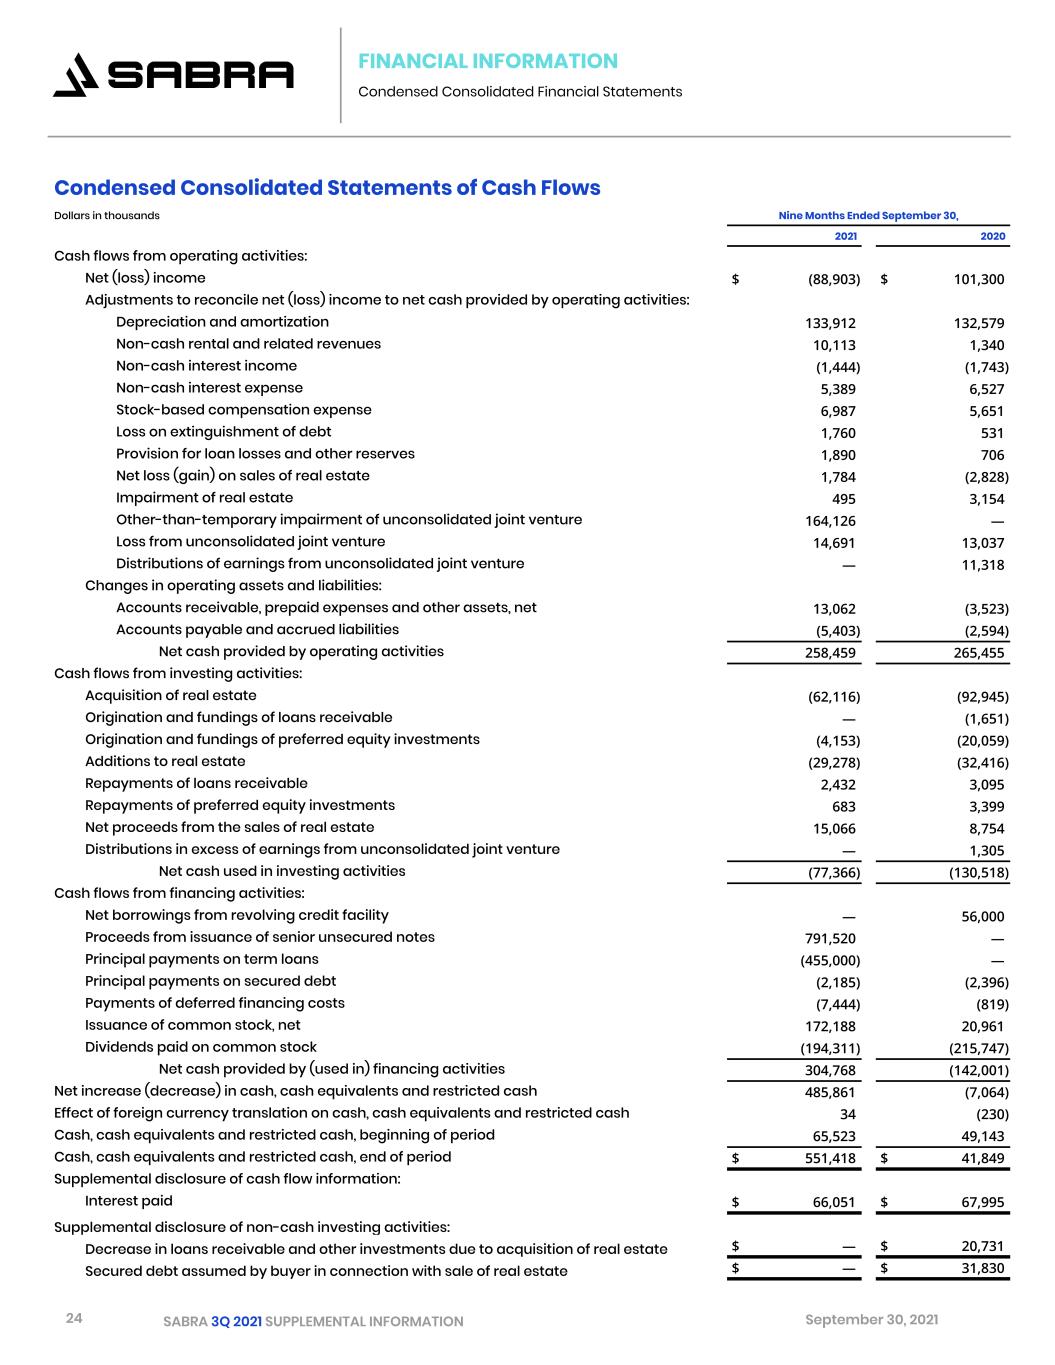
CONDENSED CONSOLIDATED STATEMENTS OF CASH FLOWS
(in thousands)
 Nine Months Ended September 30,
20212020
Cash flows from operating activities:
Net (loss) income$(88,903)$101,300 
Adjustments to reconcile net (loss) income to net cash provided by operating activities:
Depreciation and amortization133,912 132,579 
Non-cash rental and related revenues10,113 1,340 
Non-cash interest income(1,444)(1,743)
Non-cash interest expense5,389 6,527 
Stock-based compensation expense6,987 5,651 
Loss on extinguishment of debt1,760 531 
Provision for loan losses and other reserves1,890 706 
Net loss (gain) on sales of real estate1,784 (2,828)
Impairment of real estate495 3,154 
Other-than-temporary impairment of unconsolidated joint venture164,126 — 
Loss from unconsolidated joint venture14,691 13,037 
Distributions of earnings from unconsolidated joint venture— 11,318 
Changes in operating assets and liabilities:
Accounts receivable, prepaid expenses and other assets, net13,062 (3,523)
Accounts payable and accrued liabilities(5,403)(2,594)
Net cash provided by operating activities258,459 265,455 
Cash flows from investing activities:
Acquisition of real estate(62,116)(92,945)
Origination and fundings of loans receivable— (1,651)
Origination and fundings of preferred equity investments(4,153)(20,059)
Additions to real estate(29,278)(32,416)
Repayments of loans receivable2,432 3,095 
Repayments of preferred equity investments683 3,399 
Net proceeds from the sales of real estate15,066 8,754 
Distributions in excess of earnings from unconsolidated joint venture— 1,305 
Net cash used in investing activities(77,366)(130,518)
Cash flows from financing activities:
Net borrowings from revolving credit facility— 56,000 
Proceeds from issuance of senior unsecured notes791,520 — 
Principal payments on term loans(455,000)— 
Principal payments on secured debt(2,185)(2,396)
Payments of deferred financing costs(7,444)(819)
Issuance of common stock, net172,188 20,961 
Dividends paid on common stock(194,311)(215,747)
Net cash provided by (used in) financing activities304,768 (142,001)
Net increase (decrease) in cash, cash equivalents and restricted cash485,861 (7,064)
Effect of foreign currency translation on cash, cash equivalents and restricted cash34 (230)
Cash, cash equivalents and restricted cash, beginning of period65,523 49,143 
Cash, cash equivalents and restricted cash, end of period$551,418 $41,849 
Supplemental disclosure of cash flow information:
Interest paid$66,051 $67,995 
Supplemental disclosure of non-cash investing activities:
Decrease in loans receivable and other investments due to acquisition of real estate$— $20,731 
Secured debt assumed by buyer in connection with sale of real estate$— $31,830 
sabralogo21.jpg
10


SABRA HEALTH CARE REIT, INC.
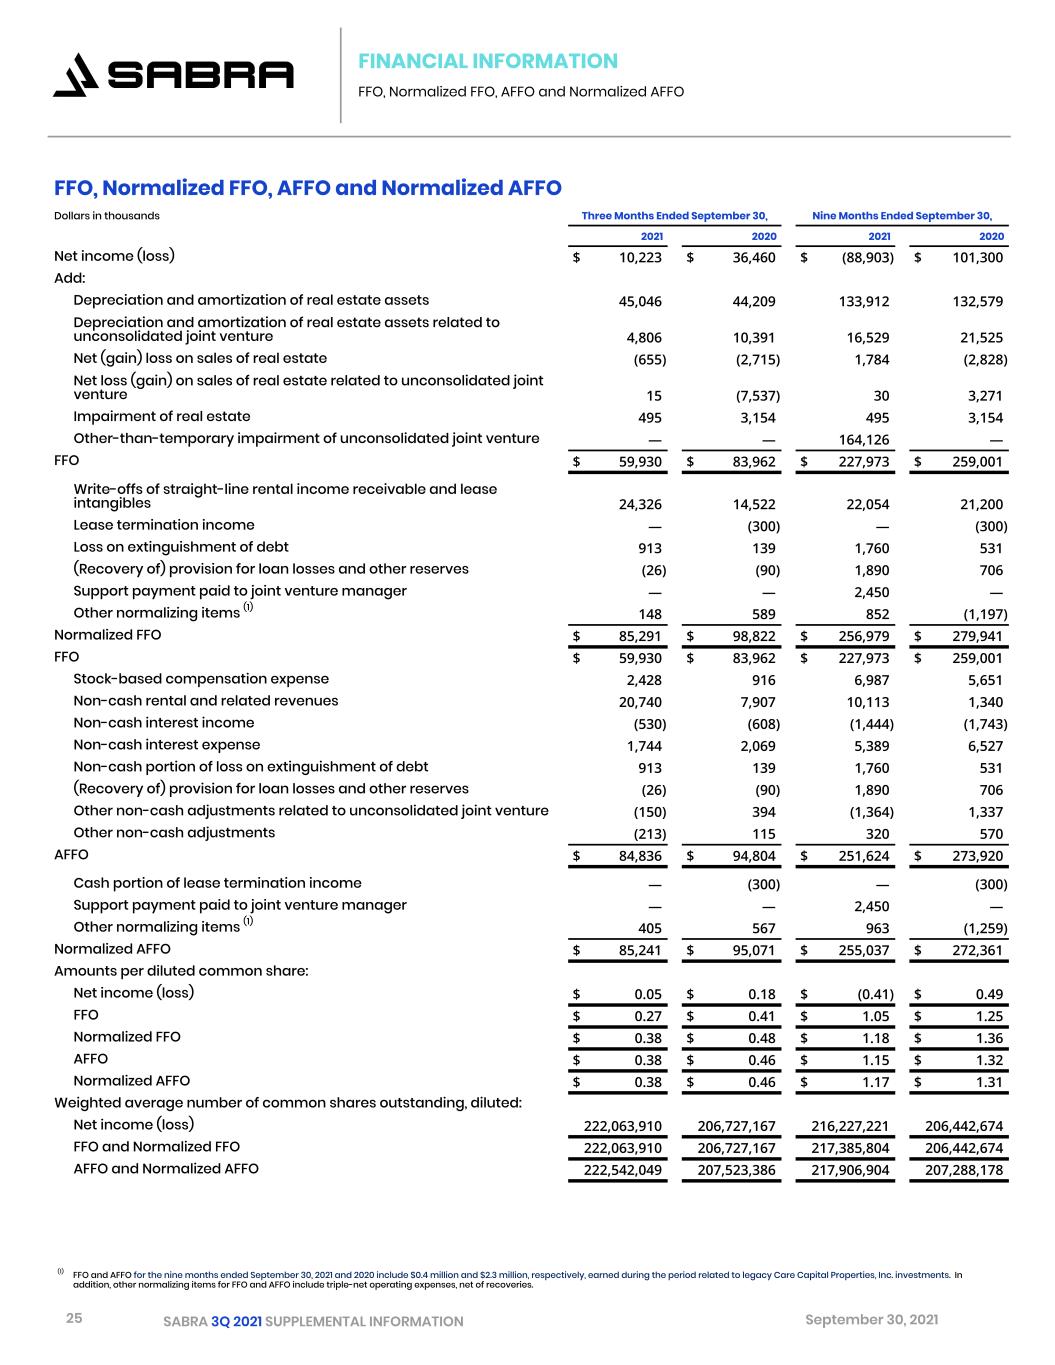
FUNDS FROM OPERATIONS (FFO), NORMALIZED FFO,
ADJUSTED FUNDS FROM OPERATIONS (AFFO) AND NORMALIZED AFFO
(dollars in thousands, except per share data)
Three Months Ended September 30,Nine Months Ended September 30,
 2021202020212020
Net income (loss)$10,223 $36,460 $(88,903)$101,300 
Add:
Depreciation and amortization of real estate assets45,046 44,209 133,912 132,579 
Depreciation and amortization of real estate assets related to unconsolidated joint venture4,806 10,391 16,529 21,525 
Net (gain) loss on sales of real estate(655)(2,715)1,784 (2,828)
Net loss (gain) on sales of real estate related to unconsolidated joint venture15 (7,537)30 3,271 
Impairment of real estate495 3,154 495 3,154 
Other-than-temporary impairment of unconsolidated joint venture— — 164,126 — 
FFO$59,930 $83,962 $227,973 $259,001 
Write-offs of straight-line rental income receivable and lease intangibles24,326 14,522 22,054 21,200 
Lease termination income— (300)— (300)
Loss on extinguishment of debt913 139 1,760 531 
(Recovery of) provision for loan losses and other reserves(26)(90)1,890 706 
Support payment paid to joint venture manager— — 2,450 — 
Other normalizing items (1)
148 589 852 (1,197)
Normalized FFO$85,291 $98,822 $256,979 $279,941 
FFO$59,930 $83,962 $227,973 $259,001 
Stock-based compensation expense2,428 916 6,987 5,651 
Non-cash rental and related revenues20,740 7,907 10,113 1,340 
Non-cash interest income(530)(608)(1,444)(1,743)
Non-cash interest expense1,744 2,069 5,389 6,527 
Non-cash portion of loss on extinguishment of debt913 139 1,760 531 
(Recovery of) provision for loan losses and other reserves(26)(90)1,890 706 
Other non-cash adjustments related to unconsolidated joint venture(150)394 (1,364)1,337 
Other non-cash adjustments(213)115 320 570 
AFFO$84,836 $94,804 $251,624 $273,920 
Cash portion of lease termination income— (300)— (300)
Support payment paid to joint venture manager— — 2,450 — 
Other normalizing items (1)
405 567 963 (1,259)
Normalized AFFO$85,241 $95,071 $255,037 $272,361 
Amounts per diluted common share:
Net income (loss)$0.05 $0.18 $(0.41)$0.49 
FFO$0.27 $0.41 $1.05 $1.25 
Normalized FFO$0.38 $0.48 $1.18 $1.36 
AFFO$0.38 $0.46 $1.15 $1.32 
Normalized AFFO$0.38 $0.46 $1.17 $1.31 
Weighted average number of common shares outstanding, diluted:
Net income (loss)222,063,910 206,727,167 216,227,221 206,442,674 
FFO and Normalized FFO 222,063,910 206,727,167 217,385,804 206,442,674 
AFFO and Normalized AFFO 222,542,049 207,523,386 217,906,904 207,288,178 


(1)    FFO and AFFO for the nine months ended September 30, 2021 and 2020 include $0.4 million and $2.3 million, respectively, earned during the period related to legacy Care Capital Properties, Inc. investments. In addition, other normalizing items for FFO and AFFO include triple-net operating expenses, net of recoveries.
sabralogo21.jpg
11


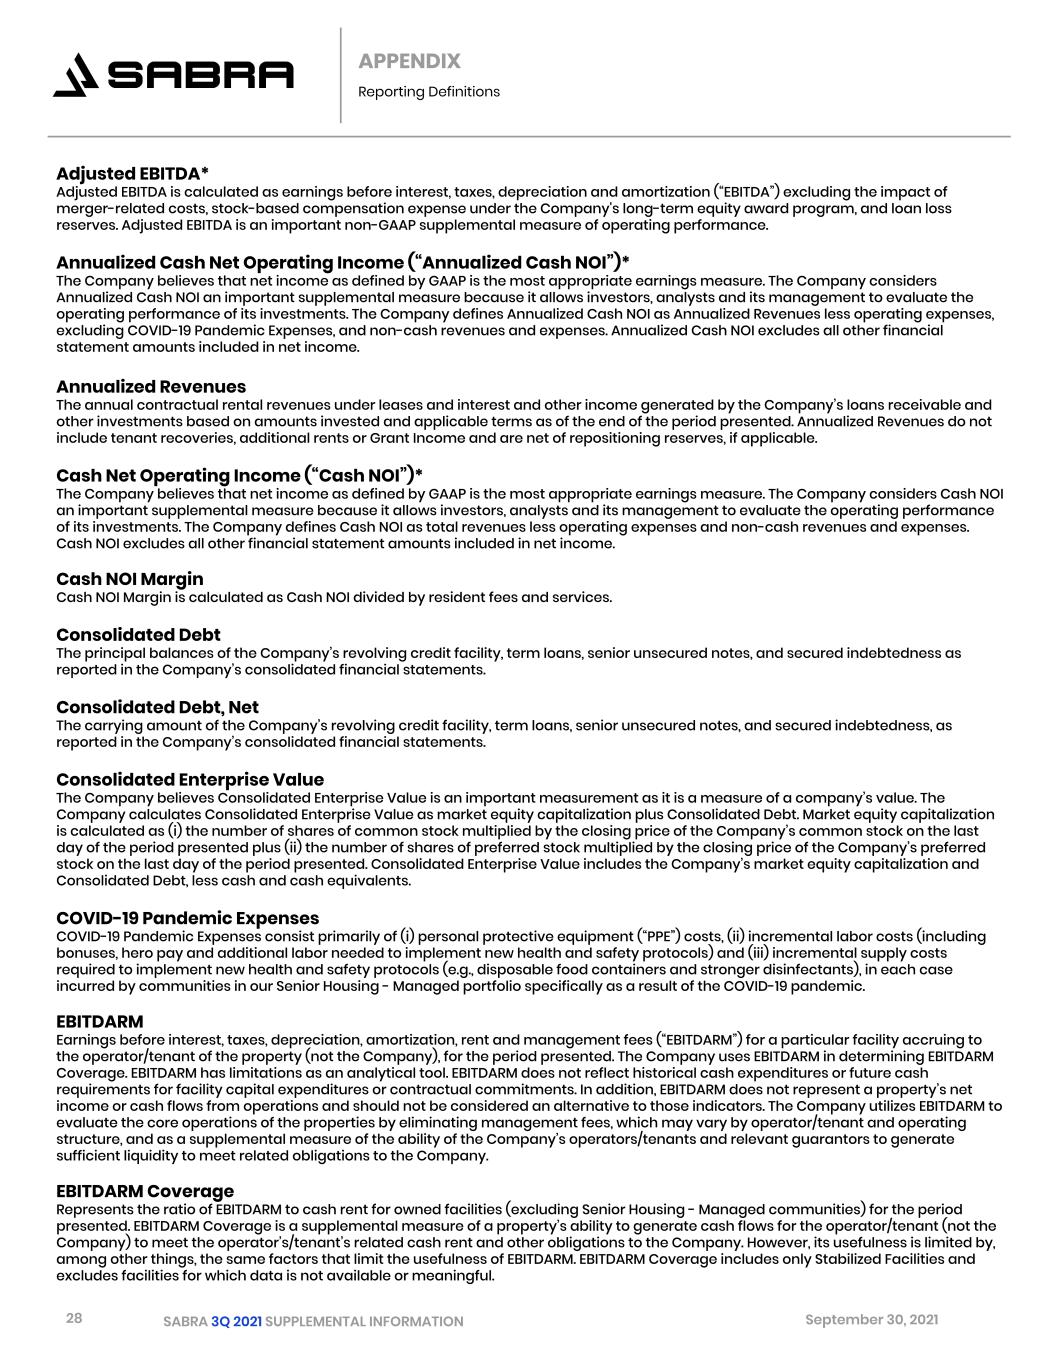
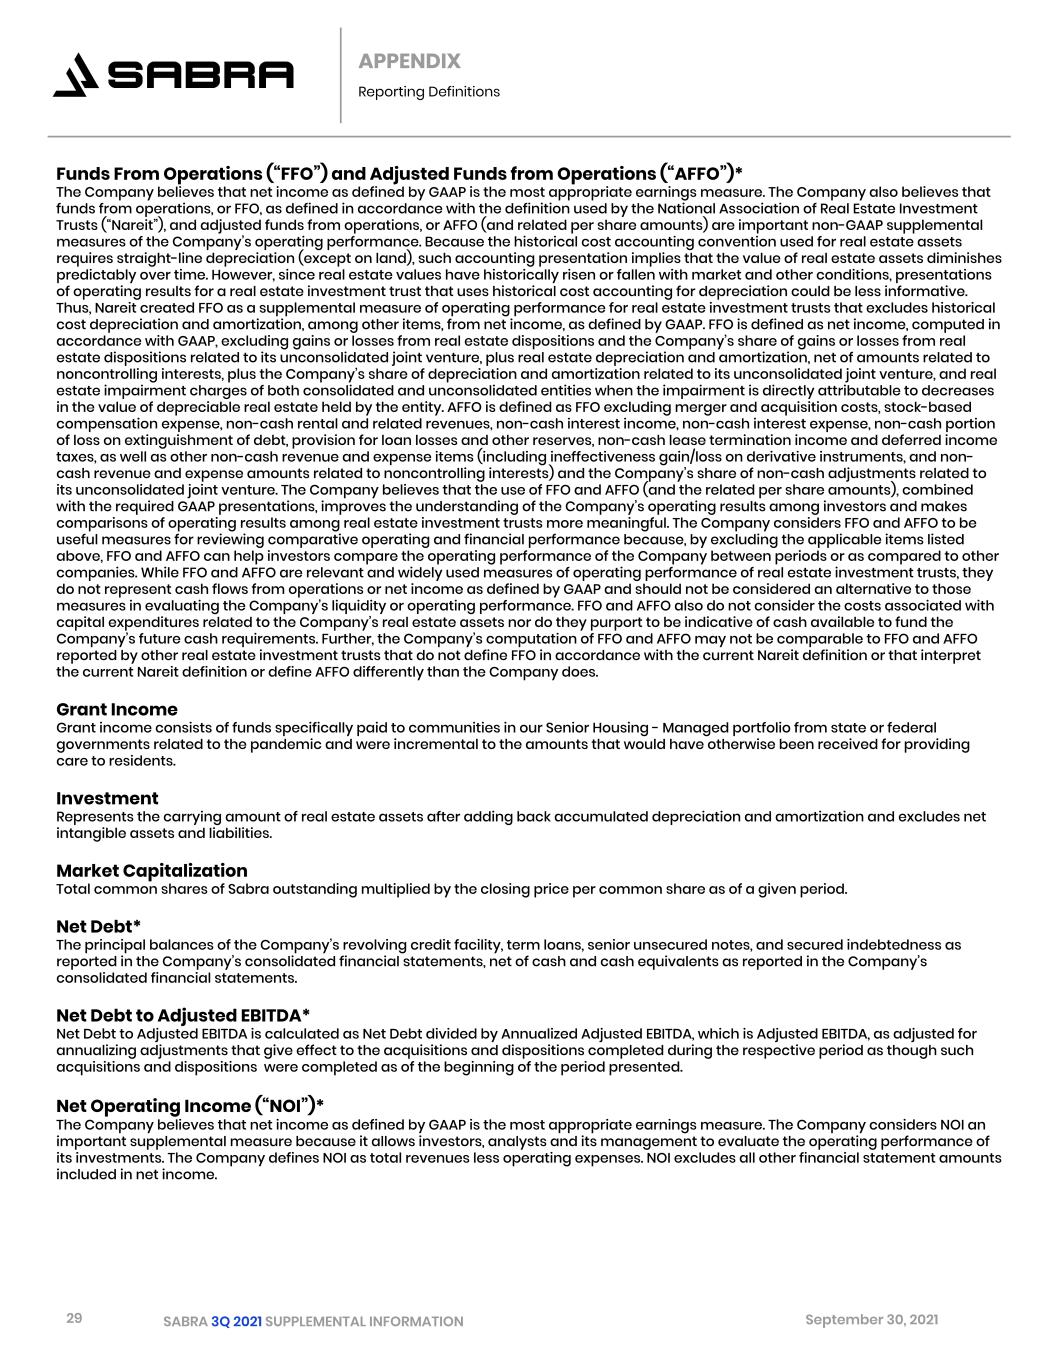
REPORTING DEFINITIONS
Adjusted EBITDA*
Adjusted EBITDA is calculated as earnings before interest, taxes, depreciation and amortization (“EBITDA”) excluding the impact of merger-related costs, stock-based compensation expense under the Company’s long-term equity award program, and loan loss reserves. Adjusted EBITDA is an important non-GAAP supplemental measure of operating performance.

Annualized Cash Net Operating Income (“Annualized Cash NOI”)*
The Company believes that net income as defined by GAAP is the most appropriate earnings measure. The Company considers Annualized Cash NOI an important supplemental measure because it allows investors, analysts and its management to evaluate the operating performance of its investments. The Company defines Annualized Cash NOI as Annualized Revenues less operating expenses, excluding COVID-19 Pandemic Expenses, and non-cash revenues and expenses. Annualized Cash NOI excludes all other financial statement amounts included in net income.

Annualized Revenues 
The annual contractual rental revenues under leases and interest and other income generated by the Company’s loans receivable and other investments based on amounts invested and applicable terms as of the end of the period presented. Annualized Revenues do not include tenant recoveries, additional rents or Grant Income and are net of repositioning reserves, if applicable.

Cash Net Operating Income (“Cash NOI”)*   
The Company believes that net income as defined by GAAP is the most appropriate earnings measure. The Company considers Cash NOI an important supplemental measure because it allows investors, analysts and its management to evaluate the operating performance of its investments. The Company defines Cash NOI as total revenues less operating expenses and non-cash revenues and expenses. Cash NOI excludes all other financial statement amounts included in net income.

COVID-19 Pandemic Expenses
COVID-19 Pandemic Expenses consist primarily of (i) personal protective equipment costs, (ii) incremental labor costs (including bonuses, hero pay and additional labor needed to implement new health and safety protocols) and (iii) incremental supply costs required to implement new health and safety protocols (e.g., disposable food containers and stronger disinfectants), in each case incurred by communities in our Senior Housing - Managed portfolio specifically as a result of the COVID-19 pandemic.

EBITDARM 
Earnings before interest, taxes, depreciation, amortization, rent and management fees (“EBITDARM”) for a particular facility accruing to the operator/tenant of the property (not the Company), for the period presented. The Company uses EBITDARM in determining EBITDARM Coverage. EBITDARM has limitations as an analytical tool. EBITDARM does not reflect historical cash expenditures or future cash requirements for facility capital expenditures or contractual commitments. In addition, EBITDARM does not represent a property’s net income or cash flows from operations and should not be considered an alternative to those indicators. The Company utilizes EBITDARM to evaluate the core operations of the properties by eliminating management fees, which may vary by operator/tenant and operating structure, and as a supplemental measure of the ability of the Company’s operators/tenants and relevant guarantors to generate sufficient liquidity to meet related obligations to the Company.

EBITDARM Coverage 
Represents the ratio of EBITDARM to cash rent for owned facilities (excluding Senior Housing - Managed communities) for the period presented. EBITDARM Coverage is a supplemental measure of a property’s ability to generate cash flows for the operator/tenant (not the Company) to meet the operator’s/tenant’s related cash rent and other obligations to the Company. However, its usefulness is limited by, among other things, the same factors that limit the usefulness of EBITDARM. EBITDARM Coverage includes only Stabilized Facilities and excludes facilities for which data is not available or meaningful.

Funds From Operations (“FFO”) and Adjusted Funds from Operations (“AFFO”)* 
The Company believes that net income as defined by GAAP is the most appropriate earnings measure. The Company also believes that funds from operations, or FFO, as defined in accordance with the definition used by the National Association of Real Estate Investment Trusts (“Nareit”), and adjusted funds from operations, or AFFO (and related per share amounts) are important non-GAAP supplemental measures of the Company’s operating performance. Because the historical cost accounting convention used for real estate assets requires straight-line depreciation (except on land), such accounting presentation implies that the value of real estate assets diminishes predictably over time. However, since real estate values have historically risen or
sabralogo21.jpg
12


REPORTING DEFINITIONS
fallen with market and other conditions, presentations of operating results for a real estate investment trust that uses historical cost accounting for depreciation could be less informative. Thus, Nareit created FFO as a supplemental measure of operating performance for real estate investment trusts that excludes historical cost depreciation and amortization, among other items, from net income, as defined by GAAP. FFO is defined as net income, computed in accordance with GAAP, excluding gains or losses from real estate dispositions and the Company’s share of gains or losses from real estate dispositions related to its unconsolidated joint venture, plus real estate depreciation and amortization, net of amounts related to noncontrolling interests, plus the Company’s share of depreciation and amortization related to its unconsolidated joint venture, and real estate impairment charges. AFFO is defined as FFO excluding merger and acquisition costs, stock-based compensation expense, non-cash rental and related revenues, non-cash interest income, non-cash interest expense, non-cash portion of loss on extinguishment of debt, provision for loan losses and other reserves, non-cash lease termination income and deferred income taxes, as well as other non-cash revenue and expense items (including ineffectiveness gain/loss on derivative instruments, and non-cash revenue and expense amounts related to noncontrolling interests) and the Company’s share of non-cash adjustments related to its unconsolidated joint venture. The Company believes that the use of FFO and AFFO (and the related per share amounts), combined with the required GAAP presentations, improves the understanding of the Company’s operating results among investors and makes comparisons of operating results among real estate investment trusts more meaningful. The Company considers FFO and AFFO to be useful measures for reviewing comparative operating and financial performance because, by excluding the applicable items listed above, FFO and AFFO can help investors compare the operating performance of the Company between periods or as compared to other companies. While FFO and AFFO are relevant and widely used measures of operating performance of real estate investment trusts, they do not represent cash flows from operations or net income as defined by GAAP and should not be considered an alternative to those measures in evaluating the Company’s liquidity or operating performance. FFO and AFFO also do not consider the costs associated with capital expenditures related to the Company’s real estate assets nor do they purport to be indicative of cash available to fund the Company’s future cash requirements. Further, the Company’s computation of FFO and AFFO may not be comparable to FFO and AFFO reported by other real estate investment trusts that do not define FFO in accordance with the current Nareit definition or that interpret the current Nareit definition or define AFFO differently than the Company does.

Grant Income
Grant income consists of funds specifically paid to communities in our Senior Housing - Managed portfolio from state or federal governments related to the pandemic and were incremental to the amounts that would have otherwise been received for providing care to residents.

Net Debt*
The principal balances of the Company’s revolving credit facility, term loans, senior unsecured notes, and secured indebtedness as reported in the Company’s consolidated financial statements, net of cash and cash equivalents as reported in the Company’s consolidated financial statements.

Net Debt to Adjusted EBITDA*
Net Debt to Adjusted EBITDA is calculated as Net Debt divided by Annualized Adjusted EBITDA, which is Adjusted EBITDA, as adjusted for annualizing adjustments that give effect to the acquisitions and dispositions completed during the respective period as though such acquisitions and dispositions were completed as of the beginning of the period presented.

Normalized FFO and Normalized AFFO*
Normalized FFO and Normalized AFFO represent FFO and AFFO, respectively, adjusted for certain income and expense items that the Company does not believe are indicative of its ongoing operating results. The Company considers Normalized FFO and Normalized AFFO to be useful measures to evaluate the Company’s operating results excluding these income and expense items to help investors compare the operating performance of the Company between periods or as compared to other companies. Normalized FFO and Normalized AFFO do not represent cash flows from operations or net income as defined by GAAP and should not be considered an alternative to those measures in evaluating the Company’s liquidity or operating performance. Normalized FFO and Normalized AFFO also do not consider the costs associated with capital expenditures related to the Company’s real estate assets nor do they purport to be indicative of cash available to fund the Company’s future cash requirements. Further, the Company’s computation of Normalized FFO and Normalized AFFO may not be comparable to Normalized FFO and Normalized AFFO reported by other real estate investment trusts that do not define FFO in accordance with the current Nareit definition or that interpret the current Nareit definition or define FFO and AFFO or Normalized FFO and Normalized AFFO differently than the Company does.

sabralogo21.jpg
13


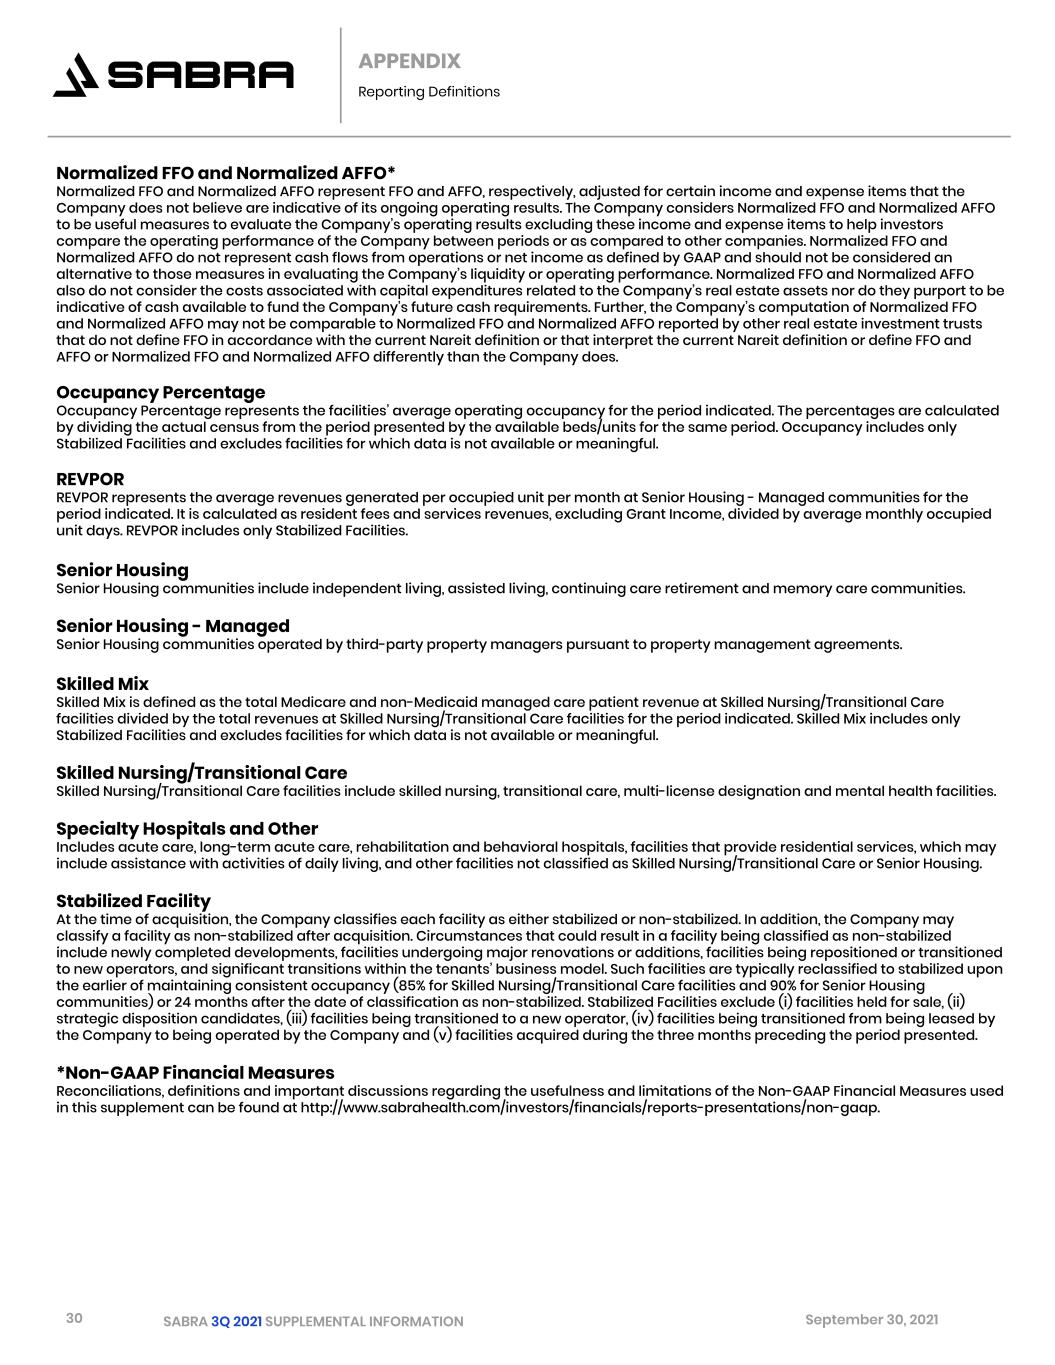
REPORTING DEFINITIONS
Occupancy Percentage
Occupancy Percentage represents the facilities’ average operating occupancy for the period indicated. The percentages are calculated by dividing the actual census from the period presented by the available beds/units for the same period. Occupancy includes only Stabilized Facilities and excludes facilities for which data is not available or meaningful.

REVPOR
REVPOR represents the average revenues generated per occupied unit per month at Senior Housing - Managed communities for the period indicated. It is calculated as resident fees and services revenues, excluding Grant Income, divided by average monthly occupied unit days. REVPOR includes only Stabilized Facilities.

Senior Housing 
Senior Housing communities include independent living, assisted living, continuing care retirement and memory care communities.

Senior Housing - Managed
Senior Housing communities operated by third-party property managers pursuant to property management agreements.

Skilled Mix 
Skilled Mix is defined as the total Medicare and non-Medicaid managed care patient revenue at Skilled Nursing/Transitional Care facilities divided by the total revenues at Skilled Nursing/Transitional Care facilities for the period indicated. Skilled Mix includes only Stabilized Facilities and excludes facilities for which data is not available or meaningful.

Skilled Nursing/Transitional Care 
Skilled Nursing/Transitional Care facilities include skilled nursing, transitional care, multi-license designation and mental health facilities.

Specialty Hospitals and Other
Includes acute care, long-term acute care, rehabilitation and behavioral hospitals, facilities that provide residential services, which may include assistance with activities of daily living, and other facilities not classified as Skilled Nursing/Transitional Care or Senior Housing.

Stabilized Facility
At the time of acquisition, the Company classifies each facility as either stabilized or non-stabilized. In addition, the Company may classify a facility as non-stabilized after acquisition. Circumstances that could result in a facility being classified as non-stabilized include newly completed developments, facilities undergoing major renovations or additions, facilities being repositioned or transitioned to new operators, and significant transitions within the tenants’ business model. Such facilities are typically reclassified to stabilized upon the earlier of maintaining consistent occupancy (85% for Skilled Nursing/Transitional Care facilities and 90% for Senior Housing communities) or 24 months after the date of classification as non-stabilized. Stabilized Facilities exclude (i) facilities held for sale, (ii) strategic disposition candidates, (iii) facilities being transitioned to a new operator, (iv) facilities being transitioned from being leased by the Company to being operated by the Company and (v) facilities acquired during the three months preceding the period presented.

*Non-GAAP Financial Measures
Reconciliations, definitions and important discussions regarding the usefulness and limitations of the Non-GAAP Financial Measures used in this release can be found at http://www.sabrahealth.com/investors/financials/reports-presentations/non-gaap.
sabralogo21.jpg
14

Exhibit 99.2


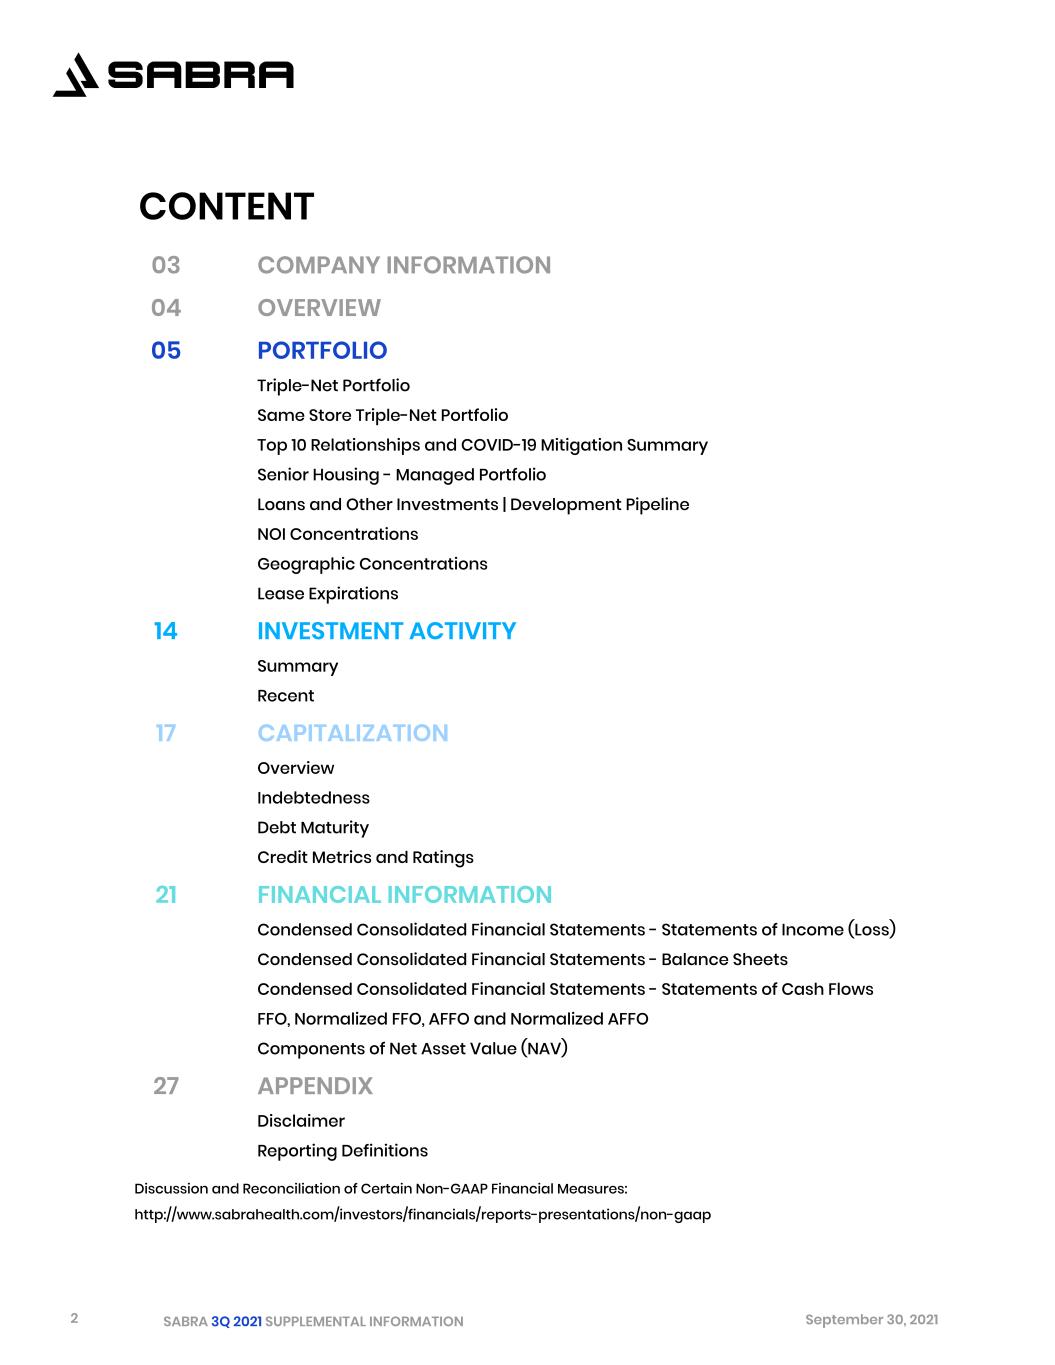
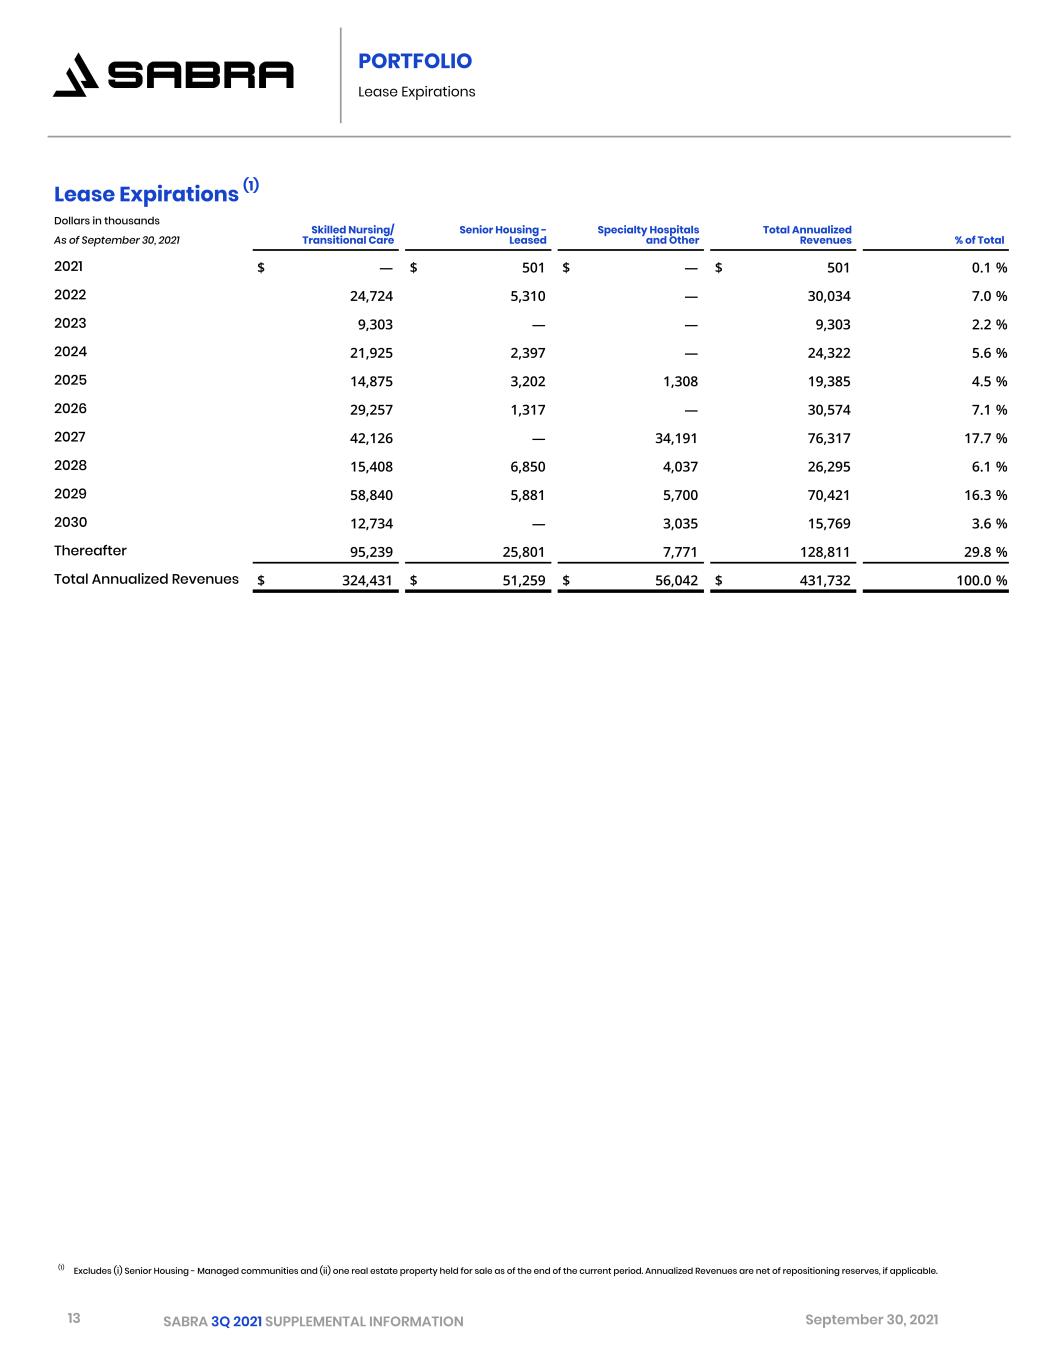
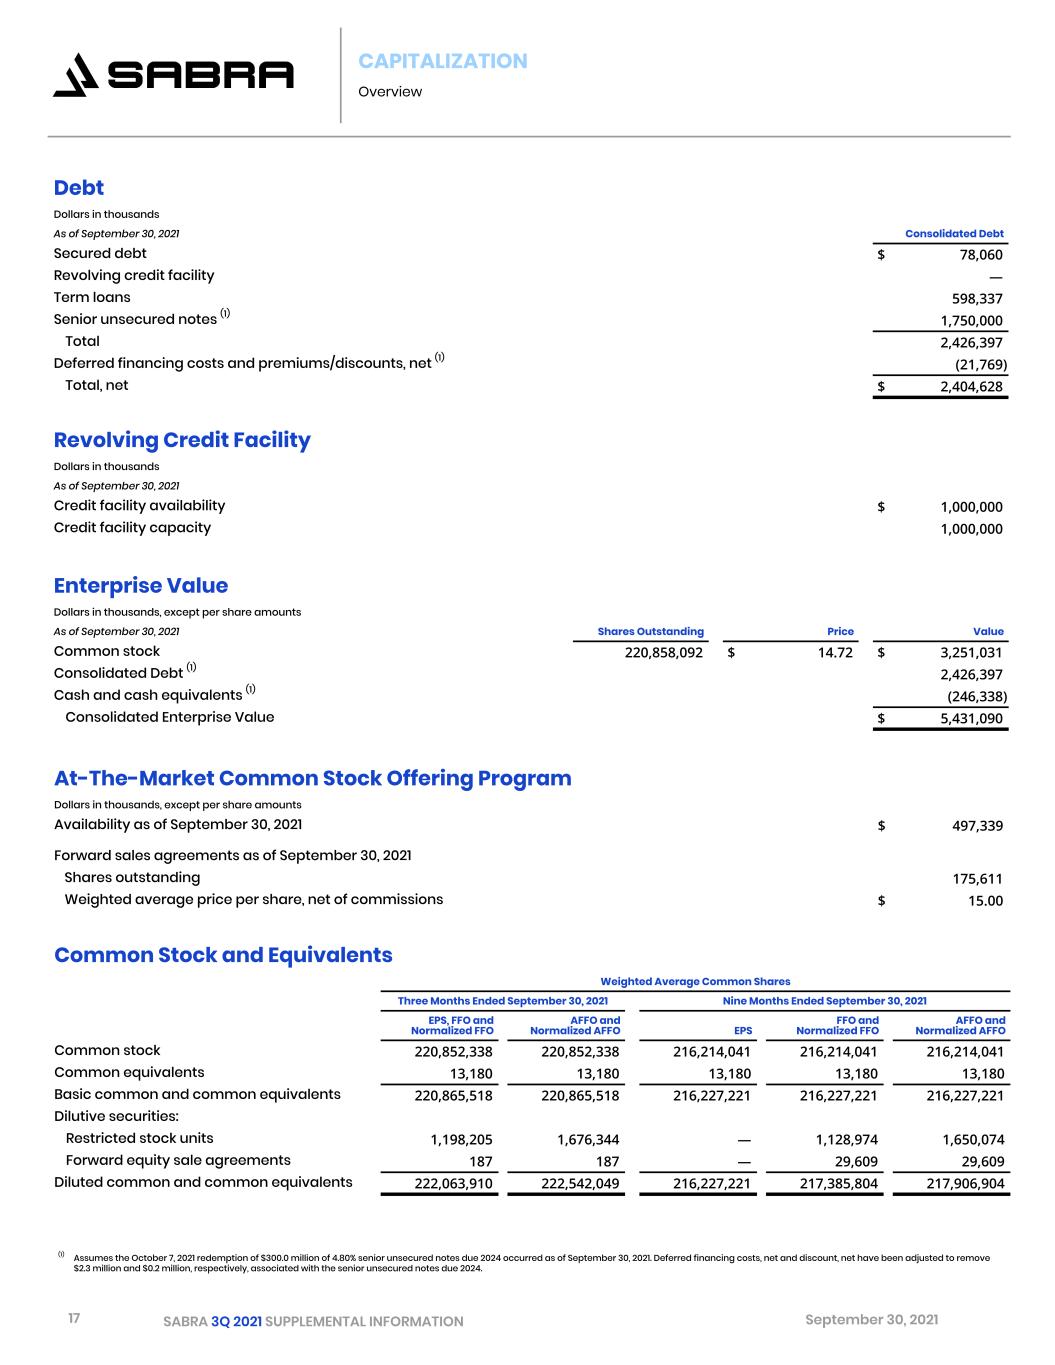
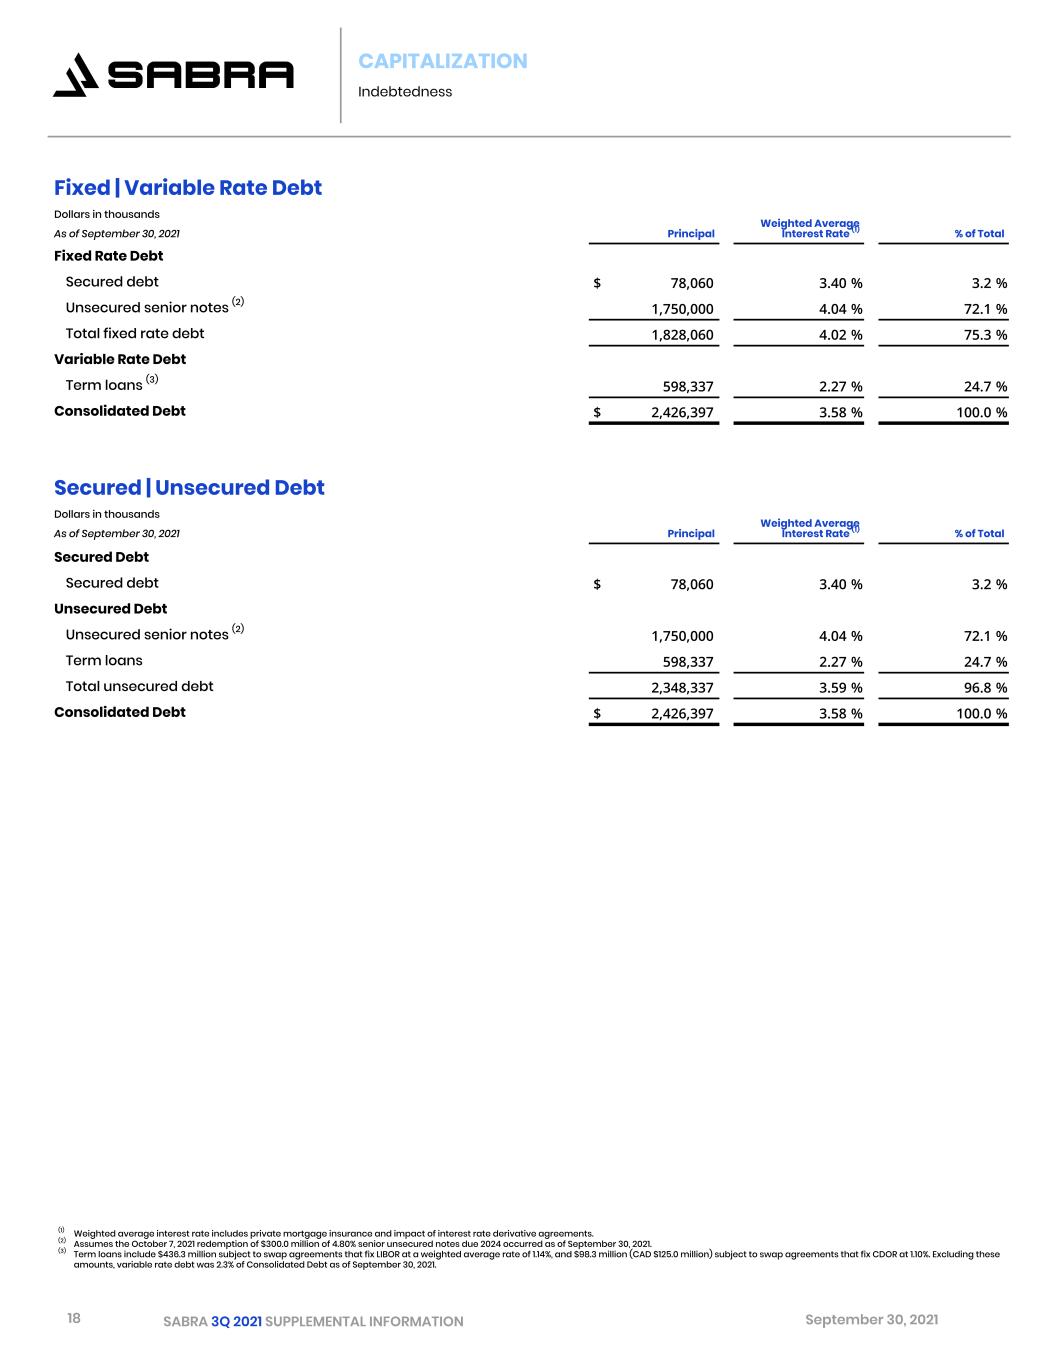
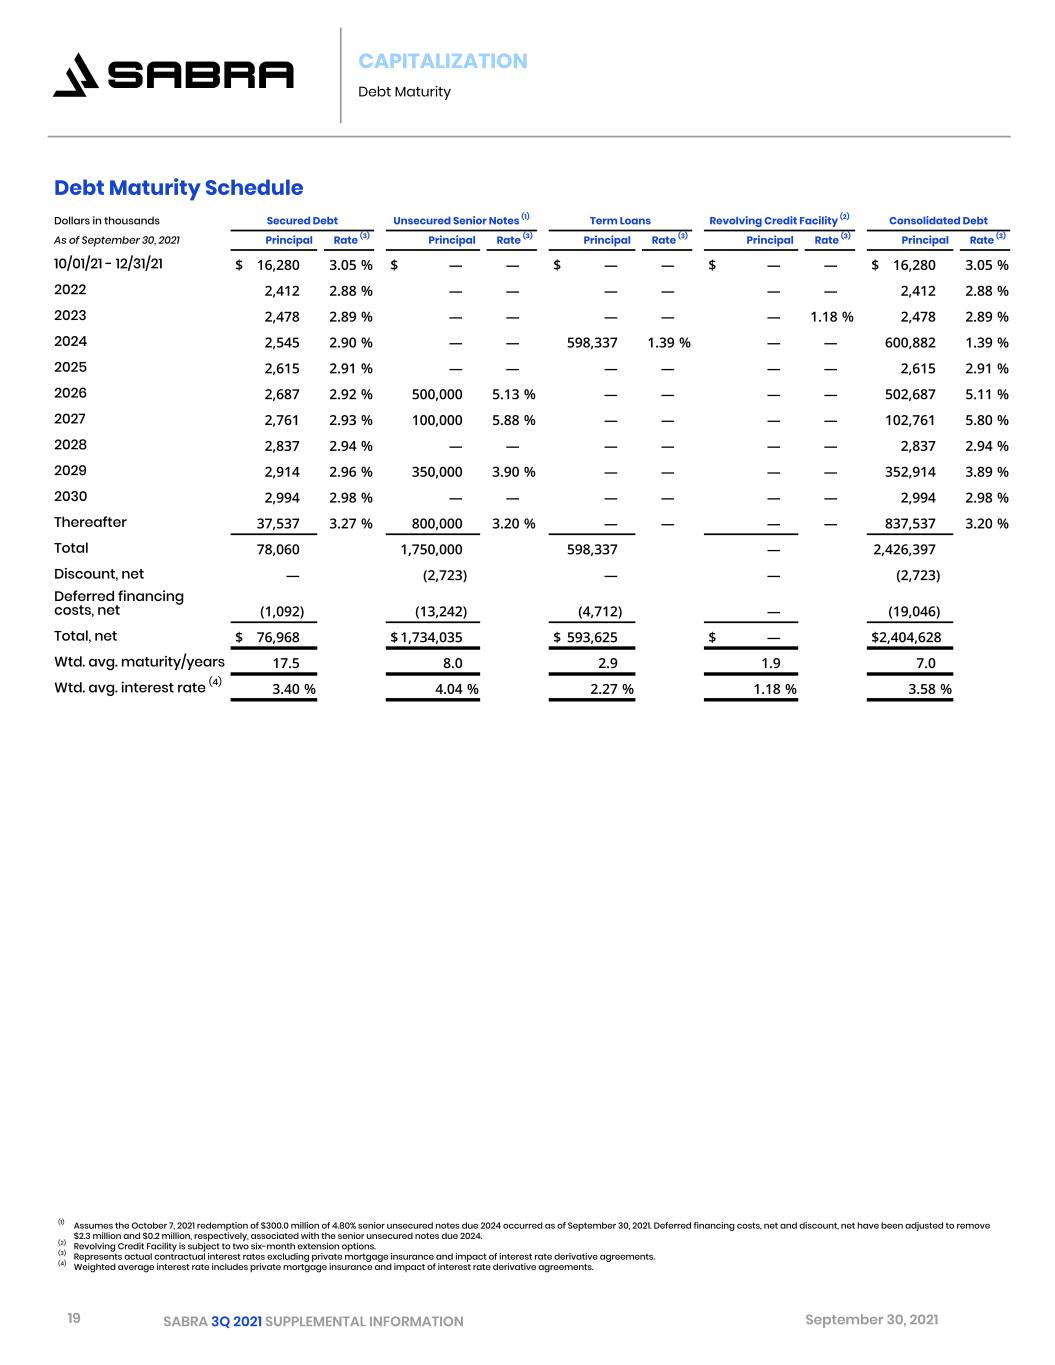
2 SABRA 3Q 2021 SUPPLEMENTAL INFORMATION September 30, 2021 03 COMPANY INFORMATION 04 OVERVIEW 05 PORTFOLIO Triple-Net Portfolio Same Store Triple-Net Portfolio Top 10 Relationships and COVID-19 Mitigation Summary Senior Housing - Managed Portfolio Loans and Other Investments | Development Pipeline NOI Concentrations Geographic Concentrations Lease Expirations 14 INVESTMENT ACTIVITY Summary Recent 17 CAPITALIZATION Overview Indebtedness Debt Maturity Credit Metrics and Ratings 21 FINANCIAL INFORMATION Condensed Consolidated Financial Statements - Statements of Income (Loss) Condensed Consolidated Financial Statements - Balance Sheets Condensed Consolidated Financial Statements - Statements of Cash Flows FFO, Normalized FFO, AFFO and Normalized AFFO Components of Net Asset Value (NAV) 27 APPENDIX Disclaimer Reporting Definitions Discussion and Reconciliation of Certain Non-GAAP Financial Measures: http://www.sabrahealth.com/investors/financials/reports-presentations/non-gaap CONTENT


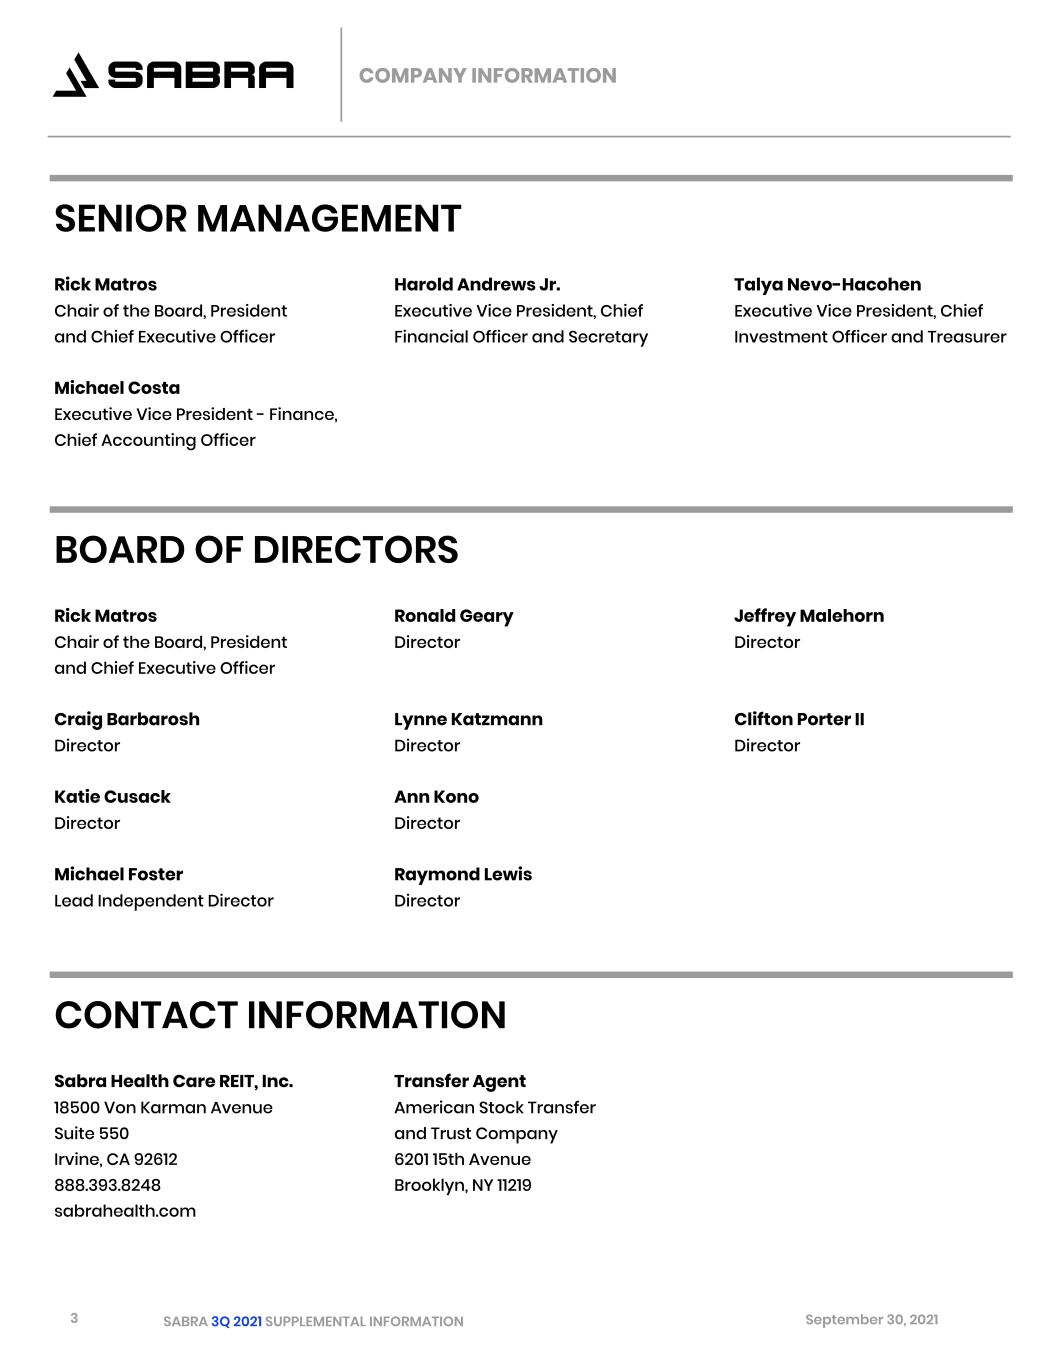
3 SABRA 3Q 2021 SUPPLEMENTAL INFORMATION September 30, 2021 SENIOR MANAGEMENT Rick Matros Harold Andrews Jr. Talya Nevo-Hacohen Chair of the Board, President Executive Vice President, Chief Executive Vice President, Chief and Chief Executive Officer Financial Officer and Secretary Investment Officer and Treasurer Michael Costa Executive Vice President - Finance, Chief Accounting Officer BOARD OF DIRECTORS Rick Matros Ronald Geary Jeffrey Malehorn Chair of the Board, President Director Director and Chief Executive Officer Craig Barbarosh Lynne Katzmann Clifton Porter II Director Director Director Katie Cusack Ann Kono Director Director Michael Foster Raymond Lewis Lead Independent Director Director CONTACT INFORMATION Sabra Health Care REIT, Inc. Transfer Agent 18500 Von Karman Avenue American Stock Transfer Suite 550 and Trust Company Irvine, CA 92612 6201 15th Avenue 888.393.8248 Brooklyn, NY 11219 sabrahealth.com COMPANY INFORMATION


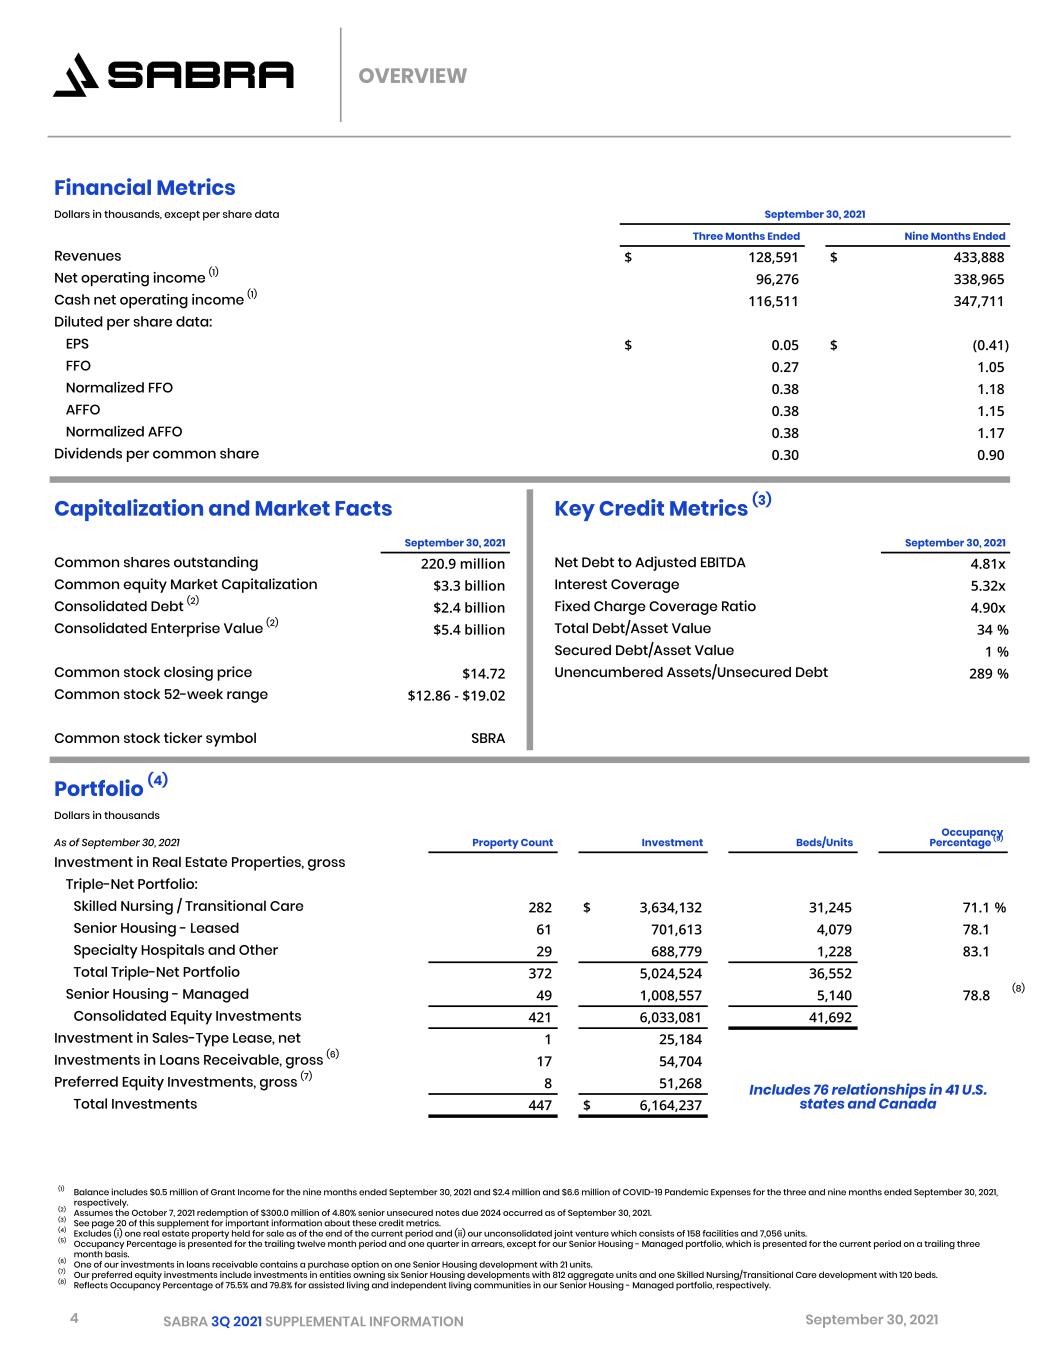
4 SABRA 3Q 2021 SUPPLEMENTAL INFORMATION September 30, 2021 Financial Metrics Dollars in thousands, except per share data September 30, 2021 Three Months Ended Nine Months Ended Revenues $ 128,591 $ 433,888 Net operating income (1) 96,276 338,965 Cash net operating income (1) 116,511 347,711 Diluted per share data: EPS $ 0.05 $ (0.41) FFO 0.27 1.05 Normalized FFO 0.38 1.18 AFFO 0.38 1.15 Normalized AFFO 0.38 1.17 Dividends per common share 0.30 0.90 Capitalization and Market Facts Key Credit Metrics (3) September 30, 2021 September 30, 2021 Common shares outstanding 220.9 million Net Debt to Adjusted EBITDA 4.81x Common equity Market Capitalization $3.3 billion Interest Coverage 5.32x Consolidated Debt (2) $2.4 billion Fixed Charge Coverage Ratio 4.90x Consolidated Enterprise Value (2) $5.4 billion Total Debt/Asset Value 34 % Secured Debt/Asset Value 1 % Common stock closing price $14.72 Unencumbered Assets/Unsecured Debt 289 % Common stock 52-week range $12.86 - $19.02 Common stock ticker symbol SBRA Portfolio (4) Dollars in thousands As of September 30, 2021 Property Count Investment Beds/Units Occupancy Percentage (5) Investment in Real Estate Properties, gross Triple-Net Portfolio: Skilled Nursing / Transitional Care 282 $ 3,634,132 31,245 71.1 % Senior Housing - Leased 61 701,613 4,079 78.1 Specialty Hospitals and Other 29 688,779 1,228 83.1 Total Triple-Net Portfolio 372 5,024,524 36,552 Senior Housing - Managed 49 1,008,557 5,140 78.8 (8) Consolidated Equity Investments 421 6,033,081 41,692 Investment in Sales-Type Lease, net 1 25,184 Investments in Loans Receivable, gross (6) 17 54,704 Preferred Equity Investments, gross (7) 8 51,268 Includes 76 relationships in 41 U.S. states and CanadaTotal Investments 447 $ 6,164,237 (1) Balance includes $0.5 million of Grant Income for the nine months ended September 30, 2021 and $2.4 million and $6.6 million of COVID-19 Pandemic Expenses for the three and nine months ended September 30, 2021, respectively. (2) Assumes the October 7, 2021 redemption of $300.0 million of 4.80% senior unsecured notes due 2024 occurred as of September 30, 2021. (3) See page 20 of this supplement for important information about these credit metrics. (4) Excludes (i) one real estate property held for sale as of the end of the current period and (ii) our unconsolidated joint venture which consists of 158 facilities and 7,056 units. (5) Occupancy Percentage is presented for the trailing twelve month period and one quarter in arrears, except for our Senior Housing - Managed portfolio, which is presented for the current period on a trailing three month basis. (6) One of our investments in loans receivable contains a purchase option on one Senior Housing development with 21 units. (7) Our preferred equity investments include investments in entities owning six Senior Housing developments with 812 aggregate units and one Skilled Nursing/Transitional Care development with 120 beds. (8) Reflects Occupancy Percentage of 75.5% and 79.8% for assisted living and independent living communities in our Senior Housing - Managed portfolio, respectively. OVERVIEW


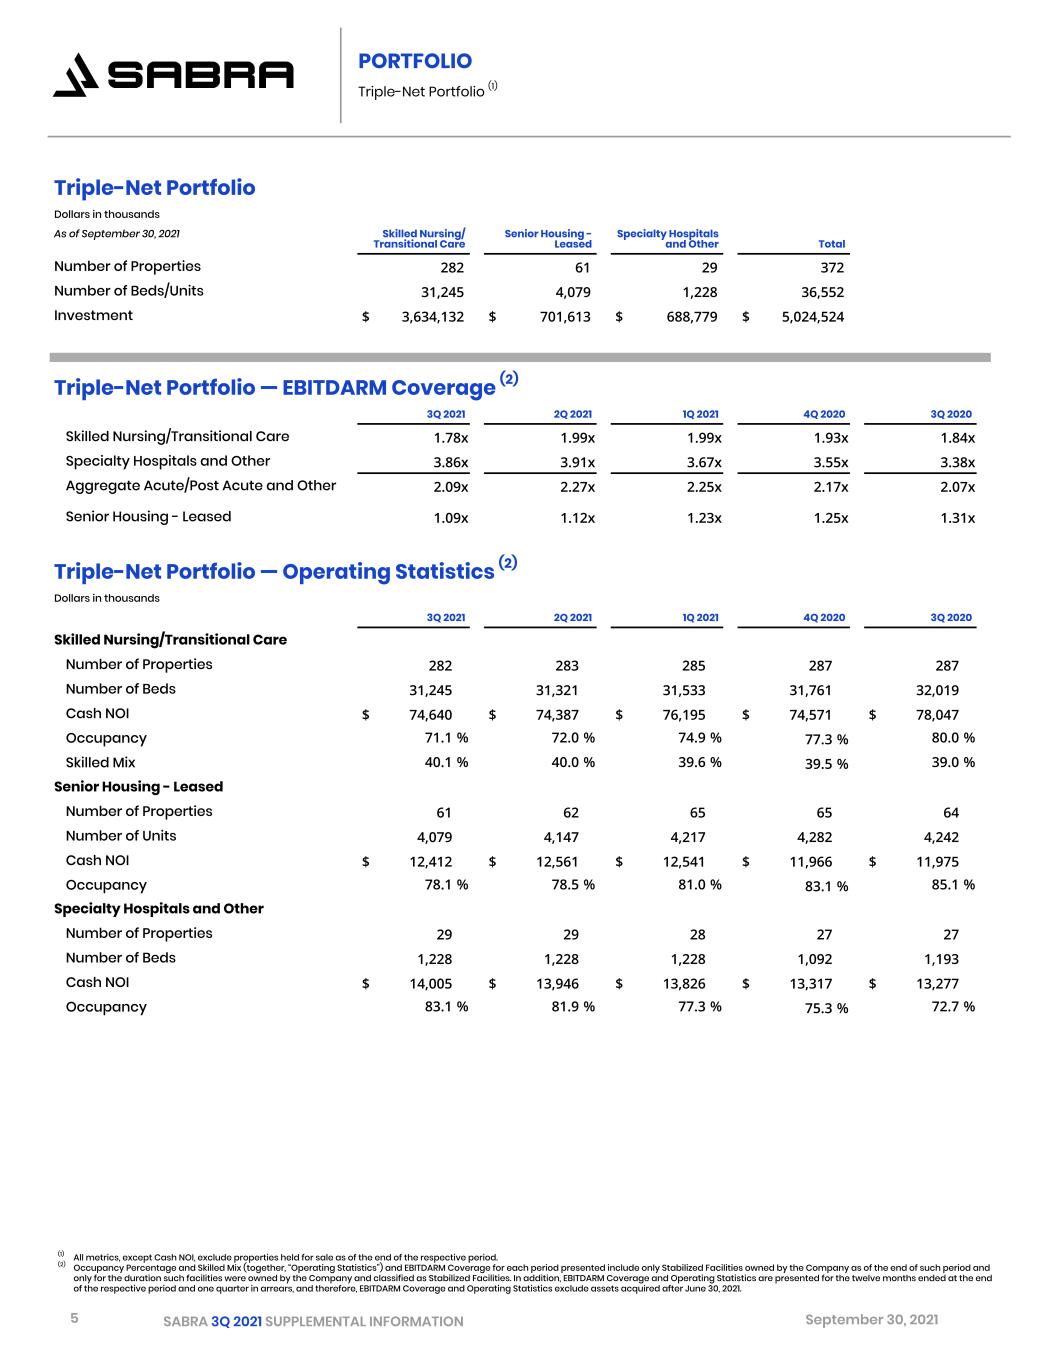
5 SABRA 3Q 2021 SUPPLEMENTAL INFORMATION September 30, 2021 Senior Housing - Leased Number of Properties 61 62 65 65 64 Number of Units 4,079 4,147 4,217 4,282 4,242 Cash NOI $ 12,412 $ 12,561 $ 12,541 $ 11,966 $ 11,975 Occupancy 78.1 % 78.5 % 81.0 % 83.1 % 85.1 % Triple-Net Portfolio — Operating Statistics (2) Dollars in thousands 3Q 2021 2Q 2021 1Q 2021 4Q 2020 3Q 2020 Skilled Nursing/Transitional Care Number of Properties 282 283 285 287 287 Number of Beds 31,245 31,321 31,533 31,761 32,019 Cash NOI $ 74,640 $ 74,387 $ 76,195 $ 74,571 $ 78,047 Occupancy 71.1 % 72.0 % 74.9 % 77.3 % 80.0 % Skilled Mix 40.1 % 40.0 % 39.6 % 39.5 % 39.0 % Specialty Hospitals and Other Number of Properties 29 29 28 27 27 Number of Beds 1,228 1,228 1,228 1,092 1,193 Cash NOI $ 14,005 $ 13,946 $ 13,826 $ 13,317 $ 13,277 Occupancy 83.1 % 81.9 % 77.3 % 75.3 % 72.7 % PORTFOLIO Triple-Net Portfolio (1) Triple-Net Portfolio Dollars in thousands As of September 30, 2021 Skilled Nursing/ Transitional Care Senior Housing - Leased Specialty Hospitals and Other Total Number of Properties 282 61 29 372 Number of Beds/Units 31,245 4,079 1,228 36,552 Investment $ 3,634,132 $ 701,613 $ 688,779 $ 5,024,524 (1) All metrics, except Cash NOI, exclude properties held for sale as of the end of the respective period. (2) Occupancy Percentage and Skilled Mix (together, “Operating Statistics”) and EBITDARM Coverage for each period presented include only Stabilized Facilities owned by the Company as of the end of such period and only for the duration such facilities were owned by the Company and classified as Stabilized Facilities. In addition, EBITDARM Coverage and Operating Statistics are presented for the twelve months ended at the end of the respective period and one quarter in arrears, and therefore, EBITDARM Coverage and Operating Statistics exclude assets acquired after June 30, 2021. Triple-Net Portfolio — EBITDARM Coverage (2) 3Q 2021 2Q 2021 1Q 2021 4Q 2020 3Q 2020 Skilled Nursing/Transitional Care 1.78x 1.99x 1.99x 1.93x 1.84x Specialty Hospitals and Other 3.86x 3.91x 3.67x 3.55x 3.38x Aggregate Acute/Post Acute and Other 2.09x 2.27x 2.25x 2.17x 2.07x Senior Housing - Leased 1.09x 1.12x 1.23x 1.25x 1.31x


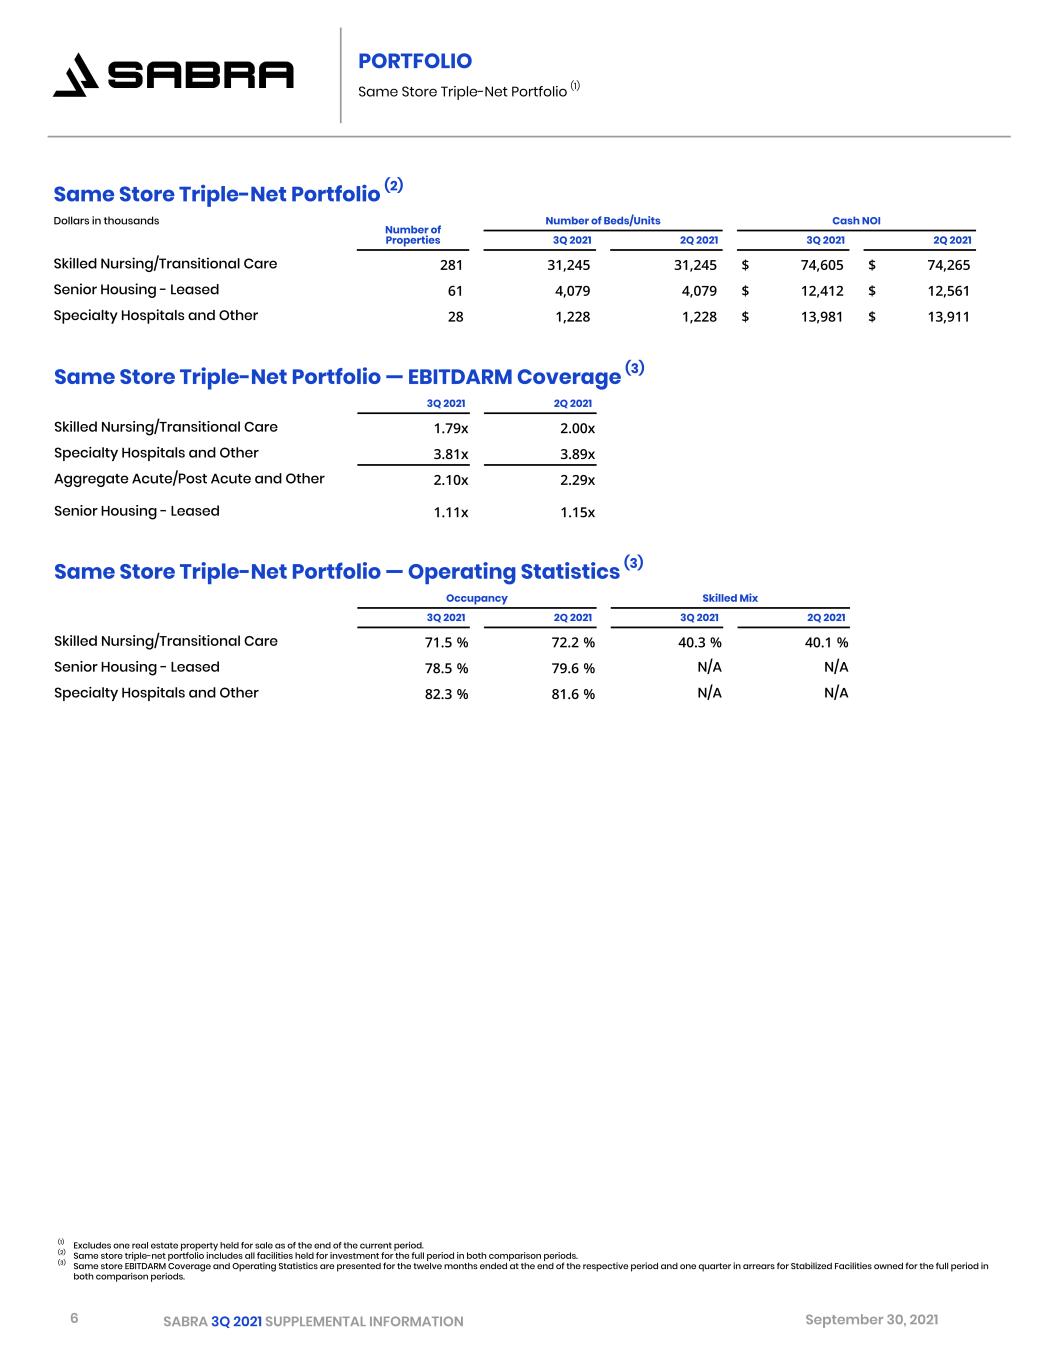
6 SABRA 3Q 2021 SUPPLEMENTAL INFORMATION September 30, 2021 PORTFOLIO Same Store Triple-Net Portfolio (1) (1) Excludes one real estate property held for sale as of the end of the current period. (2) Same store triple-net portfolio includes all facilities held for investment for the full period in both comparison periods. (3) Same store EBITDARM Coverage and Operating Statistics are presented for the twelve months ended at the end of the respective period and one quarter in arrears for Stabilized Facilities owned for the full period in both comparison periods. Same Store Triple-Net Portfolio (2) Dollars in thousands Number of Properties Number of Beds/Units Cash NOI 3Q 2021 2Q 2021 3Q 2021 2Q 2021 Skilled Nursing/Transitional Care 281 31,245 31,245 $ 74,605 $ 74,265 Senior Housing - Leased 61 4,079 4,079 $ 12,412 $ 12,561 Specialty Hospitals and Other 28 1,228 1,228 $ 13,981 $ 13,911 Same Store Triple-Net Portfolio — EBITDARM Coverage (3) 3Q 2021 2Q 2021 Skilled Nursing/Transitional Care 1.79x 2.00x Specialty Hospitals and Other 3.81x 3.89x Aggregate Acute/Post Acute and Other 2.10x 2.29x Senior Housing - Leased 1.11x 1.15x Same Store Triple-Net Portfolio — Operating Statistics (3) Occupancy Skilled Mix 3Q 2021 2Q 2021 3Q 2021 2Q 2021 Skilled Nursing/Transitional Care 71.5 % 72.2 % 40.3 % 40.1 % Senior Housing - Leased 78.5 % 79.6 % N/A N/A Specialty Hospitals and Other 82.3 % 81.6 % N/A N/A


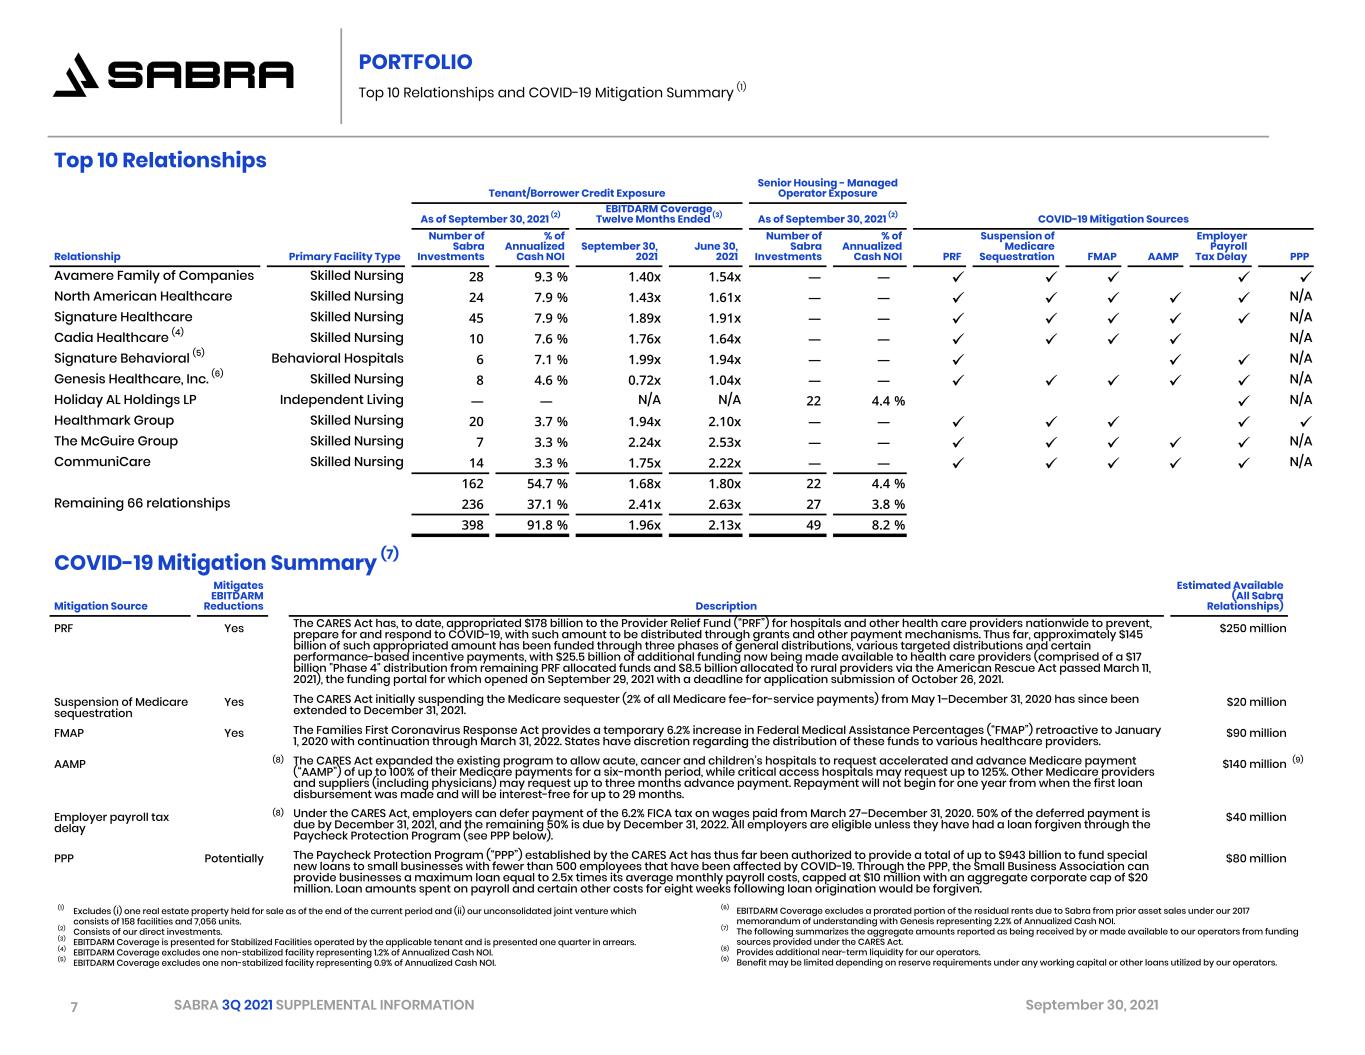
7 SABRA 3Q 2021 SUPPLEMENTAL INFORMATION September 30, 2021 PORTFOLIO Top 10 Relationships and COVID-19 Mitigation Summary (1) Top 10 Relationships Tenant/Borrower Credit Exposure Senior Housing - Managed Operator Exposure As of September 30, 2021 (2) EBITDARM Coverage Twelve Months Ended (3) As of September 30, 2021 (2) COVID-19 Mitigation Sources Relationship Primary Facility Type Number of Sabra Investments % of Annualized Cash NOI September 30, 2021 June 30, 2021 Number of Sabra Investments % of Annualized Cash NOI PRF Suspension of Medicare Sequestration FMAP AAMP Employer Payroll Tax Delay PPP Avamere Family of Companies Skilled Nursing   28 9.3 % 1.40x 1.54x — — ü ü ü ü ü North American Healthcare Skilled Nursing 24 7.9 % 1.43x 1.61x — — ü ü ü ü ü N/A Signature Healthcare Skilled Nursing 45 7.9 % 1.89x 1.91x — — ü ü ü ü ü N/A Cadia Healthcare (4) Skilled Nursing 10 7.6 % 1.76x 1.64x — — ü ü ü ü N/A Signature Behavioral (5) Behavioral Hospitals 6 7.1 % 1.99x 1.94x — — ü ü ü N/A Genesis Healthcare, Inc. (6) Skilled Nursing 8 4.6 % 0.72x 1.04x — — ü ü ü ü ü N/A Holiday AL Holdings LP Independent Living — — N/A N/A 22 4.4 % ü N/A Healthmark Group Skilled Nursing 20 3.7 % 1.94x 2.10x — — ü ü ü ü ü The McGuire Group Skilled Nursing 7 3.3 % 2.24x 2.53x — — ü ü ü ü ü N/A CommuniCare Skilled Nursing 14 3.3 % 1.75x 2.22x — — ü ü ü ü ü N/A 162 54.7 % 1.68x 1.80x 22 4.4 % Remaining 66 relationships 236 37.1 % 2.41x 2.63x 27 3.8 % 398 91.8 % 1.96x 2.13x 49 8.2 % (1) Excludes (i) one real estate property held for sale as of the end of the current period and (ii) our unconsolidated joint venture which consists of 158 facilities and 7,056 units. (2) Consists of our direct investments. (3) EBITDARM Coverage is presented for Stabilized Facilities operated by the applicable tenant and is presented one quarter in arrears. (4) EBITDARM Coverage excludes one non-stabilized facility representing 1.2% of Annualized Cash NOI. (5) EBITDARM Coverage excludes one non-stabilized facility representing 0.9% of Annualized Cash NOI. COVID-19 Mitigation Summary (7) Mitigation Source Mitigates EBITDARM Reductions Description Estimated Available (All Sabra Relationships) PRF Yes The CARES Act has, to date, appropriated $178 billion to the Provider Relief Fund (“PRF”) for hospitals and other health care providers nationwide to prevent, prepare for and respond to COVID-19, with such amount to be distributed through grants and other payment mechanisms. Thus far, approximately $145 billion of such appropriated amount has been funded through three phases of general distributions, various targeted distributions and certain performance-based incentive payments, with $25.5 billion of additional funding now being made available to health care providers (comprised of a $17 billion "Phase 4" distribution from remaining PRF allocated funds and $8.5 billion allocated to rural providers via the American Rescue Act passed March 11, 2021), the funding portal for which opened on September 29, 2021 with a deadline for application submission of October 26, 2021.   $250 million Suspension of Medicare sequestration Yes The CARES Act initially suspending the Medicare sequester (2% of all Medicare fee-for-service payments) from May 1–December 31, 2020 has since been extended to December 31, 2021.   $20 million FMAP Yes The Families First Coronavirus Response Act provides a temporary 6.2% increase in Federal Medical Assistance Percentages (“FMAP”) retroactive to January 1, 2020 with continuation through March 31, 2022. States have discretion regarding the distribution of these funds to various healthcare providers. $90 million AAMP (8) $1 The CARES Act expanded the existing program to allow acute, cancer and children’s hospitals to request accelerated and advance Medicare payment (“AAMP”) of up to 100% of their Medicare payments for a six-month period, while critical access hospitals may request up to 125%. Other Medicare providers and suppliers (including physicians) may request up to three months advance payment. Repayment will not begin for one year from when the first loan disbursement was made and will be interest-free for up to 29 months. $140 million (9) $1 Employer payroll tax delay (8) $1 Under the CARES Act, employers can defer payment of the 6.2% FICA tax on wages paid from March 27–December 31, 2020. 50% of the deferred payment is due by December 31, 2021, and the remaining 50% is due by December 31, 2022. All employers are eligible unless they have had a loan forgiven through the Paycheck Protection Program (see PPP below). $40 million PPP Potentially The Paycheck Protection Program (“PPP”) established by the CARES Act has thus far been authorized to provide a total of up to $943 billion to fund special new loans to small businesses with fewer than 500 employees that have been affected by COVID-19. Through the PPP, the Small Business Association can provide businesses a maximum loan equal to 2.5x times its average monthly payroll costs, capped at $10 million with an aggregate corporate cap of $20 million. Loan amounts spent on payroll and certain other costs for eight weeks following loan origination would be forgiven. $80 million (6) EBITDARM Coverage excludes a prorated portion of the residual rents due to Sabra from prior asset sales under our 2017 memorandum of understanding with Genesis representing 2.2% of Annualized Cash NOI. (7) The following summarizes the aggregate amounts reported as being received by or made available to our operators from funding sources provided under the CARES Act. (8) Provides additional near-term liquidity for our operators. (9) Benefit may be limited depending on reserve requirements under any working capital or other loans utilized by our operators.


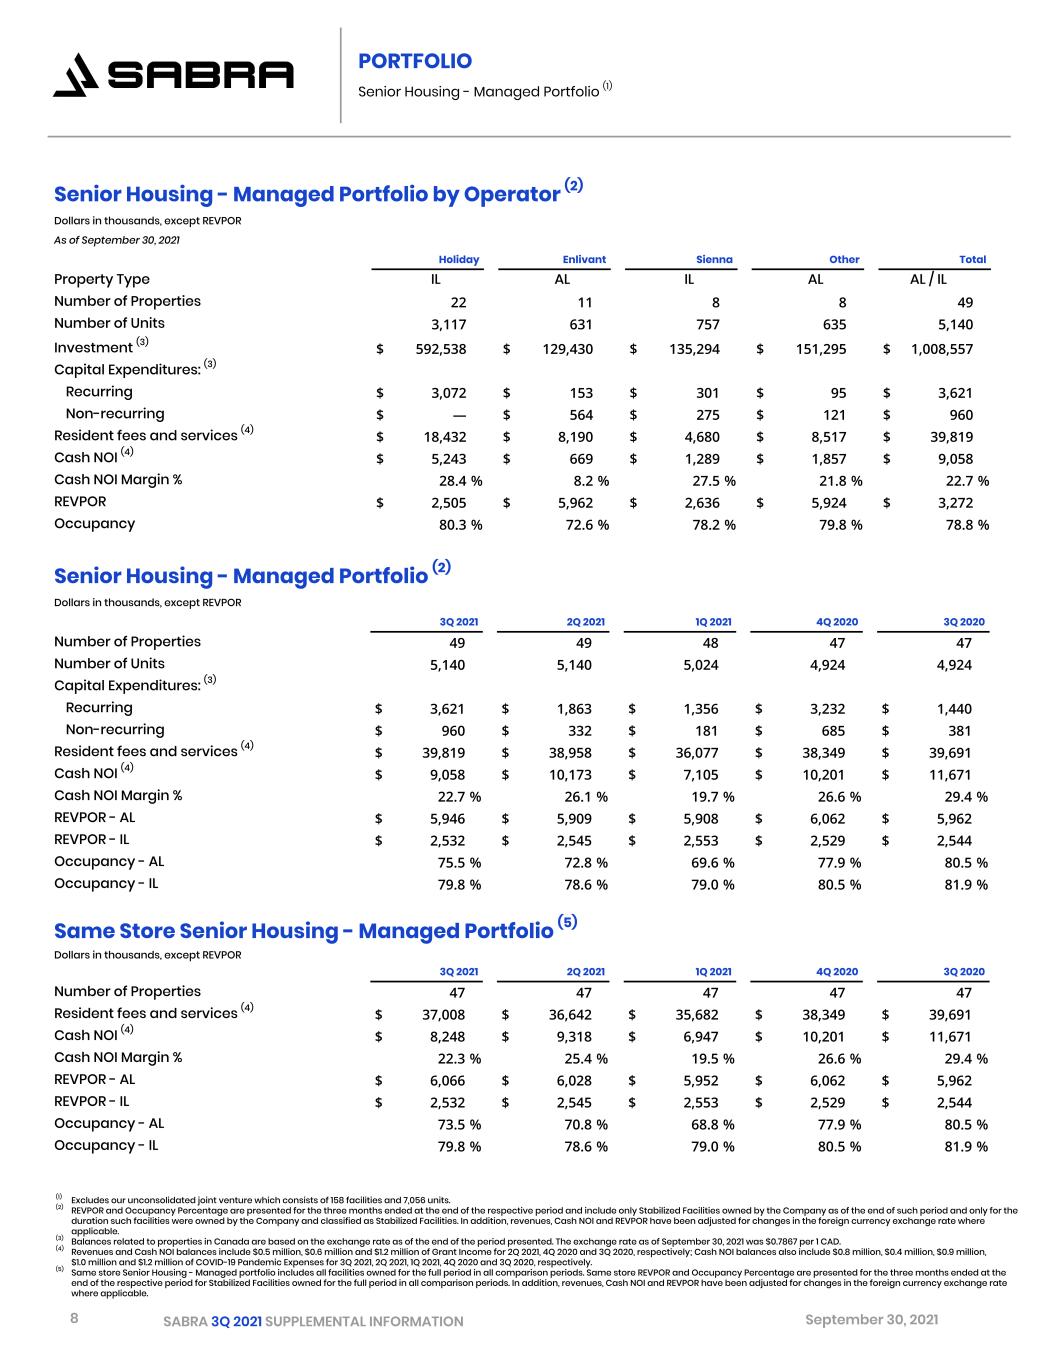
8 SABRA 3Q 2021 SUPPLEMENTAL INFORMATION September 30, 2021 PORTFOLIO Senior Housing - Managed Portfolio (1) (1) Excludes our unconsolidated joint venture which consists of 158 facilities and 7,056 units. (2) REVPOR and Occupancy Percentage are presented for the three months ended at the end of the respective period and include only Stabilized Facilities owned by the Company as of the end of such period and only for the duration such facilities were owned by the Company and classified as Stabilized Facilities. In addition, revenues, Cash NOI and REVPOR have been adjusted for changes in the foreign currency exchange rate where applicable. (3) Balances related to properties in Canada are based on the exchange rate as of the end of the period presented. The exchange rate as of September 30, 2021 was $0.7867 per 1 CAD. (4) Revenues and Cash NOI balances include $0.5 million, $0.6 million and $1.2 million of Grant Income for 2Q 2021, 4Q 2020 and 3Q 2020, respectively; Cash NOI balances also include $0.8 million, $0.4 million, $0.9 million, $1.0 million and $1.2 million of COVID-19 Pandemic Expenses for 3Q 2021, 2Q 2021, 1Q 2021, 4Q 2020 and 3Q 2020, respectively. (5) Same store Senior Housing - Managed portfolio includes all facilities owned for the full period in all comparison periods. Same store REVPOR and Occupancy Percentage are presented for the three months ended at the end of the respective period for Stabilized Facilities owned for the full period in all comparison periods. In addition, revenues, Cash NOI and REVPOR have been adjusted for changes in the foreign currency exchange rate where applicable. Senior Housing - Managed Portfolio by Operator (2) Dollars in thousands, except REVPOR As of September 30, 2021 Holiday Sienna Other TotalEnlivant Property Type IL AL IL AL AL / IL Number of Properties 22 11 8 8 49 Number of Units 3,117 631 757 635 5,140 Investment (3) $ 592,538 $ 129,430 $ 135,294 $ 151,295 $ 1,008,557 Capital Expenditures: (3) Recurring $ 3,072 $ 153 $ 301 $ 95 $ 3,621 Non-recurring $ — $ 564 $ 275 $ 121 $ 960 Resident fees and services (4) $ 18,432 $ 8,190 $ 4,680 $ 8,517 $ 39,819 Cash NOI (4) $ 5,243 $ 669 $ 1,289 $ 1,857 $ 9,058 Cash NOI Margin % 28.4 % 8.2 % 27.5 % 21.8 % 22.7 % REVPOR $ 2,505 $ 5,962 $ 2,636 $ 5,924 $ 3,272 Occupancy 80.3 % 72.6 % 78.2 % 79.8 % 78.8 % Senior Housing - Managed Portfolio (2) Dollars in thousands, except REVPOR 3Q 2021 2Q 2021 1Q 2021 4Q 2020 3Q 2020 Number of Properties 49 49 48 47 47 Number of Units 5,140 5,140 5,024 4,924 4,924 Capital Expenditures: (3) Recurring $ 3,621 $ 1,863 $ 1,356 $ 3,232 $ 1,440 Non-recurring $ 960 $ 332 $ 181 $ 685 $ 381 Resident fees and services (4) $ 39,819 $ 38,958 $ 36,077 $ 38,349 $ 39,691 Cash NOI (4) $ 9,058 $ 10,173 $ 7,105 $ 10,201 $ 11,671 Cash NOI Margin % 22.7 % 26.1 % 19.7 % 26.6 % 29.4 % REVPOR - AL $ 5,946 $ 5,909 $ 5,908 $ 6,062 $ 5,962 REVPOR - IL $ 2,532 $ 2,545 $ 2,553 $ 2,529 $ 2,544 Occupancy - AL 75.5 % 72.8 % 69.6 % 77.9 % 80.5 % Occupancy - IL 79.8 % 78.6 % 79.0 % 80.5 % 81.9 % Same Store Senior Housing - Managed Portfolio (5) Dollars in thousands, except REVPOR 3Q 2021 2Q 2021 1Q 2021 4Q 2020 3Q 2020 Number of Properties 47 47 47 47 47 Resident fees and services (4) $ 37,008 $ 36,642 $ 35,682 $ 38,349 $ 39,691 Cash NOI (4) $ 8,248 $ 9,318 $ 6,947 $ 10,201 $ 11,671 Cash NOI Margin % 22.3 % 25.4 % 19.5 % 26.6 % 29.4 % REVPOR - AL $ 6,066 $ 6,028 $ 5,952 $ 6,062 $ 5,962 REVPOR - IL $ 2,532 $ 2,545 $ 2,553 $ 2,529 $ 2,544 Occupancy - AL 73.5 % 70.8 % 68.8 % 77.9 % 80.5 % Occupancy - IL 79.8 % 78.6 % 79.0 % 80.5 % 81.9 %


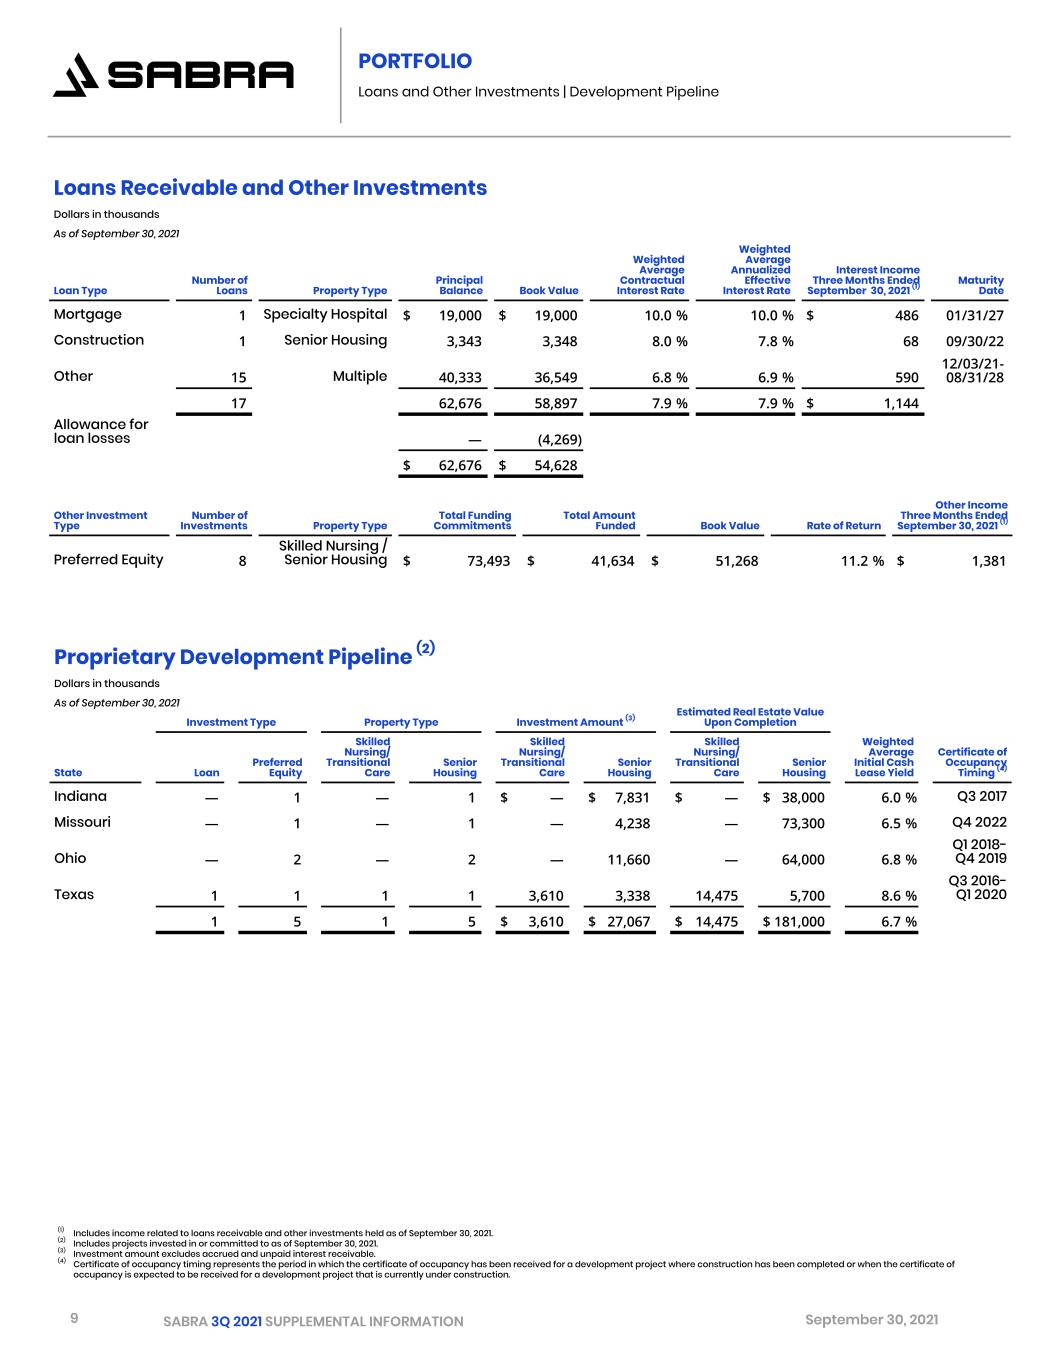
9 SABRA 3Q 2021 SUPPLEMENTAL INFORMATION September 30, 2021 PORTFOLIO Loans and Other Investments | Development Pipeline Loans Receivable and Other Investments Dollars in thousands As of September 30, 2021 Loan Type Number of Loans Property Type Principal Balance Book Value Weighted Average Contractual Interest Rate Weighted Average Annualized Effective Interest Rate Interest Income Three Months Ended September 30, 2021 (1) Maturity Date Mortgage 1 Specialty Hospital $ 19,000 $ 19,000 10.0 % 10.0 % $ 486 01/31/27 Construction 1 Senior Housing 3,343 3,348 8.0 % 7.8 % 68 09/30/22 Other 15 Multiple 40,333 36,549 6.8 % 6.9 % 590 12/03/21- 08/31/28 17 62,676 58,897 7.9 % 7.9 % $ 1,144 Allowance for loan losses — (4,269) $ 62,676 $ 54,628 Other Investment Type Number of Investments Property Type Total Funding Commitments Total Amount Funded Book Value Rate of Return Other Income Three Months Ended September 30, 2021 (1) Preferred Equity 8 Skilled Nursing / Senior Housing $ 73,493 $ 41,634 $ 51,268 11.2 % $ 1,381 (1) Includes income related to loans receivable and other investments held as of September 30, 2021. (2) Includes projects invested in or committed to as of September 30, 2021. (3) Investment amount excludes accrued and unpaid interest receivable. (4) Certificate of occupancy timing represents the period in which the certificate of occupancy has been received for a development project where construction has been completed or when the certificate of occupancy is expected to be received for a development project that is currently under construction. Proprietary Development Pipeline (2) Dollars in thousands Estimated Real Estate Value Upon Completion As of September 30, 2021 Investment Type Property Type Investment Amount (3) Weighted Average Initial Cash Lease Yield Certificate of Occupancy Timing (4)State Loan Preferred Equity Skilled Nursing/ Transitional Care Senior Housing Skilled Nursing/ Transitional Care Senior Housing Skilled Nursing/ Transitional Care Senior Housing Indiana — 1 — 1 $ — $ 7,831 $ — $ 38,000 6.0 % Q3 2017 Missouri — 1 — 1 — 4,238 — 73,300 6.5 % Q4 2022 Ohio — 2 — 2 — 11,660 — 64,000 6.8 % Q1 2018- Q4 2019 Texas 1 1 1 1 3,610 3,338 14,475 5,700 8.6 % Q3 2016- Q1 2020 1 5 1 5 $ 3,610 $ 27,067 $ 14,475 $ 181,000 6.7 %


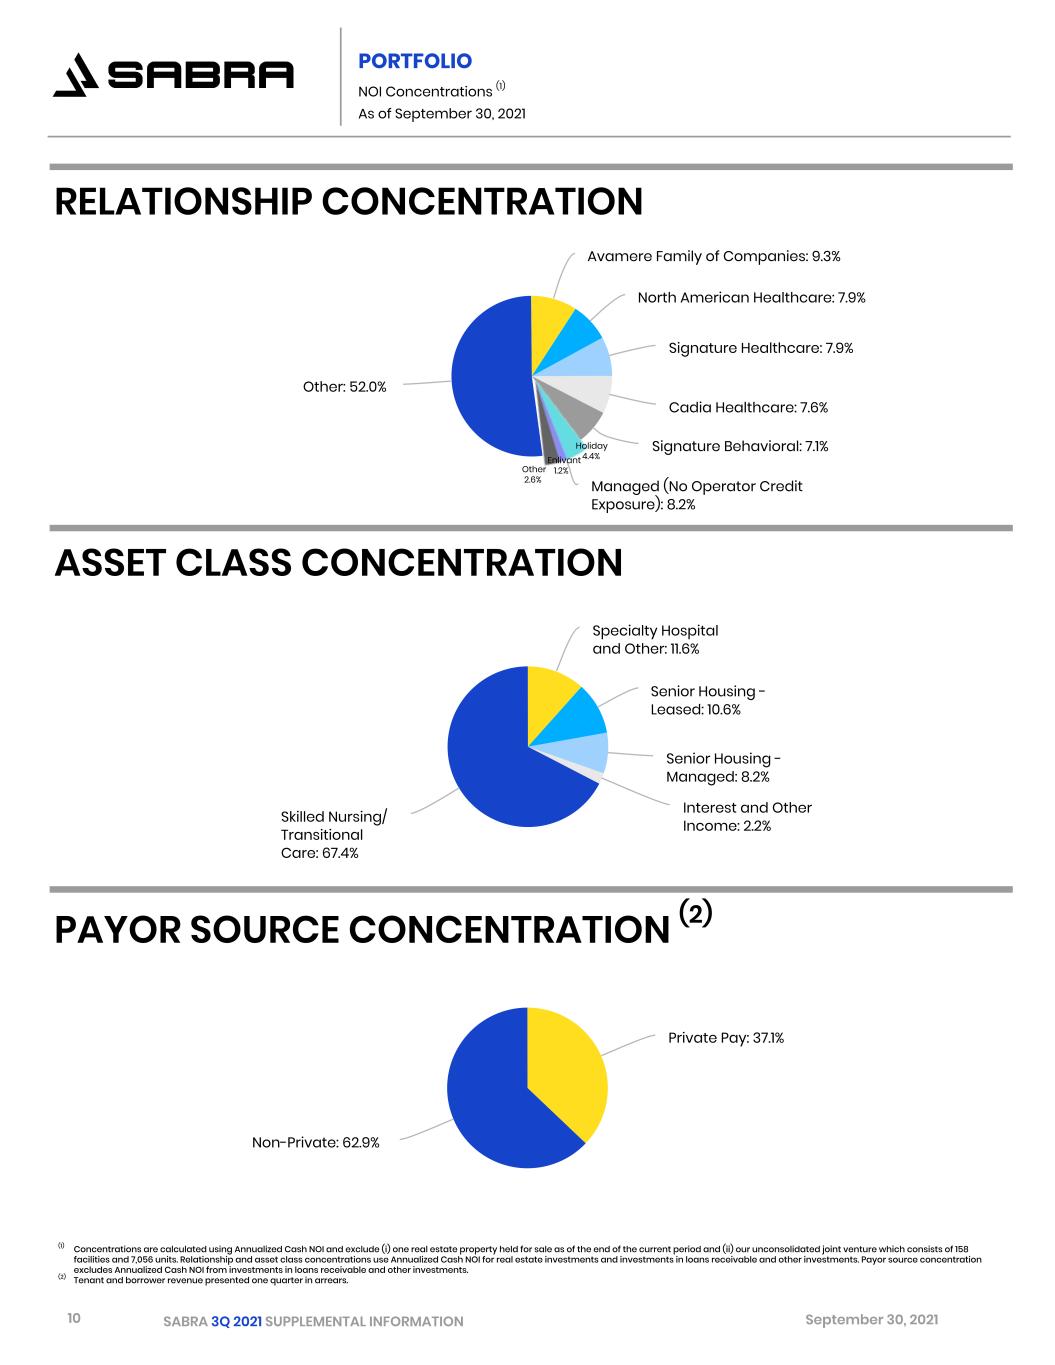
10 SABRA 3Q 2021 SUPPLEMENTAL INFORMATION September 30, 2021 North American Healthcare: 7.9% Signature Healthcare: 7.9% Cadia Healthcare: 7.6% Signature Behavioral: 7.1% Managed (No Operator Credit Exposure): 8.2% Other: 52.0% Avamere Family of Companies: 9.3% RELATIONSHIP CONCENTRATION ASSET CLASS CONCENTRATION PAYOR SOURCE CONCENTRATION (2) PORTFOLIO NOI Concentrations (1) As of September 30, 2021 (1) Concentrations are calculated using Annualized Cash NOI and exclude (i) one real estate property held for sale as of the end of the current period and (ii) our unconsolidated joint venture which consists of 158 facilities and 7,056 units. Relationship and asset class concentrations use Annualized Cash NOI for real estate investments and investments in loans receivable and other investments. Payor source concentration excludes Annualized Cash NOI from investments in loans receivable and other investments. (2) Tenant and borrower revenue presented one quarter in arrears. Holiday 4.4%Enlivant 1.2%Other 2.6% Specialty Hospital and Other: 11.6% Senior Housing - Leased: 10.6% Senior Housing - Managed: 8.2% Interest and Other Income: 2.2%Skilled Nursing/ Transitional Care: 67.4% Private Pay: 37.1% Non-Private: 62.9%


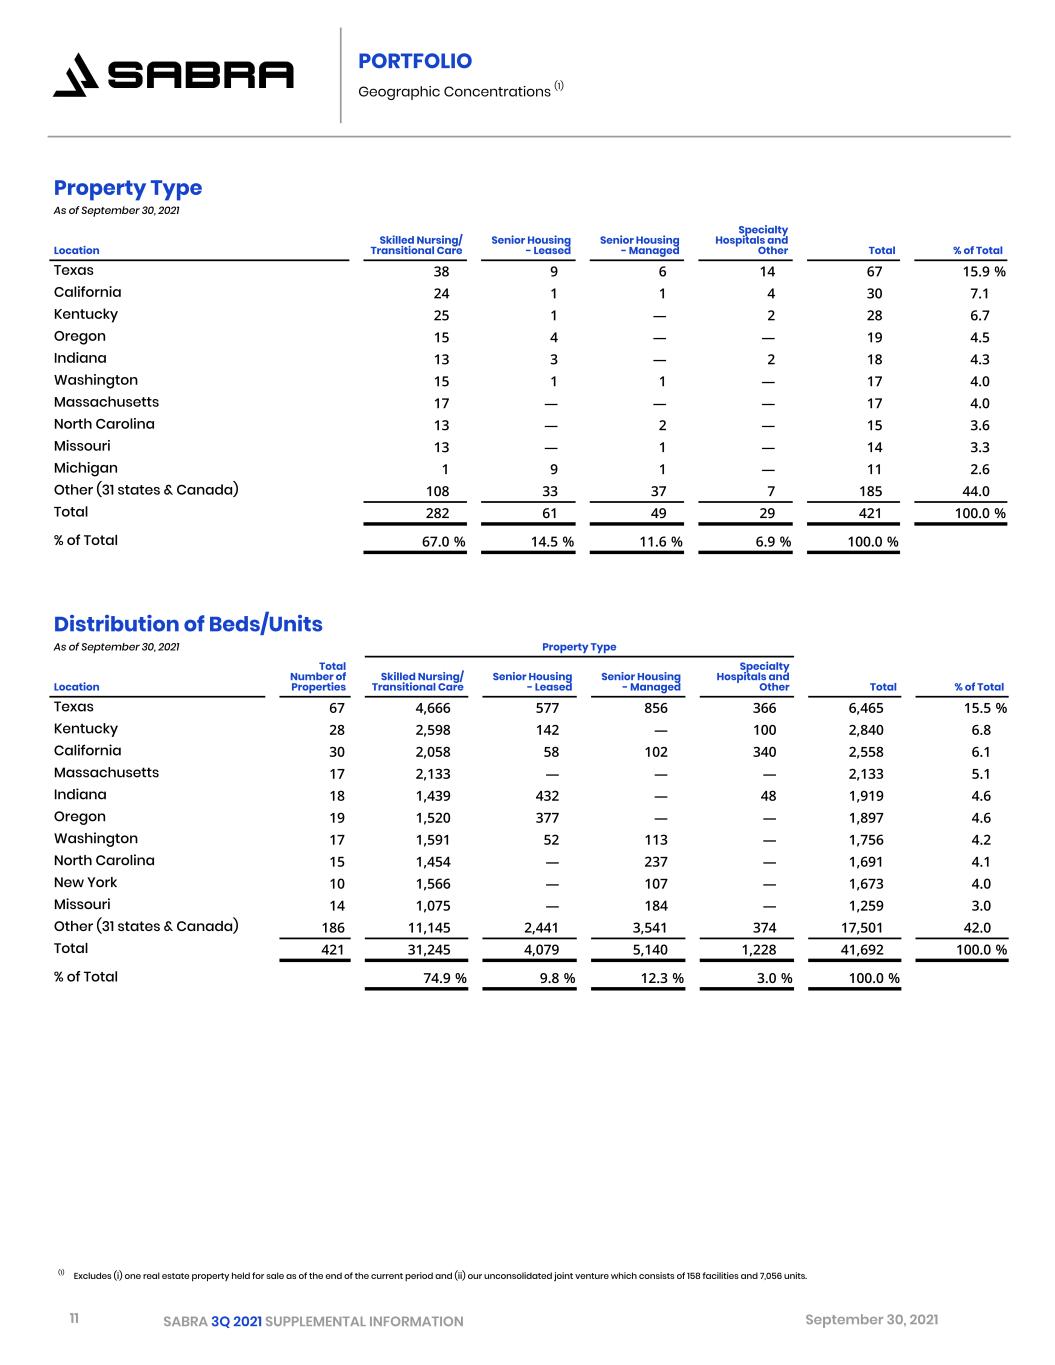
11 SABRA 3Q 2021 SUPPLEMENTAL INFORMATION September 30, 2021 PORTFOLIO Geographic Concentrations (1) Property Type As of September 30, 2021 Location Skilled Nursing/ Transitional Care Senior Housing - Leased Senior Housing - Managed    Specialty Hospitals and Other Total % of Total Texas 38 9 6 14 67 15.9 % California 24 1 1 4 30 7.1 Kentucky 25 1 — 2 28 6.7 Oregon 15 4 — — 19 4.5 Indiana 13 3 — 2 18 4.3 Washington 15 1 1 — 17 4.0 Massachusetts 17 — — — 17 4.0 North Carolina 13 — 2 — 15 3.6 Missouri 13 — 1 — 14 3.3 Michigan 1 9 1 — 11 2.6 Other (31 states & Canada) 108 33 37 7 185 44.0 Total 282 61 49 29 421 100.0 % % of Total 67.0 % 14.5 % 11.6 % 6.9 % 100.0 % Distribution of Beds/Units As of September 30, 2021   Property Type Location Total Number of Properties Skilled Nursing/ Transitional Care Senior Housing - Leased Senior Housing - Managed    Specialty Hospitals and Other Total % of Total Texas 67 4,666 577 856 366 6,465 15.5 % Kentucky 28 2,598 142 — 100 2,840 6.8 California 30 2,058 58 102 340 2,558 6.1 Massachusetts 17 2,133 — — — 2,133 5.1 Indiana 18 1,439 432 — 48 1,919 4.6 Oregon 19 1,520 377 — — 1,897 4.6 Washington 17 1,591 52 113 — 1,756 4.2 North Carolina 15 1,454 — 237 — 1,691 4.1 New York 10 1,566 — 107 — 1,673 4.0 Missouri 14 1,075 — 184 — 1,259 3.0 Other (31 states & Canada) 186 11,145 2,441 3,541 374 17,501 42.0 Total 421 31,245 4,079 5,140 1,228 41,692 100.0 % % of Total 74.9 % 9.8 % 12.3 % 3.0 % 100.0 % (1) Excludes (i) one real estate property held for sale as of the end of the current period and (ii) our unconsolidated joint venture which consists of 158 facilities and 7,056 units.


12 SABRA 3Q 2021 SUPPLEMENTAL INFORMATION September 30, 2021 PORTFOLIO Geographic Concentrations Continued (1) Investment Dollars in thousands As of September 30, 2021   Property Type Location Total Number of Properties Skilled Nursing/ Transitional Care Senior Housing - Leased Senior Housing - Managed    Specialty Hospitals and Other    Total % of Total Texas 67 $ 382,335 $ 81,305 $ 183,333 $ 196,035 $ 843,008 14.0 % California 30 435,612 18,203 38,025 225,723 717,563 11.9 Oregon 19 261,316 86,860 — — 348,176 5.8 Maryland 8 329,940 — — — 329,940 5.5 New York 10 297,573 — 20,120 — 317,693 5.2 Kentucky 28 230,928 23,669 — 39,687 294,284 4.9 Indiana 18 169,222 88,824 — 11,356 269,402 4.4 Washington 17 188,764 10,686 27,879 — 227,329 3.8 Arizona 8 34,532 10,348 38,508 121,757 205,145 3.4 North Carolina 15 123,462 — 68,854 — 192,316 3.2 Other (31 states & Canada) (2) 201 1,180,448 381,718 631,838 94,221 2,288,225 37.9 Total 421 $ 3,634,132 $ 701,613 $ 1,008,557 $ 688,779 $ 6,033,081 100.0 % % of Total 60.3 % 11.6 % 16.7 % 11.4 % 100.0 % (1) Excludes (i) one real estate property held for sale as of the end of the current period and (ii) our unconsolidated joint venture which consists of 158 facilities and 7,056 units. (2) Investment balance in Canada is based on the exchange rate as of September 30, 2021 of $0.7867 per 1 CAD.


13 SABRA 3Q 2021 SUPPLEMENTAL INFORMATION September 30, 2021 PORTFOLIO Lease Expirations Lease Expirations (1) Dollars in thousands Skilled Nursing/ Transitional Care Senior Housing - Leased Specialty Hospitals and Other Total Annualized RevenuesAs of September 30, 2021   % of Total 2021 $ — $ 501 $ — $ 501 0.1 % 2022 24,724 5,310 — 30,034 7.0 % 2023 9,303 — — 9,303 2.2 % 2024 21,925 2,397 — 24,322 5.6 % 2025 14,875 3,202 1,308 19,385 4.5 % 2026 29,257 1,317 — 30,574 7.1 % 2027 42,126 — 34,191 76,317 17.7 % 2028 15,408 6,850 4,037 26,295 6.1 % 2029 58,840 5,881 5,700 70,421 16.3 % 2030 12,734 — 3,035 15,769 3.6 % Thereafter 95,239 25,801 7,771 128,811 29.8 % Total Annualized Revenues $ 324,431 $ 51,259 $ 56,042 $ 431,732 100.0 % (1) Excludes (i) Senior Housing - Managed communities and (ii) one real estate property held for sale as of the end of the current period. Annualized Revenues are net of repositioning reserves, if applicable.


14 SABRA 3Q 2021 SUPPLEMENTAL INFORMATION September 30, 2021 INVESTMENT ACTIVITY Summary Investment Activity Dollars in thousands Investment Initial Investment Date Property Type Number of Properties Beds/Units 2021 Amounts Invested (1) Rate of Return/ Initial Cash Yield Real Estate The Claiborne at West Lake (2) 03/05/21 Senior Housing - Managed 1 100 $ 26,500 7.60 % Landmark Pensacola (3) 03/15/21 Specialty Hospitals and Other 1 60 2,000 9.00 % Baxter Senior Living (4) 05/01/21 Senior Housing - Managed 1 116 32,500 7.75 % Signature Healthcare of Elizabethtown (5) 05/27/21 Skilled Nursing/ Transitional Care 1 124 2,155 8.50 % Additions to Real Estate (6) Various Multiple N/A N/A 13,175 8.19 % Total Real Estate Investments 76,330 7.83 % Preferred Equity Shelbourne - Chesterfield (7) 06/21/21 Senior Housing 1 150 4,141 10.00 % Dwight Mortgage Trust (8) N/A N/A N/A N/A — 10.00 % Total Preferred Equity Investments 4,141 10.00 % All Investments through September 30, 2021 $ 80,471 7.94 % Subsequent to September 30, 2021: Real Estate Legacy - Jasper 10/01/21 Senior Housing - Leased 1 113 $ 26,250 6.93 % Loans Receivable Recovery Centers of America (9) 10/15/21 Specialty Hospitals and Other 6 928 $ 290,000 7.50 % (1) Excludes capitalized acquisition costs and origination fees. (2) Transaction includes a potential earnout of up to $5.5 million if certain performance metrics are achieved after one year. Yield assumes maximum earnout payment and estimated post-earnout trailing 3-month Cash NOI. (3) Bed count reflects expected capacity at the completion of a $3.2 million construction project currently in progress. (4) Transaction includes a potential earnout if certain performance metrics are achieved after 18 months. Yield assumes estimated earnout payment and estimated post-earnout trailing 3-month Cash NOI. (5) Bed count reflects expected capacity at the completion of a $19.6 million construction project currently in progress. (6) Excludes capital expenditures for the Senior Housing - Managed portfolio and recurring capital expenditures for the Triple-Net portfolio. (7) Unit count reflects expected capacity at the completion of development. Sabra has the option to purchase the development at fair market value upon achievement of specified milestones. (8) Transaction includes a $25.0 million total commitment to invest over time in a fund of bridge-to-HUD loans. Rate of return is shown net of expected fees. (9) Transaction provides Sabra a right of first offer to acquire the underlying facilities and includes an additional $35.0 million commitment to be secured by two additional properties with 232 aggregate beds currently in lease-up which is to be funded after specific performance metrics are achieved by the portfolio and by the two additional properties currently in lease-up


15 SABRA 3Q 2021 SUPPLEMENTAL INFORMATION September 30, 2021 LEGACY LIVING OF JASPER Investment Date Units October 1, 2021 113 Investment Amount Property Type $26.3 million Senior Housing - Leased Investment Type Annualized GAAP Income Real Estate $2.1 million Number of Properties Initial Cash Yield 1 6.93% Location Indiana INVESTMENT ACTIVITY Recent


16 SABRA 3Q 2021 SUPPLEMENTAL INFORMATION September 30, 2021 RECOVERY CENTERS OF AMERICA Investment Date Beds (1) October 15, 2021 1,160 Investment Amount (1) Property Type $325.0 million ($290.0 million funded as of October 15, 2021) Specialty Hospitals and Other Investment Type Annualized GAAP Income (2) Mortgage Loan Receivable $24.4 million Number of Properties (1) Rate of Return 8 7.50% Location (3) Various INVESTMENT ACTIVITY Recent (1) Transaction provides Sabra a right of first offer to acquire the underlying facilities. Number of properties and bed count includes two properties with 232 aggregate beds currently in lease-up. Remaining $35.0 million commitment to be funded after specific performance metrics are achieved by the portfolio and by the two properties currently in lease-up. (2) Represents expected income once the remaining $35.0 million commitment is fully funded. (3) Properties are located in Illinois, Indiana, Maryland (2), Massachusetts (2), New Jersey and Pennsylvania.


17 SABRA 3Q 2021 SUPPLEMENTAL INFORMATION September 30, 2021 CAPITALIZATION Overview Debt Dollars in thousands As of September 30, 2021 Consolidated Debt Secured debt $ 78,060 Revolving credit facility — Term loans 598,337 Senior unsecured notes (1) 1,750,000 Total 2,426,397 Deferred financing costs and premiums/discounts, net (1) (21,769) Total, net $ 2,404,628 Revolving Credit Facility Dollars in thousands As of September 30, 2021 Credit facility availability $ 1,000,000 Credit facility capacity 1,000,000 Enterprise Value Dollars in thousands, except per share amounts As of September 30, 2021 Shares Outstanding   Price   Value Common stock 220,858,092 $ 14.72 $ 3,251,031 Consolidated Debt (1) 2,426,397 Cash and cash equivalents (1) (246,338) Consolidated Enterprise Value $ 5,431,090 Common Stock and Equivalents Weighted Average Common Shares Three Months Ended September 30, 2021 Nine Months Ended September 30, 2021 EPS, FFO and Normalized FFO AFFO and Normalized AFFO EPS FFO and Normalized FFO AFFO and Normalized AFFO Common stock 220,852,338 220,852,338 216,214,041 216,214,041 216,214,041 Common equivalents 13,180 13,180 13,180 13,180 13,180 Basic common and common equivalents 220,865,518 220,865,518 216,227,221 216,227,221 216,227,221 Dilutive securities: Restricted stock units 1,198,205 1,676,344 — 1,128,974 1,650,074 Forward equity sale agreements 187 187 — 29,609 29,609 Diluted common and common equivalents 222,063,910 222,542,049 216,227,221 217,385,804 217,906,904 At-The-Market Common Stock Offering Program Dollars in thousands, except per share amounts Availability as of September 30, 2021 $ 497,339 Forward sales agreements as of September 30, 2021 Shares outstanding 175,611 Weighted average price per share, net of commissions $ 15.00 (1) Assumes the October 7, 2021 redemption of $300.0 million of 4.80% senior unsecured notes due 2024 occurred as of September 30, 2021. Deferred financing costs, net and discount, net have been adjusted to remove $2.3 million and $0.2 million, respectively, associated with the senior unsecured notes due 2024.


18 SABRA 3Q 2021 SUPPLEMENTAL INFORMATION September 30, 2021 CAPITALIZATION Indebtedness Fixed | Variable Rate Debt Dollars in thousands Weighted Average Interest Rate (1)As of September 30, 2021 Principal     % of Total Fixed Rate Debt   Secured debt $ 78,060     3.40 %   3.2 % Unsecured senior notes (2) 1,750,000     4.04 %   72.1 % Total fixed rate debt 1,828,060     4.02 %   75.3 % Variable Rate Debt   Term loans (3) 598,337 2.27 % 24.7 % Consolidated Debt $ 2,426,397     3.58 %   100.0 % Secured | Unsecured Debt Dollars in thousands Weighted Average Interest Rate (1)As of September 30, 2021 Principal     % of Total Secured Debt   Secured debt $ 78,060     3.40 %   3.2 % Unsecured Debt Unsecured senior notes (2) 1,750,000     4.04 %   72.1 % Term loans 598,337 2.27 % 24.7 % Total unsecured debt 2,348,337     3.59 %   96.8 % Consolidated Debt $ 2,426,397     3.58 %   100.0 % (1) Weighted average interest rate includes private mortgage insurance and impact of interest rate derivative agreements. (2) Assumes the October 7, 2021 redemption of $300.0 million of 4.80% senior unsecured notes due 2024 occurred as of September 30, 2021. (3) Term loans include $436.3 million subject to swap agreements that fix LIBOR at a weighted average rate of 1.14%, and $98.3 million (CAD $125.0 million) subject to swap agreements that fix CDOR at 1.10%. Excluding these amounts, variable rate debt was 2.3% of Consolidated Debt as of September 30, 2021.


19 SABRA 3Q 2021 SUPPLEMENTAL INFORMATION September 30, 2021 CAPITALIZATION Debt Maturity Debt Maturity Schedule Dollars in thousands Secured Debt Unsecured Senior Notes (1)   Term Loans     Revolving Credit Facility (2) Consolidated Debt As of September 30, 2021 Principal Rate (3) Principal Rate (3)   Principal Rate (3)     Principal Rate (3) Principal Rate (3) 10/01/21 - 12/31/21 $ 16,280   3.05 %   $ —   —     $ —   —     $ — — $ 16,280   3.05 % 2022 2,412   2.88 %   —   —     —   —     — — 2,412   2.88 % 2023 2,478   2.89 %   —   —     —   —     — 1.18 % 2,478   2.89 % 2024 2,545   2.90 %   —   — 598,337   1.39 %     — — 600,882   1.39 % 2025 2,615   2.91 %   —   — —   —     — — 2,615   2.91 % 2026 2,687   2.92 %   500,000   5.13 %     —   —     — — 502,687   5.11 % 2027 2,761   2.93 %   100,000 5.88 % —   —     — — 102,761   5.80 % 2028 2,837   2.94 %   —   —     —   —     — — 2,837   2.94 % 2029 2,914   2.96 %   350,000   3.90 %     —   —     — — 352,914   3.89 % 2030 2,994   2.98 % — — — — — — 2,994 2.98 % Thereafter 37,537   3.27 %   800,000   3.20 %     —   —     — — 837,537   3.20 % Total 78,060   1,750,000 598,337     — 2,426,397 Discount, net — (2,723) — — (2,723) Deferred financing costs, net (1,092) (13,242) (4,712) — (19,046) Total, net $ 76,968 $ 1,734,035 $ 593,625     $ — $ 2,404,628 Wtd. avg. maturity/years 17.5   8.0 2.9     1.9 7.0 Wtd. avg. interest rate (4) 3.40 %   4.04 % 2.27 %     1.18 % 3.58 % (1) Assumes the October 7, 2021 redemption of $300.0 million of 4.80% senior unsecured notes due 2024 occurred as of September 30, 2021. Deferred financing costs, net and discount, net have been adjusted to remove $2.3 million and $0.2 million, respectively, associated with the senior unsecured notes due 2024. (2) Revolving Credit Facility is subject to two six-month extension options. (3) Represents actual contractual interest rates excluding private mortgage insurance and impact of interest rate derivative agreements. (4) Weighted average interest rate includes private mortgage insurance and impact of interest rate derivative agreements.


20 SABRA 3Q 2021 SUPPLEMENTAL INFORMATION September 30, 2021 Key Credit Metrics (1) December 31, 2020 September 30, 2021 Net Debt to Adjusted EBITDA (2) 4.88x 4.81x Interest Coverage (2) 5.32x 5.32x Fixed Charge Coverage Ratio (2) 5.14x 4.90x Total Debt/Asset Value 35 % 34 % Secured Debt/Asset Value 1 % 1 % Unencumbered Assets/Unsecured Debt 282 % 289 % Cost of Permanent Consolidated Debt (3) 3.65 % 3.58 % Unsecured Notes Ratings S&P (Stable outlook) BBB- Fitch (Stable outlook) BBB- Moody's (Stable outlook) Ba1 CAPITALIZATION Credit Metrics and Ratings (1) Key credit statistics (except Net Debt to Adjusted EBITDA) are calculated in accordance with the credit agreement relating to the revolving credit facility and the indentures relating to our unsecured senior notes. In addition, the key credit statistics as of September 30, 2021 assume the October 7, 2021 redemption of $300.0 million of 4.80% senior unsecured notes due 2024 was completed as of the beginning of the period presented. (2) Based on the trailing twelve month period ended as of the date indicated. (3) Excludes revolving credit facility balance that had an interest rate of 1.18% and 1.24% as of September 30, 2021 and December 31, 2020, respectively. In addition, the cost of permanent debt as of September 30, 2021 assumes the October 7, 2021 redemption of $300.0 million of 4.80% senior unsecured notes due 2024 occurred as of September 30, 2021.


21 SABRA 3Q 2021 SUPPLEMENTAL INFORMATION September 30, 2021 FINANCIAL INFORMATION Condensed Consolidated Financial Statements Condensed Consolidated Statements of Income (Loss) Dollars in thousands, except per share data Three Months Ended September 30, Nine Months Ended September 30,   2021 2020 2021 2020 Revenues: Rental and related revenues (1) $ 85,367 $ 100,612 $ 309,533 $ 319,851 Interest and other income 3,405 3,299 9,377 8,756 Resident fees and services 39,819 39,341 114,978 117,908       Total revenues 128,591 143,252 433,888 446,515     Expenses: Depreciation and amortization 45,046 44,209 133,912 132,579 Interest 24,243 24,904 72,956 75,900 Triple-net portfolio operating expenses 5,075 5,249 15,210 15,481 Senior housing - managed portfolio operating expenses 30,761 27,745 88,607 82,976 General and administrative 8,683 7,216 26,432 24,650 (Recovery of) provision for loan losses and other reserves (26) (90) 1,890 706 Impairment of real estate 495 3,154 495 3,154       Total expenses 114,277 112,387 339,502 335,446     Other income (expense): Loss on extinguishment of debt (913) (139) (1,760) (531) Other income 277 115 386 2,308 Net gain (loss) on sales of real estate 655 2,715 (1,784) 2,828 Total other income (expense) 19 2,691 (3,158) 4,605 Income before (loss) income from unconsolidated joint venture and income tax (expense) benefit 14,333 33,556 91,228 115,674 (Loss) income from unconsolidated joint venture (4,018) 2,766 (178,817) (13,037) Income tax (expense) benefit (92) 138 (1,314) (1,337) Net income (loss) $ 10,223 $ 36,460 $ (88,903) $ 101,300     Net income (loss), per: Basic common share $ 0.05 $ 0.18 $ (0.41) $ 0.49         Diluted common share $ 0.05 $ 0.18 $ (0.41) $ 0.49         Weighted-average number of common shares outstanding, basic 220,865,518 205,791,699 216,227,221 205,592,806   Weighted-average number of common shares outstanding, diluted 222,063,910 206,727,167 216,227,221 206,442,674 (1) See page 22 for additional details regarding Rental and related revenues.


22 SABRA 3Q 2021 SUPPLEMENTAL INFORMATION September 30, 2021 FINANCIAL INFORMATION Condensed Consolidated Financial Statements Condensed Consolidated Statements of Income (Loss) - Supplemental Information Dollars in thousands, except per share data Three Months Ended September 30, Nine Months Ended September 30,   2021 2020 2021 2020 Cash rental income $ 101,496 $ 103,519 $ 305,480 $ 305,478 Straight-line rental income 3,391 4,198 11,114 13,649 Straight-line rental income receivable write-offs (25,213) (10,409) (25,213) (13,750) Above/below market lease amortization 1,081 2,196 3,985 5,823 Above/below market lease intangible write-offs — (3,894) — (7,063) Operating expense recoveries 4,612 5,002 14,167 15,714 Rental and related revenues $ 85,367 $ 100,612 $ 309,533 $ 319,851


23 SABRA 3Q 2021 SUPPLEMENTAL INFORMATION September 30, 2021 FINANCIAL INFORMATION Condensed Consolidated Financial Statements Condensed Consolidated Balance Sheets Dollars in thousands, except per share data September 30, 2021 December 31, 2020   (unaudited)   Assets Real estate investments, net of accumulated depreciation of $805,260 and $681,657 as of September 30, 2021 and December 31, 2020, respectively $ 5,228,677 $ 5,285,038 Loans receivable and other investments, net 105,896 102,839 Investment in unconsolidated joint venture 109,944 288,761 Cash and cash equivalents 546,338 59,076 Restricted cash 5,080 6,447 Lease intangible assets, net 76,430 82,796 Accounts receivable, prepaid expenses and other assets, net 137,181 160,646 Total assets $ 6,209,546 $ 5,985,603 Liabilities Secured debt, net $ 76,968 $ 79,065 Term loans, net 593,625 1,044,916 Senior unsecured notes, net 2,031,494 1,248,393 Accounts payable and accrued liabilities 126,828 146,276 Lease intangible liabilities, net 51,531 57,725 Total liabilities 2,880,446 2,576,375 Equity Preferred stock, $0.01 par value; 10,000,000 shares authorized, zero shares issued and outstanding as of September 30, 2021 and December 31, 2020 — — Common stock, $0.01 par value; 500,000,000 shares authorized, 220,858,092 and 210,560,815 shares issued and outstanding as of September 30, 2021 and December 31, 2020, respectively 2,209 2,106 Additional paid-in capital 4,344,273 4,163,228 Cumulative distributions in excess of net income (1,001,238) (716,195) Accumulated other comprehensive loss (16,144) (39,911) Total equity 3,329,100 3,409,228 Total liabilities and equity $ 6,209,546 $ 5,985,603


24 SABRA 3Q 2021 SUPPLEMENTAL INFORMATION September 30, 2021 FINANCIAL INFORMATION Condensed Consolidated Financial Statements Condensed Consolidated Statements of Cash Flows Dollars in thousands Nine Months Ended September 30, 2021 2020 Cash flows from operating activities: Net (loss) income $ (88,903) $ 101,300 Adjustments to reconcile net (loss) income to net cash provided by operating activities: Depreciation and amortization 133,912 132,579 Non-cash rental and related revenues 10,113 1,340 Non-cash interest income (1,444) (1,743) Non-cash interest expense 5,389 6,527 Stock-based compensation expense 6,987 5,651 Loss on extinguishment of debt 1,760 531 Provision for loan losses and other reserves 1,890 706 Net loss (gain) on sales of real estate 1,784 (2,828) Impairment of real estate 495 3,154 Other-than-temporary impairment of unconsolidated joint venture 164,126 — Loss from unconsolidated joint venture 14,691 13,037 Distributions of earnings from unconsolidated joint venture — 11,318 Changes in operating assets and liabilities: Accounts receivable, prepaid expenses and other assets, net 13,062 (3,523) Accounts payable and accrued liabilities (5,403) (2,594) Net cash provided by operating activities 258,459 265,455 Cash flows from investing activities: Acquisition of real estate (62,116) (92,945) Origination and fundings of loans receivable — (1,651) Origination and fundings of preferred equity investments (4,153) (20,059) Additions to real estate (29,278) (32,416) Repayments of loans receivable 2,432 3,095 Repayments of preferred equity investments 683 3,399 Net proceeds from the sales of real estate 15,066 8,754 Distributions in excess of earnings from unconsolidated joint venture — 1,305 Net cash used in investing activities (77,366) (130,518) Cash flows from financing activities: Net borrowings from revolving credit facility — 56,000 Proceeds from issuance of senior unsecured notes 791,520 — Principal payments on term loans (455,000) — Principal payments on secured debt (2,185) (2,396) Payments of deferred financing costs (7,444) (819) Issuance of common stock, net 172,188 20,961 Dividends paid on common stock (194,311) (215,747) Net cash provided by (used in) financing activities 304,768 (142,001) Net increase (decrease) in cash, cash equivalents and restricted cash 485,861 (7,064) Effect of foreign currency translation on cash, cash equivalents and restricted cash 34 (230) Cash, cash equivalents and restricted cash, beginning of period 65,523 49,143 Cash, cash equivalents and restricted cash, end of period $ 551,418 $ 41,849 Supplemental disclosure of cash flow information: Interest paid $ 66,051 $ 67,995 Supplemental disclosure of non-cash investing activities: Decrease in loans receivable and other investments due to acquisition of real estate $ — $ 20,731 Secured debt assumed by buyer in connection with sale of real estate $ — $ 31,830


25 SABRA 3Q 2021 SUPPLEMENTAL INFORMATION September 30, 2021 FINANCIAL INFORMATION FFO, Normalized FFO, AFFO and Normalized AFFO (1) FFO and AFFO for the nine months ended September 30, 2021 and 2020 include $0.4 million and $2.3 million, respectively, earned during the period related to legacy Care Capital Properties, Inc. investments. In addition, other normalizing items for FFO and AFFO include triple-net operating expenses, net of recoveries. FFO, Normalized FFO, AFFO and Normalized AFFO Dollars in thousands Three Months Ended September 30, Nine Months Ended September 30,   2021 2020 2021 2020 Net income (loss) $ 10,223 $ 36,460 $ (88,903) $ 101,300 Add: Depreciation and amortization of real estate assets 45,046 44,209 133,912 132,579 Depreciation and amortization of real estate assets related to unconsolidated joint venture 4,806 10,391 16,529 21,525 Net (gain) loss on sales of real estate (655) (2,715) 1,784 (2,828) Net loss (gain) on sales of real estate related to unconsolidated joint venture 15 (7,537) 30 3,271 Impairment of real estate 495 3,154 495 3,154 Other-than-temporary impairment of unconsolidated joint venture — — 164,126 — FFO $ 59,930 $ 83,962 $ 227,973 $ 259,001 Write-offs of straight-line rental income receivable and lease intangibles 24,326 14,522 22,054 21,200 Lease termination income — (300) — (300) Loss on extinguishment of debt 913 139 1,760 531 (Recovery of) provision for loan losses and other reserves (26) (90) 1,890 706 Support payment paid to joint venture manager — — 2,450 — Other normalizing items (1) 148 589 852 (1,197) Normalized FFO $ 85,291 $ 98,822 $ 256,979 $ 279,941 FFO $ 59,930 $ 83,962 $ 227,973 $ 259,001 Stock-based compensation expense 2,428 916 6,987 5,651 Non-cash rental and related revenues 20,740 7,907 10,113 1,340 Non-cash interest income (530) (608) (1,444) (1,743) Non-cash interest expense 1,744 2,069 5,389 6,527 Non-cash portion of loss on extinguishment of debt 913 139 1,760 531 (Recovery of) provision for loan losses and other reserves (26) (90) 1,890 706 Other non-cash adjustments related to unconsolidated joint venture (150) 394 (1,364) 1,337 Other non-cash adjustments (213) 115 320 570 AFFO $ 84,836 $ 94,804 $ 251,624 $ 273,920 Cash portion of lease termination income — (300) — (300) Support payment paid to joint venture manager — — 2,450 — Other normalizing items (1) 405 567 963 (1,259) Normalized AFFO $ 85,241 $ 95,071 $ 255,037 $ 272,361 Amounts per diluted common share: Net income (loss) $ 0.05 $ 0.18 $ (0.41) $ 0.49 FFO $ 0.27 $ 0.41 $ 1.05 $ 1.25 Normalized FFO $ 0.38 $ 0.48 $ 1.18 $ 1.36 AFFO $ 0.38 $ 0.46 $ 1.15 $ 1.32 Normalized AFFO $ 0.38 $ 0.46 $ 1.17 $ 1.31 Weighted average number of common shares outstanding, diluted: Net income (loss) 222,063,910 206,727,167 216,227,221 206,442,674 FFO and Normalized FFO 222,063,910 206,727,167 217,385,804 206,442,674 AFFO and Normalized AFFO 222,542,049 207,523,386 217,906,904 207,288,178


26 SABRA 3Q 2021 SUPPLEMENTAL INFORMATION September 30, 2021 FINANCIAL INFORMATION Components of Net Asset Value (NAV) (1) (1) Excludes our unconsolidated joint venture which consists of 158 facilities and 7,056 units and our 49% share of the unconsolidated joint venture's debt which was $375.2 million as of September 30, 2021. (2) Amounts represent principal amounts due and exclude deferred financing costs, net and premiums/discounts, net. (3) Assumes the October 7, 2021 redemption of $300.0 million of 4.80% senior unsecured notes due 2024 occurred as of September 30, 2021. (4) Includes balances that impact cash or NOI and excludes non-cash items. Annualized Cash NOI Dollars in thousands Skilled Nursing/Transitional Care $ 324,431 Senior Housing - Leased 51,258 Senior Housing - Managed 39,304 Specialty Hospitals and Other 56,042 Annualized Cash NOI (excluding loans receivable and other investments) $ 471,035 Obligations Dollars in thousands Secured debt (2) $ 78,060 Unsecured senior notes (2)(3) 1,750,000 Term loans (2) 598,337 Consolidated Debt 2,426,397 Add (less): Cash and cash equivalents and restricted cash (3) (251,418) Accounts payable and accrued liabilities (4) 110,331 Net obligations $ 2,285,310 Other Assets Dollars in thousands Loans receivable and other investments, net $ 105,896 Investment in unconsolidated joint venture 109,944 Accounts receivable, prepaid expenses and other assets, net (4) 47,348 Total other assets $ 263,188 Common Shares Outstanding Total shares 220,858,092 We disclose components of our business relevant to calculate NAV. We consider NAV to be a useful supplemental measure that assists both management and investors to estimate the fair value of our Company. The calculation of NAV involves significant estimates and can be calculated using various methods. Each individual investor must determine the specific methodology, assumptions and estimates to use to arrive at an estimated NAV of the Company. The components of NAV do not consider potential changes in our investment portfolio. The components include non-GAAP financial measures, such as Cash NOI. Although these measures are not presented in accordance with GAAP, investors can use these non-GAAP financial measures as supplemental information to evaluate our business.


27 SABRA 3Q 2021 SUPPLEMENTAL INFORMATION September 30, 2021 APPENDIX Disclaimer Disclaimer This supplement contains “forward-looking” statements as defined in the Private Securities Litigation Reform Act of 1995. These statements may be identified, without limitation, by the use of “expects,” “believes,” “intends,” “should” or comparable terms or the negative thereof. Examples of forward-looking statements include all statements regarding our expected future financial position, results of operations (including our 2021 guidance), cash flows, liquidity, business strategy, growth opportunities, potential investments, and plans and objectives for future operations. Our actual results may differ materially from those projected or contemplated by our forward-looking statements as a result of various factors, including, among others, the following: the ongoing COVID-19 pandemic, including the risk of additional surges of COVID-19 infections due to the rate of public acceptance and efficacy of COVID-19 vaccines or to new and more contagious and/or vaccine resistant variants, and measures intended to prevent its spread, and the related impact on our tenants, operators and Senior Housing - Managed communities; our dependence on the operating success of our tenants; the potential variability of our reported rental and related revenues following the adoption of Accounting Standards Update (“ASU”) 2016-02, Leases, as amended by subsequent ASUs, on January 1, 2019; operational risks with respect to our Senior Housing - Managed communities; the effect of our tenants declaring bankruptcy or becoming insolvent; our ability to find replacement tenants and the impact of unforeseen costs in acquiring new properties; the impact of litigation and rising insurance costs on the business of our tenants; changes in healthcare regulation and political or economic conditions; the impact of required regulatory approvals of transfers of healthcare properties; competitive conditions in our industry; our concentration in the healthcare property sector, particularly in skilled nursing/transitional care facilities and senior housing communities, which makes our profitability more vulnerable to a downturn in a specific sector than if we were investing in multiple industries; the significant amount of and our ability to service our indebtedness; covenants in our debt agreements that may restrict our ability to pay dividends, make investments, incur additional indebtedness and refinance indebtedness on favorable terms; increases in market interest rates; the phasing out of the London Interbank Offered Rate (“LIBOR”) benchmark beginning after 2021; our ability to raise capital through equity and debt financings; risks associated with our investment in the Enlivant Joint Venture; changes in foreign currency exchange rates; the relatively illiquid nature of real estate investments; the loss of key management personnel; uninsured or underinsured losses affecting our properties and the possibility of environmental compliance costs and liabilities; the impact of a failure or security breach of information technology in our operations; our ability to maintain our status as a real estate investment trust (“REIT”) under the federal tax laws; changes in tax laws and regulations affecting REITs (including the potential effects of the Tax Cuts and Jobs Act); compliance with REIT requirements and certain tax and tax regulatory matters related to our status as a REIT; and the ownership limits and takeover defenses in our governing documents and under Maryland law, which may restrict change of control or business combination opportunities.  Additional information concerning risks and uncertainties that could affect our business can be found in our filings with the Securities and Exchange Commission (the “SEC”), including in Part I, Item 1A of our Annual Report on Form 10-K for the year ended December 31, 2020. We do not intend, and we undertake no obligation, to update any forward-looking information to reflect events or circumstances after the date of this supplement or to reflect the occurrence of unanticipated events, unless required by law to do so. Note Regarding Non-GAAP Financial Measures This supplement includes the following financial measures defined as non-GAAP financial measures by the SEC: net operating income (“NOI”), Cash NOI, funds from operations (“FFO”), Normalized FFO, Adjusted FFO (“AFFO”), Normalized AFFO, FFO per diluted common share, Normalized FFO per diluted common share, AFFO per diluted common share, Normalized AFFO per diluted common share and Adjusted EBITDA (defined below). These measures may be different than non-GAAP financial measures used by other companies, and the presentation of these measures is not intended to be considered in isolation or as a substitute for financial information prepared and presented in accordance with U.S. generally accepted accounting principles. An explanation of these non-GAAP financial measures is included under “Reporting Definitions” in this supplement and reconciliations of these non-GAAP financial measures to the GAAP financial measures we consider most comparable are included on the Investors section of our website at http://www.sabrahealth.com/investors/ financials/reports-presentations/non-gaap. Tenant and Borrower Information This supplement includes information regarding certain of our tenants that lease properties from us and our borrowers, most of which are not subject to SEC reporting requirements. The information related to our tenants and borrowers that is provided in this supplement has been provided by, or derived from information provided by, such tenants and borrowers. We have not independently verified this information. We have no reason to believe that such information is inaccurate in any material respect. We are providing this data for informational purposes only. Sabra Information The information in this supplemental information package should be read in conjunction with the Company's Annual Report on Form 10- K, Quarterly Reports on Form 10-Q, Current Reports on Form 8-K and other information filed with the SEC. The Reporting Definitions and Reconciliations of Non-GAAP Measures are an integral part of the information presented herein. On Sabra’s website, www.sabrahealth.com, you can access, free of charge, Sabra's Annual Report on Form 10-K, Quarterly Reports on Form 10-Q, Current Reports on Form 8-K, and amendments to those reports filed or furnished pursuant to Sections 13(a) or 15(d) of the Securities Exchange Act of 1934, as amended, as soon as reasonably practicable after such material is filed with, or furnished to, the SEC. The information contained on Sabra’s website is not incorporated by reference into, and should not be considered a part of, this supplemental information package. All material filed with the SEC can also be accessed through its website, www.sec.gov. For more information, contact Investor Relations at (888) 393-8248 or [email protected].


28 SABRA 3Q 2021 SUPPLEMENTAL INFORMATION September 30, 2021 APPENDIX Reporting Definitions Adjusted EBITDA* Adjusted EBITDA is calculated as earnings before interest, taxes, depreciation and amortization (“EBITDA”) excluding the impact of merger-related costs, stock-based compensation expense under the Company's long-term equity award program, and loan loss reserves. Adjusted EBITDA is an important non-GAAP supplemental measure of operating performance. Annualized Cash Net Operating Income (“Annualized Cash NOI”)* The Company believes that net income as defined by GAAP is the most appropriate earnings measure. The Company considers Annualized Cash NOI an important supplemental measure because it allows investors, analysts and its management to evaluate the operating performance of its investments. The Company defines Annualized Cash NOI as Annualized Revenues less operating expenses, excluding COVID-19 Pandemic Expenses, and non-cash revenues and expenses. Annualized Cash NOI excludes all other financial statement amounts included in net income. Annualized Revenues  The annual contractual rental revenues under leases and interest and other income generated by the Company’s loans receivable and other investments based on amounts invested and applicable terms as of the end of the period presented. Annualized Revenues do not include tenant recoveries, additional rents or Grant Income and are net of repositioning reserves, if applicable. Cash Net Operating Income (“Cash NOI”)*    The Company believes that net income as defined by GAAP is the most appropriate earnings measure. The Company considers Cash NOI an important supplemental measure because it allows investors, analysts and its management to evaluate the operating performance of its investments. The Company defines Cash NOI as total revenues less operating expenses and non-cash revenues and expenses. Cash NOI excludes all other financial statement amounts included in net income. Cash NOI Margin Cash NOI Margin is calculated as Cash NOI divided by resident fees and services. Consolidated Debt  The principal balances of the Company’s revolving credit facility, term loans, senior unsecured notes, and secured indebtedness as reported in the Company’s consolidated financial statements. Consolidated Debt, Net The carrying amount of the Company’s revolving credit facility, term loans, senior unsecured notes, and secured indebtedness, as reported in the Company’s consolidated financial statements. Consolidated Enterprise Value The Company believes Consolidated Enterprise Value is an important measurement as it is a measure of a company’s value. The Company calculates Consolidated Enterprise Value as market equity capitalization plus Consolidated Debt. Market equity capitalization is calculated as (i) the number of shares of common stock multiplied by the closing price of the Company’s common stock on the last day of the period presented plus (ii) the number of shares of preferred stock multiplied by the closing price of the Company’s preferred stock on the last day of the period presented. Consolidated Enterprise Value includes the Company’s market equity capitalization and Consolidated Debt, less cash and cash equivalents. COVID-19 Pandemic Expenses COVID-19 Pandemic Expenses consist primarily of (i) personal protective equipment (“PPE”) costs, (ii) incremental labor costs (including bonuses, hero pay and additional labor needed to implement new health and safety protocols) and (iii) incremental supply costs required to implement new health and safety protocols (e.g., disposable food containers and stronger disinfectants), in each case incurred by communities in our Senior Housing - Managed portfolio specifically as a result of the COVID-19 pandemic. EBITDARM  Earnings before interest, taxes, depreciation, amortization, rent and management fees (“EBITDARM”) for a particular facility accruing to the operator/tenant of the property (not the Company), for the period presented. The Company uses EBITDARM in determining EBITDARM Coverage. EBITDARM has limitations as an analytical tool. EBITDARM does not reflect historical cash expenditures or future cash requirements for facility capital expenditures or contractual commitments. In addition, EBITDARM does not represent a property’s net income or cash flows from operations and should not be considered an alternative to those indicators. The Company utilizes EBITDARM to evaluate the core operations of the properties by eliminating management fees, which may vary by operator/tenant and operating structure, and as a supplemental measure of the ability of the Company’s operators/tenants and relevant guarantors to generate sufficient liquidity to meet related obligations to the Company. EBITDARM Coverage  Represents the ratio of EBITDARM to cash rent for owned facilities (excluding Senior Housing - Managed communities) for the period presented. EBITDARM Coverage is a supplemental measure of a property’s ability to generate cash flows for the operator/tenant (not the Company) to meet the operator’s/tenant’s related cash rent and other obligations to the Company. However, its usefulness is limited by, among other things, the same factors that limit the usefulness of EBITDARM. EBITDARM Coverage includes only Stabilized Facilities and excludes facilities for which data is not available or meaningful.


29 SABRA 3Q 2021 SUPPLEMENTAL INFORMATION September 30, 2021 APPENDIX Reporting Definitions Funds From Operations (“FFO”) and Adjusted Funds from Operations (“AFFO”)*  The Company believes that net income as defined by GAAP is the most appropriate earnings measure. The Company also believes that funds from operations, or FFO, as defined in accordance with the definition used by the National Association of Real Estate Investment Trusts (“Nareit”), and adjusted funds from operations, or AFFO (and related per share amounts) are important non-GAAP supplemental measures of the Company’s operating performance. Because the historical cost accounting convention used for real estate assets requires straight-line depreciation (except on land), such accounting presentation implies that the value of real estate assets diminishes predictably over time. However, since real estate values have historically risen or fallen with market and other conditions, presentations of operating results for a real estate investment trust that uses historical cost accounting for depreciation could be less informative. Thus, Nareit created FFO as a supplemental measure of operating performance for real estate investment trusts that excludes historical cost depreciation and amortization, among other items, from net income, as defined by GAAP. FFO is defined as net income, computed in accordance with GAAP, excluding gains or losses from real estate dispositions and the Company’s share of gains or losses from real estate dispositions related to its unconsolidated joint venture, plus real estate depreciation and amortization, net of amounts related to noncontrolling interests, plus the Company’s share of depreciation and amortization related to its unconsolidated joint venture, and real estate impairment charges of both consolidated and unconsolidated entities when the impairment is directly attributable to decreases in the value of depreciable real estate held by the entity. AFFO is defined as FFO excluding merger and acquisition costs, stock-based compensation expense, non-cash rental and related revenues, non-cash interest income, non-cash interest expense, non-cash portion of loss on extinguishment of debt, provision for loan losses and other reserves, non-cash lease termination income and deferred income taxes, as well as other non-cash revenue and expense items (including ineffectiveness gain/loss on derivative instruments, and non- cash revenue and expense amounts related to noncontrolling interests) and the Company’s share of non-cash adjustments related to its unconsolidated joint venture. The Company believes that the use of FFO and AFFO (and the related per share amounts), combined with the required GAAP presentations, improves the understanding of the Company’s operating results among investors and makes comparisons of operating results among real estate investment trusts more meaningful. The Company considers FFO and AFFO to be useful measures for reviewing comparative operating and financial performance because, by excluding the applicable items listed above, FFO and AFFO can help investors compare the operating performance of the Company between periods or as compared to other companies. While FFO and AFFO are relevant and widely used measures of operating performance of real estate investment trusts, they do not represent cash flows from operations or net income as defined by GAAP and should not be considered an alternative to those measures in evaluating the Company’s liquidity or operating performance. FFO and AFFO also do not consider the costs associated with capital expenditures related to the Company’s real estate assets nor do they purport to be indicative of cash available to fund the Company’s future cash requirements. Further, the Company’s computation of FFO and AFFO may not be comparable to FFO and AFFO reported by other real estate investment trusts that do not define FFO in accordance with the current Nareit definition or that interpret the current Nareit definition or define AFFO differently than the Company does. Grant Income Grant income consists of funds specifically paid to communities in our Senior Housing - Managed portfolio from state or federal governments related to the pandemic and were incremental to the amounts that would have otherwise been received for providing care to residents. Investment Represents the carrying amount of real estate assets after adding back accumulated depreciation and amortization and excludes net intangible assets and liabilities. Market Capitalization Total common shares of Sabra outstanding multiplied by the closing price per common share as of a given period. Net Debt* The principal balances of the Company’s revolving credit facility, term loans, senior unsecured notes, and secured indebtedness as reported in the Company’s consolidated financial statements, net of cash and cash equivalents as reported in the Company’s consolidated financial statements. Net Debt to Adjusted EBITDA* Net Debt to Adjusted EBITDA is calculated as Net Debt divided by Annualized Adjusted EBITDA, which is Adjusted EBITDA, as adjusted for annualizing adjustments that give effect to the acquisitions and dispositions completed during the respective period as though such acquisitions and dispositions were completed as of the beginning of the period presented. Net Operating Income (“NOI”)*   The Company believes that net income as defined by GAAP is the most appropriate earnings measure. The Company considers NOI an important supplemental measure because it allows investors, analysts and its management to evaluate the operating performance of its investments. The Company defines NOI as total revenues less operating expenses. NOI excludes all other financial statement amounts included in net income.


30 SABRA 3Q 2021 SUPPLEMENTAL INFORMATION September 30, 2021 APPENDIX Reporting Definitions Normalized FFO and Normalized AFFO* Normalized FFO and Normalized AFFO represent FFO and AFFO, respectively, adjusted for certain income and expense items that the Company does not believe are indicative of its ongoing operating results. The Company considers Normalized FFO and Normalized AFFO to be useful measures to evaluate the Company’s operating results excluding these income and expense items to help investors compare the operating performance of the Company between periods or as compared to other companies. Normalized FFO and Normalized AFFO do not represent cash flows from operations or net income as defined by GAAP and should not be considered an alternative to those measures in evaluating the Company’s liquidity or operating performance. Normalized FFO and Normalized AFFO also do not consider the costs associated with capital expenditures related to the Company’s real estate assets nor do they purport to be indicative of cash available to fund the Company’s future cash requirements. Further, the Company’s computation of Normalized FFO and Normalized AFFO may not be comparable to Normalized FFO and Normalized AFFO reported by other real estate investment trusts that do not define FFO in accordance with the current Nareit definition or that interpret the current Nareit definition or define FFO and AFFO or Normalized FFO and Normalized AFFO differently than the Company does. Occupancy Percentage Occupancy Percentage represents the facilities’ average operating occupancy for the period indicated. The percentages are calculated by dividing the actual census from the period presented by the available beds/units for the same period. Occupancy includes only Stabilized Facilities and excludes facilities for which data is not available or meaningful. REVPOR REVPOR represents the average revenues generated per occupied unit per month at Senior Housing - Managed communities for the period indicated. It is calculated as resident fees and services revenues, excluding Grant Income, divided by average monthly occupied unit days. REVPOR includes only Stabilized Facilities. Senior Housing  Senior Housing communities include independent living, assisted living, continuing care retirement and memory care communities. Senior Housing - Managed Senior Housing communities operated by third-party property managers pursuant to property management agreements. Skilled Mix  Skilled Mix is defined as the total Medicare and non-Medicaid managed care patient revenue at Skilled Nursing/Transitional Care facilities divided by the total revenues at Skilled Nursing/Transitional Care facilities for the period indicated. Skilled Mix includes only Stabilized Facilities and excludes facilities for which data is not available or meaningful. Skilled Nursing/Transitional Care Skilled Nursing/Transitional Care facilities include skilled nursing, transitional care, multi-license designation and mental health facilities. Specialty Hospitals and Other Includes acute care, long-term acute care, rehabilitation and behavioral hospitals, facilities that provide residential services, which may include assistance with activities of daily living, and other facilities not classified as Skilled Nursing/Transitional Care or Senior Housing. Stabilized Facility At the time of acquisition, the Company classifies each facility as either stabilized or non-stabilized. In addition, the Company may classify a facility as non-stabilized after acquisition. Circumstances that could result in a facility being classified as non-stabilized include newly completed developments, facilities undergoing major renovations or additions, facilities being repositioned or transitioned to new operators, and significant transitions within the tenants’ business model. Such facilities are typically reclassified to stabilized upon the earlier of maintaining consistent occupancy (85% for Skilled Nursing/Transitional Care facilities and 90% for Senior Housing communities) or 24 months after the date of classification as non-stabilized. Stabilized Facilities exclude (i) facilities held for sale, (ii) strategic disposition candidates, (iii) facilities being transitioned to a new operator, (iv) facilities being transitioned from being leased by the Company to being operated by the Company and (v) facilities acquired during the three months preceding the period presented. *Non-GAAP Financial Measures Reconciliations, definitions and important discussions regarding the usefulness and limitations of the Non-GAAP Financial Measures used in this supplement can be found at http://www.sabrahealth.com/investors/financials/reports-presentations/non-gaap.


sabralogo33117a13.jpg


Reconciliations of Non-GAAP Financial Measures

September 30, 2021

(Unaudited)


SABRA HEALTH CARE REIT, INC.
RECONCILIATIONS OF NON-GAAP FINANCIAL MEASURES
FFO, Normalized FFO, AFFO and Normalized AFFO
(dollars in thousands, except per share data)

Three Months Ended September 30,Nine Months Ended September 30,
 2021202020212020
Net income (loss)$10,223 $36,460 $(88,903)$101,300 
Add:
Depreciation and amortization of real estate assets45,046 44,209 133,912 132,579 
Depreciation and amortization of real estate assets related to unconsolidated joint venture4,806 10,391 16,529 21,525 
Net (gain) loss on sales of real estate(655)(2,715)1,784 (2,828)
Net loss (gain) on sales of real estate related to unconsolidated joint venture15 (7,537)30 3,271 
Impairment of real estate495 3,154 495 3,154 
Other-than-temporary impairment of unconsolidated joint venture— — 164,126 — 
FFO$59,930 $83,962 $227,973 $259,001 
Write-offs of straight-line rental income receivable and lease intangibles24,326 14,522 22,054 21,200 
Lease termination income— (300)— (300)
Loss on extinguishment of debt913 139 1,760 531 
(Recovery of) provision for loan losses and other reserves(26)(90)1,890 706 
Support payment paid to joint venture manager— — 2,450 — 
Other normalizing items (1)
148 589 852 (1,197)
Normalized FFO$85,291 $98,822 $256,979 $279,941 
FFO$59,930 $83,962 $227,973 $259,001 
Stock-based compensation expense2,428 916 6,987 5,651 
Non-cash rental and related revenues20,740 7,907 10,113 1,340 
Non-cash interest income(530)(608)(1,444)(1,743)
Non-cash interest expense1,744 2,069 5,389 6,527 
Non-cash portion of loss on extinguishment of debt913 139 1,760 531 
(Recovery of) provision for loan losses and other reserves(26)(90)1,890 706 
Other non-cash adjustments related to unconsolidated joint venture(150)394 (1,364)1,337 
Other non-cash adjustments(213)115 320 570 
AFFO$84,836 $94,804 $251,624 $273,920 
Cash portion of lease termination income— (300)— (300)
Support payment paid to joint venture manager— — 2,450 — 
Other normalizing items (1)
405 567 963 (1,259)
Normalized AFFO$85,241 $95,071 $255,037 $272,361 
Amounts per diluted common share:
Net income (loss)$0.05 $0.18 $(0.41)$0.49 
FFO$0.27 $0.41 $1.05 $1.25 
Normalized FFO$0.38 $0.48 $1.18 $1.36 
AFFO$0.38 $0.46 $1.15 $1.32 
Normalized AFFO$0.38 $0.46 $1.17 $1.31 
Weighted average number of common shares outstanding, diluted:
Net income (loss)222,063,910 206,727,167 216,227,221 206,442,674 
FFO and Normalized FFO 222,063,910 206,727,167 217,385,804 206,442,674 
AFFO and Normalized AFFO 222,542,049 207,523,386 217,906,904 207,288,178 


(1)     FFO and AFFO for the nine months ended September 30, 2021 and 2020 include $0.4 million and $2.3 million, respectively, earned during the period related to legacy Care Capital Properties, Inc. investments. In addition, other normalizing items for FFO and AFFO include triple-net operating expenses, net of recoveries.
sabralogo211.jpg
See reporting definitions.
2


SABRA HEALTH CARE REIT, INC.
RECONCILIATIONS OF NON-GAAP FINANCIAL MEASURES
EBITDA, Adjusted EBITDA and Annualized Adjusted EBITDA
Net Debt and Net Debt to Adjusted EBITDA
(in thousands) 

Trailing Twelve Months EndedYear Ended
September 30, 2021December 31, 2020
Net (loss) income$(51,786)$138,417 
Interest97,480 100,424 
Income tax expense687 710 
Depreciation and amortization178,070 176,737 
EBITDA$224,451 $416,288 
Loss from unconsolidated joint venture18,253 16,599 
Other-than-temporary impairment of unconsolidated joint venture164,126 — 
Distributions from unconsolidated joint venture1,477 12,795 
Stock-based compensation expense 9,243 7,907 
Merger and acquisition costs219 483 
CCP transition costs91 
Provision for loan losses and other reserves and non-cash revenue write-offs28,252 22,668 
Impairment of real estate1,344 4,003 
Loss on extinguishment of debt1,760 531 
Other income766 (2,433)
Lease termination income— (300)
Net gain on sales of real estate1,751 (2,861)
Adjusted EBITDA (1)
$451,644 $475,771 
Annualizing adjustments (2)
1,298 717 
Annualized Adjusted EBITDA (3)
$452,942 $476,488 
September 30, 2021December 31, 2020
Secured debt$78,060 $80,199 
Revolving credit facility— — 
Term loans598,337 1,053,100 
Senior unsecured notes (4)
1,750,000 1,250,000 
Consolidated Debt2,426,397 2,383,299 
Cash and cash equivalents (4)
(246,338)(59,076)
Net Debt$2,180,059 $2,324,223 
September 30, 2021December 31, 2020
Net Debt$2,180,059 $2,324,223 
Annualized Adjusted EBITDA$452,942 $476,488 
Net Debt to Adjusted EBITDA4.81x4.88x
(1)    Adjusted EBITDA is calculated as earnings before interest, taxes, depreciation and amortization (“EBITDA”) excluding the impact of merger-related costs, stock-based compensation expense under the Company’s long-term equity award program and loan loss reserves.
(2)    Annualizing adjustments give effect to the acquisitions and dispositions completed during the twelve months ended for the respective period as though such acquisitions and dispositions were completed as of the beginning of the period.
(3)    Annualized Adjusted EBITDA is calculated as Adjusted EBITDA as adjusted to give effect to the adjustments described in footnote 2 above.
(4)    Assumes the October 7, 2021 redemption of $300.0 million of 4.80% senior unsecured notes due 2024 occurred as of September 30, 2021.
sabralogo211.jpg
See reporting definitions.
3


SABRA HEALTH CARE REIT, INC.
RECONCILIATIONS OF NON-GAAP FINANCIAL MEASURES
Condensed Consolidated Statements of Income
Supplemental Information
(in thousands)

Three Months Ended September 30,Nine Months Ended September 30,
 2021202020212020
Cash rental income$101,496 $103,519 $305,480 $305,478 
Straight-line rental income3,391 4,198 11,114 13,649 
Straight-line rental income receivable write-offs(25,213)(10,409)(25,213)(13,750)
Above/below market lease amortization1,081 2,196 3,985 5,823 
Above/below market lease intangible write-offs— (3,894)— (7,063)
Operating expense recoveries4,612 5,002 14,167 15,714 
Rental and related revenues$85,367 $100,612 $309,533 $319,851 


sabralogo211.jpg
See reporting definitions.
4


SABRA HEALTH CARE REIT, INC.
RECONCILIATIONS OF NON-GAAP FINANCIAL MEASURES
Senior Housing - Managed Revenues
(in thousands)

Three Months Ended
 September 30, 2021June 30, 2021March 31, 2021December 31, 2020September 30, 2020
Revenues: (1)
Resident fees and services$39,819 $38,958 $36,077 $38,349 $39,691 
Resident fees and services not included in same store(2,811)(2,316)(395)— — 
Same store resident fees and services$37,008 $36,642 $35,682 $38,349 $39,691 


(1)    Revenues have been adjusted for changes in the foreign currency exchange rate where applicable.
sabralogo211.jpg
See reporting definitions.
5


SABRA HEALTH CARE REIT, INC.
RECONCILIATIONS OF NON-GAAP FINANCIAL MEASURES
Cash NOI by Facility Type
(in thousands)
Three Months Ended September 30, 2021
Skilled Nursing/ Transitional CareSenior HousingSpecialty Hospitals and Other
Senior Housing - Leased
Senior Housing - Managed (1)
Total Senior HousingInterest and Other IncomeUnconsolidated Joint VentureCorporateTotal
Net income (loss)$26,977 $6,512 $300 $6,812 $9,992 $3,405 $(4,018)$(32,945)$10,223 
Adjustments:
Depreciation and amortization26,634 5,234 8,557 13,791 4,603 — — 18 45,046 
Interest297 404 — 404 — — — 23,542 24,243 
General and administrative— — — — — — — 8,683 8,683 
Recovery of loan losses and other reserves— — — — — — — (26)(26)
Impairment of real estate312 183 — 183 — — — — 495 
Loss on extinguishment of debt— — — — — — — 913 913 
Other income— — — — — — — (277)(277)
Net (gain) loss on sales of real estate— (856)201 (655)— — — — (655)
Loss from unconsolidated JV— — — — — — 4,018 — 4,018 
Income tax expense— — — — — — — 92 92 
Sabra’s share of unconsolidated JV Net Operating Income— — — — — — 3,521 — 3,521 
Net Operating Income$54,220 $11,477 $9,058 $20,535 $14,595 $3,405 $3,521 $— $96,276 
Non-cash revenue and expense adjustments20,420 935 — 935 (590)(530)— — 20,235 
Cash Net Operating Income$74,640 $12,412 $9,058 $21,470 $14,005 $2,875 $3,521 $— $116,511 
Cash Net Operating Income not included in same store(35)— (810)(810)(24)
Same store Cash Net Operating Income$74,605 $12,412 $8,248 $20,660 $13,981 


(1)    Net Operating Income, Cash Net Operating Income and Same store Cash Net Operating Income include $0.8 million of COVID-19 Pandemic Expenses.
sabralogo211.jpg
See reporting definitions.
6


SABRA HEALTH CARE REIT, INC.
RECONCILIATIONS OF NON-GAAP FINANCIAL MEASURES
Cash NOI by Facility Type
(in thousands)
Three Months Ended June 30, 2021
Skilled Nursing/ Transitional CareSenior HousingSpecialty Hospitals and Other
Senior Housing - Leased
Senior Housing - Managed (1)
Total Senior HousingInterest and Other IncomeUnconsolidated Joint VentureCorporateTotal
Net income (loss)$47,612 $7,639 $1,810 $9,449 $10,002 $3,031 $(169,789)$(32,878)$(132,573)
Adjustments:
Depreciation and amortization26,363 5,322 8,407 13,729 4,382 — — 17 44,491 
Interest299 412 — 412 — — — 23,559 24,270 
General and administrative— — — — — — — 8,811 8,811 
Recovery of loan losses and other reserves— — — — — — — (109)(109)
Loss on extinguishment of debt— — — — — — — 54 54 
Other expense— — — — — — — 24 24 
Net loss on sales of real estate3,752 — — — — — — — 3,752 
Loss from unconsolidated JV— — — — — — 169,789 — 169,789 
Income tax expense— — — — — — — 522 522 
Sabra’s share of unconsolidated JV Net Operating Income— — — — — — 2,318 — 2,318 
Net Operating Income$78,026 $13,373 $10,217 $23,590 $14,384 $3,031 $2,318 $— $121,349 
Non-cash revenue and expense adjustments(3,639)(812)— (812)(438)(502)— — (5,391)
Foreign exchange rate adjustment— — (44)(44)— — — — (44)
Cash Net Operating Income$74,387 $12,561 $10,173 $22,734 $13,946 $2,529 $2,318 $— $115,914 
Cash Net Operating Income not included in same store(122)— (855)(855)(35)
Same store Cash Net Operating Income$74,265 $12,561 $9,318 $21,879 $13,911 


(1)    Net Operating Income, Cash Net Operating Income and Same store Cash Net Operating Income include $0.5 million of Grant Income and $0.4 million of COVID-19 Pandemic Expenses.
sabralogo211.jpg
See reporting definitions.
7


SABRA HEALTH CARE REIT, INC.
RECONCILIATIONS OF NON-GAAP FINANCIAL MEASURES
Cash NOI by Facility Type
(in thousands)
Three Months Ended March 31, 2021
Skilled Nursing/ Transitional CareSenior HousingSpecialty Hospitals and Other
Senior Housing - Leased
Senior Housing - Managed (1)
Total Senior HousingInterest and Other IncomeUnconsolidated Joint VentureCorporateTotal
Net income (loss)$54,883 $7,683 $(584)$7,099 $9,606 $2,941 $(5,010)$(36,072)$33,447 
Adjustments:
Depreciation and amortization26,618 5,318 7,680 12,998 4,741 — — 18 44,375 
Interest302 410 — 410 — — — 23,731 24,443 
General and administrative— — — — — — — 8,938 8,938 
Provision for loan losses and other reserves— — — — — — — 2,025 2,025 
Loss on extinguishment of debt— — — — — — — 793 793 
Other income— — — — — — — (133)(133)
Net gain on sales of real estate(1,313)— — — — — — — (1,313)
Loss from unconsolidated JV— — — — — — 5,010 — 5,010 
Income tax expense— — — — — — — 700 700 
Sabra’s share of unconsolidated JV Net Operating Income— — — — — — 3,055 — 3,055 
Net Operating Income$80,490 $13,411 $7,096 $20,507 $14,347 $2,941 $3,055 $— $121,340 
Non-cash revenue and expense adjustments(4,295)(870)— (870)(521)(412)— — (6,098)
Foreign exchange rate adjustment— — — — — — 
Cash Net Operating Income$76,195 $12,541 $7,105 $19,646 $13,826 $2,529 $3,055 $— $115,251 
Cash Net Operating Income not included in same store(158)
Same store Cash Net Operating Income$6,947 


(1)    Net Operating Income, Cash Net Operating Income and Same store Cash Net Operating Income include $0.9 million of COVID-19 Pandemic Expenses.
sabralogo211.jpg
See reporting definitions.
8


SABRA HEALTH CARE REIT, INC.
RECONCILIATIONS OF NON-GAAP FINANCIAL MEASURES
Cash NOI by Facility Type
(in thousands)
Three Months Ended December 31, 2020
Skilled Nursing/ Transitional CareSenior HousingSpecialty Hospitals and Other
Senior Housing - Leased
Senior Housing - Managed (1)
Total Senior HousingInterest and Other IncomeUnconsolidated Joint VentureCorporateTotal
Net income (loss)$52,347 $6,267 $2,292 $8,559 $9,199 $3,184 $(3,562)$(32,610)$37,117 
Adjustments:
Depreciation and amortization26,408 5,345 7,858 13,203 4,529 — — 18 44,158 
Interest304 409 — 409 — — — 23,811 24,524 
General and administrative— — — — — — — 8,105 8,105 
Provision for loan losses and other reserves— — — — — — — 1,149 1,149 
Impairment of real estate— 849 — 849 — — — — 849 
Other expense— — — — — — — 154 154 
Net gain on sales of real estate(33)— — — — — — — (33)
Loss from unconsolidated JV— — — — — — 3,562 — 3,562 
Income tax benefit— — — — — — — (627)(627)
Sabra’s share of unconsolidated JV Net Operating Income— — — — — — 5,054 — 5,054 
Net Operating Income$79,026 $12,870 $10,150 $23,020 $13,728 $3,184 $5,054 $— $124,012 
Non-cash revenue and expense adjustments(4,455)(904)— (904)(411)(607)— — (6,377)
Foreign exchange rate adjustment— — 51 51 — — — — 51 
Cash Net Operating Income$74,571 $11,966 $10,201 $22,167 $13,317 $2,577 $5,054 $— $117,686 
Cash Net Operating Income not included in same store— 
Same store Cash Net Operating Income$10,201 


(1)    Net Operating Income, Cash Net Operating Income and Same store Cash Net Operating Income include $0.6 million of Grant Income and $1.0 million of COVID-19 Pandemic Expenses.
sabralogo211.jpg
See reporting definitions.
9


SABRA HEALTH CARE REIT, INC.
RECONCILIATIONS OF NON-GAAP FINANCIAL MEASURES
Cash NOI by Facility Type
(in thousands)
Three Months Ended September 30, 2020
Skilled Nursing/ Transitional CareSenior HousingSpecialty Hospitals and Other
Senior Housing - Leased
Senior Housing - Managed (1)
Total Senior HousingInterest and Other IncomeUnconsolidated Joint VentureCorporateTotal
Net income (loss)$44,845 $2,777 $3,708 $6,485 $10,179 $3,299 $2,766 $(31,114)$36,460 
Adjustments:
Depreciation and amortization26,452 5,328 7,888 13,216 4,524 — — 17 44,209 
Interest399 420 — 420 — — — 24,085 24,904 
General and administrative— — — — — — — 7,216 7,216 
Recovery of loan losses and other reserves— — — — — — — (90)(90)
Impairment of real estate551 2,603 — 2,603 — — — — 3,154 
Loss on extinguishment of debt— — — — — — — 139 139 
Other income— — — — — — — (115)(115)
Net gain on sales of real estate(2,715)— — — — — — — (2,715)
Income from unconsolidated JV— — — — — — (2,766)— (2,766)
Income tax benefit— — — — — — — (138)(138)
Sabra’s share of unconsolidated JV Net Operating Income— — — — — — 9,034 — 9,034 
Net Operating Income$69,532 $11,128 $11,596 $22,724 $14,703 $3,299 $9,034 $— $119,292 
Non-cash revenue and expense adjustments8,515 847 — 847 (1,426)(608)— — 7,328 
Foreign exchange rate adjustment— — 75 75 — — — — 75 
Cash Net Operating Income$78,047 $11,975 $11,671 $23,646 $13,277 $2,691 $9,034 $— $126,695 
Cash Net Operating Income not included in same store— 
Same store Cash Net Operating Income$11,671 


(1)    Net Operating Income, Cash Net Operating Income and Same store Cash Net Operating Income include $1.2 million of Grant Income and $1.2 million of COVID-19 Pandemic Expenses.
sabralogo211.jpg
See reporting definitions.
10


SABRA HEALTH CARE REIT, INC.
RECONCILIATIONS OF NON-GAAP FINANCIAL MEASURES
Cash NOI by Facility Type
(in thousands)
Nine Months Ended September 30, 2021
Skilled Nursing/ Transitional CareSenior HousingSpecialty Hospitals and Other
Senior Housing - Leased
Senior Housing - Managed (1)
Total Senior HousingInterest and Other IncomeUnconsolidated Joint VentureCorporateTotal
Net income (loss)$129,472 $21,834 $1,526 $23,360 $29,600 $9,377 $(178,817)$(101,895)$(88,903)
Adjustments:
Depreciation and amortization79,615 15,874 24,644 40,518 13,726 — — 53 133,912 
Interest898 1,226 — 1,226 — — — 70,832 72,956 
General and administrative— — — — — — — 26,432 26,432 
Provision for loan losses and other reserves— — — — — — — 1,890 1,890 
Impairment of real estate312 183 — 183 — — — — 495 
Loss on extinguishment of debt— — — — — — — 1,760 1,760 
Other income— — — — — — — (386)(386)
Net loss (gain) on sales of real estate2,439 (856)201 (655)— — — — 1,784 
Loss from unconsolidated JV— — — — — — 178,817 — 178,817 
Income tax expense— — — — — — — 1,314 1,314 
Sabra’s share of unconsolidated JV Net Operating Income— — — — — — 8,894 — 8,894 
Net Operating Income$212,736 $38,261 $26,371 $64,632 $43,326 $9,377 $8,894 $— $338,965 
Non-cash revenue and expense adjustments12,486 (747)— (747)(1,549)(1,444)— — 8,746 
Cash Net Operating Income$225,222 $37,514 $26,371 $63,885 $41,777 $7,933 $8,894 $— $347,711 
Annualizing adjustments (2)
99,209 13,744 12,933 26,677 14,265 2,536 (8,894)— 133,793 
Annualized Cash Net Operating Income$324,431 $51,258 $39,304 $90,562 $56,042 $10,469 $— $— $481,504 


(1)    Net Operating Income and Cash Net Operating Income include $0.5 million of Grant Income and $2.0 million of COVID-19 Pandemic Expenses.
(2)    Represents the annual effect of acquisitions, dispositions, lease modifications and scheduled rent increases completed during the period and mathematical adjustments needed to make Cash Net Operating Income for the period representative of Cash Net Operating Income for a full year. Annualizing adjustments also include the removal of COVID-19 Pandemic Expenses, Grant Income, triple-net operating expenses (net of recoveries) and the Enlivant Joint Venture Cash NOI.
sabralogo211.jpg
See reporting definitions.
11


SABRA HEALTH CARE REIT, INC.
RECONCILIATIONS OF NON-GAAP FINANCIAL MEASURES
Annualized Cash NOI by Payor Type
(in thousands)
Nine Months Ended September 30, 2021
Private Payors (1)
Non-Private PayorsInterest and
Other Income
Unconsolidated Joint VentureCorporateTotal
Net income (loss)$61,462 $120,970 $9,377 $(178,817)$(101,895)$(88,903)
Adjustments:
Depreciation and amortization61,717 72,142 — — 53 133,912 
Interest1,310 814 — — 70,832 72,956 
General and administrative— — — — 26,432 26,432 
Provision for loan losses and other reserves— — — — 1,890 1,890 
Impairment of real estate266 229 — — — 495 
Loss on extinguishment of debt— — — — 1,760 1,760 
Other income— — — — (386)(386)
Net loss on sales of real estate1,012 772 — — — 1,784 
Loss from unconsolidated JV— — — 178,817 — 178,817 
Income tax expense— — — — 1,314 1,314 
Sabra’s share of unconsolidated JV Net Operating Income— — — 8,894 — 8,894 
Net Operating Income$125,767 $194,927 $9,377 $8,894 $— $338,965 
Non-cash revenue and expense adjustments(915)11,105 (1,444)— — 8,746 
Cash Net Operating Income$124,852 $206,032 $7,933 $8,894 $— $347,711 
Annualizing adjustments (2)
50,115 90,036 2,536 (8,894)— 133,793 
Annualized Cash Net Operating Income$174,967 $296,068 $10,469 $— $— $481,504 


(1)    Net Operating Income and Cash Net Operating Income include $0.5 million of Grant Income and $2.0 million of COVID-19 Pandemic Expenses.
(2)    Represents the annual effect of acquisitions, dispositions, lease modifications and scheduled rent increases completed during the period and mathematical adjustments needed to make Cash Net Operating Income for the period representative of Cash Net Operating Income for a full year. Annualizing adjustments also include the removal of COVID-19 Pandemic Expenses, Grant Income, triple-net operating expenses (net of recoveries) and the Enlivant Joint Venture Cash NOI.
sabralogo211.jpg
See reporting definitions.
12


SABRA HEALTH CARE REIT, INC.
RECONCILIATIONS OF NON-GAAP FINANCIAL MEASURES
Annualized Cash NOI by Relationship
(in thousands)
Nine Months Ended September 30, 2021
Avamere Family of CompaniesNorth American HealthcareSignature HealthcareCadia HealthcareSignature BehavioralGenesis Healthcare, Inc.Holiday AL Holdings LPHealthmark GroupThe McGuire GroupCommuniCare
All Other Relationships (1)
CorporateTotal
Net income (loss)$109 $22,078 $17,664 $5,926 $17,979 $14,665 $703 $7,827 $10,362 $8,194 $(92,515)$(101,895)$(88,903)
Adjustments:
Depreciation and amortization9,293 8,410 10,710 8,027 7,625 886 14,599 3,594 5,345 3,389 61,981 53 133,912 
Interest— — — — — 1,016 — — — — 1,108 70,832 72,956 
General and administrative— — — — — — — — — — — 26,432 26,432 
Provision for loan losses and other reserves— — — — — — — — — — — 1,890 1,890 
Impairment of real estate— — — — — — — — — — 495 — 495 
Loss on extinguishment of debt— — — — — — — — — — — 1,760 1,760 
Other income— — — — — — — — — — — (386)(386)
Net loss on sales of real estate— — — — — — — 1,594 — — 190 — 1,784 
Loss from unconsolidated JV— — — — — — — — — — 178,817 — 178,817 
Income tax expense— — — — — — — — — — — 1,314 1,314 
Sabra’s share of unconsolidated JV Net Operating Income— — — — — — — — — — 8,894 — 8,894 
Net Operating Income$9,402 $30,488 $28,374 $13,953 $25,604 $16,567 $15,302 $13,015 $15,707 $11,583 $158,970 $— $338,965 
Non-cash revenue and expense adjustments23,588 (1,865)476 (178)— — (3,645)220 (9,859)— 8,746 
Cash Net Operating Income$32,990 $28,623 $28,379 $14,429 $25,426 $16,567 $15,302 $13,019 $12,062 $11,803 $149,111 $— $347,711 
Annualizing adjustments (2)
11,661 9,540 9,602 22,312 8,765 5,522 5,737 4,680 4,056 4,127 47,791 — 133,793 
Annualized Cash Net Operating Income$44,651 $38,163 $37,981 $36,741 $34,191 $22,089 $21,039 $17,699 $16,118 $15,930 $196,902 $— $481,504 


(1)    Net Operating Income and Cash Net Operating Income include $0.5 million of Grant Income and $2.0 million of COVID-19 Pandemic Expenses.
(2)    Represents the annual effect of acquisitions, dispositions, lease modifications and scheduled rent increases completed during the period and mathematical adjustments needed to make Cash Net Operating Income for the period representative of Cash Net Operating Income for a full year. Annualizing adjustments also include the removal of COVID-19 Pandemic Expenses, Grant Income, triple-net operating expenses (net of recoveries) and the Enlivant Joint Venture Cash NOI.
sabralogo211.jpg
See reporting definitions.
13


SABRA HEALTH CARE REIT, INC.
REPORTING DEFINITIONS
Adjusted EBITDA. Adjusted EBITDA is calculated as earnings before interest, taxes, depreciation and amortization (“EBITDA”) excluding the impact of merger-related costs, stock-based compensation expense under the Company's long-term equity award program, and loan loss reserves. Adjusted EBITDA is an important non-GAAP supplemental measure of operating performance.
Annualized Cash Net Operating Income (“Annualized Cash NOI”). The Company believes that net income as defined by GAAP is the most appropriate earnings measure. The Company considers Annualized Cash NOI an important supplemental measure because it allows investors, analysts and its management to evaluate the operating performance of its investments. The Company defines Annualized Cash NOI as Annualized Revenues less operating expenses, excluding COVID-19 Pandemic Expenses, and non-cash revenues and expenses. Annualized Cash NOI excludes all other financial statement amounts included in net income.
Annualized Revenues. The annual contractual rental revenues under leases and interest and other income generated by the Company’s loans receivable and other investments based on amounts invested and applicable terms as of the end of the period presented. Annualized Revenues do not include tenant recoveries, additional rents or Grant Income and are net of repositioning reserves, if applicable.
Cash Net Operating Income (“Cash NOI”). The Company believes that net income as defined by GAAP is the most appropriate earnings measure. The Company considers Cash NOI an important supplemental measure because it allows investors, analysts and its management to evaluate the operating performance of its investments. The Company defines Cash NOI as total revenues less operating expenses and non-cash revenues and expenses. Cash NOI excludes all other financial statement amounts included in net income.
COVID-19 Pandemic Expenses. COVID-19 Pandemic Expenses consist primarily of (i) personal protective equipment (“PPE”) costs, (ii) incremental labor costs (including bonuses, hero pay and additional labor needed to implement new health and safety protocols) and (iii) incremental supply costs required to implement new health and safety protocols (e.g., disposable food containers and stronger disinfectants), in each case incurred by communities in our Senior Housing - Managed portfolio specifically as a result of the COVID-19 pandemic.
Funds From Operations (“FFO”) and Adjusted Funds from Operations (“AFFO”). The Company believes that net income as defined by GAAP is the most appropriate earnings measure. The Company also believes that funds from operations, or FFO, as defined in accordance with the definition used by the National Association of Real Estate Investment Trusts (“Nareit”), and adjusted funds from operations, or AFFO (and related per share amounts) are important non-GAAP supplemental measures of the Company’s operating performance. Because the historical cost accounting convention used for real estate assets requires straight-line depreciation (except on land), such accounting presentation implies that the value of real estate assets diminishes predictably over time. However, since real estate values have historically risen or fallen with market and other conditions, presentations of operating results for a real estate investment trust that uses historical cost accounting for depreciation could be less informative. Thus, Nareit created FFO as a supplemental measure of operating performance for real estate investment trusts that excludes historical cost depreciation and amortization, among other items, from net income, as defined by GAAP. FFO is defined as net income, computed in accordance with GAAP, excluding gains or losses from real estate dispositions and the Company’s share of gains or losses from real estate dispositions related to its unconsolidated joint venture, plus real estate depreciation and amortization, net of amounts related to noncontrolling interests, plus the Company’s share of depreciation and amortization related to its unconsolidated joint venture, and real estate impairment charges of both consolidated and unconsolidated entities when the impairment is directly attributable to decreases in the value of depreciable real estate held by the entity. AFFO is defined as FFO excluding merger and acquisition costs, stock-based compensation expense, non-cash rental and related revenues, non-cash interest income, non-cash interest expense, non-cash portion of loss on extinguishment of debt, provision for loan losses and other reserves, non-cash lease termination income and deferred income taxes, as well as other non-cash revenue and expense items (including ineffectiveness gain/loss on derivative instruments, and non-cash revenue and expense amounts related to noncontrolling interests) and the Company’s share of non-cash adjustments related to its unconsolidated joint venture. The Company believes that the use of FFO and AFFO (and the related per share amounts), combined with the required GAAP presentations, improves the understanding of the Company’s operating results among investors and makes comparisons of operating results among real estate investment trusts more meaningful. The Company considers FFO and AFFO to be useful measures for reviewing comparative operating and financial performance because, by excluding the applicable items listed above, FFO and AFFO can help investors compare the operating performance of the Company between periods or as compared to other companies. While FFO and AFFO are relevant and widely used measures of operating performance of real estate investment trusts, they do not represent cash flows from operations or net income as defined by GAAP and should not be considered an alternative to those measures in evaluating the Company’s liquidity or operating performance. FFO and AFFO also do not consider the costs associated with capital expenditures related to the Company’s real estate assets nor do they purport to be indicative of cash available to fund the Company’s future cash requirements. Further, the Company’s computation of FFO and AFFO may not be comparable to FFO and AFFO reported by other real estate investment trusts that do not define FFO in accordance with the current Nareit definition or that interpret the current Nareit definition or define AFFO differently than the Company does.
Grant Income. Grant Income consists of funds specifically paid to communities in our Senior Housing - Managed portfolio from state or federal governments related to the pandemic and were incremental to the amounts that would have otherwise been received for providing care to residents.
Net Debt. The principal balances of the Company’s revolving credit facility, term loans, senior unsecured notes, and secured indebtedness as reported in the Company’s consolidated financial statements, net of cash and cash equivalents as reported in the Company’s consolidated financial statements.
Net Debt to Adjusted EBITDA. Net Debt to Adjusted EBITDA is calculated as Net Debt divided by Annualized Adjusted EBITDA, which is Adjusted EBITDA, as adjusted for annualizing adjustments that give effect to the acquisitions and dispositions completed during the respective period as though such acquisitions and dispositions were completed as of the beginning of the period presented.
Net Operating Income (“NOI”). The Company believes that net income as defined by GAAP is the most appropriate earnings measure. The Company considers NOI an important supplemental measure because it allows investors, analysts and its management to evaluate the operating performance of its investments. The Company defines NOI as total revenues less operating expenses. NOI excludes all other financial statement amounts included in net income.
sabralogo33117a13.jpg
14

SABRA HEALTH CARE REIT, INC.
REPORTING DEFINITIONS
Normalized FFO and Normalized AFFO. Normalized FFO and Normalized AFFO represent FFO and AFFO, respectively, adjusted for certain income and expense items that the Company does not believe are indicative of its ongoing operating results. The Company considers Normalized FFO and Normalized AFFO to be useful measures to evaluate the Company’s operating results excluding these income and expense items to help investors compare the operating performance of the Company between periods or as compared to other companies. Normalized FFO and Normalized AFFO do not represent cash flows from operations or net income as defined by GAAP and should not be considered an alternative to those measures in evaluating the Company’s liquidity or operating performance. Normalized FFO and Normalized AFFO also do not consider the costs associated with capital expenditures related to the Company’s real estate assets nor do they purport to be indicative of cash available to fund the Company’s future cash requirements. Further, the Company’s computation of Normalized FFO and Normalized AFFO may not be comparable to Normalized FFO and Normalized AFFO reported by other real estate investment trusts that do not define FFO in accordance with the current Nareit definition or that interpret the current Nareit definition or define FFO and AFFO or Normalized FFO and Normalized AFFO differently than the Company does.
Senior Housing. Senior Housing communities include independent living, assisted living, continuing care retirement and memory care communities.
Senior Housing - Managed. Senior Housing communities operated by third-party property managers pursuant to property management agreements.
Skilled Nursing/Transitional Care. Skilled Nursing/Transitional Care facilities include skilled nursing, transitional care, multi-license designation and mental health facilities.
Specialty Hospitals and Other. Includes acute care, long-term acute care, rehabilitation and behavioral hospitals, facilities that provide residential services, which may include assistance with activities of daily living, and other facilities not classified as Skilled Nursing/Transitional Care or Senior Housing.
sabralogo33117a13.jpg
15