0000827052false0000092103false2021-04-278-Kfalsefalsefalsefalse0000827052eix:SoutherncaliforniaedisoncompanyMember2021-04-272021-04-2700008270522021-04-272021-04-27

UNITED STATES

SECURITIES AND EXCHANGE COMMISSION

Washington, D.C. 20549

FORM 8-K

CURRENT REPORT

Pursuant to Section 13 or 15(d) of the Securities Exchange Act of 1934

Date of Report (Date of earliest event reported): April 27, 2021

Commission
File Number


Exact Name of Registrant
as specified in its charter


State or Other Jurisdiction of
Incorporation or Organization


IRS Employer
Identification Number

1-9936

EDISON INTERNATIONAL

California

95-4137452

1-2313

SOUTHERN CALIFORNIA EDISON COMPANY

California

95-1240335

Graphic

Graphic

2244 Walnut Grove Avenue

2244 Walnut Grove Avenue

(P.O. Box 976)

(P.O. Box 800)

Rosemead,

California

91770

Rosemead,

California

91770

(Address of principal executive offices)

(Address of principal executive offices)

(626) 302-2222

(626) 302-1212

(Registrant's telephone number, including area code)

(Registrant's telephone number, including area code)

Check the appropriate box below if the Form 8-K filing is intended to simultaneously satisfy the filing obligation of the registrant under any of the following provisions:

[ ] Written communications pursuant to Rule 425 under the Securities Act (17 CFR 230.425)

[ ] Soliciting material pursuant to Rule 14a-12 under the Exchange Act (17 CFR 240.14a-12)

[ ] Pre-commencement communications pursuant to Rule 14d-2(b) under the Exchange Act (17 CFR 240.14d-2(b))

[ ] Pre-commencement communications pursuant to Rule 13e-4(c) under the Exchange Act (17 CFR 240.13e-4(c))

Securities registered pursuant to Section 12(b) of the Act:

Edison International:

Title of each class

Trading Symbol(s)

Name of each exchange on which registered

Common Stock, no par value

EIX

NYSE

LLC

Southern California Edison Company: None

Indicate by check mark whether the registrant is an emerging growth company as defined in Rule 405 of the Securities Act of 1933 (§230.405 of this chapter) or Rule 12b-2 of the Securities Exchange Act of 1934 (§240.12b-2 of this chapter).

Emerging growth company

Edison International

Emerging growth company

Southern California Edison Company

If an emerging growth company, indicate by check mark if the registrant has elected not to use the extended transition period for complying with any new or revised financial accounting standards provided pursuant to Section 13(a) of the Exchange Act.

Edison International

Southern California Edison Company

This current report and its exhibits include forward-looking statements. Edison International and Southern California Edison Company ("SCE") based these forward-looking statements on their current expectations and projections about future events in light of their knowledge of facts as of the date of this current report and their assumptions about future circumstances. These forward-looking statements are subject to various risks and uncertainties that may be outside the control of Edison International and SCE. Edison International and SCE have no obligation to publicly update or revise any forward-looking statements, whether due to new information, future events, or otherwise. This current report should be read with Edison International's and SCE's combined Annual Report on Form 10-K for the year ended December 31, 2020 and subsequent Quarterly Report on Form 10-Q. Additionally, Edison International and SCE provide direct links to EIX and SCE presentations, documents and other information at www.edisoninvestor.com (Presentations) in order to publicly disseminate such information.

Item  2.02Results of Operations and Financial Condition

On April 27, 2021, Edison International issued a press release reporting its financial results and the financial results for its subsidiary, Southern California Edison Company, for the quarter ended March 31, 2021. A copy of the press release is attached as Exhibit 99.1. On the same day, members of Edison International's management will speak to investors via a financial teleconference. Senior management's prepared remarks and accompanying presentation are attached as Exhibit 99.2 and Exhibit 99.3 to this report. The information furnished in this Item 2.02 and Exhibits 99.1, 99.2, and 99.3 shall not be deemed to be “filed” for purposes of the Securities Exchange Act of 1934, nor shall it be deemed to be incorporated by reference in any filing under the Securities Act of 1933.

Item  7.01Regulation FD Disclosure

Members of Edison International management will use the information in the presentation furnished as Exhibit 99.3 to this report in meetings with institutional investors and analysts and at investor conferences. The attached presentation will also be posted on www.edisoninvestor.com.

Item  9.01Financial Statements and Exhibits

(d)

Exhibits

EXHIBIT INDEX


Exhibit No.


Description

99.1

Edison International Press Release dated April 27, 2021

99.2

Edison International Q1 2021 Financial Results Conference Call Prepared Remarks dated April 27, 2021

99.3

Edison International Q1 2021 Financial Results Conference Call Presentation dated April 27, 2021

104

Cover Page Interactive Data File (embedded within the Inline XBRL document)

SIGNATURES

Pursuant to the requirements of the Securities Exchange Act of 1934, the registrants have duly caused this report to be signed on its behalf by the undersigned hereunto duly authorized.

EDISON INTERNATIONAL

(Registrant)

/s/ Aaron D. Moss

Aaron D. Moss

Vice President and Controller

Date: April 27, 2021
SOUTHERN CALIFORNIA EDISON COMPANY

(Registrant)

/s/ Aaron D. Moss

Aaron D. Moss

Vice President and Controller

Date: April 27, 2021

Exhibit 99.1

Graphic

NEWS

FOR IMMEDIATE RELEASE

Investor Relations: Sam Ramraj, (626) 302-2540

Media Contact: Jeff Monford, (626) 476-8120

Edison International Reports First Quarter 2021 Results

First Quarter 2021 GAAP EPS of $0.68; Core EPS of $0.79
SCE continues to upgrade its infrastructure and invest in new technologies to prevent wildfires

ROSEMEAD, Calif., April 27, 2021 — Edison International (NYSE: EIX) today reported first quarter 2021 net income of $259 million, or $0.68 per share, compared to net income of $183 million, or $0.50 per share, in the first quarter 2020. As adjusted, first quarter 2021 core earnings were $301 million, or $0.79 per share, compared to core earnings of $228 million, or $0.63 per share, in the first quarter 2020.

Southern California Edison's (SCE) first quarter 2021 core earnings per share (EPS) increased year-over-year primarily due to lower expenses related to wildfire mitigation activities and employee benefits. Wildfire mitigation expenses were lower in the first quarter primarily because fewer remediations were identified through the inspection process. These were partially offset by the increase in shares outstanding mainly associated with the equity offering in May 2020.

Edison International Parent and Other's first quarter 2021 loss per share of $0.10 was unchanged compared to first quarter 2020.

“SCE continues to invest in its infrastructure and new technologies to reduce the risk of fires associated with electric infrastructure, increase accuracy in fire weather forecasting, enhance its operational practices, and improve its Public Safety Power Shutoff program,” said Pedro J. Pizarro, president and CEO of Edison International. “The utility is accelerating the pace of covered conductor deployment and by year-end expects to have hardened over 25% of all its overhead distribution infrastructure in high fire risk areas and substantially reduced the risk of wildfires associated with utility equipment.”

Pizarro added, “Looking ahead, a successful transition to a clean energy economy will place greater demands on electrical infrastructure and require significant incremental investments. As highlighted in SCE’s Pathway 2045 analysis, the least expensive way to achieve economywide decarbonization is through an equitable clean energy future with increasing amounts of carbon-free generation powering the further electrification of the economy.”

Edison International uses core earnings, which is a non-GAAP financial measure that adjusts for significant discrete items that management does not consider representative of ongoing earnings. Edison International management believes that core earnings provide more meaningful comparisons of performance from period to period. Please see the attached tables for a reconciliation of core earnings to basic GAAP earnings.


Edison International Reports First Quarter 2021 Financial Results

Page 2 of 9

2021 Earnings Guidance

Edison International will provide 2021 earnings guidance after a final decision has been adopted by the CPUC on the Southern California Edison 2021 GRC, consistent with the company's prior practice.

First Quarter 2021 Earnings Conference Call and Webcast Details

When:

Tuesday, April 27, 2021, 1:30 p.m. (Pacific Time)

Telephone Numbers:

1-888-673-9780 (US) and 1-312-470-0178 (Int'l) - Passcode: Edison

Telephone Replay:

1-800-944-9092 (US) and 1-203-369-3943 (Int’l) - Passcode: 3495

Telephone replay available through May 11, 2021

Webcast:

www.edisoninvestor.com

Edison International has posted its earnings conference call prepared remarks by the CEO and CFO, the teleconference presentation, and Form 10-Q to the company's investor relations website. These materials are available at www.edisoninvestor.com.

About Edison International

Edison International (NYSE: EIX) is one of the nation’s largest electric utility holding companies, providing clean and reliable energy and energy services through its independent companies. Headquartered in Rosemead, California, Edison International is the parent company of Southern California Edison Company, a utility that delivers electricity to 15 million people across Southern, Central and Coastal California. Edison International is also the parent company of Edison Energy, a global energy advisory company delivering comprehensive, data-driven energy solutions to commercial and industrial users to meet their cost, sustainability and risk goals.


Edison International Reports First Quarter 2021 Financial Results

Page 3 of 9

Appendix

Use of Non-GAAP Financial Measures

Edison International’s earnings are prepared in accordance with generally accepted accounting principles used in the United States and represent the company’s earnings as reported to the Securities and Exchange Commission. Our management uses core earnings and core earnings per share (EPS) internally for financial planning and for analysis of performance of Edison International and Southern California Edison. We also use core earnings and core EPS when communicating with analysts and investors regarding our earnings results to facilitate comparisons of the Company’s performance from period to period. Financial measures referred to as net income, basic EPS, core earnings, or core EPS also apply to the description of earnings or earnings per share.

Core earnings and core EPS are non-GAAP financial measures and may not be comparable to those of other companies. Core earnings and core EPS are defined as basic earnings and basic EPS excluding income or loss from discontinued operations and income or loss from significant discrete items that management does not consider representative of ongoing earnings. Basic earnings and losses refer to net income or losses attributable to Edison International shareholders. Core earnings are reconciled to basic earnings in the attached tables. The impact of participating securities (vested awards that earn dividend equivalents that may participate in undistributed earnings with common stock) for the principal operating subsidiary is not material to the principal operating subsidiary’s EPS and is therefore reflected in the results of the Edison International holding company, which is included in Edison International Parent and Other.

Safe Harbor Statement

Statements contained in this presentation about future performance, including, without limitation, operating results, capital expenditures, rate base growth, dividend policy, financial outlook, and other statements that are not purely historical, are forward-looking statements. These forward-looking statements reflect our current expectations; however, such statements involve risks and uncertainties. Actual results could differ materially from current expectations. These forward-looking statements represent our expectations only as of the date of this presentation, and Edison International assumes no duty to update them to reflect new information, events or circumstances. Important factors that could cause different results include, but are not limited to the:

ability of SCE to recover its costs through regulated rates, including uninsured wildfire-related and debris flow-related costs, costs incurred to mitigate the risk of utility equipment causing future wildfires, costs incurred to implement SCE's new customer service system and costs incurred as a result of the COVID-19 pandemic;
ability of SCE to implement its Wildfire Mitigation Plan;
risks of regulatory or legislative restrictions that would limit SCE’s ability to implement Public Safety Power Shutoff (“PSPS”) when conditions warrant or would otherwise limit SCE’s operational PSPS practices;
risks associated with implementing PSPS, including regulatory fines and penalties, claims for damages and reputational harm;
ability of SCE to maintain a valid safety certification;
ability to obtain sufficient insurance at a reasonable cost, including insurance relating to SCE's nuclear facilities and wildfire-related claims, and to recover the costs of such insurance or, in the event liabilities exceed insured amounts, the ability to recover uninsured losses from customers or other parties;
extreme weather-related incidents (including events caused, or exacerbated, by climate change, such as wildfires, debris flows, high wind events and extreme heat events) and other natural disasters (such as earthquakes), which could cause, among other things, public safety issues, property damage, operational issues (such as rotating outages and issues due to damaged infrastructure), PSPS activations and unanticipated costs;
risks associated with California Assembly Bill 1054 (“AB 1054”) effectively mitigating the significant risk faced by California investor-owned utilities related to liability for damages arising from catastrophic wildfires where utility facilities are alleged to be a substantial cause, including the longevity of the Wildfire Insurance Fund and


Edison International Reports First Quarter 2021 Financial Results

Page 4 of 9

the CPUC's interpretation of and actions under AB 1054, including its interpretation of the new prudency standard established under AB 1054;
decisions and other actions by the California Public Utilities Commission, the Federal Energy Regulatory Commission, the Nuclear Regulatory Commission and other governmental authorities, including decisions and actions related to nationwide or statewide crisis, determinations of authorized rates of return or return on equity, the recoverability of wildfire-related and debris-flow-related costs, issuance of SCE's wildfire safety certification, wildfire mitigation efforts, and delays in executive, regulatory and legislative actions;
ability of Edison International or SCE to borrow funds and access bank and capital markets on reasonable terms;
risks associated with the decommissioning of San Onofre, including those related to worker and public safety, public opposition, permitting, governmental approvals, on-site storage of spent nuclear fuel, delays, contractual disputes, and cost overruns;
pandemics, such as COVID-19, and other events that cause regional, statewide, national or global disruption, which could impact, among other things, Edison International's and SCE's business, operations, cash flows, liquidity and/or financial results and cause Edison International and SCE to incur unanticipated costs;
physical security of Edison International's and SCE's critical assets and personnel and the cybersecurity of Edison International's and SCE's critical information technology systems for grid control, and business, employee and customer data;
risks associated with cost allocation resulting in higher rates for utility bundled service customers because of possible customer bypass or departure for other electricity providers such as Community Choice Aggregators (“CCA,” which are cities, counties, and certain other public agencies with the authority to generate and/or purchase electricity for their local residents and businesses) and Electric Service Providers (entities that offer electric power and ancillary services to retail customers, other than electrical corporations (like SCE) and CCAs);
risks inherent in SCE's transmission and distribution infrastructure investment program, including those related to project site identification, public opposition, environmental mitigation, construction, permitting, power curtailment costs (payments due under power contracts in the event there is insufficient transmission to enable acceptance of power delivery), changes in the California Independent System Operator’s transmission plans, and governmental approvals; and
risks associated with the operation of transmission and distribution assets and power generating facilities, including worker and public safety issues, the risk of utility assets causing or contributing to wildfires, failure, availability, efficiency, and output of equipment and facilities, and availability and cost of spare parts.

Additional information about risks and uncertainties, including more detail about the factors described in this report, is contained throughout this report and in the 2020 Form 10-K, including the "Risk Factors" section. Readers are urged to read this entire report, including information incorporated by reference, as well as the 2020 Form 10-K, and carefully consider the risks, uncertainties, and other factors that affect Edison International's and SCE's businesses. Edison International and SCE post or provide direct links (i) to certain SCE and other parties' regulatory filings and documents with the CPUC and the FERC and certain agency rulings and notices in open proceedings in a section titled "SCE Regulatory Highlights," (ii) to certain documents and information related to Southern California wildfires which may be of interest to investors in a section titled "Southern California Wildfires," and (iii) to presentations, documents and other information that may be of interest to investors in a section title "Presentations" at www.edisoninvestor.com in order to publicly disseminate such information.

These forward-looking statements represent our expectations only as of the date of this news release, and Edison International assumes no duty to update them to reflect new information, events or circumstances. Readers should review future reports filed by Edison International and SCE with the SEC.


Edison International Reports First Quarter 2021 Financial Results

Page 5 of 9

First Quarter Reconciliation of Basic Earnings Per Share to Core Earnings Per Share

Three months ended

March 31, 


2021


2020


Change

Earnings (loss) per share attributable to Edison International


Continuing operations


SCE

$

0.78

$

0.60

$

0.18

Edison International Parent and Other


(0.10)


(0.10)


Edison International


0.68


0.50


0.18

Less: Non-core items


SCE


(0.11)


(0.12)


0.01

Edison International Parent and Other


(0.01)


0.01

Total non-core items


(0.11)


(0.13)


0.02

Core earnings (losses)


SCE


0.89


0.72


0.17

Edison International Parent and Other


(0.10)


(0.09)


(0.01)

Edison International

$

0.79

$

0.63

$

0.16

Note: Diluted earnings were $0.68 and $0.50 per share for the three months ended March 31, 2021 and 2020, respectively.

First Quarter Reconciliation of Basic Earnings Per Share to Core Earnings (in millions)

Three months ended

March 31, 

(in millions)


2021


2020


Change

Net income (loss) attributable to Edison International


Continuing operations


SCE

$

296

$

219

$

77

Edison International Parent and Other


(37)


(36)


(1)

Edison International


259


183


76

Less: Non-core items


SCE1,2,3


(42)


(42)


Edison International Parent and Other3


(3)


3

Total non-core items


(42)


(45)


3

Core earnings (losses)


SCE


338


261


77

Edison International Parent and Other


(37)


(33)


(4)

Edison International

$

301

$

228

$

73

1

Includes charges of $53 million ($38 million after-tax) and $84 million ($60 million after-tax) for the quarter-ended March 31, 2021 and 2020, respectively, from the amortization of SCE's contributions to the Wildfire Insurance Fund.

2

Includes a charge of $5 million ($4 million after-tax) for the quarter-ended March 31, 2021 for SCE's 2017/2018 Wildfire/Mudslide Events expenses.

3

Includes income tax benefit of $18 million and income tax expense of $3 million recorded in the first quarter of 2020 for SCE and Edison International Parent and Other, respectively, due to re-measurement of uncertain tax positions related to the 2010 – 2012 California state tax filings currently under audit.


Edison International Reports First Quarter 2021 Financial Results

Page 6 of 9

Consolidated Statements of Income

Edison International

Three months ended

March 31, 

(in millions, except per-share amounts, unaudited)


2021


2020

Total operating revenue

$

2,960

$

2,790

Purchased power and fuel


1,013


928

Operation and maintenance


844


881

Wildfire Insurance Fund expense


53


84

Depreciation and amortization


525


484

Property and other taxes


126


111

Total operating expenses


2,561


2,488

Operating income


399


302

Interest expense


(217)


(225)

Other income


72


52

Income before income taxes


254


129

Income tax benefit


(36)


(84)

Net income


290


213

Preferred and preference stock dividend requirements of SCE


27


30

Preferred stock dividend requirement of Edison International


4


Net income attributable to Edison International common shareholders

$

259

$

183

Basic earnings per share:


Weighted average shares of common stock outstanding


379


363

Basic earnings per common share attributable to Edison International common shareholders

$

0.68

$

0.50

Diluted earnings per share:


Weighted average shares of common stock outstanding, including effect of dilutive securities


380


364

Diluted earnings per common share attributable to Edison International common shareholders

$

0.68

$

0.50


Edison International Reports First Quarter 2021 Financial Results

Page 7 of 9

Consolidated Balance Sheets

Edison International

March 31, 

December 31, 

(in millions, unaudited)

2021

2020

ASSETS


Cash and cash equivalents

$

389

$

87

Receivables, less allowances of $226 and $188 for uncollectible accounts at respective dates


1,093


1,130

Accrued unbilled revenue


673


521

Insurance receivable


603


708

Income tax receivables


68

Inventory


416


405

Prepaid expenses


163


281

Regulatory assets


1,578


1,314

Wildfire Insurance Fund contributions


204


323

Other current assets


209


224

Total current assets


5,328


5,061

Nuclear decommissioning trusts


4,763


4,833

Other investments


59


53

Total investments


4,822


4,886

Utility property, plant and equipment, less accumulated depreciation and amortization of $10,827 and $10,681 at respective dates


48,097


47,653

Nonutility property, plant and equipment, less accumulated depreciation of $96 and $94 at respective dates


187


186

Total property, plant and equipment


48,284


47,839

Regulatory assets (includes $331 at 2021 related to Variable Interest Entities "VIEs")


7,543


7,120

Wildfire Insurance Fund contributions


2,512


2,443

Operating lease right-of-use assets


1,071


1,088

Long-term insurance receivable

75

75

Other long-term assets


870


860

Total long-term assets


12,071


11,586

Total assets

$

70,505

$

69,372


Edison International Reports First Quarter 2021 Financial Results

Page 8 of 9

Consolidated Balance Sheets

Edison International


March 31, 


December 31, 

(in millions, except share amounts, unaudited)

2021

2020

LIABILITIES AND EQUITY


Short-term debt

$

2,520

$

2,398

Current portion of long-term debt


909


1,029

Accounts payable


1,602


1,980

Wildfire-related claims


1,812


2,231

Customer deposits


225


243

Regulatory liabilities


524


569

Current portion of operating lease liabilities


215


215

Other current liabilities


1,690


1,612

Total current liabilities


9,497


10,277

Long-term debt (Includes $327 at 2021 related to VIEs)


20,165


19,632

Deferred income taxes and credits


5,474


5,368

Pensions and benefits


554


563

Asset retirement obligations


2,902


2,930

Regulatory liabilities


8,881


8,589

Operating lease liabilities


856


873

Wildfire-related claims


2,082


2,281

Other deferred credits and other long-term liabilities


2,871


2,910

Total deferred credits and other liabilities


23,620


23,514

Total liabilities


53,282


53,423

Commitments and contingencies


Preferred stock (50,000,000 shares authorized; 1,250,000 shares issued and outstanding at March 31, 2021)

1,237

Common stock, no par value (800,000,000 shares authorized; 379,433,168 and 378,907,147 shares issued and outstanding at respective dates)


5,989


5,962

Accumulated other comprehensive loss


(67)


(69)

Retained earnings


8,163


8,155

Total Edison International's shareholders' equity


15,322


14,048

Noncontrolling interests – preference stock of SCE


1,901


1,901

Total equity


17,223


15,949

Total liabilities and equity

$

70,505

$

69,372


Edison International Reports First Quarter 2021 Financial Results

Page 9 of 9

Consolidated Statements of Cash Flows

Edison International

Three months ended March 31, 

(in millions, unaudited)


2021


2020

Cash flows from operating activities:


Net income

$

290

$

213

Adjustments to reconcile to net cash provided by operating activities:


Depreciation and amortization


542


501

Allowance for equity during construction


(35)


(21)

Deferred income taxes


(37)


(58)

Wildfire Insurance Fund amortization expense


53


84

Other


11


23

Nuclear decommissioning trusts


(52)


14

Changes in operating assets and liabilities:


Receivables


15


(30)

Inventory


(12)


1

Accounts payable


(151)


(129)

Tax receivables and payables


178


31

Other current assets and liabilities


(168)


41

Regulatory assets and liabilities, net


(70)


(372)

Wildfire-related insurance receivable


105


58

Wildfire-related claims


(618)


Other noncurrent assets and liabilities


21


(41)

Net cash provided by operating activities


72


315

Cash flows from financing activities:


Long-term debt issued, plus premium and net of discount and issuance costs of $(15) and $19 for the respective periods


1,223


1,719

Long-term debt repaid


(490)


(40)

Short-term debt borrowed


305


1,275

Short-term debt repaid


(327)


Common stock issued


15


74

Preferred stock issued, net


1,237


Commercial paper repayment, net of borrowing


(180)


(550)

Dividends and distribution to noncontrolling interests


(32)


(36)

Dividends paid


(247)


(226)

Other


7


15

Net cash provided by financing activities


1,511


2,231

Cash flows from investing activities:


Capital expenditures


(1,358)


(1,268)

Proceeds from sale of nuclear decommissioning trust investments


1,270


1,407

Purchases of nuclear decommissioning trust investments


(1,218)


(1,421)

Other


24


4

Net cash used in investing activities


(1,282)


(1,278)

Net increase in cash, cash equivalents and restricted cash


301


1,268

Cash, cash equivalents and restricted cash at beginning of period


89


70

Cash, cash equivalents and restricted cash at end of period

$

390

$

1,338


Exhibit 99.2

Prepared Remarks of Edison International CEO and CFO

First Quarter 2021 Earnings Teleconference

April 27, 2021, 1:30 p.m. (PT)

Pedro Pizarro, President and Chief Executive Officer, Edison International

Today, Edison International reported core earnings per share of $0.79 compared to $0.63 a year ago. However, this year-over-year comparison is not particularly meaningful because SCE has not received a decision in its 2021 General Rate Case. SCE recognized revenue from CPUC activities for both the first quarter 2020 and 2021 largely based on 2020 authorized base revenue requirements. Maria will discuss our financial performance in her remarks.

Investors have been asking about how we view Edison’s risk profile given news reports that California is headed into another peak wildfire season with above-average risk. As I have shared before, 2019 and 2020 were also above-average-risk years, with 2020 setting records for acres burned. However, and this is a really important “however,” the state has successfully avoided the scale of catastrophic damage seen in 2017 and 2018. I would like to highlight three key factors that have significantly improved our risk profile: state investments to improve firefighting, CPUC progress on AB 1054 implementation, and SCE’s own wildfire mitigation work.

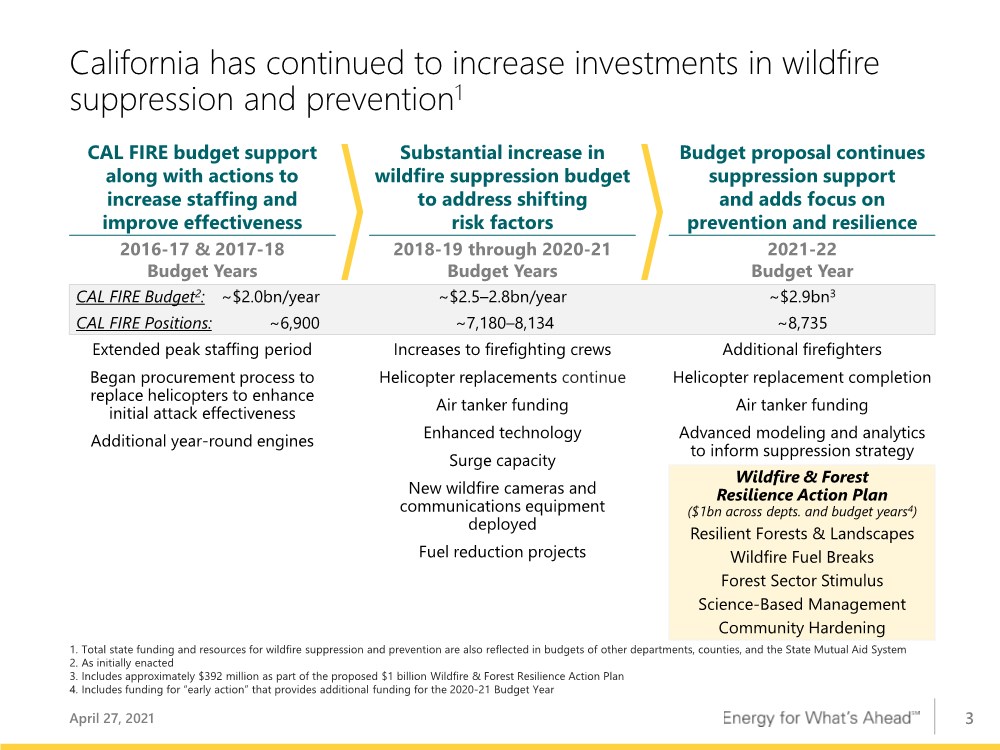
First, the state has increased investments in firefighting capabilities over the last several years. Incorporating the Governor’s 2021–2022 proposed budget, which continues this trend, this would represent a 45% increase in CAL FIRE’s budget since 2016, a 30% increase in firefighters at the peak of the season since 2019, and significant increases in equipment and modeling to enhance the state’s wildfire suppression capabilities. For example, the state is expected to have seven large air tankers operating this fire season and another five in 2022. These enhanced suppression resources will help the state move more quickly to combat wildfires before they become catastrophic. The proposed budget also adds a focus on wildfire prevention, and the Governor and the Legislature have already taken early action. Earlier this month, they approved $536 million to accelerate land and forest management projects laid out


in the Wildfire and Forest Resilience Action Plan, and an additional $80 million for roughly 1,400 new CAL FIRE firefighters for the 2021 fire season. We have also seen significant staff and resource additions in our local fire departments to aid response times and firefighting capacity.

The second risk improvement factor is that the CPUC has made steady and timely progress over the past nearly two years enacting AB 1054’s provisions as designed. For instance, shortly after the Legislature passed AB 1054, the CPUC opened a proceeding on an emergency basis to establish the non-bypassable charge that funds about half of the Wildfire Insurance Fund. Another indicator is that the Commission has approved each of SCE’s annual safety certifications in a timely manner. This certification is a key step in implementing the prudency standard that AB 1054 codified, where a utility’s conduct is deemed reasonable if it has a valid safety certification, unless serious doubt is created. This standard will go beyond the life of the Wildfire Insurance Fund. The Commission established its Wildfire Safety Division, providing additional wildfire safety oversight and direction. Lastly, the CPUC has completed numerous wildfire-related decisions on a timely pace despite the COVID-19 pandemic. The Commission has also been proactive in engaging with the IOUs on Public Safety Power Shutoff, or PSPS, execution, at the same time acknowledging that it is within the utilities’ discretion to use this crucial tool to protect the public’s safety. Taken together, these are all signs that AB 1054’s intent is being implemented steadily as designed.

The third risk improvement factor is SCE’s own work to reduce wildfire risk. Fire mitigation has been an integral part of SCE’s operational practices for years and the utility has had several programs in place to manage and reduce wildfire risk. As climate change intensified wildfire risk, the utility stepped up its comprehensive wildfire mitigation strategy and has made substantial progress, particularly through its WMP. In 2021, SCE continues to invest in its infrastructure and new technologies to mitigate the risk of fires from electric infrastructure, increase accuracy in fire weather forecasting, enhance its operational practices, and improve its PSPS program. SCE has assembled a dedicated PSPS Readiness team to address the feedback from customers, public safety partners, elected officials, and regulatory agencies. The utility is

2


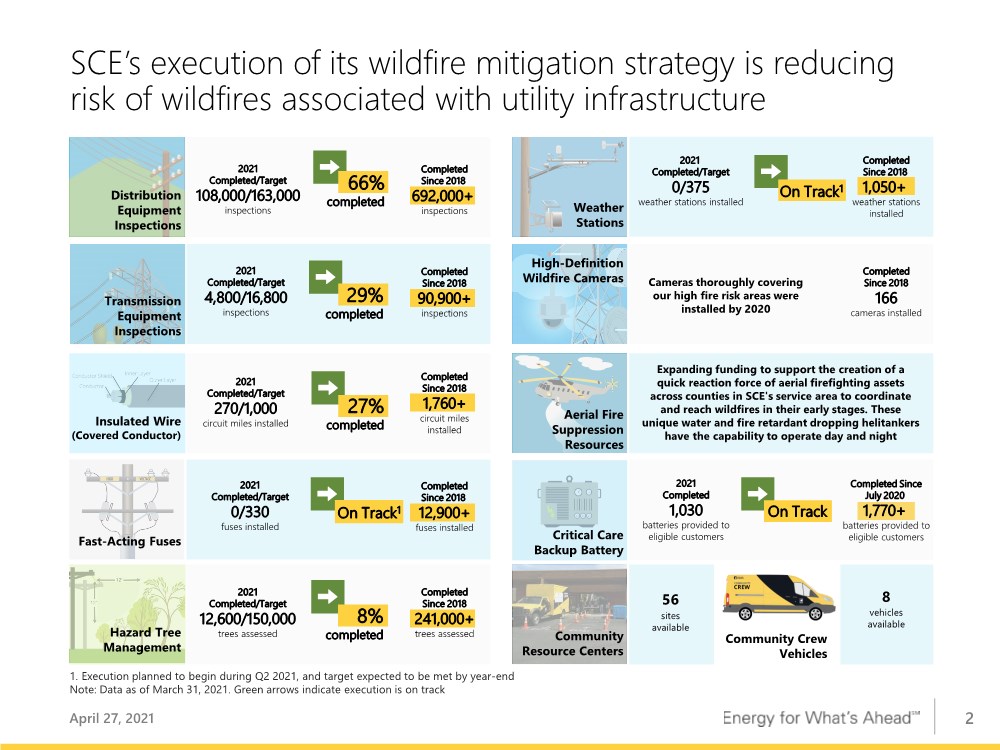
accelerating the pace of covered conductor deployment and expects to install at least 1,000 additional circuit miles by year-end. At this pace, SCE will have hardened over 2,500 miles—or over 25%—of all its overhead distribution infrastructure in high fire risk areas, substantially reducing the risk of wildfires associated with utility equipment.

This combination of investment and actions by the State of California, the CPUC, and SCE gives us increasing confidence in Edison International’s improved risk profile with respect to wildfires. Slides 2 and 3 in our deck provide additional information on SCE’s year-to-date wildfire mitigation activities and the State’s actions over the last few years. This work is also a building block for longer term reliability and resiliency, which will be essential as electrification increases dramatically across the economy for decarbonization.

Speaking of decarbonization, we agree with the goals of President Biden’s $2.25 trillion infrastructure proposal: to address climate change, create well-paying jobs, improve air quality—particularly in our most vulnerable communities—and increase our global competitiveness. That future requires substantial deployment of EVs, electrification of buildings, and new investments in electric infrastructure to ensure clean, reliable, and resilient electric service for this greater demand.

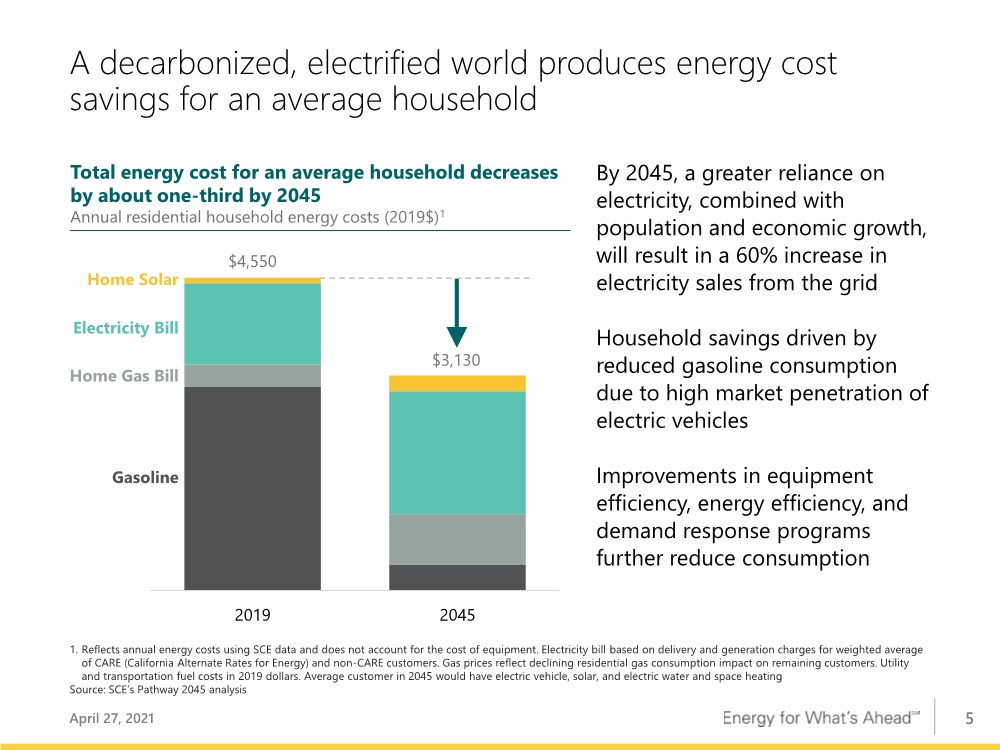
We look forward to working with the Administration and leaders in Congress to develop and implement the complementary policies that will effectively meet the Nationally Determined Contribution, or NDC, target of 50–52% greenhouse gas reductions across the economy. This is in close alignment with what SCE outlined in its Pathway 2045 white paper, and Edison had already stated its support for this economywide target prior to the NDC’s release. As highlighted in Pathway 2045, the least expensive way to achieve economywide decarbonization is through an equitable clean energy future with increasing amounts of carbon-free generation powering the further electrification of the economy. The average customer will also benefit from a decline in total energy costs of one third thanks to the greater efficiency of

3


electric technologies. Slides 4, 5, and 6 in our earnings deck provide you with additional information on our views in these areas.

SCE has a long track record in maintaining affordability, but in the near-term customers will see increases in their bills as SCE invests in grid hardening and makes the investments needed to support clean energy goals and the long-term affordability they will yield. For over a decade, SCE has proactively pursued cost reduction efforts, as well as improvements in areas like reliability, through its operational excellence efforts. We expect to do more. Embedding more digital tools deep in our operations—areas like inspections and vegetation management—will enable efficiencies in how we work and better harness data to improve asset management and performance, and reduce risk. Building a more robust capability in lean process management will help us drive these efficiencies and create a stronger basis to use automation and other technology to streamline our operations. Fundamentally, delivering value to our customers starts with being an excellent operator, through the safe delivery of reliable and affordable electricity.

Let me close my comments by acknowledging yesterday’s news that our colleague and friend Carla Peterman, SCE’s SVP of Strategy & Regulatory Affairs, will be leaving us on May 7 for a new role as PG&E’s Executive VP of Corporate Affairs. We are very sad to lose her after a great year-and-a-half together, but wish her well as she takes on the important and very challenging task of helping Patti Poppe and her new leadership team turn around PG&E’s operations and relationships with their stakeholders and communities. California needs all of its utilities to be healthy and strong, so I am glad our state will continue to benefit from Carla’s talent.

Maria Rigatti, Executive Vice President and Chief Financial Officer, Edison International

My comments today will cover first quarter 2021 results, our capital expenditure and rate base forecasts, key regulatory filings, and updates on other financial topics.

4


Edison International reported core earnings of $0.79 per share for the first quarter 2021, an increase of 16 cents per share from the same period last year. As Pedro noted earlier, this year-over-year comparison is not particularly meaningful because SCE has not received a decision in its 2021 General Rate Case.

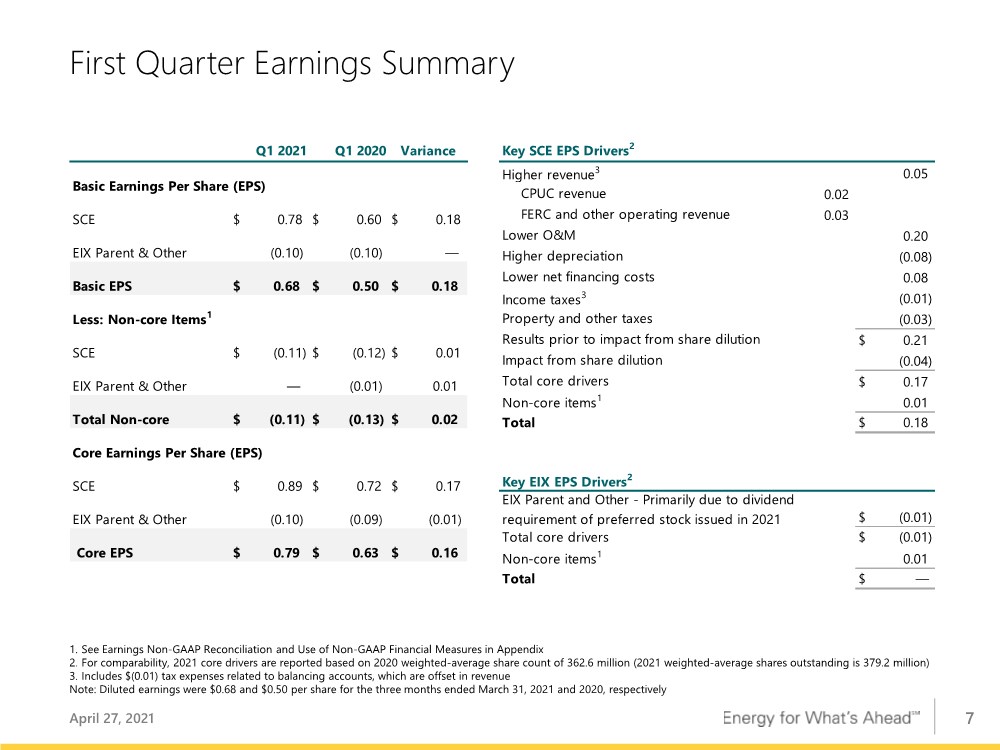
On page 7, you can see SCE’s key first quarter EPS drivers on the right-hand side. I would like to highlight a handful of items that accounted for much of the variance.

To begin, revenue was higher by 5 cents per share. FERC-related revenue contributed 3 cents to this variance, primarily due to higher rate base. CPUC-related revenue contributed 2 cents to this variance, however this was offset by balancing account expenses with no effect on earnings.

O&M had a positive variance of 20 cents, largely due to lower wildfire mitigation-related O&M and lower employee benefits expenses. Wildfire mitigation expenses were lower in the first quarter primarily because fewer remediations were identified through the inspection process. There was also a negative variance of 8 cents from an increase in depreciation due to a higher asset base.

Lower net financing costs had a positive variance of 8 cents due to several items, including lower interest rates on balancing accounts and lower preferred dividends due to the redemption of preferred stock at SCE last year.

Finally, SCE’s EPS in the quarter was 4 cents lower because of dilution from the increase in shares outstanding primarily associated with the equity offering in May 2020.

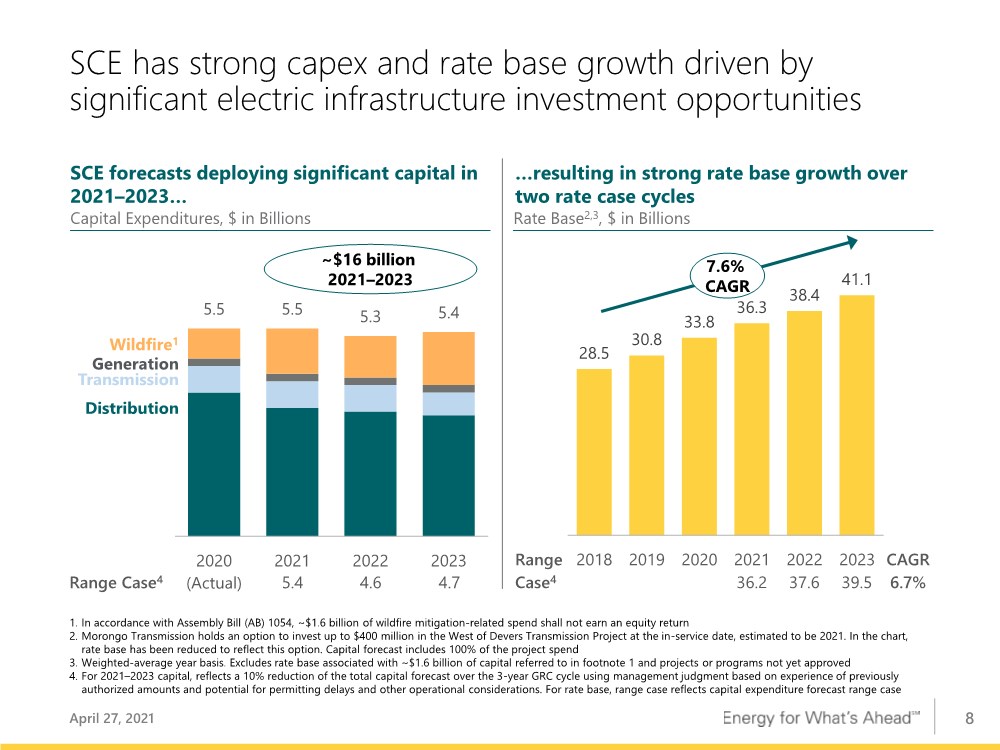
I would now like to comment on SCE’s capital expenditure and rate base growth forecasts, which are shown on Page 8. Our capital and rate base forecasts are unchanged from the last quarter pending a final decision in SCE’s 2021 GRC track 1. SCE is executing against a capital plan that targets key programs while maintaining flexibility in later years to adapt to what is ultimately authorized in the GRC decision. The rate base forecast does not include

5


certain projects and programs that are not yet approved. This includes the Customer Service Re-Platform project, or CSRP, which went operational earlier this month. SCE expects to file an application for cost recovery for CSRP later this year and, if approved, this could add approximately $500 million to rate base by 2023. It also does not reflect capital spending on fire restoration related to wildfires affecting SCE’s facilities and equipment in late 2020. SCE is evaluating the costs to determine how much may be incremental to the current rate base forecast.

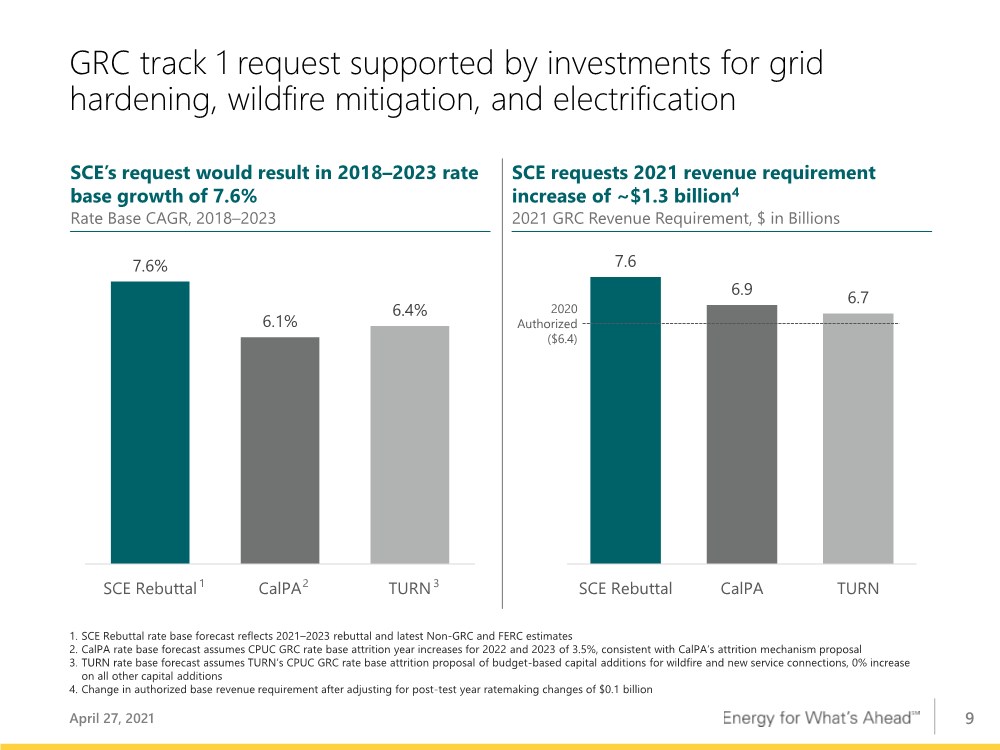
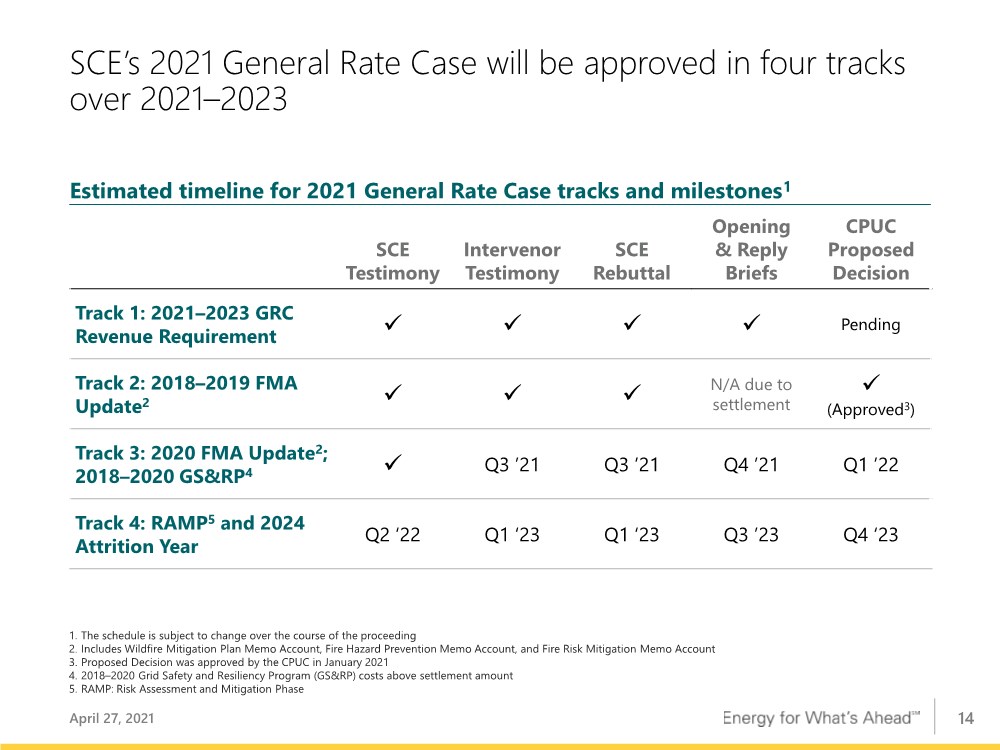
Please turn to page 9. On the regulatory front, we remain hopeful that SCE will receive a proposed decision on track 1 of its 2021 GRC this quarter. As a reminder, the CPUC can vote out a final decision no sooner than 30 days after it issues a proposed decision. Consistent with our prior practice, we will issue earnings guidance after we receive a final decision on the GRC. Additionally, SCE filed its testimony in track 3 of the 2021 GRC in the first quarter. In track 3, SCE is requesting recovery of $497 million in revenue requirement, and that the CPUC find reasonable $679 million of incremental wildfire mitigation capital expenditures. This filing is another step towards recovery of wildfire mitigation costs we have already incurred.

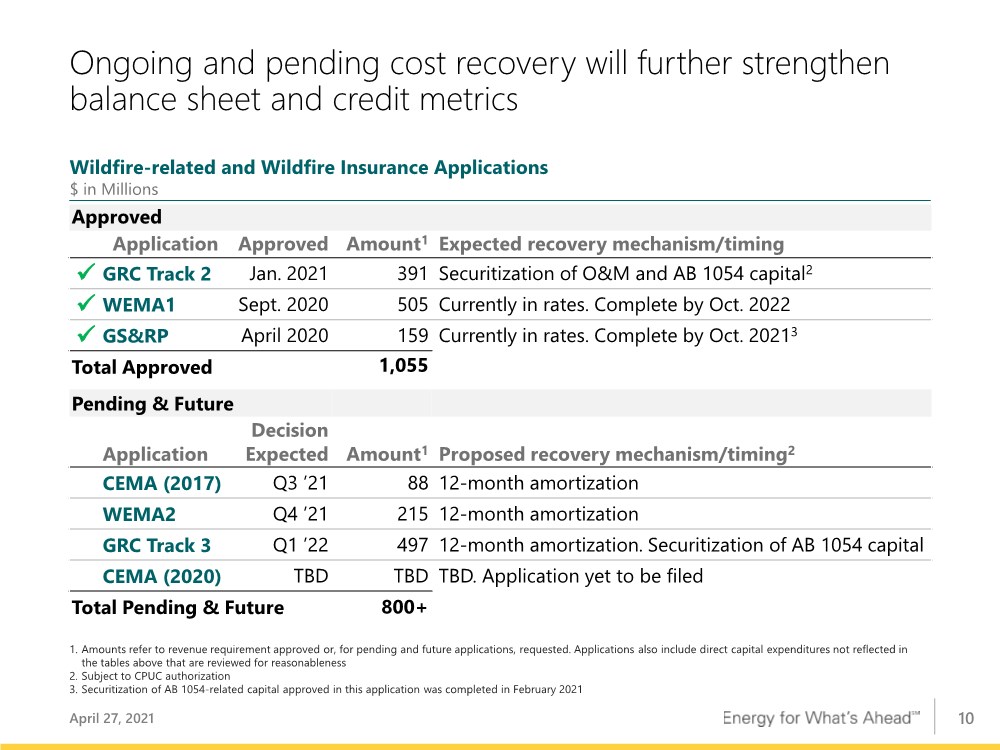
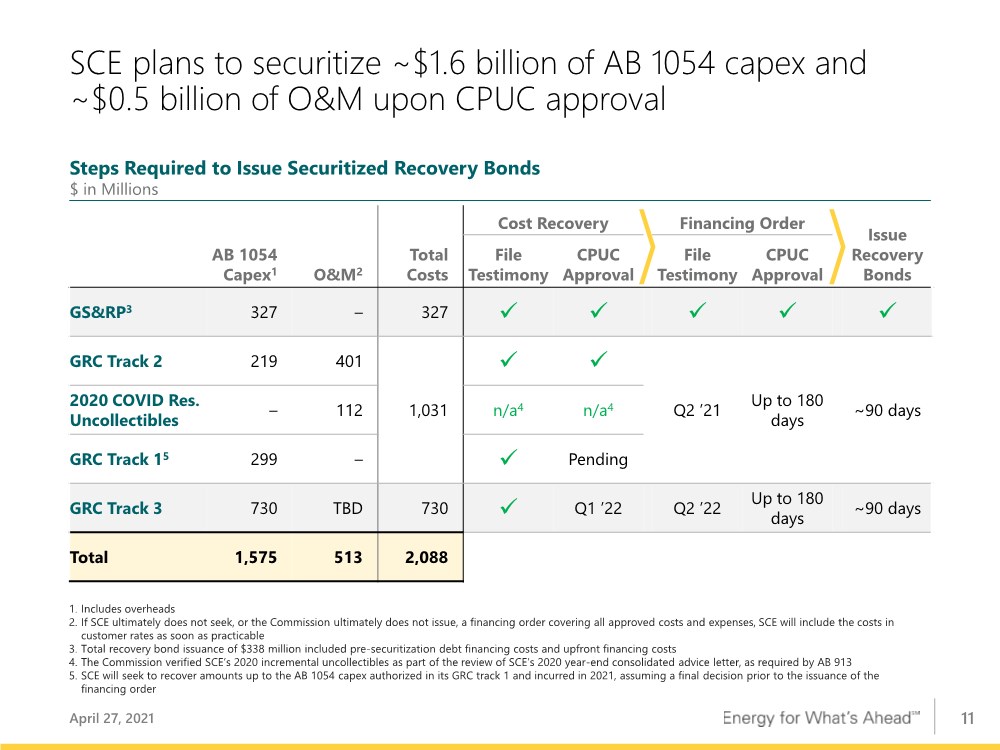
Page 10 provides a summary of the approved and pending cost recovery applications for incremental wildfire-related costs, including track 3, which I just mentioned. As you can see on page 11, in the coming months, SCE will request a financing order that would allow it to securitize the costs authorized in GRC track 2, residential uncollectibles for 2020, and additional AB 1054 capital authorized in GRC track 1. We expect SCE’s total request to be approximately $1 billion, composed of $500 million of AB 1054-related capital, $400 million of wildfire mitigation-related O&M, and $100 million of incremental residential uncollectible expenses associated with the economic effects of the COVID-19 pandemic.

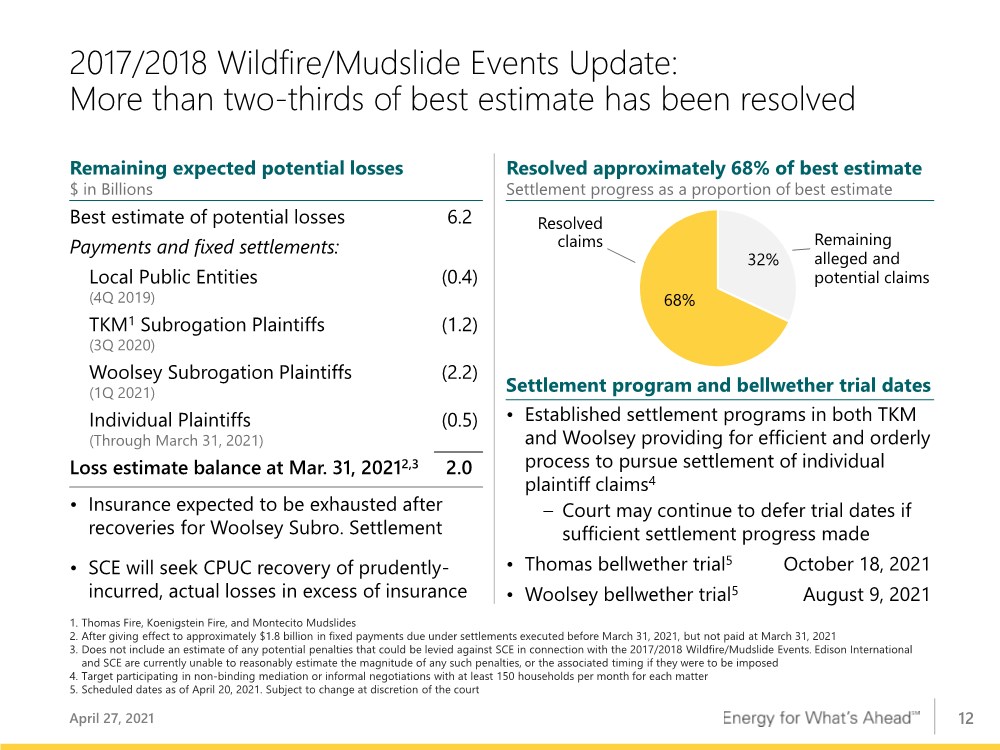
Related to the 2017 and 2018 Wildfire and Mudslide events, SCE continues to make solid progress settling the remaining individual plaintiff claims. As shown on page 12, during the first quarter, SCE resolved approximately $200 million of individual plaintiff claims. In total, that

6


brings resolved claims to approximately $4.2 billion, representing more than two-thirds of the best estimate of total losses, which remains unchanged.

I would now like to provide an update on the EIX financing plan and the issuance of securities with up to $1 billion of equity content that we discussed on our last earnings call. To reiterate our previous statements, this equity content supports maintaining investment grade ratings at EIX and the utility. During the first quarter, Edison International issued $1.25 billion of preferred stock, with equity content of approximately $625 million. We will continue to monitor market conditions and consider additional preferred equity, internal programs, and, if needed, the existing at-the-market program to satisfy the balance of the equity content need this year. Beyond 2021, we continue to expect to have minimal equity needs associated with SCE’s ongoing capital program and we will quantify these after receiving a final decision in the 2021 GRC.

7


Exhibit 99.3

GRAPHIC

April 27, 2021 First Quarter 2021 Financial Results

GRAPHIC

1 Statements contained in this presentation about future performance, including, without limitation, operating results, capital expenditures, rate base growth, dividend policy, financial outlook, and other statements that are not purely historical, are forward-looking statements. These forward-looking statements reflect our current expectations; however, such statements involve risks and uncertainties. Actual results could differ materially from current expectations. These forward-looking statements represent our expectations only as of the date of this presentation, and Edison International assumes no duty to update them to reflect new information, events or circumstances. Important factors that could cause different results include, but are not limited to the: • ability of SCE to recover its costs through regulated rates, including uninsured wildfire-related and debris flow-related costs, costs incurred to mitigate the risk of utility equipment causing future wildfires, costs incurred to implement SCE's new customer service system and costs incurred as a result of the COVID-19 pandemic; • ability of SCE to implement its Wildfire Mitigation Plan; • risks of regulatory or legislative restrictions that would limit SCE’s ability to implement Public Safety Power Shutoff (“PSPS”) when conditions warrant or would otherwise limit SCE’s operational PSPS practices; • risks associated with implementing PSPS, including regulatory fines and penalties, claims for damages and reputational harm; • ability of SCE to maintain a valid safety certification; • ability to obtain sufficient insurance at a reasonable cost, including insurance relating to SCE's nuclear facilities and wildfire-related claims, and to recover the costs of such insurance or, in the event liabilities exceed insured amounts, the ability to recover uninsured losses from customers or other parties; • extreme weather-related incidents (including events caused, or exacerbated, by climate change, such as wildfires, debris flows, high wind events and extreme heat events) and other natural disasters (such as earthquakes), which could cause, among other things, public safety issues, property damage, operational issues (such as rotating outages and issues due to damaged infrastructure), PSPS activations and unanticipated costs; • risks associated with California Assembly Bill 1054 (“AB 1054”) effectively mitigating the significant risk faced by California investor-owned utilities related to liability for damages arising from catastrophic wildfires where utility facilities are alleged to be a substantial cause, including the longevity of the Wildfire Insurance Fund and the CPUC's interpretation of and actions under AB 1054, including its interpretation of the new prudency standard established under AB 1054; • decisions and other actions by the California Public Utilities Commission, the Federal Energy Regulatory Commission, the Nuclear Regulatory Commission and other governmental authorities, including decisions and actions related to nationwide or statewide crisis, determinations of authorized rates of return or return on equity, the recoverability of wildfire-related and debris-flow-related costs, issuance of SCE's wildfire safety certification, wildfire mitigation efforts, and delays in executive, regulatory and legislative actions; • ability of Edison International or SCE to borrow funds and access bank and capital markets on reasonable terms; • risks associated with the decommissioning of San Onofre, including those related to worker and public safety, public opposition, permitting, governmental approvals, on- site storage of spent nuclear fuel, delays, contractual disputes, and cost overruns; • pandemics, such as COVID-19, and other events that cause regional, statewide, national or global disruption, which could impact, among other things, Edison International's and SCE's business, operations, cash flows, liquidity and/or financial results and cause Edison International and SCE to incur unanticipated costs; • physical security of Edison International's and SCE's critical assets and personnel and the cybersecurity of Edison International's and SCE's critical information technology systems for grid control, and business, employee and customer data; • risks associated with cost allocation resulting in higher rates for utility bundled service customers because of possible customer bypass or departure for other electricity providers such as Community Choice Aggregators (“CCA,” which are cities, counties, and certain other public agencies with the authority to generate and/or purchase electricity for their local residents and businesses) and Electric Service Providers (entities that offer electric power and ancillary services to retail customers, other than electrical corporations (like SCE) and CCAs); • risks inherent in SCE's transmission and distribution infrastructure investment program, including those related to project site identification, public opposition, environmental mitigation, construction, permitting, power curtailment costs (payments due under power contracts in the event there is insufficient transmission to enable acceptance of power delivery), changes in the California Independent System Operator’s transmission plans, and governmental approvals; and • risks associated with the operation of transmission and distribution assets and power generating facilities, including worker and public safety issues, the risk of utility assets causing or contributing to wildfires, failure, availability, efficiency, and output of equipment and facilities, and availability and cost of spare parts. Other important factors are discussed under the headings “Forward-Looking Statements”, “Risk Factors” and “Management’s Discussion and Analysis” in Edison International’s Form 10-K and other reports filed with the Securities and Exchange Commission, which are available on our website: www.edisoninvestor.com. These filings also provide additional information on historical and other factual data contained in this presentation. Forward-Looking Statements April 27, 2021

GRAPHIC

2 SCE’s execution of its wildfire mitigation strategy is reducing risk of wildfires associated with utility infrastructure April 27, 2021 Community Resource Centers Community Crew Vehicles 56 sites available 8 vehicles available High-Definition Wildfire Cameras Completed Since 2018 166 cameras installed Cameras thoroughly covering our high fire risk areas were installed by 2020 Distribution Equipment Inspections 2021 Completed/Target 108,000/163,000 inspections Completed Since 2018 692,000+ inspections 66% completed Transmission Equipment Inspections 2021 Completed/Target 4,800/16,800 inspections Completed Since 2018 90,900+ inspections 29% completed Insulated Wire (Covered Conductor) 2021 Completed/Target 270/1,000 circuit miles installed Completed Since 2018 1,760+ circuit miles installed 27% completed Fast-Acting Fuses 2021 Completed/Target 0/330 fuses installed Completed Since 2018 12,900+ fuses installed On Track1 Hazard Tree Management 2021 Completed/Target 12,600/150,000 trees assessed Completed Since 2018 241,000+ trees assessed 8% completed Weather Stations 2021 Completed/Target 0/375 weather stations installed Completed Since 2018 1,050+ weather stations installed On Track1 Aerial Fire Suppression Resources Expanding funding to support the creation of a quick reaction force of aerial firefighting assets across counties in SCE's service area to coordinate and reach wildfires in their early stages. These unique water and fire retardant dropping helitankers have the capability to operate day and night Critical Care Backup Battery Completed Since July 2020 1,770+ batteries provided to eligible customers 2021 Completed 1,030 batteries provided to eligible customers On Track 1. Execution planned to begin during Q2 2021, and target expected to be met by year-end Note: Data as of March 31, 2021. Green arrows indicate execution is on track

GRAPHIC

3 California has continued to increase investments in wildfire suppression and prevention1 April 27, 2021 CAL FIRE budget support along with actions to increase staffing and improve effectiveness ~$2.5–2.8bn/year ~7,180–8,134 Increases to firefighting crews Helicopter replacements continue Air tanker funding Enhanced technology Surge capacity New wildfire cameras and communications equipment deployed Fuel reduction projects ~$2.9bn3 ~8,735 Additional firefighters Helicopter replacement completion Air tanker funding Advanced modeling and analytics to inform suppression strategy Wildfire & Forest Resilience Action Plan ($1bn across depts. and budget years4) Resilient Forests & Landscapes Wildfire Fuel Breaks Forest Sector Stimulus Science-Based Management Community Hardening Substantial increase in wildfire suppression budget to address shifting risk factors Budget proposal continues suppression support and adds focus on prevention and resilience 2016-17 & 2017-18 Budget Years 2018-19 through 2020-21 Budget Years 2021-22 Budget Year CAL FIRE Budget2: ~$2.0bn/year CAL FIRE Positions: ~6,900 Extended peak staffing period Began procurement process to replace helicopters to enhance initial attack effectiveness Additional year-round engines 1. Total state funding and resources for wildfire suppression and prevention are also reflected in budgets of other departments, counties, and the State Mutual Aid System 2. As initially enacted 3. Includes approximately $392 million as part of the proposed $1 billion Wildfire & Forest Resilience Action Plan 4. Includes funding for “early action” that provides additional funding for the 2020-21 Budget Year

GRAPHIC

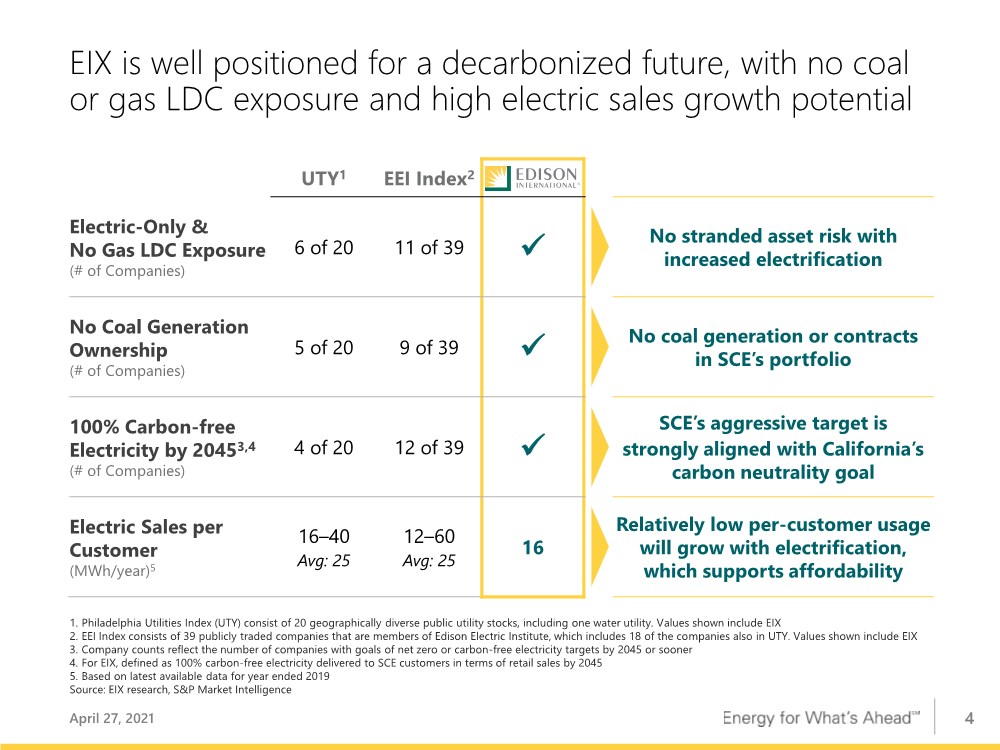
4 EIX is well positioned for a decarbonized future, with no coal or gas LDC exposure and high electric sales growth potential UTY1 EEI Index2 Electric-Only & No Gas LDC Exposure (# of Companies) 6 of 20 11 of 39 ✓ No stranded asset risk with increased electrification No Coal Generation Ownership (# of Companies) 5 of 20 9 of 39 ✓ No coal generation or contracts in SCE’s portfolio 100% Carbon-free Electricity by 20453,4 (# of Companies) 4 of 20 12 of 39 ✓ SCE’s aggressive target is strongly aligned with California’s carbon neutrality goal Electric Sales per Customer (MWh/year)5 16–40 Avg: 25 12–60 Avg: 25 16 Relatively low per-customer usage will grow with electrification, which supports affordability 1. Philadelphia Utilities Index (UTY) consist of 20 geographically diverse public utility stocks, including one water utility. Values shown include EIX 2. EEI Index consists of 39 publicly traded companies that are members of Edison Electric Institute, which includes 18 of the companies also in UTY. Values shown include EIX 3. Company counts reflect the number of companies with goals of net zero or carbon-free electricity targets by 2045 or sooner 4. For EIX, defined as 100% carbon-free electricity delivered to SCE customers in terms of retail sales by 2045 5. Based on latest available data for year ended 2019 Source: EIX research, S&P Market Intelligence April 27, 2021

GRAPHIC

5 Annual residential household energy costs (2019$)1 2019 2045 By 2045, a greater reliance on electricity, combined with population and economic growth, will result in a 60% increase in electricity sales from the grid Household savings driven by reduced gasoline consumption due to high market penetration of electric vehicles Improvements in equipment efficiency, energy efficiency, and demand response programs further reduce consumption Total energy cost for an average household decreases by about one-third by 2045 A decarbonized, electrified world produces energy cost savings for an average household $3,130 $4,550 Home Solar Electricity Bill Home Gas Bill Gasoline 1. Reflects annual energy costs using SCE data and does not account for the cost of equipment. Electricity bill based on delivery and generation charges for weighted average of CARE (California Alternate Rates for Energy) and non-CARE customers. Gas prices reflect declining residential gas consumption impact on remaining customers. Utility and transportation fuel costs in 2019 dollars. Average customer in 2045 would have electric vehicle, solar, and electric water and space heating Source: SCE’s Pathway 2045 analysis April 27, 2021

GRAPHIC

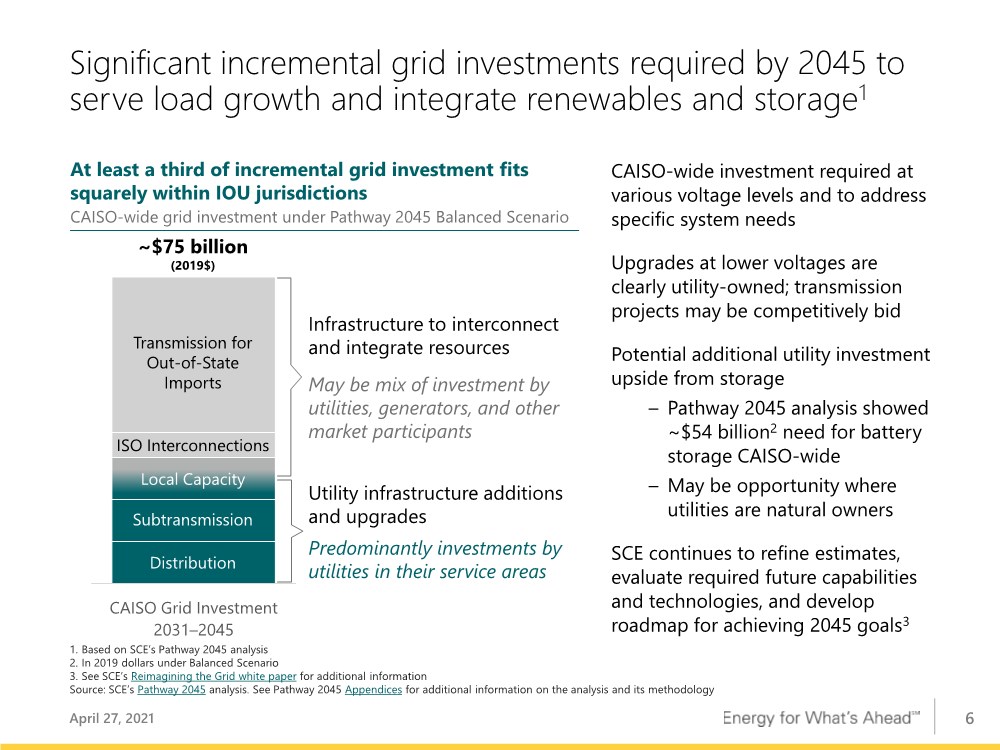
6 Significant incremental grid investments required by 2045 to serve load growth and integrate renewables and storage1 April 27, 2021 1. Based on SCE’s Pathway 2045 analysis 2. In 2019 dollars under Balanced Scenario 3. See SCE’s Reimagining the Grid white paper for additional information Source: SCE’s Pathway 2045 analysis. See Pathway 2045 Appendices for additional information on the analysis and its methodology CAISO Grid Investment 2031–2045 At least a third of incremental grid investment fits squarely within IOU jurisdictions CAISO-wide grid investment under Pathway 2045 Balanced Scenario ~$75 billion (2019$) Transmission for Out-of-State Imports ISO Interconnections Local Capacity Distribution Subtransmission Infrastructure to interconnect and integrate resources May be mix of investment by utilities, generators, and other market participants Utility infrastructure additions and upgrades Predominantly investments by utilities in their service areas CAISO-wide investment required at various voltage levels and to address specific system needs Upgrades at lower voltages are clearly utility-owned; transmission projects may be competitively bid Potential additional utility investment upside from storage – Pathway 2045 analysis showed ~$54 billion2 need for battery storage CAISO-wide – May be opportunity where utilities are natural owners SCE continues to refine estimates, evaluate required future capabilities and technologies, and develop roadmap for achieving 2045 goals3

GRAPHIC

7 Key SCE EPS Drivers2 Higher revenue3 0.05 CPUC revenue 0.02 FERC and other operating revenue 0.03 Lower O&M 0.20 Higher depreciation (0.08) Lower net financing costs 0.08 Income taxes3 (0.01) Property and other taxes (0.03) Results prior to impact from share dilution 0.21 $ Impact from share dilution (0.04) Total core drivers 0.17 $ Non-core items1 0.01 Total 0.18 $ (0.01) $ Total core drivers (0.01) $ Non-core items1 0.01 Total — $ Key EIX EPS Drivers2 EIX Parent and Other - Primarily due to dividend requirement of preferred stock issued in 2021 First Quarter Earnings Summary April 27, 2021 1. See Earnings Non-GAAP Reconciliation and Use of Non-GAAP Financial Measures in Appendix 2. For comparability, 2021 core drivers are reported based on 2020 weighted-average share count of 362.6 million (2021 weighted-average shares outstanding is 379.2 million) 3. Includes $(0.01) tax expenses related to balancing accounts, which are offset in revenue Note: Diluted earnings were $0.68 and $0.50 per share for the three months ended March 31, 2021 and 2020, respectively Q1 2021 Q1 2020 Variance Basic Earnings Per Share (EPS) SCE $ 0.78 $ 0.60 $ 0.18 EIX Parent & Other (0.10) (0.10) — Basic EPS $ 0.68 $ 0.50 $ 0.18 Less: Non-core Items1 SCE $ (0.11) $ (0.12) $ 0.01 EIX Parent & Other — (0.01) 0.01 Total Non-core $ (0.11) $ (0.13) $ 0.02 Core Earnings Per Share (EPS) SCE $ 0.89 $ 0.72 $ 0.17 EIX Parent & Other (0.10) (0.09) (0.01) Core EPS $ 0.79 $ 0.63 $ 0.16

GRAPHIC

8 5.5 5.5 5.3 5.4 2020 (Actual) 2021 2022 2023 SCE has strong capex and rate base growth driven by significant electric infrastructure investment opportunities 1. In accordance with Assembly Bill (AB) 1054, ~$1.6 billion of wildfire mitigation-related spend shall not earn an equity return 2. Morongo Transmission holds an option to invest up to $400 million in the West of Devers Transmission Project at the in-service date, estimated to be 2021. In the chart, rate base has been reduced to reflect this option. Capital forecast includes 100% of the project spend 3. Weighted-average year basis. Excludes rate base associated with ~$1.6 billion of capital referred to in footnote 1 and projects or programs not yet approved 4. For 2021–2023 capital, reflects a 10% reduction of the total capital forecast over the 3-year GRC cycle using management judgment based on experience of previously authorized amounts and potential for permitting delays and other operational considerations. For rate base, range case reflects capital expenditure forecast range case SCE forecasts deploying significant capital in 2021–2023… Capital Expenditures, $ in Billions Wildfire1 …resulting in strong rate base growth over two rate case cycles Rate Base2,3, $ in Billions 7.6% CAGR Generation Transmission Distribution ~$16 billion 2021–2023 Range Case4 5.4 4.6 4.7 Range Case4 36.2 37.6 39.5 CAGR 6.7% 28.5 30.8 33.8 36.3 38.4 41.1 2018 2019 2020 2021 2022 2023 April 27, 2021

GRAPHIC

9 GRC track 1 request supported by investments for grid hardening, wildfire mitigation, and electrification 1. SCE Rebuttal rate base forecast reflects 2021–2023 rebuttal and latest Non-GRC and FERC estimates 2. CalPA rate base forecast assumes CPUC GRC rate base attrition year increases for 2022 and 2023 of 3.5%, consistent with CalPA’s attrition mechanism proposal 3. TURN rate base forecast assumes TURN’s CPUC GRC rate base attrition proposal of budget-based capital additions for wildfire and new service connections, 0% increase on all other capital additions 4. Change in authorized base revenue requirement after adjusting for post-test year ratemaking changes of $0.1 billion SCE requests 2021 revenue requirement increase of ~$1.3 billion4 2021 GRC Revenue Requirement, $ in Billions SCE’s request would result in 2018–2023 rate base growth of 7.6% Rate Base CAGR, 2018–2023 7.6% 6.1% 6.4% SCE Rebuttal CalPA TURN 7.6 6.9 6.7 SCE Rebuttal CalPA TURN 2020 Authorized ($6.4) 1 3 2 April 27, 2021

GRAPHIC

10 Ongoing and pending cost recovery will further strengthen balance sheet and credit metrics Approved Application Approved Amount1 Expected recovery mechanism/timing ✓ GRC Track 2 Jan. 2021 391 Securitization of O&M and AB 1054 capital2 ✓ WEMA1 Sept. 2020 505 Currently in rates. Complete by Oct. 2022 ✓ GS&RP April 2020 159 Currently in rates. Complete by Oct. 20213 Total Approved 1,055 Pending & Future Application Decision Expected Amount1 Proposed recovery mechanism/timing2 CEMA (2017) Q3 ’21 88 12-month amortization WEMA2 Q4 ’21 215 12-month amortization GRC Track 3 Q1 ’22 497 12-month amortization. Securitization of AB 1054 capital CEMA (2020) TBD TBD TBD. Application yet to be filed Total Pending & Future 800+ 1. Amounts refer to revenue requirement approved or, for pending and future applications, requested. Applications also include direct capital expenditures not reflected in the tables above that are reviewed for reasonableness 2. Subject to CPUC authorization 3. Securitization of AB 1054-related capital approved in this application was completed in February 2021 April 27, 2021 Wildfire-related and Wildfire Insurance Applications $ in Millions

GRAPHIC

11 SCE plans to securitize ~$1.6 billion of AB 1054 capex and ~$0.5 billion of O&M upon CPUC approval April 27, 2021 O&M2 Total Costs Cost Recovery Financing Order Issue Recovery Bonds AB 1054 Capex1 File Testimony CPUC Approval File Testimony CPUC Approval GS&RP3 327 – 327 ✓ ✓ ✓ ✓ ✓ GRC Track 2 219 401 1,031 ✓ ✓ Q2 ’21 Up to 180 days ~90 days 2020 COVID Res. Uncollectibles – 112 n/a4 n/a4 GRC Track 15 299 – ✓ Pending GRC Track 3 730 TBD 730 ✓ Q1 ’22 Q2 ’22 Up to 180 days ~90 days Total 1,575 513 2,088 1. Includes overheads 2. If SCE ultimately does not seek, or the Commission ultimately does not issue, a financing order covering all approved costs and expenses, SCE will include the costs in customer rates as soon as practicable 3. Total recovery bond issuance of $338 million included pre-securitization debt financing costs and upfront financing costs 4. The Commission verified SCE’s 2020 incremental uncollectibles as part of the review of SCE’s 2020 year-end consolidated advice letter, as required by AB 913 5. SCE will seek to recover amounts up to the AB 1054 capex authorized in its GRC track 1 and incurred in 2021, assuming a final decision prior to the issuance of the financing order Steps Required to Issue Securitized Recovery Bonds $ in Millions

GRAPHIC

12 2017/2018 Wildfire/Mudslide Events Update: More than two-thirds of best estimate has been resolved 1. Thomas Fire, Koenigstein Fire, and Montecito Mudslides 2. After giving effect to approximately $1.8 billion in fixed payments due under settlements executed before March 31, 2021, but not paid at March 31, 2021 3. Does not include an estimate of any potential penalties that could be levied against SCE in connection with the 2017/2018 Wildfire/Mudslide Events. Edison International and SCE are currently unable to reasonably estimate the magnitude of any such penalties, or the associated timing if they were to be imposed 4. Target participating in non-binding mediation or informal negotiations with at least 150 households per month for each matter 5. Scheduled dates as of April 20, 2021. Subject to change at discretion of the court April 27, 2021 Remaining expected potential losses $ in Billions Resolved approximately 68% of best estimate Best estimate of potential losses 6.2 Payments and fixed settlements: Local Public Entities (4Q 2019) (0.4) TKM1 Subrogation Plaintiffs (3Q 2020) (1.2) Woolsey Subrogation Plaintiffs (1Q 2021) (2.2) Individual Plaintiffs (Through March 31, 2021) (0.5) Loss estimate balance at Mar. 31, 20212,3 2.0 • Established settlement programs in both TKM and Woolsey providing for efficient and orderly process to pursue settlement of individual plaintiff claims4 – Court may continue to defer trial dates if sufficient settlement progress made • Thomas bellwether trial5 October 18, 2021 • Woolsey bellwether trial5 August 9, 2021 Settlement program and bellwether trial dates 32% 68% Settlement progress as a proportion of best estimate Resolved claims Remaining alleged and potential claims • Insurance expected to be exhausted after recoveries for Woolsey Subro. Settlement • SCE will seek CPUC recovery of prudently- incurred, actual losses in excess of insurance

GRAPHIC

Appendix

GRAPHIC

14 SCE’s 2021 General Rate Case will be approved in four tracks over 2021–2023 SCE Testimony Intervenor Testimony SCE Rebuttal Opening & Reply Briefs CPUC Proposed Decision Track 1: 2021–2023 GRC Revenue Requirement ✓ ✓ ✓ ✓ Pending Track 2: 2018–2019 FMA Update2 ✓ ✓ ✓ N/A due to settlement ✓ (Approved3) Track 3: 2020 FMA Update2; 2018–2020 GS&RP4 ✓ Q3 ’21 Q3 ’21 Q4 ’21 Q1 ’22 Track 4: RAMP5 and 2024 Attrition Year Q2 ‘22 Q1 ‘23 Q1 ‘23 Q3 ’23 Q4 ‘23 1. The schedule is subject to change over the course of the proceeding 2. Includes Wildfire Mitigation Plan Memo Account, Fire Hazard Prevention Memo Account, and Fire Risk Mitigation Memo Account 3. Proposed Decision was approved by the CPUC in January 2021 4. 2018–2020 Grid Safety and Resiliency Program (GS&RP) costs above settlement amount 5. RAMP: Risk Assessment and Mitigation Phase Estimated timeline for 2021 General Rate Case tracks and milestones1 April 27, 2021

GRAPHIC

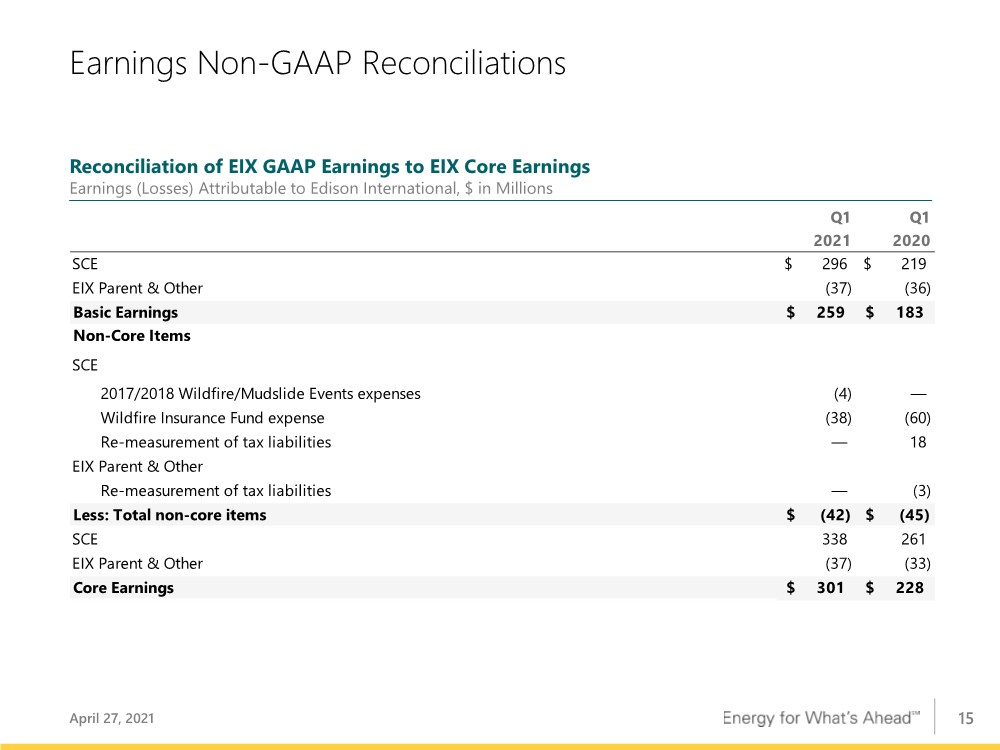
15 Earnings Non-GAAP Reconciliations April 27, 2021 Q1 2021 Q1 2020 SCE 296 $ 219 $ EIX Parent & Other (37) (36) Basic Earnings 259 $ 183 $ Non-Core Items SCE 2017/2018 Wildfire/Mudslide Events expenses (4) — Wildfire Insurance Fund expense (38) (60) Re-measurement of tax liabilities — 18 EIX Parent & Other Re-measurement of tax liabilities — (3) Less: Total non-core items (42) $ (45) $ SCE 338 261 EIX Parent & Other (37) (33) Core Earnings 301 $ 228 $ Reconciliation of EIX GAAP Earnings to EIX Core Earnings Earnings (Losses) Attributable to Edison International, $ in Millions

GRAPHIC

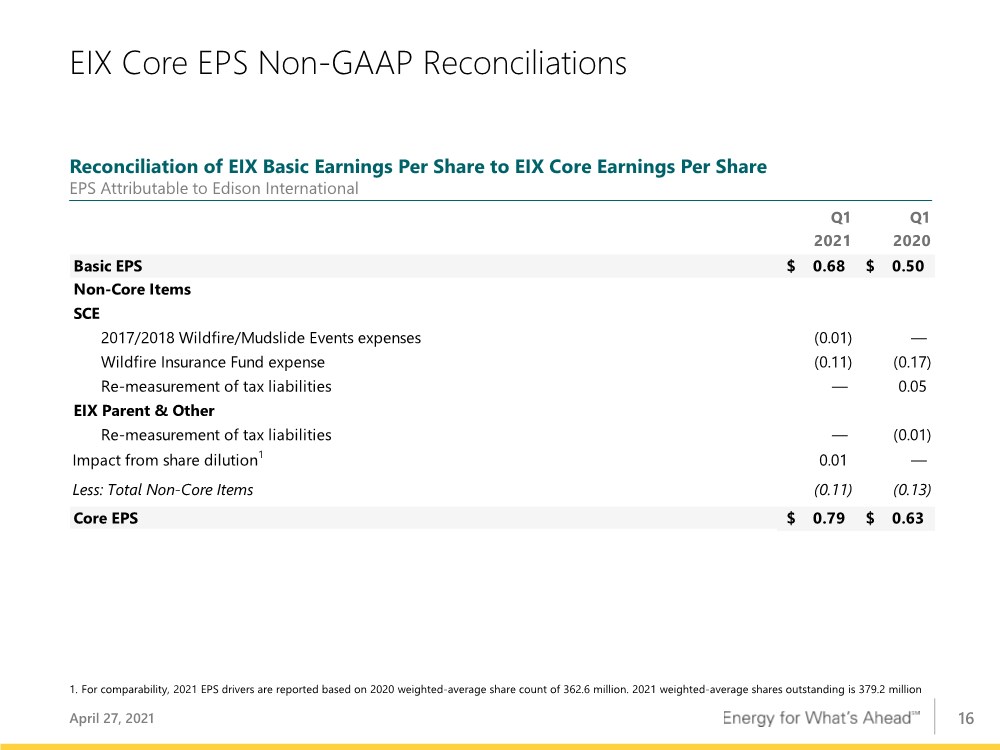
16 EIX Core EPS Non-GAAP Reconciliations April 27, 2021 1. For comparability, 2021 EPS drivers are reported based on 2020 weighted-average share count of 362.6 million. 2021 weighted-average shares outstanding is 379.2 million Q1 2021 Q1 2020 Basic EPS 0.68 $ 0.50 $ Non-Core Items SCE 2017/2018 Wildfire/Mudslide Events expenses (0.01) — Wildfire Insurance Fund expense (0.11) (0.17) Re-measurement of tax liabilities — 0.05 EIX Parent & Other Re-measurement of tax liabilities — (0.01) Impact from share dilution1 0.01 — Less: Total Non-Core Items (0.11) (0.13) Core EPS 0.79 $ 0.63 $ Reconciliation of EIX Basic Earnings Per Share to EIX Core Earnings Per Share EPS Attributable to Edison International

GRAPHIC

17 Edison International's earnings are prepared in accordance with generally accepted accounting principles used in the United States. Management uses core earnings (losses) internally for financial planning and for analysis of performance. Core earnings (losses) are also used when communicating with investors and analysts regarding Edison International's earnings results to facilitate comparisons of the company's performance from period to period. Core earnings (losses) are a non-GAAP financial measure and may not be comparable to those of other companies. Core earnings (losses) are defined as earnings attributable to Edison International shareholders less non-core items. Non- core items include income or loss from discontinued operations and income or loss from significant discrete items that management does not consider representative of ongoing earnings, such as write downs, asset impairments and other income and expense related to changes in law, outcomes in tax, regulatory or legal proceedings, and exit activities, including sale of certain assets and other activities that are no longer continuing. A reconciliation of Non-GAAP information to GAAP information is included either on the slide where the information appears or on another slide referenced in this presentation. EIX Investor Relations Contact Sam Ramraj, Vice President (626) 302-2540 [email protected] Use of Non-GAAP Financial Measures April 27, 2021