| | | | | |
| FOR IMMEDIATE RELEASE | Investor Relations: Sam Ramraj, (626) 302-2540 |
| Media Contact: Jeff Monford, (626) 476-8120 |
Edison International Reports Second Quarter and Year-to-Date 2020 Results
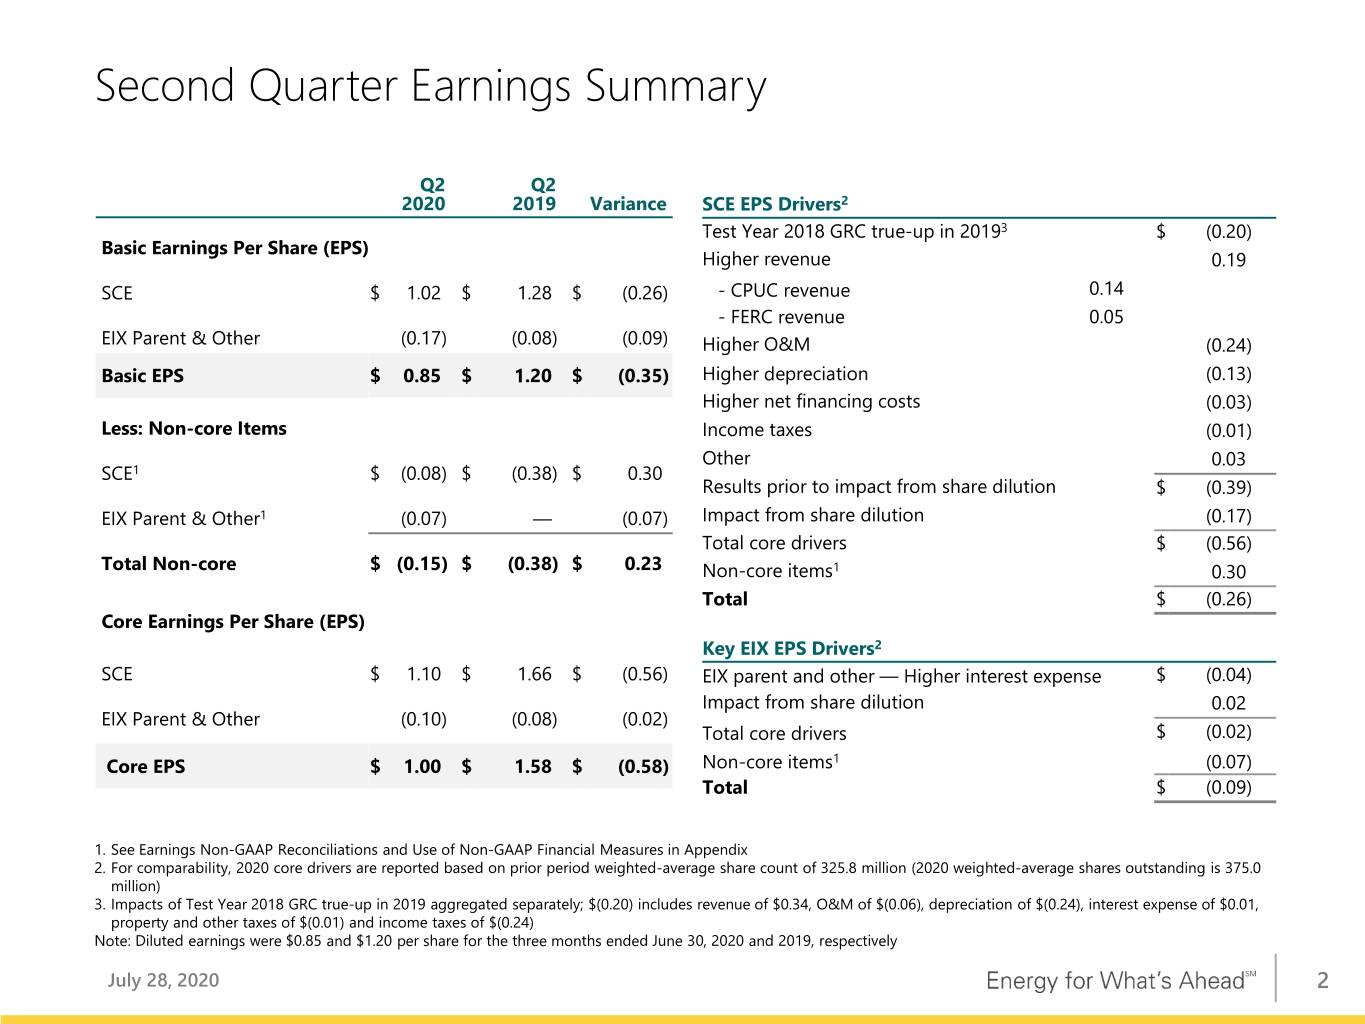
ROSEMEAD, Calif., July 28, 2020 — Edison International (NYSE: EIX) today reported second quarter 2020 net income of $318 million, or $0.85 per share, compared to net income of $392 million, or $1.20 per share, in the second quarter 2019. As adjusted, second quarter 2020 core earnings were $375 million, or $1.00 per share, compared to core earnings of $515 million, or $1.58 per share, in the second quarter 2019.
Southern California Edison's (SCE) second quarter 2020 earnings per share (EPS) decreased by $0.26 from the prior year period, consisting of lower core EPS of $0.56 and lower non-core loss per share of $0.30. Lower core EPS was primarily due to the increase in shares outstanding related to the equity offerings in July 2019 and May 2020, the adoption of the 2018 GRC decision in the second quarter of 2019, and the timing of O&M expenses, partially offset by higher CPUC-related revenue due to the escalation mechanism as set forth in the 2018 GRC decision.
SCE's lower non-core loss per share was mainly attributable to the absence of $0.38 of disallowed historical capital expenditures in SCE's 2018 GRC decision recorded in the second quarter 2019, and a charge recorded in 2020 of $0.16 from the amortization of SCE's contributions to the Wildfire Insurance Fund. These were partially offset by a gain of $0.10 recorded in 2020 for SCE's sale of San Onofre nuclear fuel.
Edison International Parent and Other's second quarter 2020 loss per share increased by $0.09 compared to second quarter 2019, consisting of higher core loss per share of $0.02 and higher non-core loss per share of $0.07. The higher core loss per share was primarily due to higher interest expense, partially offset by the increase in shares outstanding. The higher non-core loss per share was mainly related to a goodwill impairment charge recorded in 2020 related to Edison Energy stemming from the economic impact of COVID-19.
“We are confident in our 2020 earnings guidance, although the timing of operations and maintenance expenses and deferrals of certain wildfire-related costs negatively impacted our core earnings per share for the quarter. These comparisons should improve in the second half of the year,” said Pedro J. Pizarro, president and chief executive officer of Edison International. “I am proud of our team’s steadfast performance during this COVID-19 pandemic, focusing on practices to ensure the safety and health of employees and critical operations for customers’ benefit, including those laid out in SCE’s 2020–2022 Wildfire Mitigation Plan.”
Pizarro added, “While we anticipate another active fire season, SCE is entering this period better prepared than ever. In addition to advancing wildfire mitigation measures, the company has made improvements to Public Safety Power Shutoff, or PSPS, protocols since last year which we expect will reduce the number of customers affected by 30% under the same conditions as last year.”
Edison International Reports Second Quarter and Year-to-Date 2020 Financial Results
Page 2 of 11
Year-to-Date Earnings
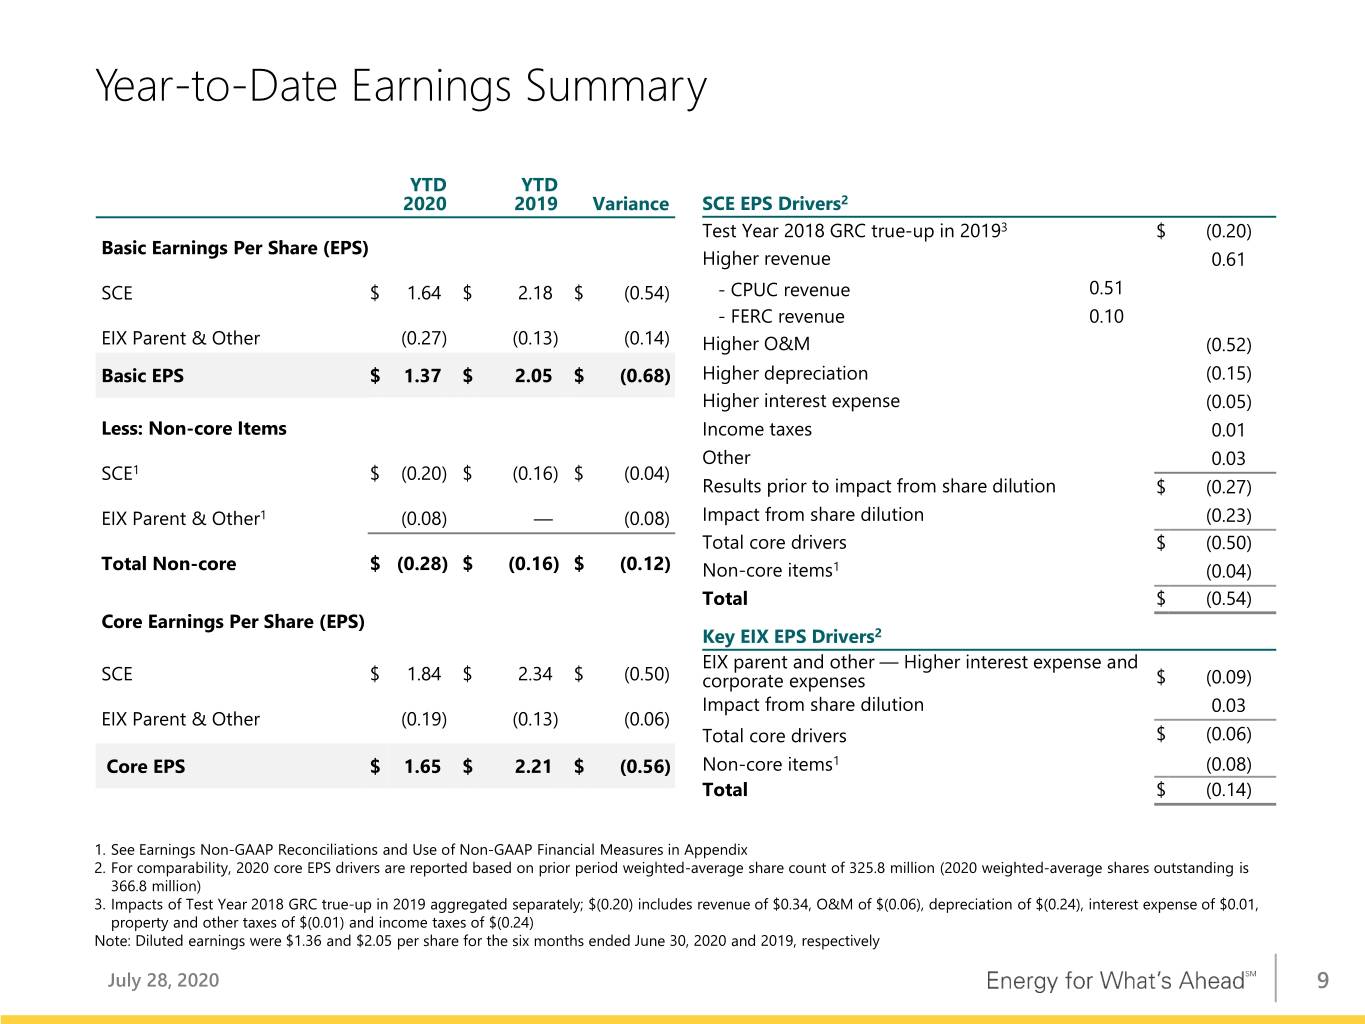
For the six months ended June 30, 2020, Edison International reported net income of $501 million, or $1.37 per share, compared to $670 million, or $2.05 per share, during the same period in 2019. As adjusted, Edison International's core earnings were $603 million, or $1.65 per share, compared to $721 million, or $2.21 per share, in the year-to-date period in 2019.
SCE's year-to-date 2020 EPS decreased $0.54 from the same period prior year, consisting of lower core EPS of $0.50 per share and higher non-core loss per share of $0.04. The decrease in SCE's core EPS was primarily due to the increase in shares outstanding related to the equity offerings in July 2019 and May 2020, the adoption of the 2018 GRC decision in the second quarter of 2019, and the timing of O&M expenses, partially offset by higher CPUC-related revenue due to the escalation mechanism as set forth in the 2018 GRC decision. SCE's higher non-core loss per share was mainly related to a charge of $0.32 recorded in 2020 from the amortization of SCE's contributions to the Wildfire Insurance Fund and the absence of $0.21 of income tax benefits related to changes in the allocation of deferred tax re-measurement between customers and shareholders as a result of a CPUC resolution issued in February 2019. These were partially offset by a $0.09 higher gain for SCE's sale of San Onofre nuclear fuel and the absence of the $0.38 impairment charge resulting from the disallowance of certain historical capital expenditures in SCE's 2018 GRC final decision recorded in the second quarter 2019.
Edison International Parent and Other’s year-to-date 2020 loss per share increased by $0.14 compared to the same period in 2019, consisting of higher core loss per share of $0.06 and higher non-core loss per share of $0.08. The increase in core loss per share was primarily due to higher interest expense, partially offset by the increase in shares outstanding. The higher non-core loss per share was mainly related to a goodwill impairment charge recorded in 2020 related to Edison Energy stemming from the economic impact of COVID-19.
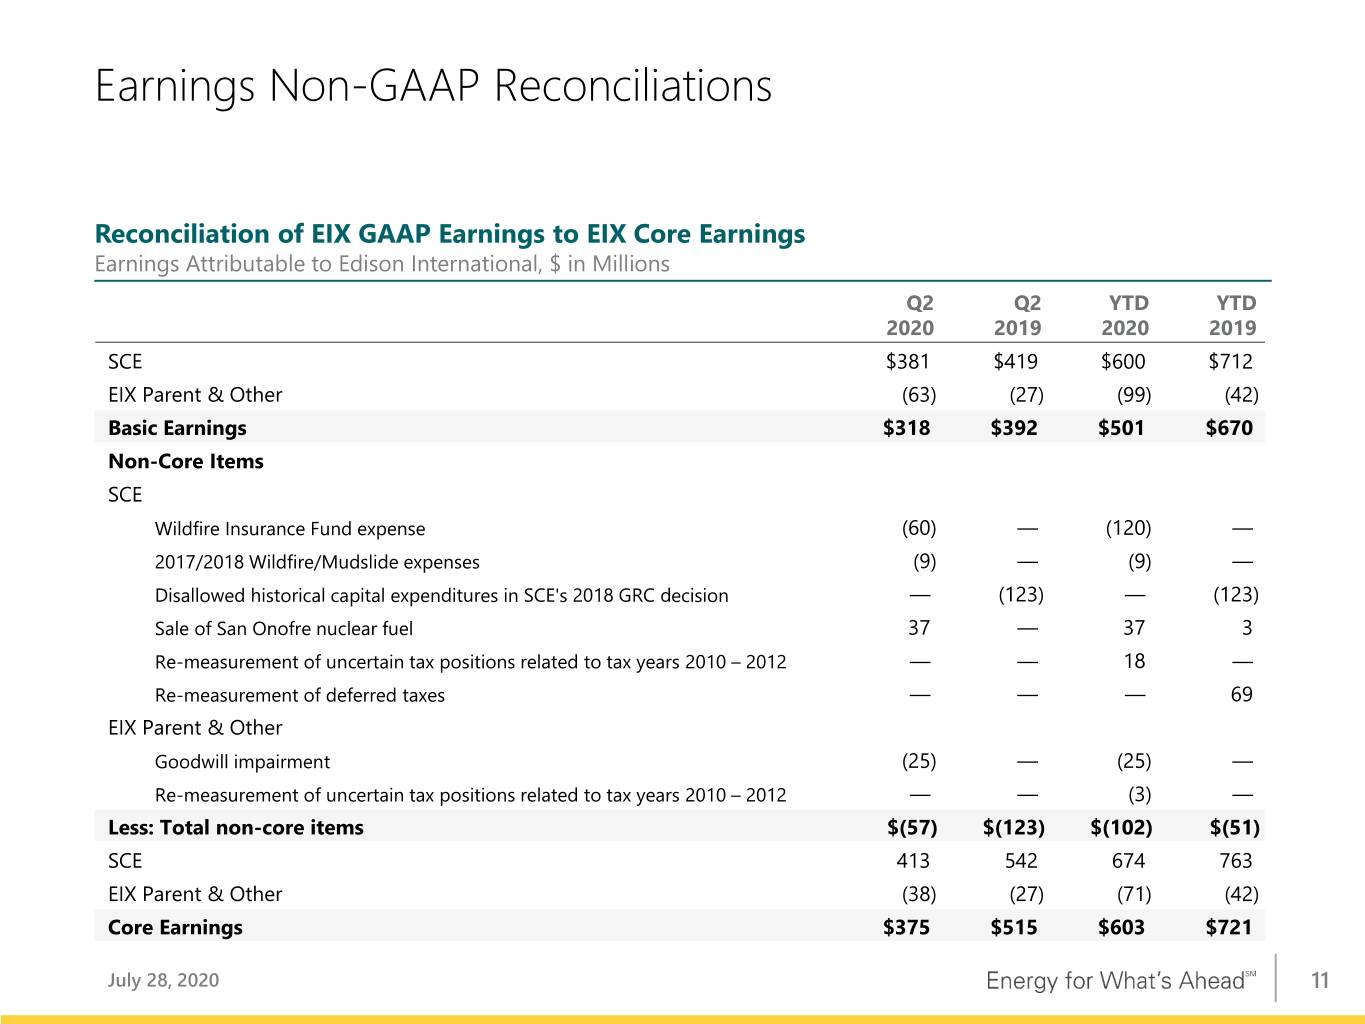
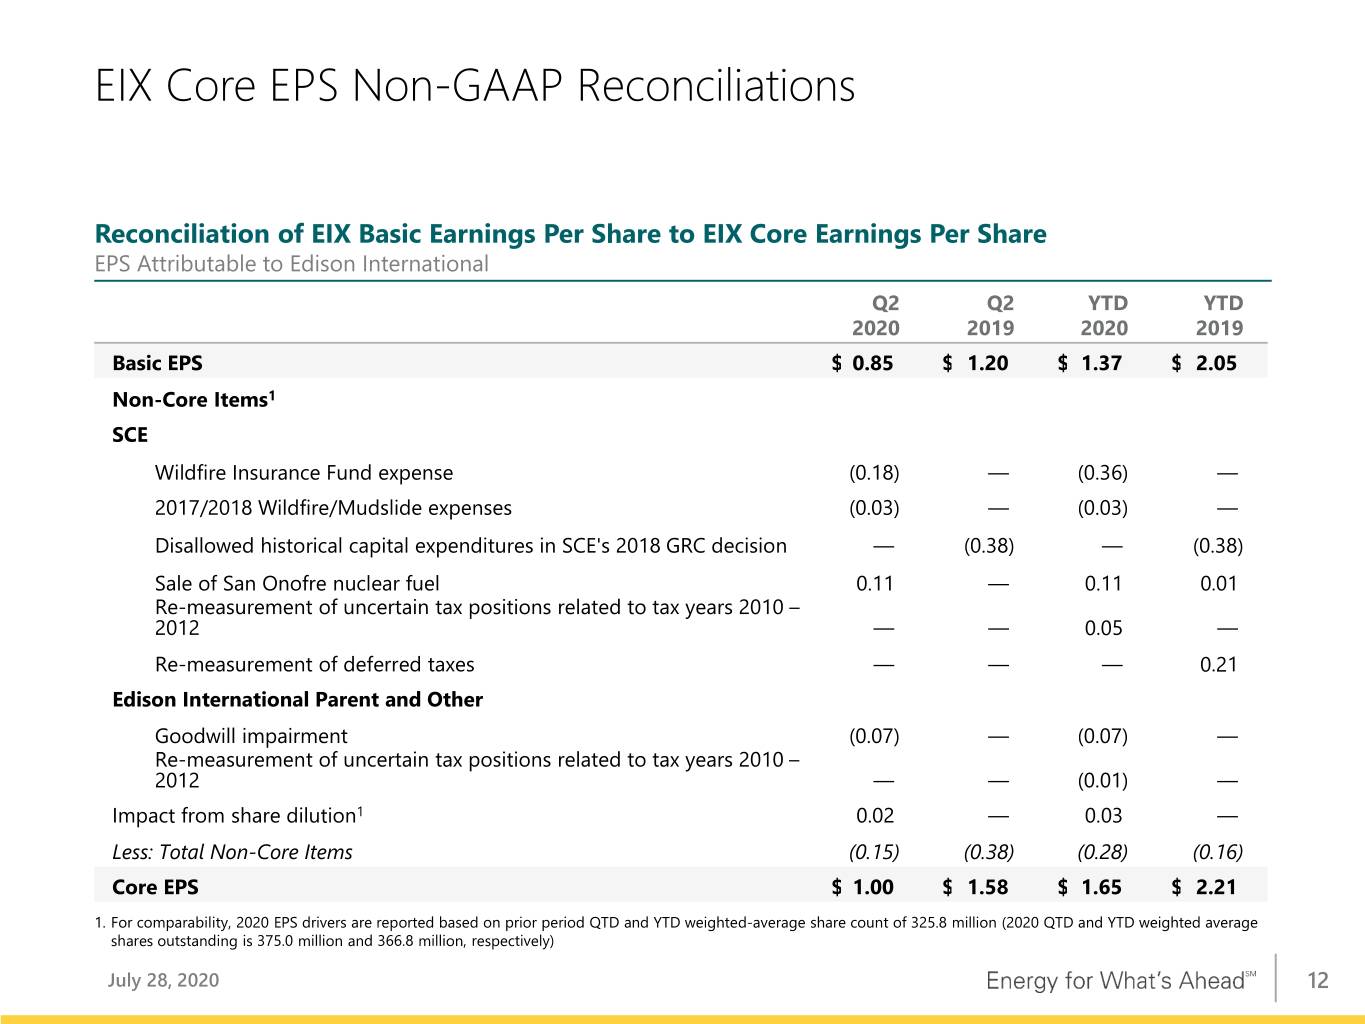
Edison International uses core earnings, which is a non-GAAP financial measure that adjusts for significant discrete items that management does not consider representative of ongoing earnings. Edison International management believes that core earnings provide more meaningful comparisons of performance from period to period. Please see the attached tables for a reconciliation of core earnings to basic GAAP earnings.
2020 Earnings Guidance
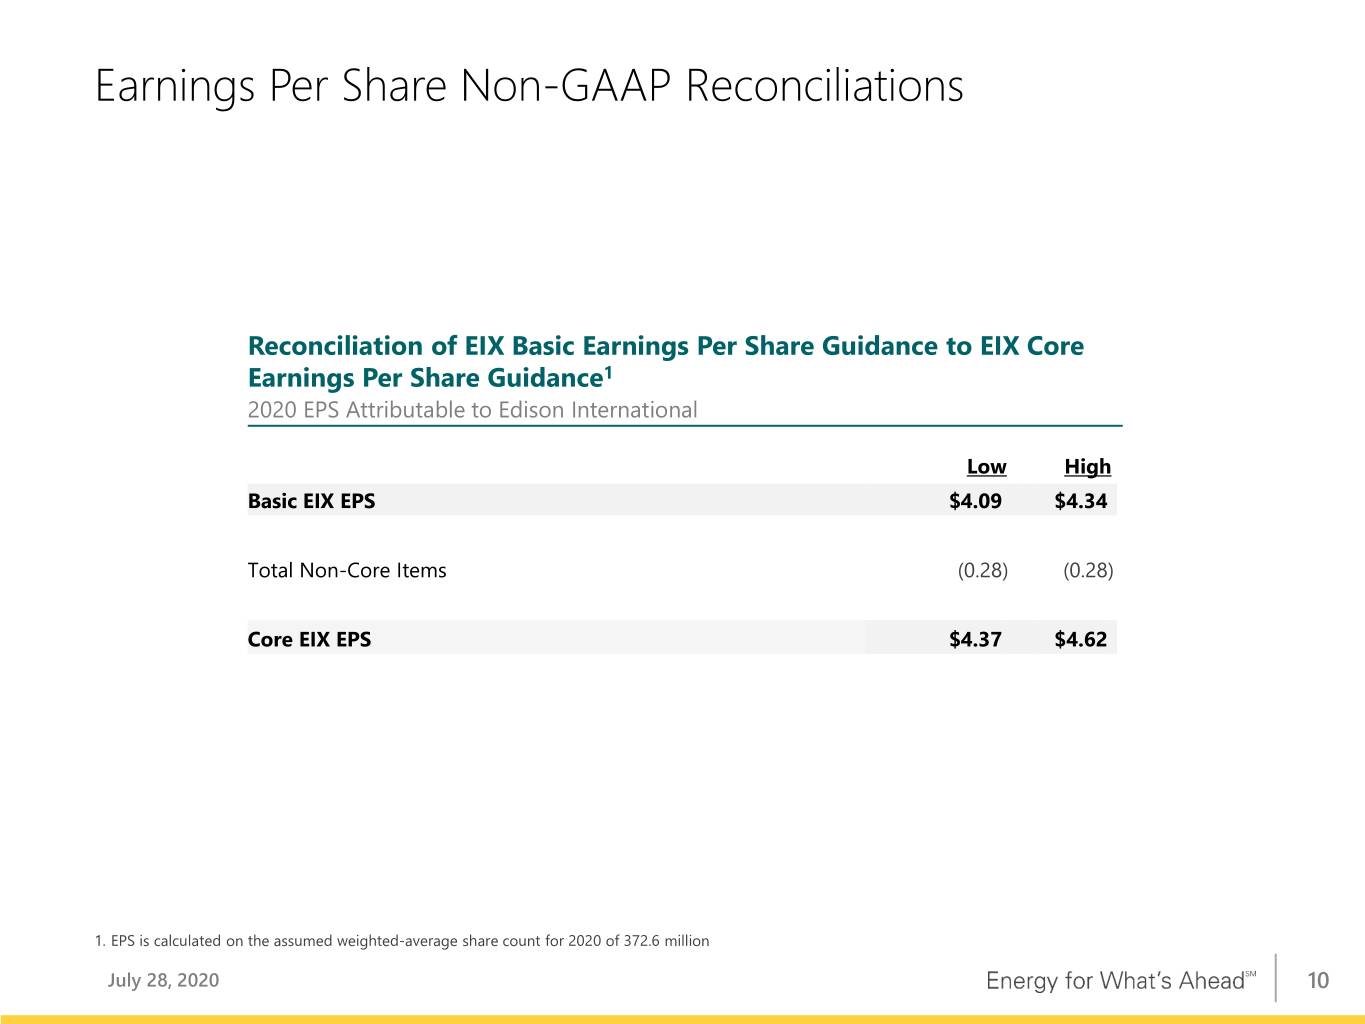
The company narrowed its earnings guidance range for 2020 as summarized in the following chart. See the presentation accompanying the company’s conference call for further information.
2020 Earnings Guidance
| | | | | | | | | | | | | | | | | |
| 2020 Earnings Guidance | | | 2020 Earnings Guidance | |
| as of April 30, 2020 | | | as of July 28, 2020 | |
| Low | High | | Low | High |
| EIX Basic EPS | $4.19 | $4.49 | | $4.09 | $4.34 |
| Less: Non-core Items* | (0.13) | (0.13) | | (0.28) | (0.28) |
| EIX Core EPS | $4.32 | $4.62 | | $4.37 | $4.62 |
* There were ($102) million, or ($0.28) per share of non-core items recorded for the six months ended June 30, 2020, calculated based on an assumed weighted average share count for 2020.
Second Quarter 2020 Earnings Conference Call Materials
Edison International has posted its earnings conference call prepared remarks by the CEO and CFO, the teleconference presentation, and Form 10-Q to the company's investor relations website. These materials are available at www.edisoninvestor.com.
Edison International Reports Second Quarter and Year-to-Date 2020 Financial Results
Page 3 of 11
Reminder: Edison International Will Hold a Conference Call Today
When: Tuesday, July 28, 2020, 1:30 p.m. (Pacific Time)
Telephone Numbers: 1-888-673-9780 (US) and 1-312-470-0178 (Int'l) - Passcode: Edison
Telephone Replay: 1-866-441-1051 (US) and 1-203-369-1058 (Int’l) - Passcode: 2548
Telephone replay available through August 11, 2020
Webcast: www.edisoninvestor.com
About Edison International
Edison International (NYSE: EIX) is one of the nation’s largest electric utility holding companies, providing clean and reliable energy and energy services through its independent companies. Headquartered in Rosemead, California, Edison International is the parent company of Southern California Edison Company, a utility that delivers electricity to 15 million people across Southern, Central and Coastal California. Edison International is also the parent company of Edison Energy, a global energy advisory company delivering comprehensive, data-driven energy solutions to commercial and industrial users to meet their cost, sustainability and risk goals.
Edison International Reports Second Quarter and Year-to-Date 2020 Financial Results
Page 4 of 11
Appendix
Use of Non-GAAP Financial Measures
Edison International’s earnings are prepared in accordance with generally accepted accounting principles used in the United States and represent the company’s earnings as reported to the Securities and Exchange Commission. Our management uses core earnings and core earnings per share (EPS) internally for financial planning and for analysis of performance of Edison International and Southern California Edison. We also use core earnings and core EPS when communicating with analysts and investors regarding our earnings results to facilitate comparisons of the Company’s performance from period to period. Financial measures referred to as net income, basic EPS, core earnings, or core EPS also apply to the description of earnings or earnings per share.
Core earnings and core EPS are non-GAAP financial measures and may not be comparable to those of other companies. Core earnings and core EPS are defined as basic earnings and basic EPS excluding income or loss from discontinued operations and income or loss from significant discrete items that management does not consider representative of ongoing earnings. Basic earnings and losses refer to net income or losses attributable to Edison International shareholders. Core earnings are reconciled to basic earnings in the attached tables. The impact of participating securities (vested awards that earn dividend equivalents that may participate in undistributed earnings with common stock) for the principal operating subsidiary is not material to the principal operating subsidiary’s EPS and is therefore reflected in the results of the Edison International holding company, which is included in Edison International Parent and Other.
Safe Harbor Statement
Statements contained in this presentation about future performance, including, without limitation, operating results, capital expenditures, rate base growth, dividend policy, financial outlook, and other statements that are not purely historical, are forward-looking statements. These forward-looking statements reflect our current expectations; however, such statements involve risks and uncertainties. Actual results could differ materially from current expectations. These forward-looking statements represent our expectations only as of the date of this presentation, and Edison International assumes no duty to update them to reflect new information, events or circumstances. Important factors that could cause different results include, but are not limited to the:
•ability of SCE to recover its costs through regulated rates, including costs related to uninsured wildfire-related and mudslide-related liabilities, costs incurred to mitigate the risk of utility equipment causing future wildfires, costs incurred to implement SCE's new customer service system and costs incurred as a result of the COVID-19 pandemic;
•ability of SCE to implement its Wildfire Mitigation Plan, including effectively implementing Public Safety Power Shut-Offs when appropriate;
•ability to obtain sufficient insurance at a reasonable cost, including insurance relating to SCE's nuclear facilities and wildfire-related claims, and to recover the costs of such insurance or, in the event liabilities exceed insured amounts, the ability to recover uninsured losses from customers or other parties;
•risks associated with California Assembly Bill 1054 (“AB 1054”) effectively mitigating the significant risk faced by California investor-owned utilities related to liability for damages arising from catastrophic wildfires where utility facilities are alleged to be a substantial cause, including SCE's ability to maintain a valid safety certification, SCE's ability to recover uninsured wildfire-related costs from the insurance fund established under AB 1054 (“Wildfire Insurance Fund”), the longevity of the Wildfire Insurance Fund, and the CPUC's interpretation of and actions under AB 1054, including their interpretation of the new prudency standard established under AB 1054;
•decisions and other actions by the California Public Utilities Commission, the Federal Energy Regulatory Commission, the Nuclear Regulatory Commission and other governmental authorities, including decisions and actions related to nationwide or statewide crisis, determinations of authorized rates of return or return on equity, the recoverability of wildfire-related and mudslide-related costs, issuance of SCE's wildfire safety certification, wildfire mitigation efforts, and delays in executive, regulatory and legislative actions;
Edison International Reports Second Quarter and Year-to-Date 2020 Financial Results
Page 5 of 11
•ability of Edison International or SCE to borrow funds and access bank and capital markets on reasonable terms;
•risks associated with the decommissioning of San Onofre, including those related to public opposition, permitting, governmental approvals, on-site storage of spent nuclear fuel, delays, contractual disputes, and cost overruns;
•pandemics, such as COVID-19, and other events that cause regional, statewide, national or global disruption, which could impact, among other things, Edison International's and SCE's business, operations, cash flows, liquidity and/or financial results;
•extreme weather-related incidents and other natural disasters (including earthquakes and events caused, or exacerbated, by climate change, such as wildfires), which could cause, among other things, public safety issues, property damage and operational issues;
•physical security of Edison International's and SCE's critical assets and personnel and the cybersecurity of Edison International's and SCE's critical information technology systems for grid control, and business, employee and customer data;
•risks associated with cost allocation resulting in higher rates for utility bundled service customers because of possible customer bypass or departure for other electricity providers such as Community Choice Aggregators (“CCA,” which are cities, counties, and certain other public agencies with the authority to generate and/or purchase electricity for their local residents and businesses) and Electric Service Providers (entities that offer electric power and ancillary services to retail customers, other than electrical corporations (like SCE) and CCAs);
•risks inherent in SCE's transmission and distribution infrastructure investment program, including those related to project site identification, public opposition, environmental mitigation, construction, permitting, power curtailment costs (payments due under power contracts in the event there is insufficient transmission to enable acceptance of power delivery), changes in the California Independent System Operator’s transmission plans, and governmental approvals; and
•risks associated with the operation of transmission and distribution assets and power generating facilities, including public, contractor and employee safety issues, the risk of utility assets causing or contributing to wildfires, failure, availability, efficiency, and output of equipment and facilities, and availability and cost of spare parts.
Additional information about risks and uncertainties, including more detail about the factors described in this report, is contained throughout this report and in the 2019 Form 10-K, including the "Risk Factors" section. Readers are urged to read this entire report, including information incorporated by reference, as well as the 2019 Form 10-K, and carefully consider the risks, uncertainties, and other factors that affect Edison International's and SCE's businesses. Edison International and SCE post or provide direct links (i) to certain SCE and other parties' regulatory filings and documents with the CPUC and the FERC and certain agency rulings and notices in open proceedings in a section titled "SCE Regulatory Highlights," (ii) to certain documents and information related to Southern California wildfires which may be of interest to investors in a section titled "Southern California Wildfires," and (iii) to presentations, documents and other information that may be of interest to investors in a section title "Events and Presentations" at www.edisoninvestor.com in order to publicly disseminate such information.
These forward-looking statements represent our expectations only as of the date of this news release, and Edison International assumes no duty to update them to reflect new information, events or circumstances. Readers should review future reports filed by Edison International and SCE with the SEC.
Edison International Reports Second Quarter and Year-to-Date 2020 Financial Results
Page 6 of 11
Second Quarter Reconciliation of Basic Earnings Per Share to Core Earnings Per Share
| | | | | | | | | | | | | | | | | | | | | | | | | | | | | | | | | | | |
| Three months ended June 30, | | | | | | Six months ended June 30, | | | | |
| 2020 | | 2019 | | Change | | 2020 | | 2019 | | Change |
Earnings (loss) per share attributable to Edison International | | | | | | | | | | | |
| Continuing operations | | | | | | | | | | | |
| SCE | $ | 1.02 | | | $ | 1.28 | | | $ | (0.26) | | | $ | 1.64 | | | $ | 2.18 | | | $ | (0.54) | |
Edison International Parent and Other | (0.17) | | | (0.08) | | | (0.09) | | | (0.27) | | | (0.13) | | | (0.14) | |
| | | | | | | | | | | |
| Edison International | 0.85 | | | 1.20 | | | (0.35) | | | 1.37 | | | 2.05 | | | (0.68) | |
| Less: Non-core items | | | | | | | | | | | |
| SCE | (0.08) | | | (0.38) | | | 0.30 | | | (0.20) | | | (0.16) | | | (0.04) | |
Edison International Parent and Other | (0.07) | | | — | | | (0.07) | | | (0.08) | | | — | | | (0.08) | |
| | | | | | | | | | | |
| Total non-core items | (0.15) | | | (0.38) | | | 0.23 | | | (0.28) | | | (0.16) | | | (0.12) | |
| Core earnings (losses) | | | | | | | | | | | |
| SCE | 1.10 | | | 1.66 | | | (0.56) | | | 1.84 | | | 2.34 | | | (0.50) | |
Edison International Parent and Other | (0.10) | | | (0.08) | | | (0.02) | | | (0.19) | | | (0.13) | | | (0.06) | |
| Edison International | $ | 1.00 | | | $ | 1.58 | | | $ | (0.58) | | | $ | 1.65 | | | $ | 2.21 | | | $ | (0.56) | |
Note: Diluted earnings were $0.85 and $1.20 per share for the three months ended June 30, 2020 and 2019, respectively, and $1.36 and $2.05 per share for the six months ended June 30, 2020 and 2019, respectively.
Edison International Reports Second Quarter and Year-to-Date 2020 Financial Results
Page 7 of 11
Second Quarter Reconciliation of Basic Earnings Per Share to Core Earnings (in millions)
| | | | | | | | | | | | | | | | | | | | | | | | | | | | | | | | | | | |
| Three months ended June 30, | | | | | | Six months ended June 30, | | | | |
| (in millions) | 2020 | | 2019 | | Change | | 2020 | | 2019 | | Change |
Net income (loss) attributable to Edison International | | | | | | | | | | | |
| Continuing operations | | | | | | | | | | | |
| SCE | $ | 381 | | | $ | 419 | | | $ | (38) | | | $ | 600 | | | $ | 712 | | | $ | (112) | |
Edison International Parent and Other | (63) | | | (27) | | | (36) | | | (99) | | | (42) | | | (57) | |
| | | | | | | | | | | |
| Edison International | 318 | | | 392 | | | (74) | | | 501 | | | 670 | | | (169) | |
| Less: Non-core items | | | | | | | | | | | |
SCE1,2,3,4,5,6 | (32) | | | (123) | | | 91 | | | (74) | | | (51) | | | (23) | |
Edison International Parent and Other2,7 | (25) | | | — | | | (25) | | | (28) | | | — | | | (28) | |
| | | | | | | | | | | |
| Total non-core items | (57) | | | (123) | | | 66 | | | (102) | | | (51) | | | (51) | |
| Core earnings (losses) | | | | | | | | | | | |
| SCE | 413 | | | 542 | | | (129) | | | 674 | | | 763 | | | (89) | |
| Edison International Parent and Other | (38) | | | (27) | | | (11) | | | (71) | | | (42) | | | (29) | |
| Edison International | $ | 375 | | | $ | 515 | | | $ | (140) | | | $ | 603 | | | $ | 721 | | | $ | (118) | |
1 Includes amortization of SCE’s Wildfire Insurance Fund expenses of $83 million ($60 million after-tax) and $167 million ($120 million after-tax) for the quarter and year-ended June 30, 2020, respectively.
2 Includes income tax benefit of $18 million and income tax expense of $3 million recorded in the first quarter of 2020 for SCE and Edison International Parent and Other, respectively, due to re-measurement of uncertain tax positions related to the 2010 – 2012 California state tax filings currently under audit.
3 Includes income tax benefits of $69 million recorded in 2019 for SCE related to changes in the allocation of deferred tax re-measurement between customers and shareholders as a result of a CPUC resolution issued in February 2019. The resolution determined that customers are only entitled to excess deferred taxes which were included when setting rates and other deferred tax re-measurement belongs to shareholders.
4 Includes a gain of $52 million ($37 million after-tax) recorded in 2020 and $4 million ($3 million after-tax) recorded in 2019 for SCE's sale of San Onofre nuclear fuel.
5 Includes expenses of $12 million ($9 million after-tax) recorded in 2020 for SCE's legal costs related to 2017/2018 Wildfire/Mudslide events.
6 Includes an impairment charge of $170 million ($123 million after-tax) recorded in 2019 for SCE related to disallowed historical capital expenditures in SCE's 2018 GRC decision.
7 Includes a goodwill impairment charge of $34 million ($25 million after-tax) recorded in 2020 for Edison International Parent and Other related to Edison Energy stemming from the economic impact of COVID-19.
Edison International Reports Second Quarter and Year-to-Date 2020 Financial Results
Page 8 of 11
| | | | | | | | | | | | | | | | | | | | | | | |
| Consolidated Statements of Income | | | | | Edison International | | |
| | | | | | | |
| | Three months ended June 30, | | | | Six months ended June 30, | | |
(in millions, except per-share amounts, unaudited) | 2020 | | 2019 | | 2020 | | 2019 |
| Total operating revenue | $ | 2,987 | | | $ | 2,812 | | | $ | 5,777 | | | $ | 5,636 | |
| Purchased power and fuel | 1,068 | | | 1,135 | | | 1,996 | | | 2,140 | |
| Operation and maintenance | 762 | | | 595 | | | 1,643 | | | 1,477 | |
| | | | | | | |
| Wildfire Insurance Fund expense | 83 | | | — | | | 167 | | | — | |
| Depreciation and amortization | 489 | | | 321 | | | 973 | | | 801 | |
| Property and other taxes | 103 | | | 93 | | | 214 | | | 203 | |
| Impairment and other | (18) | | | 170 | | | (18) | | | 166 | |
| Other operating income | — | | | (2) | | | — | | | (3) | |
| Total operating expenses | 2,487 | | | 2,312 | | | 4,975 | | | 4,784 | |
| Operating income | 500 | | | 500 | | | 802 | | | 852 | |
| | | | | | | |
| Interest expense | (229) | | | (211) | | | (454) | | | (405) | |
| Other income | 81 | | | 55 | | | 133 | | | 93 | |
| Income before taxes | 352 | | | 344 | | | 481 | | | 540 | |
| Income tax expense (benefit) | 4 | | | (78) | | | (80) | | | (190) | |
| | | | | | | |
| | | | | | | |
| Net income | 348 | | | 422 | | | 561 | | | 730 | |
| Preferred and preference stock dividend requirements of SCE | 30 | | | 30 | | | 60 | | | 60 | |
| | | | | | | |
Net income attributable to Edison International common shareholders | $ | 318 | | | $ | 392 | | | $ | 501 | | | $ | 670 | |
| | | | | | | |
| | | | | | | |
| | | | | | | |
| | | | | | | |
| Basic earnings per share: | | | | | | | |
| Weighted average shares of common stock outstanding | 375 | | | 326 | | | 367 | | | 326 | |
| | | | | | | |
| | | | | | | |
Basic earnings per common share attributable to Edison International common shareholders: | $ | 0.85 | | | $ | 1.20 | | | $ | 1.37 | | | $ | 2.05 | |
Diluted earnings per share: | | | | | | | |
Weighted average shares of common stock outstanding, including effect of dilutive securities | 376 | | | 327 | | | 368 | | | 327 | |
| | | | | | | |
| | | | | | | |
Diluted earnings per common share attributable to Edison International common shareholders | $ | 0.85 | | | $ | 1.20 | | | $ | 1.36 | | | $ | 2.05 | |
| | | | | | | |
Edison International Reports Second Quarter and Year-to-Date 2020 Financial Results
Page 9 of 11
| | | | | | | | | | | |
| Consolidated Balance Sheets | Edison International | | |
| | | |
| (in millions, unaudited) | June 30,
2020 | | December 31, 2019 |
| ASSETS | | | |
| Cash and cash equivalents | $ | 524 | | | $ | 68 | |
Receivables, less allowances of $91 and $50 accounts at respective dates | 936 | | | 788 | |
| Accrued unbilled revenue | 629 | | | 488 | |
| Inventory | 382 | | | 364 | |
| Income tax receivables | 108 | | | 118 | |
| Prepaid expenses | 49 | | | 214 | |
| | | |
| Regulatory assets | 1,692 | | | 1,009 | |
| Wildfire Insurance Fund contributions | 323 | | | 323 | |
| Other current assets | 153 | | | 188 | |
| | | |
| Total current assets | 4,796 | | | 3,560 | |
| Nuclear decommissioning trusts | 4,566 | | | 4,562 | |
| Other investments | 84 | | | 64 | |
| Total investments | 4,650 | | | 4,626 | |
Utility property, plant and equipment, less accumulated depreciation and amortization of $10,371 and $9,958 at respective dates | 45,386 | | | 44,198 | |
Nonutility property, plant and equipment, less accumulated depreciation of $90 and $86 at respective dates | 167 | | | 87 | |
| Total property, plant and equipment | 45,553 | | | 44,285 | |
| | | |
| Regulatory assets | 6,528 | | | 6,088 | |
| Wildfire Insurance Fund contributions | 2,606 | | | 2,767 | |
| Operating lease right-of-use assets | 672 | | | 693 | |
| Other long-term assets | 2,246 | | | 2,363 | |
| Total long-term assets | 12,052 | | | 11,911 | |
| | | |
| | | |
| | | |
| | | |
| | | |
| | | |
| | | |
| | | |
| | | |
| | | |
| Total assets | $ | 67,051 | | | $ | 64,382 | |
Edison International Reports Second Quarter and Year-to-Date 2020 Financial Results
Page 10 of 11
| | | | | | | | | | | |
| Consolidated Balance Sheets | Edison International | | |
| | | |
| (in millions, except share amounts, unaudited) | June 30,
2020 | | December 31, 2019 |
| LIABILITIES AND EQUITY | | | |
| Short-term debt | $ | 475 | | | $ | 550 | |
| Current portion of long-term debt | 1,029 | | | 479 | |
| Accounts payable | 1,657 | | | 1,752 | |
| | | |
| Accrued interest | 312 | | | 261 | |
| Customer deposits | 281 | | | 302 | |
| | | |
| Regulatory liabilities | 857 | | | 972 | |
| Current portion of operating lease liabilities | 65 | | | 80 | |
| Other current liabilities | 1,223 | | | 1,127 | |
| | | |
| Total current liabilities | 5,899 | | | 5,523 | |
| Long-term debt | 19,238 | | | 17,864 | |
| Deferred income taxes and credits | 5,295 | | | 5,078 | |
| | | |
| Pensions and benefits | 656 | | | 674 | |
| Asset retirement obligations | 3,013 | | | 3,029 | |
| Regulatory liabilities | 8,395 | | | 8,385 | |
| Operating lease liabilities | 607 | | | 613 | |
| Wildfire-related claims | 4,561 | | | 4,568 | |
| Other deferred credits and other long-term liabilities | 2,941 | | | 3,152 | |
| Total deferred credits and other liabilities | 25,468 | | | 25,499 | |
| Total liabilities | 50,605 | | | 48,886 | |
| Commitments and contingencies | | | |
| | | |
Common stock, no par value (800,000,000 shares authorized; 378,207,496 and 361,985,133 shares issued and outstanding at respective dates) | 5,908 | | | 4,990 | |
| Accumulated other comprehensive loss | (65) | | | (69) | |
| Retained earnings | 8,410 | | | 8,382 | |
| Total Edison International's common shareholders' equity | 14,253 | | | 13,303 | |
| Noncontrolling interests – preferred and preference stock of SCE | 2,193 | | | 2,193 | |
| | | |
| Total equity | 16,446 | | | 15,496 | |
| | | |
| | | |
| | | |
| | | |
| Total liabilities and equity | $ | 67,051 | | | $ | 64,382 | |
Edison International Reports Second Quarter and Year-to-Date 2020 Financial Results
Page 11 of 11
| | | | | | | | | | | | | |
| Consolidated Statements of Cash Flows | Edison International | | | | |
| | | | | |
| | Six months ended June 30, | | | | |
| (in millions, unaudited) | 2020 | | 2019 | | |
| Cash flows from operating activities: | | | | | |
| Net income | $ | 561 | | | $ | 730 | | | |
| | | | | |
| | | | | |
| Adjustments to reconcile to net cash provided by operating activities: | | | | | |
| Depreciation and amortization | 1,005 | | | 837 | | | |
| Allowance for equity during construction | (51) | | | (49) | | | |
| Impairment and other | (18) | | | 166 | | | |
| Deferred income taxes | (58) | | | (182) | | | |
| Wildfire Insurance Fund amortization expense | 167 | | | — | | | |
| Other | 32 | | | 13 | | | |
| Nuclear decommissioning trusts | (62) | | | (72) | | | |
| | | | | |
| Changes in operating assets and liabilities: | | | | | |
| Receivables | (108) | | | (72) | | | |
| Inventory | (19) | | | (49) | | | |
| Accounts payable | 14 | | | 221 | | | |
| Tax receivables and payables | 31 | | | 65 | | | |
| Other current assets and liabilities | (23) | | | (423) | | | |
| | | | | |
| Regulatory assets and liabilities, net | (927) | | | (543) | | | |
| Wildfire-related insurance receivable | 73 | | | — | | | |
| | | | | |
| Other noncurrent assets and liabilities | 8 | | | (44) | | | |
| | | | | |
| | | | | |
| Net cash provided by operating activities | 625 | | | 598 | | | |
| Cash flows from financing activities: | | | | | |
Long-term debt issued, plus premium and net of discount and issuance costs of $26 and $(18) for the respective periods | 2,726 | | | 1,682 | | | |
| Long-term debt repaid or repurchased | (814) | | | (41) | | | |
| Term loan issued | 1,275 | | | 1,750 | | | |
| Term loan repaid | (800) | | | (750) | | | |
| Common stock issued | 884 | | | — | | | |
| | | | | |
| | | | | |
| Short-term debt financing, net | (550) | | | (509) | | | |
| Payments for stock-based compensation | (3) | | | (48) | | | |
| Receipts from stock option exercises | 14 | | | 25 | | | |
| Dividends and distribution to noncontrolling interests | (60) | | | (60) | | | |
| Dividends paid | (454) | | | (399) | | | |
| Other | 5 | | | 1 | | | |
| | | | | |
| | | | | |
| Net cash provided by financing activities | 2,223 | | | 1,651 | | | |
| Cash flows from investing activities: | | | | | |
| Capital expenditures | (2,514) | | | (2,235) | | | |
| Proceeds from sale of nuclear decommissioning trust investments | 3,225 | | | 2,440 | | | |
| Purchases of nuclear decommissioning trust investments | (3,163) | | | (2,368) | | | |
| | | | | |
| | | | | |
| Other | 60 | | | 27 | | | |
| | | | | |
| | | | | |
| Net cash used in investing activities | (2,392) | | | (2,136) | | | |
| | | | | |
| | | | | |
| Net increase in cash, cash equivalents and restricted cash | 456 | | | 113 | | | |
| Cash, cash equivalents and restricted cash at beginning of period | 70 | | | 152 | | | |
| Cash, cash equivalents and restricted cash at end of period | $ | 526 | | | $ | 265 | | | |
| | | | | |
| | | | | |
| | | | | |
| | | | | |
| | | | | |
Prepared Remarks of Edison International CEO and CFO
Second Quarter 2020 Earnings Teleconference
July 28, 2020, 1:30 p.m. (PST)
Pedro Pizarro, President and Chief Executive Officer, Edison International
Let me start by hoping that all of you listening today and your loved ones are staying safe and healthy as our world continues to work its way through COVID-19. Today, Edison International reported core earnings per share of $1.00 for the second quarter 2020, down 58 cents compared to the same period last year. The decline in year over year EPS was primarily due to higher O&M expenses, equity share dilution, and the true-up for the final 2018 GRC decision we recorded in the second quarter of last year. Consistent with recent quarters, results for this period were impacted by the timing of O&M spend and deferrals of certain wildfire-related expenses. However, the year-over-year EPS impact of wildfire-related expenses should improve in the second half and we remain confident in our outlook for the full year. Therefore, we are narrowing our 2020 EPS guidance range to $4.37 to $4.62 by raising our low end by 5 cents. Maria will discuss our financial performance in more detail in her report.
On the legislative front, we are pleased that the Governor and Legislature prioritized wildfire funding in the recently adopted budget, despite its projected $54 billion deficit due to the pandemic. The budget provides over $200 million in one-time and ongoing funding for community resiliency preparedness, additional firefighting personnel and equipment, and enhancement of the State’s emergency preparedness, response and coordination with State agencies, local governments and utilities. We are also encouraged by the State’s enhanced wildfire mitigation capabilities as we prepare for this year’s wildfire season. For instance, CAL FIRE reported that it completed all of the planned 35 emergency fuels management projects in May, making 90,000 acres safer ahead of wildfire season and protecting 200 vulnerable communities. Some of these projects were located in, or adjacent to, SCE service territory. CAL FIRE has also made substantial investments to support its firefighting capabilities, including the addition of C-130 airplanes and new helicopters with better night firefighting capabilities.
Turning to operations during this COVID-19 pandemic: SCE remains steadfast in focusing on practices aimed at the safety and health of employees and customers. Two thirds of our 13,000 employees continue to telework, and we recently moved our earliest reentry date for them from after Labor Day to the beginning of next year. Importantly, SCE also has a sharp focus on maintaining critical operations for customers’ benefit, including those laid out in SCE’s 2020-2022 Wildfire Mitigation Plan. This plan calls for SCE to continue to harden infrastructure, bolster situational awareness capabilities and improve operational practices, while implementing enhanced data analytics and technology. Since the beginning of the year, SCE has completed more than 330 miles of covered conductor, installed nearly 400 additional weather stations and completed over 135,000 ground-based inspections of our infrastructure in high fire risk areas. SCE is also making good progress in acquiring more high definition imagery, through a combination of helicopters and drones, to facilitate additional assessments that are not possible from the ground. The CPUC approved the 2020-2022 Wildfire Mitigation Plan on June 11th, paving the way for the renewal of SCE’s annual Safety Certification as the prerequisite for access to the Wildfire Fund.
Looking ahead, we anticipate another active fire season, mainly driven by lower-than-expected precipitation and very dry conditions across California. However, SCE is entering the more active fire period better prepared than ever. In addition to advancing wildfire mitigation measures, the company has made improvements to Public Safety Power Shutoff, or PSPS, protocols since last year. While the use of PSPS is largely dependent on temperature, wind and fuel conditions, with the improvements that SCE has made since last year, we would expect to see a 30% reduction in the number of customers affected by PSPS events under the same conditions as last year. Our preparedness includes pre-established switching playbooks for each of our approximately 1,100 circuits that traverse high fire risk areas, enabling a more surgical approach to isolate the smallest portion of the circuit possible for a given weather condition. It also includes many facets of our customer care program such as providing generator rebates for customers in our high fire risk area and battery backup systems for qualified critical care customers. We continue to focus on minimizing customer impacts, but PSPS will remain a tool to mitigate the risk of a catastrophic wildfire.
Among key wildfire-related proceedings at the CPUC, SCE submitted its 2020 safety certification request on June 19th, outlining how the company meets safety culture and conduct requirements, including implementing our approved Wildfire Mitigation Plan and linking executive compensation to safety. The CPUC has 90 days to act on SCE’s request; until then, the initial safety certification we received last July will remain in effect.
On the legal front, I would like to give you an update on the 2017/2018 Wildfire/Mudslide events. SCE announced an agreement last November to settle claims with 23 public entities. Since that time, the utility has continued to explore settlement opportunities with numerous individual plaintiffs. During the quarter, SCE reached confidential settlement agreements with some of these plaintiffs, and they represent the first individual claims that the company has settled in the 2017/2018 Wildfire/Mudslide cases. There are thousands of similar individual claims against SCE, and the utility is committed to exploring settlements with all reasonable parties who wish to do so. The Court has set January 12th, 2021 as the start of the Thomas Fire bellwether trial, but this may be further impacted by COVID-19. The court vacated the July 2020 bellwether trial date for the Woolsey Fire and has yet to set a new date.
I would now like to briefly discuss how sustainability is central to our vision for leading the transformation of the electric power industry. Our vision aligns with California’s COVID-19 recovery efforts, as the State is working to help Californians recover as fast as safely possible from the COVID-19-induced recession and to shape an equitable, green and prosperous future. Our recently published 2019 sustainability report highlights Edison International’s progress towards meeting our long-term goals. They include delivering 100% carbon-free power to SCE customers by 2045, expanding infrastructure in SCE’s service area to support increased vehicle electrification and electrifying SCE’s own fleet, including 100% of light duty vehicles by 2030. I would note that at the end of 2019, 51% of the electricity that SCE delivered came from carbon-free resources.
We also remain focused on advancing our clean energy and electrification strategy. In May, SCE announced 770 megawatts of energy storage procurement, one of the largest in the
nation which will help enhance electric system local reliability needs. Also, last month, SCE, in partnership with other utilities, published the West Coast Clean Transit Corridor Initiative study, looking at infrastructure needs to serve medium- and heavy-duty electric trucks. Additionally, we were pleased that the California Air Resources Board furthered the state’s commitment to electrification by adopting the nation’s first zero-emission, electric truck rule. Maria will comment on the initial proposed decision issued yesterday in SCE’s Charge Ready 2 proceeding.
Let me conclude by saying that California’s commitment to the 2030 and 2045 climate change goals can play a critical role in a just and equitable economic recovery. Investments in clean energy and electrification can address climate change and also lower greenhouse gases affordably for all California communities. At Edison International, we are committed to enabling the State’s efforts to achieve its objective of a clean energy economy.
Maria Rigatti, Executive Vice President and Chief Financial Officer, Edison International
Edison International reported core earnings of $1.00 per share for the second quarter 2020, a decrease of 58 cents per share from the same period last year. This decline was primarily due to higher O&M expenses, equity share dilution, and the true-up for the final 2018 GRC decision we recorded in the second quarter of last year. As Pedro had mentioned, we expect the year-over-year EPS impact of wildfire-related expenses to improve in the second half and we are narrowing our full year 2020 EPS guidance by raising the low end of the range.
On page 2, you can see SCE’s key EPS drivers on the right-hand side. I would like to highlight four items that negatively impacted the variance.
First, EPS declined by 20 cents due to the 2018 true-up recorded in the second quarter of 2019 upon receipt of the final GRC decision. Second, O&M had a negative variance of 24 cents, including from increased expenses that are offset by revenue due to balancing account treatment, as well as the timing of deferrals related to both wildfire mitigation expenses and COVID-19 related costs.
The variance related to wildfire mitigation expenses is due to the timing of regulatory deferrals for vegetation management and inspection and preventative maintenance costs. For the quarter, the negative variance from wildfire mitigation expenses was 6 cents per share. During the quarter, certain wildfire-related expenses reached the total amount authorized in the GRC and we began to defer incremental costs through approved memorandum accounts. We will begin to defer other categories of costs in the third quarter when these exceed the GRC authorized levels. Therefore, wildfire-related expenses will be less of a driver of year-over-year variances in the second half.
O&M expenses were also negatively impacted by the timing of customer uncollectibles, labor and other expenses resulting from the COVID-19 pandemic and SCE's response to it. As we have noted previously, there are tracking accounts for COVID-related expenses. Since some of these expenses are similar to costs authorized in the GRC, for example uncollectibles, we must reach full-year GRC authorized levels before we begin to defer them. The EPS impact in the quarter for these items until they reached the authorized levels was 6 cents. However, for the full year, we do not expect an earnings impact due to COVID-related expenses. As for deferrals, through June 30th, we have recorded $49 million in two COVID-related memo accounts.
Third, depreciation and amortization negatively impacted EPS by 13 cents. This was primarily due to changes in Q1 2019 depreciation rates that were recorded in the second quarter last year following the GRC decision as well as higher plant. Finally, EPS in the quarter was lower by 17 cents because of dilution from the increase in shares outstanding.
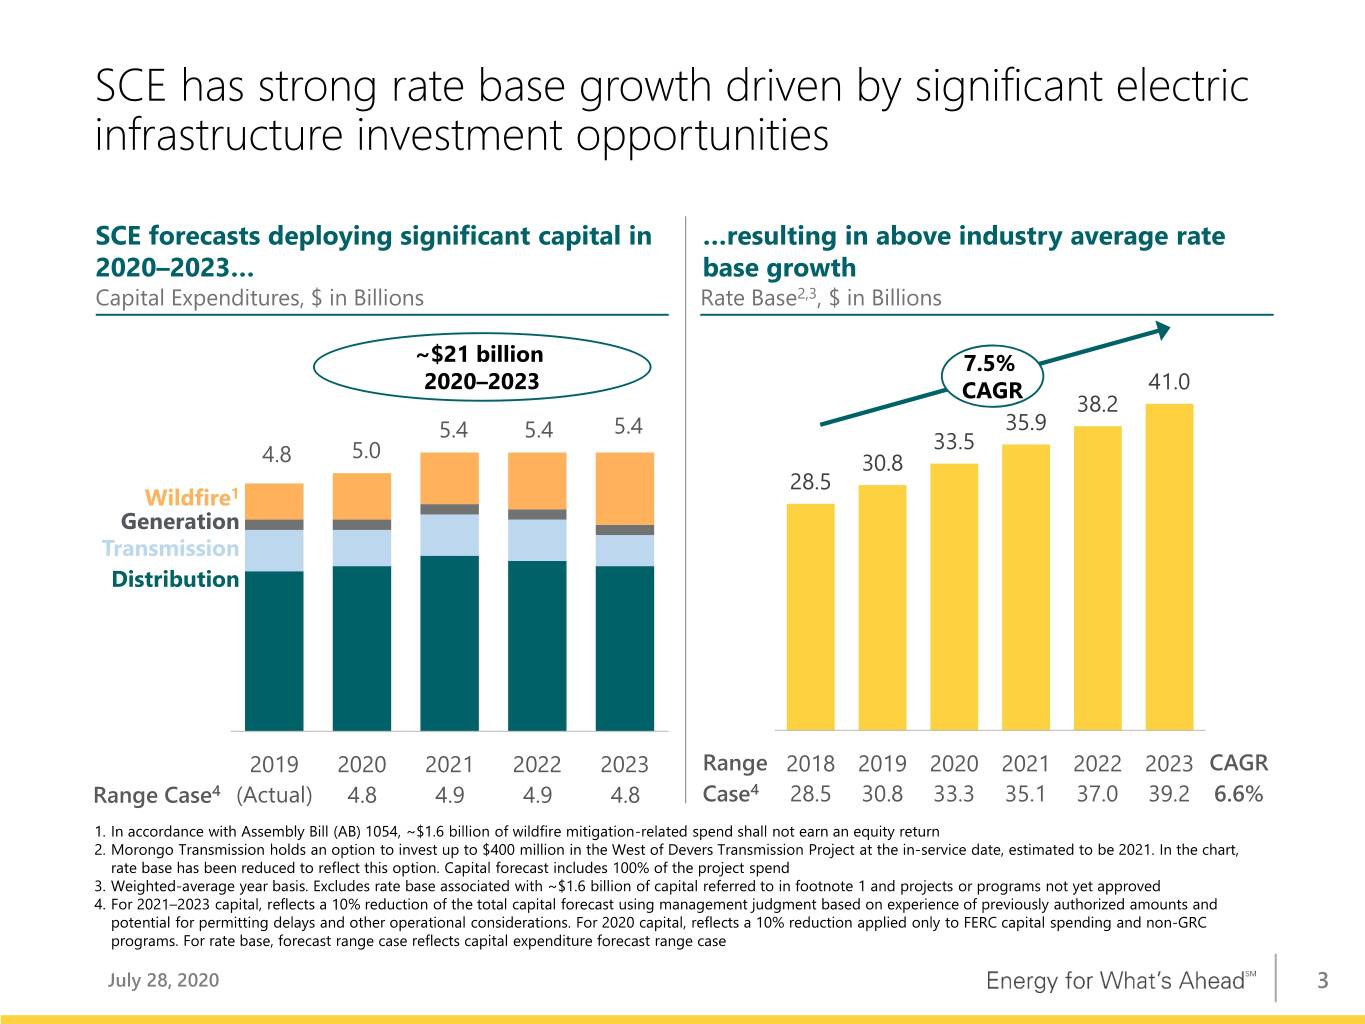
On page 3 you will find SCE’s capital expenditure and rate base forecast. We have a robust capital program of $19.4 to $21.2 billion, which includes SCE’s revised capital request reflected in the 2021 GRC rebuttal testimony. Based on the capital expenditure levels requested in the 2021 GRC, total weighted-average CPUC- and FERC-jurisdictional rate base will increase to $41 billion by 2023. This request level represents a compound annual growth rate of 7.5% over two rate case periods. Applying a 10% reduction to the total capital forecast, to reflect our experience of previously authorized amounts and other operational considerations, results in
compound annual rate base growth of 6.6%. As we have done in the past, projects and programs that have not yet been approved by the CPUC, such as Charge Ready 2, are not included in the rate base forecast. Yesterday evening, we received a proposed decision in the Charge Ready 2 proceeding. The PD would authorize a total program budget of $442 million, including a capital budget of $314 million. It is expected to be voted on at the Commission’s August 27 business meeting.
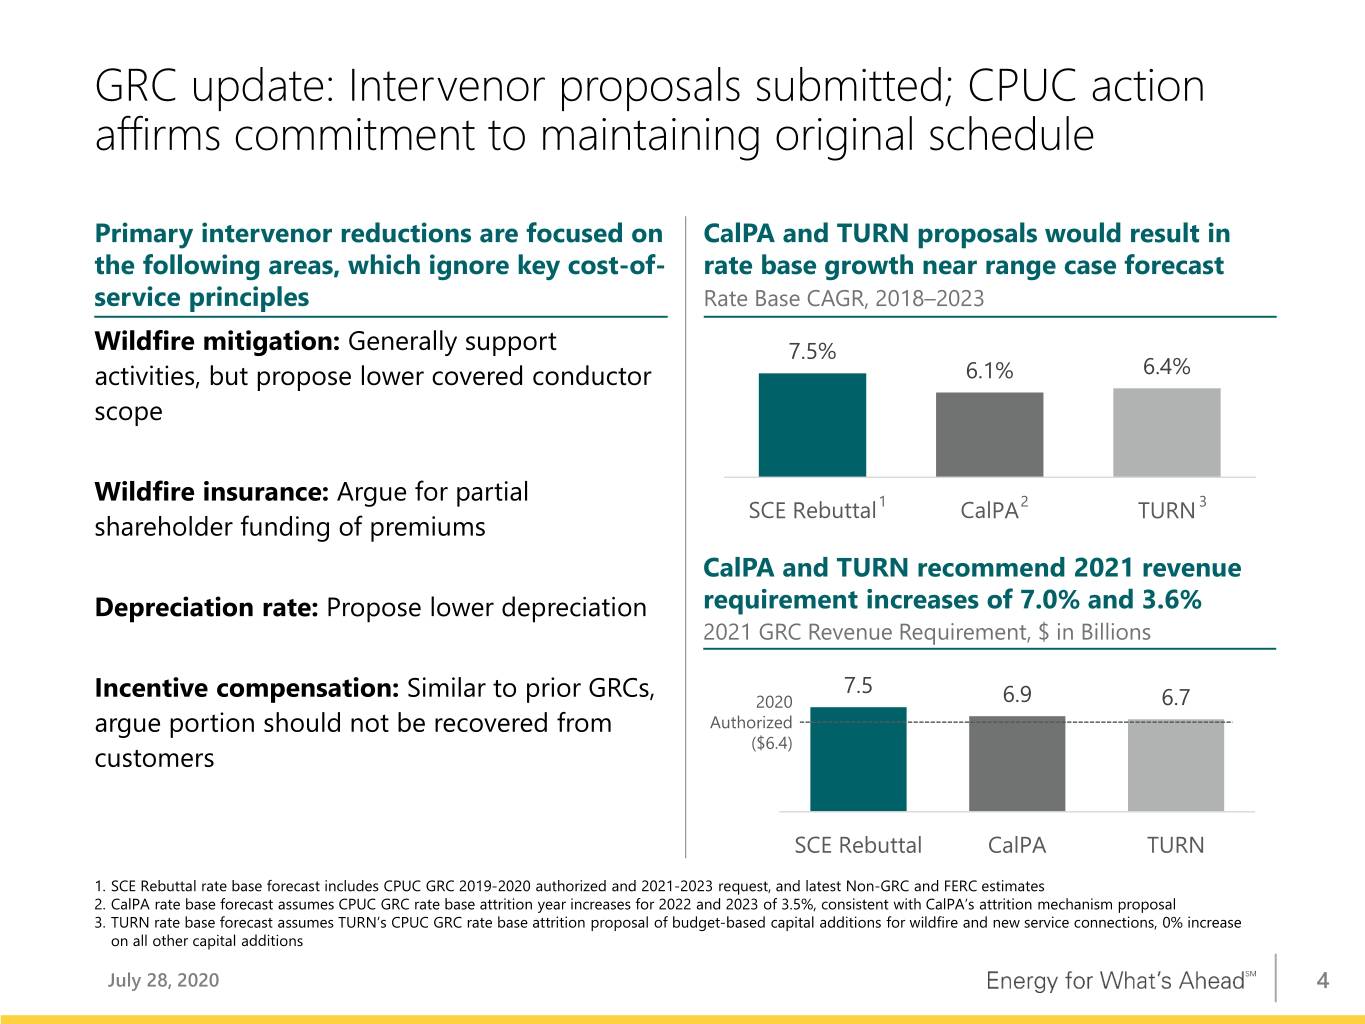
Please turn to page 4 for an update on the 2021 GRC. During the quarter, SCE filed its rebuttal testimony focusing on a number of the intervenors’ recommendations, including their positions on reductions to the covered conductor program and depreciation. While the magnitude of the revenue increase is higher than prior GRCs, we continue to underscore that our request is necessary to make the longer-term investments required to deliver safe, reliable, affordable, and increasingly clean electricity for more than 15 million Californians. As for next steps in the GRC, evidentiary hearings were completed on July 22nd and briefs and oral arguments are scheduled for the Fall. We are encouraged that the CPUC has kept this proceeding on schedule even while working remotely during the COVID-19 pandemic. The CPUC is expected to issue a final decision for Track 1 in Q1 2021.
I would now like to update you on other key financial topics. Please turn to page 5.
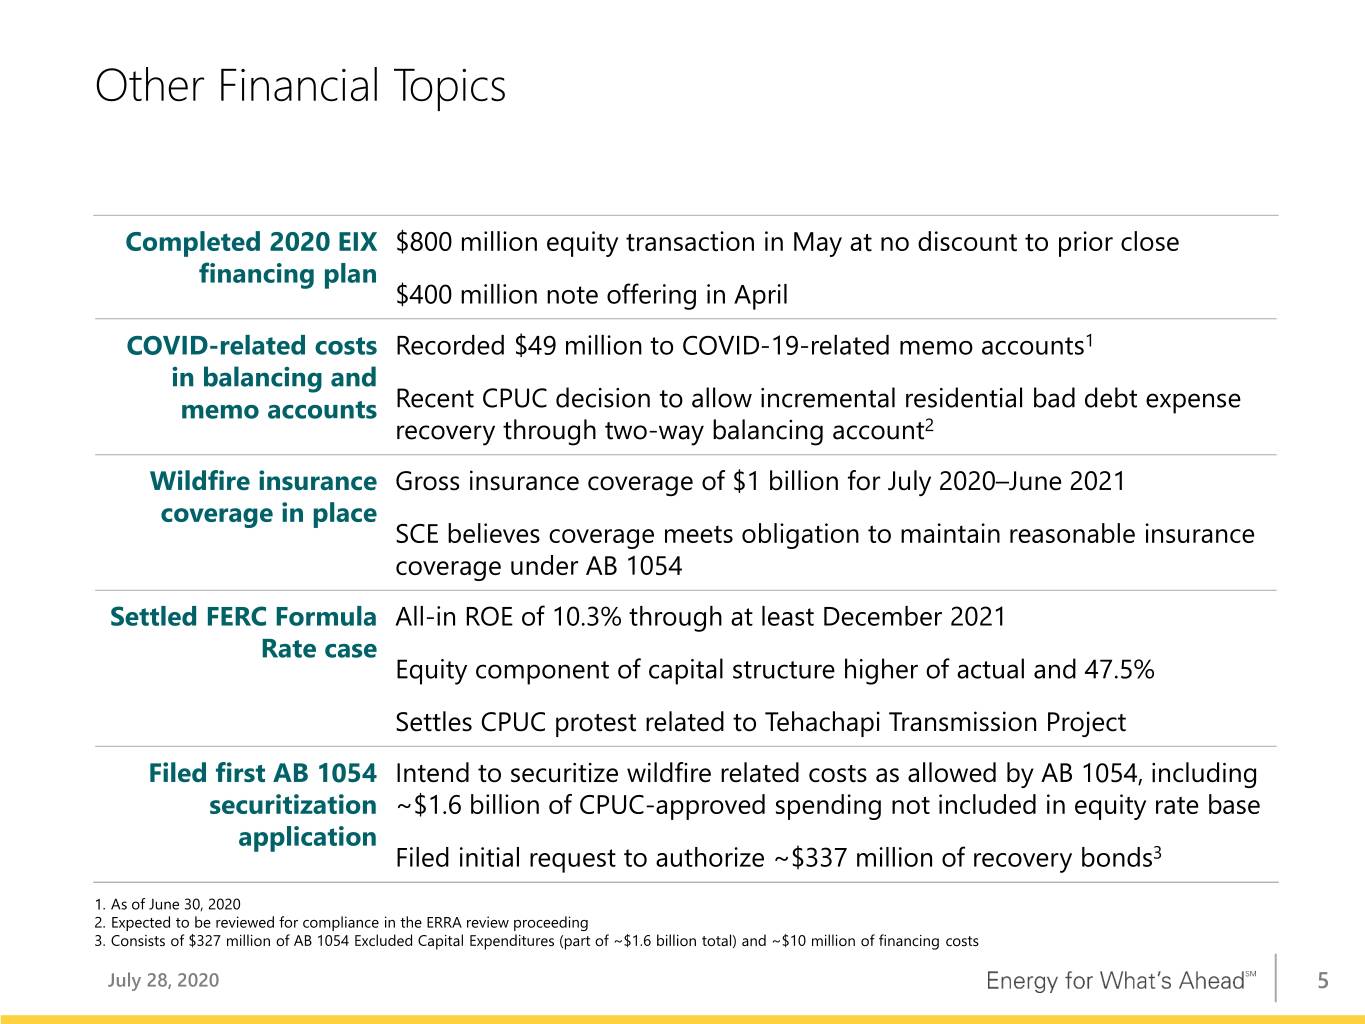
First, we completed our 2020 EIX financing plan in May with the direct placement of $800 million of equity with several existing long-term investors. We have minimal equity needs to fund our ongoing capital expenditures program beyond 2020. As noted previously, this is also predicated on timely cost recovery of the requested memorandum accounts and the current level of liabilities reflected on our balance sheet for the 2017 and 2018 wildfire and mudslide events.
Turning to wildfire insurance coverage, we have secured $1 billion of gross insurance coverage from July 2020 to June 2021, which is $870 million net of self- and co-insurance. You will recall that we had net coverage of about $1 billion for the previous policy year. The insurance market continues to be tight and based on the cost of insurance premiums, the $1 billion gross coverage optimizes risk mitigation and cost to customers. We believe that this
insurance coverage meets the requirements of AB 1054. Based on policies currently in effect, the wildfire insurance expense in 2020 is approximately $450 million.
Moving to our 2019 FERC Formula Rate case, SCE filed a settlement on its formula rates in June. If approved by FERC, this settlement will provide SCE with an all-in ROE of 10.3% and an equity layer that is the higher of actual and 47.5%. SCE can file a new rate case beginning in January 2022.
Lastly, earlier this month we filed an application with the CPUC to allow SCE to securitize $337 million of wildfire-related capital expenditures. AB 1054 allows us to securitize wildfire-related costs including $1.6 billion of CPUC-approved wildfire mitigation capital spending, which can’t be included in the equity portion of SCE’s rate base. This application requests authority to securitize a portion of the recently approved Grid Safety and Resiliency Program spending. The bonds will be repaid from a dedicated rate component.
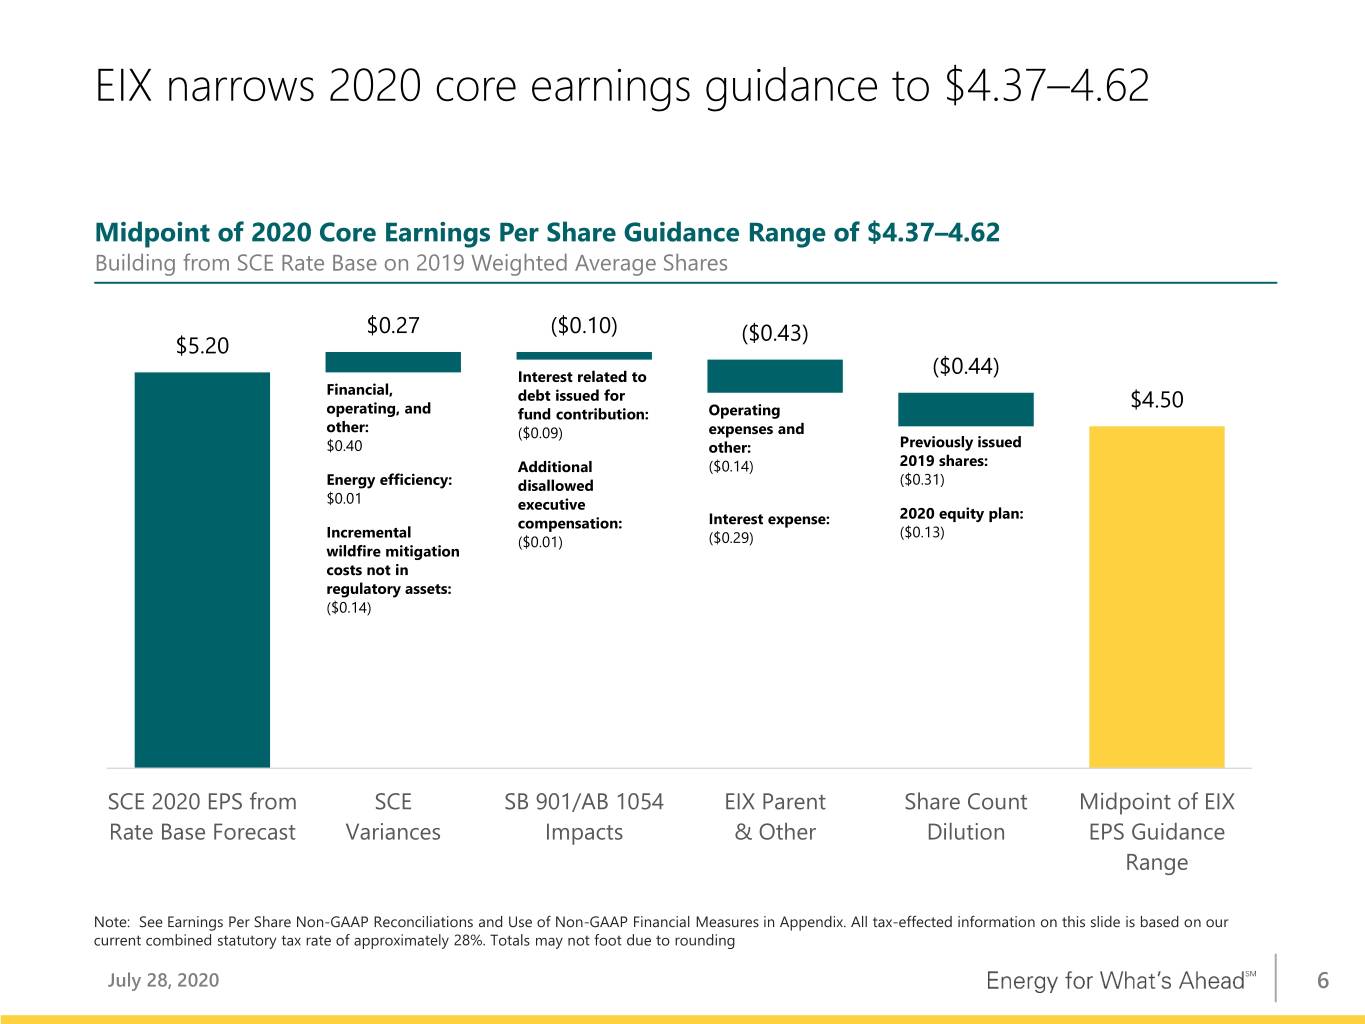
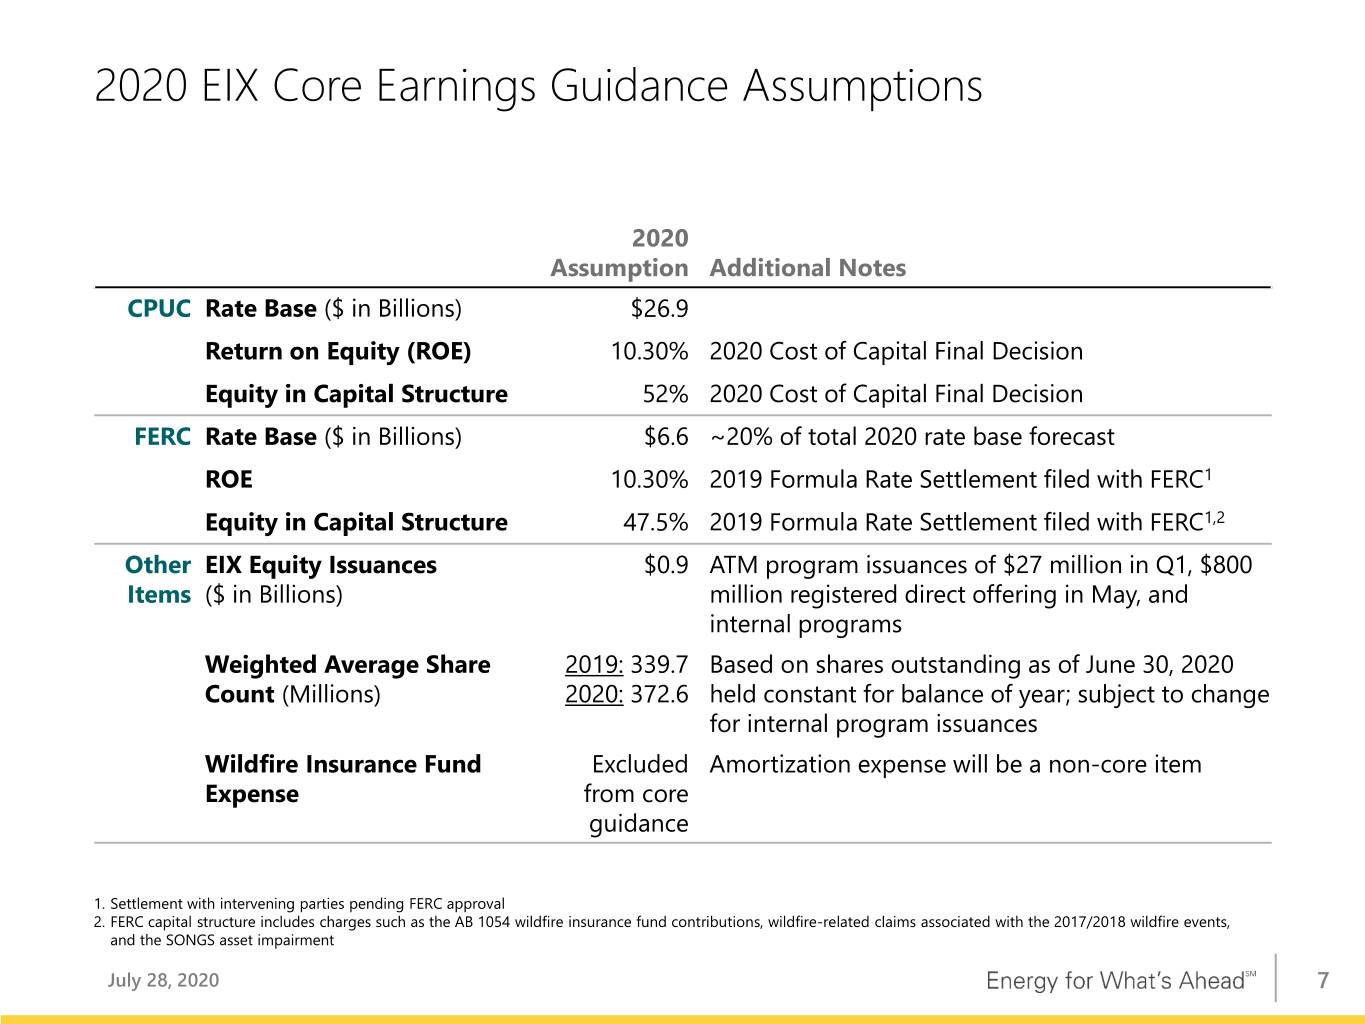
Pages 6 and 7 show our 2020 guidance and the key assumptions for modeling purposes. I’ll start by highlighting that we are narrowing the EPS guidance range to $4.37 to $4.62 per share by raising the low end of the range. This also increases the midpoint of the EPS range to $4.50.
There are several variables driving this positive revision. Let’s begin with SCE’s rate base earnings. We now expect the rate base EPS outlook to be 3 cents higher as a result of our 2019 FERC Formula Rate case settlement, and the resolution of a tax-related regulatory proceeding. Building on this, we are also now forecasting a net contribution of 27 cents from SCE operating and financial variances. This is 7 cents higher than our previous estimate. This increase is influenced by the timing of SCE’s financing activities as well as a number of other operational items. As you look at the next three bars on the chart, you will note that some of the EPS increases I just described are offset by higher costs at EIX Parent and Other, primarily from increased interest expense, and dilution from outstanding share count. We now forecast the combined EPS drag from these two items to be 7 cents higher than our previous estimate and this is primarily related to the completion of the EIX financing plan earlier in the year than originally
anticipated. Taking all of these variables into consideration, the net impact of these changes, combined with the outlook for our business with another quarter behind us in this COVID-19 environment, gives us confidence in our narrowed 2020 EPS guidance range of $4.37 to $4.62 per share.