0000827052false0000092103false2021-11-028-Kfalsefalsefalsefalse0000827052eix:SoutherncaliforniaedisoncompanyMember2021-11-022021-11-0200008270522021-11-022021-11-02

UNITED STATES

SECURITIES AND EXCHANGE COMMISSION

Washington, D.C. 20549

FORM 8-K

CURRENT REPORT

Pursuant to Section 13 or 15(d) of the Securities Exchange Act of 1934

Date of Report (Date of earliest event reported): November 2, 2021

Commission
File Number


Exact Name of Registrant
as specified in its charter


State or Other Jurisdiction of
Incorporation or Organization


IRS Employer
Identification Number

1-9936

EDISON INTERNATIONAL

California

95-4137452

1-2313

SOUTHERN CALIFORNIA EDISON COMPANY

California

95-1240335

Graphic

Graphic

2244 Walnut Grove Avenue

2244 Walnut Grove Avenue

(P.O. Box 976)

(P.O. Box 800)

Rosemead,

California

91770

Rosemead,

California

91770

(Address of principal executive offices)

(Address of principal executive offices)

(626) 302-2222

(626) 302-1212

(Registrant's telephone number, including area code)

(Registrant's telephone number, including area code)

Check the appropriate box below if the Form 8-K filing is intended to simultaneously satisfy the filing obligation of the registrant under any of the following provisions:

[ ] Written communications pursuant to Rule 425 under the Securities Act (17 CFR 230.425)

[ ] Soliciting material pursuant to Rule 14a-12 under the Exchange Act (17 CFR 240.14a-12)

[ ] Pre-commencement communications pursuant to Rule 14d-2(b) under the Exchange Act (17 CFR 240.14d-2(b))

[ ] Pre-commencement communications pursuant to Rule 13e-4(c) under the Exchange Act (17 CFR 240.13e-4(c))

Securities registered pursuant to Section 12(b) of the Act:

Edison International:

Title of each class

Trading Symbol(s)

Name of each exchange on which registered

Common Stock, no par value

EIX

NYSE

LLC

Southern California Edison Company: None

Indicate by check mark whether the registrant is an emerging growth company as defined in Rule 405 of the Securities Act of 1933 (§230.405 of this chapter) or Rule 12b-2 of the Securities Exchange Act of 1934 (§240.12b-2 of this chapter).

Emerging growth company

Edison International

Emerging growth company

Southern California Edison Company

If an emerging growth company, indicate by check mark if the registrant has elected not to use the extended transition period for complying with any new or revised financial accounting standards provided pursuant to Section 13(a) of the Exchange Act.

Edison International

Southern California Edison Company

This current report and its exhibits include forward-looking statements. Edison International and Southern California Edison Company ("SCE") based these forward-looking statements on their current expectations and projections about future events in light of their knowledge of facts as of the date of this current report and their assumptions about future circumstances. These forward-looking statements are subject to various risks and uncertainties that may be outside the control of Edison International and SCE. Edison International and SCE have no obligation to publicly update or revise any forward-looking statements, whether due to new information, future events, or otherwise. This current report should be read with Edison International's and SCE's combined Annual Report on Form 10-K for the year ended December 31, 2020 and subsequent Quarterly Reports on Form 10-Q. Additionally, Edison International and SCE provide direct links to EIX and SCE presentations, documents and other information at www.edisoninvestor.com (Presentations) in order to publicly disseminate such information.

Item  2.02Results of Operations and Financial Condition

On November 2, 2021, Edison International issued a press release reporting its financial results and the financial results for its subsidiary, Southern California Edison Company, for the quarter ended September 30, 2021. A copy of the press release is attached as Exhibit 99.1. The frequently asked questions document referenced in the press release is attached as Exhibit 99.2.

Also on November 2, 2021, members of Edison International's management will speak to investors via a financial teleconference. Senior management's prepared remarks and accompanying presentation are attached as Exhibit 99.3 and Exhibit 99.4 to this report.

The information furnished in this Item 2.02 and Exhibits 99.1, 99.2, 99.3, and 99.4 shall not be deemed to be “filed” for purposes of the Securities Exchange Act of 1934, nor shall it be deemed to be incorporated by reference in any filing under the Securities Act of 1933.

Item  7.01Regulation FD Disclosure

Members of Edison International management will use the information in the presentation furnished as Exhibit 99.4 to this report in meetings with institutional investors and analysts and at investor conferences. The attached presentation will also be posted on www.edisoninvestor.com.

Item  9.01Financial Statements and Exhibits

(d)

Exhibits

EXHIBIT INDEX


Exhibit No.


Description

99.1

Edison International Press Release dated November 2, 2021

99.2

FAQ Regarding Revised Best Estimate of Expected Losses Associated with the 2017/2018 Wildfire/Mudslide Events and SED Agreement

99.3

Edison International Q3 2021 Financial Results Conference Call Prepared Remarks dated November 2, 2021

99.4

Edison International Q3 2021 Financial Results Conference Call Presentation dated November 2, 2021

104

Cover Page Interactive Data File (embedded within the Inline XBRL document)

SIGNATURES

Pursuant to the requirements of the Securities Exchange Act of 1934, the registrants have duly caused this report to be signed on its behalf by the undersigned hereunto duly authorized.

EDISON INTERNATIONAL

(Registrant)

/s/ Aaron D. Moss

Aaron D. Moss

Vice President and Controller

Date: November 2, 2021

SOUTHERN CALIFORNIA EDISON COMPANY

(Registrant)

/s/ Kate Sturgess

Kate Sturgess

Vice President and Controller

Date: November 2, 2021

Exhibit 99.1

Graphic

NEWS

FOR IMMEDIATE RELEASE

Investor Relations: Sam Ramraj, (626) 302-2540

Media Contact: Jeff Monford, (626) 476-8120

Edison International Reports Third Quarter 2021 Results

Third Quarter 2021 GAAP loss per share of $0.90; Core EPS of $1.69
EIX and SCE revise best estimate of total potential losses from 2017/2018 Wildfire/Mudslide Events to $7.5 billion; $5.3 billion has been resolved and $2.2 billion remains to be resolved
SCE executes agreement with CPUC Safety and Enforcement Division (SED) to resolve enforcement actions related to the 2017/2018 Wildfire/Mudslide Events
EIX narrows 2021 EPS guidance to $4.42–4.52. Also reiterates long-term EPS growth rate target of 5–7%

ROSEMEAD, Calif., November 2, 2021 — Edison International (NYSE: EIX) today reported third quarter 2021 net loss of $341 million, or $0.90 per share, compared to net loss of $288 million, or $0.76 per share, in the third quarter of 2020. As adjusted, third quarter 2021 core earnings were $644 million, or $1.69 per share, compared to core earnings of $632 million, or $1.67 per share, in the third quarter of 2020.

Southern California Edison’s (SCE) third quarter 2021 core earnings per share increased year-over-year primarily due to higher revenue from the 2021 General Rate Case (GRC) final decision and higher Federal Energy Regulatory Commission revenue, partially offset by increased wildfire mitigation expenses due to the timing of regulatory deferrals in the third quarter of 2020.

In August 2021, the California Public Utilities Commission (CPUC) approved a final decision on track 1 of the 2021 GRC. The revenue requirements in the 2021 GRC final decision are retroactive to January 1, 2021. SCE recorded the prior period impact of the 2021 GRC final decision in the third quarter of 2021, which increased core EPS by $0.35.

SCE's non-core loss during the quarter was primarily attributable to a pre-tax charge of $1.2 billion recorded for 2017/2018 Wildfire/Mudslide Events claims and expenses, net of expected recoveries from FERC customers.

This charge is described further below and for additional information, the company also provided a frequently asked questions (FAQ) document, which can be accessed here.

Edison International Parent and Other's third quarter 2021 loss per share increased year-over-year primarily due to higher preferred dividends as a result of a preferred equity issuance in 2021.

“SCE continues to make solid progress in the execution of its Wildfire Mitigation Plan, including the installation of 2,500 miles of covered conductor to date. These ongoing mitigation actions combined with the PSPS Action Plan strengthen our confidence in SCE’s overall improved risk profile with respect to wildfires,” said Pedro J. Pizarro, president and CEO of Edison International. “Considering physical mitigation measures, operational practices, and the use of PSPS, SCE estimates that it has reduced the probability of losses from catastrophic wildfires by 55 to 65%, relative to pre-2018 levels.”

Pizarro added, “Ensuring reliability is essential to the transition to a clean energy economy. Looking forward to summer 2022, SCE’s recently announced 535 MW utility-owned storage investment is a material increase in capacity to mitigate the risk of statewide customer outages caused by extreme weather events and continued drought conditions.”


Edison International Reports Third Quarter 2021 Financial Results

Page 2 of 11

Edison International uses core earnings, which is a non-GAAP financial measure that adjusts for significant discrete items that management does not consider representative of ongoing earnings. Edison International management believes that core earnings provide more meaningful comparisons of performance from period to period. Please see the attached tables for a reconciliation of core earnings to basic GAAP earnings.

2017/2018 Wildfire/Mudslide Events Update

In October 2021, SCE and the SED executed an agreement (the “SED Agreement”), subject to CPUC approval, to resolve the SED’s investigations into the 2017/2018 Wildfire/Mudslide Events and three other 2017 wildfires for, among other things, aggregate costs of $550 million. The $550 million in costs is comprised of a $110 million fine to be paid to the State of California General Fund, $65 million of shareholder-funded safety measures, and an agreement by SCE to waive its right to seek cost recovery in CPUC-jurisdictional rates for $375 million of third-party uninsured claims payments. The SED Agreement also imposes other obligations on SCE, including reporting requirements and safety-focused studies. In the SED Agreement, SCE did not admit imprudence, negligence or liability with respect to the 2017/2018 Wildfire/Mudslide Events or the three other 2017 wildfires.

During the quarter, EIX and SCE increased the estimated losses for the 2017/2018 Wildfire Mudslide Events by $1.3 billion, reflecting the review of information obtained as a result of achieving key milestones in the litigation process, including settlement activity to date. The estimated losses for the 2017/2018 Wildfire/Mudslide Events as of September 30, 2021, reflect the impact of the SED Agreement. After giving effect to all settlements entered into through September 30, 2021, Edison International and SCE's best estimate of expected losses for remaining alleged and potential claims related to the 2017/2018 Wildfire/Mudslide Events was $2.2 billion.

This settlement and revised best estimate of potential losses do not change EIX’s previous disclosed 2021 financing plan. Edison International continues to anticipate issuing securities with up to $1 billion of equity content to support its investment grade credit ratings.

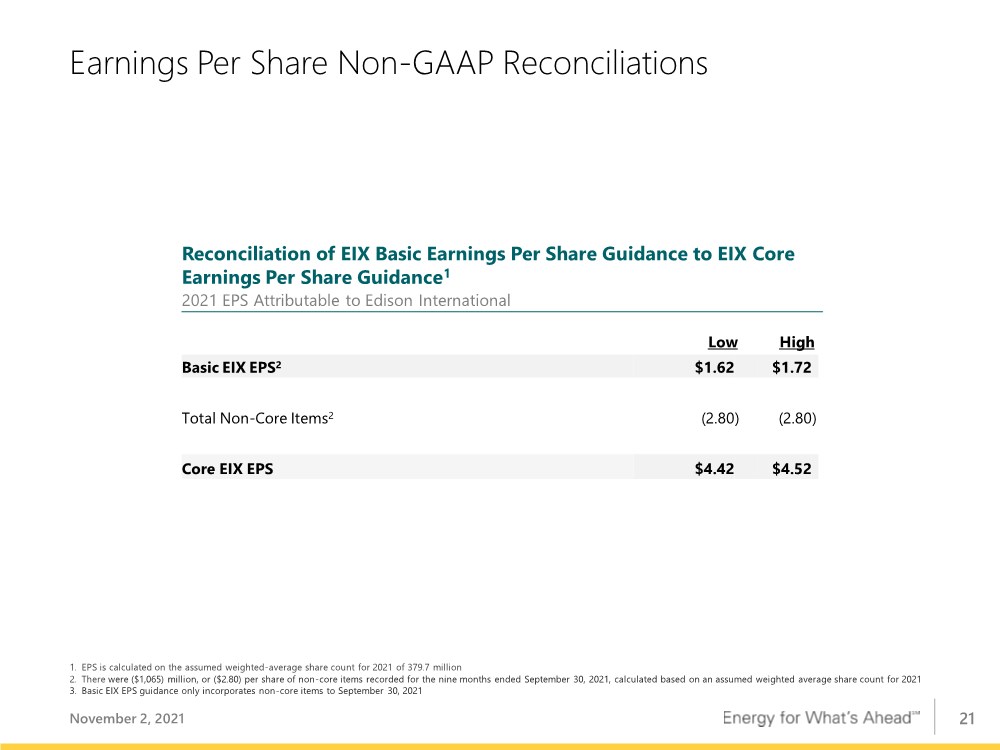
2021 Earnings Guidance

The company narrowed its earnings guidance range for 2021 as summarized in the following chart. See the presentation accompanying the company’s conference call for further information.

2021 Earnings Guidance

2021 Earnings Guidance

as of September 16, 2021

as of November 2, 2021


Low


High


Low


High

EIX Basic EPS

$

4.21

$

4.41

$

1.62

$

1.72

Less: Non-core Items*


(0.21)


(0.21)


(2.80)


(2.80)

EIX Core EPS

$

4.42

$

4.62

$

4.42

$

4.52

* There were $(1.07) billion, or $(2.80) per share of non-core items recorded for the nine months ended September 30, 2021, calculated based on an assumed weighted average share count for 2021. Basic EIX EPS guidance only incorporates non-core items to September 30, 2021.

Third Quarter 2021 Earnings Conference Call and Webcast Details

When:

Tuesday, November 2, 2021, 1:30 p.m. (Pacific Time)

Telephone Numbers:

1-888-673-9780 (US) and 1-312-470-0178 (Int'l) - Passcode: Edison

Telephone Replay:

1-866-429-9466 (US) and 1-203-369-0920 (Int’l) - Passcode: 6891

Telephone replay available through November 16, 2021

Webcast:

www.edisoninvestor.com


Edison International Reports Third Quarter 2021 Financial Results

Page 3 of 11

Edison International has posted its earnings conference call prepared remarks by the CEO and CFO, the teleconference presentation, and Form 10-Q to the company's investor relations website. These materials are available at www.edisoninvestor.com.

About Edison International

Edison International (NYSE: EIX) is one of the nation’s largest electric utility holding companies, providing clean and reliable energy and energy services through its independent companies. Headquartered in Rosemead, California, Edison International is the parent company of Southern California Edison Company, a utility that delivers electricity to 15 million people across Southern, Central and Coastal California. Edison International is also the parent company of Edison Energy, a global energy advisory company delivering comprehensive, data-driven energy solutions to commercial and industrial users to meet their cost, sustainability and risk goals.


Edison International Reports Third Quarter 2021 Financial Results

Page 4 of 11

Appendix

Use of Non-GAAP Financial Measures

Edison International’s earnings are prepared in accordance with generally accepted accounting principles used in the United States and represent the company’s earnings as reported to the Securities and Exchange Commission. Our management uses core earnings and core earnings per share (EPS) internally for financial planning and for analysis of performance of Edison International and Southern California Edison. We also use core earnings and core EPS when communicating with analysts and investors regarding our earnings results to facilitate comparisons of the Company’s performance from period to period. Financial measures referred to as net income, basic EPS, core earnings, or core EPS also apply to the description of earnings or earnings per share.

Core earnings and core EPS are non-GAAP financial measures and may not be comparable to those of other companies. Core earnings and core EPS are defined as basic earnings and basic EPS excluding income or loss from discontinued operations and income or loss from significant discrete items that management does not consider representative of ongoing earnings. Basic earnings and losses refer to net income or losses attributable to Edison International shareholders. Core earnings are reconciled to basic earnings in the attached tables. The impact of participating securities (vested awards that earn dividend equivalents that may participate in undistributed earnings with common stock) for the principal operating subsidiary is not material to the principal operating subsidiary’s EPS and is therefore reflected in the results of the Edison International holding company, which is included in Edison International Parent and Other.

Safe Harbor Statement

Statements contained in this presentation about future performance, including, without limitation, operating results, capital expenditures, rate base growth, dividend policy, financial outlook, and other statements that are not purely historical, are forward-looking statements. These forward-looking statements reflect our current expectations; however, such statements involve risks and uncertainties. Actual results could differ materially from current expectations. These forward-looking statements represent our expectations only as of the date of this presentation, and Edison International assumes no duty to update them to reflect new information, events or circumstances. Important factors that could cause different results include, but are not limited to the:

ability of SCE to recover its costs through regulated rates, including uninsured wildfire-related and debris flow-related costs, costs incurred to mitigate the risk of utility equipment causing future wildfires, costs incurred to implement SCE's new customer service system and costs incurred as a result of the COVID-19 pandemic;
ability of SCE to implement its Wildfire Mitigation Plan and capital program;
risks of regulatory or legislative restrictions that would limit SCE’s ability to implement Public Safety Power Shutoff (“PSPS”) when conditions warrant or would otherwise limit SCE’s operational PSPS practices;
risks associated with implementing PSPS, including regulatory fines and penalties, claims for damages and reputational harm;
ability of SCE to maintain a valid safety certification;
ability to obtain sufficient insurance at a reasonable cost, including insurance relating to SCE's nuclear facilities and wildfire-related claims, and to recover the costs of such insurance or, in the event liabilities exceed insured amounts, the ability to recover uninsured losses from customers or other parties;
extreme weather-related incidents (including events caused, or exacerbated, by climate change, such as wildfires, debris flows, droughts, high wind events and extreme heat events) and other natural disasters (such as earthquakes), which could cause, among other things, public safety issues, property damage, operational issues (such as rotating outages and issues due to damaged infrastructure), PSPS activations and unanticipated costs;
risk that California Assembly Bill 1054 (“AB 1054”) does not effectively mitigate the significant exposure faced by California investor-owned utilities related to liability for damages arising from catastrophic wildfires where utility facilities are alleged to be a substantial cause, including the longevity of the Wildfire Insurance Fund and


Edison International Reports Third Quarter 2021 Financial Results

Page 5 of 11

the CPUC's interpretation of and actions under AB 1054, including its interpretation of the prudency standard established under AB 1054;
ability of SCE to effectively attract, manage, develop and retain a skilled workforce, including its contract workers;
decisions and other actions by the California Public Utilities Commission, the Federal Energy Regulatory Commission, the Nuclear Regulatory Commission and other governmental authorities, including decisions and actions related to nationwide or statewide crisis, determinations of authorized rates of return or return on equity, the recoverability of wildfire-related and debris flow-related costs, issuance of SCE's wildfire safety certification, wildfire mitigation efforts, and delays in executive, regulatory and legislative actions;
ability of Edison International or SCE to borrow funds and access bank and capital markets on reasonable terms;
risks associated with the decommissioning of San Onofre, including those related to worker and public safety, public opposition, permitting, governmental approvals, on-site storage of spent nuclear fuel, delays, contractual disputes, and cost overruns;
pandemics, such as COVID-19, and other events that cause regional, statewide, national or global disruption, which could impact, among other things, Edison International's and SCE's business, operations, cash flows, liquidity and/or financial results and cause Edison International and SCE to incur unanticipated costs;
physical security of Edison International's and SCE's critical assets and personnel and the cybersecurity of Edison International's and SCE's critical information technology systems for grid control, and business, employee and customer data;
risks associated with cost allocation resulting in higher rates for utility bundled service customers because of possible customer bypass or departure for other electricity providers such as Community Choice Aggregators (“CCA,” which are cities, counties, and certain other public agencies with the authority to generate and/or purchase electricity for their local residents and businesses) and Electric Service Providers (entities that offer electric power and ancillary services to retail customers, other than electrical corporations (like SCE) and CCAs);
risks inherent in SCE's capital investment program, including those related to project site identification, public opposition, environmental mitigation, construction, permitting, power curtailment costs (payments due under power contracts in the event there is insufficient transmission to enable acceptance of power delivery), changes in the California Independent System Operator’s transmission plans, and governmental approvals; and
risks associated with the operation of electrical facilities, including worker and public safety issues, the risk of utility assets causing or contributing to wildfires, failure, availability, efficiency, and output of equipment and facilities, and availability and cost of spare parts.

Additional information about risks and uncertainties, including more detail about the factors described in this report, is contained throughout this report and in the 2020 Form 10-K, including the "Risk Factors" section. Readers are urged to read this entire report, including information incorporated by reference, as well as the 2020 Form 10-K, and carefully consider the risks, uncertainties, and other factors that affect Edison International's and SCE's businesses. Edison International and SCE post or provide direct links (i) to certain SCE and other parties' regulatory filings and documents with the CPUC and the FERC and certain agency rulings and notices in open proceedings in a section titled "SCE Regulatory Highlights," (ii) to certain documents and information related to Southern California wildfires which may be of interest to investors in a section titled "Southern California Wildfires," and (iii) to presentations, documents and other information that may be of interest to investors in a section title "Presentations" at www.edisoninvestor.com in order to publicly disseminate such information.

These forward-looking statements represent our expectations only as of the date of this news release, and Edison International assumes no duty to update them to reflect new information, events or circumstances. Readers should review future reports filed by Edison International and SCE with the SEC.


Edison International Reports Third Quarter 2021 Financial Results

Page 6 of 11

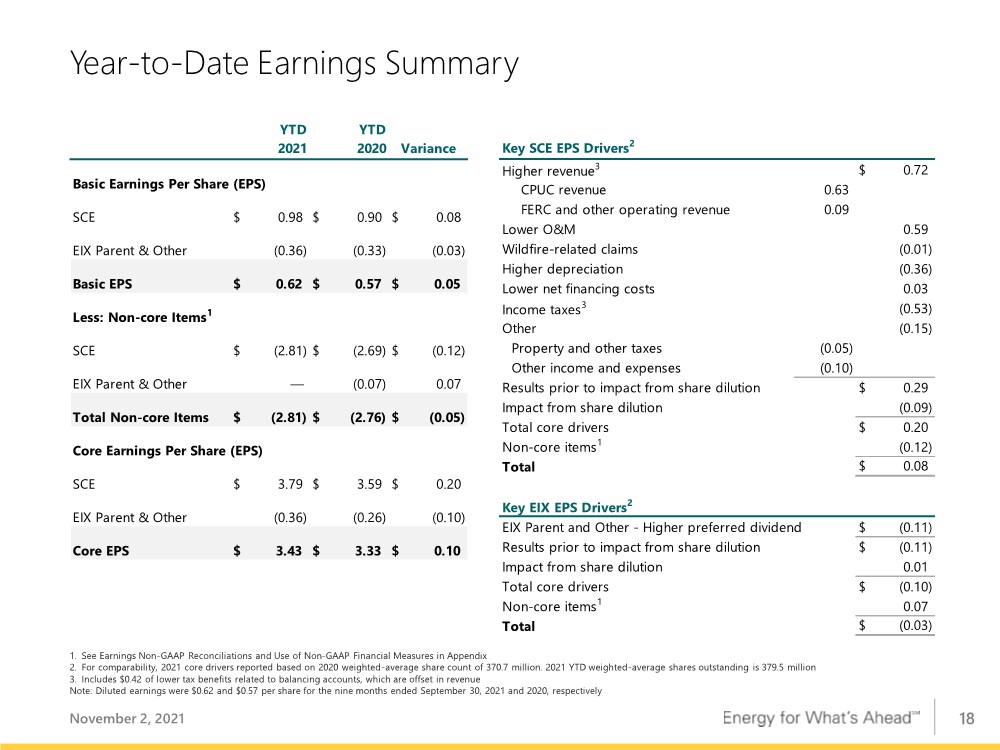
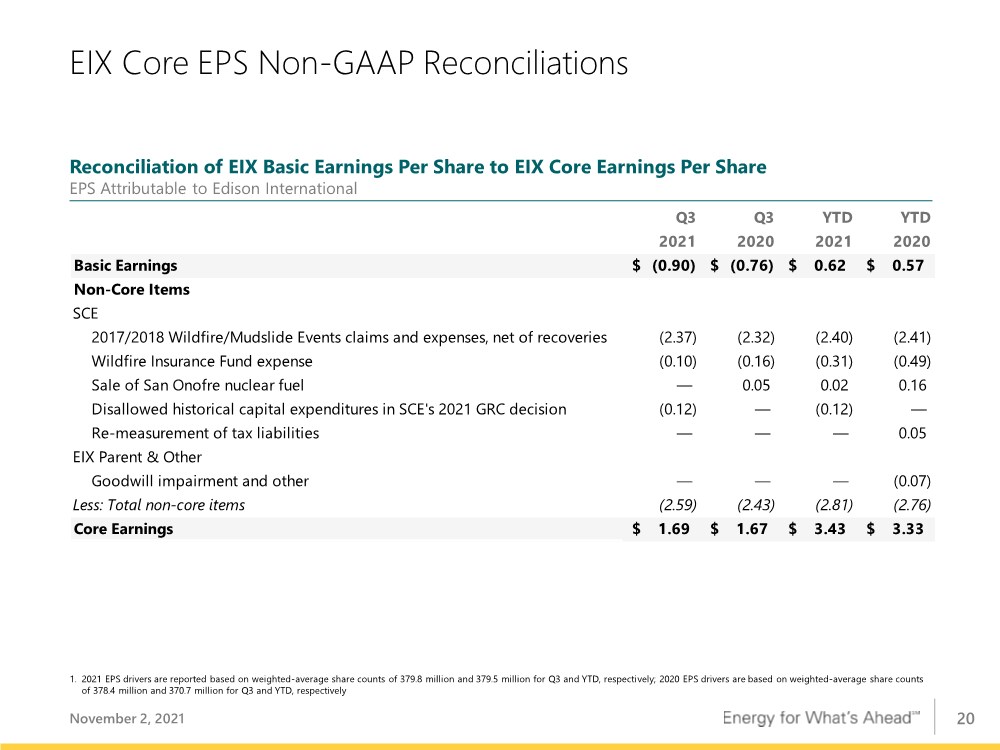
Third Quarter Reconciliation of Basic Earnings Per Share to Core Earnings Per Share

Three months ended

Nine months ended

September 30, 

September 30, 


2021


2020


Change


2021


2020


Change

(Loss) earnings per share attributable to Edison International


Continuing operations


SCE

$

(0.75)

$

(0.70)

$

(0.05)

$

0.98

$

0.90

$

0.08

Edison International Parent and Other


(0.15)


(0.06)


(0.09)


(0.36)


(0.33)


(0.03)

Edison International


(0.90)


(0.76)


(0.14)


0.62


0.57


0.05

Less: Non-core items


SCE


(2.59)


(2.43)


(0.16)


(2.81)


(2.69)


(0.12)

Edison International Parent and Other


(0.07)


0.07

Total non-core items


(2.59)


(2.43)


(0.16)


(2.81)


(2.76)


(0.05)

Core earnings (losses)


SCE


1.84


1.73


0.11


3.79


3.59


0.20

Edison International Parent and Other


(0.15)


(0.06)


(0.09)


(0.36)


(0.26)


(0.10)

Edison International

$

1.69

$

1.67

$

0.02

$

3.43

$

3.33

$

0.10

Note: Diluted (loss) earnings were $(0.90) and $(0.76) per share for the three months ended September 30, 2021 and 2020, respectively, and $0.62 and $0.57 per share for the nine months ended September 30, 2021 and 2020, respectively.

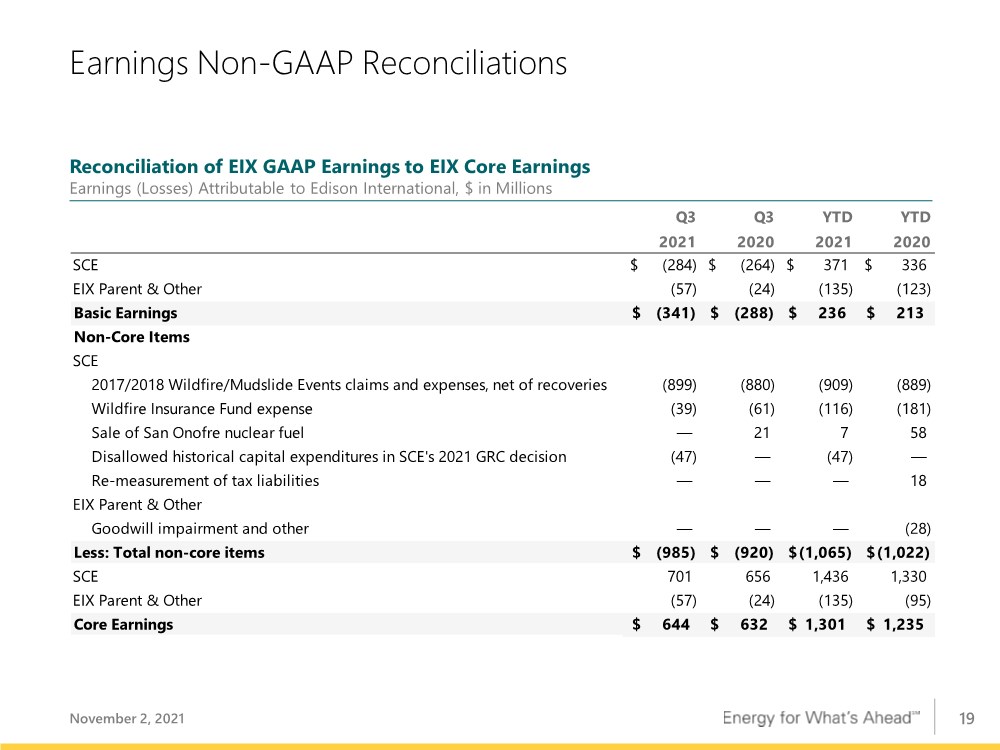
Third Quarter Reconciliation of Basic Earnings Per Share to Core Earnings (in millions)

Three months ended

Nine months ended

September 30, 

September 30, 

(in millions)


2021


2020


Change


2021


2020


Change

Net (loss) income attributable to Edison International


Continuing operations


SCE

$

(284)

$

(264)

$

(20)

$

371

$

336

$

35

Edison International Parent and Other


(57)


(24)


(33)


(135)


(123)


(12)

Edison International


(341)


(288)


(53)


236


213


23

Less: Non-core items


SCE1,2,3,4,5


(985)


(920)


(65)


(1,065)


(994)


(71)

Edison International Parent and Other3


(28)


28

Total non-core items


(985)


(920)


(65)


(1,065)


(1,022)


(43)

Core earnings (losses)


SCE


701


656


45


1,436


1,330


106

Edison International Parent and Other


(57)


(24)


(33)


(135)


(95)


(40)

Edison International

$

644

$

632

$

12

$

1,301

$

1,235

$

66

1

Includes charges of $54 million ($39 million after-tax) and $161 million ($116 million after-tax) for the quarter and year-ended September 30, 2021, respectively, and $85 million ($61 million after-tax) and $252 million ($181 million after-tax) for the quarter and year-ended September 30, 2020, respectively, from the amortization of SCE's contributions to the Wildfire Insurance Fund.

2

Includes charges of $1.2 billion ($899 million after-tax) and $1.2 billion ($909 million after-tax) for the quarter and year-ended September 30, 2021, respectively, and $1.2 billion ($880 million after-tax) and $1.2 billion ($889 million after-tax) for the quarter and year-ended September 30, 2020, respectively, for SCE's 2017/2018 Wildfire/Mudslide Events claims and expenses, net of recoveries.

3

Includes income tax benefit of $18 million and income tax expense of $3 million recorded in the first quarter of 2020 for SCE and Edison International Parent and Other, respectively, due to re-measurement of uncertain tax positions related to the 2010 – 2012 California state tax filings currently under audit.

4

Includes gains of $10 million ($7 million after-tax) recorded in the second quarter of 2021, and $28 million ($21 million after-tax) and $80 million ($58 million after-tax) for the quarter and year-ended September 30, 2020, respectively, for SCE's sale of San Onofre nuclear fuel.


Edison International Reports Third Quarter 2021 Financial Results

Page 7 of 11

5

Includes an impairment charge of $79 million ($47 million after-tax) recorded in the third quarter of 2021 related to disallowed historical capital expenditures in SCE's 2021 GRC final decision.


Edison International Reports Third Quarter 2021 Financial Results

Page 8 of 11

Consolidated Statements of Income

Edison International

Three months ended

Nine months ended

September 30, 

September 30, 

(in millions, except per-share amounts, unaudited)


2021


2020


2021


2020

Total operating revenue

$

5,299

$

4,644

$

11,574

$

10,421

Purchased power and fuel


2,088


1,817


4,384


3,813

Operation and maintenance


1,222


1,248


2,817


2,885

Wildfire-related claims, net of insurance recoveries


1,273


1,297


1,276


1,303

Wildfire Insurance Fund expense


54


85


161


252

Depreciation and amortization


599


490


1,657


1,463

Property and other taxes


113


114


356


328

Impairment and other expense (income)


78


(28)


67


(46)

Total operating expenses


5,427


5,023


10,718


9,998

Operating (loss) income


(128)


(379)


856


423

Interest expense


(245)


(222)


(694)


(676)

Other income


47


84


195


217

(Loss) income before income taxes


(326)


(517)


357


(36)

Income tax (benefit) expense


(29)


(275)


3


(355)

Net (loss) income


(297)


(242)


354


319

Preferred and preference stock dividend requirements of SCE


27


46


80


106

Preferred stock dividend requirement of Edison International


17

38

Net (loss) income attributable to Edison International common shareholders

$

(341)

$

(288)

$

236

$

213

Basic (loss) earnings per share:


Weighted average shares of common stock outstanding


380


378


380


371

Basic (loss) earnings per common share attributable to Edison International common shareholders

$

(0.90)

$

(0.76)

$

0.62

$

0.57

Diluted (loss) earnings per share:


Weighted average shares of common stock outstanding, including effect of dilutive securities


380


378


380


372

Diluted (loss) earnings per common share attributable to Edison International common shareholders

$

(0.90)

$

(0.76)

$

0.62

$

0.57


Edison International Reports Third Quarter 2021 Financial Results

Page 9 of 11

Consolidated Balance Sheets

Edison International

September 30, 

December 31, 

(in millions, unaudited)

2021

2020

ASSETS


Cash and cash equivalents

$

524

$

87

Receivables, less allowances of $245 and $188 for uncollectible accounts at respective dates


1,612


1,130

Accrued unbilled revenue


1,122


521

Insurance receivable


708

Income tax receivables


68

Inventory


412


405

Prepaid expenses


327


281

Regulatory assets


1,553


1,314

Wildfire Insurance Fund contributions


204


323

Other current assets


274


224

Total current assets


6,028


5,061

Nuclear decommissioning trusts


4,769


4,833

Marketable securities

13

Other investments


35


53

Total investments


4,817


4,886

Utility property, plant and equipment, less accumulated depreciation and amortization of $11,093 and $10,681 at respective dates


49,561


47,653

Nonutility property, plant and equipment, less accumulated depreciation of $98 and $94 at respective dates


193


186

Total property, plant and equipment


49,754


47,839

Receivables, less allowances of $93 uncollectible accounts at September 30, 2021

106

Regulatory assets (includes $329 at September 30, 2021 related to Variable Interest Entities "VIEs")


7,386


7,120

Wildfire Insurance Fund contributions


2,410


2,443

Operating lease right-of-use assets


1,532


1,088

Long-term insurance receivable

76

75

Other long-term assets


914


860

Total long-term assets


12,424


11,586

Total assets

$

73,023

$

69,372


Edison International Reports Third Quarter 2021 Financial Results

Page 10 of 11

Consolidated Balance Sheets

Edison International


September 30, 


December 31, 

(in millions, except share amounts, unaudited)

2021

2020

LIABILITIES AND EQUITY


Short-term debt

$

3,042

$

2,398

Current portion of long-term debt


776


1,029

Accounts payable


2,039


1,980

Wildfire-related claims


84


2,231

Customer deposits


200


243

Regulatory liabilities


583


569

Current portion of operating lease liabilities


355


215

Other current liabilities


1,883


1,612

Total current liabilities


8,962


10,277

Long-term debt (Includes $320 at September 30, 2021 related to VIEs)


23,342


19,632

Deferred income taxes and credits


5,524


5,368

Pensions and benefits


531


563

Asset retirement obligations


2,739


2,930

Regulatory liabilities


8,584


8,589

Operating lease liabilities


1,177


873

Wildfire-related claims


2,308


2,281

Other deferred credits and other long-term liabilities


3,114


2,910

Total deferred credits and other liabilities


23,977


23,514

Total liabilities


56,281


53,423

Commitments and contingencies


Preferred stock (50,000,000 shares authorized; 1,250,000 shares issued and outstanding at September 30, 2021)

1,235

Common stock, no par value (800,000,000 shares authorized; 379,887,286 and 378,907,147 shares issued and outstanding at respective dates)


6,033


5,962

Accumulated other comprehensive loss


(63)


(69)

Retained earnings


7,636


8,155

Total Edison International's shareholders' equity


14,841


14,048

Noncontrolling interests – preference stock of SCE


1,901


1,901

Total equity


16,742


15,949

Total liabilities and equity

$

73,023

$

69,372


Edison International Reports Third Quarter 2021 Financial Results

Page 11 of 11

Consolidated Statements of Cash Flows

Edison International

Nine months ended September 30, 

(in millions, unaudited)


2021


2020

Cash flows from operating activities:


Net income

$

354

$

319

Adjustments to reconcile to net cash provided by operating activities:


Depreciation and amortization


1,709


1,512

Allowance for equity during construction


(92)


(87)

Impairment and other expense (income)


67


(46)

Deferred income taxes


(1)


(344)

Wildfire Insurance Fund amortization expense


161


252

Other


34


31

Nuclear decommissioning trusts


(204)


(123)

Proceeds from Morongo Transmission LLC

400

Changes in operating assets and liabilities:


Receivables


(706)


(556)

Inventory


(10)


(24)

Accounts payable


282


7

Tax receivables and payables


204


197

Other current assets and liabilities


(716)


(311)

Regulatory assets and liabilities, net


(484)


(1,074)

Wildfire-related insurance receivable


707


73

Wildfire-related claims


(2,120)


1,267

Other noncurrent assets and liabilities


(1)


(22)

Net cash (used in) provided by operating activities


(416)


1,071

Cash flows from financing activities:


Long-term debt issued, plus premium and net of discount and issuance costs of $(40) and $26 for the respective periods


4,798


2,726

Long-term debt repaid


(1,031)


(1,098)

Short-term debt borrowed


2,105


1,929

Short-term debt repaid


(1,355)


(800)

Common stock issued


28


896

Preferred stock issued, net


1,235


Preferred and preference stock redeemed

(308)

Commercial paper (repayment) borrowing, net


(435)


73

Dividends and distribution to noncontrolling interests


(85)


(97)

Common stock dividends paid


(741)


(691)

Preferred stock dividends paid

(35)

Other


22


17

Net cash provided by financing activities


4,506


2,647

Cash flows from investing activities:


Capital expenditures


(3,948)


(3,897)

Proceeds from sale of nuclear decommissioning trust investments


3,218


4,754

Purchases of nuclear decommissioning trust investments


(3,014)


(4,631)

Other


90


80

Net cash used in investing activities


(3,654)


(3,694)

Net increase in cash, cash equivalents and restricted cash


436


24

Cash, cash equivalents and restricted cash at beginning of period


89


70

Cash, cash equivalents and restricted cash at end of period

$

525

$

94


Exhibit 99.2

Frequently Asked Questions Regarding

Revised Best Estimate of Expected Losses Associated with the 2017/2018 Wildfire/Mudslide Events and the SED Agreement

1.How do you reconcile this charge with the cumulative charge through the end of Q2?

Cumulative Income Statement Impacts

($ in Millions)

June 30, 2021

Sept 30, 2021

Difference (3Q21 Charge)

Cumulative charge for wildfire-related claims

6,198

7,463

1,265

Total expected insurance recoveries

(2,000

)

(2,000

)

Cumulative expected revenue from FERC customers

(233

)

(300

)

(67

)

Total cumulative pre-tax charge

3,965

5,163

1,198

Cumulative income tax benefit

(1,109

)

(1,413

)

(304

)

Total cumulative after-tax charge

2,856

3,750

894

The following table represents the changes in accrued estimated losses for the 2017/2018 Wildfire/Mudslide Events that will be recorded: 

(in millions)  


Total accrued estimated losses at June 30, 2021 

$  

1,531

Amounts paid under settlements executed through June 30, 2021 


(141

)

Estimated losses at June 30, 2021 

$

1,390

Increase in accrued estimated losses to reflect best estimate  


1,265

Amounts paid or agreed to be paid under settlements executed between June 30, 2021, and September 30, 2021


(483

)

Best estimate of expected losses for remaining alleged and potential claims at September 30, 20211

$

2,172

1.After giving effect to approximately $84 million in fixed payments due under settlements executed before September 30, 2021, but not paid at September 30, 2021, which are reflected as current liabilities on the balance sheet as of September 30, 2021.

2.What incremental information did SCE obtain from the ongoing settlement process that caused this revision to the estimated liability? Also, can you say whether most of the increase relates to Thomas and Koenigstein Fires, and Montecito Mudslides (TKM) or Woolsey?
The factors considered when adjusting the reserve include, among others, claims information from individual plaintiffs, and remaining public entities across these

events, and updated experience and information regarding settlements of these and other wildfire events.
As SCE moved further along the litigation/settlement paths, SCE gained additional information that was helpful in refining the best estimate.
As a result of the settlement protocols in both Woolsey and TKM, the settlement process increased in pace and provided significant experience with different types of claims.
We are not breaking down the components of the estimates. The estimates for all outstanding losses were adjusted based, in part, on the settlements accomplished in both Woolsey and TKM.

3.Can you provide additional information about the scope of the SED Agreement?
The SED Agreement, and all financial obligations under the agreement, globally resolve SED’s investigations into SCE’s conduct associated with the 2017 Thomas Fire (including the Anlauf ignition, Koenigstein ignition, and debris flow), the 2018 Woolsey Fire, and three other 2017 fires (Liberty, Rye and Meyers).
The SED Agreement is for aggregate costs of $550 million:
$110 million fine to be paid to the State of California General Fund
$65 million of shareholder-funded safety measures
$375 million disallowance resulting from SCE’s agreement to permanently waive its right to seek cost recovery of this amount in CPUC-jurisdictional rates for third-party uninsured claims payments

4.SCE was not alleged to be criminally liable in the TKM and Woolsey wildfires. What is the basis for the enforcement action?
The Safety and Enforcement Division of the CPUC is charged with enforcing compliance with relevant laws and the CPUC’s rules, orders, and decisions. SED is also responsible for investigating utility incidents, including fires, and can recommend fines and penalties to the CPUC through enforcement actions if SED concludes, based on its investigation, that the utility violated relevant rules or regulations.
Here, SCE is voluntarily agreeing to pay a fine and implement other remedies as part of a settlement in lieu of SED pursuing other enforcement activities.
The CPUC’s regulation and enforcement of its orders are separate from actions that could theoretically be brought by state or federal authorities alleging criminal conduct beyond a reasonable doubt. The California Attorney General's Office has

2


completed its investigation of the Thomas Fire and the Woolsey Fire without pursuing criminal charges.

5.What are the next steps? When can the CPUC vote on the agreement? What happens if they deny it?
Upon issuance of a Draft Resolution to which the SED Agreement will be attached, the CPUC will allow for public comment. No vote on the Draft Resolution can occur within 30 days of issuance.
The CPUC’s Enforcement Policy permits the CPUC to approve, deny, or modify the SED Agreement. If the CPUC denies approval, the Draft Resolution will be withdrawn and the SED Agreement will be terminated. SCE and SED could attempt to renegotiate another agreement, but if they are unable to reach consensus, the CPUC may then initiate an OII where the SED can propose penalties and potentially other remedies.
If an Alternate Draft Resolution is issued that proposes modifications to the SED Agreement, then SCE and SED are obligated to use their best efforts to actively oppose the modifications. Should either SCE or SED be unwilling to accept any proposed modification(s), either party may terminate the SED Agreement and seek to render the Alternate Draft Resolution moot.

6.How do you expect to fund this incremental liability? Does any of this have to be funded with additional equity issuance?
We continue to manage our financing plan to support our investment grade credit ratings.
For the current charge, we do not require additional equity content. After considering the impacts of the increased charge, we are still focused on our previously disclosed up to $1 billion of equity content for 2021.
The payments of the claims themselves will be financed with debt issued by SCE.

###

3


Exhibit 99.3

Prepared Remarks of Edison International CEO and CFO

Third Quarter 2021 Earnings Teleconference

November 2, 2021, 1:30 p.m. (PT)

Pedro Pizarro, President and Chief Executive Officer, Edison International

Before I comment on the quarter, let me note the senior leadership changes we announced last week. Kevin Payne, SCE’s president and CEO, plans to retire on December 1, after 35 years with the company. Kevin has had a profound impact at the utility, most particularly with his customer-centric focus, leading our wildfire risk mitigation efforts, and advocating for and advancing the company’s clean energy strategy. While I am going to miss my good friend very much, I am delighted with our deep bench: Steve Powell will succeed Kevin as president and CEO. Jill Anderson, currently SVP of Customer Service, will succeed Steve as EVP of Operations. Promoting SCE talent will ensure a seamless transition, and I believe that Steve and Jill bring exceptional experience to their new roles. Many of you will have an opportunity to meet Steve and Jill next week at EEI’s financial conference.

Today, Edison International reported core earnings per share of $1.69 compared to $1.67 a year ago. This comparison is not meaningful because during the quarter SCE recorded a true-up for the final decision in track 1 of its 2021 General Rate Case, which is retroactive to January 1. Reflecting the year-to-date performance and our outlook for the remainder of the year, we are narrowing our 2021 EPS guidance range to $4.42 to $4.52. We are also reiterating our longer-term EPS growth target of 5 to 7% through 2025. Maria will discuss our financial performance in detail in her report.

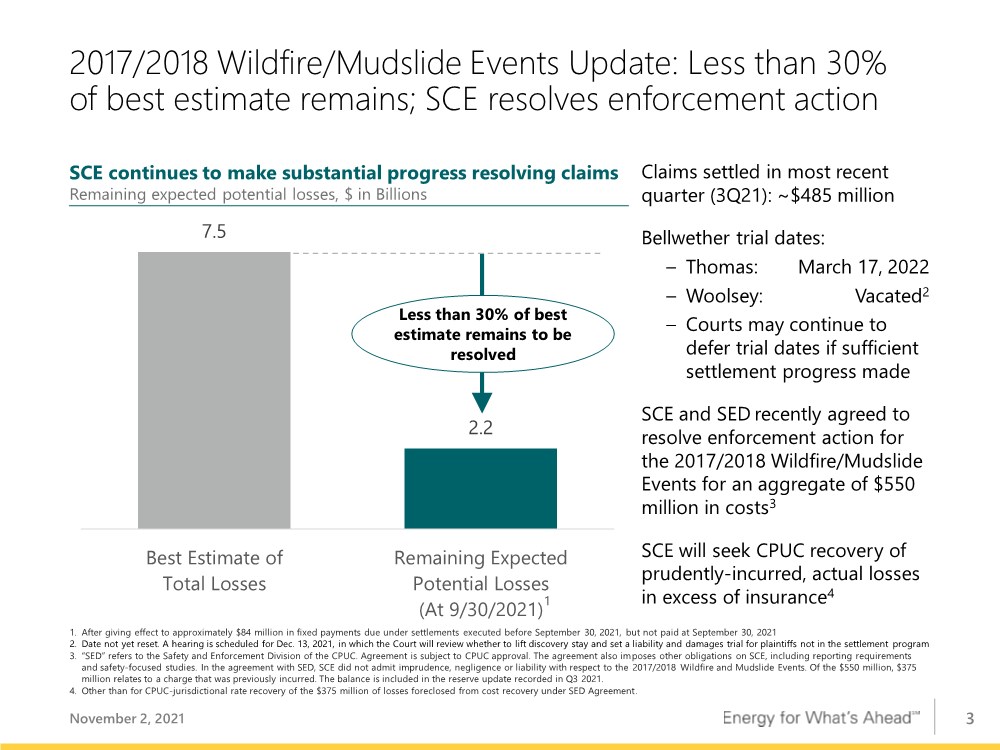
Starting with past events, SCE today announced two updates related to the 2017 and 2018 Wildfire and Mudslide Events. Page 3 in the slide deck provides an overall summary. First, SCE revised the best estimate of potential losses to $7.5 billion from $6.2 billion. As we have mentioned in our continuing communications on this topic, we evaluate the best estimate quarterly. As part of the ongoing, complex litigation process, we diligently consider new


information that arises to provide you all with our best estimate. Based on additional information across a broad set of claim types collected during the quarter, along with an agreement with the CPUC Safety and Enforcement Division, or SED, which I’ll talk about in a minute, SCE revised its estimate of the total potential losses. While the total estimate increased this quarter, SCE continued to make meaningful progress settling claims and completed approximately $485 million of settlements. SCE has now settled about 70% of the estimated exposure for the 2017 and 2018 events. I want to emphasize that we don’t need equity above our previously disclosed 2021 financing plan to fund the higher estimated losses. Maria will address this topic later on the call.

Second, the utility reached an agreement with the SED to resolve its investigations into the 2017 and 2018 Wildfire and Mudslide Events and three other 2017 wildfires. As we have previously disclosed, the SED has conducted investigations to assess SCE’s compliance with applicable rules and regulations in areas affected by the Thomas, Koenigstein, and Woolsey Fires. It was possible the CPUC would initiate formal enforcement proceedings to pursue fines and penalties for alleged violations, though we were unable to estimate the magnitude or timing as part of our best estimate. The recently executed agreement, which is subject to CPUC approval, would resolve that uncertainty. The agreement has a total value of $550 million, composed of a $110 million fine, $65 million of shareholder-funded safety measures, and an agreement by SCE to waive its right to seek cost recovery for $375 million of uninsured claims payments out of the $5.2 billion total in the current best estimate. In the SED Agreement, SCE did not admit imprudence, negligence, or liability with respect to the 2017 and 2018 Wildfire and Mudslide Events, and will seek rate recovery of prudently-incurred, actual losses in excess of available insurance, other than for the $375 million waived under the SED agreement. While SCE disputes a number of the alleged violations, reaching an agreement puts one additional uncertainty behind us.

Let me now address the Southern California wildfire season. SCE continues to make solid progress in the execution of its Wildfire Mitigation Plan, or WMP, and its PSPS Action Plan.

2


SCE has installed over 1,000 miles of covered conductor year-to-date, bringing the total to 2,500 miles since program inception. Over the past three years, the utility has replaced about 25% of its overhead distribution power lines in high fire risk areas with covered conductor. SCE has also performed another annual cycle of inspections in high fire risk areas, supplemented with additional inspections targeting dry fuel areas. This resulted in approximately 195,000 assets undergoing 360-degree inspections in SCE’s high fire risk area. SCE also continues to be on track to meet most of its goals outlined in our WMP by end of the year, and the scorecard is shown on page 4 of the slide deck. All these ongoing mitigation actions continue to strengthen our confidence in SCE’s overall improved risk profile with respect to wildfires.

Turning to page 5, we highlight the metrics we showed you last quarter, which are proof points of how SCE believes it has reduced wildfire risk for its customers. We have added an additional metric. Looking back at past wildfire events and considering SCE’s current PSPS protocols, we can quantify the damage that would have been prevented. Using red flag warning days as a proxy for when the utility would use PSPS today, SCE would have prevented over 90% of the structures damaged or destroyed for fires larger than 1,000 acres associated with its infrastructure. However, we think it is more important to assess how much total risk SCE has reduced on a forward-looking basis. We have summarized this on page 6. In total, considering physical mitigation measures such as covered conductor, operational practices such as tree removals, inspections, and vegetation management, and the use of PSPS, SCE estimates that it has reduced the probability of losses from catastrophic wildfires by 55 to 65%, relative to pre-2018 levels. This is based on a recent analysis using Risk Management Solutions’ industry-leading wildfire model and SCE’s data related to actual mitigations deployed and mitigation effectiveness, which enabled us to quantify the risk reduction. While the risk can never be fully eliminated, SCE expects to further reduce risk, and decrease the need for PSPS to achieve this risk reduction, with continued grid hardening investments.

As California continues to transition to a clean energy economy, maintaining and even improving system reliability becomes essential, particularly with greater reliance on electricity.

3


SCE worked closely with the Governor’s Office, CAISO, CPUC, customers and stakeholders to avoid rolling outages this past summer, when the state and the West once again faced record temperatures. Major California energy agencies, including the CAISO, California Energy Commission, and CPUC, have indicated that additional capacity is needed to support summer 2022 under extreme conditions like the heat, drought, and wildfires we have seen repeatedly over the past several years. To accelerate construction of new capacity, the Governor issued an Emergency Proclamation that requested the CPUC to work with load serving entities to accelerate construction of energy storage for 2021 and 2022. To this end, in addition to securing over 230 MW of additional capacity from third-parties, SCE plans to construct about 535 MW of utility-owned storage for this upcoming summer. This is a material increase in incremental capacity to mitigate the risk of statewide customer outages for summer 2022 caused by extreme weather events and continued drought conditions.

While the Governor signed the largest climate package in state history, which included 24 bills and over $15 billion in climate, clean energy, and wildfire preparedness funding, there is still an ongoing need for more to be done. I would like to highlight a paper we recently released, titled “Mind the Gap: Policies for California’s Countdown to 2030.” This policy paper is Edison International’s latest contribution to identify policies and actions needed to help California reduce emissions and decarbonize the economy. In it, we identified state and federal policy recommendations needed for California to meet its 2030 climate target, which is a foundational waypoint for the state to achieve its goal to decarbonize its economy by 2045. While California has made progress in reducing GHG emissions, closing the gap between the current trajectory and its 2030 goal requires a significant acceleration of its efforts—quadrupling the average 1% annual reduction in GHG emissions achieved since 2006 to 4.1% per year between 2021 and 2030. That will require market transforming policies and incentives to advance critical areas such as decarbonizing the power supply; preparing the grid for shifts in usage and increasing demands; and electrifying transportation and buildings.

4


As the only all-electric investor-owned utility in California, SCE is well positioned to lead this transition. We will continue to work in close partnership with policymakers and stakeholders to identify ways to improve funding, planning, standard setting, and other approaches to successfully achieve the equitable and affordable transition to a clean energy economy. To emphasize affordability, our analysis shows that an electric-led transition is the most affordable pathway, since the greater efficiency of electric motors and appliances will reduce customers’ total costs across all energy commodities by one-third by 2045. Edison International is committed to achieving net-zero GHG emissions across Scopes 1, 2, and 3 by 2045. This covers the power SCE delivers to customers, and Edison International’s enterprise-wide operations, including supply chain. This continues our alignment with the broad policies needed to address climate change and ensure a resilient grid.

Maria Rigatti, Executive Vice President and Chief Financial Officer, Edison International

My comments today will cover third quarter 2021 results, our capital expenditure and rate base forecasts, and updates on other financial topics.

Edison International reported core earnings of $1.69 per share for the third quarter 2021, an increase of 2 cents per share from the same period last year. As Pedro noted earlier, this year-over-year comparison is not particularly meaningful because SCE recorded a true-up for the final decision in its 2021 General Rate Case, which is retroactive to January 1.

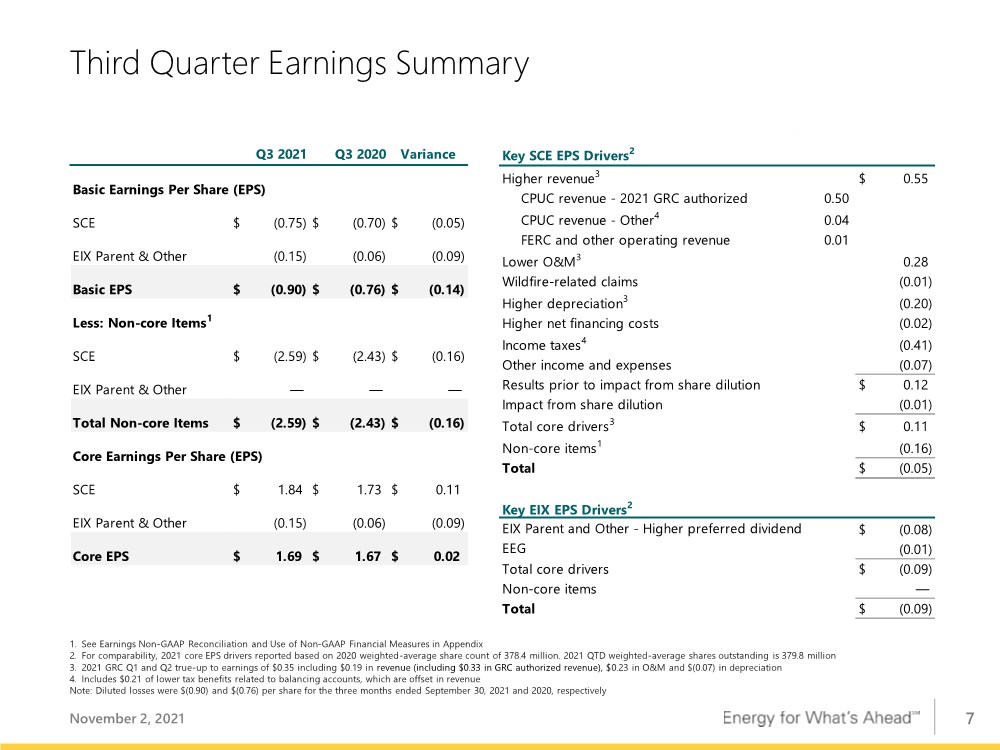
On page 7, you can see SCE’s key third quarter EPS drivers on the right-hand side. I will highlight the primary contributors to the variance.

To begin, SCE received a final decision in the 2021 GRC during the third quarter. Because first and second quarter results were based on 2020 authorized revenue, a true-up was recorded during the quarter for the first sixth months of 2021. This true-up is reflected in several line items on the income statement for a net increase in earnings of 35 cents. The components are listed in footnote 3.

5


Higher 2021 revenues contributed 55 cents, including 50 cents related to the 2021 GRC decision, 4 cents for CPUC revenues related to certain tracking accounts, and 1 cent at FERC.

O&M had a positive variance of 28 cents, mainly due to the establishment of the vegetation management and risk management balancing accounts, partially offset by increased wildfire mitigation costs due to the timing of regulatory deferrals in the third quarter of 2020.

Depreciation had a negative variance of 20 cents, primarily driven by a higher asset base and a higher depreciation rate resulting from the 2021 GRC decision.

Income taxes had a negative variance of 41 cents. This includes 39 cents of lower tax benefits related to balancing accounts and the GRC true-up, which are offset in revenue and have no earnings impact.

At EIX Parent and Other, the loss per share was 9 cents higher than in third quarter 2020. The primary driver was preferred dividends on the $1.25 billion of preferred equity we issued at the parent in March of this year.

Now let’s move to SCE’s capital expenditure and rate base growth forecasts. As shown on page 8, we have updated our capital forecast primarily to reflect the recently announced utility owned storage investment. As Pedro mentioned, SCE filed an advice letter for cost recovery of $1 billion of capital spending to construct about 535 megawatts of utility-owned storage. SCE is seeking expedited approval of the advice letter to maximize the likelihood of the projects meeting their expected online dates for the incremental capacity needed for summer 2022. These projects are a prime example of the essential role utilities can play in quickly ensuring California has a safe, reliable, and clean electricity supply. We increased our 2022 capital expenditure forecast by approximately $900 million and lowered the forecasts somewhat for 2023 through 2025 because these storage projects accelerate some, but not all, of the capacity we previously forecasted in those years. The net increase in the high end of the capital forecast for 2021 through 2025 is approximately $500 million.

6


As shown on page 9, we have also updated our rate base forecast to reflect the storage investments I just mentioned. This is the primary driver of the increase to the 2022 through 2025 rate base forecasts. For 2021, we also fine-tuned the forecast to reflect adjustments related to wildfire mitigation tracking accounts following the implementation of the 2021 GRC decision, and quarter-end assessments of the spending related to these accounts. The result of these updates is a reduction to 2021 rate base of $300 million. Overall, these updates result in a projected rate base growth rate of 7 to 9% from 2021 to 2025.

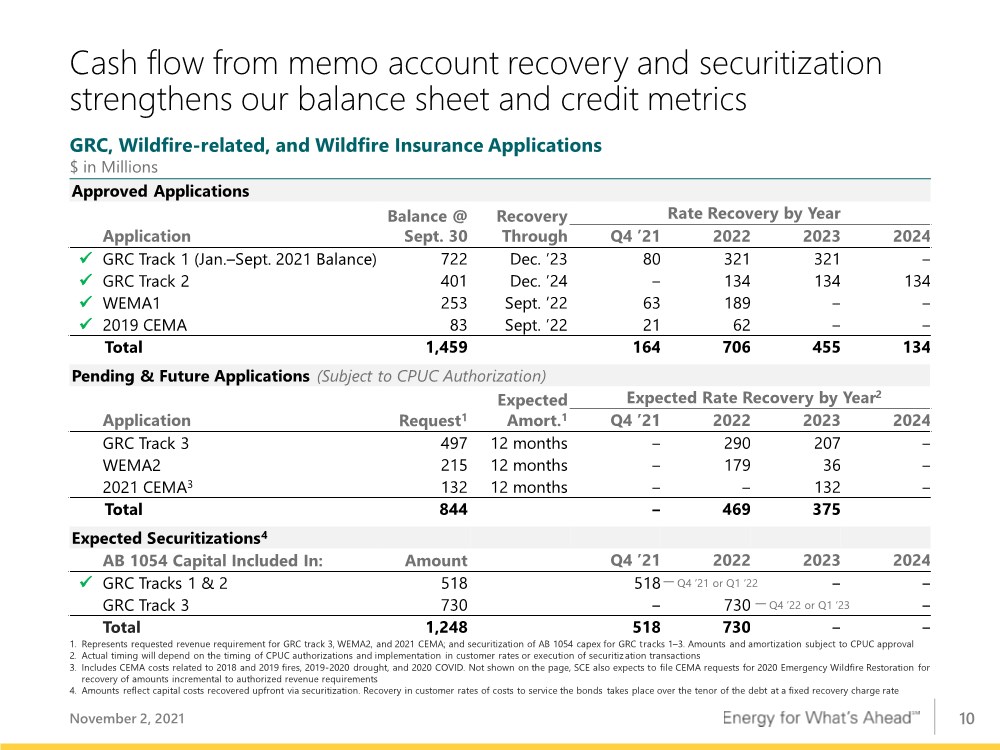
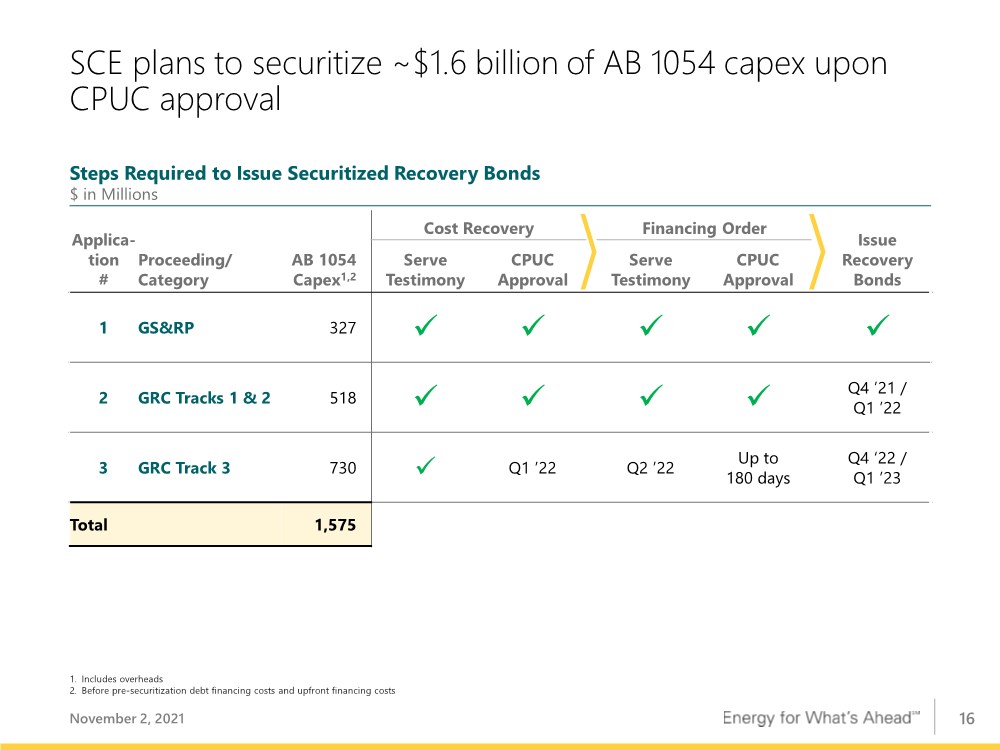
Page 10 provides an update on several major approved and pending applications for recovery of amounts in regulatory assets. This will result in significant incremental cash flow to SCE over the next few years. SCE expects to collect over $1.4 billion in rates between now and 2024 related to already approved applications. About half of that balance will be recovered in 2022. For the three pending applications shown in the middle of the slide, assuming timely regulatory decisions, SCE expects to collect another $844 million by the end of 2023. Lastly, we show the remaining expected securitizations of AB 1054 capital expenditures. The utility recently received a final decision in its second securitization application. This will allow SCE to securitize $518 million of wildfire mitigation capital expenditures. SCE expects to complete the securitization in Q4 of this year or Q1 2022. The securitizations, along with the rate recovery of the other regulatory assets, will allow SCE to pay down short-term debt and strengthen our balance sheet and credit metrics.

Turning to page 11, during the quarter SCE filed an application to establish its CPUC cost of capital for 2022 through 2024 and reset the cost of capital mechanism. SCE is requesting an ROE of 10.53% with resets to its cost of debt and preferred financing, which would keep customer rates unchanged. The utility’s alternative request to maintain its ROE at 10.3% and reset the costs of debt and preferred would reduce customer rates by about $50 million in 2022. When SCE filed the cost of capital request in August, it paused any other filings related to the trigger mechanism. Last week, SCE was directed by the CPUC to file the information that

7


would have normally been provided in those other filings. The next step from here is that the Commission will issue a scoping memo to outline the issues and procedural schedule.

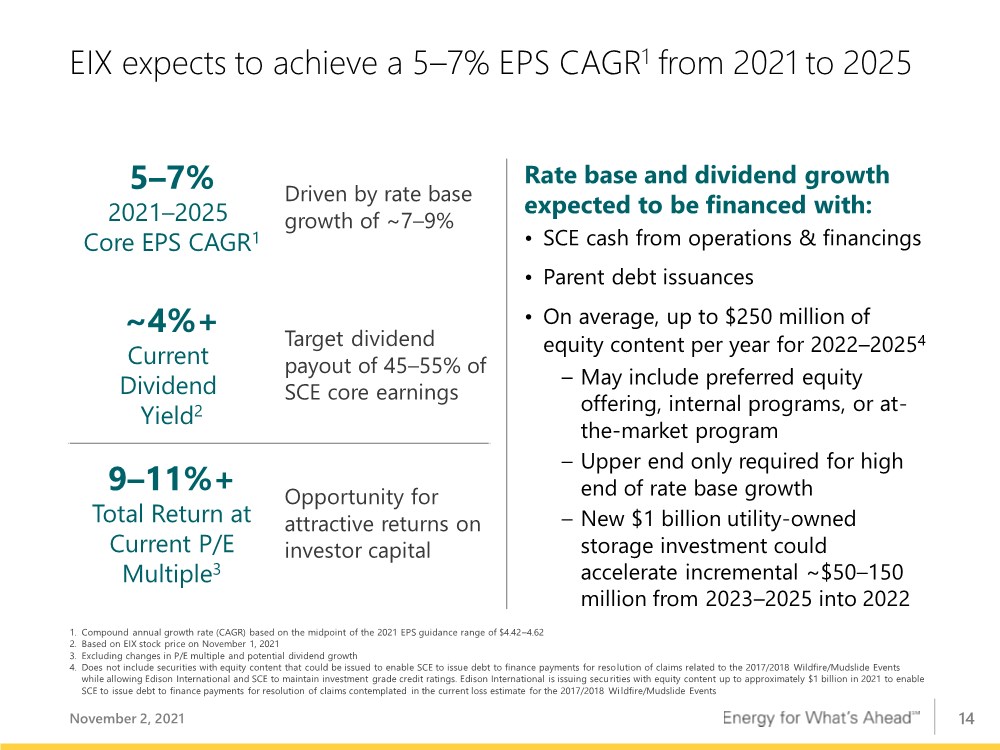
Turning to guidance, pages 12 and 13 show our 2021 guidance and the preliminary modeling considerations for 2022. As Pedro mentioned earlier, we are narrowing the 2021 EPS guidance range to $4.42 to $4.52. Turning to page 14, we see an average need of up to $250 million of equity content annually through 2025. The specific annual amounts will depend on the level of spending within our capital plan for that year. The significant new investment of $1 billion of utility owned storage considerably accelerates the timing of the capital investment program and increases the overall opportunity as noted earlier. To fund this growth, which is well above the high end of the capital spending range previously disclosed for next year, we anticipate accelerating the issuance of equity content securities from the 2023 through 2025 period into 2022. The 2022 equity need will be in the range of $300 to $400 million and we will provide more specifics on the financing plan when we provide 2022 EPS guidance on the fourth quarter 2021 earnings call. Additionally, let me reiterate Pedro’s comment that the SED agreement and update to the best estimate of potential losses associated with the 2017 and 2018 Wildfire and Mudslide Events do not require equity above the levels previously announced in our 2021 financing plan. Consistent with our prior disclosure, we plan to issue securities with up to $1 billion of equity content to support investment grade credit ratings.

In closing, I want to underscore the important role that SCE plays in ensuring safety and resiliency. This can be seen in the ongoing investment in risk-reducing wildfire mitigation as well as utility-owned storage to enhance near-term reliability. These investments are indicative of the longer-term opportunity associated with meeting customer needs and clean energy objectives and gives us confidence in reiterating our long-term EPS growth rate of 5 to 7% for 2021 through 2025.

8


Exhibit 99.4

GRAPHIC

November 2, 2021 Third Quarter 2021 Financial Results

GRAPHIC

1 Statements contained in this presentation about future performance, including, without limitation, operating results, capital expenditures, rate base growth, dividend policy, financial outlook, and other statements that are not purely historical, are forward-looking statements. These forward-looking statements reflect our current expectations; however, such statements involve risks and uncertainties. Actual results could differ materially from current expectations. These forward-looking statements represent our expectations only as of the date of this presentation, and Edison International assumes no duty to update them to reflect new information, events or circumstances. Important factors that could cause different results include, but are not limited to the: • ability of SCE to recover its costs through regulated rates, including uninsured wildfire-related and debris flow-related costs, costs incurred to mitigate the risk of utility equipment causing future wildfires, costs incurred to implement SCE's new customer service system and costs incurred as a result of the COVID-19 pandemic; • ability of SCE to implement its Wildfire Mitigation Plan and capital program; • risks of regulatory or legislative restrictions that would limit SCE’s ability to implement Public Safety Power Shutoff (“PSPS”) when conditions warrant or would otherwise limit SCE’s operational PSPS practices; • risks associated with implementing PSPS, including regulatory fines and penalties, claims for damages and reputational harm; • ability of SCE to maintain a valid safety certification; • ability to obtain sufficient insurance at a reasonable cost, including insurance relating to SCE's nuclear facilities and wildfire-related claims, and to recover the costs of such insurance or, in the event liabilities exceed insured amounts, the ability to recover uninsured losses from customers or other parties; • extreme weather-related incidents (including events caused, or exacerbated, by climate change, such as wildfires, debris flows, droughts, high wind events and extreme heat events) and other natural disasters (such as earthquakes), which could cause, among other things, public safety issues, property damage, operational issues (such as rotating outages and issues due to damaged infrastructure), PSPS activations and unanticipated costs; • risk that California Assembly Bill 1054 (“AB 1054”) does not effectively mitigate the significant exposure faced by California investor-owned utilities related to liability for damages arising from catastrophic wildfires where utility facilities are alleged to be a substantial cause, including the longevity of the Wildfire Insurance Fund and the CPUC's interpretation of and actions under AB 1054, including its interpretation of the prudency standard established under AB 1054; • ability of SCE to effectively attract, manage, develop and retain a skilled workforce, including its contract workers; • decisions and other actions by the California Public Utilities Commission, the Federal Energy Regulatory Commission, the Nuclear Regulatory Commission and other governmental authorities, including decisions and actions related to nationwide or statewide crisis, determinations of authorized rates of return or return on equity, the recoverability of wildfire-related and debris flow-related costs, issuance of SCE's wildfire safety certification, wildfire mitigation efforts, and delays in executive, regulatory and legislative actions; • ability of Edison International or SCE to borrow funds and access bank and capital markets on reasonable terms; • risks associated with the decommissioning of San Onofre, including those related to worker and public safety, public opposition, permitting, governmental approvals, on- site storage of spent nuclear fuel, delays, contractual disputes, and cost overruns; • pandemics, such as COVID-19, and other events that cause regional, statewide, national or global disruption, which could impact, among other things, Edison International's and SCE's business, operations, cash flows, liquidity and/or financial results and cause Edison International and SCE to incur unanticipated costs; • physical security of Edison International's and SCE's critical assets and personnel and the cybersecurity of Edison International's and SCE's critical information technology systems for grid control, and business, employee and customer data; • risks associated with cost allocation resulting in higher rates for utility bundled service customers because of possible customer bypass or departure for other electricity providers such as Community Choice Aggregators (“CCA,” which are cities, counties, and certain other public agencies with the authority to generate and/or purchase electricity for their local residents and businesses) and Electric Service Providers (entities that offer electric power and ancillary services to retail customers, other than electrical corporations (like SCE) and CCAs); • risks inherent in SCE’s capital investment program, including those related to project site identification, public opposition, environmental mitigation, construction, permitting, power curtailment costs (payments due under power contracts in the event there is insufficient transmission to enable acceptance of power delivery), changes in the California Independent System Operator’s transmission plans, and governmental approvals; and • risks associated with the operation of electrical facilities, including worker and public safety issues, the risk of utility assets causing or contributing to wildfires, failure, availability, efficiency, and output of equipment and facilities, and availability and cost of spare parts. Other important factors are discussed under the headings “Forward-Looking Statements”, “Risk Factors” and “Management’s Discussion and Analysis” in Edison International’s Form 10-K and other reports filed with the Securities and Exchange Commission, which are available on our website: www.edisoninvestor.com. These filings also provide additional information on historical and other factual data contained in this presentation. Forward-Looking Statements November 2, 2021

GRAPHIC

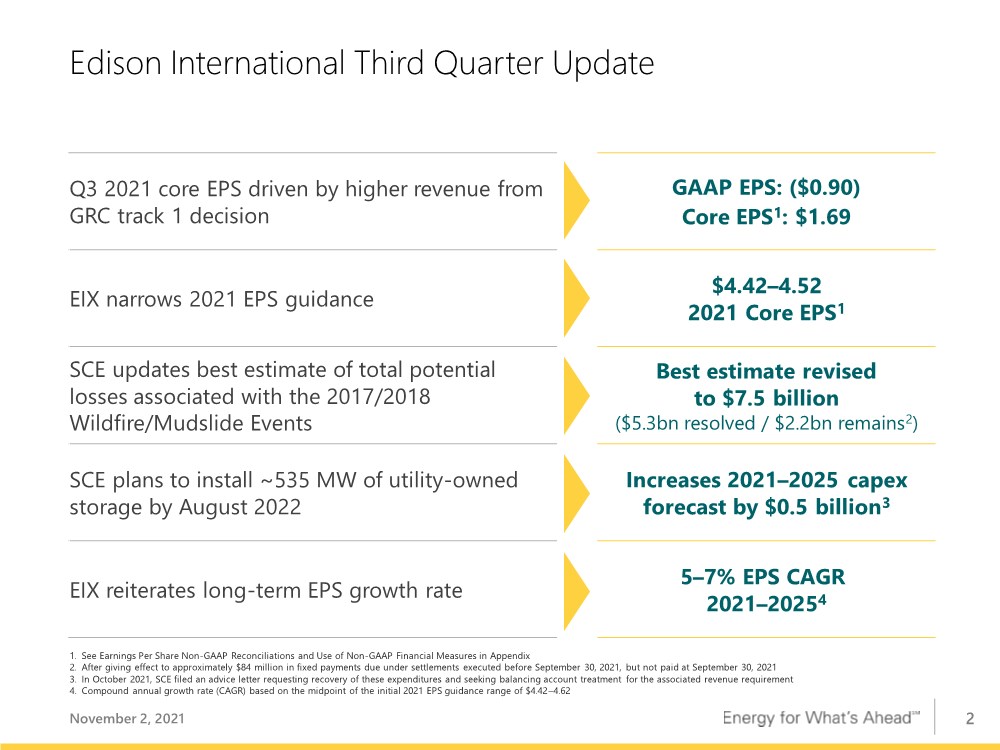
2 Edison International Third Quarter Update Q3 2021 core EPS driven by higher revenue from GRC track 1 decision GAAP EPS: ($0.90) Core EPS1: $1.69 EIX narrows 2021 EPS guidance $4.42–4.52 2021 Core EPS1 SCE updates best estimate of total potential losses associated with the 2017/2018 Wildfire/Mudslide Events Best estimate revised to $7.5 billion ($5.3bn resolved / $2.2bn remains2) SCE plans to install ~535 MW of utility-owned storage by August 2022 Increases 2021–2025 capex forecast by $0.5 billion3 EIX reiterates long-term EPS growth rate 5–7% EPS CAGR 2021–20254 1. See Earnings Per Share Non-GAAP Reconciliations and Use of Non-GAAP Financial Measures in Appendix 2. After giving effect to approximately $84 million in fixed payments due under settlements executed before September 30, 2021, but not paid at September 30, 2021 3. In October 2021, SCE filed an advice letter requesting recovery of these expenditures and seeking balancing account treatment for the associated revenue requirement 4. Compound annual growth rate (CAGR) based on the midpoint of the initial 2021 EPS guidance range of $4.42–4.62 November 2, 2021

GRAPHIC

3 2017/2018 Wildfire/Mudslide Events Update: Less than 30% of best estimate remains; SCE resolves enforcement action November 2, 2021 SCE continues to make substantial progress resolving claims Remaining expected potential losses, $ in Billions 7.5 2.2 Best Estimate of Total Losses Remaining Expected Potential Losses (At 9/30/2021) Less than 30% of best estimate remains to be resolved Claims settled in most recent quarter (3Q21): ~$485 million Bellwether trial dates: – Thomas: March 17, 2022 – Woolsey: Vacated2 – Courts may continue to defer trial dates if sufficient settlement progress made SCE and SED recently agreed to resolve enforcement action for the 2017/2018 Wildfire/Mudslide Events for an aggregate of $550 million in costs3 SCE will seek CPUC recovery of prudently-incurred, actual losses in excess of insurance4 1 1. After giving effect to approximately $84 million in fixed payments due under settlements executed before September 30, 2021, but not paid at September 30, 2021 2. Date not yet reset. A hearing is scheduled for Dec. 13, 2021, in which the Court will review whether to lift discovery stay and set a liability and damages trial for plaintiffs not in the settlement program 3. “SED” refers to the Safety and Enforcement Division of the CPUC. Agreement is subject to CPUC approval. The agreement also imposes other obligations on SCE, including reporting requirements and safety-focused studies. In the agreement with SED, SCE did not admit imprudence, negligence or liability with respect to the 2017/2018 Wildfire and Mudslide Events. Of the $550 million, $375 million relates to a charge that was previously incurred. The balance is included in the reserve update recorded in Q3 2021. 4. Other than for CPUC-jurisdictional rate recovery of the $375 million of losses foreclosed from cost recovery under SED Agreement.

GRAPHIC

4 SCE’s execution of its wildfire mitigation strategy is reducing risk of wildfires associated with utility infrastructure November 2, 2021 Note: Data as of September 30, 2021. Blue check marks indicate met or exceeded target. Green arrows indicate execution is on track. Community Resource Centers Community Crew Vehicles 64 sites available 8 vehicles available High-Definition Wildfire Cameras Completed Since 2018 166 cameras installed Cameras thoroughly covering our high fire risk areas were installed by 2020 Distribution Equipment Inspections 2021 Completed/Target 185,000/163,000 inspections Completed Since 2018 769,300+ inspections Transmission Equipment Inspections 2021 Completed/Target 21,100/16,800 inspections Completed Since 2018 107,300+ inspections Insulated Wire (Covered Conductor) 2021 Completed/Target 1,010/1,000 circuit miles installed Completed Since 2018 2,500 circuit miles installed Fast-Acting Fuses 2021 Completed/Target 340/330 fuses installed Completed Since 2018 13,300+ fuses installed Hazard Tree Management 2021 Completed/Target 108,800/150,000 trees assessed Completed Since 2018 337,300+ trees assessed 73% completed Weather Stations 2021 Completed/Target 375/375 weather stations installed Completed Since 2018 1,430+ weather stations installed Aerial Fire Suppression Resources SCE contributed $18 million to support the creation of a quick reaction force of aerial firefighting assets across counties in SCE's service area to coordinate and reach wildfires in their early stages. These unique water and fire retardant dropping helitankers have the capability to operate day and night Critical Care Backup Battery 113% completed 126% completed 101% completed 103% completed 100% completed 2021 Completed/Target 5,050/3,600 batteries provided to eligible customers Completed Since July 2020 5,770+ batteries provided to eligible customers 140% completed

GRAPHIC

5 SCE is making meaningful progress in mitigating wildfire risk for its customers November 2, 2021 Covered conductor has reduced faults, which could lead to ignitions High fire risk inspection program has reduced remediation needs Expanded vegetation management and tree removal has reduced faults 72% fewer faults on fully covered circuits1 52% fewer tree-caused faults2 66% lower defect find rate3 1. Measured by faults per 100 circuit miles on fully covered circuits in HFRA as compared to bare circuits in HFRA year-to-date in 2021 through September 30, 2021 2. Measured by average monthly tree caused circuit interruptions in HFRA in 2020–2021 as compared to the average from 2015–2019 3. Measured as Total Defect Find Rate (percentage of inspections) in 2021 as compared to 2019 (inception of program) for structures inspected every year 4. Measured as structures damaged or destroyed in wildfires greater than 1,000 acres associated with SCE’s infrastructure during 2015–2020, using red flag warning days as a proxy for PSPS conditions. Please note, however, that a red flag warning, alone, would not necessarily result in a decision to implement a PSPS On segments where SCE has covered bare wire, there has not been a single CPUC-reportable ignition from contact with objects or wire-to-wire contact Today’s PSPS use would have prevented majority of damage from past wildfires >90% reduction of structures damaged4

GRAPHIC

6 SCE estimates its wildfire mitigation and PSPS have reduced probability of losses from catastrophic wildfires by ~55-65%1,2 1. Baseline risk estimated by RMS using its wildfire model, the location of SCE’s assets, and SCE reported ignitions from 2014-2020. Risk reduction calculated by applying SCE- provided mitigation effectiveness and locations of covered conductor, tree removals, inspections, line clearing, and PSPS. Range may vary for other loss thresholds 2. Includes 50,000 year-long simulations using 20 years of weather and fire modeling weighted for the last 5 years to reflect recent experience and climate-change impacts 3. Annual losses represent potential claims resulting from wildfire. Total potential insured losses, such as damages to assets of homeowners and businesses, estimated by RMS, and uninsured losses, such as personal injury, fire suppression, and damage to publicly-owned assets estimated by SCE based on management experience and judgment 4. Fund refers to AB 1054 Wildfire Insurance Fund. SCE used the one-year RMS loss estimates with its estimates for the size of uninsured losses to quantify the reduction in probability of experiencing $3.5 billion in losses over a three-year period, excess of $1 billion aggregate each year, after which the AB 1054 liability cap would apply RMS, a leading provider of climate and natural disaster risk modeling, worked with SCE to analyze the benefits of SCE’s wildfire mitigations The RMS wildfire model is designed to capture the full spectrum of wildfire threat Combined with SCE’s mitigation effectiveness data, RMS quantified risk reduction from SCE’s mitigations, including PSPS3 SCE estimates PSPS currently accounts for ~40% of the reduction2 Methodology Substantial risk reduction due to SCE’s mitigation measures Pre- 2018 Now Estimated Risk Reduction Annual Risk of ≥$1.0 billion loss4 ~7.6% ~3.2% ~55% reduction in estimated probability of accessing the Wildfire Fund Risk of ≥$3.5 billion drawn from Fund over 3 years4 ~4.2% ~1.5% ~65% reduction in estimated probability of exceeding AB 1054 liability cap SCE expects to further reduce risk and decrease the need for PSPS with continued grid hardening investments 1. Baseline risk estimated by Risk Management Solutions, Inc. (RMS) using its wildfire model, relying on the following data provided by SCE: the location of SCE’s assets, reported ignitions from 2014– 2020, mitigation effectiveness and locations of installed covered conductor, tree removals, inspections, line clearing, and PSPS de-energization criteria 2. There are risks inherent in the simulation analyses, models and predictions of SCE and RMS relating to the likelihood of and damage due to wildfires. As with any simulation analysis or model related to physical systems, particularly those with lower frequencies of occurrence and potentially high severity outcomes, the actual losses from catastrophic wildfire events may differ from the results of the simulation analyses and models of RMS and SCE. Range may vary for other loss thresholds 3. Includes 50,000 year-long simulations using 20 years of weather and fire modeling data weighted for the last 5 years to reflect recent experience and climate change impacts to date 4. Includes (i) total potential insured losses estimated by RMS, and (ii) total potential uninsured losses estimated by SCE based on management experience and consultation with insurance industry experts. “Fund” refers to CA AB 1054 Wildfire Insurance Fund. SCE used RMS loss estimates along with its estimates of uninsured losses to quantify the reductions in estimated probability November 2, 2021

GRAPHIC

7 Higher revenue3 0.55 $ CPUC revenue - 2021 GRC authorized 0.50 CPUC revenue - Other4 0.04 FERC and other operating revenue 0.01 Lower O&M3 0.28 Wildfire-related claims (0.01) Higher depreciation3 (0.20) Higher net financing costs (0.02) Income taxes4 (0.41) Other income and expenses (0.07) Results prior to impact from share dilution 0.12 $ Impact from share dilution (0.01) Total core drivers3 0.11 $ Non-core items1 (0.16) Total (0.05) $ (0.08) $ (0.01) Total core drivers (0.09) $ Non-core items — Total (0.09) $ Key SCE EPS Drivers2 Key EIX EPS Drivers2 EIX Parent and Other - Higher preferred dividend EEG Third Quarter Earnings Summary November 2, 2021 1. See Earnings Non-GAAP Reconciliation and Use of Non-GAAP Financial Measures in Appendix 2. For comparability, 2021 core EPS drivers reported based on 2020 weighted-average share count of 378.4 million. 2021 QTD weighted-average shares outstanding is 379.8 million 3. 2021 GRC Q1 and Q2 true-up to earnings of $0.35 including $0.19 in revenue (including $0.33 in GRC authorized revenue), $0.23 in O&M and $(0.07) in depreciation 4. Includes $0.21 of lower tax benefits related to balancing accounts, which are offset in revenue Note: Diluted losses were $(0.90) and $(0.76) per share for the three months ended September 30, 2021 and 2020, respectively Q3 2021 Q3 2020 Variance Basic Earnings Per Share (EPS) SCE (0.75) $ (0.70) $ (0.05) $ EIX Parent & Other (0.15) (0.06) (0.09) Basic EPS (0.90) $ (0.76) $ (0.14) $ Less: Non-core Items1 SCE (2.59) $ (2.43) $ (0.16) $ EIX Parent & Other — — — Total Non-core Items (2.59) $ (2.43) $ (0.16) $ Core Earnings Per Share (EPS) SCE 1.84 $ 1.73 $ 0.11 $ EIX Parent & Other (0.15) (0.06) (0.09) Core EPS 1.69 $ 1.67 $ 0.02 $

GRAPHIC

8 Range Case2 5.2 6.0 5.2 5.2 5.2 5.3 6.2 5.3–5.7 6.0 6.8 2021 2022 2023 2024 2025 SCE has significant capital expenditure opportunities driven by investments in the safety and reliability of the grid November 2, 2021 Capital deployment expected to increase beyond the current GRC cycle and will be proposed in future applications Capital Expenditures, $ in Billions 2021 GRC track 1 supports $5.3 billion of annual capital spending supporting safety, reliability, and risk reduction for customers Additional growth potential from requests to be made in future GRC and other proceedings Primary 2023+ potential: – Deployment of incremental miles of covered conductor3 – Investment to support infrastructure replacement and load growth – Transmission and energy storage investments to meet long-term state GHG targets 1. Forecast for 2024 includes amounts expected to be requested in track 4 of SCE’s 2021 GRC. Forecast for 2025 includes amounts currently expected to be requested in SCE’s 2025 GRC filing. Additionally, reflects non-GRC spending subject to future regulatory requests beyond GRC proceedings and FERC Formula Rate updates 2. Annual Range Case capital reflects variability associated with future requests based on management judgment, potential for permitting delays and other operational considerations; GRC forecast is in line with authorized spend over the 2021 GRC track 1 cycle 3. The final decision in track 1 of SCE’s 2021 GRC established a cost recovery mechanism that would allow SCE to install additional covered conductor miles above the 4,500 circuit-mile level approved in the decision, including within the track 1 GRC period, subject to after-the-fact reasonableness review Future Requests1 +$0.9 billion of utility-owned storage for 2022 reliability 2021 GRC Track 1 Track 4 2025 GRC

GRAPHIC

9 Range Case2 35.2 38.2 41.2 43.8 46.6 2021 GRC track 1 decision provides rate base visibility through 2023; future applications expected to extend growth November 2, 2021 1. Weighted-average year basis. Excludes rate base associated with ~$1.6 billion of wildfire mitigation-related spend that shall not earn an equity return under AB 1054 2. Range Case rate base reflects capital expenditure Range Case forecast 3. The final decision in track 1 of SCE’s 2021 GRC established a cost recovery mechanism that would allow SCE to install additional covered conductor miles above the 4,500 circuit-mile level approved in the decision, including within the track 1 GRC period, subject to after-the-fact reasonableness review From a 2021 base, rate base growth forecast of 7–9% through 2025, reflecting future incremental investment Rate Base1 $ in Billions 2021 GRC track 1 final decision supports solid rate base growth through 2023 Forecast includes recovery of utility-owned storage for summer 2022 reliability Longer-term rate base growth potential from: – Deployment of incremental miles of covered conductor3 – Investment to support infrastructure replacement and load growth – Transmission and energy storage investments to meet long-term state GHG targets 35.3 38.4 41.5–42.3 46.0 49.4 2021 2022 2023 2024 2025 ~9% 2021–2025 CAGR 2021 GRC Track 1 Track 4 2025 GRC Future Requests

GRAPHIC

10 Cash flow from memo account recovery and securitization strengthens our balance sheet and credit metrics November 2, 2021 Approved Applications Application Balance @ Sept. 30 Recovery Through Rate Recovery by Year Q4 ’21 2022 2023 2024 ✓ GRC Track 1 (Jan.–Sept. 2021 Balance) 722 Dec. ’23 80 321 321 – ✓ GRC Track 2 401 Dec. ’24 – 134 134 134 ✓ WEMA1 253 Sept. ’22 63 189 –– ✓ 2019 CEMA 83 Sept. ’22 21 62 –– Total 1,459 164 706 455 134 Pending & Future Applications (Subject to CPUC Authorization) Application Request1 Expected Amort.1 Expected Rate Recovery by Year2 Q4 ’21 2022 2023 2024 GRC Track 3 497 12 months – 290 207 – WEMA2 215 12 months – 179 36 – 2021 CEMA3 132 12 months –– 132 – Total 844 – 469 375 Expected Securitizations4 AB 1054 Capital Included In: Amount Q4 ’21 2022 2023 2024 ✓ GRC Tracks 1 & 2 518 518 –– GRC Track 3 730 – 730 – Total 1,248 518 730 –– 1. Represents requested revenue requirement for GRC track 3, WEMA2, and 2021 CEMA; and securitization of AB 1054 capex for GRC tracks 1–3. Amounts and amortization subject to CPUC approval 2. Actual timing will depend on the timing of CPUC authorizations and implementation in customer rates or execution of securitization transactions 3. Includes CEMA costs related to 2018 and 2019 fires, 2019-2020 drought, and 2020 COVID. Not shown on the page, SCE also expects to file CEMA requests for 2020 Emergency Wildfire Restoration for recovery of amounts incremental to authorized revenue requirements 4. Amounts reflect capital costs recovered upfront via securitization. Recovery in customer rates of costs to service the bonds takes place over the tenor of the debt at a fixed recovery charge rate GRC, Wildfire-related, and Wildfire Insurance Applications $ in Millions Q4 ’21 or Q1 ‘22 Q4 ’22 or Q1 ‘23

GRAPHIC

11 SCE’s requested 2022 cost of capital would result in an ROE of 10.53%, while keeping customer rates unchanged On August 23, SCE filed request to set CPUC cost of capital for 2022–2024 and to reset cost of capital mechanism (CCM) Proposed alternative would suspend CCM for 2022, maintain SCE’s ROE, and update costs of debt and preferred – If adopted, SCE would file next cost of capital application in April 2022, effective for 2023–2025 SCE proposed making cost of capital effective January 1, 2022, through use of a memo account SCE will submit materials that would have been included in cost of capital mechanism advice letter by Nov. 8, 2021. Next steps in the proceeding will be outlined in forthcoming CPUC scoping memo Capital Structure 2021 Rate 2022 Request 2022 Alt. Request Common Equity 52% 10.30% 10.53% 10.30% Preferred 5% 5.70% 5.90% 5.90% Long-term Debt 43% 4.74% 4.32% 4.32% WACC 7.68% 7.63% 7.51% Revenue Change n/a $0 ~($50) 2.5 3.0 3.5 4.0 4.5 5.0 5.5 6.0 Oct. 1, 2020 Apr. 1, 2021 Oct. 1, 2021 CPUC Authorized Cost of Capital and 2022 Request Measurement Period Average: 3.33% Starting Value – 4.50% CPUC Cost of Capital Adjustment Mechanism Moody’s Baa Utility Bond Index Rate (%) Dead- band November 2, 2021

GRAPHIC

12 EIX narrows 2021 core EPS guidance to $4.42–4.52 November 2, 2021 YTD Recorded1 2021 Guidance1 SCE 2021 Rate Base EPS $3.65 $4.89 SCE Operational Variances 0.32 0.34–0.42 SCE Operational Results 3.97 5.23–5.31 EIX Parent and Other (0.36)(0.56)–(0.54) EIX Operational Results 3.61 4.67–4.77 SCE Costs Excluded from Authorized (0.19)(0.25) EIX Consolidated Core EPS $3.43 $4.42–4.52 1. YTD results as of September 30, 2021, based on 2021 YTD weighted average shares of 379.5 million; 2021 guidance based on weighted average shares assumption of 379.7 million 2. SCE is unable to conclude, at this time, that these amounts are probable of recovery; however, recovery may be sought as part of future cost recovery applications Note: See Earnings Per Share Non-GAAP Reconciliations and Use of Non-GAAP Financial Measures in Appendix. All tax-effected information on this slide is based on our current combined statutory tax rate of approximately 28%. Totals may not add due to rounding EIX 2021 Core Earnings Per Share Guidance Range Building from SCE Rate Base EPS Key components of variances from SCE rate base EPS1 SCE Operational Variances Financial, operating, and other variances from auth. 0.34–0.42 EIX Parent and Other Operating expense, other (0.14)–(0.13) Interest expense (0.26) EIX preferred dividends (0.16)–(0.15) SCE Costs Excluded from Authorized Wildfire Insurance Fund contribution interest expense (0.08) Wildfire claims payment debt interest expense2 (0.03) Short- and long-term incentive comp not in rates; SB 901 disallowed exec comp (0.14)

GRAPHIC

13 2021 EIX Core Earnings Guidance Assumptions and Preliminary 2022 Considerations November 2, 2021 1. Beginning in 2023, Intervenors have an annual opportunity to terminate the TO2019A Formula Rate. The earliest any new rate could become effective is January 1, 2024 2. Does not include securities with equity content that could be issued to enable SCE to issue debt to finance payments for resolution of claims related to the 2017/2018 Wildfire/Mudslide Events while allowing Edison International and SCE to maintain investment grade credit ratings. Edison International is issuing securities with equity content up to approximately $1 billion in 2021 to enable SCE to issue debt to finance payments for resolution of claims contemplated in the current loss estimate for the 2017/2018 Wildfire/Mudslide Events Note: All tax-effected information on this slide is based on our current combined statutory tax rate of approximately 28% 2021 Assumption 2022 Preliminary Considerations CPUC Rate Base ($ in Billions) $28.1 Rate base growth as projected Return on Equity (ROE) 10.30% 2022 ROE subject to CPUC decision on SCE’s 2022 cost of capital application Equity in Capital Structure 52.0% FERC Rate Base ($ in Billions) $7.2 Rate base growth as projected Return on Equity (ROE) 10.30% ROE and capital structure based on TO2019A Formula Rate1 Equity in Capital Structure 47.5% Other Items SCE Cost-of-Capital- related Financing Variance ($ Millions, after-tax) ~$35 Based on SCE’s cost of capital application, costs of debt and preferred would true-up, resulting in ~$35 million reduction in earnings SCE Wildfire Claims Payment Debt Interest Expense ($ Millions, after-tax) ~$13 Full year of interest on ~$3 billion of debt issued in 2020–2021 plus interest on incremental 2022 issuances EIX Equity Issuance Securities with up to $1 billion of equity content Evaluating potential issuance of securities with $300–400 million of equity content, which includes acceleration of 2023–2025 amounts due to utility-owned storage investment2 EIX Preferred Dividends ($ in Millions) ~$55–60 Full year of dividends on preferred equity issued in 2021

GRAPHIC

14 EIX expects to achieve a 5–7% EPS CAGR1 from 2021 to 2025 November 2, 2021 Rate base and dividend growth expected to be financed with: • SCE cash from operations & financings • Parent debt issuances • On average, up to $250 million of equity content per year for 2022–20254 – May include preferred equity offering, internal programs, or at- the-market program – Upper end only required for high end of rate base growth – New $1 billion utility-owned storage investment could accelerate incremental ~$50–150 million from 2023–2025 into 2022 5–7% 2021–2025 Core EPS CAGR1 Driven by rate base growth of ~7–9% ~4%+ Current Dividend Yield2 Target dividend payout of 45–55% of SCE core earnings 9–11%+ Total Return at Current P/E Multiple3 Opportunity for attractive returns on investor capital 1. Compound annual growth rate (CAGR) based on the midpoint of the 2021 EPS guidance range of $4.42–4.62 2. Based on EIX stock price on November 1, 2021 3. Excluding changes in P/E multiple and potential dividend growth 4. Does not include securities with equity content that could be issued to enable SCE to issue debt to finance payments for resolution of claims related to the 2017/2018 Wildfire/Mudslide Events while allowing Edison International and SCE to maintain investment grade credit ratings. Edison International is issuing securities with equity content up to approximately $1 billion in 2021 to enable SCE to issue debt to finance payments for resolution of claims contemplated in the current loss estimate for the 2017/2018 Wildfire/Mudslide Events

GRAPHIC

Appendix

GRAPHIC

16 SCE plans to securitize ~$1.6 billion of AB 1054 capex upon CPUC approval November 2, 2021 Applica- tion # Cost Recovery Financing Order Issue Recovery Bonds Proceeding/ Category AB 1054 Capex1,2 Serve Testimony CPUC Approval Serve Testimony CPUC Approval 1 GS&RP 327 ✓ ✓ ✓ ✓ ✓ 2 GRC Tracks 1 & 2 518 ✓ ✓ ✓ ✓ Q4 ’21 / Q1 ’22 3 GRC Track 3 730 ✓ Q1 ’22 Q2 ’22 Up to 180 days Q4 ‘22 / Q1 ’23 Total 1,575 1. Includes overheads 2. Before pre-securitization debt financing costs and upfront financing costs Steps Required to Issue Securitized Recovery Bonds $ in Millions

GRAPHIC

17 SCE’s 2021 General Rate Case will be approved in four tracks over 2021–2023 SCE Testimony Intervenor Testimony SCE Rebuttal Opening & Reply Briefs CPUC Proposed Decision Track 1: 2021–2023 GRC Revenue Requirement ✓ ✓ ✓ ✓ ✓ (Approved) Track 2: 2018–2019 FMA Update1 ✓ ✓ ✓ N/A due to settlement ✓ (Approved) Track 3: 2020 FMA Update1; 2018–2020 GS&RP ✓ ✓ ✓ Q4 ’21 Q1 ’22 Track 4: RAMP and 2024 Attrition Year Q2 ‘22 Q1 ‘23 Q1 ‘23 Q3 ’23 Q4 ‘23 1. Fire Memo Accounts (FMA) include Wildfire Mitigation Plan Memo Account, Fire Hazard Prevention Memo Account, and Fire Risk Mitigation Memo Account November 2, 2021 Estimated timeline for 2021 General Rate Case tracks and milestones

GRAPHIC

18 Year-to-Date Earnings Summary November 2, 2021 1. See Earnings Non-GAAP Reconciliations and Use of Non-GAAP Financial Measures in Appendix 2. For comparability, 2021 core drivers reported based on 2020 weighted-average share count of 370.7 million. 2021 YTD weighted-average shares outstanding is 379.5 million 3. Includes $0.42 of lower tax benefits related to balancing accounts, which are offset in revenue Note: Diluted earnings were $0.62 and $0.57 per share for the nine months ended September 30, 2021 and 2020, respectively YTD YTD 2021 2020 Variance Basic Earnings Per Share (EPS) SCE 0.98 $ 0.90 $ 0.08 $ EIX Parent & Other (0.36) (0.33) (0.03) Basic EPS 0.62 $ 0.57 $ 0.05 $ Less: Non-core Items1 SCE (2.81) $ (2.69) $ (0.12) $ EIX Parent & Other — (0.07) 0.07 Total Non-core Items (2.81) $ (2.76) $ (0.05) $ Core Earnings Per Share (EPS) SCE 3.79 $ 3.59 $ 0.20 $ EIX Parent & Other (0.36) (0.26) (0.10) Core EPS 3.43 $ 3.33 $ 0.10 $ Key SCE EPS Drivers2 Higher revenue3 0.72 $ CPUC revenue 0.63 FERC and other operating revenue 0.09 Lower O&M 0.59 Wildfire-related claims (0.01) Higher depreciation (0.36) Lower net financing costs 0.03 Income taxes3 (0.53) Other (0.15) Property and other taxes (0.05) Other income and expenses (0.10) Results prior to impact from share dilution 0.29 $ Impact from share dilution (0.09) Total core drivers 0.20 $ Non-core items1 (0.12) Total 0.08 $ (0.11) $ Results prior to impact from share dilution (0.11) $ Impact from share dilution 0.01 Total core drivers (0.10) $ Non-core items1 0.07 Total (0.03) $ Key EIX EPS Drivers2 EIX Parent and Other - Higher preferred dividend

GRAPHIC

19 Earnings Non-GAAP Reconciliations November 2, 2021 Reconciliation of EIX GAAP Earnings to EIX Core Earnings Earnings (Losses) Attributable to Edison International, $ in Millions Q3 Q3 YTD YTD 2021 2020 2021 2020 SCE (284) $ (264) $ 371 $ 336 $ EIX Parent & Other (57) (24) (135) (123) Basic Earnings (341) $ (288) $ 236 $ 213 $ Non-Core Items SCE 2017/2018 Wildfire/Mudslide Events claims and expenses, net of recoveries (899) (880) (909) (889) Wildfire Insurance Fund expense (39) (61) (116) (181) Sale of San Onofre nuclear fuel — 21 7 58 Disallowed historical capital expenditures in SCE's 2021 GRC decision (47) — (47) — Re-measurement of tax liabilities — — — 18 EIX Parent & Other Goodwill impairment and other — — — (28) Less: Total non-core items (985) $ (920) $ (1,065) $ (1,022) $ SCE 701 656 1,436 1,330 EIX Parent & Other (57) (24) (135) (95) Core Earnings 644 $ 632 $ 1,301 $ 1,235 $

GRAPHIC

20 EIX Core EPS Non-GAAP Reconciliations November 2, 2021 1. 2021 EPS drivers are reported based on weighted-average share counts of 379.8 million and 379.5 million for Q3 and YTD, respectively; 2020 EPS drivers are based on weighted-average share counts of 378.4 million and 370.7 million for Q3 and YTD, respectively Q3 Q3 YTD YTD 2021 2020 2021 2020 Basic Earnings (0.90) $ (0.76) $ 0.62 $ 0.57 $ Non-Core Items SCE 2017/2018 Wildfire/Mudslide Events claims and expenses, net of recoveries (2.37) (2.32) (2.40) (2.41) Wildfire Insurance Fund expense (0.10) (0.16) (0.31) (0.49) Sale of San Onofre nuclear fuel — 0.05 0.02 0.16 Disallowed historical capital expenditures in SCE's 2021 GRC decision (0.12) — (0.12) — Re-measurement of tax liabilities — — — 0.05 EIX Parent & Other Goodwill impairment and other — — — (0.07) Less: Total non-core items (2.59) (2.43) (2.81) (2.76) Core Earnings 1.69 $ 1.67 $ 3.43 $ 3.33 $ Reconciliation of EIX Basic Earnings Per Share to EIX Core Earnings Per Share EPS Attributable to Edison International

GRAPHIC

21 Low High Basic EIX EPS2 $1.62 $1.72 Total Non-Core Items2 (2.80)(2.80) Core EIX EPS $4.42 $4.52 1. EPS is calculated on the assumed weighted-average share count for 2021 of 379.7 million 2. There were ($1,065) million, or ($2.80) per share of non-core items recorded for the nine months ended September 30, 2021, calculated based on an assumed weighted average share count for 2021 3. Basic EIX EPS guidance only incorporates non-core items to September 30, 2021 Earnings Per Share Non-GAAP Reconciliations November 2, 2021 Reconciliation of EIX Basic Earnings Per Share Guidance to EIX Core Earnings Per Share Guidance1 2021 EPS Attributable to Edison International

GRAPHIC

22 Edison International's earnings are prepared in accordance with generally accepted accounting principles used in the United States. Management uses core earnings (losses) internally for financial planning and for analysis of performance. Core earnings (losses) are also used when communicating with investors and analysts regarding Edison International's earnings results to facilitate comparisons of the company's performance from period to period. Core earnings (losses) are a non-GAAP financial measure and may not be comparable to those of other companies. Core earnings (losses) are defined as earnings attributable to Edison International shareholders less non-core items. Non- core items include income or loss from discontinued operations and income or loss from significant discrete items that management does not consider representative of ongoing earnings, such as write downs, asset impairments and other income and expense related to changes in law, outcomes in tax, regulatory or legal proceedings, and exit activities, including sale of certain assets and other activities that are no longer continuing. A reconciliation of Non-GAAP information to GAAP information is included either on the slide where the information appears or on another slide referenced in this presentation. EIX Investor Relations Contact Sam Ramraj, Vice President Derek Matsushima, Senior Manager (626) 302-2540 (626) 302-3625 [email protected] [email protected] Use of Non-GAAP Financial Measures November 2, 2021