scsc-20260205
0000918965false00009189652025-08-212025-08-21

UNITED STATES
SECURITIES AND EXCHANGE COMMISSION
Washington, D.C. 20549
 
Form 8-K
 
CURRENT REPORT

Pursuant to Section 13 or 15(d) of the
Securities Exchange Act of 1934

Date of Report (Date of earliest event reported): February 5, 2026

 ScanSource, Inc.
(Exact name of registrant as specified in its charter)
SC00-26926 57-0965380
(State or other jurisdiction
of incorporation)
(Commission File Number) (IRS Employer
Identification No.)

6 Logue Court, Greenville, SC 29615
(Address of principal executive offices, including zip code)
864-288-2432
(Registrant’s telephone number, including area code)
Title of Each ClassTrading SymbolName of Each Exchange on Which Registered
Common Stock, no par valueSCSCNASDAQ Global Select Market
 
Check the appropriate box below if the Form 8-K filing is intended to simultaneously satisfy the filing obligation of the registrant under any of the following provisions:
Written communications pursuant to Rule 425 under the Securities Act (17 CFR 230.425)
Soliciting material pursuant to Rule 14a-12 under the Exchange Act (17 CFR 240.14a-12)
Pre-commencement communications pursuant to Rule 14d-2(b) under the Exchange Act (17 CFR 240.14d-2(b))
Pre-commencement communications pursuant to Rule 13e-4(c) under the Exchange Act (17 CFR 240.13e-4(c))

Indicate by check mark whether the registrant is an emerging growth company as defined in Rule 405 of the Securities Act of 1933 or Rule 12b-2 of the Securities Exchange Act of 1934.
Emerging growth company

If an emerging growth company, indicate by check mark if the registrant has elected not to use the extended transition period for complying with any new or revised financial accounting standards provided pursuant to Section 13(a) of the Exchange Act.      


Item 2.02. Results of Operations and Financial Condition

On February 5, 2026, ScanSource, Inc. (the "Company") issued a press release announcing its financial results for its second quarter ended December 31, 2025. A copy of the press release and accompanying Earnings Infographic are attached as Exhibits 99.1 and 99.2 hereto, incorporated herein by reference and also made available through the Company’s website at www.scansource.com. An updated investor presentation will be made available on the Company's website within approximately two weeks.

The information in Item 2.02 of this Report, including the Exhibits 99.1 and 99.2 hereto, is being furnished and shall not be deemed “filed” for purposes of Section 18 of the Securities Exchange Act of 1934, as amended (the “Exchange Act”), or otherwise subject to the liabilities of that section, nor shall it be deemed incorporated by reference in any other filing under the Securities Act of 1933, as amended (the “Securities Act”), or the Exchange Act.


Item 7.01. Regulation FD Disclosure

In addition to announcing financial results as discussed above, the Company's press release issued on February 5, 2026 also announced that the Company's Board of Directors (the “Board”) has appointed Charles A. Mathis to serve as the Lead Independent Director of the Board and Chair of the Nominating and Corporate Governance Committee of the Board, in each case to succeed Peter C. Browning. Mr. Browning will continue to serve on the Board as an independent director and on each of its committees. The Board also appointed Vernon J. Nagel to succeed Mr. Mathis as the Chair of the Audit Committee of the Board. A copy of the press release is attached as Exhibit 99.1 hereto, incorporated by reference herein and also made available through the Company's website at www.scansource.com.

The information in Item 7.01 of this Report, including Exhibits 99.1 hereto, is being furnished and shall not be deemed “filed” for purposes of Section 18 of the Exchange Act or otherwise subject to the liabilities of that section, nor shall it be deeded incorporated by reference in any other filing under the Securities Act or the Exchange Act.


Item 9.01. Financial Statements and Exhibits

(d) Exhibits

99.1 – Press release issued by ScanSource, Inc. on February 5, 2026. The information contained in the attached exhibit is unaudited and should be read in conjunction with the Company’s annual and quarterly reports filed with the Securities and Exchange Commission.

99.2 – Earnings Infographic for the financial results conference call held on February 5, 2026.  The information contained in the attached exhibit is unaudited and should be read in conjunction with the Company’s annual and quarterly reports filed with the Securities and Exchange Commission.

Exhibit
Number
Description
99.1
99.2
104Cover Page Interactive Data File (embedded within the Inline XBRL document)

SIGNATURES

Pursuant to the requirements of the Securities Exchange Act of 1934, the Registrant has duly caused this report to be signed on its behalf by the undersigned hereunto duly authorized.
    ScanSource, Inc.
    
Date:February 5, 2026    /s/ STEVE JONES
     Steve Jones
     Senior Executive Vice President and Chief Financial Officer


Exhibit 99.1

FOR IMMEDIATE RELEASE
Contact:  
Steve Jones Mary M. Gentry
Senior EVP, Chief Financial OfficerSVP, Finance and Treasurer
ScanSource, Inc. ScanSource, Inc.
(864) 286-4302 (864) 286-4892

SCANSOURCE REPORTS SECOND QUARTER RESULTS
GREENVILLE, SC -- February 5, 2026 -- ScanSource, Inc. (NASDAQ: SCSC), a leading technology distributor uniquely positioned to address complex, converging technologies, today announced financial results for the second quarter ended December 31, 2025.

Second Quarter Summary
Q2 FY26Q2 FY25Change
(in thousands, except percentages and per share data)
Select reported measures:
Net sales$766,512 $747,497 2.5%
Gross profit$102,910 $101,723 1.2%
Gross profit margin %13.4 %13.6 %-18bp
Operating income$17,868 $18,444 -3.1%
GAAP net income$16,493 $17,053 -3.3%
GAAP diluted EPS$0.75 $0.70 7.1%
Select Non-GAAP measures*:
Adjusted EBITDA$31,193 $35,299 -11.6%
Adjusted EBITDA margin %4.07 %4.72 %-65bp
Non-GAAP net income$17,611 $20,698 -14.9%
Non-GAAP diluted EPS$0.80 $0.85 -5.9%
Note: Margin % reflects measure as a percentage of sales.
* Represents non-GAAP financial measures. For more information and a reconciliation to the most directly comparable GAAP financial measure, see "Non-GAAP Financial Information" below as well as the accompanying Supplementary Information.

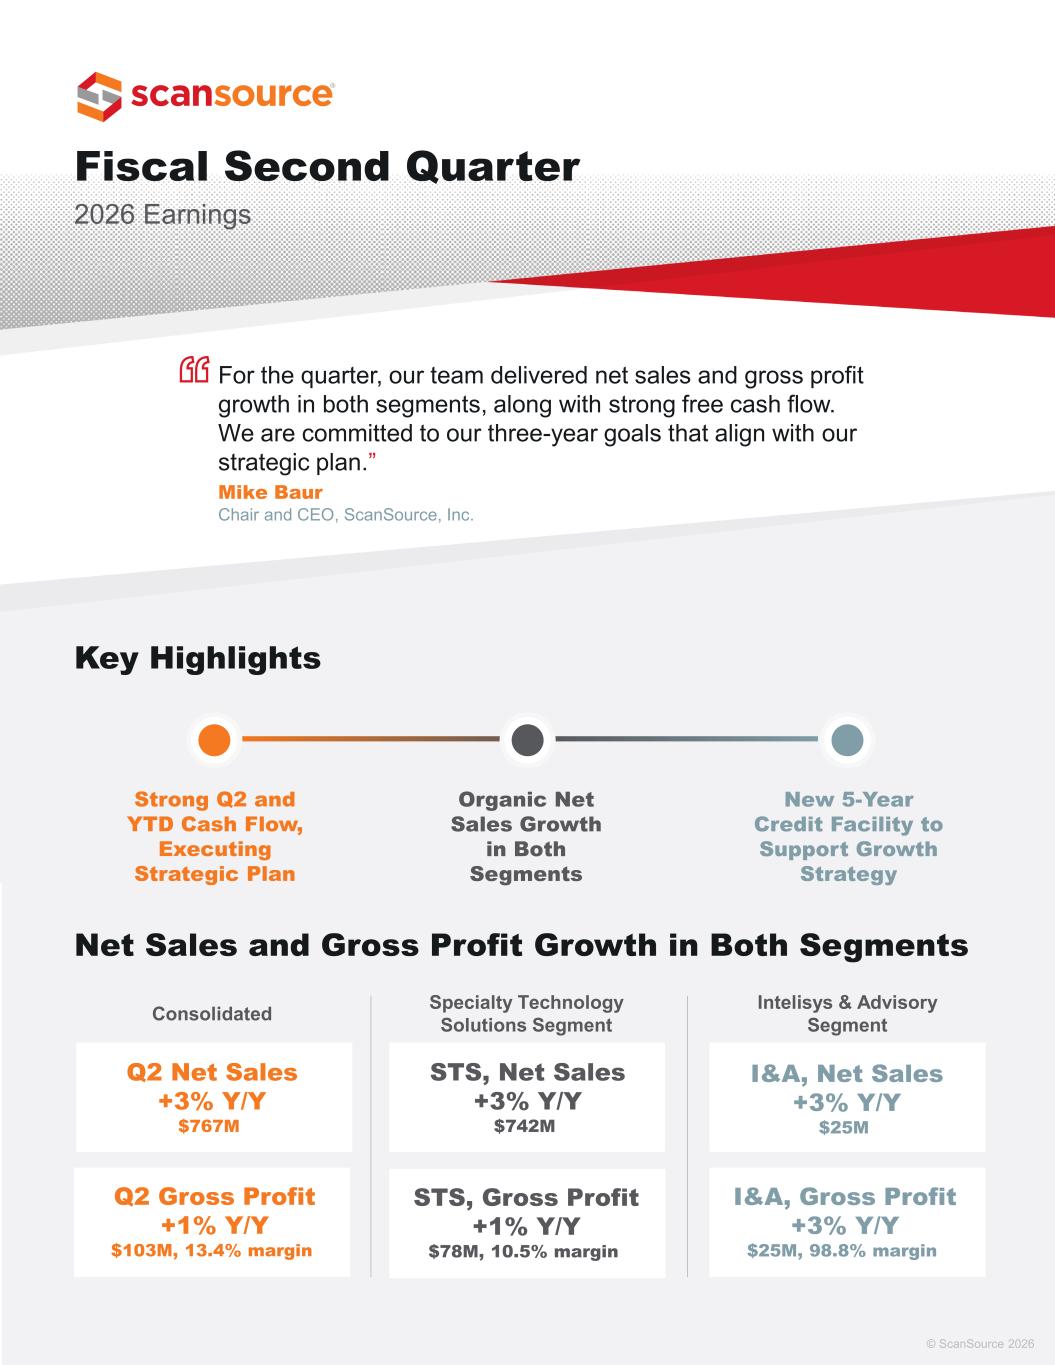
“For the quarter, our team delivered net sales and gross profit growth in both segments, along with strong free cash flow,” said Mike Baur, Chair and CEO, ScanSource, Inc. “We are committed to our three-year goals that align with our strategic plan.”

Quarterly Results

Net sales for the second quarter of fiscal year 2026 totaled $766.5 million, an increase of 2.5% year-over-year, or an increase of 1.7% on a non-GAAP basis. Net sales for products and services increased 1.9% year-over-year, and recurring revenue increased 15.9% year-over-year including acquisitions. For Specialty Technology Solutions, second quarter net sales of $741.5 million increased 2.5% year-over-year, driven by growth in North America. Intelisys & Advisory net sales for the second quarter increased 3.1% year-over-year to $25.0 million led by Intelisys organic net sales growth.

Gross profit for the second quarter of fiscal year 2026 increased 1.2% year-over-year to $102.9 million, with a gross profit margin of 13.4% versus 13.6% in the prior-year quarter. For the second quarter of fiscal year 2026, the percentage of gross profit from recurring revenue increased to 37.2%, from 32.5% for the prior-year period.

For the second quarter of fiscal year 2026, operating income was $17.9 million, compared to $18.4 million in the prior-year quarter. Second quarter fiscal year 2026 non-GAAP operating income decreased to $23.2 million from $25.9 million in the prior-year quarter.

On a GAAP basis, net income for the second quarter of fiscal year 2026 totaled $16.5 million, or $0.75 per diluted share, compared to net income of $17.1 million, or $0.70 per diluted share, for the prior-year quarter. Second quarter fiscal year 2026
1


non-GAAP net income decreased to $17.6 million, or $0.80 per diluted share, from $20.7 million, or $0.85 per diluted share, for the prior-year quarter. On a non-GAAP basis, adjusted EBITDA for the second quarter of fiscal year 2026 totaled $31.2 million, or 4.07% of net sales, compared to $35.3 million, or 4.72% of net sales, for the prior-year quarter.

Balance Sheet and Cash Flow

As of December 31, 2025, ScanSource had cash and cash equivalents of $83.5 million and total debt of $102.7 million.

For fiscal year 2026, ScanSource generated $54.1 million of operating cash flow and $49.7 million of free cash flow (non-GAAP). ScanSource also had share repurchases of $38.7 million for the six months of fiscal 2026.

Annual Financial Outlook for Fiscal Year 2026

ScanSource updates its expectations for net sales and adjusted EBITDA for the full fiscal year ended June 30, 2026 and replaces previously provided guidance.

FY26 Annual OutlookPrior FY26 Annual Outlook
Net sales $3.0 billion to $3.1 billion$3.1 billion to $3.3 billion
Adjusted EBITDA (non-GAAP)$140 million to $150 million$150 million to $160 million
Free cash flow (non-GAAP)At least $80 millionAt least $80 million

Adjusted EBITDA is a non-GAAP measure, which excludes estimates for amortization of intangible assets, depreciation expense, and non-cash shared-based compensation expense. Free cash flow is a non-GAAP measure, which excludes the effect of estimated capital expenditures from estimated operating cash flow. These measures are forward-looking, and actual results may differ materially.

ScanSource believes that a quantitative reconciliation of such forward-looking information to the most directly comparable GAAP financial measures cannot be made without unreasonable efforts, because a reconciliation of these non-GAAP financial measures would require an estimate of future non-operating items such as acquisitions and divestitures, restructuring costs, impairment charges and other unusual or non-recurring items. Neither the timing nor likelihood of these events, nor their probable significance, can be quantified with a reasonable degree of accuracy. Accordingly, a reconciliation of such forward-looking information to the most directly comparable GAAP financial measures is not provided.

Governance Changes

ScanSource's Board of Directors has appointed Charles A. Mathis to succeed Peter C. Browning as the Lead Independent Director of the Board and Chair of the Nominating and Corporate Governance Committee of the Board, effective January 29, 2026. Peter Browning will continue to serve on the Board as an independent director and on each of the committees. The Board appointed Vernon J. Nagel to succeed Charles Mathis as the Chair of the Audit Committee of the Board, also effective January 29, 2026.

Webcast Details and Earnings Infographic
At approximately 8:45 a.m. ET today, an Earnings Infographic, as a supplement to this press release and the earnings conference call, will be available on ScanSource's website, www.scansource.com (Investor Relations section). ScanSource will present additional information about its financial results and business in a conference call today, February 5, 2026, at 10:30 a.m. ET. A webcast of the call will be available for all interested parties and can be accessed at www.scansource.com (Investor Relations section). The webcast will be available for replay for 60 days.

Safe Harbor Statement

This press release contains “forward-looking” statements, including ScanSource's FY26 annual outlook, which involve risks and uncertainties, many of which are beyond ScanSource's control. No undue reliance should be placed on such statements, as any number of factors could cause actual results to differ materially from anticipated or forecasted results, including, but not limited to, the following factors, which are neither presented in order of importance nor weighted: macroeconomic conditions, including potential prolonged economic weakness, inflation, tariffs and changes in trade policy, the failure to manage and implement ScanSource's growth strategy, the ability for ScanSource to realize the synergies or other benefits from acquisitions, credit risks involving ScanSource's larger channel sales partners and suppliers, changes in interest and exchange rates and
2


regulatory regimes impacting ScanSource's international operations, including new or increased tariffs, risk to the business from a cyberattack, a failure of IT systems, failure to hire and retain quality employees, loss of ScanSource's major channel sales partners, relationships with key suppliers and channel sales partners or a termination or a modification of the terms under which it operates with these key suppliers and channel sales partners, changes in ScanSource's operating strategy, and other factors set forth in the "Risk Factors" contained in ScanSource's annual report on Form 10-K for the year ended June 30, 2025. Except as may be required by law, ScanSource expressly disclaims any obligation to update these forward-looking statements to reflect events or circumstances after the date of this press release or otherwise.

Non-GAAP Financial Information

In addition to disclosing results that are determined in accordance with United States Generally Accepted Accounting Principles ("GAAP"), ScanSource also discloses certain non-GAAP financial measures, which are summarized below. Non-GAAP financial measures are used to understand and evaluate performance, including comparisons from period to period. Non-GAAP results exclude items such as amortization of intangible assets related to acquisitions, acquisition and divestiture costs, gain/loss on sale of business, and restructuring costs and include other non-GAAP adjustments.

Net sales on a constant currency basis excluding acquisitions and divestitures to calculate organic growth ("non-GAAP net sales"): ScanSource discloses the percentage change in net sales excluding the translation impact from changes in foreign currency exchange rates between reporting periods and excluding the net sales from acquisitions and divestitures prior to the first full year from the transaction date. This measure enhances the comparability between periods to help analyze underlying trends on an organic basis.

Adjusted earnings before interest expense, income taxes, depreciation, and amortization (“Adjusted EBITDA”): Adjusted EBITDA starts with net income and adds back interest expense, income tax expense, depreciation expense, amortization of intangible assets, change in fair value of contingent consideration, and other non-GAAP adjustments, including acquisition and divestiture costs, restructuring costs, cyberattack restoration costs, tax recovery, and non-cash share-based compensation expense. Since Adjusted EBITDA excludes some non-cash costs of investing in ScanSource’s business and people, management believes that Adjusted EBITDA shows the profitability from the business operations more clearly. The Adjusted EBITDA margin is calculated as Adjusted EBITDA as a percentage of net sales.

Adjusted return on invested capital ("Adjusted ROIC"): Adjusted ROIC assists management in comparing ScanSource's performance over various reporting periods on a consistent basis because it removes from operating results the impact of items that do not reflect core operating performance. Management believes the calculation of Adjusted ROIC provides useful information to investors and is an additional relevant comparison of its performance. Adjusted ROIC is calculated as Adjusted EBITDA over invested capital. Invested capital is defined as average equity plus average daily funded interest-bearing debt for the period. Management believes the calculation of Adjusted ROIC provides useful information to investors and is an additional relevant comparison of ScanSource's performance during the year.

Free cash flow: ScanSource presents free cash flow as it is a measure used by management to measure our business. ScanSource believes this measure provides more information regarding liquidity and capital resources. Free cash flow is defined as net cash provided by operating activities less capital expenditures.

Net debt: Net debt includes total balance sheet debt less cash and cash equivalents. ScanSource believes this measure is useful in assessing its borrowing capacity.

Additional Non-GAAP Metrics: To evaluate current period performance on a more consistent basis with prior periods, ScanSource discloses non-GAAP SG&A expenses, non-GAAP operating income, non-GAAP pre-tax income, non-GAAP net income, and non-GAAP diluted earnings per share (non-GAAP diluted EPS). These non-GAAP results exclude amortization of intangible assets related to acquisitions, change in fair value of contingent consideration, acquisition and divestiture costs, restructuring costs, and other non-GAAP adjustments. These metrics include the translation impact of changes in foreign currency exchange rates. Non-GAAP metrics are useful in assessing and understanding ScanSource's performance especially when comparing results with previous periods or forecasting performance for future periods.

These non-GAAP financial measures have limitations as analytical tools, and the non-GAAP financial measures that ScanSource reports may not be comparable to similarly titled amounts reported by other companies. Analysis of results and outlook on a non-GAAP basis should be considered in addition to, and not in substitution for or as superior to, measurements of financial performance prepared in accordance with GAAP. A reconciliation of ScanSource's non-GAAP financial information to GAAP is set forth in the Supplementary Information (Unaudited) below.

3


About ScanSource, Inc.

ScanSource, Inc. (NASDAQ: SCSC) is a leading technology distributor uniquely positioned to address complex, converging technologies and to accelerate growth for channel sales partners across hardware, software as a service (SaaS), connectivity and cloud services. ScanSource enables channel sales partners to deliver converging solutions for their end users. ScanSource uses multiple sales models to offer technology solutions from leading suppliers of specialty technologies, connectivity and cloud services. Founded in 1992 and headquartered in Greenville, South Carolina, ScanSource was named one of the 2025 Best Places to Work in South Carolina and on the Fortune World’s Most Admired Companies 2026 list. ScanSource ranks #875 on the Fortune 1000. For more information, visit www.scansource.com.

4

SCANSOURCE REPORTS SECOND QUARTER RESULTS

ScanSource, Inc. and Subsidiaries
Condensed Consolidated Balance Sheets (Unaudited)
(in thousands, except share data)
December 31, 2025June 30, 2025*
Assets
Current assets:
Cash and cash equivalents$83,466 $126,157 
Accounts receivable, less allowance of $31,534 at December 31, 2025
and $27,821 at June 30, 2025
605,411 635,521 
Inventories490,259 483,815 
Prepaid income tax expense11,208 2,821 
Prepaid expenses and other current assets112,727 122,138 
Total current assets1,303,071 1,370,452 
Property and equipment, net32,158 31,169 
Goodwill244,178 230,820 
Identifiable intangible assets, net72,423 62,909 
Deferred income taxes14,172 18,769 
Other non-current assets75,669 71,487 
Total assets$1,741,671 $1,785,606 
Liabilities and Shareholders’ Equity
Current liabilities:
Accounts payable$576,662 $598,595 
Accrued expenses and other current liabilities67,982 71,263 
Current portion of contingent consideration16,447 1,318 
Income taxes payable274 3,927 
Current portion of long-term debt2,866 7,861 
Total current liabilities664,231 682,964 
Long-term debt, net of current portion99,797 128,288 
Long-term portion of contingent consideration12,153 17,782 
Other long-term liabilities54,604 50,163 
Total liabilities830,785 879,197 
Commitments and contingencies
Shareholders’ equity:
Preferred stock, no par value; 3,000,000 shares authorized, none issued
 — 
Common stock, no par value; 45,000,000 shares authorized, 21,645,381 and 22,217,421 shares issued and outstanding at December 31, 2025 and June 30, 2025, respectively
 — 
Retained earnings1,027,300 1,020,833 
Accumulated other comprehensive loss(116,414)(114,424)
Total shareholders’ equity910,886 906,409 
Total liabilities and shareholders’ equity$1,741,671 $1,785,606 
*Derived from audited financial statements.

5

SCANSOURCE REPORTS SECOND QUARTER RESULTS
ScanSource, Inc. and Subsidiaries
Condensed Consolidated Income Statements (Unaudited)
(in thousands, except per share data)
 Quarter ended December 31,Six months ended December 31,
 2025202420252024
Net sales$766,512 $747,497 $1,506,162 $1,523,077 
Cost of goods sold663,602 645,774 1,295,779 1,319,735 
Gross profit102,910 101,723 210,383 203,342 
Selling, general and administrative expenses78,114 73,920 153,388 145,626 
Depreciation expense1,434 2,902 3,011 5,759 
Intangible amortization expense4,285 5,001 8,689 9,359 
Restructuring and other charges 313  5,381 
Change in fair value of contingent consideration1,209 1,143 1,523 1,143 
Operating income17,868 18,444 43,772 36,074 
Interest expense1,946 1,970 3,859 4,078 
Interest income(3,363)(2,693)(6,543)(5,352)
Other (income) expense, net(136)(543)37 (5,325)
Income before income taxes19,421 19,710 46,419 42,673 
Provision for income taxes2,928 2,657 10,047 8,645 
Net income$16,493 $17,053 $36,372 $34,028 
Per share data:
Net income per common share, basic$0.75 $0.72 $1.66 $1.42 
Weighted-average shares outstanding, basic21,865 23,806 21,942 23,976 
Net income per common share, diluted$0.75 $0.70 $1.63 $1.39 
Weighted-average shares outstanding, diluted22,110 24,217 22,248 24,450 


6

SCANSOURCE REPORTS SECOND QUARTER RESULTS
ScanSource, Inc. and Subsidiaries
Condensed Consolidated Statements of Cash Flows (Unaudited)
(in thousands)
Six months ended December 31,
20252024
Cash flows from operating activities:
Net income$36,372 $34,028 
Adjustments to reconcile net income to net cash provided by operating activities:
Depreciation and amortization12,138 15,603 
Amortization of debt issue costs434 193 
Provision for doubtful accounts5,580 5,925 
Share-based compensation6,536 5,492 
Deferred income taxes32 2,306 
Change in fair value of contingent consideration1,523 1,143 
Finance lease interest28 48 
Changes in operating assets and liabilities, net of acquisitions:
Accounts receivable24,077 21,110 
Inventories(6,618)16,316 
Prepaid expenses and other assets945 (380)
Other non-current assets(3,861)3,145 
Accounts payable(21,383)(64,915)
Accrued expenses and other liabilities1,872 (1,834)
Income taxes payable(3,623)462 
Net cash provided by operating activities54,052 38,642 
Cash flows from investing activities:
Capital expenditures(4,370)(4,348)
Cash paid for business acquisitions, net of cash acquired(18,358)(56,673)
Proceeds from sale of business, net of cash transferred 2,569 
Net cash used in investing activities(22,728)(58,452)
Cash flows from financing activities:
Borrowings on revolving credit141,738 26,587 
Repayments on revolving credit(141,738)(26,636)
Borrowings on long-term debt100,000 — 
Repayments on long-term debt(133,486)(4,107)
Repayments on finance lease obligation(523)(547)
Debt issuance costs(1,417)— 
Contingent consideration payments(1,375)— 
Exercise of stock options4,854 9,489 
Taxes paid on settlement of equity awards(2,634)(4,805)
Common stock repurchased(38,687)(52,342)
Net cash used in financing activities(73,268)(52,361)
Effect of exchange rate changes on cash and cash equivalents(747)(2,769)
Decrease in cash and cash equivalents(42,691)(74,940)
Cash and cash equivalents at beginning of period126,157 185,460 
Cash and cash equivalents at period end$83,466 $110,520 


7

SCANSOURCE REPORTS SECOND QUARTER RESULTS
ScanSource, Inc. and Subsidiaries
Supplementary Information (Unaudited)
(in thousands, except percentages)
Non-GAAP Financial Information:
Quarter ended December 31,
20252024
Reconciliation of Net Income to Adjusted EBITDA:
Net income (GAAP)$16,493$17,053
Plus: Interest expense1,9461,970
Plus: Income taxes2,9282,657
Plus: Depreciation and amortization5,9388,132
EBITDA (non-GAAP)27,30529,812
Plus: Change in fair value of contingent consideration1,2091,143
Plus: Share-based compensation3,6603,021
Plus: Acquisition costs (a)
593151
Plus: Cyberattack restoration costs5330
Plus: Restructuring costs313
Plus: Legal settlement1,579
Plus: Tax recovery(789)(750)
Plus: Insurance recovery, net of payments(838)
Adjusted EBITDA (numerator for Adjusted ROIC) (non-GAAP)$31,193$35,299
Invested Capital Calculations:
Equity – beginning of the period$914,032$920,893
Equity – end of the period910,886900,662
Plus: Change in fair value of contingent consideration, net 907861
Plus: Share-based compensation, net2,7412,271
Plus: Acquisition costs (a)
593151
Plus: Cyberattack restoration costs, net3923
Plus: Restructuring costs, net 236
Plus: Insurance recovery, net(629)
Plus: Legal settlement, net1,189
Plus: Tax recovery, net(2,991)(2,560)
Average equity912,789911,863
Average funded debt (b)
131,470142,143
Invested capital (denominator for Adjusted ROIC) (non-GAAP)$1,044,259$1,054,006
Adjusted return on invested capital ratio (Adjusted ROIC), annualized (c)
11.9 %13.3 %
(a) Acquisition costs are generally non-deductible for tax purposes.
(b) Average funded debt is calculated as the average daily amounts outstanding on short-term and long-term interest-bearing debt.
(c) The annualized adjusted EBITDA amount is divided by days in the quarter times 365 days per year, or 366 days for leap year. There were 92 days in the current quarter and prior-year quarter.


8

SCANSOURCE REPORTS SECOND QUARTER RESULTS
ScanSource, Inc. and Subsidiaries
Supplementary Information (Unaudited)
Net Sales by Segment:
Quarter ended December 31,
20252024% Change
Specialty Technology Solutions:(in thousands)
Net sales, reported$741,540 $723,277 2.5 %
Foreign exchange impact (a)
(4,412)— 
Less: Acquisitions(2,034)— 
Non-GAAP net sales$735,094 $723,277 1.6 %
Intelisys & Advisory:
Non-GAAP net sales$24,972 $24,220 3.1 %
Consolidated:
Net sales, reported$766,512 $747,497 2.5 %
Foreign exchange impact (a)
(4,412)— 
Less: Acquisitions(2,034)— 
Non-GAAP net sales$760,066 $747,497 1.7 %
(a) Year-over-year net sales growth rate excluding the translation impact of changes in foreign currency exchange rates. Calculated by translating the net sales for the quarter ended December 31, 2025 into U.S. dollars using the average foreign exchange rates for the quarter ended December 31, 2024.
Net Sales by Revenue Type:
Quarter ended December 31,
20252024% Change
(in thousands)
Net sales by product/service:
Products and services$724,489 $711,235 1.9 %
Recurring revenue(a)
42,023 36,262 15.9 %
$766,512 $747,497 2.5 %
(a) Recurring revenue represents primarily agency commissions, managed connectivity, SaaS, subscriptions, and hardware rentals.
9

SCANSOURCE REPORTS SECOND QUARTER RESULTS
ScanSource, Inc. and Subsidiaries
Supplementary Information (Unaudited)
Net Sales by Geography:
Quarter ended December 31,
20252024% Change
United States:(in thousands)
Net sales, reported (a)
$707,366 $687,111 2.9 %
Less: Acquisitions(2,034)— 
Non-GAAP net sales$705,332 $687,111 2.7 %
Brazil:
Net sales, reported (b)
$59,146 $60,386 (2.1)%
Foreign exchange impact (c)
(4,412)— 
Non-GAAP net sales$54,734 $60,386 (9.4)%
Consolidated:
Net sales, reported $766,512 $747,497 2.5 %
Foreign exchange impact (c)
(4,412)— 
Less: Acquisitions(2,034)— 
Non-GAAP net sales$760,066 $747,497 1.7 %
(a) Includes net sales in Canada that are supported by U.S. operations and represent less than 5.0% of United States net sales for the quarters ended December 31, 2025 and 2024.
(b) Includes net sales from outside of the United States, Canada and Brazil, which represent less than 0.1% of Brazil net sales for the quarters ended December 31, 2025 and 2024.
(c) Year-over-year net sales growth rate excluding the translation impact of changes in foreign currency exchange rates. Calculated by translating the net sales for the quarter ended December 31, 2025 into U.S. dollars using the average foreign exchange rates for the quarter ended December 31, 2024.
Free Cash Flow:
Quarter ended December 31,Six months ended December 31,
2025202420252024
GAAP operating cash flow$30,838 $(6,190)$54,052 $38,642 
Less: Capital expenditures(1,975)(1,974)(4,370)(4,348)
Free cash flow (non-GAAP)$28,863 $(8,164)$49,682 $34,294 


10

SCANSOURCE REPORTS SECOND QUARTER RESULTS
ScanSource, Inc. and Subsidiaries
Supplementary Information (Unaudited)
(in thousands, except per share data)
Reconciliation of Other Non-GAAP Financial Information:
Quarter ended December 31, 2025
GAAP MeasureIntangible amortization expenseChange in fair value of contingent consideration
Acquisition costs (a)
Restructuring costsTax recoveryCyberattack restoration costsInsurance RecoveryNon-GAAP measure
(in thousands, except per share data)
SG&A expenses$78,114 $ $ $(593)$ $789 $(53)$ $78,257 
Operating income17,868 4,285 1,209 593  (789)53  23,219 
Pre-tax income19,421 4,285 1,209 593  (789)53 (838)23,934 
Net income16,493 3,199 907 593  (2,991)39 (629)17,611 
Diluted EPS$0.75 $0.14 $0.04 $0.03 $ $(0.14)$ $(0.03)$0.80 
Quarter ended December 31, 2024
GAAP MeasureIntangible amortization expenseChange in fair value of contingent consideration
Acquisition costs (a)
Restructuring costsTax recoveryCyberattack restoration costsLegal SettlementNon-GAAP measure
(in thousands, except per share data)
SG&A expense$73,920 $— $— $(151)$— $750 $(30)$(1,579)$72,910 
Operating income18,444 5,001 1,143 151 313 (750)30 1,579 25,911 
Pre-tax income19,710 5,001 1,143 151 313 (750)30 1,579 27,177 
Net income17,053 3,745 861 151 236 (2,560)23 1,189 20,698 
Diluted EPS$0.70 $0.15 $0.04 $0.01 $0.01 $(0.11)$— $0.05 $0.85 
(a) Acquisition costs for the quarters ended December 31, 2025 and December 31, 2024 are generally nondeductible for tax purposes.


11
Fiscal Second Quarter 2026 Earnings Key Highlights © ScanSource 2026 Consolidated For the quarter, our team delivered net sales and gross profit growth in both segments, along with strong free cash flow. We are committed to our three-year goals that align with our strategic plan.” Mike Baur Chair and CEO, ScanSource, Inc. Strong Q2 and YTD Cash Flow, Executing Strategic Plan Organic Net Sales Growth in Both Segments New 5-Year Credit Facility to Support Growth Strategy Net Sales and Gross Profit Growth in Both Segments Specialty Technology Solutions Segment Intelisys & Advisory Segment Q2 Net Sales +3% Y/Y $767M Q2 Gross Profit +1% Y/Y $103M, 13.4% margin STS, Net Sales +3% Y/Y $742M STS, Gross Profit +1% Y/Y $78M, 10.5% margin I&A, Net Sales +3% Y/Y $25M I&A, Gross Profit +3% Y/Y $25M, 98.8% margin
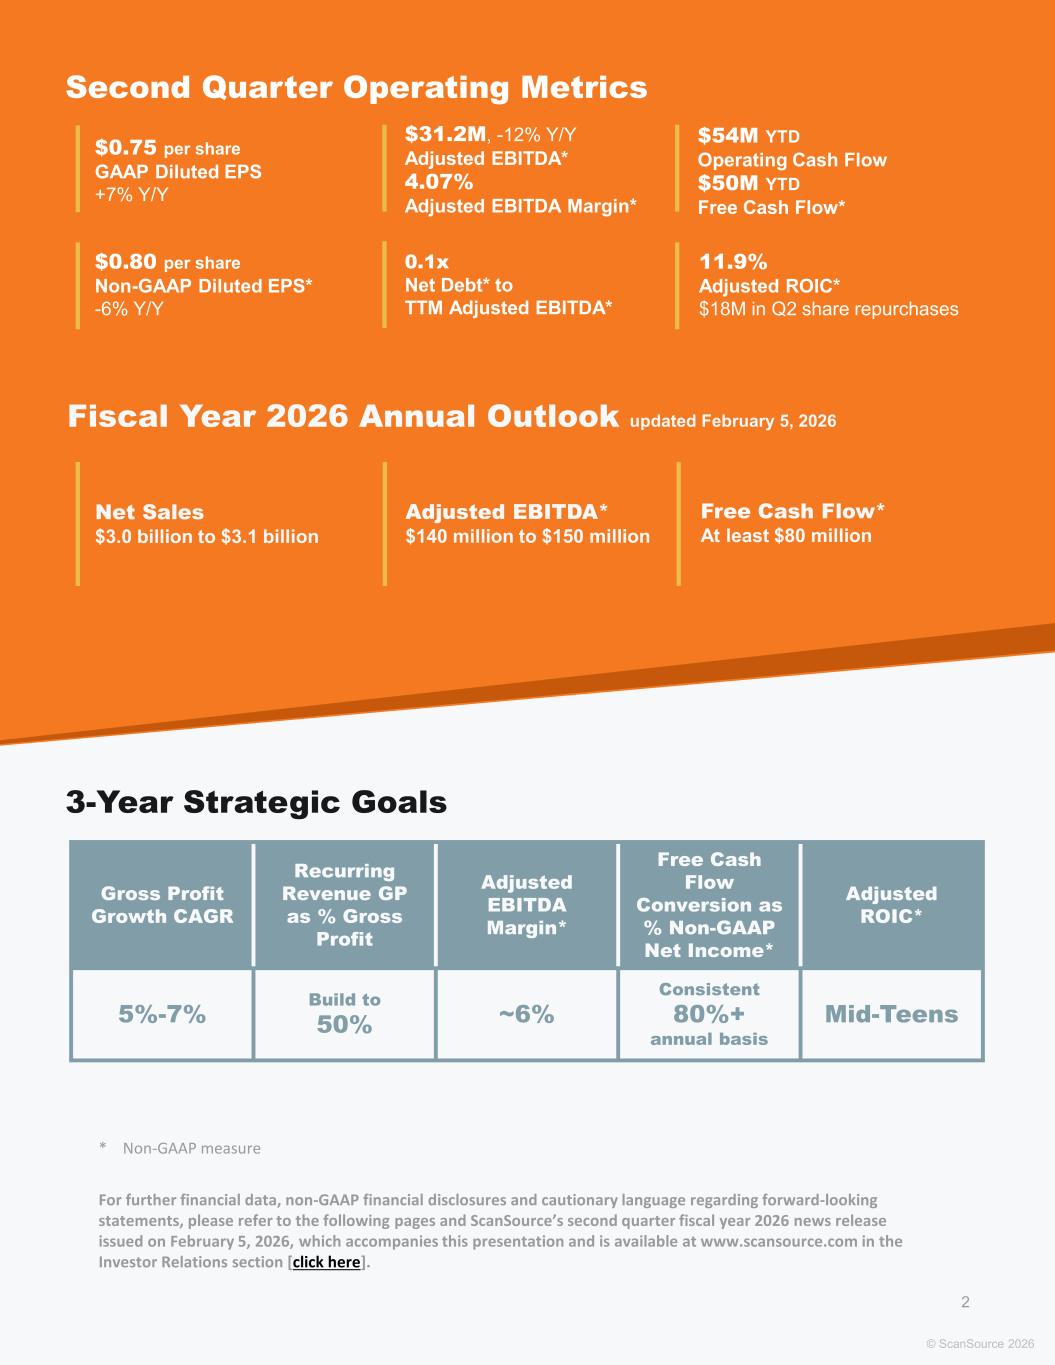

 
* Non-GAAP measure For further financial data, non-GAAP financial disclosures and cautionary language regarding forward-looking statements, please refer to the following pages and ScanSource’s second quarter fiscal year 2026 news release issued on February 5, 2026, which accompanies this presentation and is available at www.scansource.com in the Investor Relations section [click here]. Second Quarter Operating Metrics 3-Year Strategic Goals Fiscal Year 2026 Annual Outlook updated February 5, 2026 © ScanSource 2026 2 Net Sales $3.0 billion to $3.1 billion Adjusted EBITDA* $140 million to $150 million Free Cash Flow* At least $80 million Gross Profit Growth CAGR Recurring Revenue GP as % Gross Profit Adjusted EBITDA Margin* Free Cash Flow Conversion as % Non-GAAP Net Income* Adjusted ROIC* 5%-7% Build to 50% ~6% Consistent 80%+ annual basis Mid-Teens $0.75 per share GAAP Diluted EPS +7% Y/Y $31.2M, -12% Y/Y Adjusted EBITDA* 4.07% Adjusted EBITDA Margin* $54M YTD Operating Cash Flow $50M YTD Free Cash Flow* $0.80 per share Non-GAAP Diluted EPS* -6% Y/Y 0.1x Net Debt* to TTM Adjusted EBITDA* 11.9% Adjusted ROIC* $18M in Q2 share repurchases
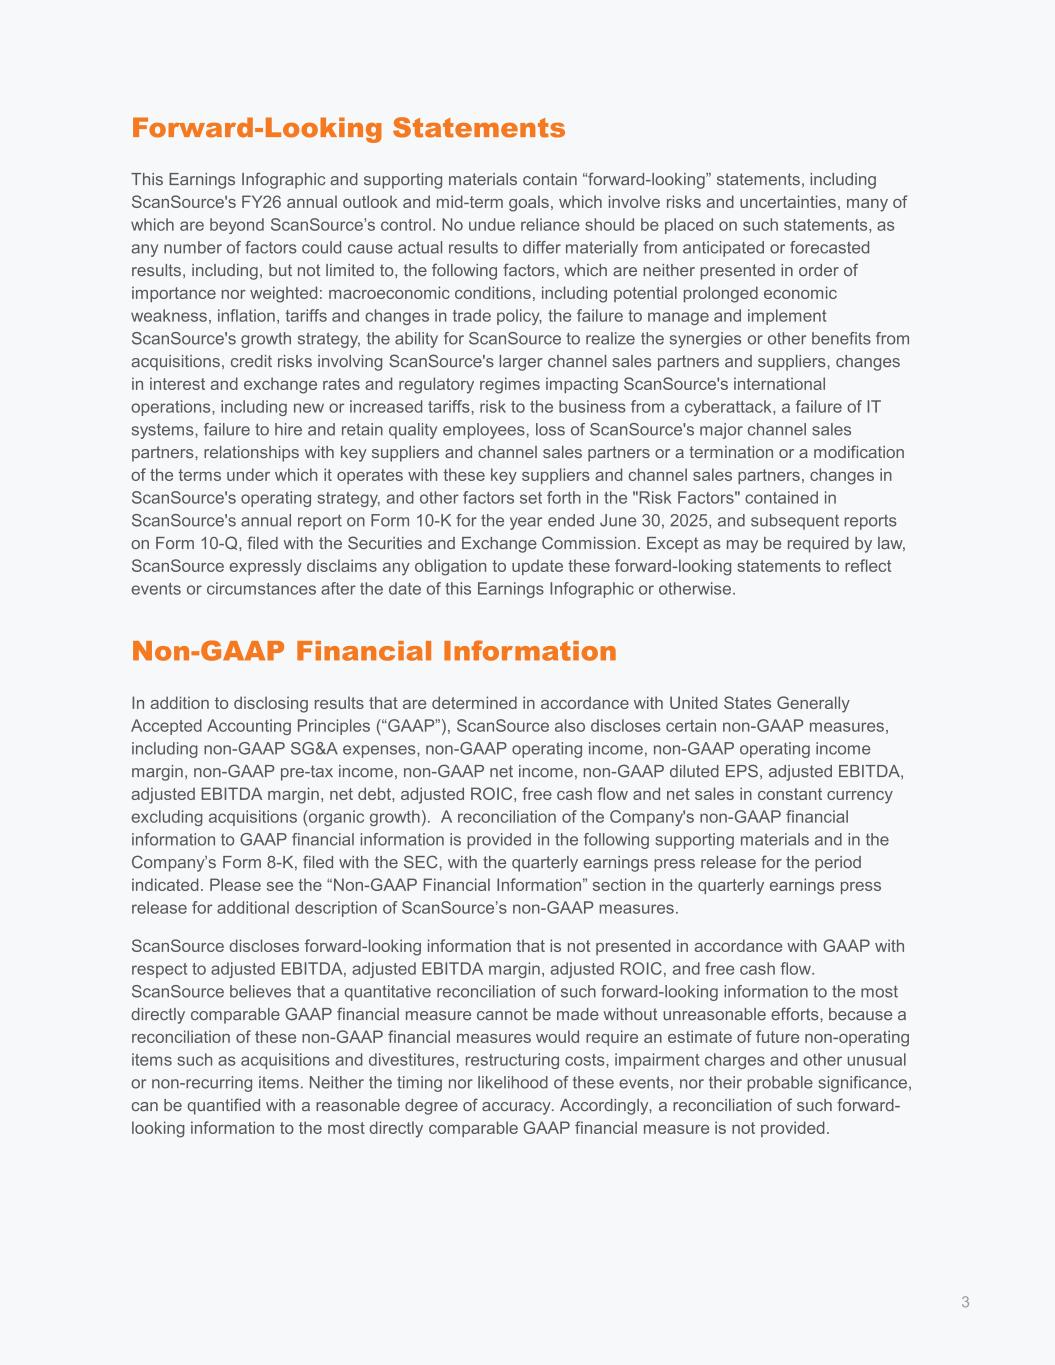

 
Forward-Looking Statements This Earnings Infographic and supporting materials contain “forward-looking” statements, including ScanSource's FY26 annual outlook and mid-term goals, which involve risks and uncertainties, many of which are beyond ScanSource’s control. No undue reliance should be placed on such statements, as any number of factors could cause actual results to differ materially from anticipated or forecasted results, including, but not limited to, the following factors, which are neither presented in order of importance nor weighted: macroeconomic conditions, including potential prolonged economic weakness, inflation, tariffs and changes in trade policy, the failure to manage and implement ScanSource's growth strategy, the ability for ScanSource to realize the synergies or other benefits from acquisitions, credit risks involving ScanSource's larger channel sales partners and suppliers, changes in interest and exchange rates and regulatory regimes impacting ScanSource's international operations, including new or increased tariffs, risk to the business from a cyberattack, a failure of IT systems, failure to hire and retain quality employees, loss of ScanSource's major channel sales partners, relationships with key suppliers and channel sales partners or a termination or a modification of the terms under which it operates with these key suppliers and channel sales partners, changes in ScanSource's operating strategy, and other factors set forth in the "Risk Factors" contained in ScanSource's annual report on Form 10-K for the year ended June 30, 2025, and subsequent reports on Form 10-Q, filed with the Securities and Exchange Commission. Except as may be required by law, ScanSource expressly disclaims any obligation to update these forward-looking statements to reflect events or circumstances after the date of this Earnings Infographic or otherwise. Non-GAAP Financial Information In addition to disclosing results that are determined in accordance with United States Generally Accepted Accounting Principles (“GAAP”), ScanSource also discloses certain non-GAAP measures, including non-GAAP SG&A expenses, non-GAAP operating income, non-GAAP operating income margin, non-GAAP pre-tax income, non-GAAP net income, non-GAAP diluted EPS, adjusted EBITDA, adjusted EBITDA margin, net debt, adjusted ROIC, free cash flow and net sales in constant currency excluding acquisitions (organic growth). A reconciliation of the Company's non-GAAP financial information to GAAP financial information is provided in the following supporting materials and in the Company’s Form 8-K, filed with the SEC, with the quarterly earnings press release for the period indicated. Please see the “Non-GAAP Financial Information” section in the quarterly earnings press release for additional description of ScanSource’s non-GAAP measures. ScanSource discloses forward-looking information that is not presented in accordance with GAAP with respect to adjusted EBITDA, adjusted EBITDA margin, adjusted ROIC, and free cash flow. ScanSource believes that a quantitative reconciliation of such forward-looking information to the most directly comparable GAAP financial measure cannot be made without unreasonable efforts, because a reconciliation of these non-GAAP financial measures would require an estimate of future non-operating items such as acquisitions and divestitures, restructuring costs, impairment charges and other unusual or non-recurring items. Neither the timing nor likelihood of these events, nor their probable significance, can be quantified with a reasonable degree of accuracy. Accordingly, a reconciliation of such forward- looking information to the most directly comparable GAAP financial measure is not provided. 3
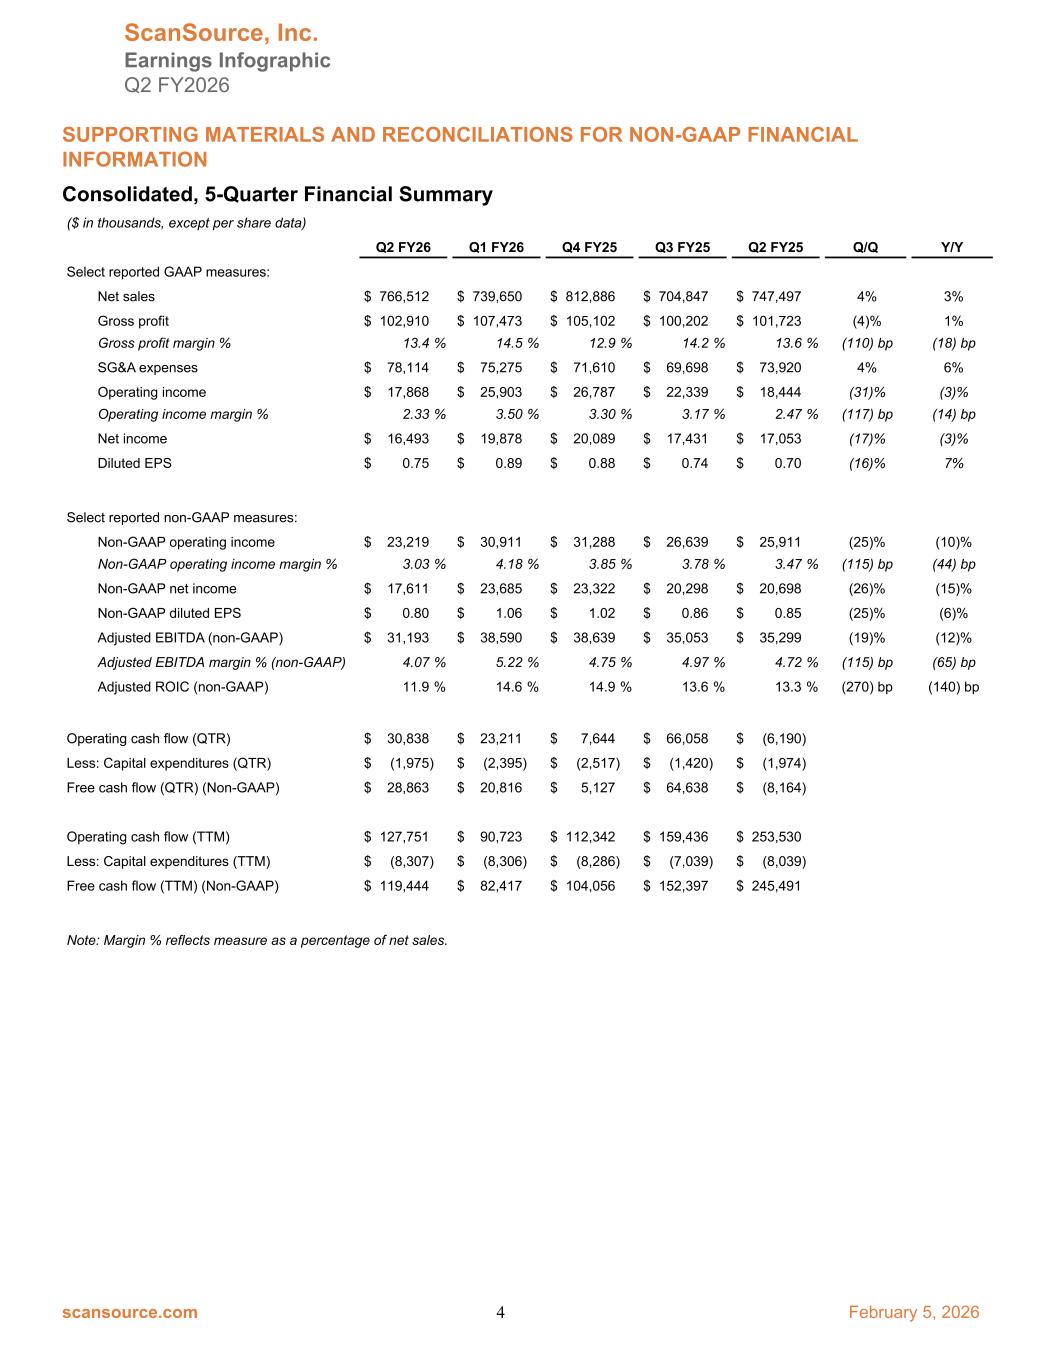

 
Consolidated, 5-Quarter Financial Summary ($ in thousands, except per share data) Q2 FY26 Q1 FY26 Q4 FY25 Q3 FY25 Q2 FY25 Q/Q Y/Y Select reported GAAP measures: Net sales $ 766,512 $ 739,650 $ 812,886 $ 704,847 $ 747,497 4% 3% Gross profit $ 102,910 $ 107,473 $ 105,102 $ 100,202 $ 101,723 (4)% 1% Gross profit margin % 13.4 % 14.5 % 12.9 % 14.2 % 13.6 % (110) bp (18) bp SG&A expenses $ 78,114 $ 75,275 $ 71,610 $ 69,698 $ 73,920 4% 6% Operating income $ 17,868 $ 25,903 $ 26,787 $ 22,339 $ 18,444 (31)% (3)% Operating income margin % 2.33 % 3.50 % 3.30 % 3.17 % 2.47 % (117) bp (14) bp Net income $ 16,493 $ 19,878 $ 20,089 $ 17,431 $ 17,053 (17)% (3)% Diluted EPS $ 0.75 $ 0.89 $ 0.88 $ 0.74 $ 0.70 (16)% 7% Select reported non-GAAP measures: Non-GAAP operating income $ 23,219 $ 30,911 $ 31,288 $ 26,639 $ 25,911 (25)% (10)% Non-GAAP operating income margin % 3.03 % 4.18 % 3.85 % 3.78 % 3.47 % (115) bp (44) bp Non-GAAP net income $ 17,611 $ 23,685 $ 23,322 $ 20,298 $ 20,698 (26)% (15)% Non-GAAP diluted EPS $ 0.80 $ 1.06 $ 1.02 $ 0.86 $ 0.85 (25)% (6)% Adjusted EBITDA (non-GAAP) $ 31,193 $ 38,590 $ 38,639 $ 35,053 $ 35,299 (19)% (12)% Adjusted EBITDA margin % (non-GAAP) 4.07 % 5.22 % 4.75 % 4.97 % 4.72 % (115) bp (65) bp Adjusted ROIC (non-GAAP) 11.9 % 14.6 % 14.9 % 13.6 % 13.3 % (270) bp (140) bp Operating cash flow (QTR) $ 30,838 $ 23,211 $ 7,644 $ 66,058 $ (6,190) Less: Capital expenditures (QTR) $ (1,975) $ (2,395) $ (2,517) $ (1,420) $ (1,974) Free cash flow (QTR) (Non-GAAP) $ 28,863 $ 20,816 $ 5,127 $ 64,638 $ (8,164) Operating cash flow (TTM) $ 127,751 $ 90,723 $ 112,342 $ 159,436 $ 253,530 Less: Capital expenditures (TTM) $ (8,307) $ (8,306) $ (8,286) $ (7,039) $ (8,039) Free cash flow (TTM) (Non-GAAP) $ 119,444 $ 82,417 $ 104,056 $ 152,397 $ 245,491 Note: Margin % reflects measure as a percentage of net sales. ScanSource, Inc. Earnings Infographic Q2 FY2026 SUPPORTING MATERIALS AND RECONCILIATIONS FOR NON-GAAP FINANCIAL INFORMATION scansource.com 4 February 5, 2026
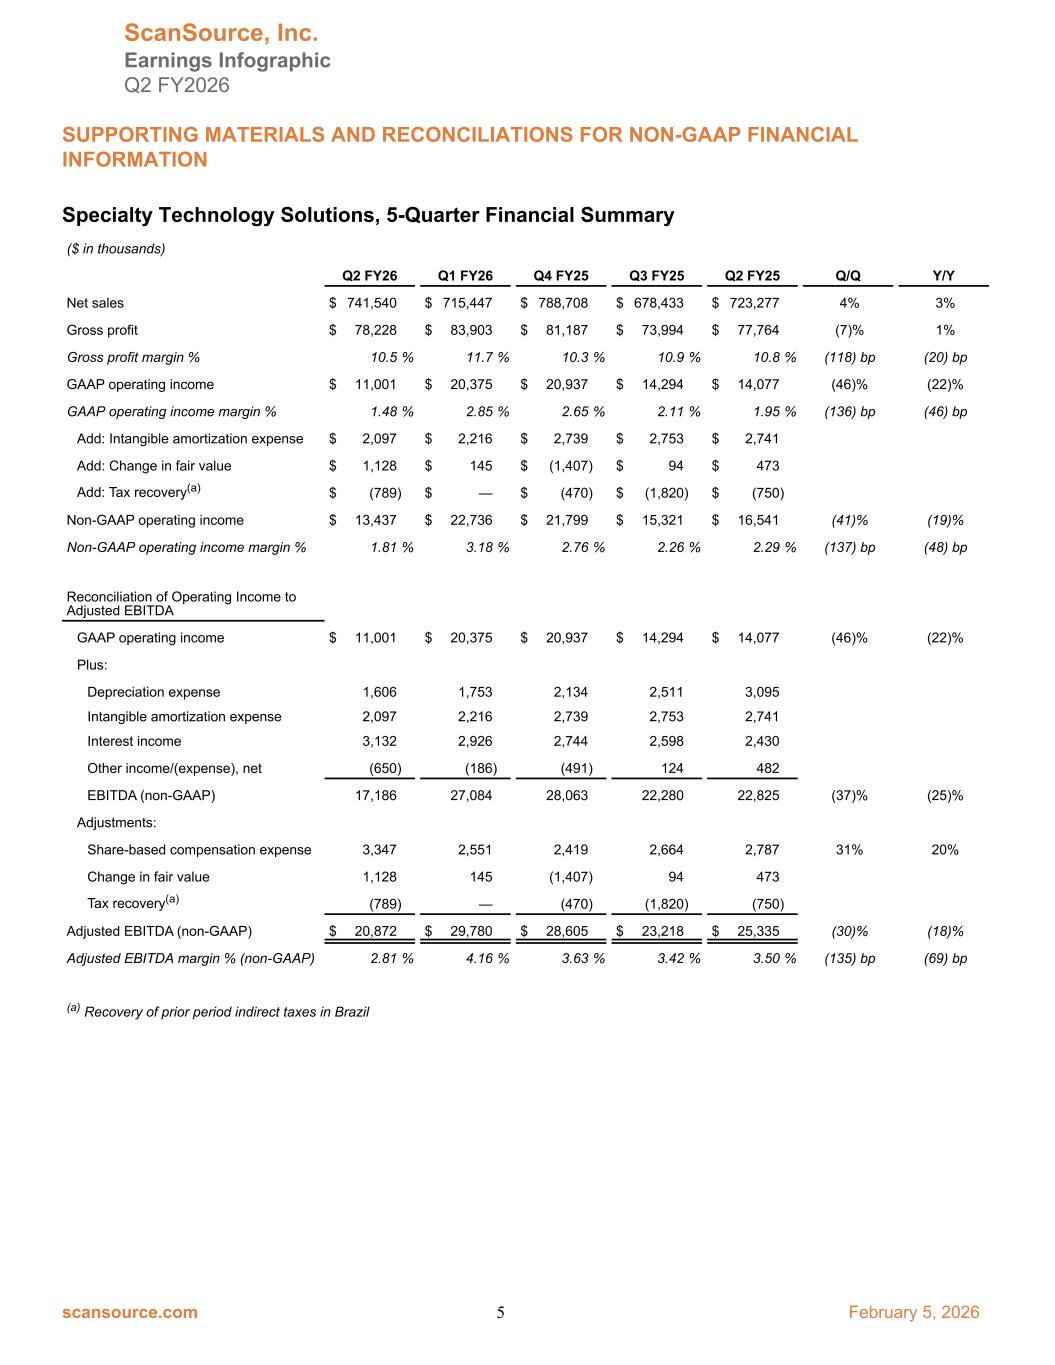

 
Specialty Technology Solutions, 5-Quarter Financial Summary ($ in thousands) Q2 FY26 Q1 FY26 Q4 FY25 Q3 FY25 Q2 FY25 Q/Q Y/Y Net sales $ 741,540 $ 715,447 $ 788,708 $ 678,433 $ 723,277 4% 3% Gross profit $ 78,228 $ 83,903 $ 81,187 $ 73,994 $ 77,764 (7)% 1% Gross profit margin % 10.5 % 11.7 % 10.3 % 10.9 % 10.8 % (118) bp (20) bp GAAP operating income $ 11,001 $ 20,375 $ 20,937 $ 14,294 $ 14,077 (46)% (22)% GAAP operating income margin % 1.48 % 2.85 % 2.65 % 2.11 % 1.95 % (136) bp (46) bp Add: Intangible amortization expense $ 2,097 $ 2,216 $ 2,739 $ 2,753 $ 2,741 Add: Change in fair value $ 1,128 $ 145 $ (1,407) $ 94 $ 473 Add: Tax recovery(a) $ (789) $ — $ (470) $ (1,820) $ (750) Non-GAAP operating income $ 13,437 $ 22,736 $ 21,799 $ 15,321 $ 16,541 (41)% (19)% Non-GAAP operating income margin % 1.81 % 3.18 % 2.76 % 2.26 % 2.29 % (137) bp (48) bp Reconciliation of Operating Income to Adjusted EBITDA GAAP operating income $ 11,001 $ 20,375 $ 20,937 $ 14,294 $ 14,077 (46)% (22)% Plus: Depreciation expense 1,606 1,753 2,134 2,511 3,095 Intangible amortization expense 2,097 2,216 2,739 2,753 2,741 Interest income 3,132 2,926 2,744 2,598 2,430 Other income/(expense), net (650) (186) (491) 124 482 EBITDA (non-GAAP) 17,186 27,084 28,063 22,280 22,825 (37)% (25)% Adjustments: Share-based compensation expense 3,347 2,551 2,419 2,664 2,787 31% 20% Change in fair value 1,128 145 (1,407) 94 473 Tax recovery(a) (789) — (470) (1,820) (750) Adjusted EBITDA (non-GAAP) $ 20,872 $ 29,780 $ 28,605 $ 23,218 $ 25,335 (30)% (18)% Adjusted EBITDA margin % (non-GAAP) 2.81 % 4.16 % 3.63 % 3.42 % 3.50 % (135) bp (69) bp (a) Recovery of prior period indirect taxes in Brazil ScanSource, Inc. Earnings Infographic Q2 FY2026 SUPPORTING MATERIALS AND RECONCILIATIONS FOR NON-GAAP FINANCIAL INFORMATION scansource.com 5 February 5, 2026
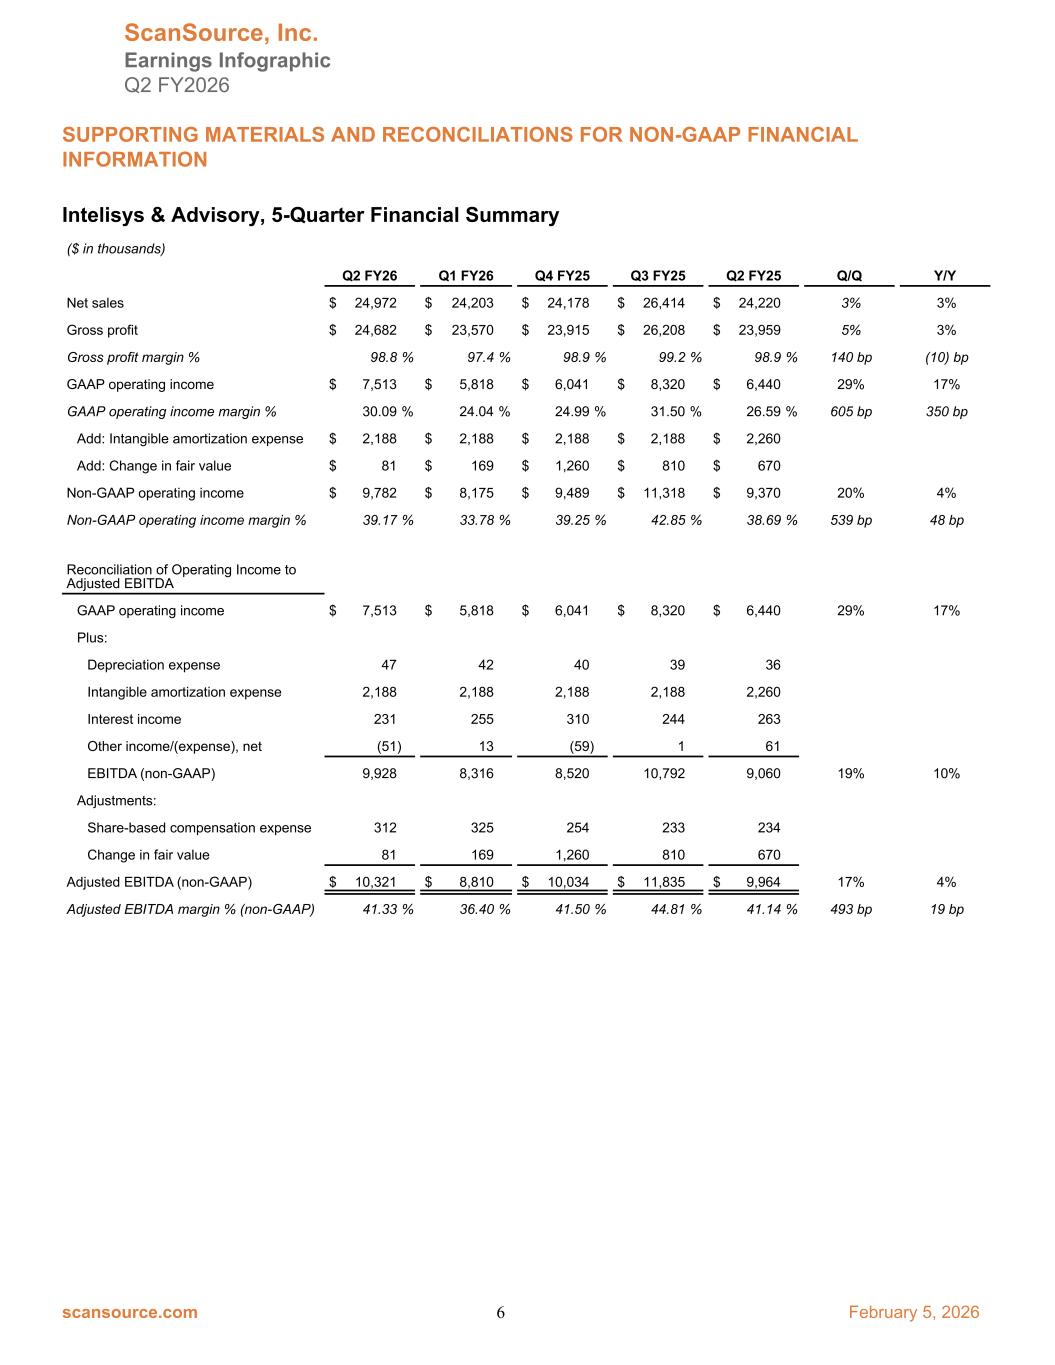

 
Intelisys & Advisory, 5-Quarter Financial Summary ($ in thousands) Q2 FY26 Q1 FY26 Q4 FY25 Q3 FY25 Q2 FY25 Q/Q Y/Y Net sales $ 24,972 $ 24,203 $ 24,178 $ 26,414 $ 24,220 3% 3% Gross profit $ 24,682 $ 23,570 $ 23,915 $ 26,208 $ 23,959 5% 3% Gross profit margin % 98.8 % 97.4 % 98.9 % 99.2 % 98.9 % 140 bp (10) bp GAAP operating income $ 7,513 $ 5,818 $ 6,041 $ 8,320 $ 6,440 29% 17% GAAP operating income margin % 30.09 % 24.04 % 24.99 % 31.50 % 26.59 % 605 bp 350 bp Add: Intangible amortization expense $ 2,188 $ 2,188 $ 2,188 $ 2,188 $ 2,260 Add: Change in fair value $ 81 $ 169 $ 1,260 $ 810 $ 670 Non-GAAP operating income $ 9,782 $ 8,175 $ 9,489 $ 11,318 $ 9,370 20% 4% Non-GAAP operating income margin % 39.17 % 33.78 % 39.25 % 42.85 % 38.69 % 539 bp 48 bp Reconciliation of Operating Income to Adjusted EBITDA GAAP operating income $ 7,513 $ 5,818 $ 6,041 $ 8,320 $ 6,440 29% 17% Plus: Depreciation expense 47 42 40 39 36 Intangible amortization expense 2,188 2,188 2,188 2,188 2,260 Interest income 231 255 310 244 263 Other income/(expense), net (51) 13 (59) 1 61 EBITDA (non-GAAP) 9,928 8,316 8,520 10,792 9,060 19% 10% Adjustments: Share-based compensation expense 312 325 254 233 234 Change in fair value 81 169 1,260 810 670 Adjusted EBITDA (non-GAAP) $ 10,321 $ 8,810 $ 10,034 $ 11,835 $ 9,964 17% 4% Adjusted EBITDA margin % (non-GAAP) 41.33 % 36.40 % 41.50 % 44.81 % 41.14 % 493 bp 19 bp ScanSource, Inc. Earnings Infographic Q2 FY2026 SUPPORTING MATERIALS AND RECONCILIATIONS FOR NON-GAAP FINANCIAL INFORMATION scansource.com 6 February 5, 2026
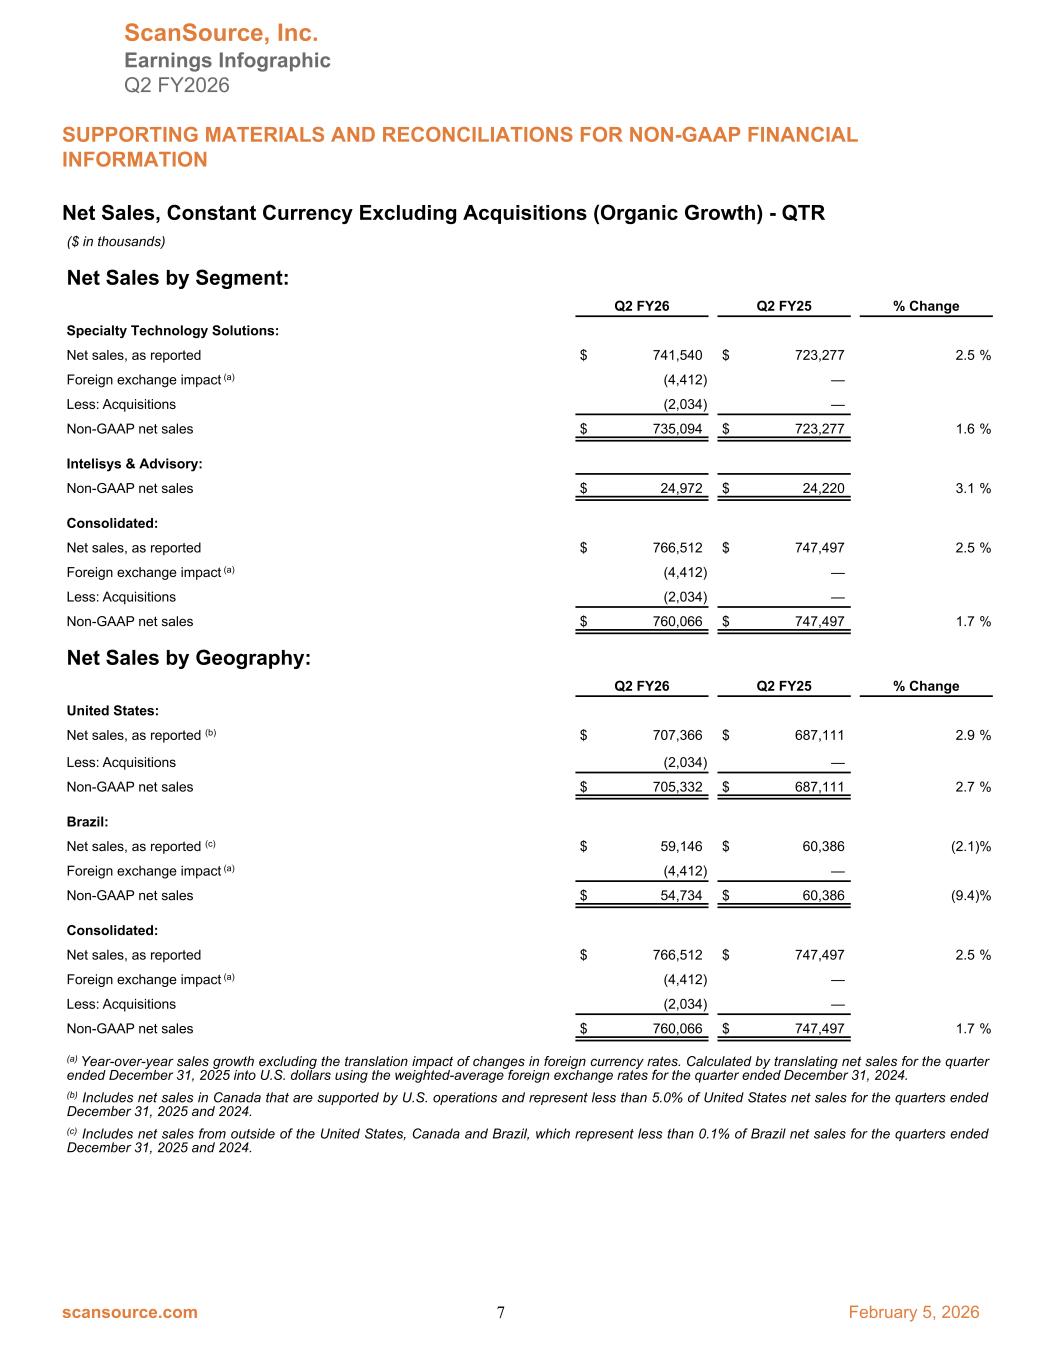

 
Net Sales, Constant Currency Excluding Acquisitions (Organic Growth) - QTR ($ in thousands) Net Sales by Segment: Q2 FY26 Q2 FY25 % Change Specialty Technology Solutions: Net sales, as reported $ 741,540 $ 723,277 2.5 % Foreign exchange impact (a) (4,412) — Less: Acquisitions (2,034) — Non-GAAP net sales $ 735,094 $ 723,277 1.6 % Intelisys & Advisory: Non-GAAP net sales $ 24,972 $ 24,220 3.1 % Consolidated: Net sales, as reported $ 766,512 $ 747,497 2.5 % Foreign exchange impact (a) (4,412) — Less: Acquisitions (2,034) — Non-GAAP net sales $ 760,066 $ 747,497 1.7 % Net Sales by Geography: Q2 FY26 Q2 FY25 % Change United States: Net sales, as reported (b) $ 707,366 $ 687,111 2.9 % Less: Acquisitions (2,034) — Non-GAAP net sales $ 705,332 $ 687,111 2.7 % Brazil: Net sales, as reported (c) $ 59,146 $ 60,386 (2.1) % Foreign exchange impact (a) (4,412) — Non-GAAP net sales $ 54,734 $ 60,386 (9.4) % Consolidated: Net sales, as reported $ 766,512 $ 747,497 2.5 % Foreign exchange impact (a) (4,412) — Less: Acquisitions (2,034) — Non-GAAP net sales $ 760,066 $ 747,497 1.7 % (a) Year-over-year sales growth excluding the translation impact of changes in foreign currency rates. Calculated by translating net sales for the quarter ended December 31, 2025 into U.S. dollars using the weighted-average foreign exchange rates for the quarter ended December 31, 2024. (b) Includes net sales in Canada that are supported by U.S. operations and represent less than 5.0% of United States net sales for the quarters ended December 31, 2025 and 2024. (c) Includes net sales from outside of the United States, Canada and Brazil, which represent less than 0.1% of Brazil net sales for the quarters ended December 31, 2025 and 2024. ScanSource, Inc. Earnings Infographic Q2 FY2026 SUPPORTING MATERIALS AND RECONCILIATIONS FOR NON-GAAP FINANCIAL INFORMATION scansource.com 7 February 5, 2026
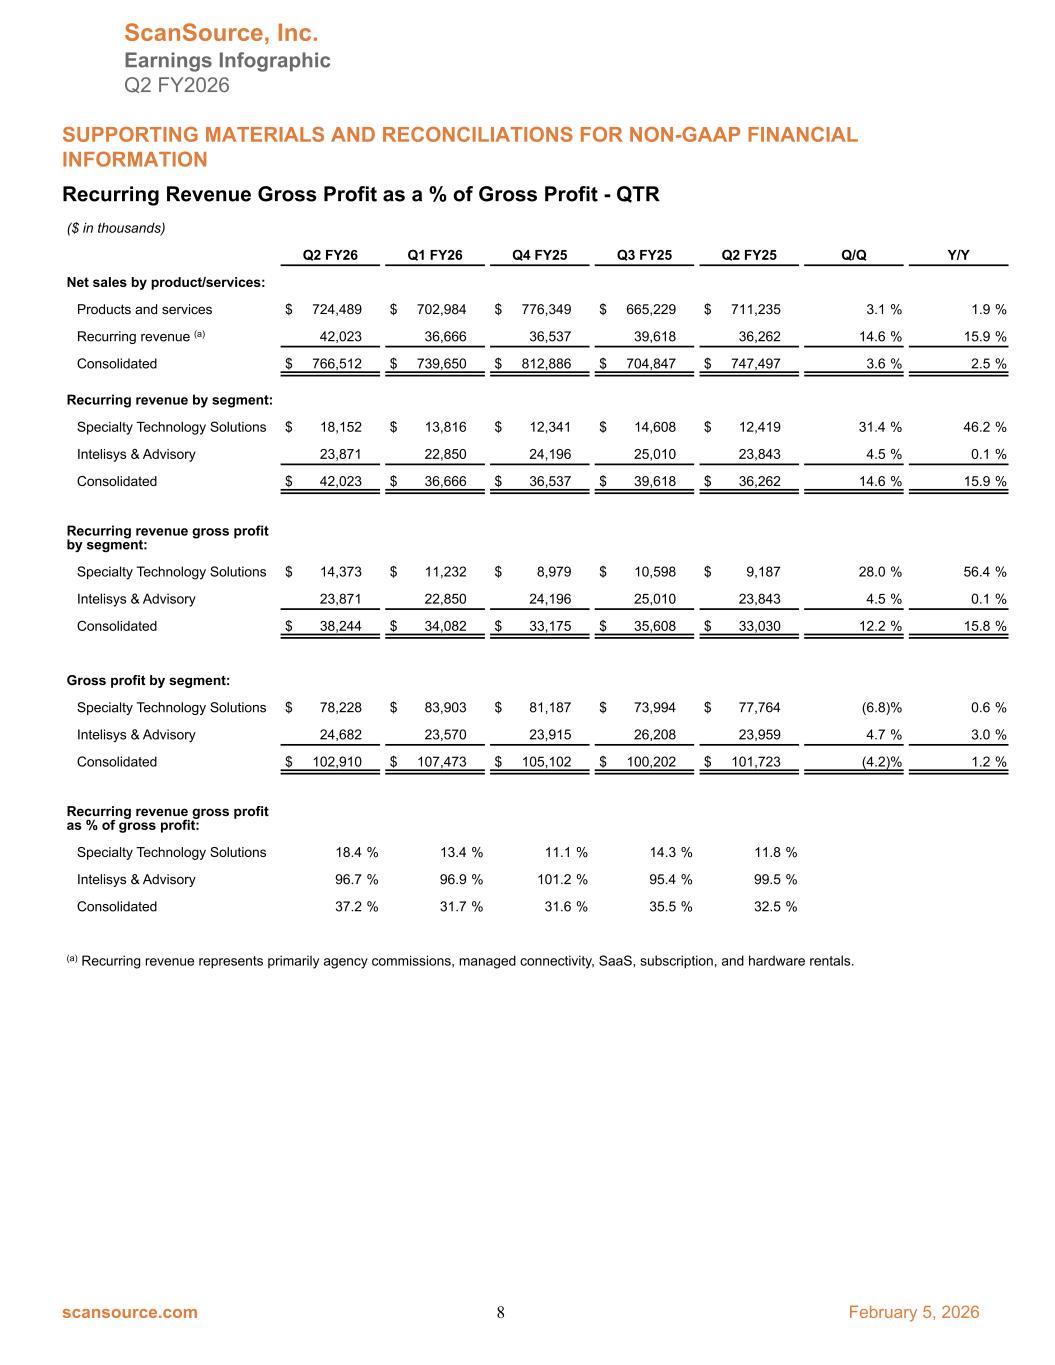

 
Recurring Revenue Gross Profit as a % of Gross Profit - QTR ($ in thousands) Q2 FY26 Q1 FY26 Q4 FY25 Q3 FY25 Q2 FY25 Q/Q Y/Y Net sales by product/services: Products and services $ 724,489 $ 702,984 $ 776,349 $ 665,229 $ 711,235 3.1 % 1.9 % Recurring revenue (a) 42,023 36,666 36,537 39,618 36,262 14.6 % 15.9 % Consolidated $ 766,512 $ 739,650 $ 812,886 $ 704,847 $ 747,497 3.6 % 2.5 % Recurring revenue by segment: Specialty Technology Solutions $ 18,152 $ 13,816 $ 12,341 $ 14,608 $ 12,419 31.4 % 46.2 % Intelisys & Advisory 23,871 22,850 24,196 25,010 23,843 4.5 % 0.1 % Consolidated $ 42,023 $ 36,666 $ 36,537 $ 39,618 $ 36,262 14.6 % 15.9 % Recurring revenue gross profit by segment: Specialty Technology Solutions $ 14,373 $ 11,232 $ 8,979 $ 10,598 $ 9,187 28.0 % 56.4 % Intelisys & Advisory 23,871 22,850 24,196 25,010 23,843 4.5 % 0.1 % Consolidated $ 38,244 $ 34,082 $ 33,175 $ 35,608 $ 33,030 12.2 % 15.8 % Gross profit by segment: Specialty Technology Solutions $ 78,228 $ 83,903 $ 81,187 $ 73,994 $ 77,764 (6.8) % 0.6 % Intelisys & Advisory 24,682 23,570 23,915 26,208 23,959 4.7 % 3.0 % Consolidated $ 102,910 $ 107,473 $ 105,102 $ 100,202 $ 101,723 (4.2) % 1.2 % Recurring revenue gross profit as % of gross profit: Specialty Technology Solutions 18.4 % 13.4 % 11.1 % 14.3 % 11.8 % Intelisys & Advisory 96.7 % 96.9 % 101.2 % 95.4 % 99.5 % Consolidated 37.2 % 31.7 % 31.6 % 35.5 % 32.5 % (a) Recurring revenue represents primarily agency commissions, managed connectivity, SaaS, subscription, and hardware rentals. ScanSource, Inc. Earnings Infographic Q2 FY2026 SUPPORTING MATERIALS AND RECONCILIATIONS FOR NON-GAAP FINANCIAL INFORMATION scansource.com 8 February 5, 2026
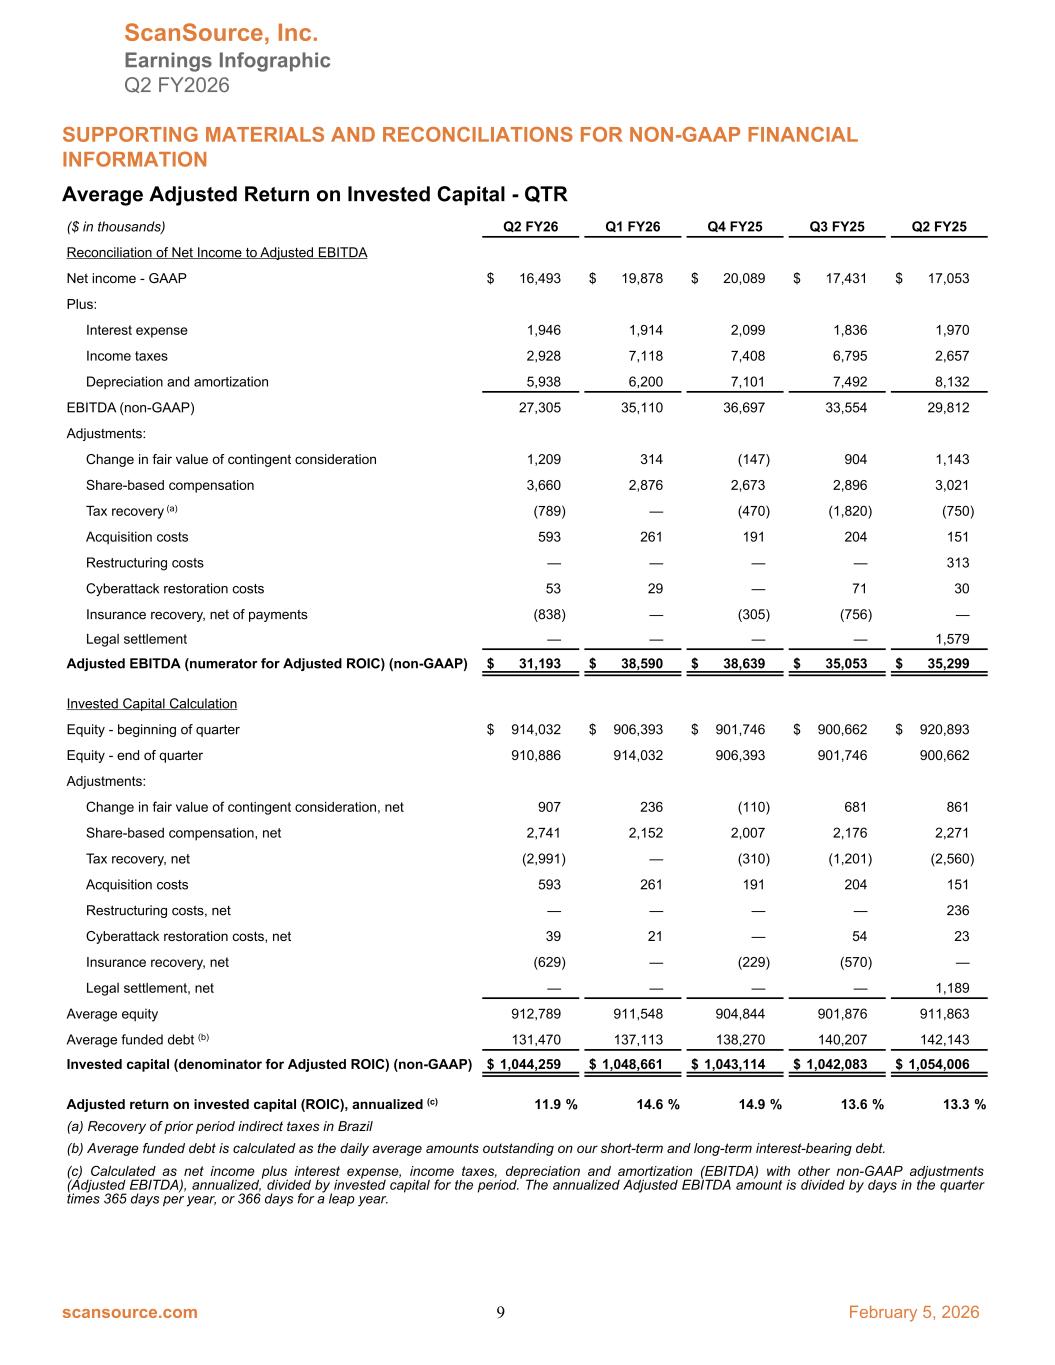

 
Average Adjusted Return on Invested Capital - QTR ($ in thousands) Q2 FY26 Q1 FY26 Q4 FY25 Q3 FY25 Q2 FY25 Reconciliation of Net Income to Adjusted EBITDA Net income - GAAP $ 16,493 $ 19,878 $ 20,089 $ 17,431 $ 17,053 Plus: Interest expense 1,946 1,914 2,099 1,836 1,970 Income taxes 2,928 7,118 7,408 6,795 2,657 Depreciation and amortization 5,938 6,200 7,101 7,492 8,132 EBITDA (non-GAAP) 27,305 35,110 36,697 33,554 29,812 Adjustments: Change in fair value of contingent consideration 1,209 314 (147) 904 1,143 Share-based compensation 3,660 2,876 2,673 2,896 3,021 Tax recovery (a) (789) — (470) (1,820) (750) Acquisition costs 593 261 191 204 151 Restructuring costs — — — — 313 Cyberattack restoration costs 53 29 — 71 30 Insurance recovery, net of payments (838) — (305) (756) — Legal settlement — — — — 1,579 Adjusted EBITDA (numerator for Adjusted ROIC) (non-GAAP) $ 31,193 $ 38,590 $ 38,639 $ 35,053 $ 35,299 Invested Capital Calculation Equity - beginning of quarter $ 914,032 $ 906,393 $ 901,746 $ 900,662 $ 920,893 Equity - end of quarter 910,886 914,032 906,393 901,746 900,662 Adjustments: Change in fair value of contingent consideration, net 907 236 (110) 681 861 Share-based compensation, net 2,741 2,152 2,007 2,176 2,271 Tax recovery, net (2,991) — (310) (1,201) (2,560) Acquisition costs 593 261 191 204 151 Restructuring costs, net — — — — 236 Cyberattack restoration costs, net 39 21 — 54 23 Insurance recovery, net (629) — (229) (570) — Legal settlement, net — — — — 1,189 Average equity 912,789 911,548 904,844 901,876 911,863 Average funded debt (b) 131,470 137,113 138,270 140,207 142,143 Invested capital (denominator for Adjusted ROIC) (non-GAAP) $ 1,044,259 $ 1,048,661 $ 1,043,114 $ 1,042,083 $ 1,054,006 Adjusted return on invested capital (ROIC), annualized (c) 11.9 % 14.6 % 14.9 % 13.6 % 13.3 % (a) Recovery of prior period indirect taxes in Brazil (b) Average funded debt is calculated as the daily average amounts outstanding on our short-term and long-term interest-bearing debt. (c) Calculated as net income plus interest expense, income taxes, depreciation and amortization (EBITDA) with other non-GAAP adjustments (Adjusted EBITDA), annualized, divided by invested capital for the period. The annualized Adjusted EBITDA amount is divided by days in the quarter times 365 days per year, or 366 days for a leap year. ScanSource, Inc. Earnings Infographic Q2 FY2026 SUPPORTING MATERIALS AND RECONCILIATIONS FOR NON-GAAP FINANCIAL INFORMATION scansource.com 9 February 5, 2026
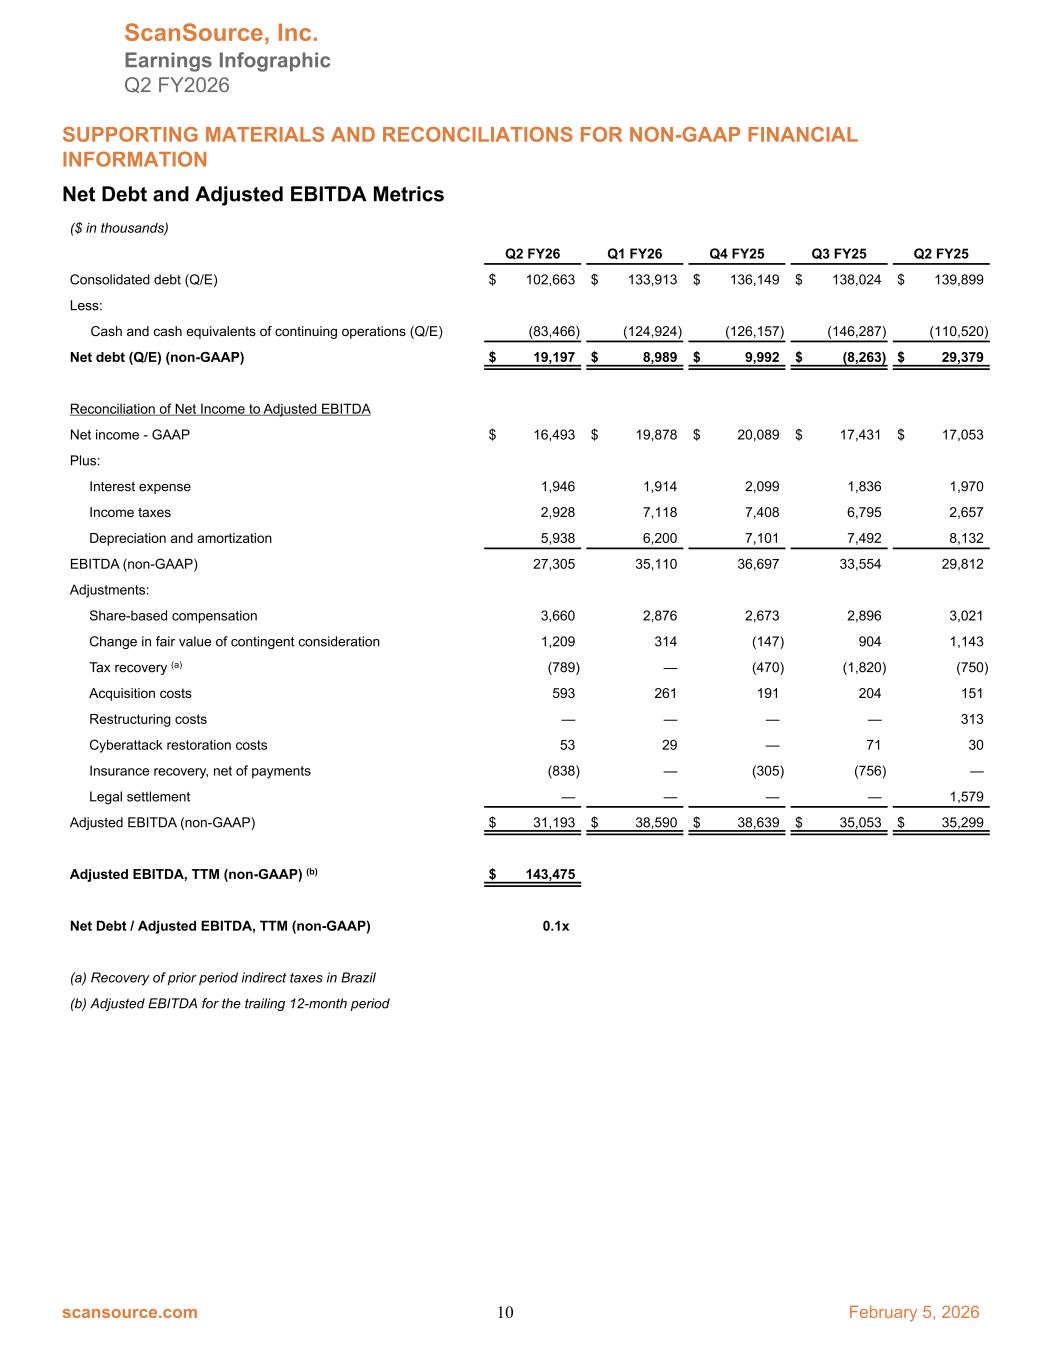

 
Net Debt and Adjusted EBITDA Metrics ($ in thousands) Q2 FY26 Q1 FY26 Q4 FY25 Q3 FY25 Q2 FY25 Consolidated debt (Q/E) $ 102,663 $ 133,913 $ 136,149 $ 138,024 $ 139,899 Less: Cash and cash equivalents of continuing operations (Q/E) (83,466) (124,924) (126,157) (146,287) (110,520) Net debt (Q/E) (non-GAAP) $ 19,197 $ 8,989 $ 9,992 $ (8,263) $ 29,379 Reconciliation of Net Income to Adjusted EBITDA Net income - GAAP $ 16,493 $ 19,878 $ 20,089 $ 17,431 $ 17,053 Plus: Interest expense 1,946 1,914 2,099 1,836 1,970 Income taxes 2,928 7,118 7,408 6,795 2,657 Depreciation and amortization 5,938 6,200 7,101 7,492 8,132 EBITDA (non-GAAP) 27,305 35,110 36,697 33,554 29,812 Adjustments: Share-based compensation 3,660 2,876 2,673 2,896 3,021 Change in fair value of contingent consideration 1,209 314 (147) 904 1,143 Tax recovery (a) (789) — (470) (1,820) (750) Acquisition costs 593 261 191 204 151 Restructuring costs — — — — 313 Cyberattack restoration costs 53 29 — 71 30 Insurance recovery, net of payments (838) — (305) (756) — Legal settlement — — — — 1,579 Adjusted EBITDA (non-GAAP) $ 31,193 $ 38,590 $ 38,639 $ 35,053 $ 35,299 Adjusted EBITDA, TTM (non-GAAP) (b) $ 143,475 Net Debt / Adjusted EBITDA, TTM (non-GAAP) 0.1 x (a) Recovery of prior period indirect taxes in Brazil (b) Adjusted EBITDA for the trailing 12-month period ScanSource, Inc. Earnings Infographic Q2 FY2026 SUPPORTING MATERIALS AND RECONCILIATIONS FOR NON-GAAP FINANCIAL INFORMATION scansource.com 10 February 5, 2026
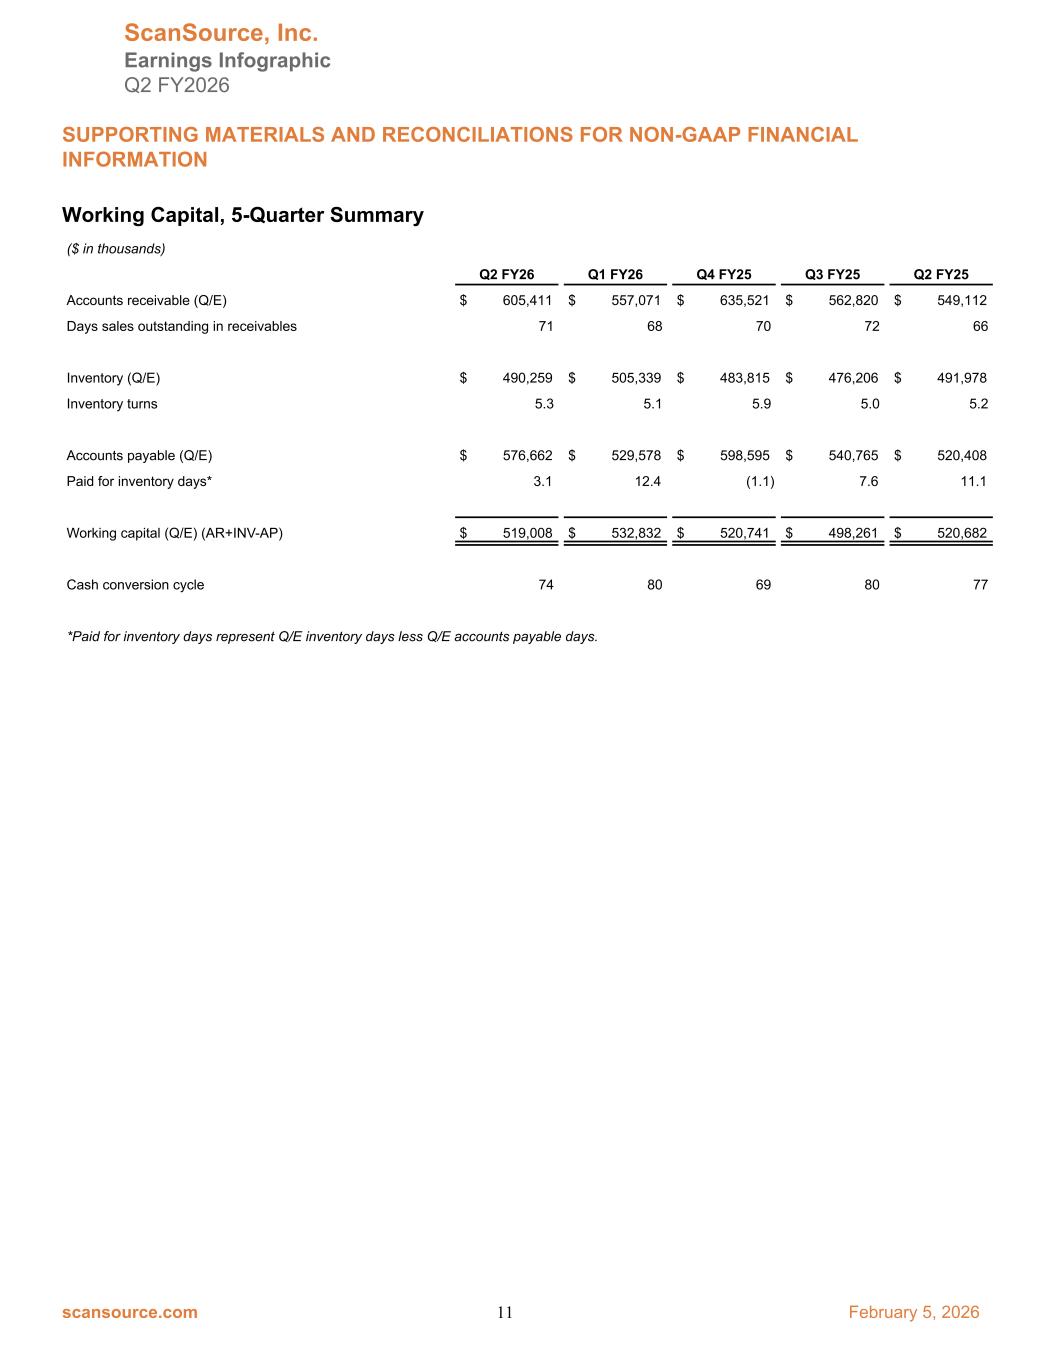

 
Working Capital, 5-Quarter Summary ($ in thousands) Q2 FY26 Q1 FY26 Q4 FY25 Q3 FY25 Q2 FY25 Accounts receivable (Q/E) $ 605,411 $ 557,071 $ 635,521 $ 562,820 $ 549,112 Days sales outstanding in receivables 71 68 70 72 66 Inventory (Q/E) $ 490,259 $ 505,339 $ 483,815 $ 476,206 $ 491,978 Inventory turns 5.3 5.1 5.9 5.0 5.2 Accounts payable (Q/E) $ 576,662 $ 529,578 $ 598,595 $ 540,765 $ 520,408 Paid for inventory days* 3.1 12.4 (1.1) 7.6 11.1 Working capital (Q/E) (AR+INV-AP) $ 519,008 $ 532,832 $ 520,741 $ 498,261 $ 520,682 Cash conversion cycle 74 80 69 80 77 *Paid for inventory days represent Q/E inventory days less Q/E accounts payable days. ScanSource, Inc. Earnings Infographic Q2 FY2026 SUPPORTING MATERIALS AND RECONCILIATIONS FOR NON-GAAP FINANCIAL INFORMATION scansource.com 11 February 5, 2026
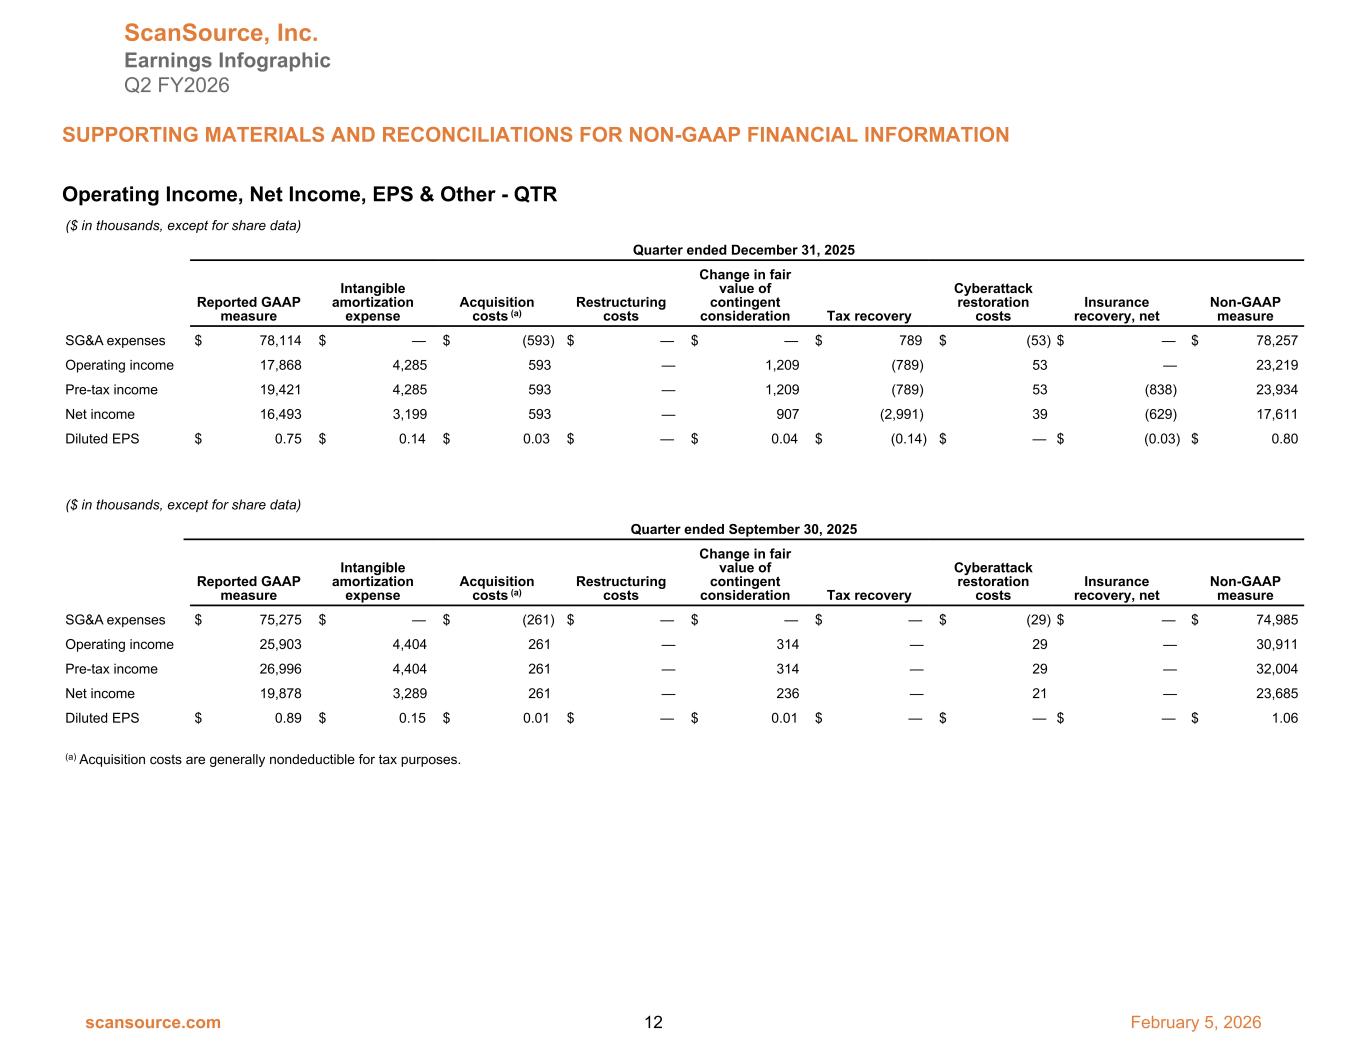

 
Operating Income, Net Income, EPS & Other - QTR ($ in thousands, except for share data) Quarter ended December 31, 2025 Reported GAAP measure Intangible amortization expense Acquisition costs (a) Restructuring costs Change in fair value of contingent consideration Tax recovery Cyberattack restoration costs Insurance recovery, net Non-GAAP measure SG&A expenses $ 78,114 $ — $ (593) $ — $ — $ 789 $ (53) $ — $ 78,257 Operating income 17,868 4,285 593 — 1,209 (789) 53 — 23,219 Pre-tax income 19,421 4,285 593 — 1,209 (789) 53 (838) 23,934 Net income 16,493 3,199 593 — 907 (2,991) 39 (629) 17,611 Diluted EPS $ 0.75 $ 0.14 $ 0.03 $ — $ 0.04 $ (0.14) $ — $ (0.03) $ 0.80 ($ in thousands, except for share data) Quarter ended September 30, 2025 Reported GAAP measure Intangible amortization expense Acquisition costs (a) Restructuring costs Change in fair value of contingent consideration Tax recovery Cyberattack restoration costs Insurance recovery, net Non-GAAP measure SG&A expenses $ 75,275 $ — $ (261) $ — $ — $ — $ (29) $ — $ 74,985 Operating income 25,903 4,404 261 — 314 — 29 — 30,911 Pre-tax income 26,996 4,404 261 — 314 — 29 — 32,004 Net income 19,878 3,289 261 — 236 — 21 — 23,685 Diluted EPS $ 0.89 $ 0.15 $ 0.01 $ — $ 0.01 $ — $ — $ — $ 1.06 (a) Acquisition costs are generally nondeductible for tax purposes. ScanSource, Inc. Earnings Infographic Q2 FY2026 SUPPORTING MATERIALS AND RECONCILIATIONS FOR NON-GAAP FINANCIAL INFORMATION scansource.com 12 February 5, 2026
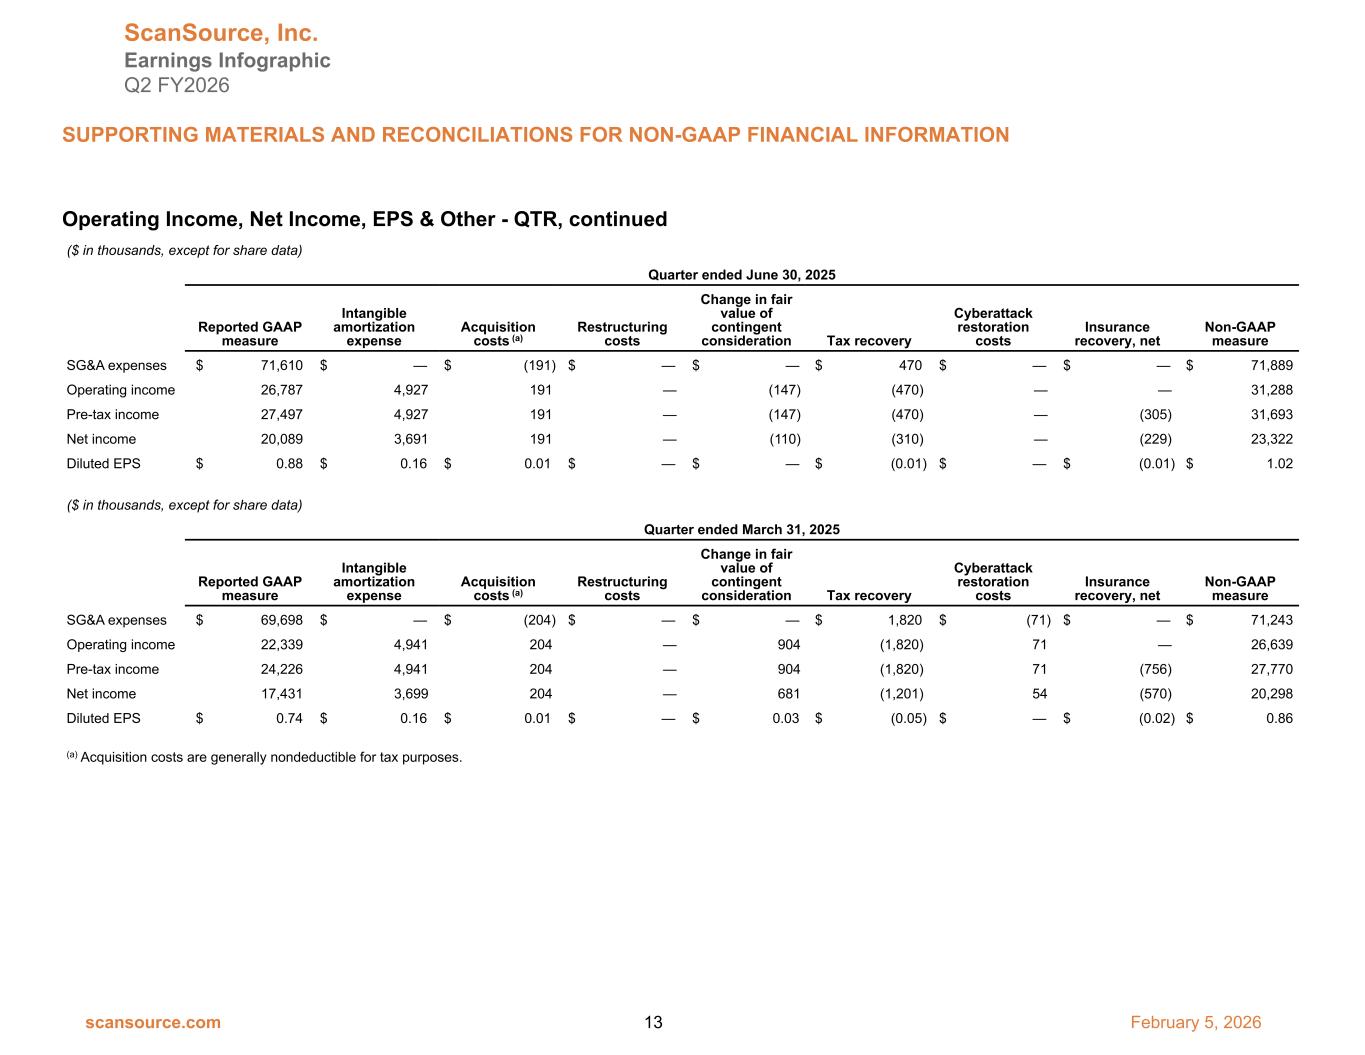

 
Operating Income, Net Income, EPS & Other - QTR, continued ($ in thousands, except for share data) Quarter ended June 30, 2025 Reported GAAP measure Intangible amortization expense Acquisition costs (a) Restructuring costs Change in fair value of contingent consideration Tax recovery Cyberattack restoration costs Insurance recovery, net Non-GAAP measure SG&A expenses $ 71,610 $ — $ (191) $ — $ — $ 470 $ — $ — $ 71,889 Operating income 26,787 4,927 191 — (147) (470) — — 31,288 Pre-tax income 27,497 4,927 191 — (147) (470) — (305) 31,693 Net income 20,089 3,691 191 — (110) (310) — (229) 23,322 Diluted EPS $ 0.88 $ 0.16 $ 0.01 $ — $ — $ (0.01) $ — $ (0.01) $ 1.02 ($ in thousands, except for share data) Quarter ended March 31, 2025 Reported GAAP measure Intangible amortization expense Acquisition costs (a) Restructuring costs Change in fair value of contingent consideration Tax recovery Cyberattack restoration costs Insurance recovery, net Non-GAAP measure SG&A expenses $ 69,698 $ — $ (204) $ — $ — $ 1,820 $ (71) $ — $ 71,243 Operating income 22,339 4,941 204 — 904 (1,820) 71 — 26,639 Pre-tax income 24,226 4,941 204 — 904 (1,820) 71 (756) 27,770 Net income 17,431 3,699 204 — 681 (1,201) 54 (570) 20,298 Diluted EPS $ 0.74 $ 0.16 $ 0.01 $ — $ 0.03 $ (0.05) $ — $ (0.02) $ 0.86 (a) Acquisition costs are generally nondeductible for tax purposes. ScanSource, Inc. Earnings Infographic Q2 FY2026 SUPPORTING MATERIALS AND RECONCILIATIONS FOR NON-GAAP FINANCIAL INFORMATION scansource.com 13 February 5, 2026
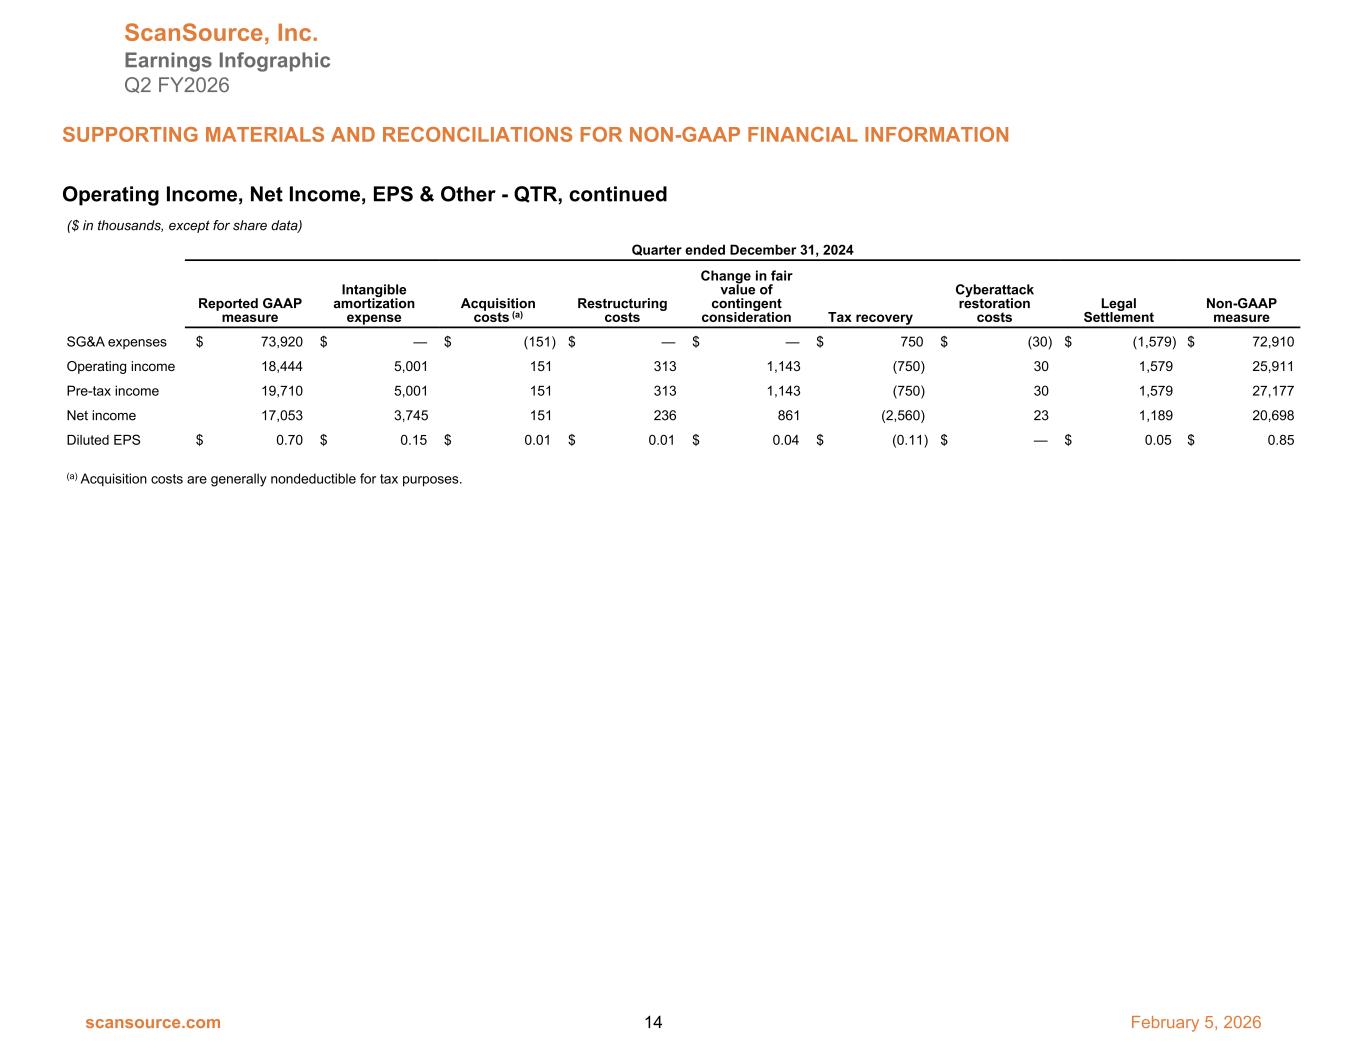

 
Operating Income, Net Income, EPS & Other - QTR, continued ($ in thousands, except for share data) Quarter ended December 31, 2024 Reported GAAP measure Intangible amortization expense Acquisition costs (a) Restructuring costs Change in fair value of contingent consideration Tax recovery Cyberattack restoration costs Legal Settlement Non-GAAP measure SG&A expenses $ 73,920 $ — $ (151) $ — $ — $ 750 $ (30) $ (1,579) $ 72,910 Operating income 18,444 5,001 151 313 1,143 (750) 30 1,579 25,911 Pre-tax income 19,710 5,001 151 313 1,143 (750) 30 1,579 27,177 Net income 17,053 3,745 151 236 861 (2,560) 23 1,189 20,698 Diluted EPS $ 0.70 $ 0.15 $ 0.01 $ 0.01 $ 0.04 $ (0.11) $ — $ 0.05 $ 0.85 (a) Acquisition costs are generally nondeductible for tax purposes. ScanSource, Inc. Earnings Infographic Q2 FY2026 SUPPORTING MATERIALS AND RECONCILIATIONS FOR NON-GAAP FINANCIAL INFORMATION scansource.com 14 February 5, 2026