scsc-20210818
0000918965false00009189652021-08-242021-08-2400009189652021-08-182021-08-18

UNITED STATES
SECURITIES AND EXCHANGE COMMISSION
Washington, D.C. 20549
 
Form 8-K
 
CURRENT REPORT

Pursuant to Section 13 or 15(d) of the
Securities Exchange Act of 1934

Date of Report (Date of earliest event reported): August 18, 2021

 ScanSource, Inc.
(Exact name of registrant as specified in its charter)
SC00-26926 57-0965380
(State or other jurisdiction
of incorporation)
(Commission File Number) (IRS Employer
Identification No.)

6 Logue Court, Greenville, SC 29615
(Address of principal executive offices, including zip code)
864-288-2432
(Registrant’s telephone number, including area code)
Title of Each ClassTrading SymbolName of Each Exchange on Which Registered
Common Stock, no par valueSCSCNASDAQ Global Select Market
 
Check the appropriate box below if the Form 8-K filing is intended to simultaneously satisfy the filing obligation of the registrant under any of the following provisions:
Written communications pursuant to Rule 425 under the Securities Act (17 CFR 230.425)
Soliciting material pursuant to Rule 14a-12 under the Exchange Act (17 CFR 240.14a-12)
Pre-commencement communications pursuant to Rule 14d-2(b) under the Exchange Act (17 CFR 240.14d-2(b))
Pre-commencement communications pursuant to Rule 13e-4(c) under the Exchange Act (17 CFR 240.13e-4(c))

Indicate by check mark whether the registrant is an emerging growth company as defined in Rule 405 of the Securities Act of 1933 or Rule 12b-2 of the Securities Exchange Act of 1934.
Emerging growth company

If an emerging growth company, indicate by check mark if the registrant has elected not to use the extended transition period for complying with any new or revised financial accounting standards provided pursuant to Section 13(a) of the Exchange Act.      


Item 2.02. Results of Operations and Financial Condition

On August 24, 2021, ScanSource, Inc. (the "Company") issued a press release announcing its financial results for its fiscal year ended June 30, 2021. A copy of the press release and accompanying CFO commentary are attached as Exhibits 99.1 and 99.2 hereto and incorporated herein by reference and also made available through the Company’s website at www.scansource.com. An updated investor presentation will be made available on the Company's website within approximately two weeks.

The information in Item 2.02 of this Report, including the exhibits, is being furnished and shall not be deemed “filed” for purposes of Section 18 of the Securities Exchange Act of 1934 (the “Exchange Act”) or otherwise subject to the liabilities of that section, nor shall it be deemed incorporated by reference in any other filing under the Securities Act of 1933 or the Exchange Act.

Item 5.02. Departure of Directors or Certain Officers; Election of Directors; Appointment of Certain Officers; Compensatory Arrangements of Certain Officers.

On August 19, 2021, the Board of Directors (the “Board”) of ScanSource, Inc. (the “Company”) increased the size of its Board to ten members and appointed Charles A. Mathis as a director of the Company, both effective August 19, 2021.

Mr. Mathis, age 61, served as executive vice president and chief financial officer for Science Applications International Corporation (“SAIC”), a U.S. government IT services provider, from 2016 to 2021. Prior to joining SAIC, Mr. Mathis served as chief financial officer at the Company, from 2012 to 2016. Prior to joining the Company, Mr. Mathis was chief financial officer from 2008 to 2012 for Force Protection Inc., a global defense company. He also served as the chief financial officer for Fort Worth-based EFW, Inc., the U.S.-based subsidiary of the Israeli defense contractor, Elbit Systems, from 2006 to 2008.

Upon his appointment to the Board, Mr. Mathis became entitled to receive benefits under the Company’s non-employee directors’ compensation plan, including an annual retainer of $85,000. Mr. Mathis will also be entitled to reimbursement of his expenses incurred in connection with the performance of his services as a director.

In addition, Mr. Mathis will receive annual awards of restricted stock units under the Company’s 2013 Long-Term Incentive Plan (the “2013 Plan”). Each non-employee director of the Company annually receives an award of restricted stock units, determined by dividing $130,000 by the Equity Award Value (as defined in the 2013 Plan). The restricted stock units are granted automatically under the 2013 Plan and may not be transferred or sold until vested. Restricted stock units granted under the 2013 Plan will vest in full on the day that is six months after the date of grant, or upon the earlier to occur of (i) the director’s termination of service as a director by reason of death, disability or retirement, or (ii) a change in control of the Company. If Mr. Mathis terminates his service as a director for any other reason, he will forfeit all of his right, title and interest in and to the restricted stock as of the date of termination.

There are no transactions between Mr. Mathis or any member of his immediate family and the Company or any of its subsidiaries and there is no arrangement or understanding between Mr. Mathis and any other persons or entities pursuant to which Mr. Mathis was appointed as a director of the Company.

On August 18, 2021, Jack Reilly, who has served on the Board since 2001, notified the Board that he plans to retire from the Board when his current term of office expires at the next Annual Meeting of Shareholders. The Board expects that the Board will be decreased in size back to nine at that time. This transition is not a result of any disagreement between Mr. Reilly and the Company.

The full text of the press release announcing Mr. Mathis' appointment and Mr. Reilly's retirement is furnished as Exhibit 99.3 to this Report and shall not be deemed "filed" for purposes of Section 18 of the Exchange Act or otherwise subject to the liabilities of that section, nor shall it be deemed incorporated by reference in any other filing under the Securities Act of 1933 or the Exchange Act.

Item 9.01. Financial Statements and Exhibits

(d) Exhibits

99.1 – Press release issued by ScanSource, Inc. on August 24, 2021. The information contained in the attached exhibit is unaudited and should be read in conjunction with the Company’s annual and quarterly reports filed with the Securities and Exchange Commission.


99.2 – CFO commentary for the financial results conference call held on August 24, 2021.  The information contained in the attached exhibit is unaudited and should be read in conjunction with the Company’s annual and quarterly reports filed with the Securities and Exchange Commission.

99.3 – Press release issued by ScanSource, Inc. on August 24, 2021.
Exhibit
Number
Description
99.1
99.2
99.3
104Cover Page Interactive Data File (embedded within the Inline XBRL document)

SIGNATURES

Pursuant to the requirements of the Securities Exchange Act of 1934, the Registrant has duly caused this report to be signed on its behalf by the undersigned hereunto duly authorized.
 
    ScanSource, Inc.
    
Date:August 24, 2021    /s/ STEVE JONES
     Steve Jones
     Senior Executive Vice President and Chief Financial Officer


Exhibit 99.1

FOR IMMEDIATE RELEASE
Contact:  
Steve Jones Mary M. Gentry
Senior EVP, Chief Financial Officer- or -SVP, Treasurer and Investor Relations
ScanSource, Inc. ScanSource, Inc.
(864) 286-4302 (864) 286-4892

SCANSOURCE DELIVERS STRONG FOURTH QUARTER SALES AND PROFITABILITY GROWTH

Outstanding execution of growth opportunities; quarterly net sales up 34% year-over-year
Initiates annual financial outlook for FY22
Announces new $100 million share repurchase authorization

GREENVILLE, SC -- August 24, 2021 -- ScanSource, Inc. (NASDAQ: SCSC), a leading provider of technology products and solutions, today announced financial results for the fourth quarter and fiscal year ended June 30, 2021. All results in this release reflect continuing operations only unless otherwise noted.

Fourth Quarter Summary:

Net sales: $852.7 million, up 34% year-over-year
Gross profit: $95.8 million, up 29% year-over-year
GAAP operating income of $23.3 million for a 2.73% operating income margin
Non-GAAP operating income of $28.4 million, up 245% year-over-year, for a 3.33% non-GAAP operating
income margin
Net income from continuing operations of $20.7 million
GAAP diluted EPS of $0.80 per share; non-GAAP diluted EPS of $0.96 per share
Generated strong operating cash flow of $61.3 million for the quarter and $116.8 million for the fiscal year
Return on invested capital increased to 14.9% for the quarter
“Our employees delivered strong fourth quarter net sales and profitability growth with operational excellence across our business,” said Mike Baur, Chairman and CEO, ScanSource, Inc. “Our momentum and execution strengthen our confidence in our hybrid distribution strategy accelerating our growth across hardware, software, connectivity, and cloud. ScanSource is uniquely positioned to enable the growth opportunities ahead for our channel partners and suppliers.”

Quarterly Results
Net sales for the fourth quarter of fiscal year 2021 totaled $852.7 million, up 34.0% year-over-year, or 33.7% year-over-year for organic growth. This reflects broad-based growth across our technologies in both operating segments in all geographies.

For the fourth quarter of fiscal year 2021, operating income increased to $23.3 million from $(113.4) million for the prior-year quarter, which included goodwill and asset impairment charges of $120.5 million. Fourth quarter fiscal year 2021 non-GAAP operating income increased to $28.4 million for a 3.33% non-GAAP operating income margin, up from $8.2 million for the prior-year quarter.

On a GAAP basis, net income for the fourth quarter of fiscal year 2021 totaled $20.7 million, or $0.80 per diluted share, compared to net loss of $(108.9) million, or $(4.29) per diluted share, for the prior-year quarter. Fourth quarter non-GAAP net income totaled $24.5 million, or $0.96 per diluted share, which includes a $0.19 benefit from discrete tax items. These results compare to fourth quarter fiscal year 2020 non-GAAP net income of $4.9 million, or $0.19 per diluted share.

1


Exhibit 99.1

Full-Year Results

For fiscal year 2021, net sales increased 3.4% to $3.2 billion, or a 5.5% year-over-year increase on an organic basis. During the year, the Company saw continued progress in recovering from the sales impact of the COVID-19 pandemic. For the Intelisys business, fiscal year 2021 net sales increased 13.1% year-over-year. Fiscal year 2021 GAAP operating income increased to $61.5 million, and non-GAAP operating income increased to $93.1 million, up 18.0% year-over-year. In July 2020, the Company implemented a $30 million annualized expense reduction program to address the business impacts of the COVID-19 pandemic and prepare for the next phase of growth.
On a GAAP basis, net income for fiscal year 2021 totaled $45.4 million, or $1.78 per diluted share. Non-GAAP net income increased to $69.9 million, or $2.74 per diluted share, compared to $52.0 million, or $2.05 per diluted share, for the fiscal year 2020.

Share Repurchase Authorization

ScanSource also announced a new $100 million authorization by its Board of Directors to repurchase shares of the Company's common stock.

"In setting our capital allocation priorities, our top priority is reinvestment in the growth of our business and driving value creation for our shareholders," said Steve Jones, Chief Financial Officer, ScanSource, Inc. "Our repurchase authorization reflects our confidence in ScanSource's business and the strength of our long-term operating cash flow generation."

Repurchases may be made in the open market or through privately negotiated transactions, and ScanSource may enter into Rule 10b5-1 plans to facilitate repurchases. This share repurchase authorization does not obligate ScanSource to purchase any particular amount of common stock, and it may be suspended at any time at the Company's discretion. The authorization does not have any time limit.

Annual Financial Outlook for Fiscal Year 2022

The following statements are based on ScanSource's current expectation for the full fiscal year ended June 30, 2022.

FY22 Annual Outlook
Net sales growth, year-over-yearAt least 5.5%
Adjusted EBITDA (non-GAAP)At least $135 million

Adjusted EBITDA is a non-GAAP measure, which excludes estimates for amortization of intangible assets, depreciation expense, and non-cash share-based compensation expense (effective with the first quarter of fiscal year 2022). For comparison, fiscal year 2021 Adjusted EBITDA, excluding share-based compensation totaled $118 million. ScanSource’s outlook does not include the potential impact of any business combinations, asset acquisitions, divestitures, strategic investments, or other significant transactions that may be completed after the date hereof. These statements are forward-looking, and actual results may differ materially.

Webcast Details and CFO Commentary
At approximately 4:15 p.m. ET today, a CFO commentary, as a supplement to this press release and the Company's conference call, will be available on ScanSource's website, www.scansource.com (Investor Relations section). ScanSource will present additional information about its financial results in a conference call today, August 24, 2021, at 5:00 p.m. ET. A webcast of the call will be available for all interested parties and can be accessed at www.scansource.com (Investor Relations section). The webcast will be available for replay for 60 days.

Safe Harbor Statement

This press release contains “forward-looking” statements, including regarding the Company's FY22 outlook, capital allocation plans, growth opportunities and the impact of the COVID-19 pandemic, which involve risks and uncertainties. Any number of factors could cause actual results to differ materially from anticipated results, including, but not limited to, failure to hire and retain quality employees, risk to the Company's business from a cyber-security attack, the failure to manage and implement the Company's organic growth strategy, the impact of the COVID-19 pandemic on the Company's operations and financial condition and the potential prolonged economic weakness brought on by COVID-19, a failure of the Company's IT systems, a
2


failure to acquire new businesses, changes in interest and exchange rates and regulatory regimes impacting the Company's international operations, credit risks involving the Company's larger customers and suppliers, loss of the Company's major customers, termination of the Company's relationship with key suppliers or a significant modification of the terms under which it operates with a key supplier, changes in the Company's operating strategy, and other factors set forth in the "Risk Factors" contained in the Company's annual report on Form 10-K for the year ended June 30, 2021, filed with the Securities and Exchange Commission. Except as may be required by law, the Company expressly disclaims any obligation to update these forward-looking statements to reflect events or circumstances after the date of this press release or to reflect the occurrence of unanticipated events.

Non-GAAP Financial Information

In addition to disclosing results that are determined in accordance with United States Generally Accepted Accounting Principles ("GAAP"), the Company also discloses certain non-GAAP financial measures, which are summarized below. Non-GAAP financial measures are used to understand and evaluate performance, including comparisons from period to period. Non-GAAP results exclude amortization of intangible assets related to acquisitions, change in fair value of contingent consideration, acquisition costs, restructuring costs and other non-GAAP adjustments.

Net sales on a constant currency basis, excluding acquisitions (organic growth): The Company discloses the percentage change in net sales excluding the translation impact from changes in foreign currency exchange rates between reporting periods and excluding the net sales from acquisitions prior to the first full year from the acquisition date. This measure enhances the comparability between periods to help analyze underlying trends on an organic basis.

Income Statement Non-GAAP Metrics: To evaluate current period performance on a more consistent basis with prior periods, the Company discloses non-GAAP net sales, non-GAAP gross profit, non-GAAP operating income, non-GAAP other expense, net, non-GAAP pre-tax income, non-GAAP net income and non-GAAP diluted earnings per share (non-GAAP diluted "EPS"). Non-GAAP results exclude amortization of intangible assets related to acquisitions, changes in fair value of contingent consideration, acquisition and divestiture costs, impairment charges, restructuring costs, and other non-GAAP adjustments. These year-over-year metrics include the translation impact of changes in foreign currency exchange rates. Non-GAAP metrics are useful in assessing and understanding the Company's operating performance, especially when comparing results with previous periods or forecasting performance for future periods.

Adjusted earnings before interest expense, income taxes, depreciation, and amortization (“Adjusted EBITDA”): Adjusted EBITDA starts with net income and adds back interest expense, income tax expense, depreciation expense, amortization of intangible assets, changes in fair value of contingent considerations, and other non-GAAP adjustments, including acquisition and divestiture costs, impairment charges, and restructuring costs. Effective with the first quarter of fiscal year 2022, non-cash share-based compensation expense will also be added back in calculating Adjusted EBITDA. Since Adjusted EBITDA excludes some non-cash costs of investing in our business and people, management believes that Adjusted EBITDA shows the profitability from our business operations more clearly.

Return on invested capital ("ROIC"): ROIC assists management in comparing the Company's performance over various reporting periods on a consistent basis because it removes from our operating results the impact of items that do not reflect our core operating performance. We believe the calculation of ROIC provides useful information to investors and is an additional relevant comparison of our performance. ROIC is calculated as Adjusted EBITDA over invested capital. Invested capital is defined as average equity plus average daily funded interest-bearing debt for the period. Management believes the calculation of ROIC provides useful information to investors and is an additional relevant comparison of the Company's performance during the year.

These non-GAAP financial measures have limitations as analytical tools, and the non-GAAP financial measures that the Company reports may not be comparable to similarly titled amounts reported by other companies. Analysis of results and outlook on a non-GAAP basis should be considered in addition to, and not in substitution for or as superior to, measurements of financial performance prepared in accordance with GAAP. A reconciliation of the Company's non-GAAP financial information to GAAP is set forth in the Supplementary Information (Unaudited) below.

About ScanSource, Inc.

ScanSource, Inc. (NASDAQ: SCSC) is at the center of the technology solution delivery channel, connecting businesses and providing solutions for their complex needs. ScanSource sells through multiple, specialized routes-to-market with digital, physical and services offerings from the world’s leading suppliers of point-of-sale (POS), payments, barcode, physical security, unified communications and collaboration, telecom and cloud services. ScanSource enables its sales partners to create, deliver
3


and manage solutions for end-customers across almost every vertical market. Founded in 1992 and headquartered in Greenville, South Carolina, ScanSource was named one of the 2021 Best Places to Work in South Carolina and on FORTUNE magazine’s 2021 List of World’s Most Admired Companies. ScanSource ranks #655 on the Fortune 1000. For more information, visit www.scansource.com.
4

ScanSource Delivers Strong Fourth Quarter Sales and Profitability Growth
ScanSource, Inc. and Subsidiaries
Condensed Consolidated Balance Sheets (Unaudited)
(in thousands)
June 30, 2021June 30, 2020*
Assets
Current assets:
Cash and cash equivalents$62,718 $29,485 
Accounts receivable, less allowance of $19,341 at June 30, 2021
and $21,906 at June 30, 2020
568,984 443,185 
Inventories470,081 454,885 
Prepaid expenses and other current assets117,860 94,681 
Current assets held for sale 181,231 
Total current assets1,219,643 1,203,467 
Property and equipment, net42,836 55,641 
Goodwill218,877 214,288 
Identifiable intangible assets, net104,860 121,547 
Deferred income taxes21,853 24,630 
Other non-current assets63,615 72,521 
Total assets$1,671,684 $1,692,094 
Liabilities and Shareholders’ Equity
Current liabilities:
Accounts payable$634,805 $454,240 
Accrued expenses and other current liabilities87,790 76,686 
Current portion of contingent consideration 46,334 
Income taxes payable2,501 5,886 
Current portion of long-term debt7,843 7,839 
Current liabilities held for sale 128,022 
Total current liabilities732,939 719,007 
Deferred income taxes3,954 3,884 
Long-term debt, net of current portion135,331 143,175 
Borrowings under revolving credit facility 67,714 
Other long-term liabilities68,269 80,068 
Total liabilities940,493 1,013,848 
Commitments and contingencies
Shareholders’ equity:
Preferred stock, no par value; 3,000,000 shares authorized, none issued
 — 
Common stock, no par value; 45,000,000 shares authorized, 25,499,465 and 25,361,298 shares issued and outstanding at June 30, 2021 and June 30, 2020, respectively
71,253 63,765 
Retained earnings758,071 747,276 
Accumulated other comprehensive loss(98,133)(132,795)
Total shareholders’ equity731,191 678,246 
Total liabilities and shareholders’ equity$1,671,684 $1,692,094 
*Derived from audited financial statements.
5

ScanSource Delivers Strong Fourth Quarter Sales and Profitability Growth
ScanSource, Inc. and Subsidiaries
Condensed Consolidated Income Statements (Unaudited)
(in thousands, except per share data)
 Quarter ended June 30,Fiscal year ended June 30,
 2021202020212020
Net sales$852,694 $636,450 $3,150,806 $3,047,734 
Cost of goods sold756,916 562,303 2,800,090 2,692,165 
Gross profit95,778 74,147 350,716 355,569 
Selling, general and administrative expenses64,758 58,192 247,438 259,535 
Depreciation expense2,898 3,304 12,533 13,033 
Intangible amortization expense4,893 4,946 19,488 19,953 
Restructuring and other charges(54)— 9,258 604 
Impairment charges 120,470  120,470 
Change in fair value of contingent consideration 674 516 6,941 
Operating income (loss)23,283 (113,439)61,483 (64,967)
Interest expense1,643 2,497 6,929 12,224 
Interest income(1,341)(3,199)(3,097)(5,826)
Other expense (income), net(65)213 116 411 
Income before income taxes23,046 (112,950)57,535 (71,776)
Provision for income taxes2,389 (4,091)12,146 7,451 
Net income (loss) from continuing operations20,657 (108,859)45,389 (79,227)
Net income (loss) from discontinued operations3,053 (108,403)(34,594)(113,427)
Net income (loss)$23,710 $(217,262)$10,795 $(192,654)
Per share data:
Net income (loss) from continuing operations per common share, basic$0.81 $(4.29)$1.79 $(3.12)
Net income (loss) from discontinued operations per common share, basic0.12 (4.28)(1.36)(4.47)
Net income (loss) per common share, basic$0.93 $(8.57)$0.42 $(7.59)
Weighted-average shares outstanding, basic25,482 25,353 25,423 25,378 
Net income (loss) from continuing operations per common share, diluted$0.80 $(4.29)$1.78 $(3.12)
Net income (loss) from discontinued operations per common share, diluted0.12 (4.28)(1.36)(4.47)
Net income (loss) per common share, diluted$0.92 $(8.57)$0.42 $(7.59)
Weighted-average shares outstanding, diluted25,664 25,353 25,518 25,378 


6

ScanSource Delivers Strong Fourth Quarter Sales and Profitability Growth
ScanSource, Inc. and Subsidiaries
Condensed Consolidated Statements of Cash Flows (Unaudited)
(in thousands)
Quarter ended June 30,Fiscal year ended June 30,
2021202020212020
Cash flows from operating activities:
Net income (loss)$23,710 $(217,262)$10,795 $(192,654)
Net income (loss) from discontinued operations3,053 (108,403)(34,594)(113,427)
Net income (loss) from continuing operations20,657 (108,859)45,389 (79,227)
Adjustments to reconcile net income (loss) to net cash provided by operating activities of continuing operations:
Depreciation and amortization8,090 8,743 33,507 35,328 
Amortization of debt issue costs104 104 417 417 
Provision for doubtful accounts112 222 338 1,621 
Share-based compensation2,328 1,425 8,039 5,478 
Impairment charges 120,470  120,470 
Deferred income taxes2,941 (10,714)2,916 (12,193)
Change in fair value of contingent consideration 674 516 6,941 
Contingent consideration payments excess— — (5,457)(3,050)
Finance lease interest23 21 119 85 
Changes in operating assets and liabilities, net of acquisitions:
Accounts receivable(50,204)57,562 (118,859)57,477 
Inventories(6,394)93,623 (12,301)86,177 
Prepaid expenses and other assets(17,111)(2,903)(18,753)(13,880)
Other non-current assets7,102 (12,534)9,948 (13,563)
Accounts payable105,511 (76,224)175,120 (20,846)
Accrued expenses and other liabilities(8,928)(1,992)(493)11,239 
Income taxes payable(2,886)4,334 (3,679)(441)
Net cash provided by operating activities of continuing operations61,345 73,952 116,767 182,033 
Cash flows from investing activities of continuing operations:
Capital expenditures(80)188 (2,363)(6,387)
Cash paid for business acquisitions, net of cash acquired —  (48,921)
Cash received for business disposal — 34,356 — 
Net cash (used in) provided by investing activities of continuing operations(80)188 31,993 (55,308)
Cash flows from financing activities of continuing operations:
Borrowings on revolving credit, net of expenses395,215 477,446 1,881,679 2,085,918 
Repayments on revolving credit, net of expenses(449,017)(539,732)(1,949,392)(2,190,595)
Borrowings on long-term debt, net(1,875)(938)(7,839)(4,085)
Repayments of finance lease obligations(320)(1,105)(1,294)(1,765)
Contingent consideration payments — (41,393)(35,482)
Exercise of stock options12 — 451 754 
Taxes paid on settlement of equity awards — (1,036)(1,353)
Repurchase of common stock —  (6,078)
Net cash used in financing activities of continuing operations(55,985)(64,329)(118,824)(152,686)
7

ScanSource Delivers Strong Fourth Quarter Sales and Profitability Growth
ScanSource, Inc. and Subsidiaries
Condensed Consolidated Statements of Cash Flows (Unaudited), continued
(in thousands)
Cash flows from discontinued operations:
Net cash flows provided by operating activities of discontinued operations2,469 2,235 24,173 44,238 
Net cash flows used in investing activities of discontinued operations (35)(58)(77)
Net cash flows used in financing activities of discontinued operations (10,663)(29,494)(3,921)
Net cash flows provided by (used in) discontinued operations2,469 (8,463)(5,379)40,240 
Effect of exchange rate changes on cash and cash equivalents5,648 (1,489)3,706 (3,642)
Increase (decrease) in cash and cash equivalents13,397 (141)28,263 10,637 
Consolidated cash and cash equivalents at beginning of period49,321 34,596 34,455 23,818 
Consolidated cash and cash equivalents at end of period62,718 34,455 62,718 34,455 
Cash and cash equivalents of discontinued operations —  4,970 
Cash and cash equivalents of continuing operations$62,718 $34,455 $62,718 $29,485 
8

ScanSource Delivers Strong Fourth Quarter Sales and Profitability Growth


ScanSource, Inc. and Subsidiaries
Supplementary Information (Unaudited)
(in thousands, except percentages)
Non-GAAP Financial Information:
Quarter ended June 30,Fiscal year ended June 30,
2021202020212020
Return on invested capital ratio (ROIC), annualized (a)
14.9 %4.0 %11.8 %7.5 %
Reconciliation of net income to EBITDA:
Net income (loss) from continuing operations (GAAP)$20,657$(108,859)$45,389$(79,227)
Plus: Interest expense1,6432,4976,92912,224
Plus: Income taxes2,389(4,091)12,1467,451
Plus: Depreciation and amortization8,0908,74333,50735,328
EBITDA (non-GAAP)32,779(101,710)97,971(24,224)
Plus: Change in fair value of contingent consideration6745166,941
Plus: Acquisition and divestiture costs(b)
2461,3112,3764,000
Plus: Restructuring costs(54)9,047604
Plus: Impairment charges120,470120,470
Plus: Tax recovery(8,424)(10,744)
Adjusted EBITDA (numerator for ROIC) (non-GAAP)$32,971$12,321$109,910$97,047
Invested Capital Calculations:
Equity – beginning of the quarter (c)
$690,575$897,678$678,246$914,129
Equity – end of the quarter (c)
731,191678,246731,191678,246
Plus: Change in fair value of contingent consideration, net of tax5103905,247
Plus: Acquisition and divestiture costs(b)
2071,3112,3374,000
Plus: Restructuring, net(40)6,840449
Plus: Impact of discontinued operations, net(3,053)108,40334,594113,427
Plus: Impairment charges, net114,398114,398
Plus: Tax recovery, net(6,247)(8,001)
Average equity709,440897,150726,799910,948
Average funded debt (d)
177,074337,973202,869390,709
Invested capital (denominator for ROIC) (non-GAAP)$886,514$1,235,123$929,668$1,301,657
(a) The annualized EBITDA amount is divided by days in the quarter times 365 days per year, or 366 days for leap year. There were 91 days in the current and prior-year quarter.
(b) Acquisition and divestiture costs are generally nondeductible for tax purposes.
(c) In the quarter ending June 30, 2020, the Company recorded impairment charges of $120.5 million. Impairment charges, net of tax reduced equity by $114.4 million.
(d) Average funded debt, which includes both continuing and discontinued operations, is calculated as the average daily amounts outstanding on short-term and long-term interest-bearing debt.
9

ScanSource Delivers Strong Fourth Quarter Sales and Profitability Growth
ScanSource, Inc. and Subsidiaries
Supplementary Information (Unaudited)
Net Sales by Segment:
Quarter ended June 30,
20212020% Change
Worldwide Barcode, Networking & Security:(in thousands)
Net sales, reported$597,943 $447,812 33.5 %
Foreign exchange impact (a)
(447)— 
Non-GAAP net sales, constant currency$597,496 $447,812 33.4 %
Worldwide Communications & Services:
Net sales, reported$254,751 $188,638 35.0 %
Foreign exchange impact (a)
(1,224)— 
Non-GAAP net sales, constant currency$253,527 $188,638 34.4 %
Consolidated:
Net sales, reported$852,694 $636,450 34.0 %
Foreign exchange impact (a)
(1,671)— 
Non-GAAP net sales, constant currency$851,023 $636,450 33.7 %
(a) Year-over-year net sales growth rate excluding the translation impact of changes in foreign currency exchange rates. Calculated by translating the net sales for the quarter ended June 30, 2021 into U.S. dollars using the average foreign exchange rates for the quarter ended June 30, 2020.
ScanSource, Inc. and Subsidiaries
Supplementary Information (Unaudited)
Net Sales by Segment:
Fiscal year ended June 30,
20212020% Change
Worldwide Barcode, Networking & Security:(in thousands)
Net sales, reported$2,175,141 $2,093,217 3.9 %
Foreign exchange impact (a)
19,311 — 
Non-GAAP net sales, constant currency$2,194,452 $2,093,217 4.8 %
Worldwide Communications & Services:
Net sales, reported$975,665 $954,517 2.2 %
Foreign exchange impact (a)
46,470 — 
Non-GAAP net sales, constant currency$1,022,135 $954,517 7.1 %
Consolidated:
Net sales, reported$3,150,806 $3,047,734 3.4 %
Foreign exchange impact (a)
65,781 — 
Non-GAAP net sales, constant currency$3,216,587 $3,047,734 5.5 %
(a) Year-over-year net sales growth rate excluding the translation impact of changes in foreign currency exchange rates. Calculated by translating the net sales for the fiscal year ended June 30, 2021 into U.S. dollars using the average foreign exchange rates for the fiscal year ended June 30, 2020.
10

ScanSource Delivers Strong Fourth Quarter Sales and Profitability Growth
ScanSource, Inc. and Subsidiaries
Supplementary Information (Unaudited)
Net Sales by Geography:
Quarter ended June 30,
20212020% Change
United States and Canada:(in thousands)
Net sales, as reported$771,403 $581,619 32.6 %
International:
Net sales, reported$81,291 $54,831 48.3 %
Foreign exchange impact(a)
(1,671)— 
Non-GAAP net sales, constant currency$79,620 $54,831 45.2 %
Consolidated:
Net sales, reported$852,694 $636,450 34.0 %
Foreign exchange impact(a)
(1,671)— 
Non-GAAP net sales, constant currency$851,023 $636,450 33.7 %
(a) Year-over-year net sales growth rate excluding the translation impact of changes in foreign currency exchange rates. Calculated by translating the net sales for the quarter ended June 30, 2021 into U.S. dollars using the average foreign exchange rates for the quarter ended June 30, 2020.

ScanSource, Inc. and Subsidiaries
Supplementary Information (Unaudited)
Net Sales by Geography:
Fiscal year ended June 30,
20212020% Change
United States and Canada:(in thousands)
Net sales, as reported$2,840,731 $2,755,134 3.1 %
International:
Net sales, reported$310,075 $292,600 6.0 %
Foreign exchange impact(a)
65,781 — 
Non-GAAP net sales, constant currency$375,856 $292,600 28.5 %
Consolidated:
Net sales, reported$3,150,806 $3,047,734 3.4 %
Foreign exchange impact(a)
65,781 — 
Non-GAAP net sales, constant currency$3,216,587 $3,047,734 5.5 %
(a) Year-over-year net sales growth rate excluding the translation impact of changes in foreign currency exchange rates. Calculated by translating the net sales for the fiscal year ended June 30, 2021 into U.S. dollars using the average foreign exchange rates for the fiscal year ended June 30, 2020.

11

ScanSource Delivers Strong Fourth Quarter Sales and Profitability Growth
Quarter ended June 30, 2021
GAAP MeasureIntangible amortization expenseChange in fair value of contingent considerationAcquisition, divestiture, and restructuring costs(a)Tax recovery, netImpairment chargesNon-GAAP measure
(in thousands, except per share data)
Net sales$852,694 $ $ $ $ $ $852,694 
Gross profit95,778      95,778 
Operating income23,283 4,893  192   28,368 
Other expense, net237      237 
Pre-tax income23,046 4,893  192   28,131 
Net income from continuing operations20,657 3,698  167   24,522 
Diluted EPS from continuing operations$0.80 $0.14 $ $0.01 $ $ $0.96 
(a) Acquisition and divestiture costs totaled $0.2 million for the quarter ended June 30, 2021 and are generally nondeductible for tax purposes. Restructuring costs totaled $(0.1) million for the quarter ended June 30, 2021.
Quarter ended June 30, 2020
GAAP MeasureIntangible amortization expenseChange in fair value of contingent considerationAcquisition, divestiture, and restructuring costs(a)Tax recovery, netImpairment chargesNon-GAAP measure
(in thousands, except per share data)
Net sales$636,450 $— $— $— $— $— $636,450 
Gross profit74,147 — — — — — 74,147 
Operating (loss) income(113,439)4,946 674 1,311 (5,743)120,470 8,219 
Other expense, net(489)— — — 2,681 — 2,192 
Pre-tax (loss) income(112,950)4,946 674 1,311 (8,424)120,470 6,027 
Net (loss) income from continuing operations(108,859)3,744 510 1,311 (6,247)114,398 4,857 
Diluted EPS from continuing operations$(4.29)$0.15 $0.02 $0.05 $(0.25)$4.51 $0.19 
(a) Acquisition and divestiture costs totaled xx for the quarter ended June 30, 2020 and are generally nondeductible for tax purposes.
12

ScanSource Delivers Strong Fourth Quarter Sales and Profitability Growth
Year ended June 30, 2021
Reported GAAP MeasureIntangible amortization expenseChange in fair value of contingent considerationAcquisition, divestiture, and restructuring costs(a)Tax recovery, netImpairment chargesNon-GAAP measure
(in thousands, except per share data)
Net sales$3,150,806 $ $ $ $ $ $3,150,806 
Gross profit350,716      350,716 
Operating income61,483 19,488 516 11,634   93,121 
Other expense, net3,948      3,948 
Pre-tax income57,535 19,488 516 11,634   89,173 
Net income from continuing operations45,389 14,753 390 9,336   69,868 
Diluted EPS from continuing operations$1.78 $0.58 $0.02 $0.36 $ $ $2.74 
(a) Acquisition and divestiture costs totaled $2.4 million for the fiscal year ended June 30, 2021 and are generally nondeductible for tax purposes. Restructuring costs totaled $9.3 million for the fiscal year ended June 30, 2021.
Year ended June 30, 2020
Reported GAAP MeasureIntangible amortization expenseChange in fair value of contingent considerationAcquisition, divestiture, and restructuring costsTax recovery, netImpairment chargesNon-GAAP measure
(in thousands, except per share data)
Net sales$3,047,734 $— $— $— $— $— $3,047,734 
Gross profit355,569 — — — — — 355,569 
Operating (loss) income(64,967)19,953 6,941 4,604 (8,063)120,470 78,938 
Other expense, net6,809 — — — 2,681 — 9,490 
Pre-tax (loss) income(71,776)19,953 6,941 4,604 (10,744)120,470 69,448 
Net (loss) income from continuing operations(79,227)15,091 5,247 4,449 (8,001)114,398 51,957 
Diluted EPS from continuing operations$(3.12)$0.59 $0.21 $0.18 $(0.32)$4.51 $2.05 
(a) Acquisition and divestiture costs totaled $4.0 million for the fiscal year ended June 30, 2020 and are generally nondeductible for tax purposes. Restructuring costs totaled $0.6 million for the fiscal year ended June 30, 2020.
13

ScanSource Delivers Strong Fourth Quarter Sales and Profitability Growth

ScanSource, Inc. and Subsidiaries
Supplementary Information (Unaudited)
Discontinued Operations - Financial Results:
Quarter ended June 30,Fiscal year ended June 30,
2021202020212020
(in thousands)
Net sales$ $121,969 $213,373 $561,496 
Cost of goods sold 112,846 198,512 513,003 
Gross profit 9,123 14,861 48,493 
Selling, general and administrative expenses 11,337 17,291 53,946 
Depreciation expense 205  975 
Intangible amortization expense 330  1,403 
Operating loss (16,496)(2,430)(21,578)
Interest expense, net 163 394 1,399 
Loss on disposal group101 88,923 34,597 88,923 
Other expense, net 1,221 310 1,124 
Loss from discontinued operations before taxes(101)(106,803)(37,731)(113,024)
Income tax (benefit) expense(3,154)1,600 (3,137)403 
Net income (loss) from discontinued operations$3,053 $(108,403)$(34,594)$(113,427)
14

ScanSource Delivers Strong Fourth Quarter Sales and Profitability Growth
ScanSource, Inc. and Subsidiaries
Supplementary Information (Unaudited)
Discontinued Operations - Assets and Liabilities:
June 30, 2021June 30, 2020
(in thousands)
Assets
Current assets:
Cash and cash equivalents$ $4,970 
Accounts receivable, net 117,200 
Inventories, net 106,779 
Prepaid expenses and other current assets 23,808 
Total current assets 252,757 
Property and equipment, net 1,833 
Deferred income taxes 9,349 
Other non-current assets 6,215 
Total assets, before valuation allowance 270,154 
Less: valuation allowance (88,923)
Total assets, net of valuation allowance (a)
$ $181,231 
Liabilities
Current liabilities:
Accounts payable$— $56,098 
Accrued expenses and other current liabilities— 14,815 
Other taxes payable— 20,378 
Short-term borrowings— 3,524 
Income tax payable— 1,085 
Total current liabilities— 95,900 
Borrowings under revolving credit facility— 24,704 
Other long-term liabilities— 7,418 
Total liabilities(1)
$— $128,022 
(a) Total assets and liabilities of discontinued operations are classified in current assets and liabilities, respectively, in the Company's consolidated balance sheet as of June 30, 2020. The discontinued operations were disposed of during the quarter ended December 31, 2020.


15

ScanSource Delivers Strong Fourth Quarter Sales and Profitability Growth
ScanSource, Inc. and Subsidiaries
Supplementary Forward-Looking Information (Unaudited)
Annual Financial Outlook for Fiscal Year 2022:
FY22 Outlook
GAAP, Operating IncomeAt least $92 million
Intangible amortization$18 million
Depreciation expense$14 million
Share-based compensation expense$11 million
Adjusted EBITDA (non-GAAP)At least $135 million
Fiscal Year 2021 Adjusted EBITDA, excluding Share-Based Compensation Expense:
FY21
Adjusted EBITDA, as reported (non-GAAP)$109.9 million
Add: Share-based compensation expense$8.0 million
Adjusted EBITDA, excluding share-based compensation expense$117.9 million
16
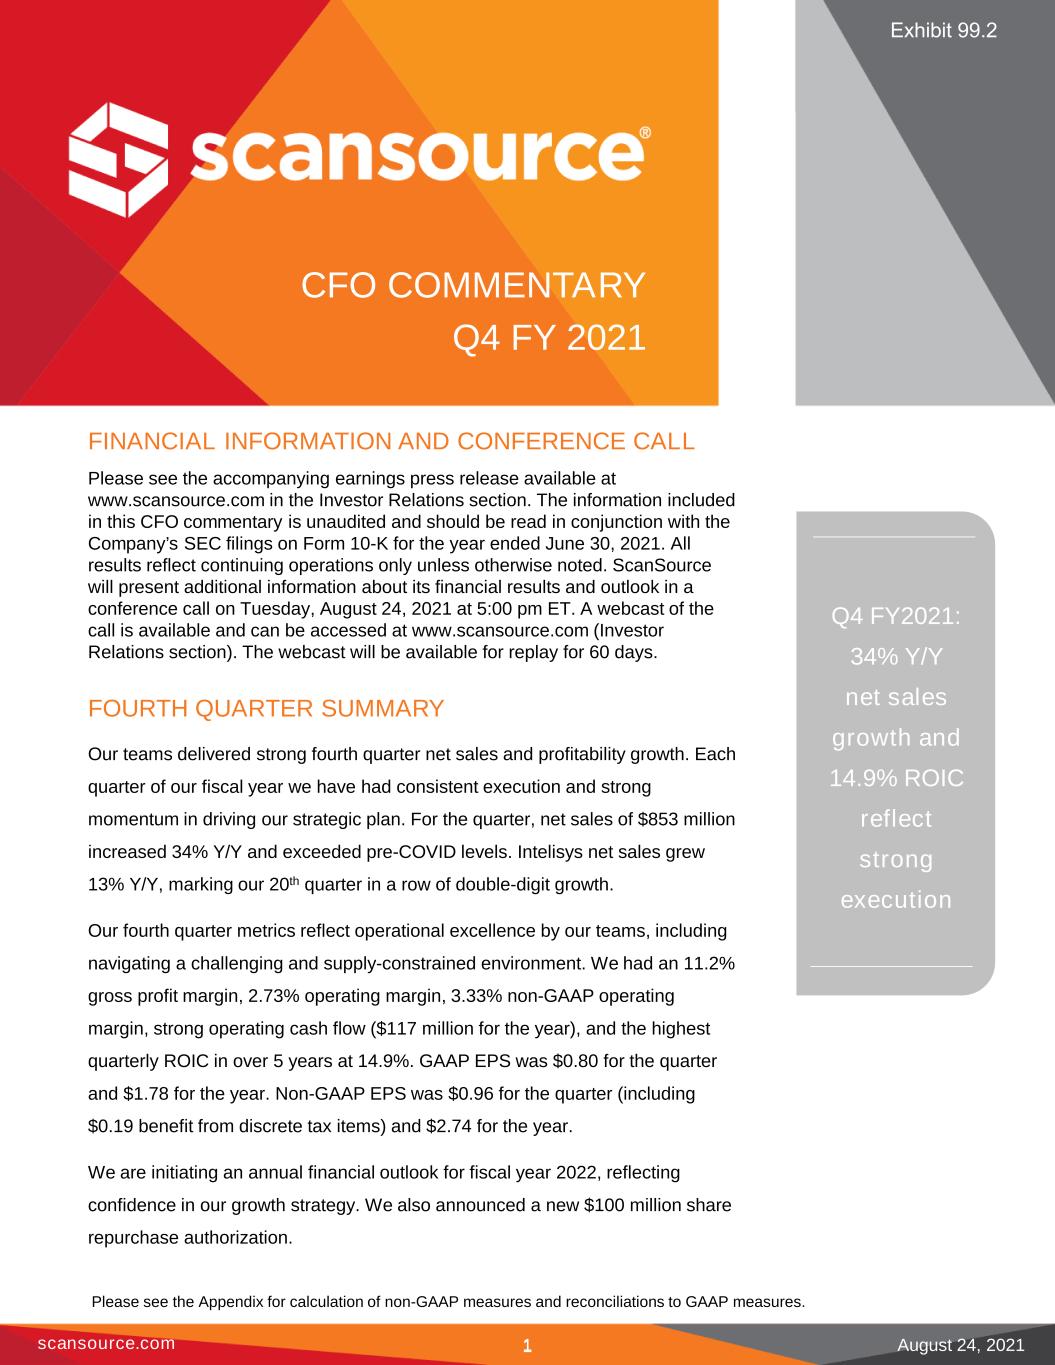
CFO COMMENTARY Q4 FY2021 ScanSource, Inc. scansource.com FINANCIAL INFORMATION AND CONFERENCE CALL Please see the accompanying earnings press release available at www.scansource.com in the Investor Relations section. The information included in this CFO commentary is unaudited and should be read in conjunction with the Company’s SEC filings on Form 10-K for the year ended June 30, 2021. All results reflect continuing operations only unless otherwise noted. ScanSource will present additional information about its financial results and outlook in a conference call on Tuesday, August 24, 2021 at 5:00 pm ET. A webcast of the call is available and can be accessed at www.scansource.com (Investor Relations section). The webcast will be available for replay for 60 days. FOURTH QUARTER SUMMARY Our teams delivered strong fourth quarter net sales and profitability growth. Each quarter of our fiscal year we have had consistent execution and strong momentum in driving our strategic plan. For the quarter, net sales of $853 million increased 34% Y/Y and exceeded pre-COVID levels. Intelisys net sales grew 13% Y/Y, marking our 20th quarter in a row of double-digit growth. Our fourth quarter metrics reflect operational excellence by our teams, including navigating a challenging and supply-constrained environment. We had an 11.2% gross profit margin, 2.73% operating margin, 3.33% non-GAAP operating margin, strong operating cash flow ($117 million for the year), and the highest quarterly ROIC in over 5 years at 14.9%. GAAP EPS was $0.80 for the quarter and $1.78 for the year. Non-GAAP EPS was $0.96 for the quarter (including $0.19 benefit from discrete tax items) and $2.74 for the year. We are initiating an annual financial outlook for fiscal year 2022, reflecting confidence in our growth strategy. We also announced a new $100 million share repurchase authorization. CFO COMMENTARY Q4 FY 2021 August 24, 20211 Please see the Appendix for calculation of non-GAAP measures and reconciliations to GAAP measures. Q4 FY2021: 34% Y/Y net sales growth and 14.9% ROIC reflect strong execution Exhibit 99.2
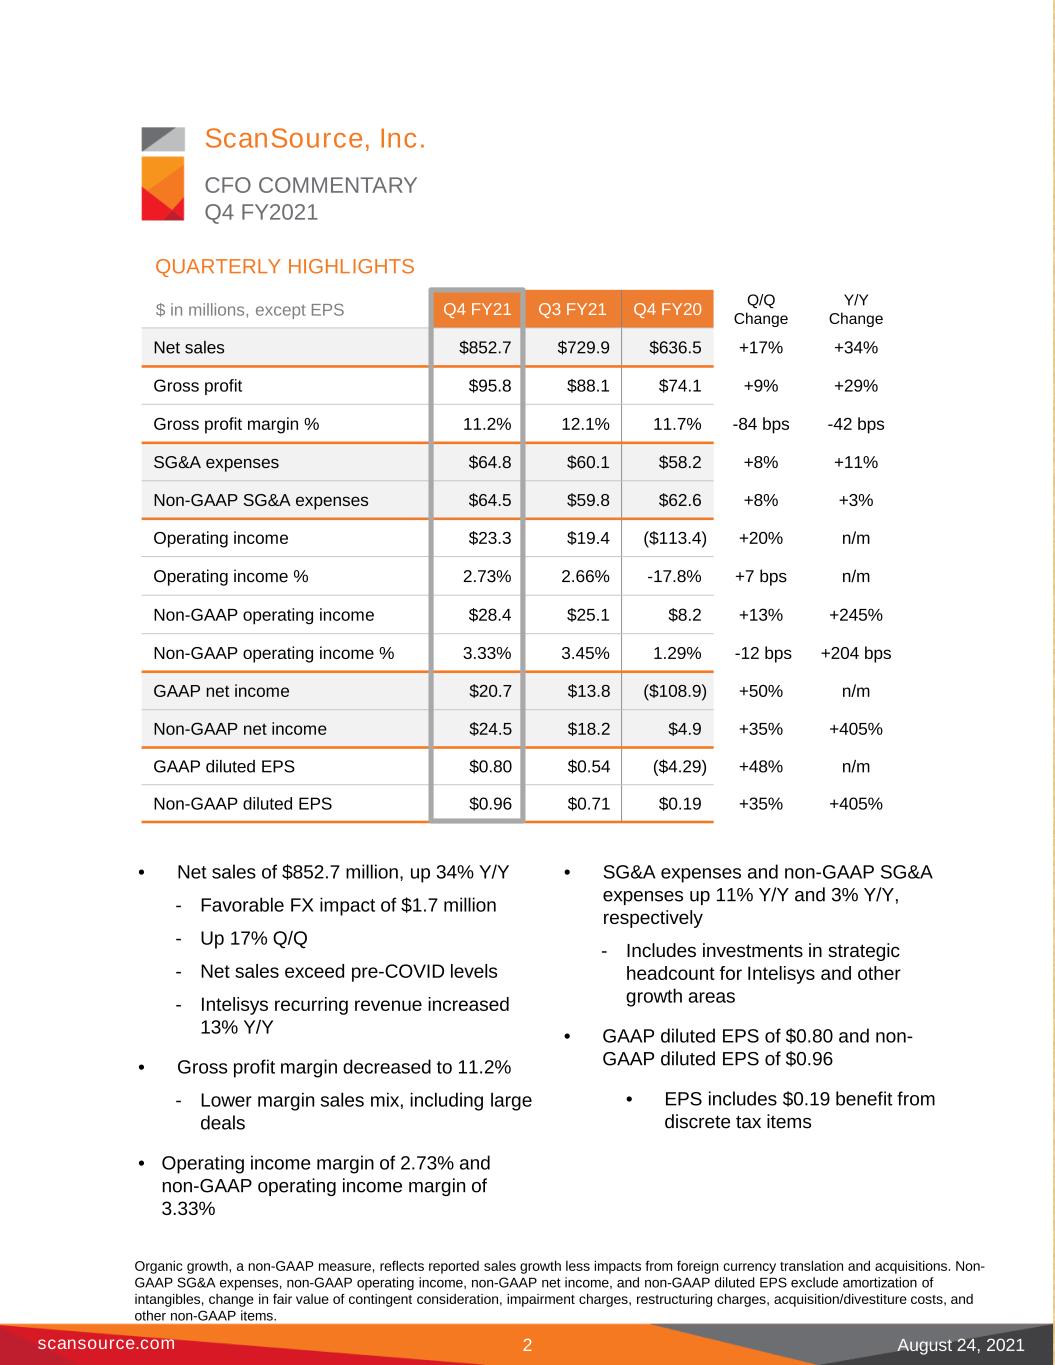

 
CFO COMMENTARY Q4 FY2021 ScanSource, Inc. scansource.com Q4 FY21 Q3 FY21 Q4 FY20 Q/Q Change Y/Y Change Net sales $852.7 $729.9 $636.5 +17% +34% Gross profit $95.8 $88.1 $74.1 +9% +29% Gross profit margin % 11.2% 12.1% 11.7% -84 bps -42 bps SG&A expenses $64.8 $60.1 $58.2 +8% +11% Non-GAAP SG&A expenses $64.5 $59.8 $62.6 +8% +3% Operating income $23.3 $19.4 ($113.4) +20% n/m Operating income % 2.73% 2.66% -17.8% +7 bps n/m Non-GAAP operating income $28.4 $25.1 $8.2 +13% +245% Non-GAAP operating income % 3.33% 3.45% 1.29% -12 bps +204 bps GAAP net income $20.7 $13.8 ($108.9) +50% n/m Non-GAAP net income $24.5 $18.2 $4.9 +35% +405% GAAP diluted EPS $0.80 $0.54 ($4.29) +48% n/m Non-GAAP diluted EPS $0.96 $0.71 $0.19 +35% +405% • Net sales of $852.7 million, up 34% Y/Y - Favorable FX impact of $1.7 million - Up 17% Q/Q - Net sales exceed pre-COVID levels - Intelisys recurring revenue increased 13% Y/Y • Gross profit margin decreased to 11.2% - Lower margin sales mix, including large deals • Operating income margin of 2.73% and non-GAAP operating income margin of 3.33% • SG&A expenses and non-GAAP SG&A expenses up 11% Y/Y and 3% Y/Y, respectively - Includes investments in strategic headcount for Intelisys and other growth areas • GAAP diluted EPS of $0.80 and non- GAAP diluted EPS of $0.96 • EPS includes $0.19 benefit from discrete tax items $ in millions, except EPS August 24, 2021 QUARTERLY HIGHLIGHTS Organic growth, a non-GAAP measure, reflects reported sales growth less impacts from foreign currency translation and acquisitions. Non- GAAP SG&A expenses, non-GAAP operating income, non-GAAP net income, and non-GAAP diluted EPS exclude amortization of intangibles, change in fair value of contingent consideration, impairment charges, restructuring charges, acquisition/divestiture costs, and other non-GAAP items. 2
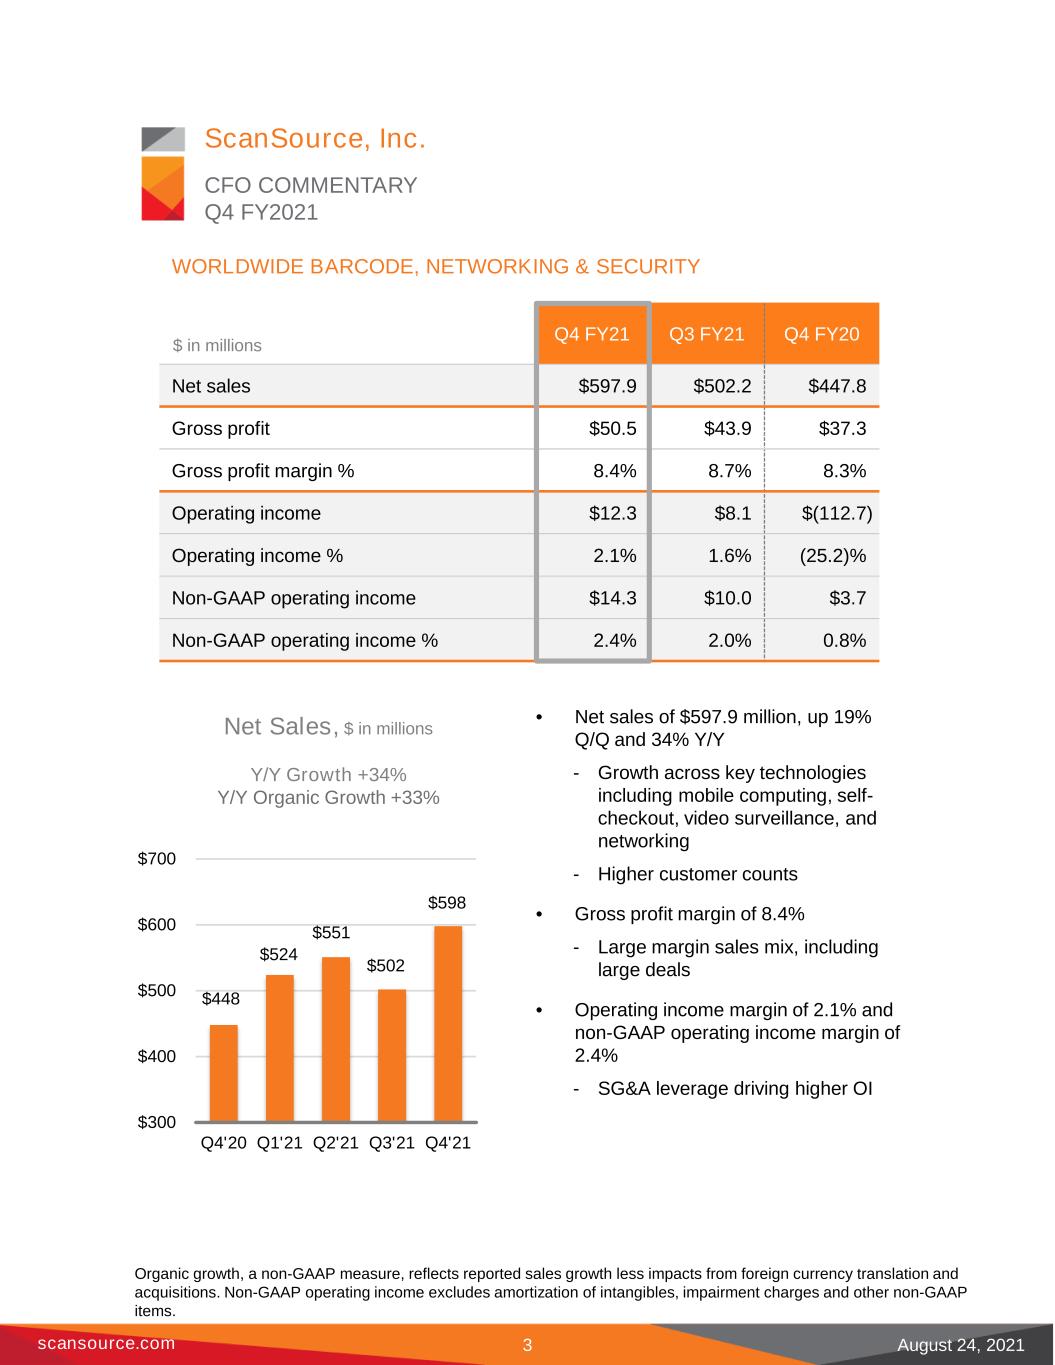

 
CFO COMMENTARY Q4 FY2021 ScanSource, Inc. scansource.com • Net sales of $597.9 million, up 19% Q/Q and 34% Y/Y - Growth across key technologies including mobile computing, self- checkout, video surveillance, and networking - Higher customer counts • Gross profit margin of 8.4% - Large margin sales mix, including large deals • Operating income margin of 2.1% and non-GAAP operating income margin of 2.4% - SG&A leverage driving higher OI Q4 FY21 Q3 FY21 Q4 FY20 Net sales $597.9 $502.2 $447.8 Gross profit $50.5 $43.9 $37.3 Gross profit margin % 8.4% 8.7% 8.3% Operating income $12.3 $8.1 $(112.7) Operating income % 2.1% 1.6% (25.2)% Non-GAAP operating income $14.3 $10.0 $3.7 Non-GAAP operating income % 2.4% 2.0% 0.8% August 24, 2021 WORLDWIDE BARCODE, NETWORKING & SECURITY $448 $524 $551 $502 $598 $300 $400 $500 $600 $700 Q4'20 Q1'21 Q2'21 Q3'21 Q4'21 Net Sales, $ in millions Y/Y Growth +34% Y/Y Organic Growth +33% $ in millions Organic growth, a non-GAAP measure, reflects reported sales growth less impacts from foreign currency translation and acquisitions. Non-GAAP operating income excludes amortization of intangibles, impairment charges and other non-GAAP items. 3
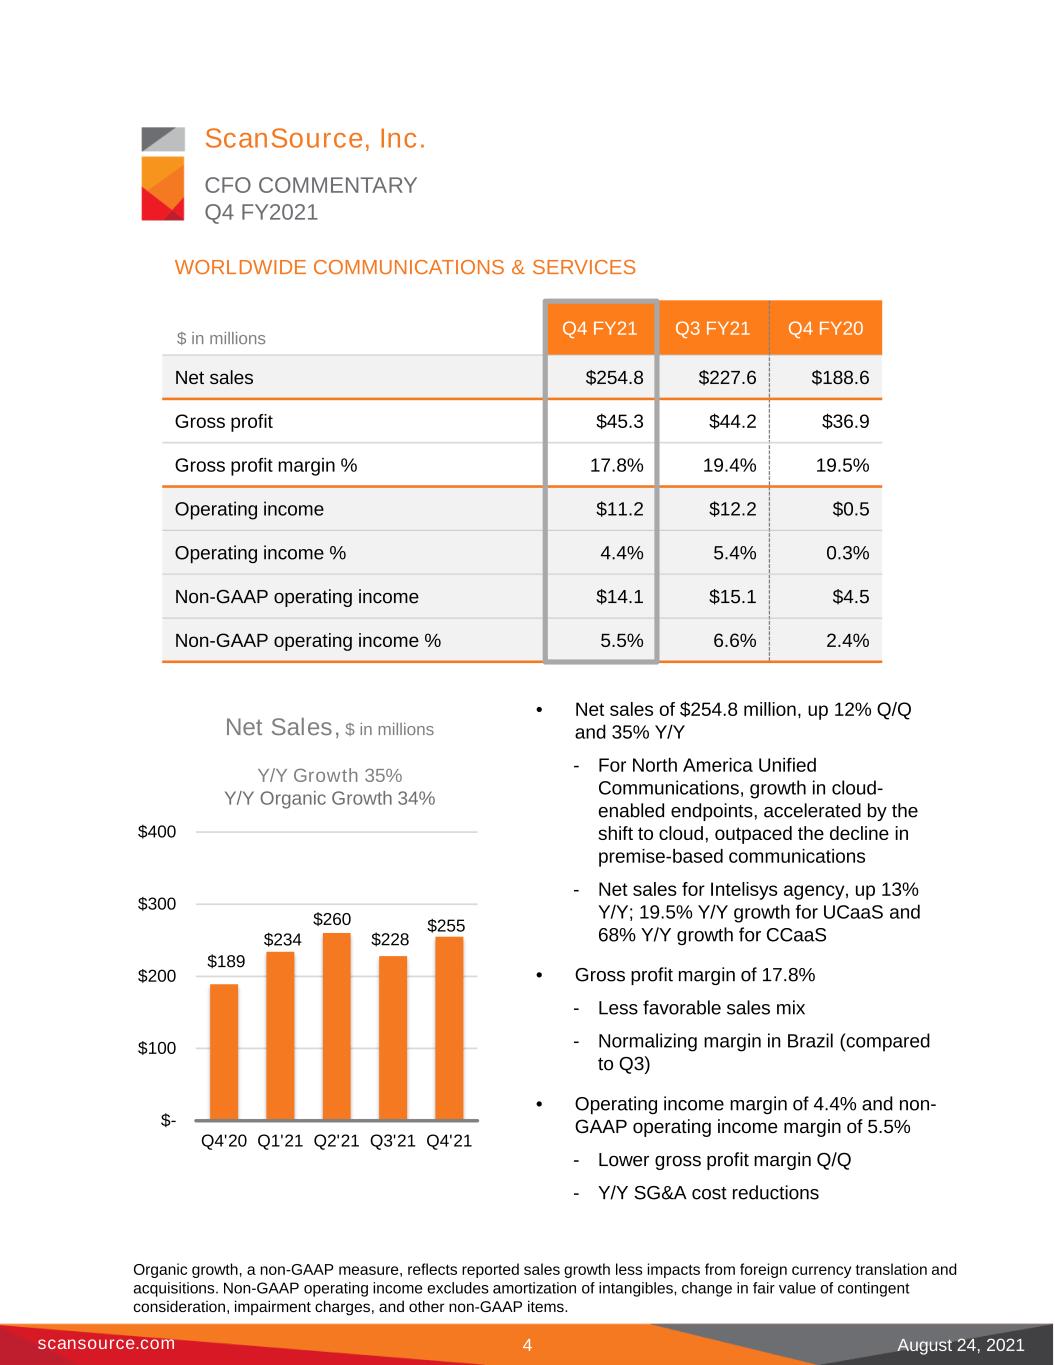

 
CFO COMMENTARY Q4 FY2021 ScanSource, Inc. scansource.com Q4 FY21 Q3 FY21 Q4 FY20 Net sales $254.8 $227.6 $188.6 Gross profit $45.3 $44.2 $36.9 Gross profit margin % 17.8% 19.4% 19.5% Operating income $11.2 $12.2 $0.5 Operating income % 4.4% 5.4% 0.3% Non-GAAP operating income $14.1 $15.1 $4.5 Non-GAAP operating income % 5.5% 6.6% 2.4% August 24, 2021 WORLDWIDE COMMUNICATIONS & SERVICES $189 $234 $260 $228 $255 $- $100 $200 $300 $400 Q4'20 Q1'21 Q2'21 Q3'21 Q4'21 Net Sales, $ in millions Y/Y Growth 35% Y/Y Organic Growth 34% $ in millions • Net sales of $254.8 million, up 12% Q/Q and 35% Y/Y - For North America Unified Communications, growth in cloud- enabled endpoints, accelerated by the shift to cloud, outpaced the decline in premise-based communications - Net sales for Intelisys agency, up 13% Y/Y; 19.5% Y/Y growth for UCaaS and 68% Y/Y growth for CCaaS • Gross profit margin of 17.8% - Less favorable sales mix - Normalizing margin in Brazil (compared to Q3) • Operating income margin of 4.4% and non- GAAP operating income margin of 5.5% - Lower gross profit margin Q/Q - Y/Y SG&A cost reductions 4 Organic growth, a non-GAAP measure, reflects reported sales growth less impacts from foreign currency translation and acquisitions. Non-GAAP operating income excludes amortization of intangibles, change in fair value of contingent consideration, impairment charges, and other non-GAAP items.
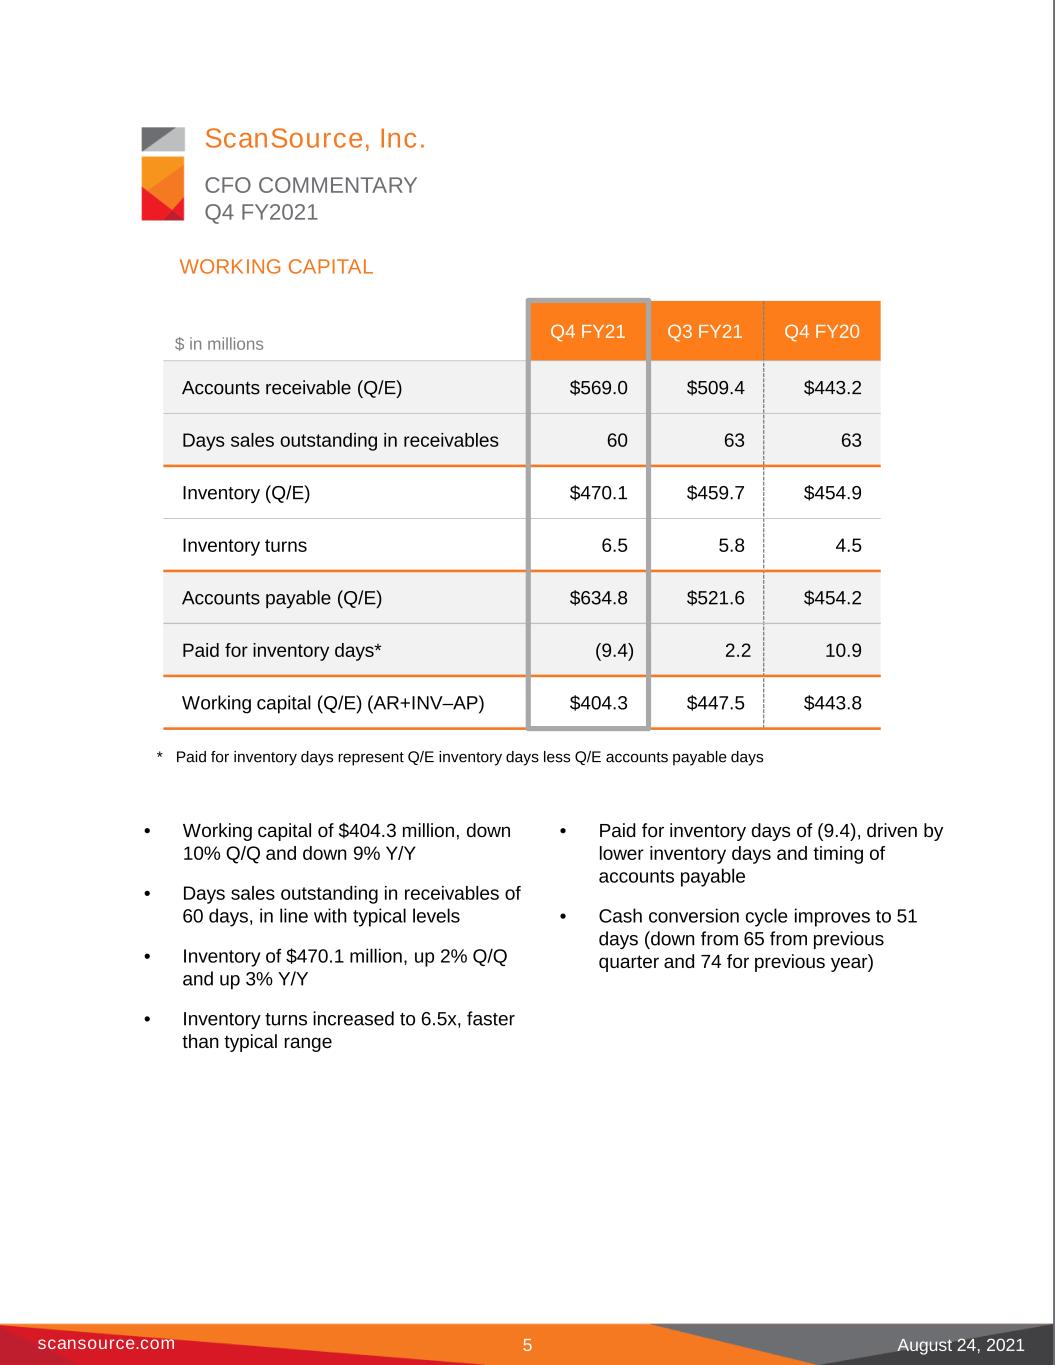

 
CFO COMMENTARY Q4 FY2021 ScanSource, Inc. scansource.com Q4 FY21 Q3 FY21 Q4 FY20 Accounts receivable (Q/E) $569.0 $509.4 $443.2 Days sales outstanding in receivables 60 63 63 Inventory (Q/E) $470.1 $459.7 $454.9 Inventory turns 6.5 5.8 4.5 Accounts payable (Q/E) $634.8 $521.6 $454.2 Paid for inventory days* (9.4) 2.2 10.9 Working capital (Q/E) (AR+INV–AP) $404.3 $447.5 $443.8 August 24, 2021 WORKING CAPITAL • Working capital of $404.3 million, down 10% Q/Q and down 9% Y/Y • Days sales outstanding in receivables of 60 days, in line with typical levels • Inventory of $470.1 million, up 2% Q/Q and up 3% Y/Y • Inventory turns increased to 6.5x, faster than typical range • Paid for inventory days of (9.4), driven by lower inventory days and timing of accounts payable • Cash conversion cycle improves to 51 days (down from 65 from previous quarter and 74 for previous year) $ in millions * Paid for inventory days represent Q/E inventory days less Q/E accounts payable days 5
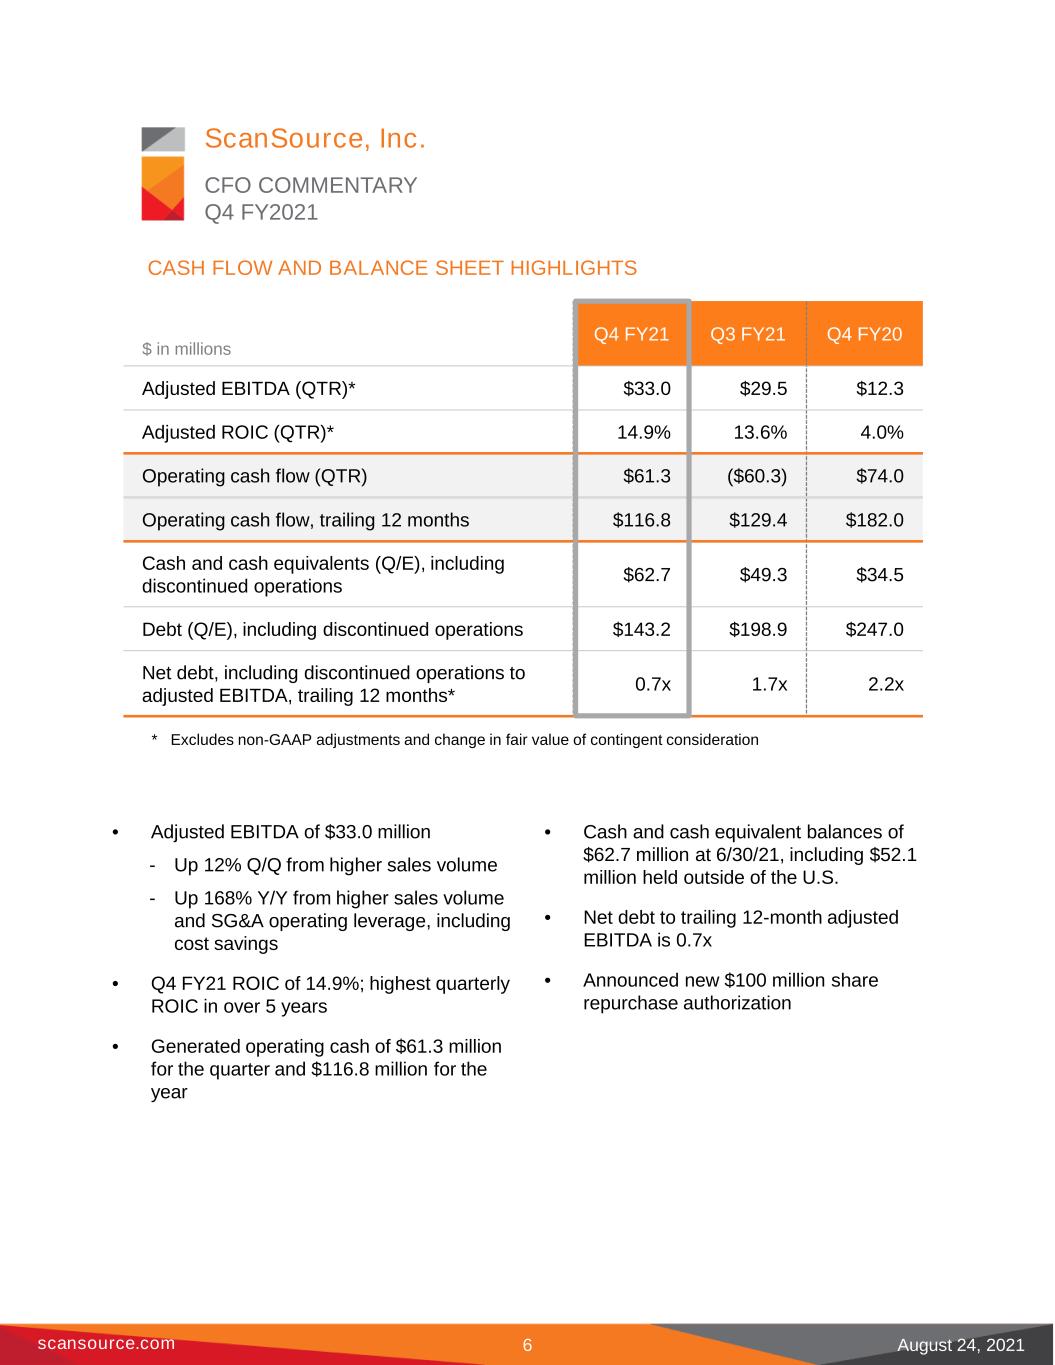

 
CFO COMMENTARY Q4 FY2021 ScanSource, Inc. scansource.com Q4 FY21 Q3 FY21 Q4 FY20 Adjusted EBITDA (QTR)* $33.0 $29.5 $12.3 Adjusted ROIC (QTR)* 14.9% 13.6% 4.0% Operating cash flow (QTR) $61.3 ($60.3) $74.0 Operating cash flow, trailing 12 months $116.8 $129.4 $182.0 Cash and cash equivalents (Q/E), including discontinued operations $62.7 $49.3 $34.5 Debt (Q/E), including discontinued operations $143.2 $198.9 $247.0 Net debt, including discontinued operations to adjusted EBITDA, trailing 12 months* 0.7x 1.7x 2.2x August 24, 2021 CASH FLOW AND BALANCE SHEET HIGHLIGHTS • Adjusted EBITDA of $33.0 million - Up 12% Q/Q from higher sales volume - Up 168% Y/Y from higher sales volume and SG&A operating leverage, including cost savings • Q4 FY21 ROIC of 14.9%; highest quarterly ROIC in over 5 years • Generated operating cash of $61.3 million for the quarter and $116.8 million for the year • Cash and cash equivalent balances of $62.7 million at 6/30/21, including $52.1 million held outside of the U.S. • Net debt to trailing 12-month adjusted EBITDA is 0.7x • Announced new $100 million share repurchase authorization $ in millions * Excludes non-GAAP adjustments and change in fair value of contingent consideration 6
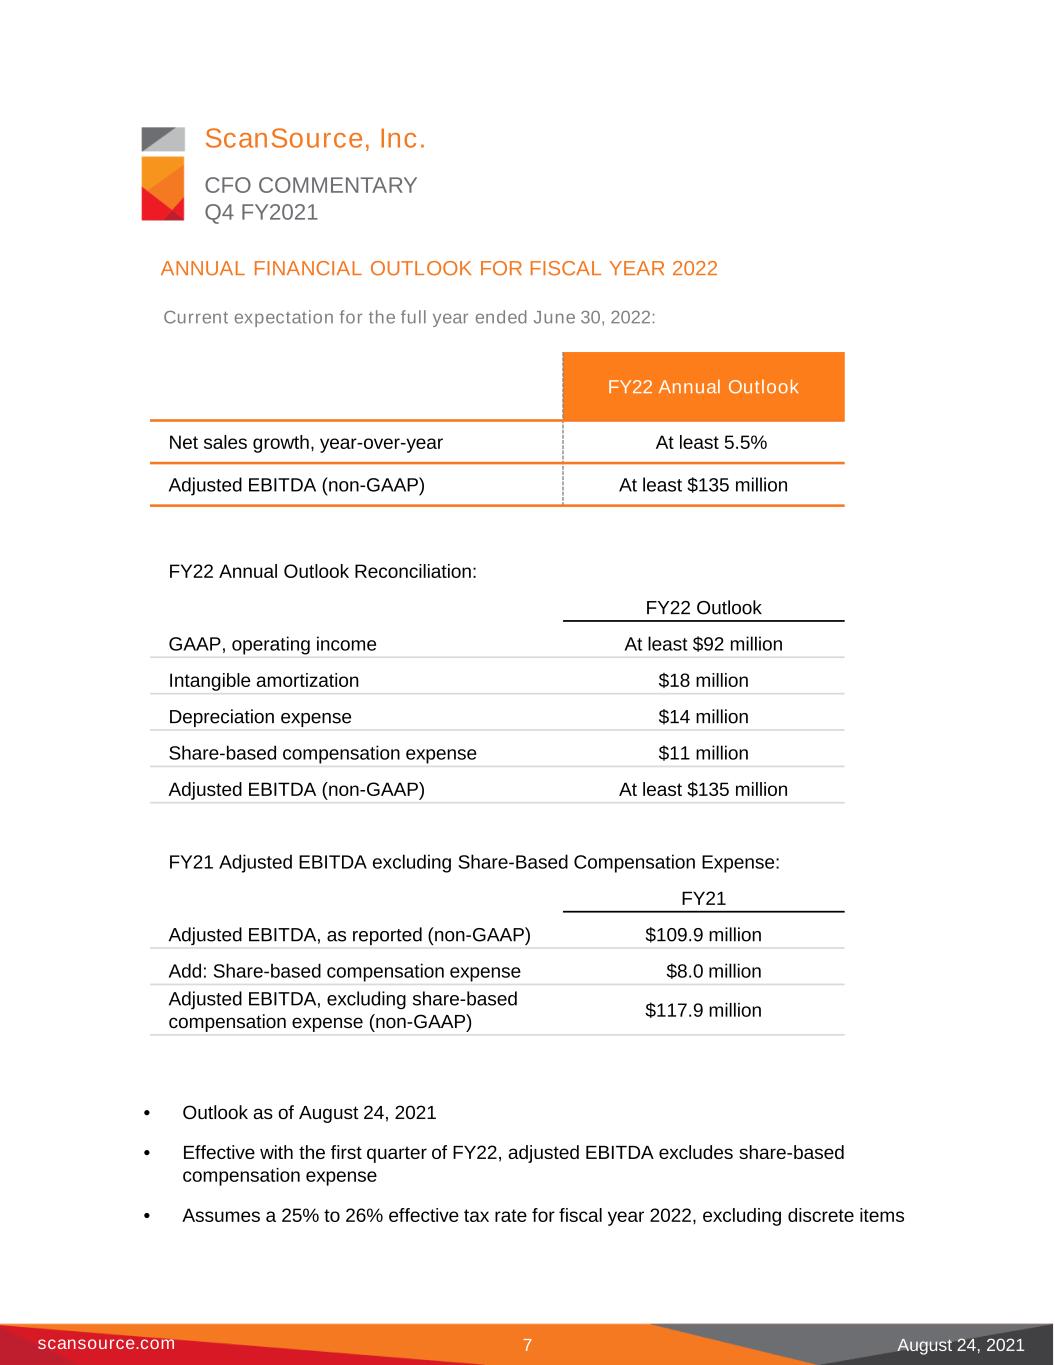

 
CFO COMMENTARY Q4 FY2021 ScanSource, Inc. scansource.com August 24, 2021 ANNUAL FINANCIAL OUTLOOK FOR FISCAL YEAR 2022 Current expectation for the full year ended June 30, 2022: • Outlook as of August 24, 2021 • Effective with the first quarter of FY22, adjusted EBITDA excludes share-based compensation expense • Assumes a 25% to 26% effective tax rate for fiscal year 2022, excluding discrete items 7 FY22 Annual Outlook Net sales growth, year-over-year At least 5.5% Adjusted EBITDA (non-GAAP) At least $135 million FY22 Annual Outlook Reconciliation: FY22 Outlook GAAP, operating income At least $92 million Intangible amortization $18 million Depreciation expense $14 million Share-based compensation expense $11 million Adjusted EBITDA (non-GAAP) At least $135 million FY21 Adjusted EBITDA excluding Share-Based Compensation Expense: FY21 Adjusted EBITDA, as reported (non-GAAP) $109.9 million Add: Share-based compensation expense $8.0 million Adjusted EBITDA, excluding share-based compensation expense (non-GAAP) $117.9 million
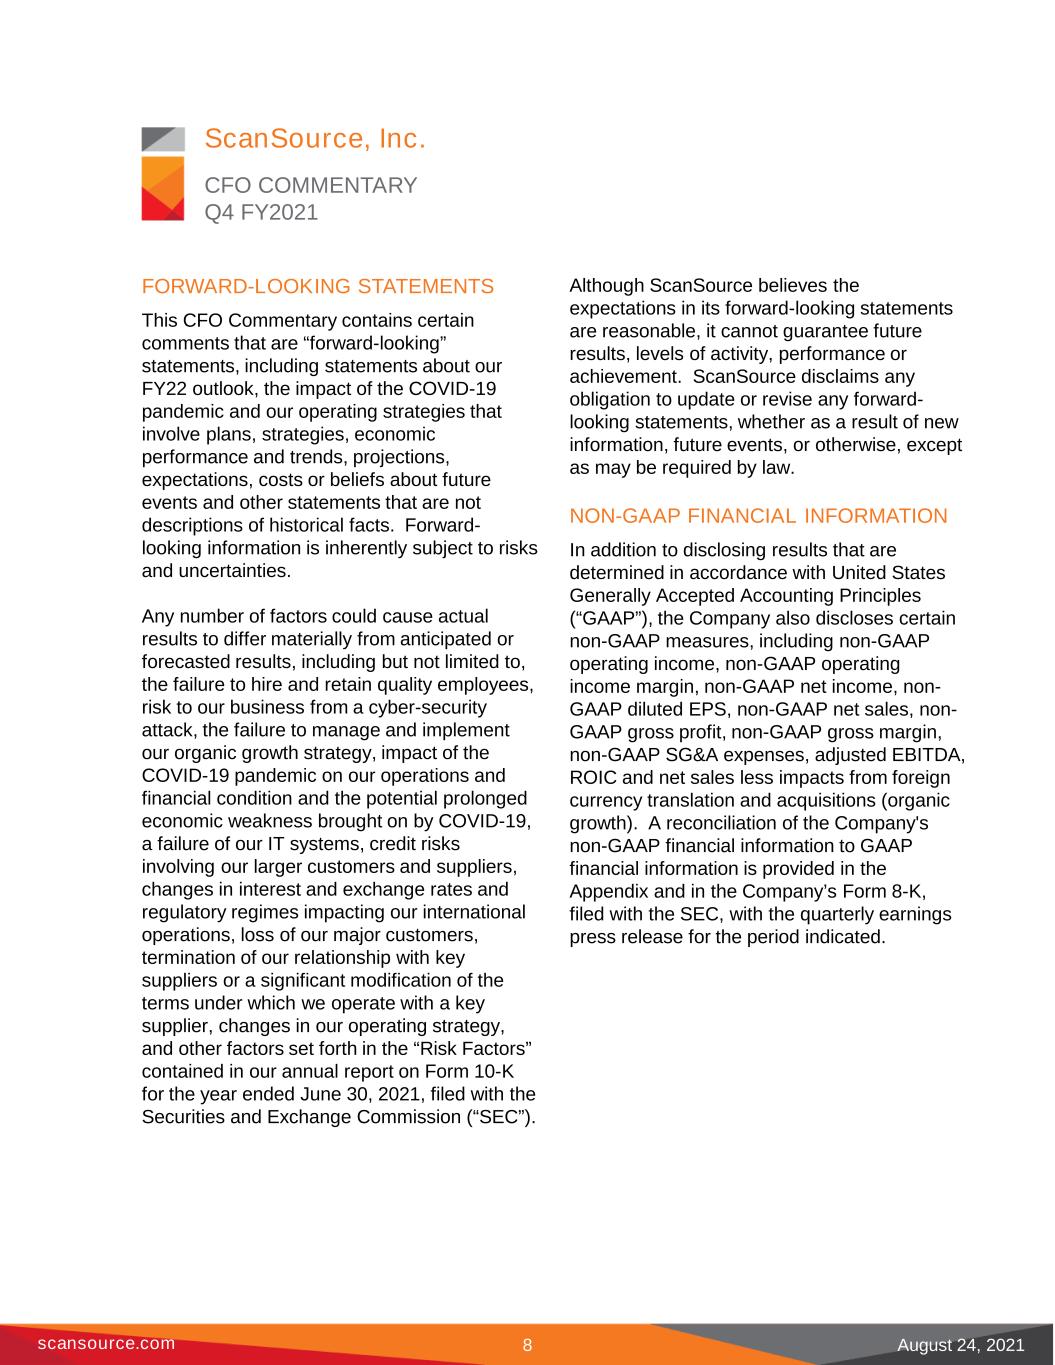

 
CFO COMMENTARY Q4 FY2021 ScanSource, Inc. scansource.com FORWARD-LOOKING STATEMENTS This CFO Commentary contains certain comments that are “forward-looking” statements, including statements about our FY22 outlook, the impact of the COVID-19 pandemic and our operating strategies that involve plans, strategies, economic performance and trends, projections, expectations, costs or beliefs about future events and other statements that are not descriptions of historical facts. Forward- looking information is inherently subject to risks and uncertainties. Any number of factors could cause actual results to differ materially from anticipated or forecasted results, including but not limited to, the failure to hire and retain quality employees, risk to our business from a cyber-security attack, the failure to manage and implement our organic growth strategy, impact of the COVID-19 pandemic on our operations and financial condition and the potential prolonged economic weakness brought on by COVID-19, a failure of our IT systems, credit risks involving our larger customers and suppliers, changes in interest and exchange rates and regulatory regimes impacting our international operations, loss of our major customers, termination of our relationship with key suppliers or a significant modification of the terms under which we operate with a key supplier, changes in our operating strategy, and other factors set forth in the “Risk Factors” contained in our annual report on Form 10-K for the year ended June 30, 2021, filed with the Securities and Exchange Commission (“SEC”). Although ScanSource believes the expectations in its forward-looking statements are reasonable, it cannot guarantee future results, levels of activity, performance or achievement. ScanSource disclaims any obligation to update or revise any forward- looking statements, whether as a result of new information, future events, or otherwise, except as may be required by law. NON-GAAP FINANCIAL INFORMATION In addition to disclosing results that are determined in accordance with United States Generally Accepted Accounting Principles (“GAAP”), the Company also discloses certain non-GAAP measures, including non-GAAP operating income, non-GAAP operating income margin, non-GAAP net income, non- GAAP diluted EPS, non-GAAP net sales, non- GAAP gross profit, non-GAAP gross margin, non-GAAP SG&A expenses, adjusted EBITDA, ROIC and net sales less impacts from foreign currency translation and acquisitions (organic growth). A reconciliation of the Company's non-GAAP financial information to GAAP financial information is provided in the Appendix and in the Company’s Form 8-K, filed with the SEC, with the quarterly earnings press release for the period indicated. August 24, 20218
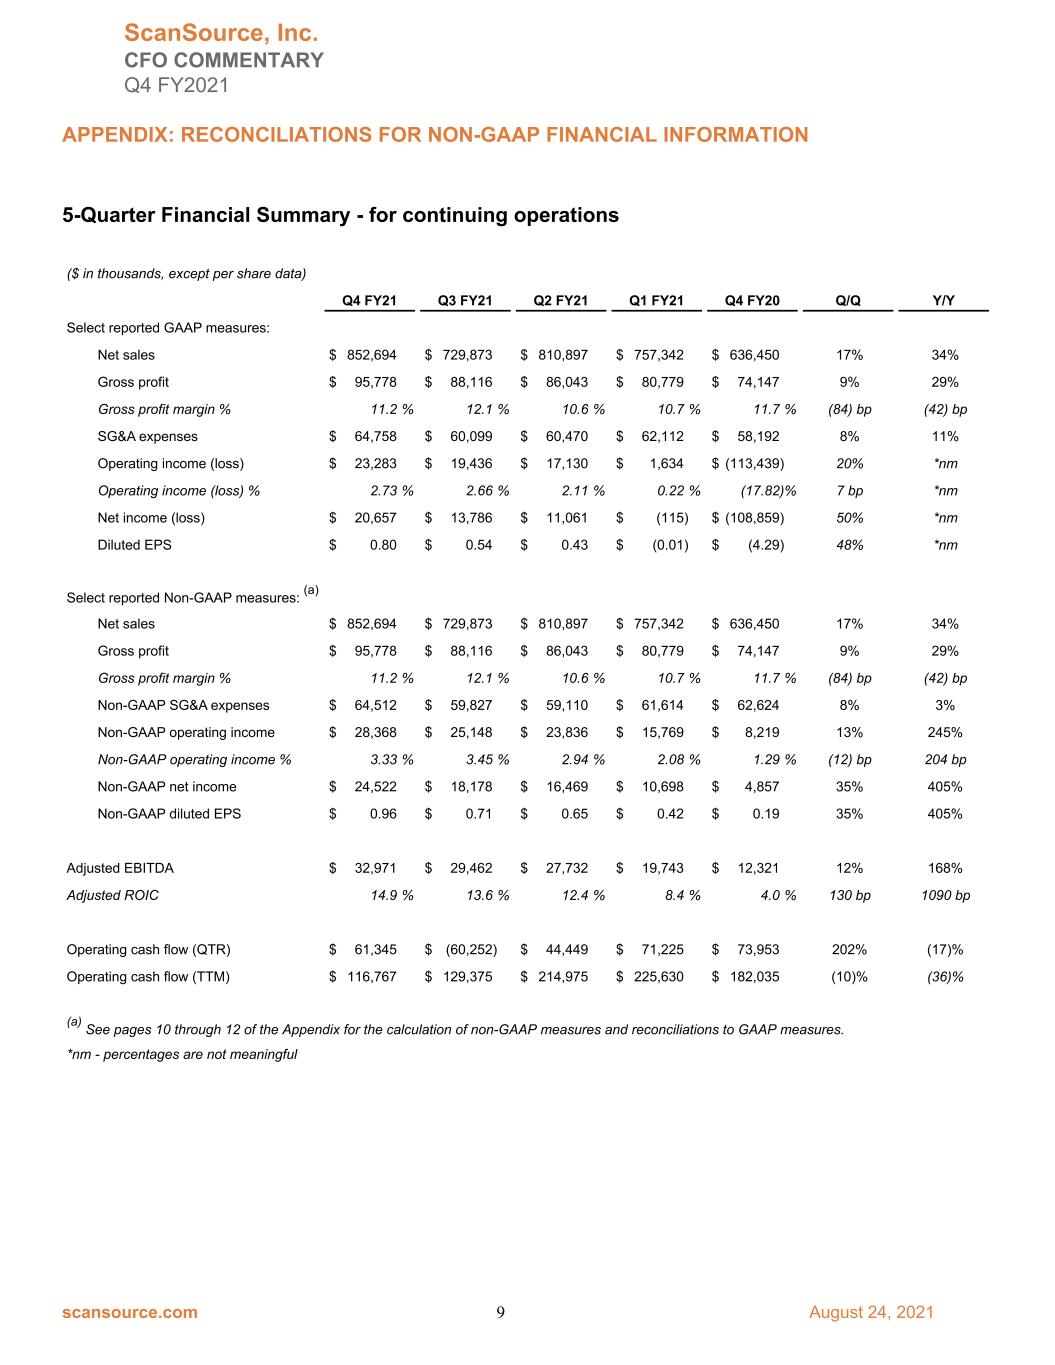

 
5-Quarter Financial Summary - for continuing operations ($ in thousands, except per share data) Q4 FY21 Q3 FY21 Q2 FY21 Q1 FY21 Q4 FY20 Q/Q Y/Y Select reported GAAP measures: Net sales $ 852,694 $ 729,873 $ 810,897 $ 757,342 $ 636,450 17% 34% Gross profit $ 95,778 $ 88,116 $ 86,043 $ 80,779 $ 74,147 9% 29% Gross profit margin % 11.2 % 12.1 % 10.6 % 10.7 % 11.7 % (84) bp (42) bp SG&A expenses $ 64,758 $ 60,099 $ 60,470 $ 62,112 $ 58,192 8% 11% Operating income (loss) $ 23,283 $ 19,436 $ 17,130 $ 1,634 $ (113,439) 20% *nm Operating income (loss) % 2.73 % 2.66 % 2.11 % 0.22 % (17.82) % 7 bp *nm Net income (loss) $ 20,657 $ 13,786 $ 11,061 $ (115) $ (108,859) 50% *nm Diluted EPS $ 0.80 $ 0.54 $ 0.43 $ (0.01) $ (4.29) 48% *nm Select reported Non-GAAP measures: (a) Net sales $ 852,694 $ 729,873 $ 810,897 $ 757,342 $ 636,450 17% 34% Gross profit $ 95,778 $ 88,116 $ 86,043 $ 80,779 $ 74,147 9% 29% Gross profit margin % 11.2 % 12.1 % 10.6 % 10.7 % 11.7 % (84) bp (42) bp Non-GAAP SG&A expenses $ 64,512 $ 59,827 $ 59,110 $ 61,614 $ 62,624 8% 3% Non-GAAP operating income $ 28,368 $ 25,148 $ 23,836 $ 15,769 $ 8,219 13% 245% Non-GAAP operating income % 3.33 % 3.45 % 2.94 % 2.08 % 1.29 % (12) bp 204 bp Non-GAAP net income $ 24,522 $ 18,178 $ 16,469 $ 10,698 $ 4,857 35% 405% Non-GAAP diluted EPS $ 0.96 $ 0.71 $ 0.65 $ 0.42 $ 0.19 35% 405% Adjusted EBITDA $ 32,971 $ 29,462 $ 27,732 $ 19,743 $ 12,321 12% 168% Adjusted ROIC 14.9 % 13.6 % 12.4 % 8.4 % 4.0 % 130 bp 1090 bp Operating cash flow (QTR) $ 61,345 $ (60,252) $ 44,449 $ 71,225 $ 73,953 202% (17)% Operating cash flow (TTM) $ 116,767 $ 129,375 $ 214,975 $ 225,630 $ 182,035 (10)% (36)% (a) See pages 10 through 12 of the Appendix for the calculation of non-GAAP measures and reconciliations to GAAP measures. *nm - percentages are not meaningful ScanSource, Inc. CFO COMMENTARY Q4 FY2021 APPENDIX: RECONCILIATIONS FOR NON-GAAP FINANCIAL INFORMATION scansource.com 9 August 24, 2021
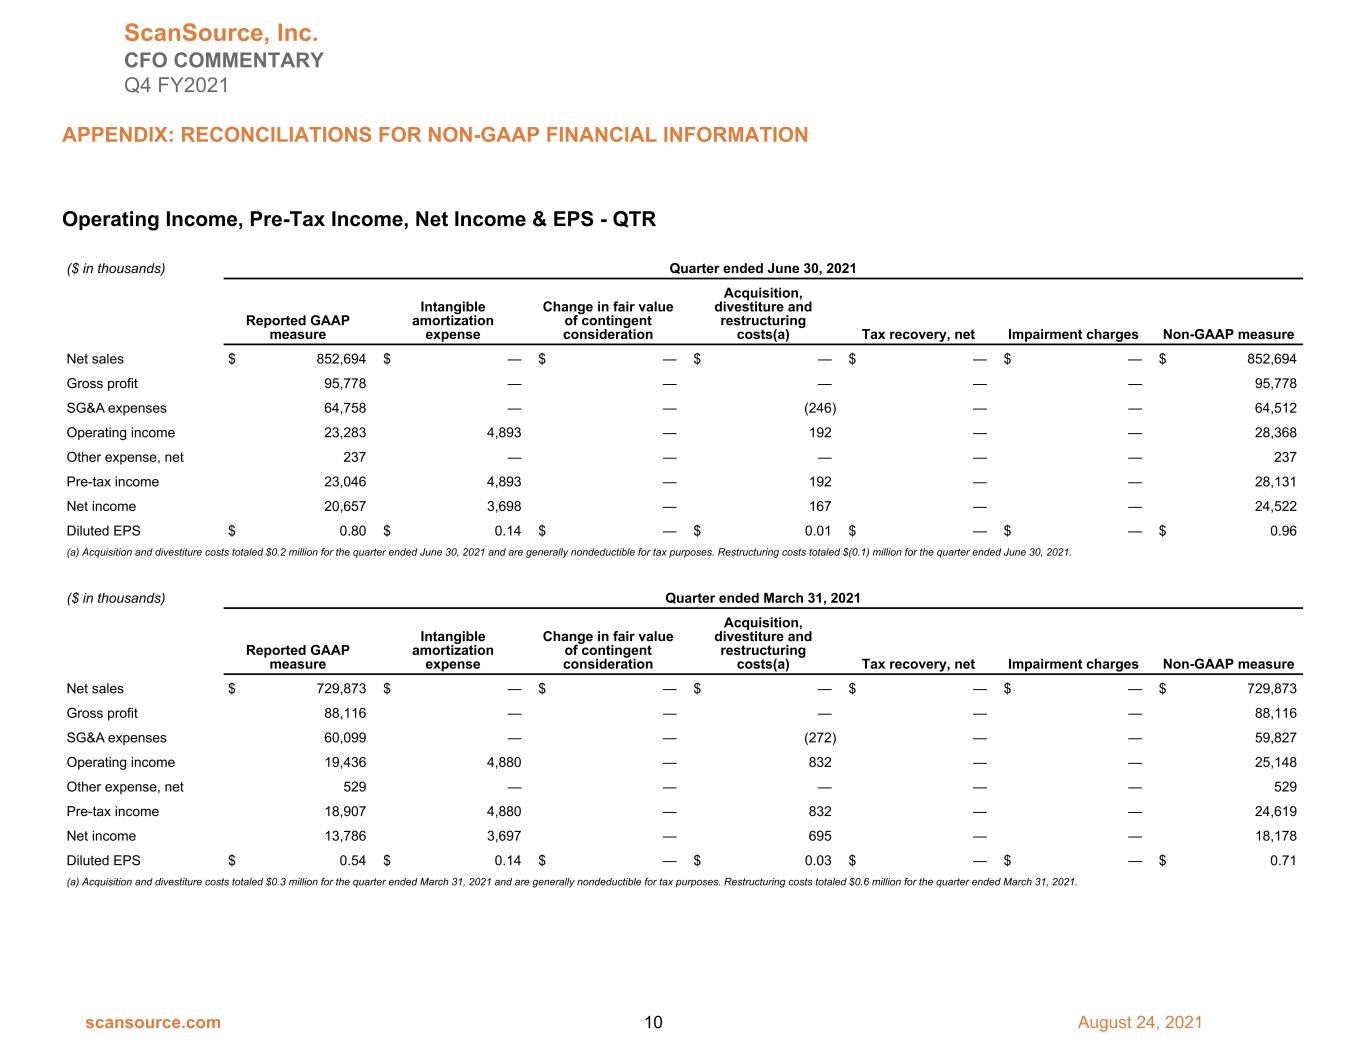

 
Operating Income, Pre-Tax Income, Net Income & EPS - QTR ($ in thousands) Quarter ended June 30, 2021 Reported GAAP measure Intangible amortization expense Change in fair value of contingent consideration Acquisition, divestiture and restructuring costs(a) Tax recovery, net Impairment charges Non-GAAP measure Net sales $ 852,694 $ — $ — $ — $ — $ — $ 852,694 Gross profit 95,778 — — — — — 95,778 SG&A expenses 64,758 — — (246) — — 64,512 Operating income 23,283 4,893 — 192 — — 28,368 Other expense, net 237 — — — — — 237 Pre-tax income 23,046 4,893 — 192 — — 28,131 Net income 20,657 3,698 — 167 — — 24,522 Diluted EPS $ 0.80 $ 0.14 $ — $ 0.01 $ — $ — $ 0.96 (a) Acquisition and divestiture costs totaled $0.2 million for the quarter ended June 30, 2021 and are generally nondeductible for tax purposes. Restructuring costs totaled $(0.1) million for the quarter ended June 30, 2021. ($ in thousands) Quarter ended March 31, 2021 Reported GAAP measure Intangible amortization expense Change in fair value of contingent consideration Acquisition, divestiture and restructuring costs(a) Tax recovery, net Impairment charges Non-GAAP measure Net sales $ 729,873 $ — $ — $ — $ — $ — $ 729,873 Gross profit 88,116 — — — — — 88,116 SG&A expenses 60,099 — — (272) — — 59,827 Operating income 19,436 4,880 — 832 — — 25,148 Other expense, net 529 — — — — — 529 Pre-tax income 18,907 4,880 — 832 — — 24,619 Net income 13,786 3,697 — 695 — — 18,178 Diluted EPS $ 0.54 $ 0.14 $ — $ 0.03 $ — $ — $ 0.71 (a) Acquisition and divestiture costs totaled $0.3 million for the quarter ended March 31, 2021 and are generally nondeductible for tax purposes. Restructuring costs totaled $0.6 million for the quarter ended March 31, 2021. ScanSource, Inc. CFO COMMENTARY Q4 FY2021 APPENDIX: RECONCILIATIONS FOR NON-GAAP FINANCIAL INFORMATION scansource.com 10 August 24, 2021
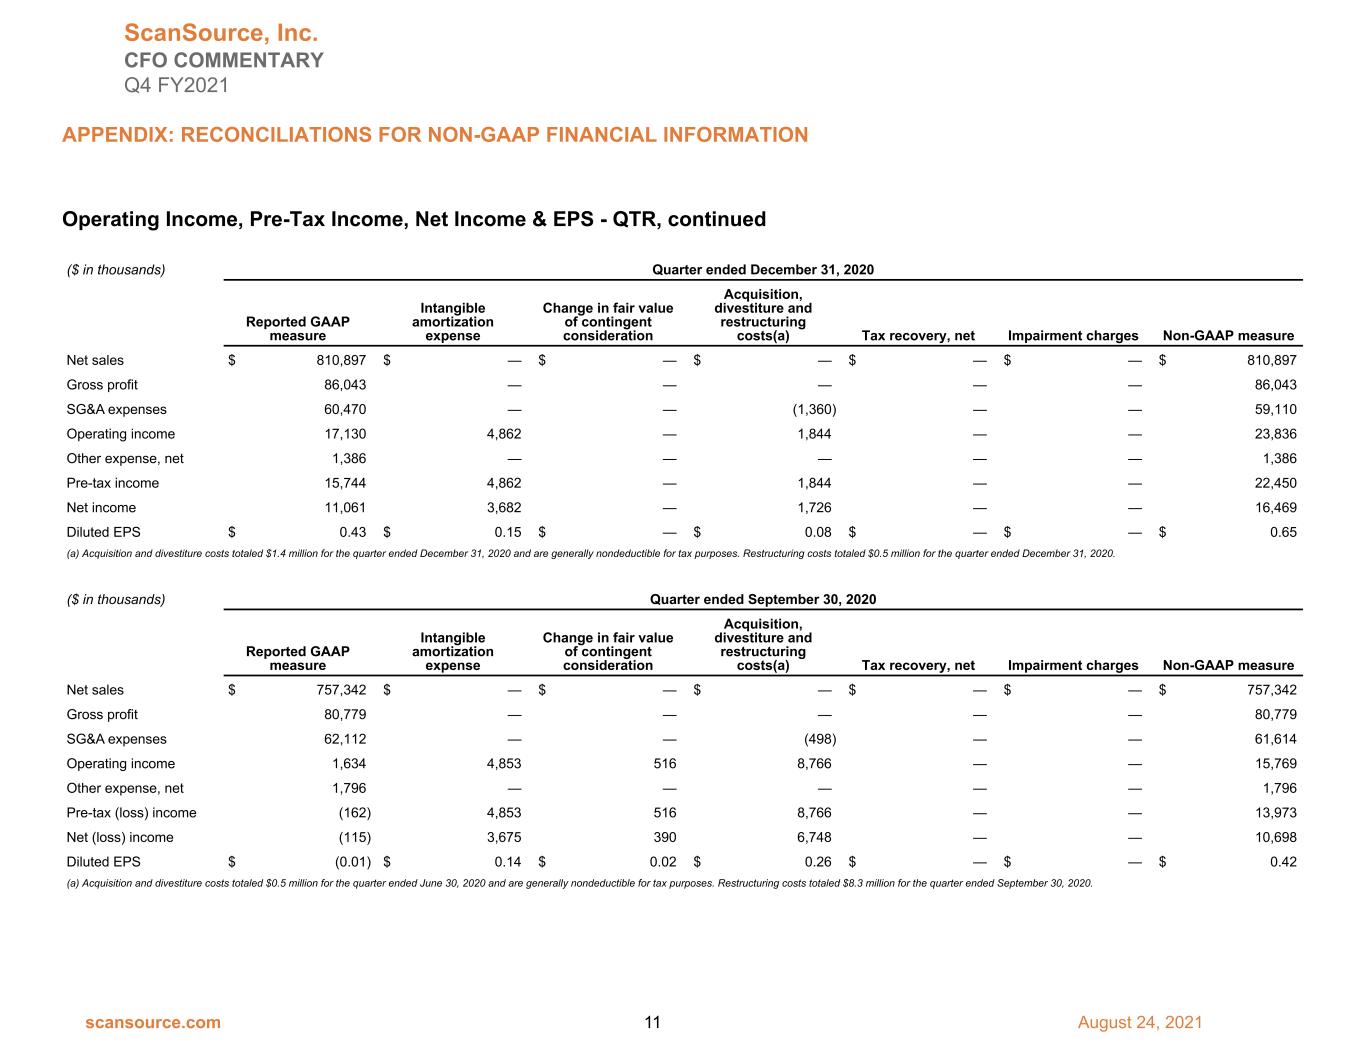

 
Operating Income, Pre-Tax Income, Net Income & EPS - QTR, continued ($ in thousands) Quarter ended December 31, 2020 Reported GAAP measure Intangible amortization expense Change in fair value of contingent consideration Acquisition, divestiture and restructuring costs(a) Tax recovery, net Impairment charges Non-GAAP measure Net sales $ 810,897 $ — $ — $ — $ — $ — $ 810,897 Gross profit 86,043 — — — — — 86,043 SG&A expenses 60,470 — — (1,360) — — 59,110 Operating income 17,130 4,862 — 1,844 — — 23,836 Other expense, net 1,386 — — — — — 1,386 Pre-tax income 15,744 4,862 — 1,844 — — 22,450 Net income 11,061 3,682 — 1,726 — — 16,469 Diluted EPS $ 0.43 $ 0.15 $ — $ 0.08 $ — $ — $ 0.65 (a) Acquisition and divestiture costs totaled $1.4 million for the quarter ended December 31, 2020 and are generally nondeductible for tax purposes. Restructuring costs totaled $0.5 million for the quarter ended December 31, 2020. ($ in thousands) Quarter ended September 30, 2020 Reported GAAP measure Intangible amortization expense Change in fair value of contingent consideration Acquisition, divestiture and restructuring costs(a) Tax recovery, net Impairment charges Non-GAAP measure Net sales $ 757,342 $ — $ — $ — $ — $ — $ 757,342 Gross profit 80,779 — — — — — 80,779 SG&A expenses 62,112 — — (498) — — 61,614 Operating income 1,634 4,853 516 8,766 — — 15,769 Other expense, net 1,796 — — — — — 1,796 Pre-tax (loss) income (162) 4,853 516 8,766 — — 13,973 Net (loss) income (115) 3,675 390 6,748 — — 10,698 Diluted EPS $ (0.01) $ 0.14 $ 0.02 $ 0.26 $ — $ — $ 0.42 (a) Acquisition and divestiture costs totaled $0.5 million for the quarter ended June 30, 2020 and are generally nondeductible for tax purposes. Restructuring costs totaled $8.3 million for the quarter ended September 30, 2020. ScanSource, Inc. CFO COMMENTARY Q4 FY2021 APPENDIX: RECONCILIATIONS FOR NON-GAAP FINANCIAL INFORMATION scansource.com 11 August 24, 2021
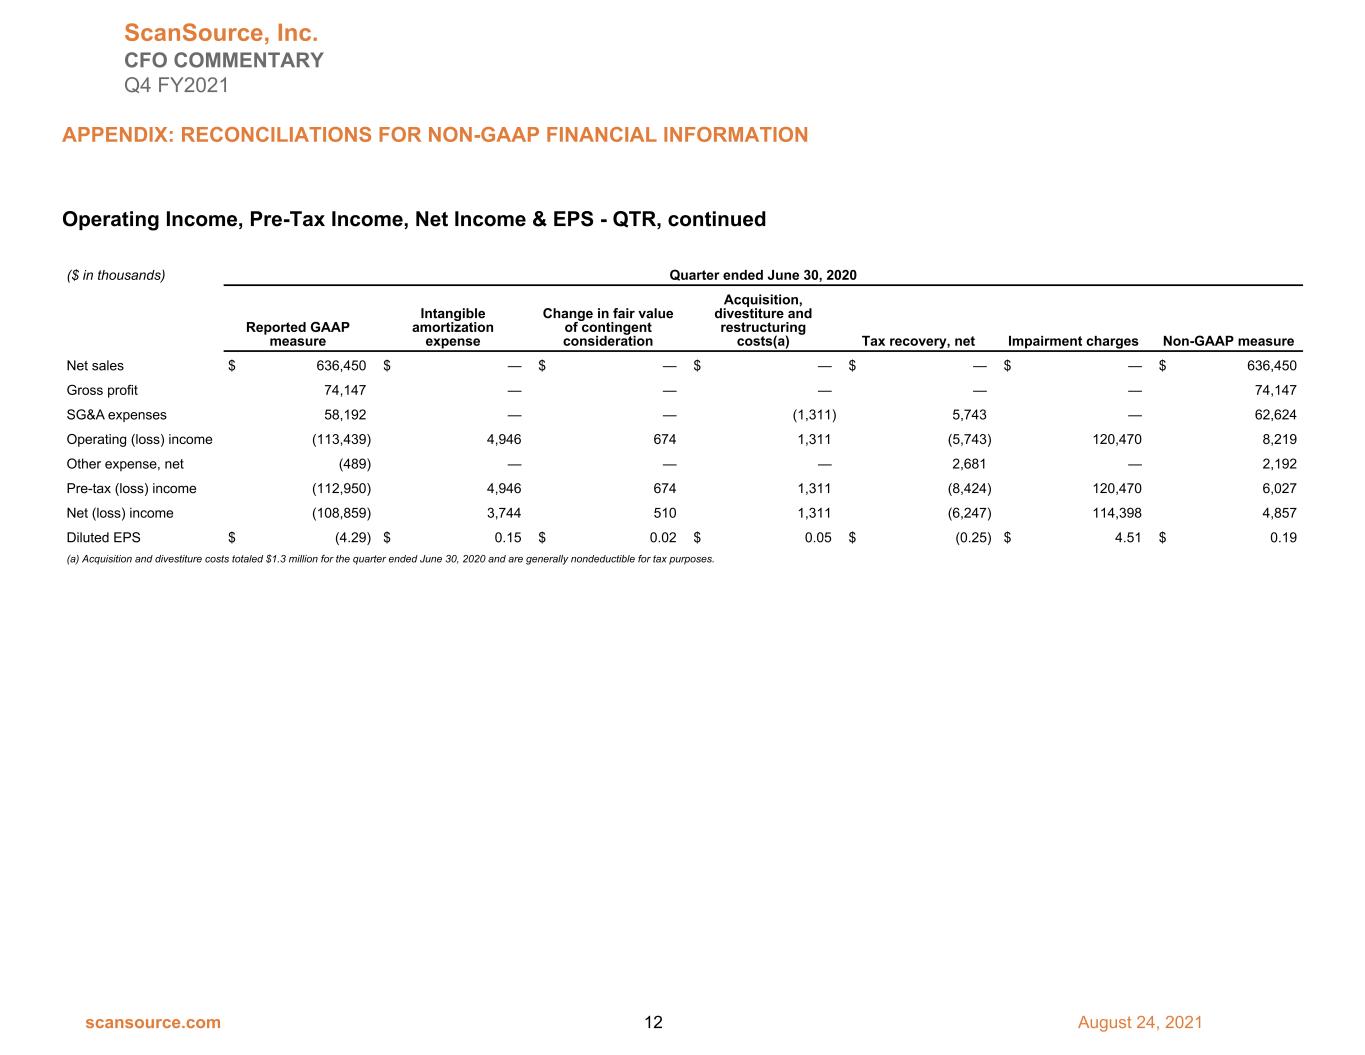

 
Operating Income, Pre-Tax Income, Net Income & EPS - QTR, continued ($ in thousands) Quarter ended June 30, 2020 Reported GAAP measure Intangible amortization expense Change in fair value of contingent consideration Acquisition, divestiture and restructuring costs(a) Tax recovery, net Impairment charges Non-GAAP measure Net sales $ 636,450 $ — $ — $ — $ — $ — $ 636,450 Gross profit 74,147 — — — — — 74,147 SG&A expenses 58,192 — — (1,311) 5,743 — 62,624 Operating (loss) income (113,439) 4,946 674 1,311 (5,743) 120,470 8,219 Other expense, net (489) — — — 2,681 — 2,192 Pre-tax (loss) income (112,950) 4,946 674 1,311 (8,424) 120,470 6,027 Net (loss) income (108,859) 3,744 510 1,311 (6,247) 114,398 4,857 Diluted EPS $ (4.29) $ 0.15 $ 0.02 $ 0.05 $ (0.25) $ 4.51 $ 0.19 (a) Acquisition and divestiture costs totaled $1.3 million for the quarter ended June 30, 2020 and are generally nondeductible for tax purposes. ScanSource, Inc. CFO COMMENTARY Q4 FY2021 APPENDIX: RECONCILIATIONS FOR NON-GAAP FINANCIAL INFORMATION scansource.com 12 August 24, 2021
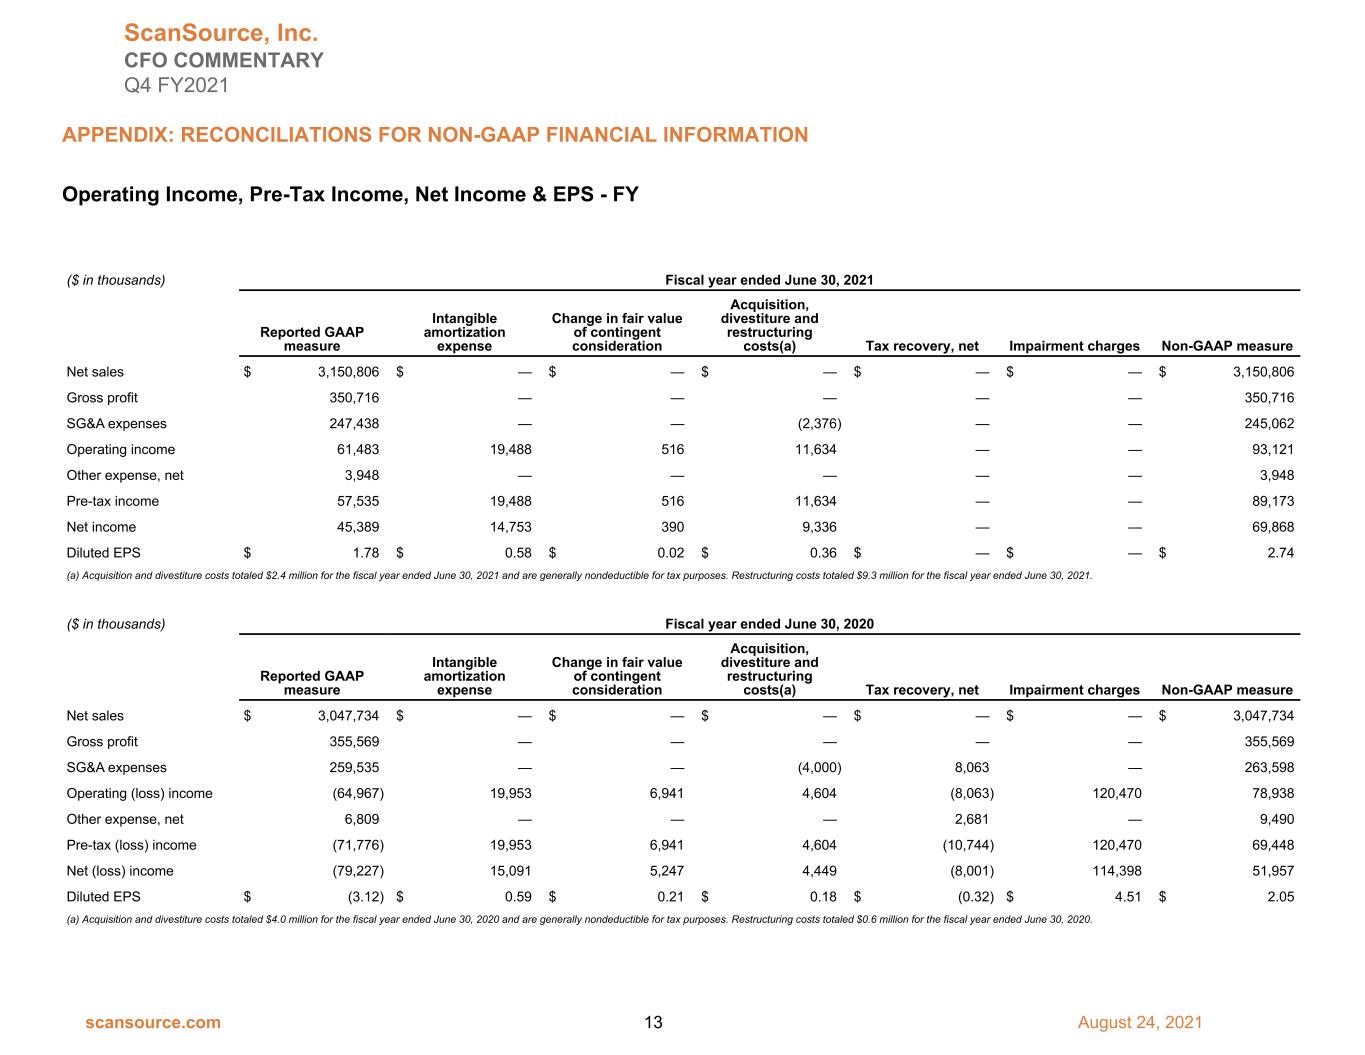

 
Operating Income, Pre-Tax Income, Net Income & EPS - FY ($ in thousands) Fiscal year ended June 30, 2021 Reported GAAP measure Intangible amortization expense Change in fair value of contingent consideration Acquisition, divestiture and restructuring costs(a) Tax recovery, net Impairment charges Non-GAAP measure Net sales $ 3,150,806 $ — $ — $ — $ — $ — $ 3,150,806 Gross profit 350,716 — — — — — 350,716 SG&A expenses 247,438 — — (2,376) — — 245,062 Operating income 61,483 19,488 516 11,634 — — 93,121 Other expense, net 3,948 — — — — — 3,948 Pre-tax income 57,535 19,488 516 11,634 — — 89,173 Net income 45,389 14,753 390 9,336 — — 69,868 Diluted EPS $ 1.78 $ 0.58 $ 0.02 $ 0.36 $ — $ — $ 2.74 (a) Acquisition and divestiture costs totaled $2.4 million for the fiscal year ended June 30, 2021 and are generally nondeductible for tax purposes. Restructuring costs totaled $9.3 million for the fiscal year ended June 30, 2021. ($ in thousands) Fiscal year ended June 30, 2020 Reported GAAP measure Intangible amortization expense Change in fair value of contingent consideration Acquisition, divestiture and restructuring costs(a) Tax recovery, net Impairment charges Non-GAAP measure Net sales $ 3,047,734 $ — $ — $ — $ — $ — $ 3,047,734 Gross profit 355,569 — — — — — 355,569 SG&A expenses 259,535 — — (4,000) 8,063 — 263,598 Operating (loss) income (64,967) 19,953 6,941 4,604 (8,063) 120,470 78,938 Other expense, net 6,809 — — — 2,681 — 9,490 Pre-tax (loss) income (71,776) 19,953 6,941 4,604 (10,744) 120,470 69,448 Net (loss) income (79,227) 15,091 5,247 4,449 (8,001) 114,398 51,957 Diluted EPS $ (3.12) $ 0.59 $ 0.21 $ 0.18 $ (0.32) $ 4.51 $ 2.05 (a) Acquisition and divestiture costs totaled $4.0 million for the fiscal year ended June 30, 2020 and are generally nondeductible for tax purposes. Restructuring costs totaled $0.6 million for the fiscal year ended June 30, 2020. ScanSource, Inc. CFO COMMENTARY Q4 FY2021 APPENDIX: RECONCILIATIONS FOR NON-GAAP FINANCIAL INFORMATION scansource.com 13 August 24, 2021
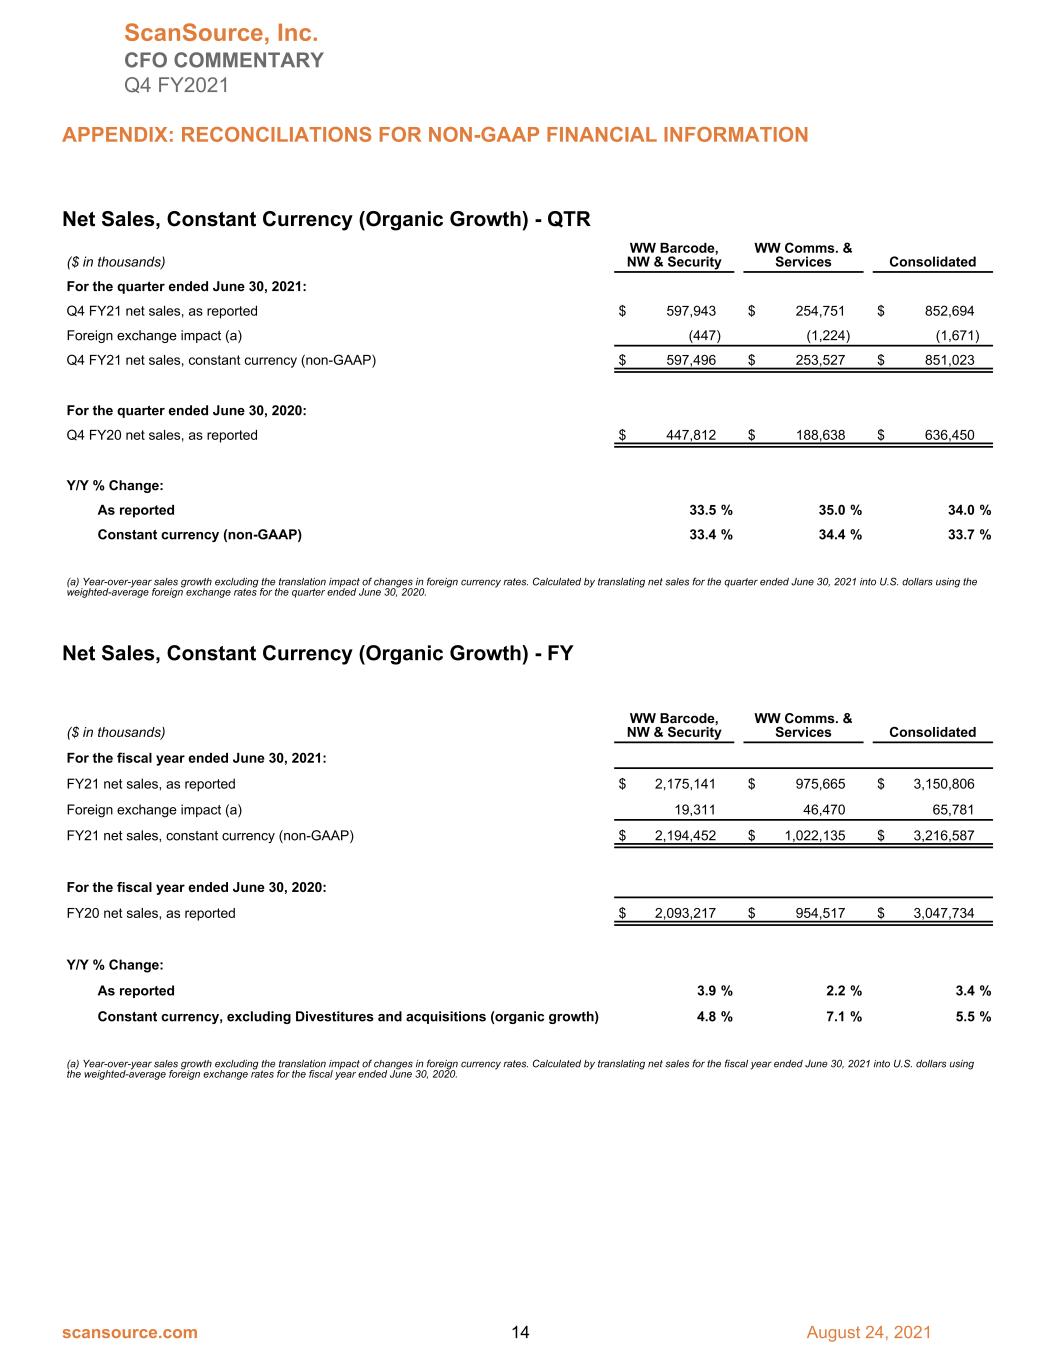

 
Net Sales, Constant Currency (Organic Growth) - QTR ($ in thousands) WW Barcode, NW & Security WW Comms. & Services Consolidated For the quarter ended June 30, 2021: Q4 FY21 net sales, as reported $ 597,943 $ 254,751 $ 852,694 Foreign exchange impact (a) (447) (1,224) (1,671) Q4 FY21 net sales, constant currency (non-GAAP) $ 597,496 $ 253,527 $ 851,023 For the quarter ended June 30, 2020: Q4 FY20 net sales, as reported $ 447,812 $ 188,638 $ 636,450 Y/Y % Change: As reported 33.5 % 35.0 % 34.0 % Constant currency (non-GAAP) 33.4 % 34.4 % 33.7 % (a) Year-over-year sales growth excluding the translation impact of changes in foreign currency rates. Calculated by translating net sales for the quarter ended June 30, 2021 into U.S. dollars using the weighted-average foreign exchange rates for the quarter ended June 30, 2020. Net Sales, Constant Currency (Organic Growth) - FY ($ in thousands) WW Barcode, NW & Security WW Comms. & Services Consolidated For the fiscal year ended June 30, 2021: FY21 net sales, as reported $ 2,175,141 $ 975,665 $ 3,150,806 Foreign exchange impact (a) 19,311 46,470 65,781 FY21 net sales, constant currency (non-GAAP) $ 2,194,452 $ 1,022,135 $ 3,216,587 For the fiscal year ended June 30, 2020: FY20 net sales, as reported $ 2,093,217 $ 954,517 $ 3,047,734 Y/Y % Change: As reported 3.9 % 2.2 % 3.4 % Constant currency, excluding Divestitures and acquisitions (organic growth) 4.8 % 7.1 % 5.5 % (a) Year-over-year sales growth excluding the translation impact of changes in foreign currency rates. Calculated by translating net sales for the fiscal year ended June 30, 2021 into U.S. dollars using the weighted-average foreign exchange rates for the fiscal year ended June 30, 2020. ScanSource, Inc. CFO COMMENTARY Q4 FY2021 APPENDIX: RECONCILIATIONS FOR NON-GAAP FINANCIAL INFORMATION scansource.com 14 August 24, 2021
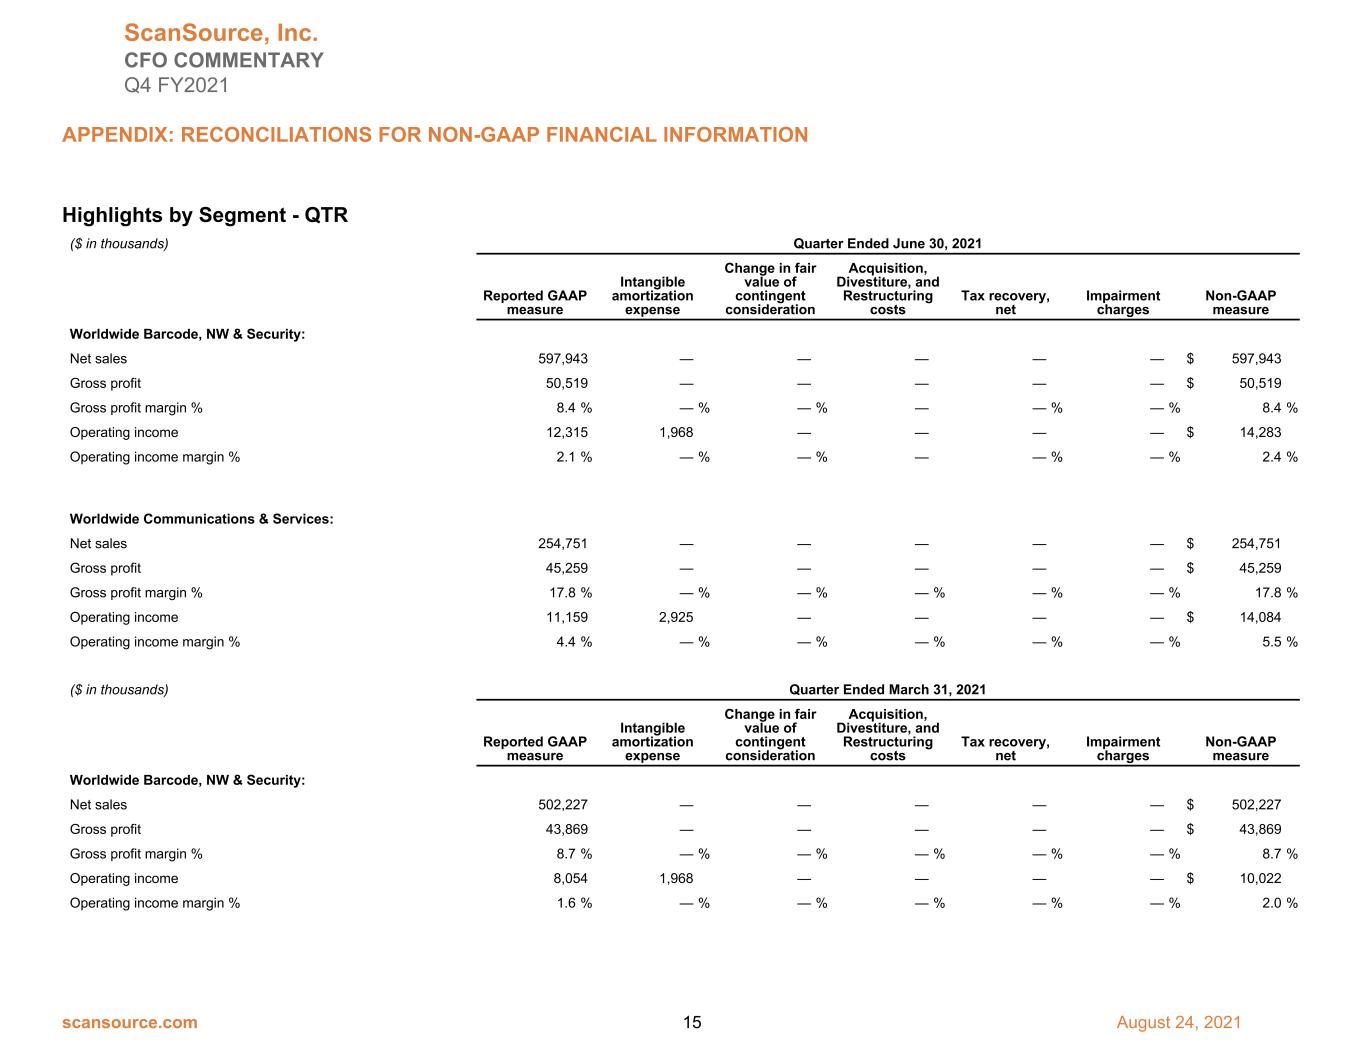

 
Highlights by Segment - QTR ($ in thousands) Quarter Ended June 30, 2021 Reported GAAP measure Intangible amortization expense Change in fair value of contingent consideration Acquisition, Divestiture, and Restructuring costs Tax recovery, net Impairment charges Non-GAAP measure Worldwide Barcode, NW & Security: Net sales 597,943 — — — — — $ 597,943 Gross profit 50,519 — — — — — $ 50,519 Gross profit margin % 8.4 % — % — % — — % — % 8.4 % Operating income 12,315 1,968 — — — — $ 14,283 Operating income margin % 2.1 % — % — % — — % — % 2.4 % Worldwide Communications & Services: Net sales 254,751 — — — — — $ 254,751 Gross profit 45,259 — — — — — $ 45,259 Gross profit margin % 17.8 % — % — % — % — % — % 17.8 % Operating income 11,159 2,925 — — — — $ 14,084 Operating income margin % 4.4 % — % — % — % — % — % 5.5 % ($ in thousands) Quarter Ended March 31, 2021 Reported GAAP measure Intangible amortization expense Change in fair value of contingent consideration Acquisition, Divestiture, and Restructuring costs Tax recovery, net Impairment charges Non-GAAP measure Worldwide Barcode, NW & Security: Net sales 502,227 — — — — — $ 502,227 Gross profit 43,869 — — — — — $ 43,869 Gross profit margin % 8.7 % — % — % — % — % — % 8.7 % Operating income 8,054 1,968 — — — — $ 10,022 Operating income margin % 1.6 % — % — % — % — % — % 2.0 % ScanSource, Inc. CFO COMMENTARY Q4 FY2021 APPENDIX: RECONCILIATIONS FOR NON-GAAP FINANCIAL INFORMATION scansource.com 15 August 24, 2021
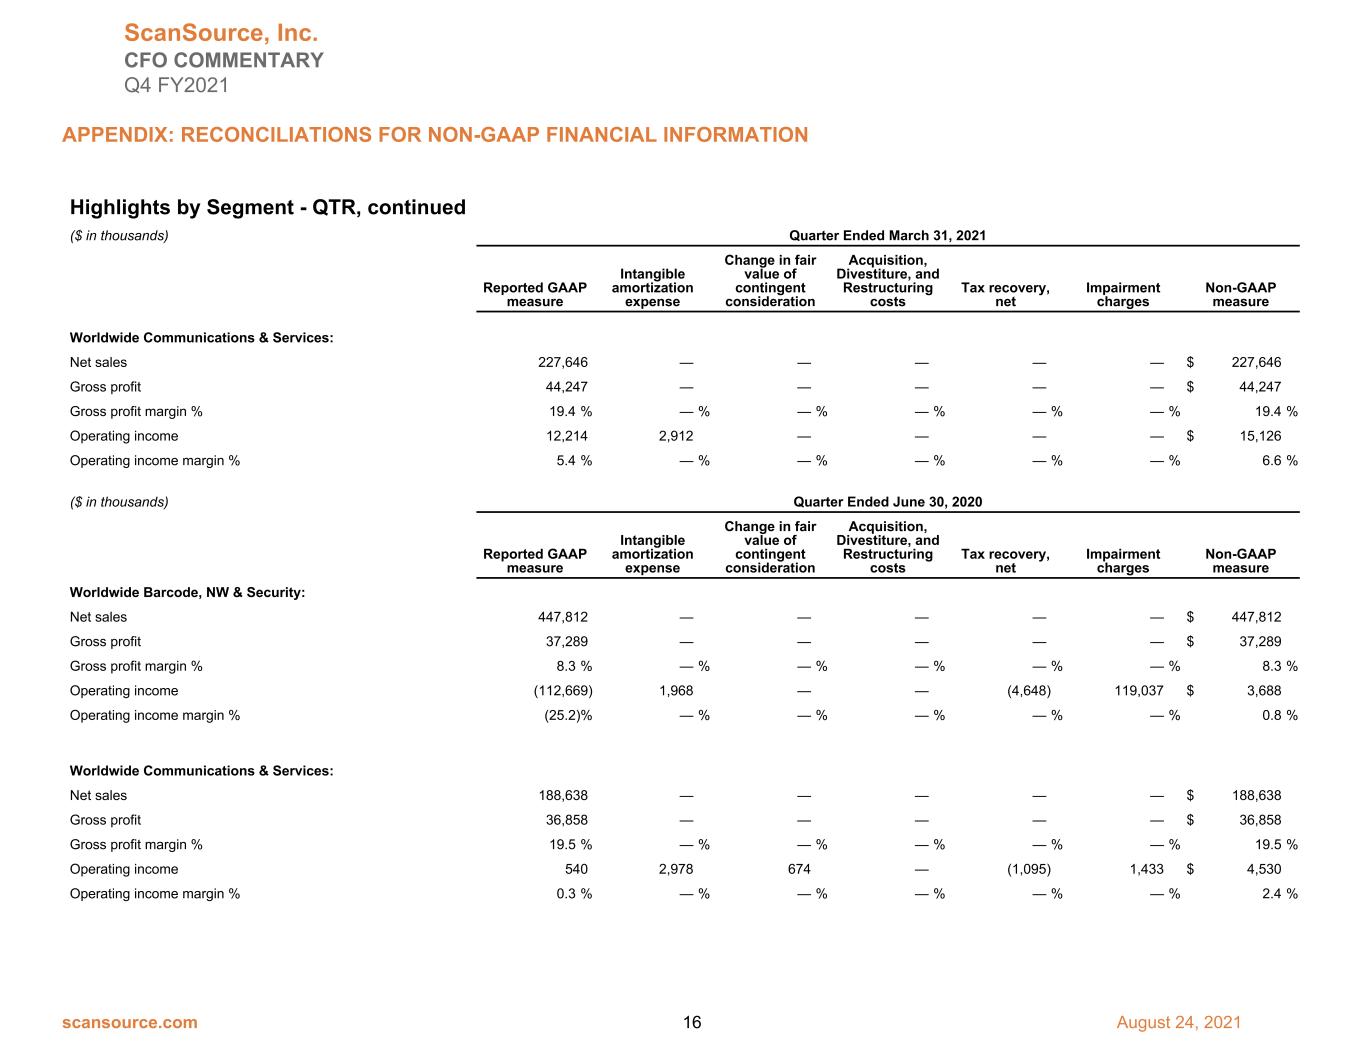

 
Highlights by Segment - QTR, continued ($ in thousands) Quarter Ended March 31, 2021 Reported GAAP measure Intangible amortization expense Change in fair value of contingent consideration Acquisition, Divestiture, and Restructuring costs Tax recovery, net Impairment charges Non-GAAP measure Worldwide Communications & Services: Net sales 227,646 — — — — — $ 227,646 Gross profit 44,247 — — — — — $ 44,247 Gross profit margin % 19.4 % — % — % — % — % — % 19.4 % Operating income 12,214 2,912 — — — — $ 15,126 Operating income margin % 5.4 % — % — % — % — % — % 6.6 % ($ in thousands) Quarter Ended June 30, 2020 Reported GAAP measure Intangible amortization expense Change in fair value of contingent consideration Acquisition, Divestiture, and Restructuring costs Tax recovery, net Impairment charges Non-GAAP measure Worldwide Barcode, NW & Security: Net sales 447,812 — — — — — $ 447,812 Gross profit 37,289 — — — — — $ 37,289 Gross profit margin % 8.3 % — % — % — % — % — % 8.3 % Operating income (112,669) 1,968 — — (4,648) 119,037 $ 3,688 Operating income margin % (25.2) % — % — % — % — % — % 0.8 % Worldwide Communications & Services: Net sales 188,638 — — — — — $ 188,638 Gross profit 36,858 — — — — — $ 36,858 Gross profit margin % 19.5 % — % — % — % — % — % 19.5 % Operating income 540 2,978 674 — (1,095) 1,433 $ 4,530 Operating income margin % 0.3 % — % — % — % — % — % 2.4 % ScanSource, Inc. CFO COMMENTARY Q4 FY2021 APPENDIX: RECONCILIATIONS FOR NON-GAAP FINANCIAL INFORMATION scansource.com 16 August 24, 2021
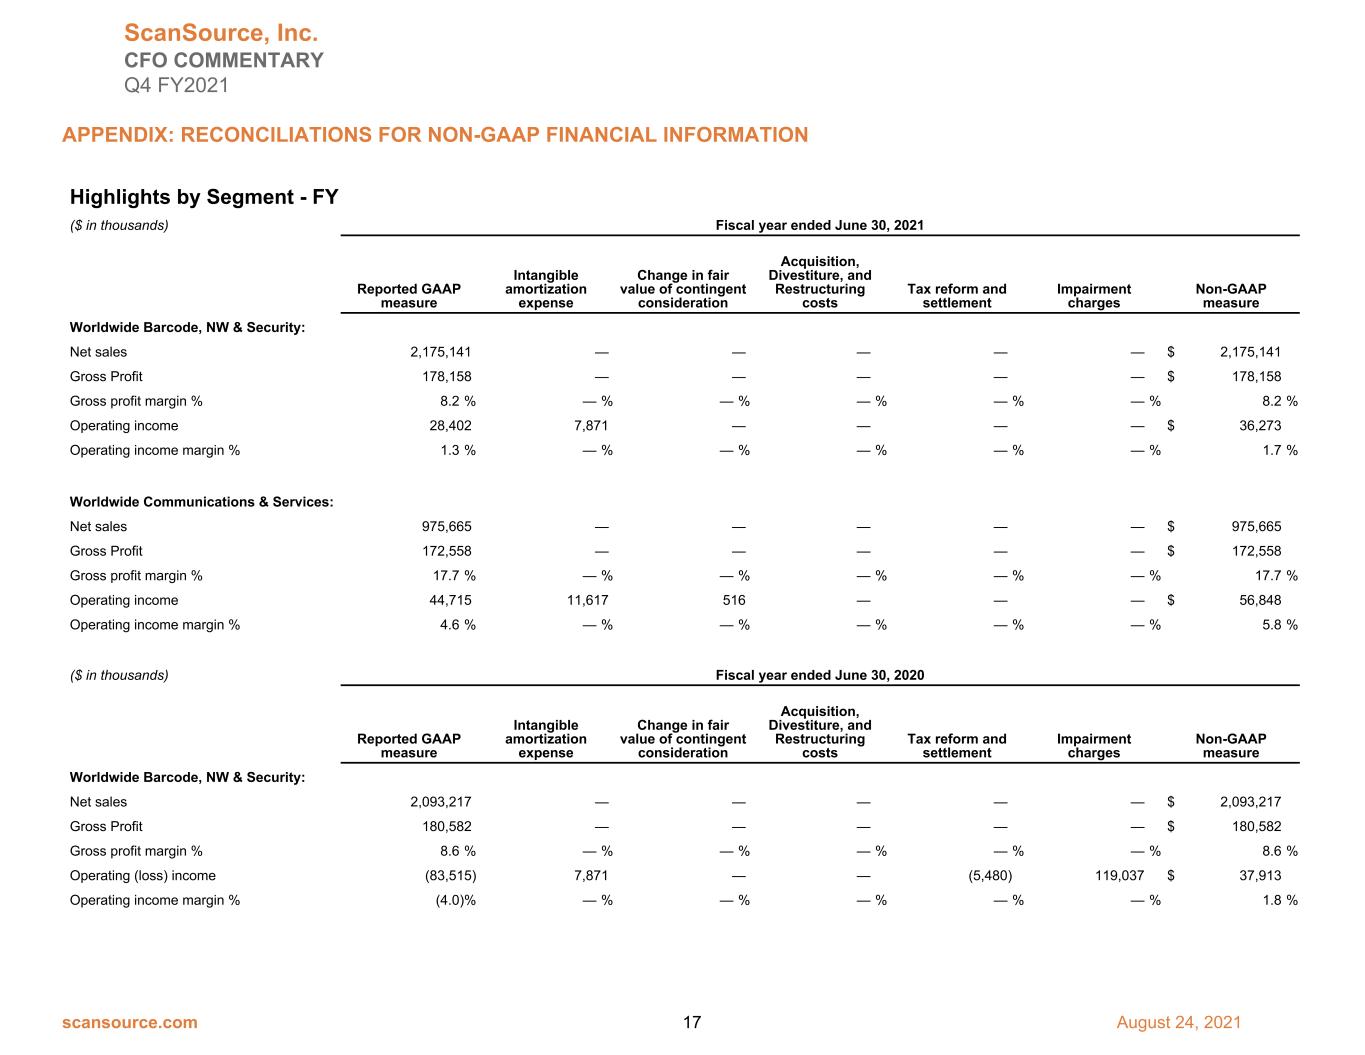

 
Highlights by Segment - FY ($ in thousands) Fiscal year ended June 30, 2021 Reported GAAP measure Intangible amortization expense Change in fair value of contingent consideration Acquisition, Divestiture, and Restructuring costs Tax reform and settlement Impairment charges Non-GAAP measure Worldwide Barcode, NW & Security: Net sales 2,175,141 — — — — — $ 2,175,141 Gross Profit 178,158 — — — — — $ 178,158 Gross profit margin % 8.2 % — % — % — % — % — % 8.2 % Operating income 28,402 7,871 — — — — $ 36,273 Operating income margin % 1.3 % — % — % — % — % — % 1.7 % Worldwide Communications & Services: Net sales 975,665 — — — — — $ 975,665 Gross Profit 172,558 — — — — — $ 172,558 Gross profit margin % 17.7 % — % — % — % — % — % 17.7 % Operating income 44,715 11,617 516 — — — $ 56,848 Operating income margin % 4.6 % — % — % — % — % — % 5.8 % ($ in thousands) Fiscal year ended June 30, 2020 Reported GAAP measure Intangible amortization expense Change in fair value of contingent consideration Acquisition, Divestiture, and Restructuring costs Tax reform and settlement Impairment charges Non-GAAP measure Worldwide Barcode, NW & Security: Net sales 2,093,217 — — — — — $ 2,093,217 Gross Profit 180,582 — — — — — $ 180,582 Gross profit margin % 8.6 % — % — % — % — % — % 8.6 % Operating (loss) income (83,515) 7,871 — — (5,480) 119,037 $ 37,913 Operating income margin % (4.0) % — % — % — % — % — % 1.8 % ScanSource, Inc. CFO COMMENTARY Q4 FY2021 APPENDIX: RECONCILIATIONS FOR NON-GAAP FINANCIAL INFORMATION scansource.com 17 August 24, 2021
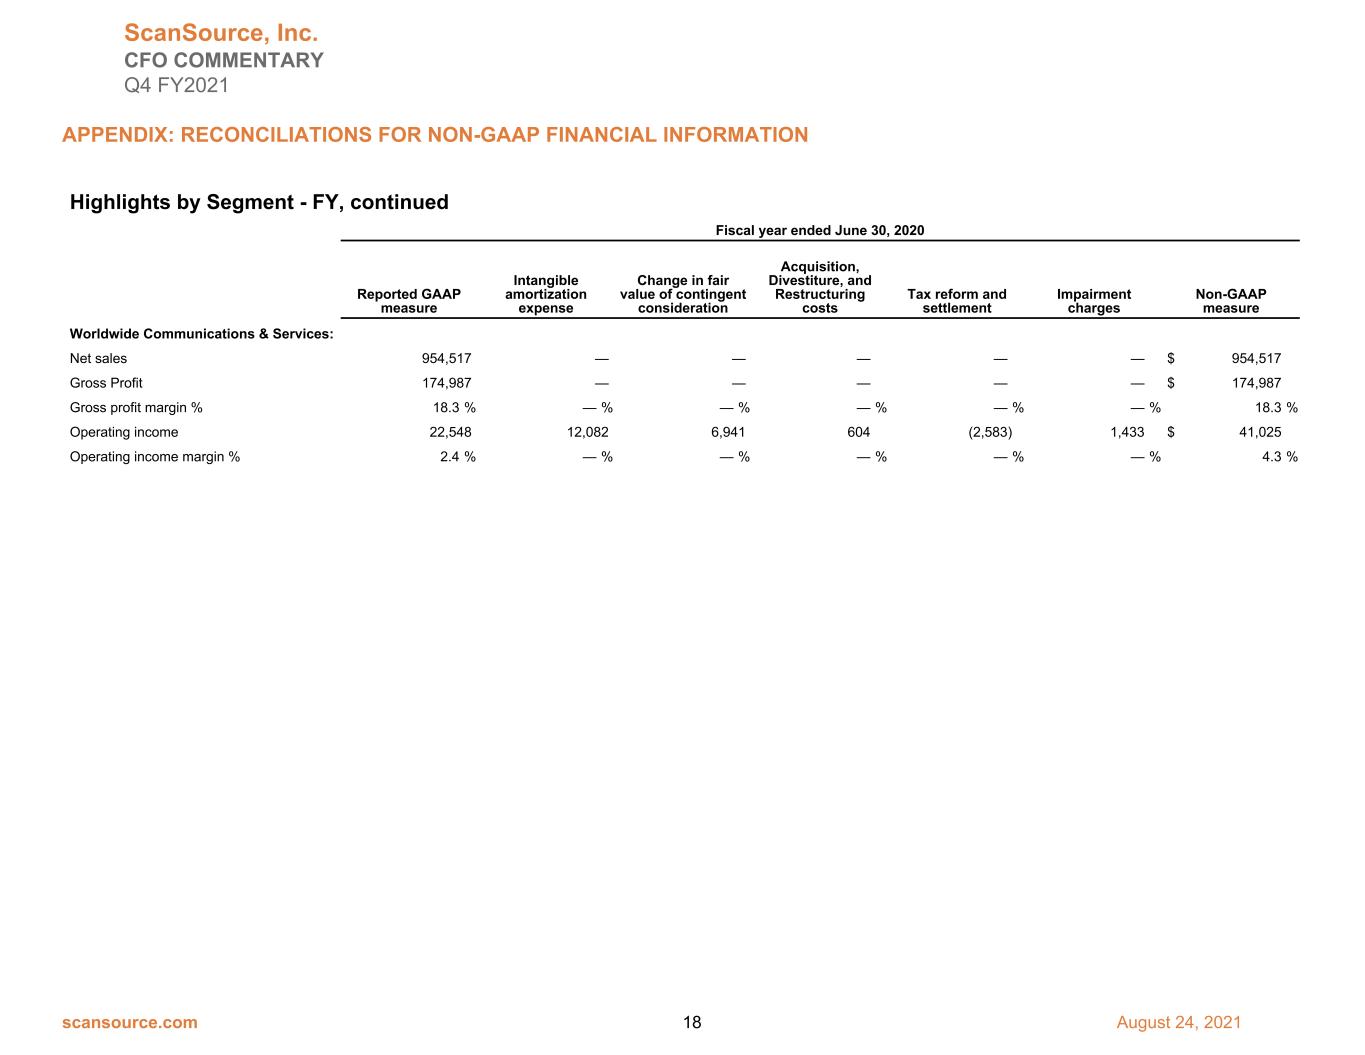

 
Highlights by Segment - FY, continued Fiscal year ended June 30, 2020 Reported GAAP measure Intangible amortization expense Change in fair value of contingent consideration Acquisition, Divestiture, and Restructuring costs Tax reform and settlement Impairment charges Non-GAAP measure Worldwide Communications & Services: Net sales 954,517 — — — — — $ 954,517 Gross Profit 174,987 — — — — — $ 174,987 Gross profit margin % 18.3 % — % — % — % — % — % 18.3 % Operating income 22,548 12,082 6,941 604 (2,583) 1,433 $ 41,025 Operating income margin % 2.4 % — % — % — % — % — % 4.3 % ScanSource, Inc. CFO COMMENTARY Q4 FY2021 APPENDIX: RECONCILIATIONS FOR NON-GAAP FINANCIAL INFORMATION scansource.com 18 August 24, 2021
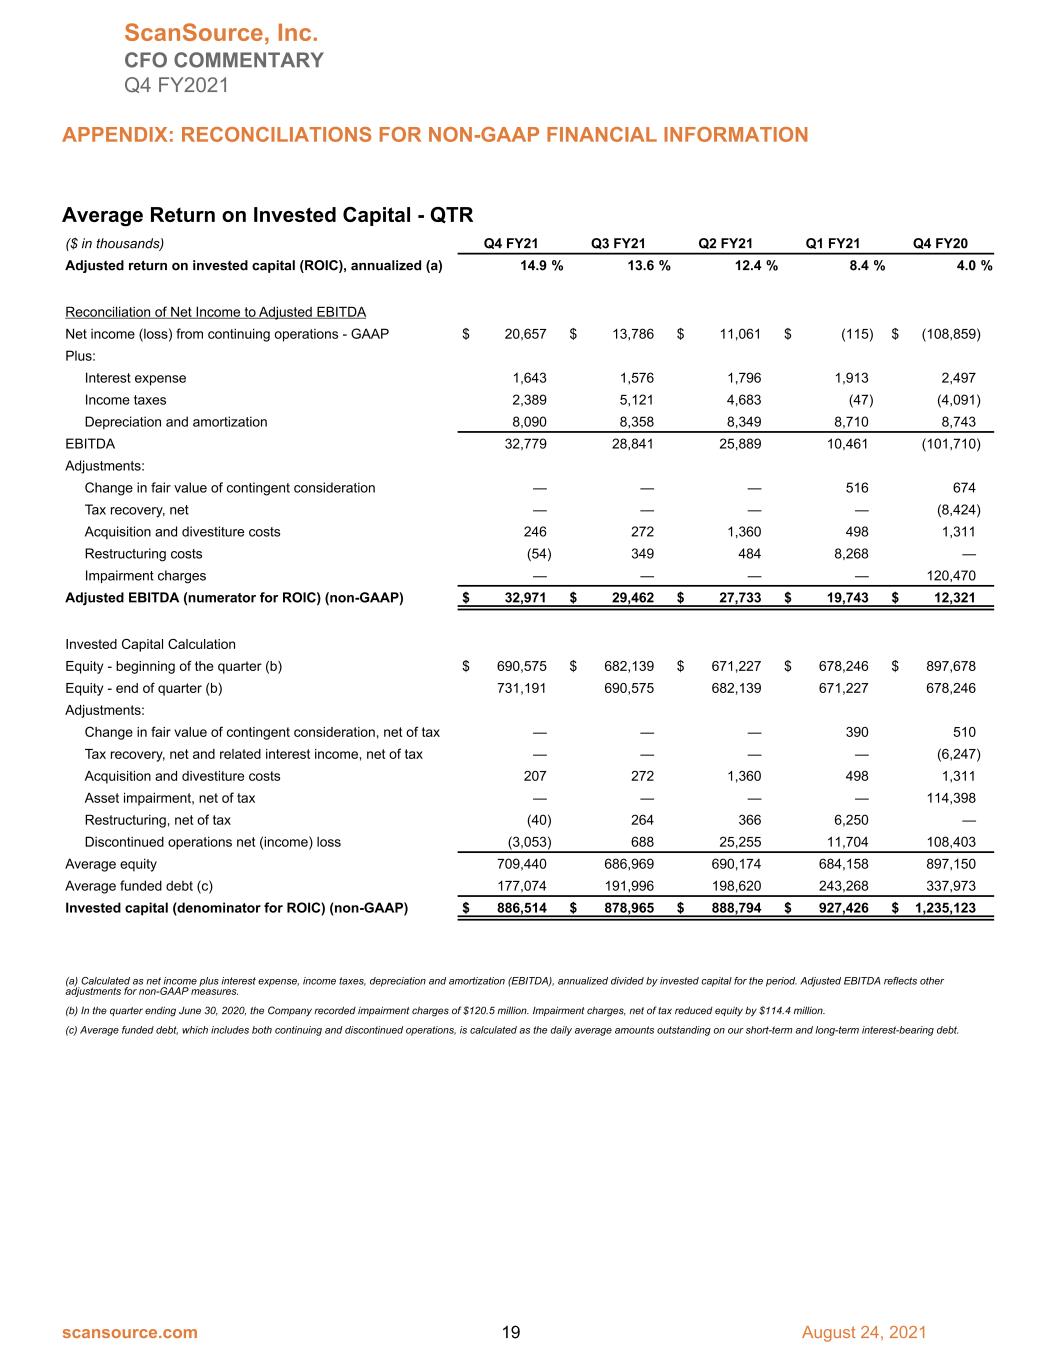

 
Average Return on Invested Capital - QTR ($ in thousands) Q4 FY21 Q3 FY21 Q2 FY21 Q1 FY21 Q4 FY20 Adjusted return on invested capital (ROIC), annualized (a) 14.9 % 13.6 % 12.4 % 8.4 % 4.0 % Reconciliation of Net Income to Adjusted EBITDA Net income (loss) from continuing operations - GAAP $ 20,657 $ 13,786 $ 11,061 $ (115) $ (108,859) Plus: Interest expense 1,643 1,576 1,796 1,913 2,497 Income taxes 2,389 5,121 4,683 (47) (4,091) Depreciation and amortization 8,090 8,358 8,349 8,710 8,743 EBITDA 32,779 28,841 25,889 10,461 (101,710) Adjustments: Change in fair value of contingent consideration — — — 516 674 Tax recovery, net — — — — (8,424) Acquisition and divestiture costs 246 272 1,360 498 1,311 Restructuring costs (54) 349 484 8,268 — Impairment charges — — — — 120,470 Adjusted EBITDA (numerator for ROIC) (non-GAAP) $ 32,971 $ 29,462 $ 27,733 $ 19,743 $ 12,321 Invested Capital Calculation Equity - beginning of the quarter (b) $ 690,575 $ 682,139 $ 671,227 $ 678,246 $ 897,678 Equity - end of quarter (b) 731,191 690,575 682,139 671,227 678,246 Adjustments: Change in fair value of contingent consideration, net of tax — — — 390 510 Tax recovery, net and related interest income, net of tax — — — — (6,247) Acquisition and divestiture costs 207 272 1,360 498 1,311 Asset impairment, net of tax — — — — 114,398 Restructuring, net of tax (40) 264 366 6,250 — Discontinued operations net (income) loss (3,053) 688 25,255 11,704 108,403 Average equity 709,440 686,969 690,174 684,158 897,150 Average funded debt (c) 177,074 191,996 198,620 243,268 337,973 Invested capital (denominator for ROIC) (non-GAAP) $ 886,514 $ 878,965 $ 888,794 $ 927,426 $ 1,235,123 (a) Calculated as net income plus interest expense, income taxes, depreciation and amortization (EBITDA), annualized divided by invested capital for the period. Adjusted EBITDA reflects other adjustments for non-GAAP measures. (b) In the quarter ending June 30, 2020, the Company recorded impairment charges of $120.5 million. Impairment charges, net of tax reduced equity by $114.4 million. (c) Average funded debt, which includes both continuing and discontinued operations, is calculated as the daily average amounts outstanding on our short-term and long-term interest-bearing debt. ScanSource, Inc. CFO COMMENTARY Q4 FY2021 APPENDIX: RECONCILIATIONS FOR NON-GAAP FINANCIAL INFORMATION scansource.com 19 August 24, 2021
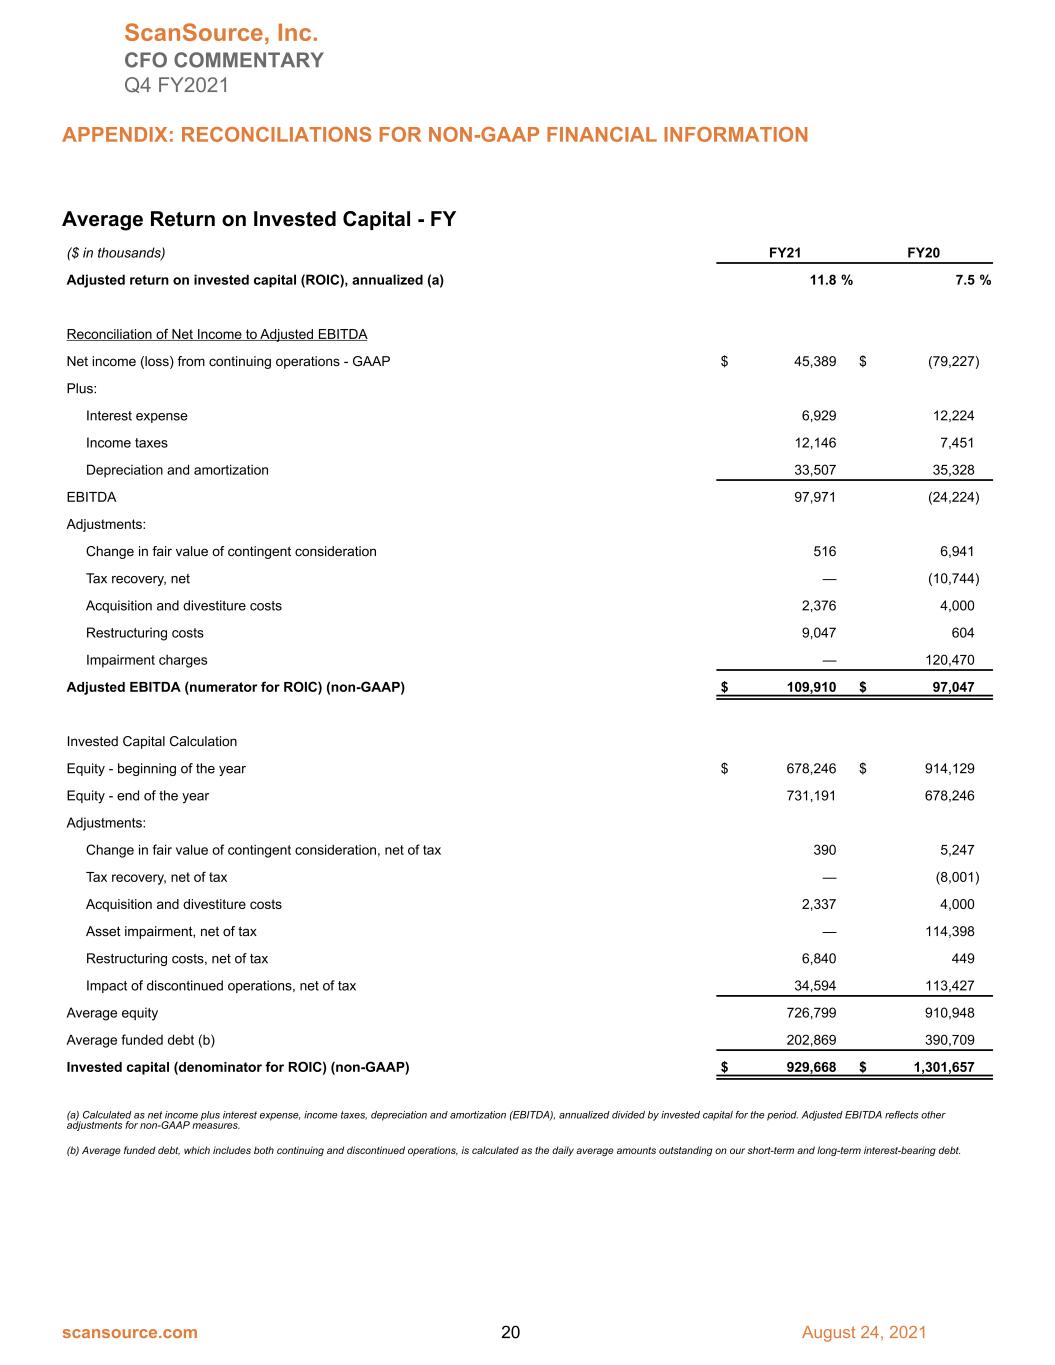

 
Average Return on Invested Capital - FY ($ in thousands) FY21 FY20 Adjusted return on invested capital (ROIC), annualized (a) 11.8 % 7.5 % Reconciliation of Net Income to Adjusted EBITDA Net income (loss) from continuing operations - GAAP $ 45,389 $ (79,227) Plus: Interest expense 6,929 12,224 Income taxes 12,146 7,451 Depreciation and amortization 33,507 35,328 EBITDA 97,971 (24,224) Adjustments: Change in fair value of contingent consideration 516 6,941 Tax recovery, net — (10,744) Acquisition and divestiture costs 2,376 4,000 Restructuring costs 9,047 604 Impairment charges — 120,470 Adjusted EBITDA (numerator for ROIC) (non-GAAP) $ 109,910 $ 97,047 Invested Capital Calculation Equity - beginning of the year $ 678,246 $ 914,129 Equity - end of the year 731,191 678,246 Adjustments: Change in fair value of contingent consideration, net of tax 390 5,247 Tax recovery, net of tax — (8,001) Acquisition and divestiture costs 2,337 4,000 Asset impairment, net of tax — 114,398 Restructuring costs, net of tax 6,840 449 Impact of discontinued operations, net of tax 34,594 113,427 Average equity 726,799 910,948 Average funded debt (b) 202,869 390,709 Invested capital (denominator for ROIC) (non-GAAP) $ 929,668 $ 1,301,657 (a) Calculated as net income plus interest expense, income taxes, depreciation and amortization (EBITDA), annualized divided by invested capital for the period. Adjusted EBITDA reflects other adjustments for non-GAAP measures. (b) Average funded debt, which includes both continuing and discontinued operations, is calculated as the daily average amounts outstanding on our short-term and long-term interest-bearing debt. ScanSource, Inc. CFO COMMENTARY Q4 FY2021 APPENDIX: RECONCILIATIONS FOR NON-GAAP FINANCIAL INFORMATION scansource.com 20 August 24, 2021
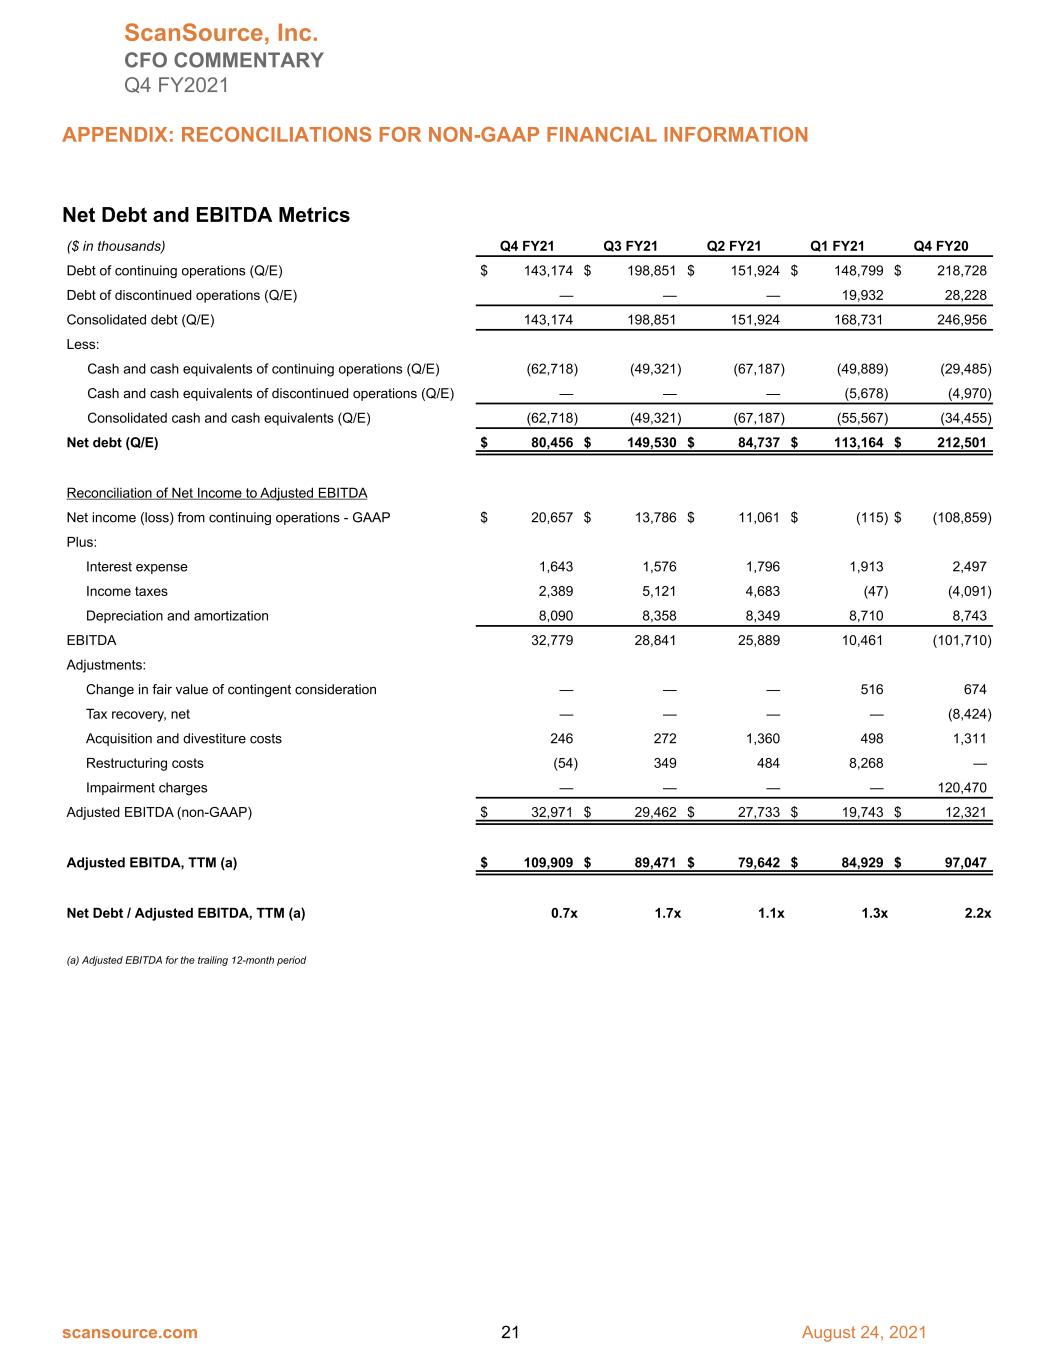

 
Net Debt and EBITDA Metrics ($ in thousands) Q4 FY21 Q3 FY21 Q2 FY21 Q1 FY21 Q4 FY20 Debt of continuing operations (Q/E) $ 143,174 $ 198,851 $ 151,924 $ 148,799 $ 218,728 Debt of discontinued operations (Q/E) — — — 19,932 28,228 Consolidated debt (Q/E) 143,174 198,851 151,924 168,731 246,956 Less: Cash and cash equivalents of continuing operations (Q/E) (62,718) (49,321) (67,187) (49,889) (29,485) Cash and cash equivalents of discontinued operations (Q/E) — — — (5,678) (4,970) Consolidated cash and cash equivalents (Q/E) (62,718) (49,321) (67,187) (55,567) (34,455) Net debt (Q/E) $ 80,456 $ 149,530 $ 84,737 $ 113,164 $ 212,501 Reconciliation of Net Income to Adjusted EBITDA Net income (loss) from continuing operations - GAAP $ 20,657 $ 13,786 $ 11,061 $ (115) $ (108,859) Plus: Interest expense 1,643 1,576 1,796 1,913 2,497 Income taxes 2,389 5,121 4,683 (47) (4,091) Depreciation and amortization 8,090 8,358 8,349 8,710 8,743 EBITDA 32,779 28,841 25,889 10,461 (101,710) Adjustments: Change in fair value of contingent consideration — — — 516 674 Tax recovery, net — — — — (8,424) Acquisition and divestiture costs 246 272 1,360 498 1,311 Restructuring costs (54) 349 484 8,268 — Impairment charges — — — — 120,470 Adjusted EBITDA (non-GAAP) $ 32,971 $ 29,462 $ 27,733 $ 19,743 $ 12,321 Adjusted EBITDA, TTM (a) $ 109,909 $ 89,471 $ 79,642 $ 84,929 $ 97,047 Net Debt / Adjusted EBITDA, TTM (a) 0.7x 1.7x 1.1x 1.3x 2.2x (a) Adjusted EBITDA for the trailing 12-month period ScanSource, Inc. CFO COMMENTARY Q4 FY2021 APPENDIX: RECONCILIATIONS FOR NON-GAAP FINANCIAL INFORMATION scansource.com 21 August 24, 2021
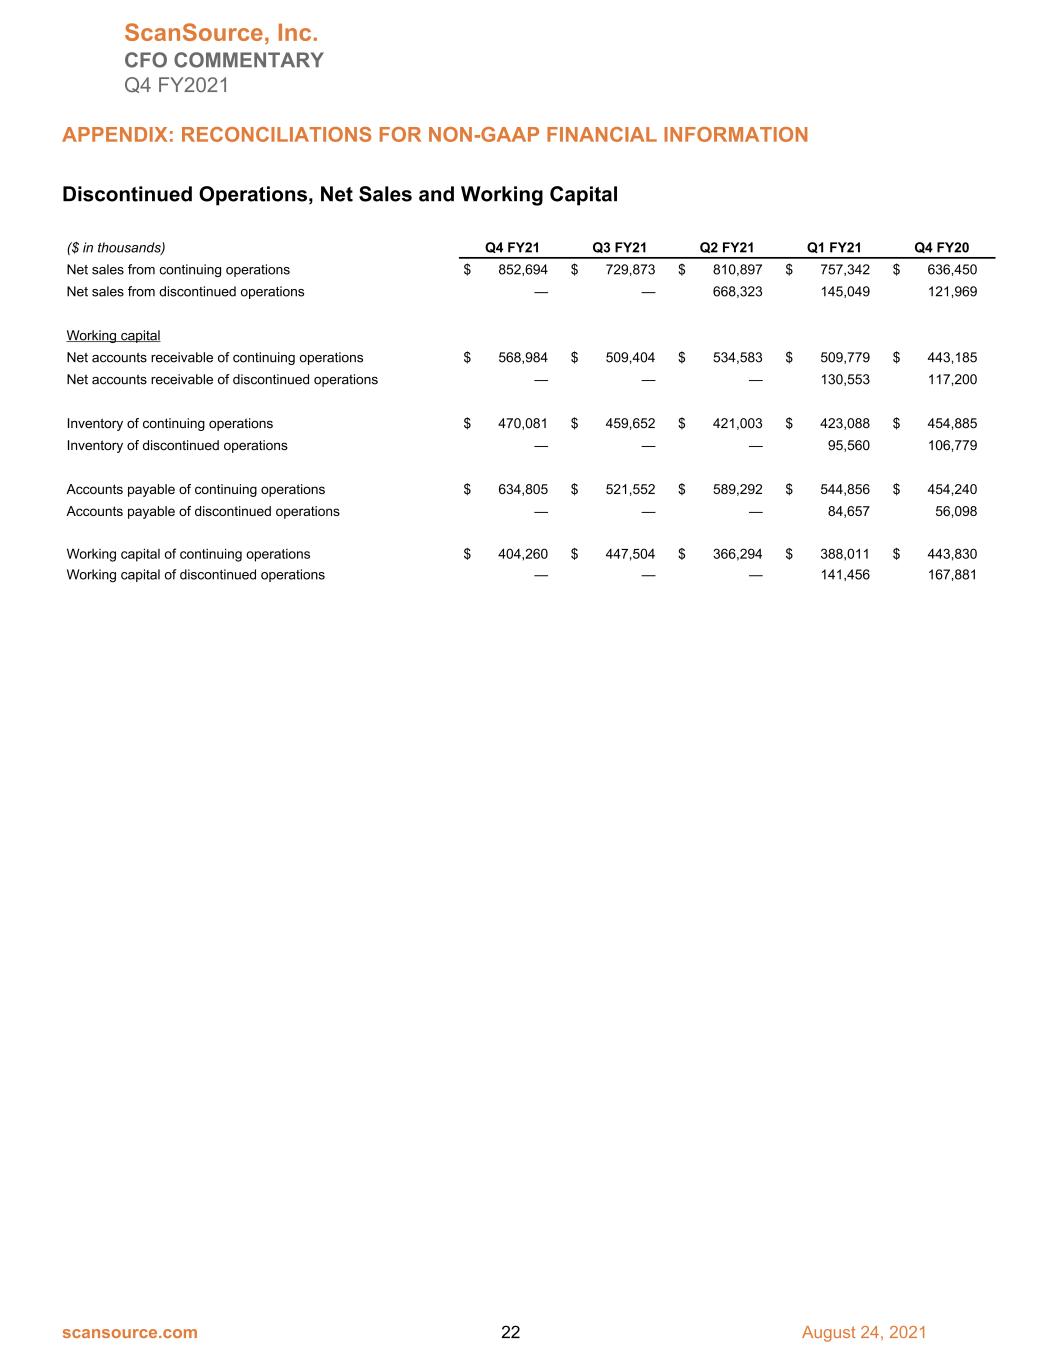

 
Discontinued Operations, Net Sales and Working Capital ($ in thousands) Q4 FY21 Q3 FY21 Q2 FY21 Q1 FY21 Q4 FY20 Net sales from continuing operations $ 852,694 $ 729,873 $ 810,897 $ 757,342 $ 636,450 Net sales from discontinued operations — — 668,323 145,049 121,969 Working capital Net accounts receivable of continuing operations $ 568,984 $ 509,404 $ 534,583 $ 509,779 $ 443,185 Net accounts receivable of discontinued operations — — — 130,553 117,200 Inventory of continuing operations $ 470,081 $ 459,652 $ 421,003 $ 423,088 $ 454,885 Inventory of discontinued operations — — — 95,560 106,779 Accounts payable of continuing operations $ 634,805 $ 521,552 $ 589,292 $ 544,856 $ 454,240 Accounts payable of discontinued operations — — — 84,657 56,098 Working capital of continuing operations $ 404,260 $ 447,504 $ 366,294 $ 388,011 $ 443,830 Working capital of discontinued operations — — — 141,456 167,881 ScanSource, Inc. CFO COMMENTARY Q4 FY2021 APPENDIX: RECONCILIATIONS FOR NON-GAAP FINANCIAL INFORMATION scansource.com 22 August 24, 2021


Exhibit 99.3
For Immediate Release
Contact: Melissa Andrews
864.286.4425
[email protected]
August 24, 2021

ScanSource Announces Retirement of Jack Reilly and Appointment of
Charlie Mathis to the Board of Directors

Greenville, S.C. – ScanSource, Inc. (NASDAQ: SCSC), a leading global provider of technology products and solutions, today announced the upcoming retirement of long-time director John P. (“Jack”) Reilly from its Board of Directors. Mr. Reilly, who has served as a director of ScanSource since 2001, is retiring from the Board when his current term of office expires effective at ScanSource’s Annual Meeting of Shareholders to be held on January 27, 2022. The Company also announced the appointment of Charles A. (“Charlie”) Mathis to its Board of Directors, effective August 19, 2021. Mr. Mathis’ appointment expands the Board to 10 members.

Mr. Mathis brings decades of experience in finance, strategic M&A, and capital markets to the Board, including 13 years as Chief Financial Officer for multiple publicly traded companies. Mr. Mathis also has in-depth knowledge of ScanSource and the IT industry. He previously served as ScanSource’s Chief Financial Officer from 2012 to 2016 and was instrumental in the 2016 acquisition of Intelisys. Most recently, Mr. Mathis served as Chief Financial Officer for Science Applications International Corporation, a Fortune 500 company and U.S. government IT services provider, from 2016 until his retirement in January 2021. He previously served as Chief Financial Officer for Force Protection Inc., a global defense company, and EFW, Inc., the U.S.-based subsidiary of the Israeli defense contractor, Elbit Systems. He started his career in investment banking.

“Charlie is an outstanding fit for our Board, and I am thrilled to welcome him back to ScanSource,” said Mike Baur, Chairman and CEO, ScanSource, Inc. “Charlie’s deep knowledge of our business and markets, financial acumen, and experience creating shareholder value will serve ScanSource extremely well.”

Mr. Reilly joined the ScanSource Board in 2001. During his tenure, Mr. Reilly has served on all committees of the Board, most recently as Chair of Nominating Committee.

Mr. Baur commented, “Working alongside Jack is a privilege. His extensive corporate finance and banking knowledge helped guide our strategy and growth. On behalf of the Board, I want to thank Jack for his 20 years of insightful guidance and exceptional service to the ScanSource Board.”

Following Mr. Reilly’s retirement and Mr. Mathis’ appointment, ScanSource’s Board is expected to consist of nine directors.

About ScanSource, Inc.
ScanSource, Inc. (NASDAQ: SCSC) is at the center of the technology solution delivery channel, connecting businesses and providing solutions for their complex needs. ScanSource sells through multiple, specialized routes-to-market with digital, physical and services offerings from the world’s leading suppliers of point-of-sale (POS), payments, barcode, physical security, unified communications and collaboration, telecom and cloud services. ScanSource enables its sales partners to create, deliver and manage solutions for end-customers across almost every vertical market. Founded in 1992 and headquartered in Greenville, South Carolina, ScanSource was named one of the 2021 Best Places to Work in South Carolina and on FORTUNE magazine’s 2021 List of World’s Most Admired Companies. ScanSource ranks #655 on the Fortune 1000. For more information, visit www.scansource.com.
# # #