Dear Shareholders,
SES is solving two of the most difficult challenges in energy storage: accelerating product development using AI4Materials and building a robust supply chain to manufacture these products. While we originally focused on EVs, we pivoted more than a year ago to focus on ESS and drone applications. In Q2, we began seeing significant commercial milestones, and we are very excited about the path ahead. Our Q2 revenue grew by more than 40% compared to Q2 last year, while our gross margin improved from 18% to more than 22%, driven by our differentiated technology and robust supply chain. We are also reaffirming our 2026 revenue guidance of $30 million to $35 million.
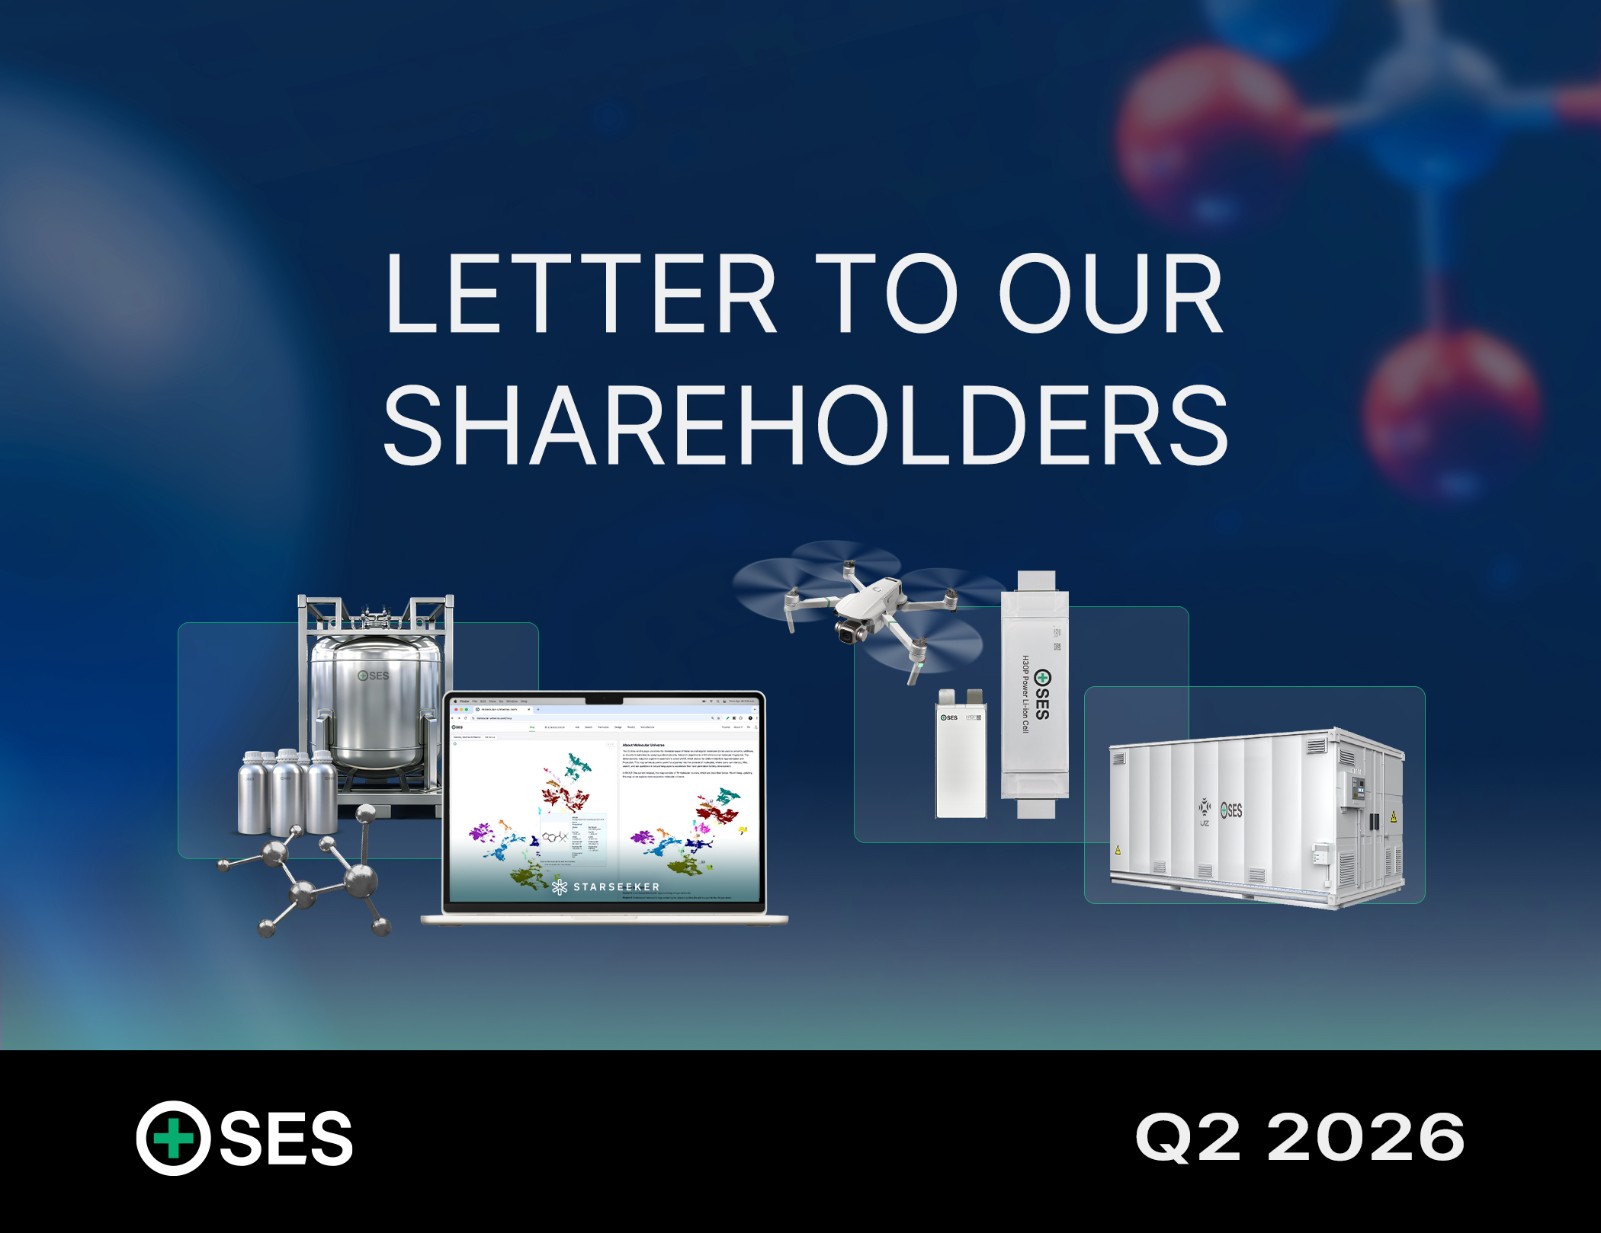
On accelerating product development using AI4Materials, we released Molecular Universe MU-3.0, our first agentic workflow platform that works across both sodium and lithium chemistries and integrates with autonomous labs deployed in a fully secure and on-premises environment. We shipped our first Search-in-a-Box order to one of the world’s largest battery manufacturers. Some of the materials discovered by Molecular Universe have completed testing and entered pilot commercial deployment.
On building a robust supply chain to manufacture these products, our largest revenue-generating unit, ESS, is making great progress, especially in the US market. We were selected by Sol-Ark as a
certified battery partner, and we appointed Paul Diemer, former CTO of Flex Power, to our board to help guide our ESS strategy. We continue to build out a stellar team with experience at leading AI data center total solutions providers to execute on and deliver our exciting ESS growth.
For drones and unmanned systems, we are recruiting a team with a proven track record of selling to defense and commercial drones. We expect to produce 1 million NDAA-compliant cells per year within one month at our Korea plant, and based on the strong customer demand we are seeing, we are looking at securing orders well into 2028. Here is an update on each of our business units.
1
Building a Robust Supply Chain –
Energy Storage Systems (ESS)
On ESS, while most competitors sell either pure hardware without intelligent software or pure software that isn’t trained on real-world data, our edge-box-enabled ESS systems are trained on the specific cells that we use in our hardware systems, enabling 1-to-1 matching, accurate state-of-health and safety management. This prediction accuracy not only helps prevent fires and other incidents but also delivers tremendous savings for our customers across residential, commercial and industrial, and data center applications.
One of the leading US-based, FCC-authorized inverter producers, Sol-Ark, certified our subsidiary UZ Energy’s low-voltage
| 1 | Letter to Our Shareholders | Q2 2026 | |
|

residential batteries for their closed-loop compatibility with its hybrid inverters. We believe this certification with Sol-Ark will greatly accelerate the growth of UZ’s revenue growth in the US, especially given the recent FCC restrictions on foreign-produced inverters and other electronics.
Last quarter, we announced a $20 million, three-year agreement with ATG Epower (now US Energy Distributors), providing UZ Energy with immediate access to ATG Epower’s established distribution network across residential, commercial, and industrial customer segments.
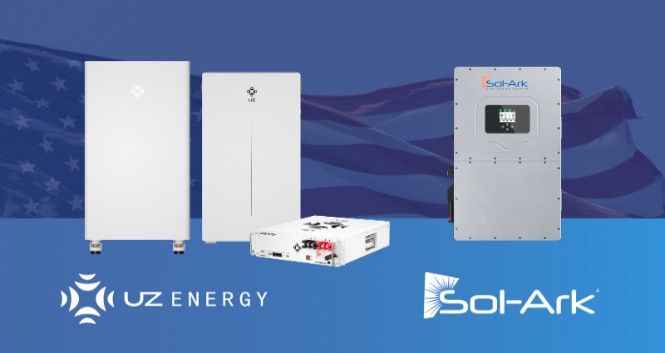
UZ Energy’s batteries certified for closed-loop compatibility with Sol-Ark’s hybrid inverters, strengthening our position in the US energy storage market.
2
Building a Robust Supply Chain –
Drones & Unmanned Systems
On drones and unmanned systems, we expect to complete the scale-up of our Korea-based, NDAA-compliant cell production from 200,000 cells a year to 1 million cells a year in about one month. We expect to start producing at full capacity of 1 million cells a year starting in Q4 this year. We have already hosted many of the largest American and allied drone makers for line audits, with many more in the queue later this year. We expect revenue from NDAA-compliant cells produced on our Korea line to begin contributing meaningfully in Q4 this year and to accelerate further in the first half of next year.
Even at 1 million NDAA-compliant pouch cells, which we believe represents one of the largest NDAA-compliant pouch manufacturing capacities in the world, combined with our best-in-class energy density and performance, based on the strong customer demand we are seeing, we are looking at securing orders well into 2028. We are also seeking additional NDAA-compliant manufacturing capacity for both pouch and cylindrical cells to address the strong demand for these products. These cells will be for drones, but also for broader unmanned and mobility applications. We recently announced a framework agreement with Doroni, where we will be responsible for designing and developing the complete battery pack for their H1-X eVTOL.
| 2 | Letter to Our Shareholders | Q2 2026 | |
|
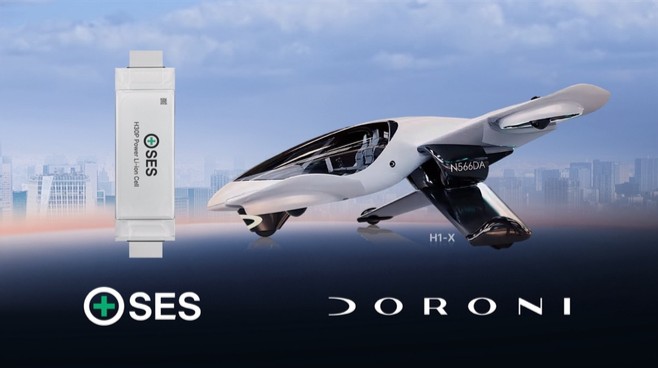
SES to design and develop the complete battery pack powering Doroni’s H1-X, a next-generation two-seat eVTOL.
3
Accelerating Product Development Using AI4Materials – Molecular Universe
On Molecular Universe, we released MU-3.0. This is the most powerful and complete end-to-end workflow automation platform in energy storage. We sold a Search-in-a-Box module to one of the largest battery makers in the world, and we are trialing the full MU-3.0 workflow integrated with autonomous labs with many more. We do have competitors in AI for Materials, but none offer solutions as complete, accurate, and, most importantly, secure as ours. Many of our customers switched to MU after trying our competitors’ offerings. Many of our competitors try to offer building blocks through cloud-based toolkits, but product development is more
than a toolkit. Very few enterprise customers would allow their proprietary data to leave their premises or be used to train external models. It requires a fully secured, on-premises integration of domain expertise, experimental data, and computational chemistry simulations in a full-stack solution.
Some of the materials discovered by Molecular Universe have completed testing and entered early-stage commercial pilot deployment. We continue to build our pipeline—roughly half a dozen customers have progressed through second-phase testing of materials discovered through Molecular Universe—and we remain focused on converting this pipeline into our first commercial supply agreement in the second half of the year.
We expect to release MU-4.0 later this year. It will feature the ability to generate new molecules based on desired properties. MU-4.0 will be integrated with autonomous lab hardware, enabling users to generate or discover new molecules, synthesize them, validate them in full devices, and feed the resulting experimental data back to train their own foundation models—all fully secured and deployed on-premises. This flywheel connects simulation with experimental validation, can organize and generate high-quality data, and train models fully secured and on-premises. Without humans in the loop, we believe it can operate far faster than humans ever can.
| 3 | Letter to Our Shareholders | Q2 2026 | |
|
While some investors may be underestimating Molecular Universe, especially when viewed purely through the lens of near-term monetization, we believe that over the next 3 to 5 years, Molecular Universe will power the majority of product development, particularly in energy storage, before expanding into complex fluids and eventually other material applications.
New Board Member
We are honored to bring on Paul Diemer to our board of directors. Paul previously served as the CTO of Flex’s Power business, where he led the Critical and Embedded Power group, which was responsible for delivering power solutions to data centers and other industrial systems. In addition to his role at Flex, he oversaw new EV product architectures at BorgWarner and currently serves as SVP of Corporate Engineering at Generac Power Systems.
Financial Highlights
Revenue and Gross Margin
Our revenue for the second quarter was $5.1 million, compared to $6.7 million in the first quarter of 2026 and $3.5 million in the second quarter of 2025. Notably, this quarter validated our commercial momentum — for the first time, we saw revenue contribution across all product lines: ESS, drone battery cells, materials, and Molecular Universe. Our GAAP gross margin was 22.6% in the second quarter, an improvement from 18.1% in the
first quarter of 2026. The improvement was primarily driven by our ESS products, where we saw a higher mix of international sales and continued pricing discipline.
Operating Expenses
Turning to operating expenses, our GAAP operating expenses for the second quarter were $20.3 million, compared to $19.1 million in the first quarter of 2026. The slight sequential increase was primarily due to a bad-debt provision related to a legacy EV service contract. Year over year, however, operating expenses were down 26%, and we remain confident in our ability to sustain an operating expense reduction of more than 20% year over year.
Net Loss and Adjusted EBITDA
Our GAAP net loss for the second quarter was $17.8 million, or a $0.05 loss per share, compared to a GAAP net loss of $12.1 million, or $0.04 loss per share, in the first quarter of 2026. The sequential increase in GAAP net loss was primarily driven by a non-cash change in the fair value of the sponsor earn-out liabilities.
Excluding the change in fair value of Sponsor Earn-Out liabilities, stock-based compensation, depreciation and amortization, and including interest income, our non-GAAP net loss for the second quarter was $13.1 million, or a $0.04 loss per share, compared to a non-GAAP net loss of $11.1 million, or a $0.03 loss per share, in the first quarter of 2026. The sequential widening in non-GAAP net
| 4 | Letter to Our Shareholders | Q2 2026 | |
|
loss was primarily due to slightly lower revenue in the second quarter and the bad-debt provision mentioned earlier.
Looking ahead, we expect our net loss to narrow in the second half of the year, driven by a pickup in revenue and continued reductions in operating expenses as our cost reduction program takes full effect. Adjusted EBITDA for the second quarter of 2026 was a loss of $14.6 million, compared to a loss of $12.8 million in the first quarter of 2026.
Liquidity and Cash Flow
We exited the second quarter with cash, cash equivalents, and short-term investments of approximately $163 million. Our CapEx-light business model remains a core financial discipline, and we are confident that our current liquidity provides a runway to fund operations and execute on our 2026 growth initiatives. This strong liquidity position also gives us the flexibility to pursue inorganic growth opportunities, including M&A, that complement our multi-business platform strategy, while maintaining financial discipline.
2026 Financial Outlook
For full-year 2026, we are reaffirming our revenue guidance of $30 million to $35 million. We are focused on building on the revenue we are generating across all our product lines. With Energy Storage Systems continuing to be our largest revenue source, we are looking for increased contributions from drone cells, materials, and Molecular Universe as we expand our sales and marketing teams and build the pipeline. On a blended basis, we continue to expect consolidated gross margin of approximately 15%, with room for improvement as we scale and add higher-margin revenue streams. As we look to the second half of the year, our priorities are clear. We expect to continue scaling Energy Storage Systems and Edge Box distribution, convert our drone qualification pipeline into commercial orders as the Chungju ramp-up completes, and close our first supply agreement for materials discovered through Molecular Universe.
Thank you to the team for their continued execution, and thank you all for your continued interest in SES AI.
 Qichao Hu Founder, CEO and Chairman |  Ray Liu Chief Financial Officer |
| 5 | Letter to Our Shareholders | Q2 2026 | |
|
SES AI Corporation
Condensed Consolidated Balance Sheets
(Unaudited)
(in thousands, except share and per share amounts) | | June 30, 2026 | | December 31, 2025 | ||
Assets | | | |
| | |
Current Assets | | | |
| | |
Cash and cash equivalents | | $ | 64,136 | | $ | 29,541 |
Short-term investments | | | 98,862 | | | 170,091 |
Accounts receivable | | | 7,749 | | | 4,783 |
Inventories | | | 8,435 | | | 5,154 |
Prepaid expenses and other assets | |
| 6,808 | |
| 6,707 |
Total current assets | |
| 185,990 | |
| 216,276 |
Property and equipment, net | |
| 24,225 | |
| 28,866 |
Goodwill | | | 13,272 | | | 13,272 |
Intangible assets, net | |
| 2,689 | |
| 2,809 |
Right-of-use assets, net | | | 6,356 | | | 7,638 |
Deferred tax assets | | | 1,522 | | | 1,521 |
Other assets, non-current | |
| 2,159 | |
| 2,264 |
Total assets | | $ | 236,213 | | $ | 272,646 |
Liabilities and Stockholders’ Equity | |
| | |
| |
Current Liabilities | |
| | |
| |
Accounts payable | | $ | 5,617 | | $ | 5,694 |
Operating lease liabilities | | | 1,629 | | | 2,298 |
Deferred consideration, current | | | 7,966 | | | 1,093 |
Accrued expenses and other liabilities | |
| 13,316 | |
| 15,071 |
Total current liabilities | |
| 28,528 | |
| 24,156 |
Sponsor Earn-Out liabilities | | | 3,571 | | | 7,795 |
Operating lease liabilities, non-current | | | 5,074 | | | 5,813 |
Unearned government grant | | | 8,567 | | | 9,042 |
Deferred consideration, non-current | | | — | | | 7,677 |
Other liabilities, non-current | |
| 3,412 | |
| 3,408 |
Total liabilities | |
| 49,152 | |
| 57,891 |
Stockholders’ Equity | |
| | |
| |
Common stock: Class A shares, $0.0001 par value, 2,100,000,000 shares authorized; 327,266,996 and 321,551,078 shares issued and outstanding as of June 30, 2026 and December 31, 2025, respectively; | |
| 37 | |
| 37 |
Additional paid-in capital | |
| 590,203 | |
| 588,355 |
Accumulated deficit | |
| (401,914) | |
| (371,911) |
Accumulated other comprehensive loss | |
| (1,267) | |
| (1,726) |
Total stockholders' equity attributable to SES | |
| 187,059 | |
| 214,755 |
Non-controlling interests | | | 2 | | | — |
Total equity | |
| 187,061 | |
| 214,755 |
Total liabilities and stockholders' equity | | $ | 236,213 | | $ | 272,646 |
| 6 | Letter to Our Shareholders | Q2 2026 | |
|
Condensed Consolidated Statements of Operations and Comprehensive Loss
(Unaudited)
| | Three Months Ended June 30, | | Six Months Ended June 30, | ||||||||
(in thousands, except share and per share amounts) | | 2026 | | 2025 | | 2026 | | 2025 | ||||
Revenue from contracts with customers: | | | | | | | | | | | | |
Revenue | | $ | 5,072 | | $ | 3,527 | | $ | 11,783 | | $ | 9,320 |
Cost of revenues | | | 3,925 | |
| 927 | | | 9,421 | | | 2,163 |
Gross profit | |
| 1,147 | |
| 2,600 | |
| 2,362 | |
| 7,157 |
Operating expenses: | | | |
| | | | | |
| | |
Research and development | | | 11,362 | | | 19,087 | | | 22,393 | | | 39,597 |
General and administrative | |
| 8,981 | |
| 6,520 | |
| 17,034 | |
| 13,840 |
Total operating expenses | |
| 20,343 | |
| 25,607 | |
| 39,427 | |
| 53,437 |
Loss from operations | |
| (19,196) | |
| (23,007) | |
| (37,065) | |
| (46,280) |
Other income: | |
| | |
| | |
| | |
| |
Gain (Loss) on change in fair value of Sponsor Earn-Out liabilities | | | 16 | | | (1,443) | | | 4,224 | | | 6,436 |
Interest income | | | 1,470 | | | 2,367 | | | 3,166 | | | 5,037 |
Miscellaneous (expense) income, net | | | (63) | | | 100 | | | 218 | | | 396 |
Total other income, net | |
| 1,423 | |
| 1,024 | |
| 7,608 | |
| 11,869 |
Loss before income taxes | |
| (17,773) | |
| (21,983) | |
| (29,457) | |
| (34,411) |
Provision for income taxes | |
| (132) | |
| (668) | |
| (546) | |
| (672) |
Net loss | |
| (17,905) | |
| (22,651) | |
| (30,003) | |
| (35,083) |
Less: Net income attributable to non-controlling interests | | | 2 | | | — | | | 2 | | | — |
Net loss attributable to SES | | | (17,903) | | | (22,651) | | | (30,001) | | | (35,083) |
Other comprehensive income (loss), net of tax: | |
| | |
| | |
| | |
| |
Foreign currency translation adjustment | |
| 27 | |
| (283) | |
| 739 | |
| (236) |
Unrealized gain (loss) on short-term investments | | | (55) | | | (55) | | | (280) | | | (75) |
Total other comprehensive (loss) income, net of tax | | | (28) | | | (338) | | | 459 | | | (311) |
Total comprehensive loss | | $ | (17,931) | | $ | (22,989) | | $ | (29,542) | | $ | (35,394) |
| | | | | | | | | | | | |
Net loss per share attributable to common stockholders: | | | | | | | | | | | | |
Basic and diluted | | $ | (0.05) | | $ | (0.07) | | $ | (0.09) | | $ | (0.11) |
| | | | | | | | | | | | |
Weighted-average shares outstanding: | | | | | | | | | | | | |
Basic and diluted | |
| 336,324,962 | |
| 331,731,923 | |
| 334,592,319 | |
| 330,539,801 |
| 7 | Letter to Our Shareholders | Q2 2026 | |
|
Condensed Consolidated Statements of Cash Flows
(Unaudited)
| Six Months Ended June 30, | ||||
(in thousands) | 2026 | | 2025 | ||
Cash Flows From Operating Activities | | |
| | |
Net loss | $ | (30,003) | | $ | (35,083) |
Adjustments to reconcile net loss to net cash used in operating activities: |
| | |
| |
Gain from change in fair value of Sponsor Earn-Out liabilities | | (4,224) | | | (6,436) |
Stock-based compensation |
| 4,102 | |
| 6,686 |
Depreciation and amortization |
| 5,365 | |
| 5,043 |
Gain from change in fair value of deferred consideration | | (1,044) | | | — |
Accretion income from available-for-sale short-term investments | | (839) | | | (1,734) |
Other | | 676 | | | 103 |
Changes in operating assets and liabilities: |
| | |
| |
Accounts receivable | | (2,864) | | | (2,059) |
Inventories | | (3,103) | | | 103 |
Prepaid expenses and other assets |
| 54 | |
| 2,338 |
Right-of-use assets | | 1,273 | | | 1,272 |
Accounts payable |
| 149 | |
| (25) |
Lease liabilities |
| (1,394) | |
| (1,350) |
Accrued expenses and other liabilities | | (1,775) | | | (2,512) |
Net cash used in operating activities |
| (33,627) | |
| (33,654) |
Cash Flows From Investing Activities |
| | |
| |
Purchases of property and equipment |
| (986) | |
| (1,720) |
Purchase of short-term investments |
| (31,990) | |
| (162,267) |
Proceeds from the maturities of short-term investments |
| 103,581 | |
| 80,800 |
Net cash provided by (used in) investing activities |
| 70,605 | |
| (83,187) |
Cash Flows From Financing Activities |
| | |
| |
Payments for taxes withheld on vesting of restricted stock | | (2,429) | | | (358) |
Proceeds from stock option exercises | | 176 | | | 13 |
Net cash used in financing activities |
| (2,253) | |
| (345) |
Effect of exchange rates on cash |
| (175) | |
| 199 |
Net increase (decrease) in cash, cash equivalents and restricted cash |
| 34,550 | |
| (116,987) |
Cash, cash equivalents and restricted cash at beginning of period |
| 30,213 | |
| 129,395 |
Cash, cash equivalents and restricted cash at end of period | $ | 64,763 | | $ | 12,408 |
| | | | | |
Supplemental Cash and Non-Cash Information: |
| | |
| |
Accounts payable and accrued expenses related to purchases of property and equipment | $ | 327 | | $ | 1,005 |
| 8 | Letter to Our Shareholders | Q2 2026 | |
|
SES AI Corporation – Supplemental Non-GAAP Information
(Unaudited)
| GAAP | | Non-GAAP | ||||||||
(in thousands, except per share amount) | Q2 2026 | | Q2 2025 | | Q1 2026 | | Q2 2026 | | Q2 2025 | | Q1 2026 |
Revenue | 5,072 | | 3,527 | | 6,711 | | 5,072 | | 3,527 | | 6,711 |
Gross profit | 1,147 | | 2,600 | | 1,215 | | 1,151 | | 2,709 | | 1,225 |
Gross margin | 22.6% | | 73.7% | | 18.1% | | 22.7% | | 76.8% | | 18.3% |
Operating expenses | 20,343 | | 25,606 | | 19,084 | | 15,674 | | 30,737 | | 14,300 |
Loss from operations | (19,196) | | (23,006) | | (17,869) | | (14,523) | | (17,766) | | (13,075) |
Net loss | (17,905) | | (22,651) | | (12,098) | | (13,116) | | (15,300) | | (11,098) |
Basic and diluted Earnings per Share ("EPS") | (0.05) | | (0.07) | | (0.04) | | (0.04) | | (0.05) | | (0.03) |
| | | | | | | | | | | |
Reconciliation of Non GAAP Financial Measures | | | | | | | | | | | |
| | | | | | | | | | | |
| Three Months Ended | | Period/Year Ended | ||||||||
(in thousands) | June 30, 2026 | | June 30, 2025 | | March 31, 2026 | | June 30, 2026 | | December 31, 2025 | | December 31, 2024 |
Gross profit (GAAP) | 1,147 | | 2,600 | | 1,215 | | 2,362 | | 11,307 | | 1,288 |
Stock-based compensation | 1 | | 93 | | 7 | | 8 | | 339 | | 18 |
Depreciation and amortization | 3 | | 16 | | 3 | | 6 | | 46 | | 18 |
Gross profit (Non-GAAP) | 1,151 | | 2,709 | | 1,225 | | 2,376 | | 11,692 | | 1,324 |
| | | | | | | | | | | |
Gross margin (GAAP) | 22.6% | | 73.7% | | 18.1% | | 20.0% | | 53.8% | | 63.1% |
Stock-based compensation | 0.0% | | 2.6% | | 0.1% | | 0.1% | | 1.6% | | 0.9% |
Depreciation and amortization | 0.1% | | 0.5% | | 0.0% | | 0.1% | | 0.3% | | 0.9% |
Gross margin (Non-GAAP) | 22.7% | | 76.8% | | 18.3% | | 20.2% | | 55.7% | | 64.9% |
| | | | | | | | | | | |
Operating expenses (GAAP) | 20,343 | | 25,606 | | 19,084 | | 39,427 | | 93,921 | | 110,536 |
Stock-based compensation | (1,985) | | 2,620 | | (2,109) | | (4,094) | | (10,632) | | (19,917) |
Depreciation and amortization | (2,684) | | 2,511 | | (2,675) | | (5,359) | | (10,249) | | (8,290) |
Operating expenses (Non-GAAP) | 15,674 | | 30,737 | | 14,300 | | 29,974 | | 73,040 | | 82,329 |
| | | | | | | | | | | |
Loss from operations (GAAP) | (19,196) | | (23,006) | | (17,869) | | (37,065) | | (82,614) | | (109,248) |
Stock-based compensation | 1,986 | | 2,713 | | 2,116 | | 4,102 | | 10,971 | | 19,935 |
Depreciation and amortization | 2,687 | | 2,527 | | 2,678 | | 5,365 | | 10,295 | | 8,308 |
Loss from operations (Non-GAAP) | (14,523) | | (17,766) | | (13,075) | | (27,598) | | (61,348) | | (81,005) |
| | | | | | | | | | | |
Net loss (GAAP) | (17,905) | | (22,651) | | (12,098) | | (30,003) | | (73,040) | | (100,185) |
Interest income | (1,470) | | (2,367) | | (1,696) | | (3,166) | | (9,338) | | (15,036) |
Depreciation and amortization expense | 2,687 | | 2,527 | | 2,678 | | 5,365 | | 10,295 | | 8,308 |
Benefit (provision) from income taxes | 132 | | 668 | | 414 | | 546 | | 231 | | 188 |
EBITDA | (16,556) | | (21,823) | | (10,702) | | (27,258) | | (71,852) | | (106,725) |
(Gain) loss on change in fair value of Sponsor Earn-Out liabilities | (16) | | 1,443 | | (4,208) | | (4,224) | | (1,677) | | 5,306 |
Stock-based compensation | 1,986 | | 2,713 | | 2,116 | | 4,102 | | 10,971 | | 19,935 |
Adjusted EBITDA | (14,586) | | (17,667) | | (12,794) | | (27,380) | | (62,558) | | (81,484) |
| 9 | Letter to Our Shareholders | Q2 2026 | |
|
| | | | | | | | | | | |
Interest income | 1,470 | | 2,367 | | 1,696 | | 3,166 | | 9,338 | | 15,036 |
Net loss (Non-GAAP) | (13,116) | | (15,300) | | (11,098) | | (24,214) | | (53,220) | | (66,448) |
| | | | | | | | | | | |
Weighted-average shares outstanding | 336,324,962 | | 331,732,000 | | 332,840,425 | | 332,840,425 | | 330,917,166 | | 321,824,143 |
EPS GAAP | (0.05) | | (0.07) | | (0.04) | | (0.09) | | (0.22) | | (0.31) |
EPS Non-GAAP | (0.04) | | (0.05) | | (0.03) | | (0.07) | | (0.16) | | (0.21) |
| | | | | | | | | | | |
Basic and Diluted EPS (GAAP) | (0.05) | | (0.07) | | (0.04) | | (0.09) | | (0.22) | | (0.31) |
Loss (gain) on change in fair value of Sponsor Earn-Out liabilities | - | | - | | (0.01) | | (0.01) | | (0.01) | | 0.02 |
Stock-based compensation | - | | 0.01 | | 0.01 | | 0.01 | | 0.03 | | 0.06 |
Depreciation and amortization expense | 0.01 | | 0.01 | | 0.01 | | 0.02 | | 0.03 | | 0.02 |
Benefit (provision) from income taxes | - | | - | | - | | - | | 0.01 | | - |
Basic and Diluted EPS (Non-GAAP) | (0.04) | | (0.05) | | (0.03) | | (0.07) | | (0.16) | | (0.21) |
Forward-Looking Statements

| 10 | Letter to Our Shareholders | Q2 2026 | |
|
This press release contains forward-looking statements within the meaning of Section 27A of the Securities Act of 1933, as amended, and Section 21E of the Securities Exchange Act of 1934, as amended, about us and our industry that involve substantial risks and uncertainties. Forward-looking statements generally relate to future events or our future financial or operating performance. In some cases, you can identify forward-looking statements because they contain words such as “will,” “goal,” “prioritize,” “plan,” “target,” “expect,” “focus,” “look forward,” “opportunity,” “believe,” “estimate,” “continue,” “anticipate,” “project” and “pursue” or the negative of these terms or similar expressions. These statements are based on the beliefs and assumptions of the management of the Company. You should not place undue reliance on these forward-looking statements. Although the Company believes that its plans, intentions and expectations reflected in or suggested by these forward-looking statements are reasonable, it cannot provide assurance that it will achieve or realize these plans, intentions or expectations. Should one or more of a number of known and unknown risks and uncertainties materialize, or should any of our assumptions prove incorrect, our actual results or performance may be materially different from those expressed or implied by these forward-looking statements. Some factors that could cause actual results to differ include, but are not limited to, among other things, the risk that the market for the Molecular Universe platform is still emerging, and may not achieve the customer interest or growth potential that SES AI expects; risks related to the development and commercialization of SES AI’s battery technology and the timing and achievement of expected business milestones; risks relating to the uncertainty of achieving and maintaining profitability; risks relating to the uncertainty of meeting future capital requirements; risks relating to the integration of Shenzhen UZ Energy Co., Ltd. into the business of SES; the market for drones, robotics and air mobility, and for use of SES technology in such applications, is still emerging and may not achieve the growth potential we expect; we may be unable to secure the level of drone cell orders we expect from our NDAA-compliant line in Korea; potential supply chain difficulties; the ability to obtain raw materials, components or equipment through new or existing supply relationships; our use of artificial intelligence and machine learning may result in legal and regulatory risk; risks resulting from SES’s strategic alliances and investments; product liability and other potential litigation, regulation and legal compliance; SES’s ability to attract, train and retain highly skilled employees and key personnel; developments in alternative technology or other fossil fuel alternatives; risks related to SES’s intellectual property; business, regulatory, political, operational, financial and economic risks related to SES’s business operations outside the United States; SES’s failure to satisfy certain NYSE listing requirements may result in its Class A common stock or public warrants being delisted from the NYSE, which could eliminate or adversely affect the trading market for SES Class A common stock or public warrants; the volatility of SES’s common stock and value of SES’s public warrants; SES has, in the past, identified material weaknesses in its internal control over financial reporting and may identify material weaknesses in the future or otherwise fail to maintain an effective system of internal controls, and other factors described in our filings with the Securities and Exchange Commission (the “SEC”), including in the “Risk Factors” and “Management’s Discussion and Analysis of Financial Condition and Results of Operations” sections of our most recently filed Annual Report on Form 10-K, Quarterly Report on Form 10-Q and other documents that we have filed, or that we will file, with the SEC. Any forward-looking statements made by us in this press release speak only as of the date on which they are made and subsequent events may cause these expectations to change. We disclaim any obligations to update or alter these forward-looking statements in the future, whether as a result of new information, future events or otherwise, except as required by law.
Non-GAAP Financial Measures

This letter includes the use of non-GAAP financial measures, which are intended to provide supplemental information regarding our performance. These non-GAAP measures include Gross profit (Non-GAAP), Gross margin (Non-GAAP), Operating expenses (Non-GAAP), Loss from operations (Non-GAAP), EBITDA, adjusted EBITDA, Net loss (Non-GAAP) attributable to SES shareholders, and Earnings per share (Non-GAAP).
We use these non-GAAP measures to supplement our financial reporting and to evaluate ongoing operations and results, facilitate internal planning and forecasting, and assess performance against prior periods, industry peers, and the broader market. These non-GAAP measures are not prepared in accordance with generally accepted accounting principles (GAAP) and should not be considered as an alternative to GAAP results. Industry peers and other
| 11 | Letter to Our Shareholders | Q2 2026 | |
|
companies may calculate similar non-GAAP measures differently. Non-GAAP financial measures have limitations, including that they exclude the impact of certain items that are included in the most directly comparable measure calculated and presented in accordance with GAAP, which adjustments reflect the exercise of judgment by management. We believe that these non-GAAP measures, when considered together with the GAAP results, provide investors with an additional understanding of our operating performance. Reconciliations of each non-GAAP financial measure to the most directly comparable GAAP financial measure can be found in the supplemental non-GAAP information section at the end of this press release.
As presented in the “Reconciliation of Non-GAAP Financial Measures” tables below, each of the non-GAAP financial measures excludes the impact of one or more of the following items for purposes of calculating non-GAAP financial measures to facilitate an evaluation of SES’s current operating performance and a comparison to its past operating performance:
Stock-based compensation expense. SES excludes the impact of stock-based compensation expense from its non-GAAP measures primarily because they are non-cash in nature. Moreover, the impact of this expense is significantly affected by SES’s stock price at the time of an award, which can be volatile and over which management has limited to no control.
Depreciation and amortization. This item represents depreciation and amortization of purchased long-lived assets and acquired intangible assets, which are both non-cash expenses. Acquisition related amortization of acquired intangible assets are not reflective of SES’s ongoing financial performance.
Interest income. This item consists primarily of interest income on short term debt securities that primarily includes accretion income from the debt securities as they progress towards their maturity date.
Benefit (provision) from income taxes. This item represents the amount adjusted to SES’s GAAP tax provision or benefit to exclude the impact of the income tax effects of GAAP adjustments that are not reflective of SES’s ongoing financial performance.
(Loss) gain on change in fair value of Sponsor Earn-Out Liability. This item represents the amount adjusted to SES’s GAAP fair value liability for Sponsor Earn-Out shares, which is a non-cash adjustment that is more tied to the change in stock price rather than management’s operational performance.
Definitions
Gross profit (Non-GAAP), Gross margin (Non-GAAP), Operating expenses (Non-GAAP), and Loss from operations (Non-GAAP) represent, in each case, the corresponding GAAP financial measure adjusted to exclude the impact of stock-based compensation expense and depreciation and amortization.
EBITDA represents net loss attributable to SES shareholders adjusted to exclude the impact of interest income, taxes, depreciation and amortization.
Adjusted EBITDA represents EBITDA adjusted to exclude the impact of loss (gain) on change in fair value of Sponsor Earn-Out liability and stock-based compensation.
Net loss (Non-GAAP) attributable to SES shareholders represents Adjusted EBITDA adjusted further to reinclude the impact of interest income.
Earnings per share (Non-GAAP) represents earnings (loss) per share adjusted to exclude the impact of taxes, depreciation and amortization, loss (gain) on change in fair value of Sponsor Earn-Out liability and stock-based compensation.
| 12 | Letter to Our Shareholders | Q2 2026 | |
|