rmrm-20211102
0001452477False00014524772021-11-022021-11-0200014524772021-05-042021-05-04

 
  UNITED STATES
SECURITIES AND EXCHANGE COMMISSION
WASHINGTON, D.C. 20549

FORM 8-K
 
CURRENT REPORT PURSUANT
TO SECTION 13 or 15(d) OF THE
SECURITIES EXCHANGE ACT of 1934
Date of report (Date of earliest event reported): November 2, 2021
Seven Hills Realty Trust
(Exact Name of Registrant as Specified in Its Charter)
Maryland
(State or other Jurisdiction of Incorporation)
001-3438320-4649929
(Commission File Number)(IRS Employer Identification Number)
    Two Newton Place, 255 Washington Street, Suite 300,
            Newton, Massachusetts                    02458-1634
        (Address of Principal Executive Offices)                 (Zip Code)

Securities registered pursuant to Section 12(b) of the Act:
Title of each classTrading SymbolName of each exchange on which registered
Common Shares of Beneficial InterestSEVNThe Nasdaq Stock Market LLC
 (617) 332-9530
(Registrant’s Telephone Number, Including Area Code)

Check the appropriate box below if the Form 8-K filing is intended to simultaneously satisfy the filing obligation of the registrant under any of the following provisions:  
            Written communications pursuant to Rule 425 under the Securities Act (17 CFR 230.425)
            Soliciting material pursuant to Rule 14a-12 under the Exchange Act (17 CFR 240.14a-12)
            Pre-commencement communications pursuant to Rule 14d-2(b) under the Exchange Act (17 CFR 240.14d-2(b))
            Pre-commencement communications pursuant to Rule 13e-4(c) under the Exchange Act (17 CFR 240.13e-4(c))
Indicate by check mark whether the registrant is an emerging growth company as defined in Rule 405 of the Securities Act of 1933 (§230.405 of this chapter) or Rule 12b-2 of the Securities Exchange Act of 1934 (§240.12b-2 of this chapter).
Emerging growth company 
If an emerging growth company, indicate by check mark if the registrant has elected not to use the extended transition period for complying with any new or revised financial accounting standards provided pursuant to Section 13(a) of the Exchange Act.  


Item 2.02.  Results of Operations and Financial Condition.
On November 2, 2021, Seven Hills Realty Trust, or the Company, issued a press release regarding the Company’s results of operations and financial condition for the quarter and nine months ended September 30, 2021 and also provided certain supplemental operating and financial data for the quarter and nine months ended September 30, 2021. Copies of the Company’s press release and supplemental operating and financial data are furnished as Exhibits 99.1 and 99.2 hereto, respectively.
Item 9.01.  Financial Statements and Exhibits.
(d)          Exhibits
99.1 Press release dated November 2, 2021
99.2 Third Quarter 2021 Supplemental Operating and Financial Data
104 Cover Page Interactive Data File. (Embedded within the inline XBRL document.)


2


SIGNATURES

Pursuant to the requirements of the Securities Exchange Act of 1934, the registrant has duly caused this report to be signed on its behalf by the undersigned hereunto duly authorized.
RMR MORTGAGE TRUST
Date:November 2, 2021By:/s/ G. Douglas Lanois
Name:G. Douglas Lanois
Title:Chief Financial Officer and Treasurer


3

Exhibit 99.1
sevnletterheadtop_2016x243.jpg
FOR IMMEDIATE RELEASE        
Seven Hills Realty Trust Announces Third Quarter 2021 Results
Completed Merger with Tremont Mortgage Trust on September 30, 2021
Combined Third Quarter Loan Originations of $140 Million
Third Quarter Net Income and Distributable Earnings Per Common Share of $0.24
____________________________________________________________________________________________________
Newton, MA (November 2, 2021): Seven Hills Realty Trust (Nasdaq: SEVN) today announced financial results for the quarter and nine months ended September 30, 2021. On September 30, 2021, SEVN (formerly RMR Mortgage Trust, or RMRM) completed its previously announced merger with Tremont Mortgage Trust, or TRMT, whereby TRMT merged with and into RMRM, with RMRM as the surviving entity, or the Merger.
Tom Lorenzini, President of SEVN, made the following statement:
"We are pleased to have successfully completed the merger with Tremont Mortgage Trust to create Seven Hills Realty Trust, a larger commercial mortgage REIT with an expanded capital base, improved access to capital markets and greater financial strength. Our combined portfolio exceeds $526 million of committed capital and is well diversified geographically and across asset classes. All of our loans are current on debt service and the credit quality of our loan portfolio remains strong, supported by healthy fundamentals and the ongoing strength of our investments.

Going forward, we are intensely focused on leveraging SEVN’s liquidity and debt capacity to fully invest our capital in first mortgage loans secured by middle market and transitional commercial real estate. Our manager, Tremont Realty Capital, remains active in the bridge loan market with a robust pipeline of potential lending opportunities, which we believe will continue to scale our investment portfolio, increase distributable earnings and deliver more attractive risk-adjusted returns for our shareholders over time.”

The Merger was effective after the close of trading on September 30, 2021. Accordingly, assets acquired and liabilities assumed from TRMT in the Merger are included in SEVN's condensed consolidated balance sheet as of September 30, 2021; however, TRMT's results of operations are excluded from SEVN's condensed consolidated statement of operations for all periods presented.

sevnletterheadbottom_2400x.jpg


Quarterly Results
Three Months Ended
(dollars in thousands, except per share data)
September 30, 2021
June 30, 2021
Change
Net income
$2,484$1,160114.1%
Net income per diluted share
$0.24$0.11118.2%
Distributable Earnings
$2,484$1,34285.1%
Distributable Earnings per diluted share
$0.24$0.1384.6%
Income from investments, net
$4,022$2,86340.5%
Book value per common share
$16.32$18.90(13.7%)
Adjusted Book Value per Common Share (1)
$18.83$18.90(0.4%)
(1)Adjusted Book Value per Common Share excludes $36.4 million, or $2.51 per common share, of unaccreted purchase discount resulting from the excess fair value compared to the purchase price of the loans acquired in the Merger. The purchase discount will be accreted into income over the remaining term of the respective loans held for investment.
Additional information and a reconciliation of net income determined in accordance with U.S. generally accepted accounting principles, or GAAP, to Distributable Earnings for the quarter and nine months ended September 30, 2021 appear later in this press release. Pro forma condensed consolidated statement of operations and calculation and reconciliation of net income (loss) to Distributable Earnings (Losses) for the three months ended September 30, 2021 as if the Merger had occurred on July 1, 2021 also appear later in this press release.
Portfolio Summary

(dollars in thousands)
September 30, 2021June 30, 2021March 31, 2021
Number of loans2297
Total loan commitments$525,885$250,710$177,195
Weighted average maximum maturity (years) 3.74.24.3
Weighted average coupon rate4.86%4.98%4.99%
Weighted average all in yield
5.43%5.62%5.65%
Weighted average LIBOR floor1.01%0.76%0.77%
Weighted average risk rating3.02.93.0
Weighted average loan to value 68%68%67%
2


Recent Investment Activities
Excluding the 10 first mortgage loans acquired in the Merger on September 30, 2021, SEVN funded the following first mortgage loans during the three months ended September 30, 2021:
LocationProperty TypeOrigination DateCommitted Principal Principal as of September 30, 2021Coupon RateAll in Yield Maximum
Maturity
(date)
LTV
(dollars in thousands)
Plano, TXOffice07/01/21$27,384$24,827 L + 4.75%L + 5.18%07/01/202678 %
Portland, ORMultifamily07/09/2119,68819,688 L + 3.57%L + 3.97%07/09/202675 %
Seattle, WAMultifamily08/16/2112,50012,200 L + 3.55%L + 3.89%08/16/202670 %
Sandy Springs, GARetail09/23/2116,48814,821 L + 3.75%L + 4.11%09/23/202672 %
Total/weighted average$76,060$71,536 L + 4.01%L + 4.41%75 %

In August 2021, SEVN received $19.1 million of repayment proceeds on its loan that was used to refinance a three-building lab property located in Berkeley, CA, which included outstanding principal of $18.4 million, a prepayment premium and exit fee of $0.6 million, as well as accrued interest and SEVN's associated legal expenses.

In October 2021, SEVN received $13.1 million of repayment proceeds on its loan that was used to finance a grocery anchored shopping center in Omaha, NE, which included outstanding principal of $13.1 million, as well as accrued interest and SEVN's associated legal expenses.

Also in October 2021, SEVN originated a first mortgage loan of $24.8 million to refinance a multi-tenant office building located in Carlsbad, CA. This loan requires the borrower to pay interest at the floating rate of LIBOR plus a premium of 325 basis points per annum. This floating rate loan includes an initial funding of $23.7 million and a future funding allowance of $1.1 million for tenant improvements, leasing commissions and capital expenditures and has a three-year initial term with two, one-year extension options, subject to the borrower meeting certain conditions.

Merger with Tremont Mortgage Trust

On September 30, 2021, SEVN completed the previously announced Merger and acquired TRMT's loan investment portfolio of 10 loans with $218.2 million in aggregate loan commitments. The purchase price, based on the closing price of SEVN's common shares on September 30, 2021 of $10.31 per share, was $169.2 million, including the assumption of $129.0 million outstanding under TRMT's master repurchase facility and closing costs of approximately $6.2 million (excluding closing costs of $5.2 million of which was paid by TRMT) and assumed working capital of $10.1 million. At the effective time of the Merger, each one (1) issued and outstanding common share of beneficial interest, $0.01 par value per share, of TRMT was automatically converted into the right to receive 0.516 of one (1) of the common shares of beneficial interest of SEVN, $0.001 par value per share. No fractional shares of SEVN common shares were issued in the Merger, and holders of shares of TRMT common shares received cash in lieu of any such fractional shares.

3


The fair value of the loans acquired in the Merger exceeded the purchase price of the loans. In accordance with GAAP, a purchase discount is recorded for the difference between the fair value and purchase price of the loans acquired. The purchase discount of $36.4 million will be allocated to each acquired TRMT loan and accreted into income over the remaining term of the respective loan.

Recent Financing Activities
During the quarter ended September 30, 2021, UBS AG, or UBS, advanced approximately $48.5 million to SEVN under its master repurchase facility, and SEVN repaid $10.3 million of outstanding balances under its master repurchase facility with UBS.

As a result of the Merger with TRMT, SEVN assumed an aggregate $129.0 million outstanding principal balance under a master repurchase facility with Citibank, N.A., or Citibank.

As of September 30, 2021 and October 29, 2021, SEVN had $216.3 million and $223.6 million, respectively, in aggregate outstanding principal balance under its master repurchase facilities with Citibank and UBS. As of September 30, 2021, SEVN was in compliance with all covenants and other terms under its master repurchase facilities.

Distributions
On August 19, 2021, SEVN paid a quarterly distribution to common shareholders of record as of July 26, 2021 of $0.15 per common share, or approximately $1.5 million in aggregate.

On September 29, 2021, in connection with the Merger, SEVN paid a cash distribution in lieu of its regular quarterly distribution to common shareholders of record as of September 7, 2021 of $0.15 per common share, or approximately $1.5 million in aggregate.

Conference Call
At 10:00 a.m. Eastern Time on Wednesday, November 3, 2021, President, Tom Lorenzini, and Chief Financial Officer and Treasurer, Doug Lanois, will host a conference call to discuss SEVN’s third quarter 2021 financial results. The conference call telephone number is (877) 270-2148. Participants calling from outside the United States and Canada should dial (412) 902-6510. No pass code is necessary to access the call from either number. Participants should dial in about 15 minutes prior to the scheduled start of the call. A replay of the conference call will be available through 11:59 p.m. on Wednesday, November 10, 2021. To access the replay, dial (412) 317-0088. The replay pass code is 10160361.
A live audio webcast of the conference call will also be available in a listen-only mode on SEVN’s website, which is located at www.sevnreit.com. Participants wanting to access the webcast should visit SEVN’s website about five minutes before the call. The archived webcast will be available for replay on SEVN’s website after the call. The transcription, recording and retransmission in any way of SEVN’s third quarter conference call are strictly prohibited without the prior written consent of SEVN.
Supplemental Data
A copy of SEVN’s Third Quarter 2021 Supplemental Operating and Financial Data is available for download at SEVN’s website, www.sevnreit.com. SEVN’s website is not incorporated as part of this press release.
4


Pro Forma Financial Information
Pro forma results combine the results of SEVN and TRMT for the three months ended September 30, 2021 as if the Merger had occurred on July 1, 2021.
On a pro forma basis for the quarter ended September 30, 2021, SEVN committed capital and funded six first mortgage loans totaling $139.5 million in loan commitments with an aggregate principal balance of $128.4 million and unfunded loan commitments of $11.1 million with a weighted average all in yield of 4.11% and a weighted average loan to value ratio, or LTV, of 73.3%. Pro forma net income per share and Distributable Earnings per share for the three months ended September 30, 2021 were $1.02 and $0.22 per diluted share, respectively.

Pro forma condensed consolidated statement of operations and calculation and reconciliation of net income (loss) to Distributable Earnings (Losses) for the three months ended September 30, 2021 as if the Merger had occurred on July 1, 2021 appear later in this press release.

About Seven Hills Realty Trust
SEVN is a real estate finance company that originates and invests in first mortgage loans secured by middle market and transitional commercial real estate. SEVN is managed by an affiliate of The RMR Group Inc. (Nasdaq: RMR). Substantially all of RMR’s business is conducted by its majority owned subsidiary, The RMR Group LLC, which is an alternative asset management company with $32 billion in assets under management and more than 35 years of institutional experience in buying, selling, financing and operating commercial real estate. For more information about SEVN, please visit www.sevnreit.com.

Non-GAAP Financial Measures
SEVN presents Distributable Earnings and Adjusted Book Value per Common Share, which are considered “non-GAAP financial measures” within the meaning of the applicable rules of the Securities and Exchange Commission, or SEC.
Distributable Earnings does not represent net income or cash generated from operating activities and should not be considered as an alternative to net income determined in accordance with GAAP or an indication of SEVN’s cash flows from operations determined in accordance with GAAP, a measure of SEVN’s liquidity or operating performance or an indication of funds available for SEVN’s cash needs. In addition, SEVN’s methodology for calculating Distributable Earnings may differ from the methodologies employed by other companies to calculate the same or similar supplemental performance measures; therefore, SEVN’s reported Distributable Earnings may not be comparable to the distributable earnings as reported by other companies.
SEVN calculates Distributable Earnings as net income, computed in accordance with GAAP, including realized losses not otherwise included in net income determined in accordance with GAAP, and excluding: (a) the management incentive fees earned by SEVN’s manager, if any; (b) depreciation and amortization, if any; (c) non-cash equity compensation expense; (d) unrealized gains, losses and other similar non-cash items that are included in net income for the period of the calculation (regardless of whether such items are included in or deducted from net income or in other comprehensive income under GAAP), if any; and (e) one-time events pursuant to changes in GAAP and certain non-cash items, if any. Distributable Earnings are reduced for realized losses on loan investments when amounts are deemed uncollectable.
5


Management believes that Adjusted Book Value per Common Share is a more meaningful measure of SEVN's capital adequacy than book value per common share because it excludes the unaccreted purchase discount resulting from the Merger that will be accreted into income over the remaining term of the respective loans acquired in the Merger. SEVN's methodology for calculating Adjusted Book Value per Common Share may differ from the methodologies employed by other companies to calculate the same or similar supplemental capital adequacy measures; therefore, SEVN's reported Adjusted Book Value per Common Share may not be comparable to the adjusted book value per common share reported by other companies.
SEVN elected to be taxed as a REIT under the Internal Revenue Code of 1986, as amended, effective for its 2020 taxable year. In order to qualify for taxation as a REIT, SEVN is generally required to distribute substantially all of its taxable income, subject to certain adjustments, to its shareholders. SEVN believes that one of the factors that investors consider important in deciding whether to buy or sell securities of a REIT is its distribution rate. Over time, Distributable Earnings may be a useful indicator of distributions to SEVN's shareholders and is a measure that is considered by SEVN's Board of Trustees when determining the amount of such distributions. SEVN believes that Distributable Earnings provides meaningful information to consider in addition to net income and cash flows from operating activities determined in accordance with GAAP. This measure helps SEVN to evaluate its performance excluding the effects of certain transactions, the variability of any management incentive fees that may be paid or payable and GAAP adjustments that SEVN believes are not necessarily indicative of SEVN’s current loan portfolio and operations. In addition, Distributable Earnings is used in determining the amount of base management and management incentive fees payable by SEVN to its manager under SEVN’s management agreement.
Please see the pages attached hereto for a more detailed statement of SEVN’s operating results and financial condition and for an explanation of SEVN's calculation of Distributable Earnings and a reconciliation of net income determined in accordance with GAAP to that amount.

6


SEVEN HILLS REALTY TRUST
CONDENSED CONSOLIDATED STATEMENTS OF OPERATIONS
(amounts in thousands, except per share data)
(unaudited)


Three Months Ended September 30, 2021Nine Months Ended September 30, 2021
INCOME FROM INVESTMENTS:
Interest income from investments$4,510 $9,566 
Less: interest and related expenses (488)(680)
Income from investments, net4,022 8,886 
OTHER EXPENSES:
Base management fees
731 2,167 
General and administrative expenses433 1,739 
Reimbursement of shared services expenses349 950 
Total expenses 1,513 4,856 
Income before income tax expense2,509 4,030 
Income tax expense(25)(36)
Net income$2,484 $3,994 
Weighted average common shares outstanding - basic10,263 10,225 
Weighted average common shares outstanding - diluted10,264 10,225 
Net income per common share - basic and diluted$0.24 $0.39 


7


SEVEN HILLS REALTY TRUST
CALCULATION AND RECONCILIATION OF NET INCOME TO DISTRIBUTABLE EARNINGS
(amounts in thousands, except per share data)
(unaudited)

Three Months Ended September 30, 2021Nine Months Ended September 30, 2021
Reconciliation of net income to Distributable Earnings:
Net income$2,484 $3,994 
Non-cash equity compensation expense— 181 
Distributable Earnings$2,484 $4,175 
Weighted average common shares outstanding - basic10,263 10,225 
Weighted average common shares outstanding - diluted10,264 10,225 
Distributable Earnings per common share -basic and diluted$0.24 $0.41 


8


SEVEN HILLS REALTY TRUST
CONDENSED CONSOLIDATED BALANCE SHEET
(dollars in thousands, except per share data)
(unaudited)
September 30,
2021
ASSETS
Cash and cash equivalents$19,298 
Restricted cash549 
Loans held for investment, net 434,474 
Accrued interest receivable 1,611 
Prepaid expenses and other assets271 
Total assets $456,203 
LIABILITIES AND SHAREHOLDERS' EQUITY
Accounts payable, accrued liabilities and deposits$2,076 
Master repurchase facilities, net215,735 
Due to related persons1,743 
Total liabilities 219,554 
Commitments and contingencies
Shareholders' equity:
Common shares of beneficial interest, $0.001 par value per share; unlimited number of shares authorized; 14,501,609 shares issued and outstanding
15 
Additional paid in capital 237,235 
Cumulative net income3,994 
Cumulative distributions(4,595)
Total shareholders' equity 236,649 
Total liabilities and shareholders' equity $456,203 


9


SEVEN HILLS REALTY TRUST
PRO FORMA CONDENSED CONSOLIDATED STATEMENT OF OPERATIONS AND CALCULATION AND RECONCILIATION OF NET INCOME (LOSS) TO DISTRIBUTABLE EARNINGS (LOSSES) AS IF THE MERGER HAD OCCURRED ON JULY 1, 2021
(amounts in thousands, except per share data)
(unaudited)

For the Three Months Ended September 30, 2021
 Pro Forma
 SEVNTRMTAdjustments Pro Forma
INCOME FROM INVESTMENTS
Interest income from investments$4,510 $3,707 $(1,759)
(1)
$6,458 
Accretion of purchase discount— — 11,597 
(2)
11,597 
Less: interest and related expenses(488)(931)255 
(1)
(1,164)
Income from investments, net4,022 2,776 10,093 16,891 
OTHER EXPENSES:
Base management fees704 330 — 1,034 
General and administrative expenses432 425 (390)
(3)
467 
Reimbursement of shared services expenses349 223 — 572 
Transaction related expenses— 3,356 (3,356)
(4)
— 
Total expenses 1,485 4,334 (3,746)2,073 
 
Income before income tax expense2,537 (1,558)13,839 14,818 
Income tax expense(25)(16)— (41)
Net income (loss)$2,512 $(1,574)$13,839 $14,777 
Weighted average common shares outstanding - basic10,263 4,285 
(5)
14,548 
Weighted average common shares outstanding - diluted10,264 4,285 
(5)
14,549 
 
Net income per common share - basic and diluted$0.24 $1.02 
Reconciliation of net income to Distributable Earnings (Losses):
Net income (loss)$2,512 $(1,574)$13,839 $14,777 
Non-cash equity compensation expense— 38 (38)— 
Non-cash accretion of purchase discount — — (11,597)
(2)
(11,597)
Distributable Earnings (Losses)$2,512 $(1,536)$2,204 $3,180 
Distributable Earnings per common share - basic and diluted$0.24 $0.22 

(1)The adjustments to interest income and interest expense represent the effect of recording any loan payoffs as if they occurred prior to July 1, 2021 and to reflect any loan originations as if they had occurred on July 1, 2021.
10


(2)This adjustment represents the effects of the Merger as if the Merger occurred on July 1, 2021, assuming the purchase price of the 10 TRMT loans acquired was $169,150 and the fair value was $205,593 resulting in a purchase discount of $36,443. This adjustment reflects the accretion of the purchase discount on loans acquired from TRMT allocated to each loan over each loan's remaining term.

(3)This adjustment eliminates duplicative public company, legal and audit fee costs that TRMT incurred during the three months ended September 30, 2021 that would not have been incurred by SEVN had the Merger occurred on July 1, 2021.

(4)This adjustment removes transaction related expenses incurred by TRMT during the three months ended September 30, 2021 which would not have been incurred by SEVN had the Merger occurred on July 1, 2021.

(5)The adjustment reflects the issuance of approximately 4,285 of SEVN's common shares issued to TRMT shareholders as part of the Merger as if the Merger occurred on July 1, 2021.
11


Warning Concerning Forward-Looking Statements
This press release contains statements that constitute forward-looking statements within the meaning of the Private Securities Litigation Reform Act of 1995 and other securities laws. Also, whenever SEVN uses words such as “believe”, “expect”, “anticipate”, “intend”, “plan”, “estimate”, “will”, “may” and negatives or derivatives of these or similar expressions, SEVN is making forward-looking statements. These forward-looking statements are based upon SEVN’s present intent, beliefs or expectations, but forward-looking statements are not guaranteed to occur and may not occur. Actual results may differ materially from those contained in or implied by SEVN’s forward-looking statements. Forward-looking statements involve known and unknown risks, uncertainties and other factors, some of which are beyond SEVN’s control. For example:
Mr. Lorenzini states that the Merger has resulted in a larger commercial mortgage REIT with an expanded capital base, improved access to capital markets and greater financial strength. SEVN’s business is subject to various risks, including the competitive nature of the commercial real estate lending industry, and SEVN may not be able to access capital in the near or longer term on desirable terms or at all. As a result, these expectations may not be realized as currently expected or at all.

Mr. Lorenzini states that SEVN’s loans are current on debt service and the credit quality of its loan portfolio remains strong, supported by healthy fundamentals and the ongoing strength of its investments. These statements may imply that SEVN’s loan portfolio performance will continue to perform well, that its borrowers will continue to remain current on their loans and that SEVN will benefit as a result. However, SEVN, its borrowers' and their tenants' businesses are subject to risks, including those related to the COVID-19 pandemic and its resulting economic impacts, and SEVN operates in a highly competitive industry. As a result of these or other factors, SEVN’s loan portfolio performance and risk ratings may decline and it may not be able to execute its business objective or realize any benefits from doing so.

Mr. Lorenzini states that SEVN is intensely focused on leveraging its liquidity and debt capacity to fully invest its capital in first mortgage loans secured by middle market and transitional commercial real estate. Additionally, this press release states that SEVN's manager, Tremont Realty Capital, remains active in the bridge loan market, and Mr. Lorenzini makes note of a robust deal pipeline. These statements may imply that SEVN will close additional loans and that its business will continue to improve as a result. However, as described above, SEVN’s business and ability to execute loans and realize its business objectives are subject to various risks, including the competitive nature of the industry in which it operates, as well as other factors, many of which are outside its control, such as the current COVID-19 pandemic. These risks and other factors may prevent SEVN from successfully closing additional loans and executing and realizing its business objectives. Further, once SEVN invests or commits its remaining capital, its ability to continue to grow and fund loans will be subject to its ability to obtain additional cost-effective capital or its redeploying proceeds from repayments of its loan investments.

The information contained in SEVN's filings with the SEC, including under “Risk Factors” in the joint proxy statement/prospectus that is included in the registration statement on Form S-4 filed on June 9, 2021, as subsequently amended and declared effective on July 26, 2021, and under "Risk Factors" in SEVN's periodic reports, or incorporated therein, identifies other important factors that could cause SEVN’s actual results to differ materially from those stated in or implied by SEVN’s forward looking statements. SEVN’s filings with the SEC are available on the SEC’s website at www.sec.gov.
12


You should not place undue reliance upon forward-looking statements.

Except as required by law, SEVN does not intend to update or change any forward-looking statements as a result of new information, future events or otherwise.


Contact:
Kevin Barry
Director, Investor Relations
(617) 796-7651
(END)
13
1 THIRD QUARTER 2021 Supplemental Operating and Financial Data ALL AMOUNTS IN THIS REPORT ARE UNAUDITED. Exhibit 99.2


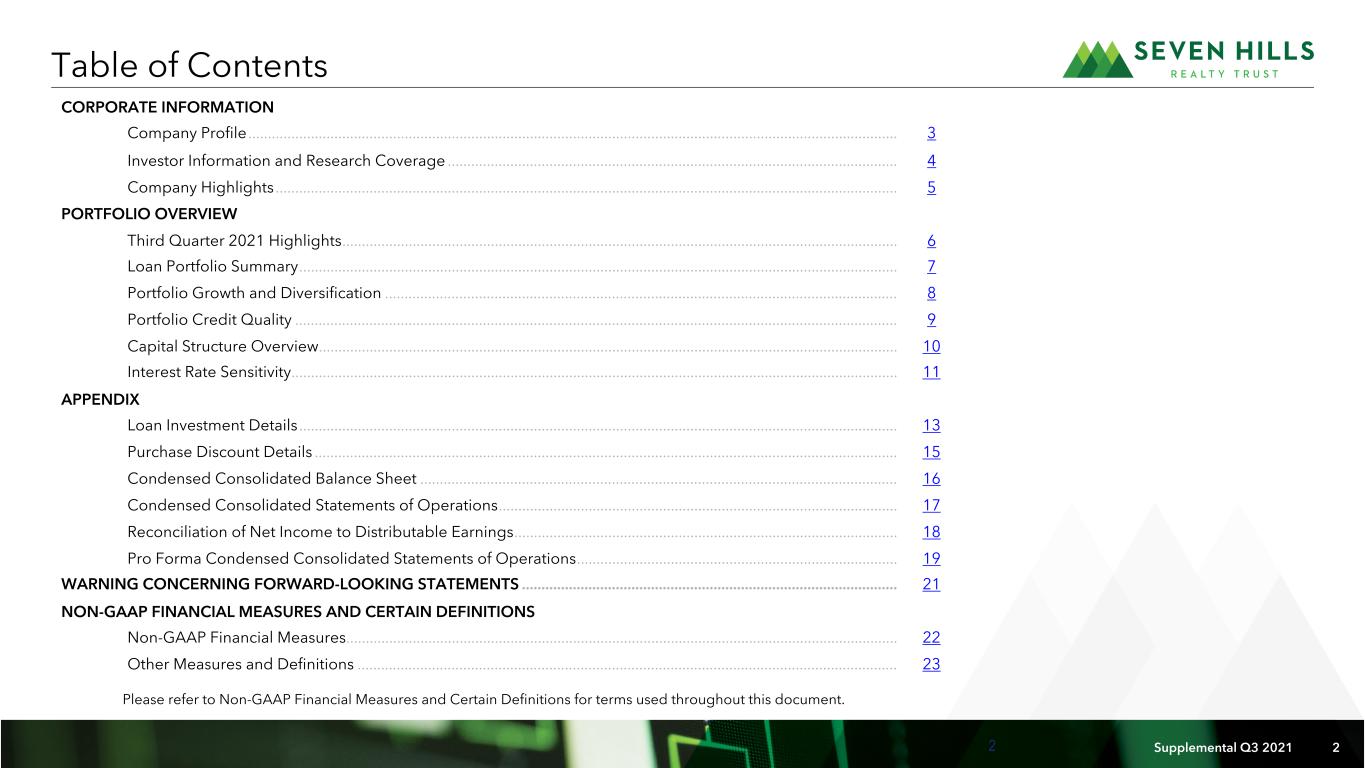
2 Supplemental Q3 2021 2 Table of Contents CORPORATE INFORMATION Company Profile ...................................................................................................................................................................... 3 Investor Information and Research Coverage ................................................................................................................... 4 Company Highlights ............................................................................................................................................................... 5 PORTFOLIO OVERVIEW Third Quarter 2021 Highlights .............................................................................................................................................. 6 Loan Portfolio Summary ......................................................................................................................................................... 7 Portfolio Growth and Diversification ................................................................................................................................... 8 Portfolio Credit Quality .......................................................................................................................................................... 9 Capital Structure Overview .................................................................................................................................................... 10 Interest Rate Sensitivity ........................................................................................................................................................... 11 APPENDIX Loan Investment Details ......................................................................................................................................................... 13 Purchase Discount Details ..................................................................................................................................................... 15 Condensed Consolidated Balance Sheet .......................................................................................................................... 16 Condensed Consolidated Statements of Operations ...................................................................................................... 17 Reconciliation of Net Income to Distributable Earnings .................................................................................................. 18 Pro Forma Condensed Consolidated Statements of Operations .................................................................................. 19 WARNING CONCERNING FORWARD-LOOKING STATEMENTS ................................................................................................ 21 NON-GAAP FINANCIAL MEASURES AND CERTAIN DEFINITIONS Non-GAAP Financial Measures ............................................................................................................................................. 22 Other Measures and Definitions .......................................................................................................................................... 23 Please refer to Non-GAAP Financial Measures and Certain Definitions for terms used throughout this document.


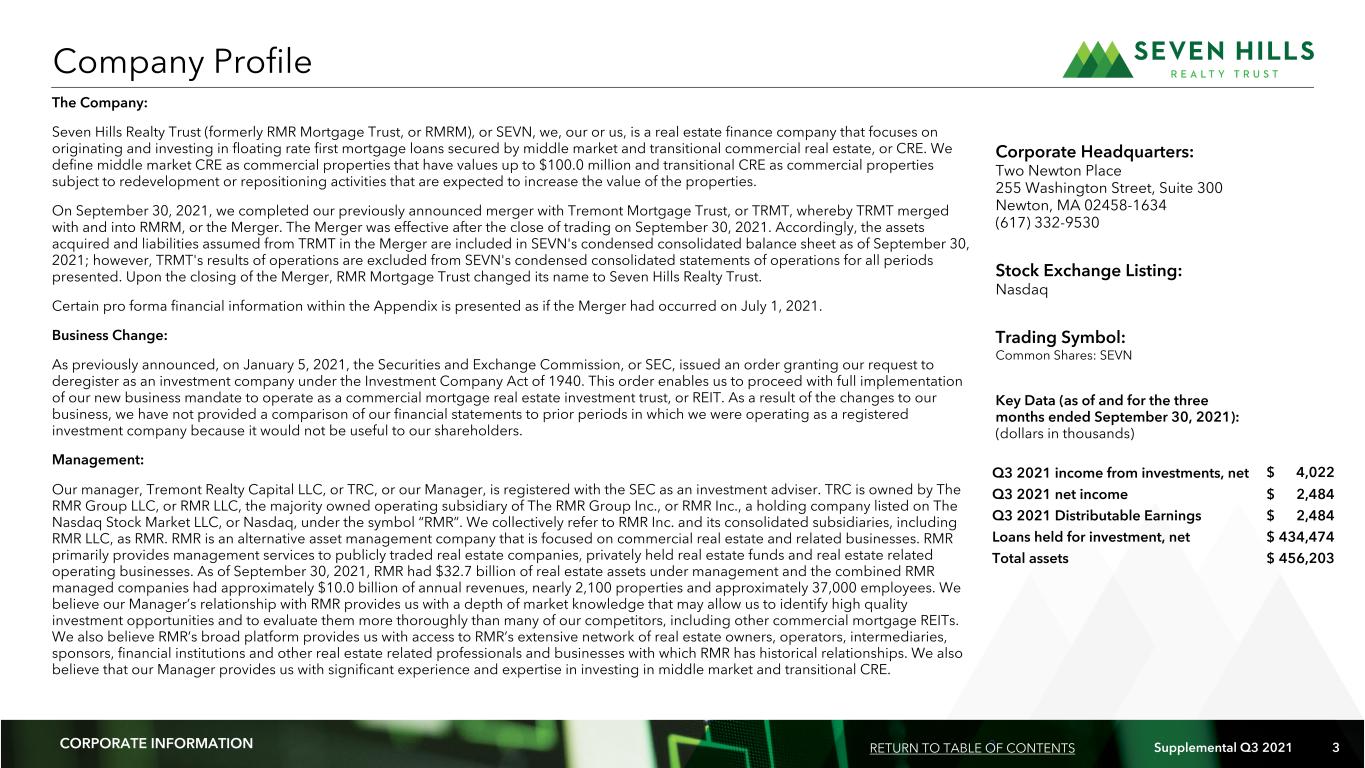
3 Supplemental Q3 2021 3 Management: Our manager, Tremont Realty Capital LLC, or TRC, or our Manager, is registered with the SEC as an investment adviser. TRC is owned by The RMR Group LLC, or RMR LLC, the majority owned operating subsidiary of The RMR Group Inc., or RMR Inc., a holding company listed on The Nasdaq Stock Market LLC, or Nasdaq, under the symbol “RMR”. We collectively refer to RMR Inc. and its consolidated subsidiaries, including RMR LLC, as RMR. RMR is an alternative asset management company that is focused on commercial real estate and related businesses. RMR primarily provides management services to publicly traded real estate companies, privately held real estate funds and real estate related operating businesses. As of September 30, 2021, RMR had $32.7 billion of real estate assets under management and the combined RMR managed companies had approximately $10.0 billion of annual revenues, nearly 2,100 properties and approximately 37,000 employees. We believe our Manager’s relationship with RMR provides us with a depth of market knowledge that may allow us to identify high quality investment opportunities and to evaluate them more thoroughly than many of our competitors, including other commercial mortgage REITs. We also believe RMR’s broad platform provides us with access to RMR’s extensive network of real estate owners, operators, intermediaries, sponsors, financial institutions and other real estate related professionals and businesses with which RMR has historical relationships. We also believe that our Manager provides us with significant experience and expertise in investing in middle market and transitional CRE. The Company: Seven Hills Realty Trust (formerly RMR Mortgage Trust, or RMRM), or SEVN, we, our or us, is a real estate finance company that focuses on originating and investing in floating rate first mortgage loans secured by middle market and transitional commercial real estate, or CRE. We define middle market CRE as commercial properties that have values up to $100.0 million and transitional CRE as commercial properties subject to redevelopment or repositioning activities that are expected to increase the value of the properties. On September 30, 2021, we completed our previously announced merger with Tremont Mortgage Trust, or TRMT, whereby TRMT merged with and into RMRM, or the Merger. The Merger was effective after the close of trading on September 30, 2021. Accordingly, the assets acquired and liabilities assumed from TRMT in the Merger are included in SEVN's condensed consolidated balance sheet as of September 30, 2021; however, TRMT's results of operations are excluded from SEVN's condensed consolidated statements of operations for all periods presented. Upon the closing of the Merger, RMR Mortgage Trust changed its name to Seven Hills Realty Trust. Certain pro forma financial information within the Appendix is presented as if the Merger had occurred on July 1, 2021. Business Change: As previously announced, on January 5, 2021, the Securities and Exchange Commission, or SEC, issued an order granting our request to deregister as an investment company under the Investment Company Act of 1940. This order enables us to proceed with full implementation of our new business mandate to operate as a commercial mortgage real estate investment trust, or REIT. As a result of the changes to our business, we have not provided a comparison of our financial statements to prior periods in which we were operating as a registered investment company because it would not be useful to our shareholders. Corporate Headquarters: Two Newton Place 255 Washington Street, Suite 300 Newton, MA 02458-1634 (617) 332-9530 Stock Exchange Listing: Nasdaq Trading Symbol: Common Shares: SEVN Key Data (as of and for the three months ended September 30, 2021): (dollars in thousands) Q3 2021 income from investments, net $ 4,022 Q3 2021 net income $ 2,484 Q3 2021 Distributable Earnings $ 2,484 Loans held for investment, net $ 434,474 Total assets $ 456,203 Company Profile RETURN TO TABLE OF CONTENTSCORPORATE INFORMATION


4 Supplemental Q3 2021 4 Investor Information and Research Coverage Board of Trustees Barbara D. Gilmore William A. Lamkin Joseph L. Morea Jeffrey P. Somers Independent Trustee Independent Trustee Lead Independent Trustee Independent Trustee Matthew P. Jordan Adam D. Portnoy Managing Trustee Chair of the Board & Managing Trustee Executive Officers Equity Research Coverage Thomas J. Lorenzini G. Douglas Lanois JMP Securities President Chief Financial Officer and Treasurer Steven C. Delaney (212) 906-3517 Contact Information [email protected] Investor Relations Inquiries Seven Hills Realty Trust Financial, investor and media inquiries should be directed to: Jones Trading Institutional Services, LLC Two Newton Place Kevin Barry, Director, Investor Relations Jason M. Stewart 255 Washington Street, Suite 300 at (617) 332-9530 or [email protected] (646) 465-9932 (617) 796-8253 [email protected] [email protected] www.sevnreit.com SEVN is followed by the analysts listed above. Please note that any opinions, estimates or forecasts regarding SEVN’s performance made by these analysts do not represent opinions, estimates or forecasts of SEVN or its management. SEVN does not by its reference above imply its endorsement of or concurrence with any information, conclusions or recommendations provided by any of these analysts. CORPORATE INFORMATION RETURN TO TABLE OF CONTENTS


5 Supplemental Q3 2021 5 Note: As of and for the three months ended September 30, 2021 (unless otherwise noted) Company Highlights CORPORATE INFORMATION 22 Floating Rate First Mortgage Loans SEVN Nasdaq Listed $526M Total Loan Commitments 100% Loans Current on Debt Service $405M Total Debt Capacity 68% Weighted Average Loan to Value 0.9x Debt to Equity Ratio 3.0 Weighted Average Portfolio Risk Rating 0.5x Price to Adjusted Book Value RETURN TO TABLE OF CONTENTS


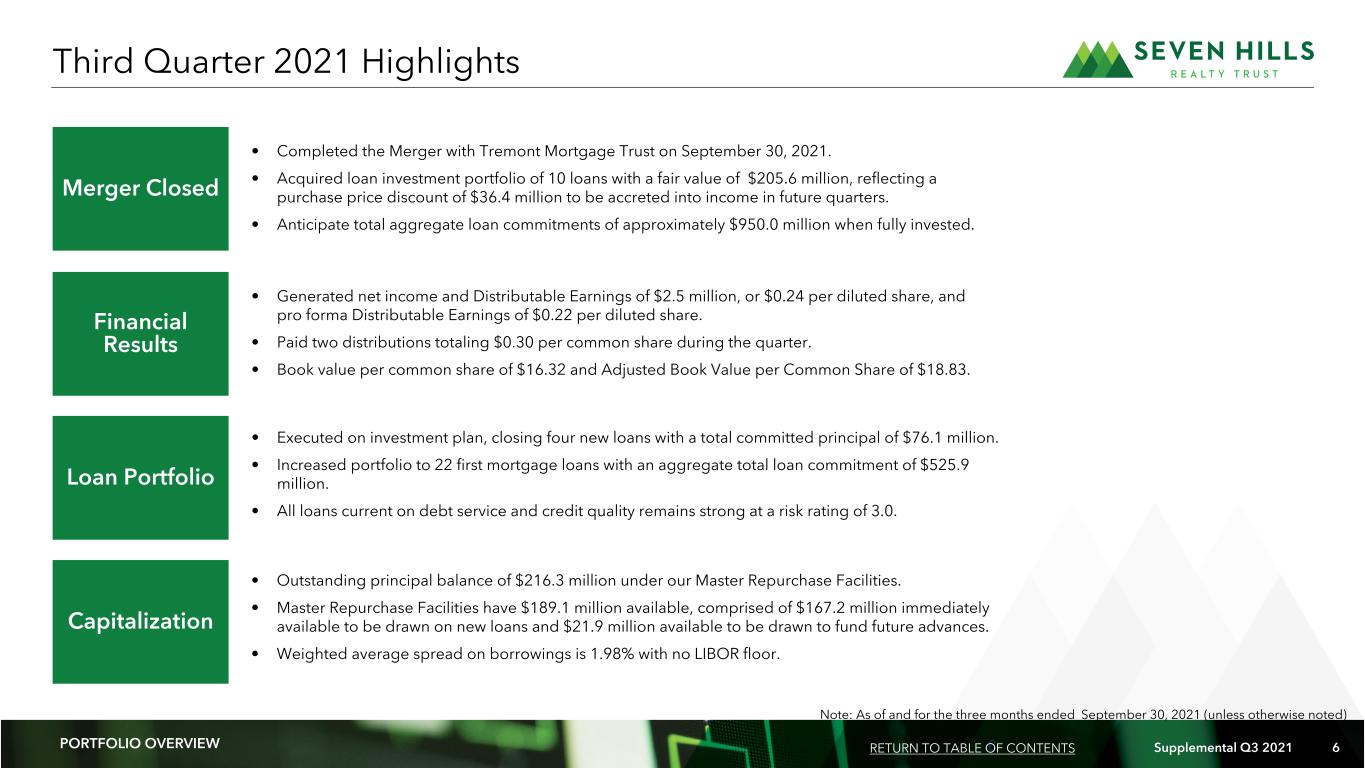
6 Supplemental Q3 2021 6 Merger Closed Financial Results Loan Portfolio Capitalization Note: As of and for the three months ended September 30, 2021 (unless otherwise noted) • Generated net income and Distributable Earnings of $2.5 million, or $0.24 per diluted share, and pro forma Distributable Earnings of $0.22 per diluted share. • Paid two distributions totaling $0.30 per common share during the quarter. • Book value per common share of $16.32 and Adjusted Book Value per Common Share of $18.83. • Executed on investment plan, closing four new loans with a total committed principal of $76.1 million. • Increased portfolio to 22 first mortgage loans with an aggregate total loan commitment of $525.9 million. • All loans current on debt service and credit quality remains strong at a risk rating of 3.0. • Completed the Merger with Tremont Mortgage Trust on September 30, 2021. • Acquired loan investment portfolio of 10 loans with a fair value of $205.6 million, reflecting a purchase price discount of $36.4 million to be accreted into income in future quarters. • Anticipate total aggregate loan commitments of approximately $950.0 million when fully invested. • Outstanding principal balance of $216.3 million under our Master Repurchase Facilities. • Master Repurchase Facilities have $189.1 million available, comprised of $167.2 million immediately available to be drawn on new loans and $21.9 million available to be drawn to fund future advances. • Weighted average spread on borrowings is 1.98% with no LIBOR floor. Third Quarter 2021 Highlights PORTFOLIO OVERVIEW RETURN TO TABLE OF CONTENTS


7 Supplemental Q3 2021 7 (dollars in thousands) Third Quarter 2021 Portfolio Activity (dollars in millions) Total Loan Commitments Unfunded Commitments Third Quarter Originations TRMT Loans Acquired in the Merger As of September 30, 2021 Number of loans 4 10 22 Average loan commitment $19,015 $21,823 $23,904 Total loan commitments $76,060 $218,235 $525,885 Unfunded loan commitments $4,524 $13,543 $53,963 Principal balance $71,536 $204,692 $472,018 Weighted average coupon rate 4.26% 4.94% 4.86% Weighted average All In Yield 4.41% 5.50% 5.43% Weighted average Maximum Maturity 5.0 3.1 3.7 Weighted average LTV 75% 67% 68% Weighted average LIBOR floor 0.73% 1.48% 1.01% Loans with active LIBOR floors 100% 100% 100% Weighted average risk rating 3.0 3.0 3.0 Principal Balance Third Quarter 2021 Portfolio Summary $525.9 PORTFOLIO OVERVIEW RETURN TO TABLE OF CONTENTS


8 Supplemental Q3 2021 8 Retail Geographic Region (2) Property Type (2) (dollars in millions) Portfolio Growth and Diversification (1) Includes loans originated by TRMT and owned by SEVN at September 30, 2021. (2) Based on principal balance of loans held for investment as of September 30, 2021. Total Loan Commitments Unfunded Commitments Principal Balance Loan Originations by Quarter (1) PORTFOLIO OVERVIEW Loan Count 1 4 2 3 6 RETURN TO TABLE OF CONTENTS


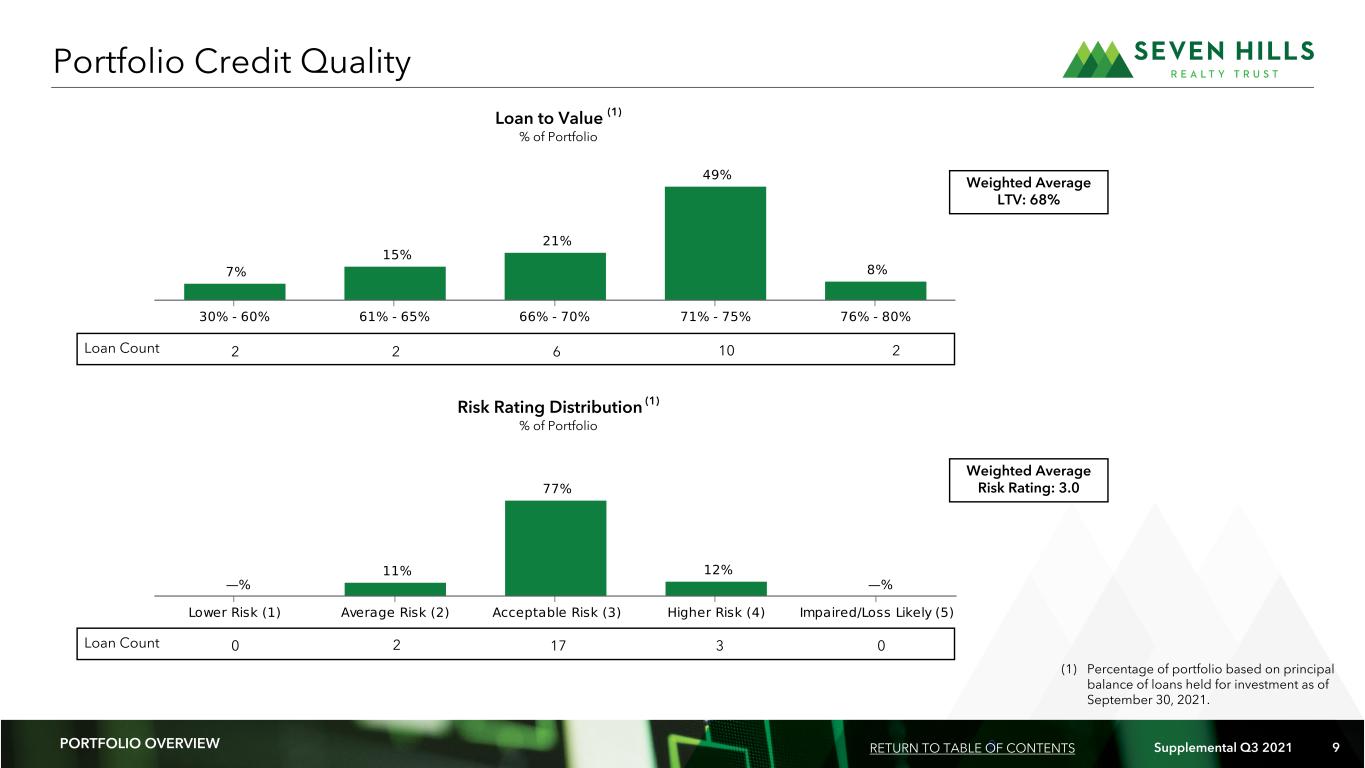
9 Supplemental Q3 2021 9 Loan Count Loan to Value (1) % of Portfolio Portfolio Credit Quality Loan Count 2 2 6 10 2 0 2 17 3 0 Risk Rating Distribution (1) % of Portfolio Weighted Average LTV: 68% Weighted Average Risk Rating: 3.0 (1) Percentage of portfolio based on principal balance of loans held for investment as of September 30, 2021. PORTFOLIO OVERVIEW RETURN TO TABLE OF CONTENTS


10 Supplemental Q3 2021 10 CA PI TA L ST RU CT UR E OV ER VI EW Secured Financing Maximum Facilities Size (1) Coupon Rate (2) Remaining Maturity (3) Principal Balance Master Repurchase Facilities $ 405,482 L + 1.98% 1.3 $ 216,345 Reconciliation of Book Value per Common Share to Adjusted Book Value per Common Share Shareholders’ equity $ 236,649 Total outstanding common shares 14,502 Book value per common share     $ 16.32 Unaccreted purchase discount per common share 2.51 Adjusted Book Value per Common Share (4) $ 18.83 Capital Structure Detail (dollars in thousands, except per share data) (1) The maximum facility amount stated in the master repurchase agreement with UBS is $192,000. The maximum facility amount stated in the master repurchase agreement with Citibank assumed in the Merger with TRMT is $213,482. (2) The weighted average coupon rate and outstanding debt to funded investments are based on outstanding principal balances as of September 30, 2021. (3) The weighted average remaining maturity is determined using the earlier of the underlying loan maturity date and the respective repurchase agreement maturity date. (4) Adjusted Book Value per Common Share excludes the impact of the unaccreted purchase discount resulting from the excess fair value over the purchase price of the loans held for investment acquired in the Merger. The purchase discount of $36.4 million was allocated to each acquired loan held for investment and will be accreted into income over the remaining term of the respective loan held for investment. (dollars in millions) Capital Structure Overview as of September 30, 2021 Capital Structure Composition Outstanding Debt to Funded Investments (2) Leverage Capacity RETURN TO TABLE OF CONTENTS (dollars in millions) PORTFOLIO OVERVIEW RETURN TO TABLE OF CONTENTS


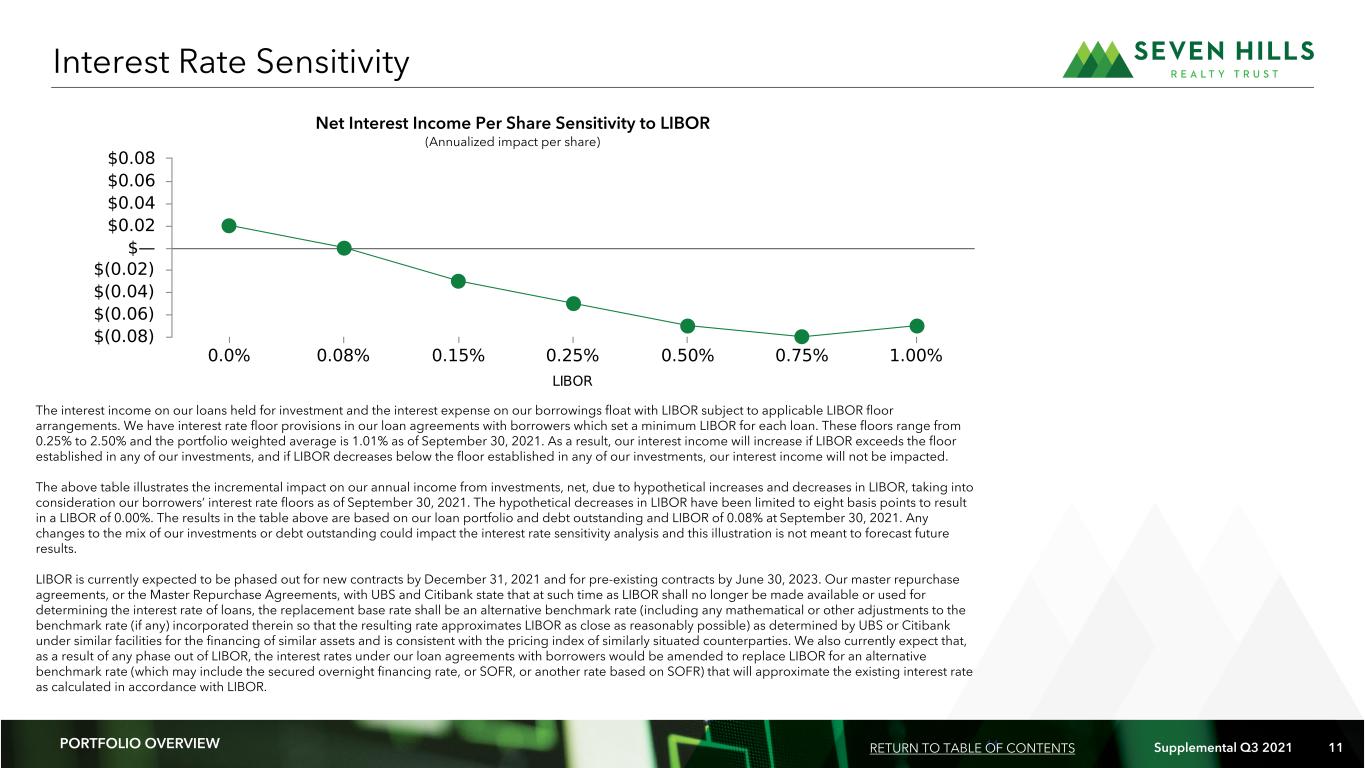
11 Supplemental Q3 2021 11 The interest income on our loans held for investment and the interest expense on our borrowings float with LIBOR subject to applicable LIBOR floor arrangements. We have interest rate floor provisions in our loan agreements with borrowers which set a minimum LIBOR for each loan. These floors range from 0.25% to 2.50% and the portfolio weighted average is 1.01% as of September 30, 2021. As a result, our interest income will increase if LIBOR exceeds the floor established in any of our investments, and if LIBOR decreases below the floor established in any of our investments, our interest income will not be impacted. The above table illustrates the incremental impact on our annual income from investments, net, due to hypothetical increases and decreases in LIBOR, taking into consideration our borrowers’ interest rate floors as of September 30, 2021. The hypothetical decreases in LIBOR have been limited to eight basis points to result in a LIBOR of 0.00%. The results in the table above are based on our loan portfolio and debt outstanding and LIBOR of 0.08% at September 30, 2021. Any changes to the mix of our investments or debt outstanding could impact the interest rate sensitivity analysis and this illustration is not meant to forecast future results. LIBOR is currently expected to be phased out for new contracts by December 31, 2021 and for pre-existing contracts by June 30, 2023. Our master repurchase agreements, or the Master Repurchase Agreements, with UBS and Citibank state that at such time as LIBOR shall no longer be made available or used for determining the interest rate of loans, the replacement base rate shall be an alternative benchmark rate (including any mathematical or other adjustments to the benchmark rate (if any) incorporated therein so that the resulting rate approximates LIBOR as close as reasonably possible) as determined by UBS or Citibank under similar facilities for the financing of similar assets and is consistent with the pricing index of similarly situated counterparties. We also currently expect that, as a result of any phase out of LIBOR, the interest rates under our loan agreements with borrowers would be amended to replace LIBOR for an alternative benchmark rate (which may include the secured overnight financing rate, or SOFR, or another rate based on SOFR) that will approximate the existing interest rate as calculated in accordance with LIBOR. Interest Rate Sensitivity Net Interest Income Per Share Sensitivity to LIBOR (Annualized impact per share) PORTFOLIO OVERVIEW RETURN TO TABLE OF CONTENTS


12 Supplemental Q3 2021 12APPENDIX Appendix


13 Supplemental Q3 2021 13 First mortgage loans as of September 30, 2021: (1) Location Property Type Origination Date Committed Principal Amount Principal Balance (2) Coupon Rate All in Yield Maturity Date Maximum Maturity Date LTV Risk Rating St. Louis, MO (3) Office 12/19/2018 $ 29,500 $ 27,763 L + 3.25% L + 3.74% 12/19/2021 12/19/2023 72% 2 Atlanta, GA (3) Hotel 12/21/2018 24,000 23,904 L + 3.25% L + 3.72% 12/21/2021 12/21/2023 62% 4 Coppell, TX (3) Retail 02/05/2019 19,865 19,615 L + 3.50% L + 3.72% 02/12/2022 02/12/2022 73% 4 Omaha, NE (3)(4) Retail 06/14/2019 14,500 13,053 L + 3.65% L + 4.05% 06/14/2022 06/14/2024 77% 3 Yardley, PA (3) Office 12/19/2019 14,900 14,265 L + 3.75% L + 4.47% 12/19/2022 12/19/2024 75% 4 Allentown, PA (3) Industrial 01/24/2020 14,000 14,000 L + 3.50% L + 4.02% 01/24/2023 01/24/2025 67% 3 Dublin, OH (3) Office 02/18/2020 22,820 21,735 L + 3.75% L + 4.82% 02/18/2022 02/18/2023 33% 2 Downers Grove, IL Office 09/25/2020 30,000 29,500 L + 4.25% L + 4.69% 12/17/2022 11/25/2024 67% 3 Los Angeles, CA Retail 12/17/2020 24,600 18,138 L + 4.25% L + 5.07% 11/25/2023 12/17/2024 67% 3 Durham, NC Lab 12/17/2020 21,500 13,500 L + 4.35% L + 5.20% 12/18/2023 12/17/2025 57% 3 Aurora, IL Office / Industrial 12/18/2020 16,500 14,710 L + 4.35% L + 5.04% 01/19/2023 12/18/2024 73% 3 Miami, FL Office 01/19/2021 10,900 10,900 L + 4.50% L + 5.47% 01/28/2024 01/19/2025 68% 3 Olmstead Falls, OH Multifamily 01/28/2021 54,575 45,316 L + 4.00% L + 4.65% 12/17/2023 01/28/2026 63% 3 Loan Investment Details (dollars in thousands) APPENDIX RETURN TO TABLE OF CONTENTS


14 Supplemental Q3 2021 14 First mortgage loans as of September 30, 2021: (1) Location Property Type Origination Date Committed Principal Amount Principal Balance (2) Coupon Rate All in Yield Maturity Date Maximum Maturity Date LTV Risk Rating Colorado Springs, CO Office / Industrial 04/06/2021 34,275 29,404 L + 4.50% L + 5.03% 04/06/2024 04/06/2025 73% 3 Londonderry, NH Industrial 04/06/2021 39,240 34,323 L + 4.00% L + 4.62% 04/06/2024 04/06/2026 73% 3 Westminster, CO (3) Office 05/24/2021 15,250 13,506 L + 3.75% L + 4.25% 05/24/2024 05/24/2026 66% 3 Plano, TX Office 07/01/2021 27,384 24,827 L + 4.75% L + 5.18% 07/01/2024 07/01/2026 78% 3 Portland, OR Multifamily 07/09/2021 19,688 19,688 L + 3.57% L + 3.97% 07/09/2024 07/09/2026 75% 3 Portland, OR (3) Multifamily 07/30/2021 13,400 13,400 L + 3.57% L + 4.01% 07/30/2024 07/30/2026 71% 3 Seattle, WA Multifamily 08/16/2021 12,500 12,200 L + 3.55% L + 3.89% 08/16/2024 08/16/2026 70% 3 Dallas, TX (3) Office 08/25/2021 50,000 43,450 L + 3.25% L + 3.64% 08/25/2024 08/25/2026 72% 3 Sandy Springs, GA Retail 09/23/2021 16,488 14,821 L + 3.75% L + 4.11% 09/23/2024 09/23/2026 72% 3 Total/weighted average $ 525,885 $ 472,018 L + 3.86% L + 4.41% 68% 3.0 Loan Investment Details (Continued) (dollars in thousands) APPENDIX RETURN TO TABLE OF CONTENTS (1) As of October 29, 2021, all of our borrowers had paid their debt service obligations owed and due to us, and none of the loans included in our investment portfolio were in default. (2) The principal balance excludes the impact of the $36,443 purchase discount related to the Merger with TRMT. (3) These first mortgage loans were acquired in the Merger with TRMT. (4) In October 2021, we received $13,130 of repayment proceeds which included the outstanding principal of $13,053, as well as immaterial accrued interest and our associated legal expenses.


15 Supplemental Q3 2021 15 Purchase Discount Details (1) The estimate of purchase discount accretion is based on information as of September 30, 2021 and is subject to change as a result of early repayment. (dollars in millions) The fair value of the loans acquired in the Merger exceeded the purchase price of the loans. In accordance with U.S. generally accepted accounting principles, or GAAP, a purchase discount is recorded for the difference between the fair value and purchase price of the loans acquired. The purchase discount will be accreted into income over the remaining term of the loans. Purchase Discount Fair value of TRMT loans acquired in the Merger  $ 205.6 Less: Purchase price of TRMT loans acquired in the Merger 169.2 Purchase discount $ 36.4 Estimate of Purchase Discount Accretion $18.1 $5.1 $2.1 $2.1 $2.1 $4.6 $2.3 Q4 2021 Q1 2022 Q2 2022 Q3 2022 Q4 2022 2023 2024 (1) PORTFOLIO OVERVIEW RETURN TO TABLE OF CONTENTS


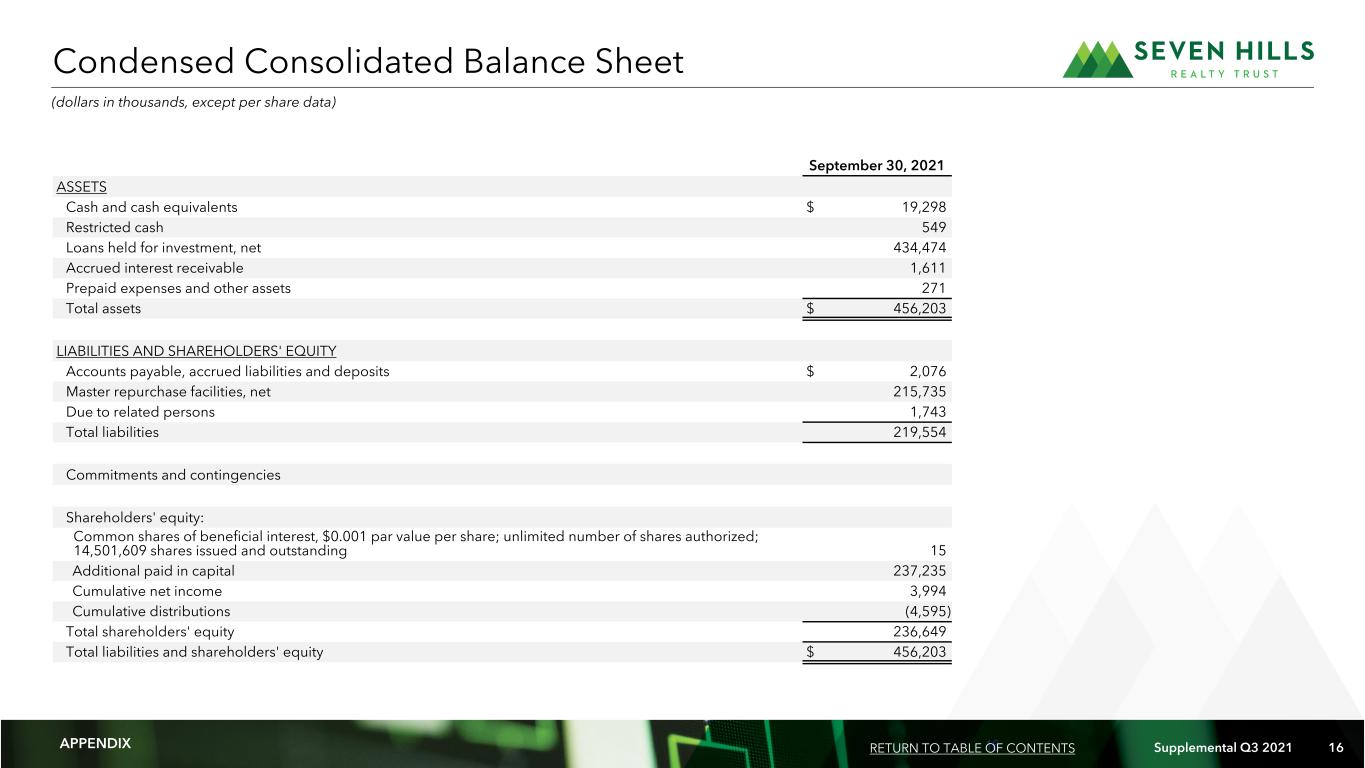
16 Supplemental Q3 2021 16 Financial Summary September 30, 2021 ASSETS   Cash and cash equivalents $ 19,298 Restricted cash 549 Loans held for investment, net 434,474 Accrued interest receivable 1,611 Prepaid expenses and other assets 271 Total assets $ 456,203 LIABILITIES AND SHAREHOLDERS' EQUITY Accounts payable, accrued liabilities and deposits $ 2,076 Master repurchase facilities, net 215,735 Due to related persons 1,743 Total liabilities 219,554 Commitments and contingencies Shareholders' equity: Common shares of beneficial interest, $0.001 par value per share; unlimited number of shares authorized; 14,501,609 shares issued and outstanding 15 Additional paid in capital 237,235 Cumulative net income 3,994 Cumulative distributions (4,595) Total shareholders' equity 236,649 Total liabilities and shareholders' equity $ 456,203 Condensed Consolidated Balance Sheet (dollars in thousands, except per share data) APPENDIX RETURN TO TABLE OF CONTENTS


17 Supplemental Q3 2021 17 Condensed Consolidated Statements of Operations     Three Months Ended September 30, 2021   Nine Months Ended September 30, 2021 INCOME FROM INVESTMENTS:         Interest income from investments   $ 4,510 $ 9,566 Less: interest and related expenses   (488) (680) Income from investments, net   4,022 8,886 OTHER EXPENSES: Base management fees   731 2,167 General and administrative expenses   433 1,739 Reimbursement of shared services expenses   349 950 Total expenses   1,513 4,856 Income before income tax expense 2,509 4,030 Income tax expense (25) (36) Net income   $ 2,484 $ 3,994   Weighted average common shares outstanding - basic   10,263 10,225 Weighted average common shares outstanding - diluted   10,264 10,225   Net income per common share - basic and diluted   $ 0.24 $ 0.39       (amounts in thousands, except per share data) APPENDIX RETURN TO TABLE OF CONTENTS


18 Supplemental Q3 2021 18 Three Months Ended September 30, 2021 Nine Months Ended September 30, 2021 Reconciliation of net income to Distributable Earnings: Net income $ 2,484 $ 3,994 Non-cash equity compensation expense — 181 Distributable Earnings $ 2,484 $ 4,175 Weighted average common shares outstanding - basic   10,263 10,225 Weighted average common shares outstanding - diluted   10,264 10,225 Distributable Earnings per common share - basic and diluted   $ 0.24 $ 0.41 Reconciliation of Net Income to Distributable Earnings (amounts in thousands, except per share data) APPENDIX RETURN TO TABLE OF CONTENTS


19 Supplemental Q3 2021 19 PRO FORMA CONDENSED CONSOLIDATED STATEMENT OF OPERATIONS AND CALCULATION AND RECONCILIATION OF NET INCOME (LOSS) TO DISTRIBUTABLE EARNINGS (LOSSES) AS IF THE MERGER HAD OCCURRED ON JULY 1, 2021 (amounts in thousands, except per share data) For the Three Months Ended September 30, 2021 Pro Forma SEVN TRMT Adjustments Pro Forma INCOME FROM INVESTMENTS Interest income from investments $ 4,510 $ 3,707 $ (1,759) (1) $ 6,458 Purchase discount accretion — — 11,597 (2) 11,597 Less: interest and related expenses (488) (931) 255 (1) (1,164) Income from investments, net 4,022 2,776 10,093 16,891 OTHER EXPENSES: Base management fees 704 330 — 1,034 General and administrative expenses 432 425 (390) (3) 467 Reimbursement of shared services expenses 349 223 — 572 Transaction related expenses — 3,356 (3,356) (4) — Total expenses 1,485 4,334 (3,746) 2,073 Income before income tax expense 2,537 (1,558) 13,839 14,818 Income tax expense (25) (16) — (41) Net income (loss) $ 2,512 $ (1,574) $ 13,839 $ 14,777 Weighted average common shares outstanding - basic 10,263 4,285 (5) 14,548 Weighted average common shares outstanding - diluted 10,264 4,285 (5) 14,549 Net income per common share - basic and diluted $ 0.24 $ 1.02 APPENDIX RETURN TO TABLE OF CONTENTS


20 Supplemental Q3 2021 20 PRO FORMA CONDENSED CONSOLIDATED STATEMENT OF OPERATIONS AND CALCULATION AND RECONCILIATION OF NET INCOME (LOSS) TO DISTRIBUTABLE EARNINGS (LOSSES) AS IF THE MERGER HAD OCCURRED ON JULY 1, 2021 (CONTINUED) (amounts in thousands, except per share data) For the Three Months Ended September 30, 2021 Pro Forma SEVN TRMT Adjustments Pro Forma Reconciliation of net income to Distributable Earnings (Losses): Net income (loss) $ 2,512 $ (1,574) $ 13,839 $ 14,777 Non-cash equity compensation expense — 38 (38) — Non-cash accretion of purchase discount — — (11,597) (2) (11,597) Distributable Earnings (Losses) $ 2,512 $ (1,536) $ 2,204 $ 3,180 Weighted average common shares outstanding - basic 10,263 4,285 (5) 14,548 Weighted average common shares outstanding - diluted 10,264 4,285 (5) 14,549 Distributable Earnings per common share - basic and diluted $ 0.24 $ 0.22 (1) The adjustments to interest income and interest expense represent the effect of recording any loan payoffs as if they occurred prior to July 1, 2021 and to reflect any loan originations as if those transactions had occurred on July 1, 2021. (2) This adjustment represents the effects of the Merger as if the Merger occurred on July 1, 2021, assuming the purchase price of the 10 TRMT loans acquired was $169,150 and the fair value was $205,593 resulting in a purchase discount of $36,443. This adjustment reflects the accretion of the purchase discount on loans acquired from TRMT allocated to each loan over each loan's remaining term. (3) This adjustment eliminates duplicative public company, legal and audit fee costs that TRMT incurred during the three months ended September 30, 2021 that would not have been incurred by us had the Merger occurred on July 1, 2021. (4) This adjustment removes transaction related expenses incurred by TRMT during the three months ended September 30, 2021 which would not have been incurred by us had the Merger occurred on July 1, 2021. (5) The adjustment reflects the issuance of approximately 4,285 of SEVN's common shares issued to TRMT shareholders as part of the Merger as if the Merger occurred on July 1, 2021. APPENDIX RETURN TO TABLE OF CONTENTS


21 Supplemental Q3 2021 21 This supplemental operating and financial data may contain forward-looking statements within the meaning of the Private Securities Litigation Reform Act of 1995 and other securities laws. Also, whenever we use words such as “believe”, “expect”, “anticipate”, “intend”, “plan”, “estimate”, “will”, “may” and negatives or derivatives of these or similar expressions, we are making forward-looking statements. These forward-looking statements are based upon our present intent, beliefs or expectations, but forward-looking statements are not guaranteed to occur and may not occur. Actual results may differ materially from those contained in or implied by our forward-looking statements. Forward-looking statements involve known and unknown risks, uncertainties and other factors, some of which are beyond our control. The information contained in our filings with the SEC, including under "Risk Factors" in the joint proxy statement/ prospectus that is included in the registration statement on Form S-4 filed on June 9, 2021, as subsequently amended and declared effective on July 26, 2021, and under “Summary of Principal Risk Factors” included in our Current Report on Form 8-K filed on March 24, 2021 and our periodic reports, identifies other important factors that could cause SEVN’s actual results to differ materially from those stated in or implied by SEVN’s forward looking statements. SEVN’s filings with the SEC are available on the SEC’s website at www.sec.gov. Warning Concerning Forward-Looking Statements WARNING CONCERNING FORWARD-LOOKING STATEMENTS RETURN TO TABLE OF CONTENTS


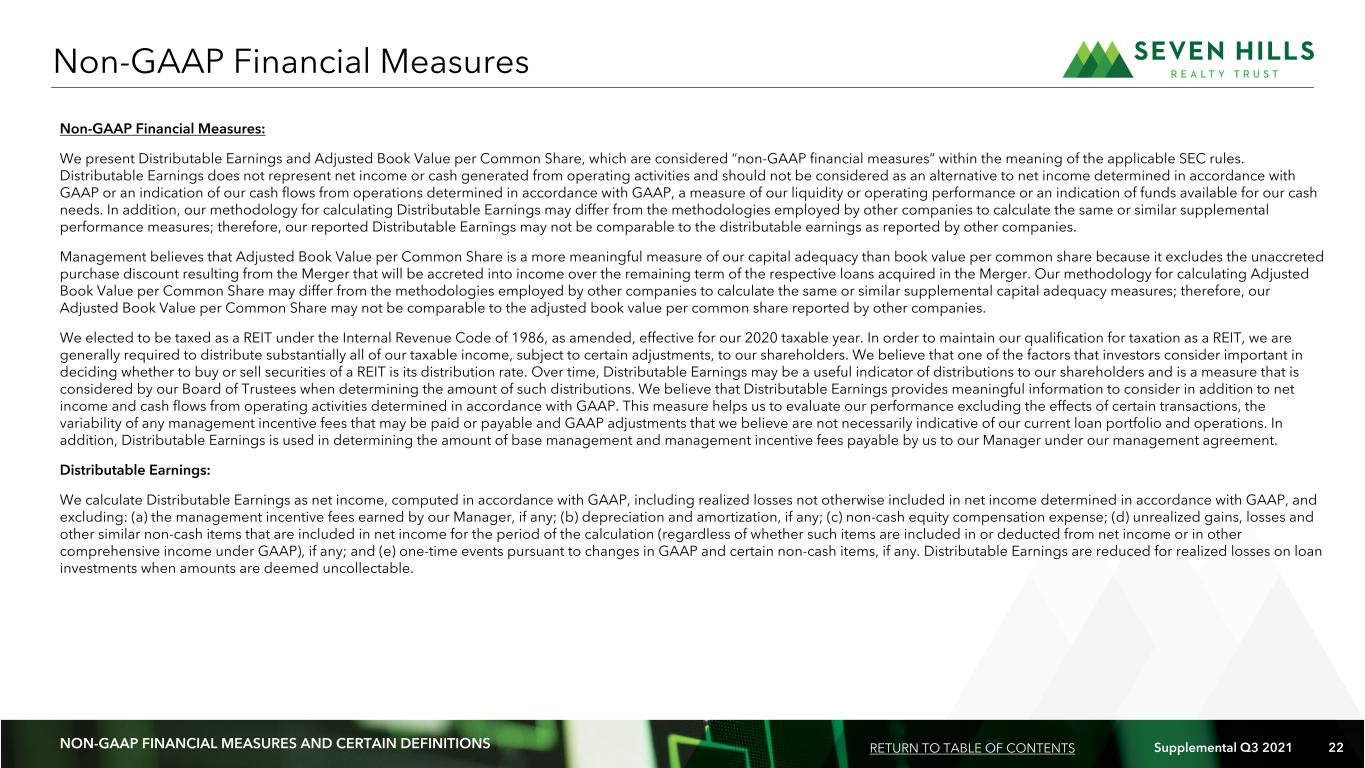
22 Supplemental Q3 2021 22 ON -G AA P FI NA NC IA L ME AS UR ES A ND C ER TA IN D EF IN IT IO NS Non-GAAP Financial Measures: We present Distributable Earnings and Adjusted Book Value per Common Share, which are considered “non-GAAP financial measures” within the meaning of the applicable SEC rules. Distributable Earnings does not represent net income or cash generated from operating activities and should not be considered as an alternative to net income determined in accordance with GAAP or an indication of our cash flows from operations determined in accordance with GAAP, a measure of our liquidity or operating performance or an indication of funds available for our cash needs. In addition, our methodology for calculating Distributable Earnings may differ from the methodologies employed by other companies to calculate the same or similar supplemental performance measures; therefore, our reported Distributable Earnings may not be comparable to the distributable earnings as reported by other companies. Management believes that Adjusted Book Value per Common Share is a more meaningful measure of our capital adequacy than book value per common share because it excludes the unaccreted purchase discount resulting from the Merger that will be accreted into income over the remaining term of the respective loans acquired in the Merger. Our methodology for calculating Adjusted Book Value per Common Share may differ from the methodologies employed by other companies to calculate the same or similar supplemental capital adequacy measures; therefore, our Adjusted Book Value per Common Share may not be comparable to the adjusted book value per common share reported by other companies. We elected to be taxed as a REIT under the Internal Revenue Code of 1986, as amended, effective for our 2020 taxable year. In order to maintain our qualification for taxation as a REIT, we are generally required to distribute substantially all of our taxable income, subject to certain adjustments, to our shareholders. We believe that one of the factors that investors consider important in deciding whether to buy or sell securities of a REIT is its distribution rate. Over time, Distributable Earnings may be a useful indicator of distributions to our shareholders and is a measure that is considered by our Board of Trustees when determining the amount of such distributions. We believe that Distributable Earnings provides meaningful information to consider in addition to net income and cash flows from operating activities determined in accordance with GAAP. This measure helps us to evaluate our performance excluding the effects of certain transactions, the variability of any management incentive fees that may be paid or payable and GAAP adjustments that we believe are not necessarily indicative of our current loan portfolio and operations. In addition, Distributable Earnings is used in determining the amount of base management and management incentive fees payable by us to our Manager under our management agreement. Distributable Earnings: We calculate Distributable Earnings as net income, computed in accordance with GAAP, including realized losses not otherwise included in net income determined in accordance with GAAP, and excluding: (a) the management incentive fees earned by our Manager, if any; (b) depreciation and amortization, if any; (c) non-cash equity compensation expense; (d) unrealized gains, losses and other similar non-cash items that are included in net income for the period of the calculation (regardless of whether such items are included in or deducted from net income or in other comprehensive income under GAAP), if any; and (e) one-time events pursuant to changes in GAAP and certain non-cash items, if any. Distributable Earnings are reduced for realized losses on loan investments when amounts are deemed uncollectable. Non-GAAP Financial Measures NON-GAAP FINANCIAL MEASURES AND CERTAIN DEFINITIONS RETURN TO TABLE OF CONTENTS


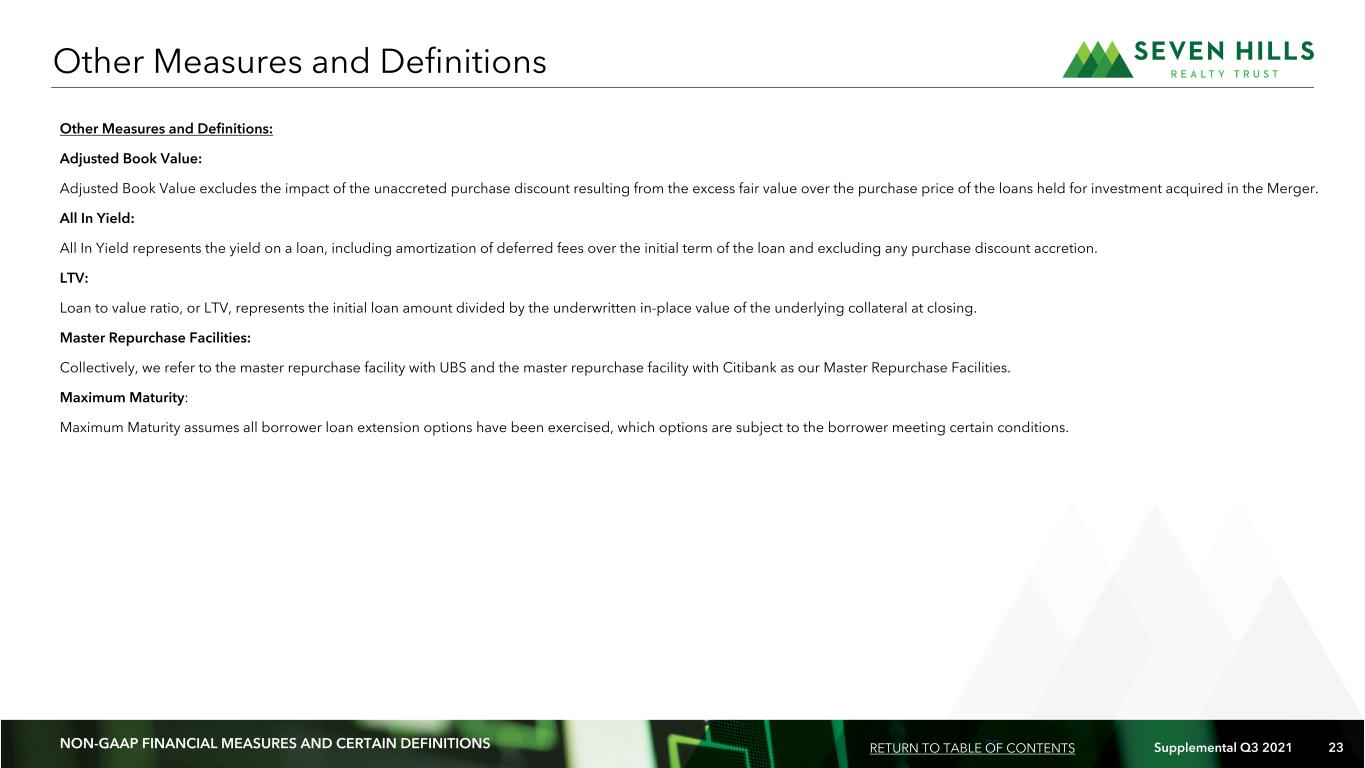
23 Supplemental Q3 2021 23 ON -G AA P FI NA NC IA L ME AS UR ES A ND C ER TA IN D EF IN IT IO NS Other Measures and Definitions: Adjusted Book Value: Adjusted Book Value excludes the impact of the unaccreted purchase discount resulting from the excess fair value over the purchase price of the loans held for investment acquired in the Merger. All In Yield: All In Yield represents the yield on a loan, including amortization of deferred fees over the initial term of the loan and excluding any purchase discount accretion. LTV: Loan to value ratio, or LTV, represents the initial loan amount divided by the underwritten in-place value of the underlying collateral at closing. Master Repurchase Facilities: Collectively, we refer to the master repurchase facility with UBS and the master repurchase facility with Citibank as our Master Repurchase Facilities. Maximum Maturity: Maximum Maturity assumes all borrower loan extension options have been exercised, which options are subject to the borrower meeting certain conditions. Other Measures and Definitions NON-GAAP FINANCIAL MEASURES AND CERTAIN DEFINITIONS RETURN TO TABLE OF CONTENTS