Goldman Sachs U.S. Financial Services Conference December 9, 2020 Exhibit 99.1
Disclaimer Forward-Looking Statements This presentation may contain “forward-looking statements” within the meaning of the Private Securities Litigation Reform Act of 1995 that involve significant risks, assumptions, and uncertainties, including statements relating to the market opportunity and future business prospects of Stifel Financial Corp., as well as Stifel, Nicolaus & Company, Incorporated and its subsidiaries (collectively, “SF” or the “Company”). These statements can be identified by the use of the words “may,” “will,” “should,” “could,” “would,” “plan,” “potential,” “estimate,” “project,” “believe,” “intend,” “anticipate,” “expect,” and similar expressions. In particular, these statements may refer to our goals, intentions, and expectations, our business plans and growth strategies, our ability to integrate and manage our acquired businesses, estimates of our risks and future costs and benefits, and forecasted demographic and economic trends relating to our industry. You should not place undue reliance on any forward-looking statements, which speak only as of the date they were made. We will not update these forward-looking statements, even though our situation may change in the future, unless we are obligated to do so under federal securities laws. Actual results may differ materially and reported results should not be considered as an indication of future performance. Factors that could cause actual results to differ are included in the Company’s annual and quarterly reports and from time to time in other reports filed by the Company with the Securities and Exchange Commission and include, among other things, changes in general economic and business conditions, actions of competitors, regulatory and legal actions, changes in legislation, and technology changes. Use of Non-GAAP Financial Measures The Company utilized certain non-GAAP calculations as additional measures to aid in understanding and analyzing the Company’s financial results for the nine months ended September 30, 2020. Specifically, the Company believes that the non-GAAP measures provide useful information by excluding certain items that may not be indicative of the Company’s core operating results and business outlook. The Company believes that these non-GAAP measures will allow for a better evaluation of the operating performance of the business and facilitate a meaningful comparison of the Company’s results in the current period to those in prior and future periods. Reference to these non-GAAP measures should not be considered as a substitute for results that are presented in a manner consistent with GAAP. These non-GAAP measures are provided to enhance investors' overall understanding of the Company’s current financial performance. The non-GAAP financial information should be considered in addition to, not as a substitute for or as being superior to, operating income, cash flows, or other measures of financial performance prepared in accordance with GAAP. These non-GAAP measures primarily exclude expenses which management believes are, in some instances, non-recurring and not representative of ongoing business. A limitation of utilizing these non-GAAP measures is that the GAAP accounting effects of these charges do, in fact, reflect the underlying financial results of the Company’s business and these effects should not be ignored in evaluating and analyzing its financial results. Therefore, the Company believes that GAAP measures and the same respective non-GAAP measures of the Company’s financial performance should be considered together.
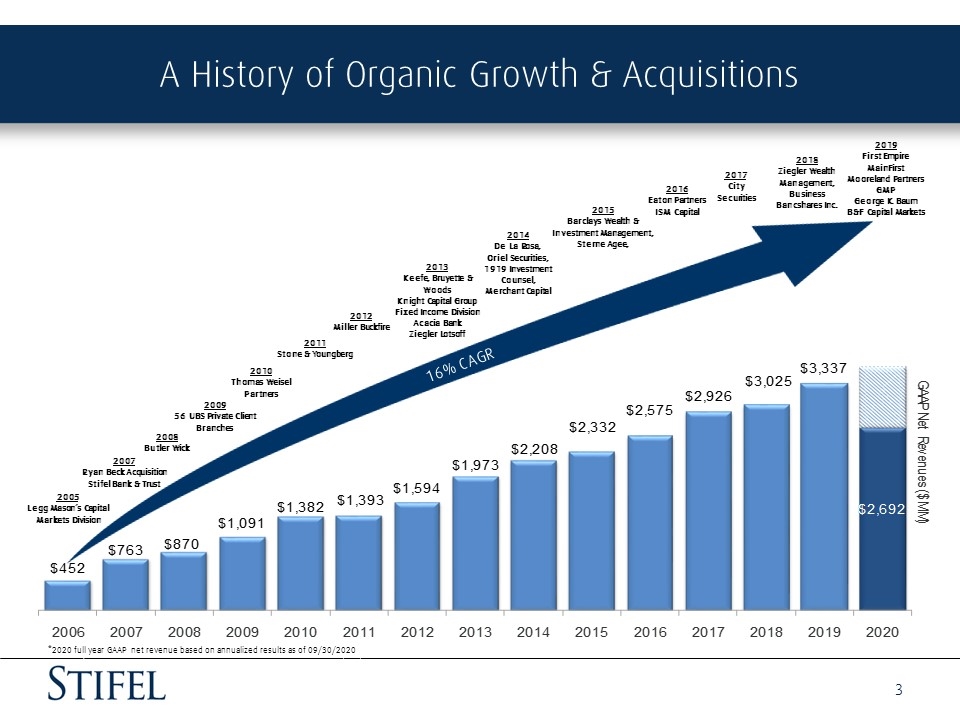
A History of Organic Growth & Acquisitions 16% CAGR 2005 Legg Mason’s Capital Markets Division 2007 Ryan Beck Acquisition Stifel Bank & Trust 2008 Butler Wick 2009 56 UBS Private Client Branches 2010 Thomas Weisel Partners 2011 Stone & Youngberg 2012 Miller Buckfire 2013 Keefe, Bruyette & Woods Knight Capital Group Fixed Income Division Acacia Bank Ziegler Lotsoff 2014 De La Rosa, Oriel Securities, 1919 Investment Counsel, Merchant Capital 2015 Barclays Wealth & Investment Management, Sterne Agee, 2016 Eaton Partners ISM Capital 2017 City Securities 2018 Ziegler Wealth Management, Business Bancshares Inc. 2019 First Empire MainFirst Mooreland Partners GMP George K. Baum B&F Capital Markets * 2019 full year GAAP net revenues based on annualized results as of 9/30/19. *2020 full year GAAP net revenue based on annualized results as of 09/30/2020
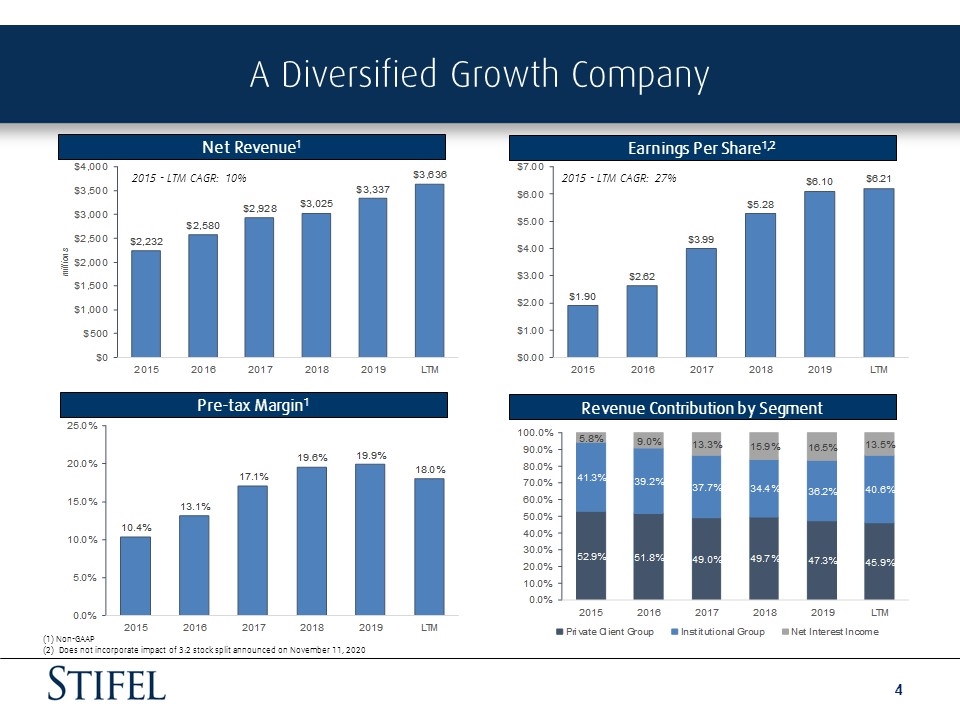
A Diversified Growth Company Net Revenue1 Earnings Per Share1,2 Pre-tax Margin1 Revenue Contribution by Segment (1) Non-GAAP (2) Does not incorporate impact of 3:2 stock split announced on November 11, 2020 2015 - LTM CAGR: 10% 2015 - LTM CAGR: 27%
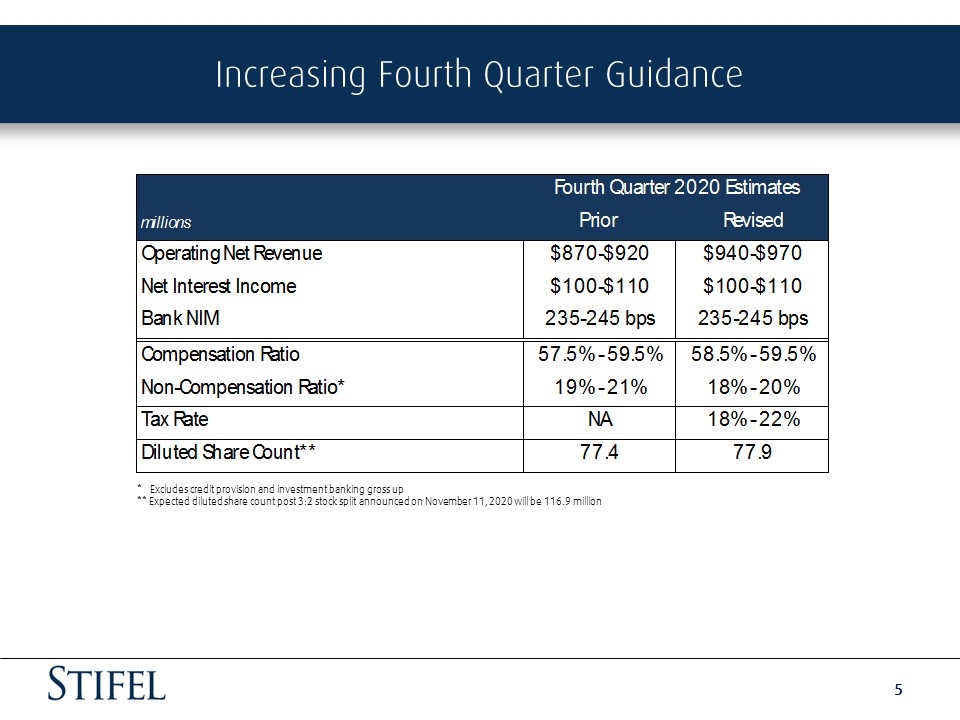
Increasing Fourth Quarter Guidance * Excludes credit provision and investment banking gross up ** Expected diluted share count post 3:2 stock split announced on November 11, 2020 will be 116.9 million
Business Overview
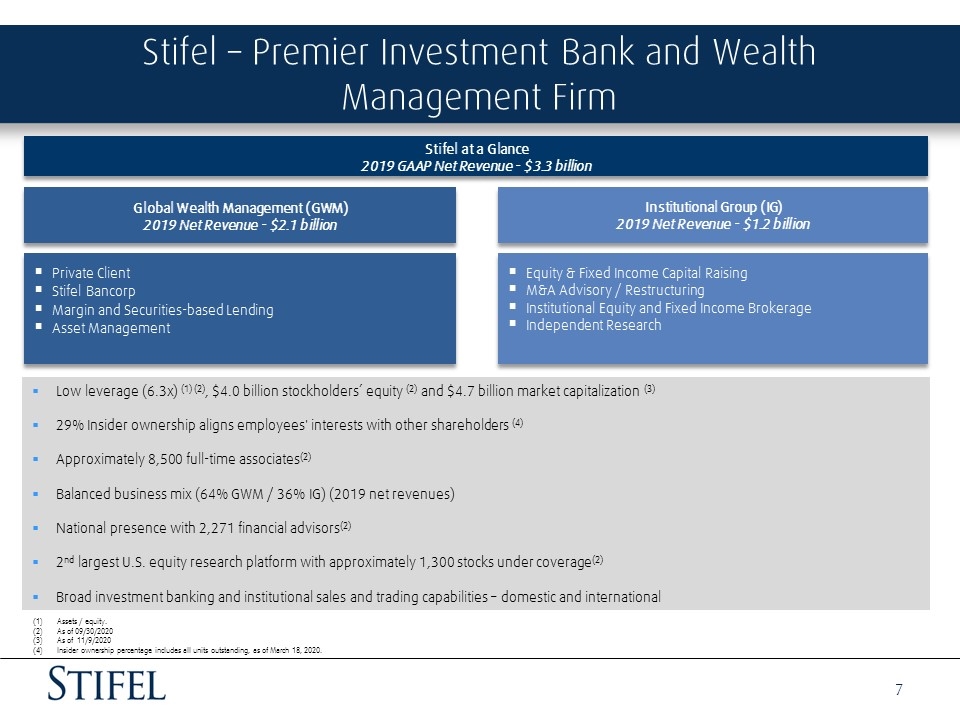
Stifel – Premier Investment Bank and Wealth Management Firm Stifel at a Glance 2019 GAAP Net Revenue - $3.3 billion Global Wealth Management (GWM) 2019 Net Revenue - $2.1 billion Institutional Group (IG) 2019 Net Revenue - $1.2 billion Private Client Stifel Bancorp Margin and Securities-based Lending Asset Management Equity & Fixed Income Capital Raising M&A Advisory / Restructuring Institutional Equity and Fixed Income Brokerage Independent Research Low leverage (6.3x) (1) (2), $4.0 billion stockholders’ equity (2) and $4.7 billion market capitalization (3) 29% Insider ownership aligns employees' interests with other shareholders (4) Approximately 8,500 full-time associates(2) Balanced business mix (64% GWM / 36% IG) (2019 net revenues) National presence with 2,271 financial advisors(2) 2nd largest U.S. equity research platform with approximately 1,300 stocks under coverage(2) Broad investment banking and institutional sales and trading capabilities – domestic and international Assets / equity. As of 09/30/2020 As of 11/9/2020 Insider ownership percentage includes all units outstanding, as of March 18, 2020.
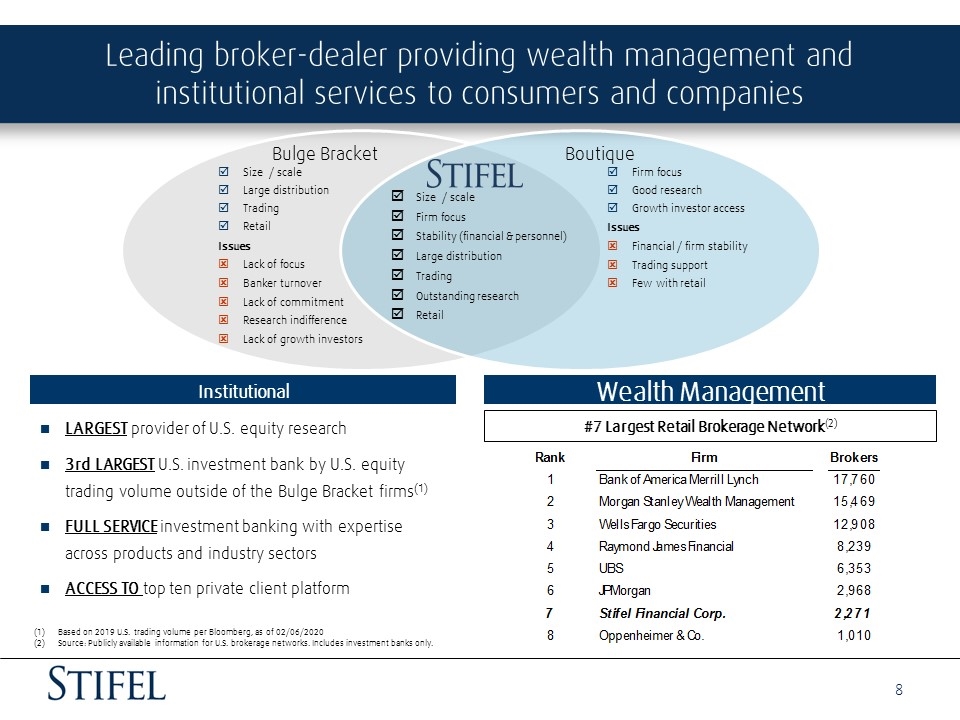
Leading broker-dealer providing wealth management and institutional services to consumers and companies Bulge Bracket Boutique Size / scale Large distribution Trading Retail Issues Lack of focus Banker turnover Lack of commitment Research indifference Lack of growth investors Firm focus Good research Growth investor access Issues Financial / firm stability Trading support Few with retail Size / scale Firm focus Stability (financial & personnel) Large distribution Trading Outstanding research Retail Institutional Wealth Management LARGEST provider of U.S. equity research 3rd LARGEST U.S. investment bank by U.S. equity trading volume outside of the Bulge Bracket firms(1) FULL SERVICE investment banking with expertise across products and industry sectors ACCESS TO top ten private client platform #7 Largest Retail Brokerage Network(2) Based on 2019 U.S. trading volume per Bloomberg, as of 02/06/2020 Source: Publicly available information for U.S. brokerage networks. Includes investment banks only.
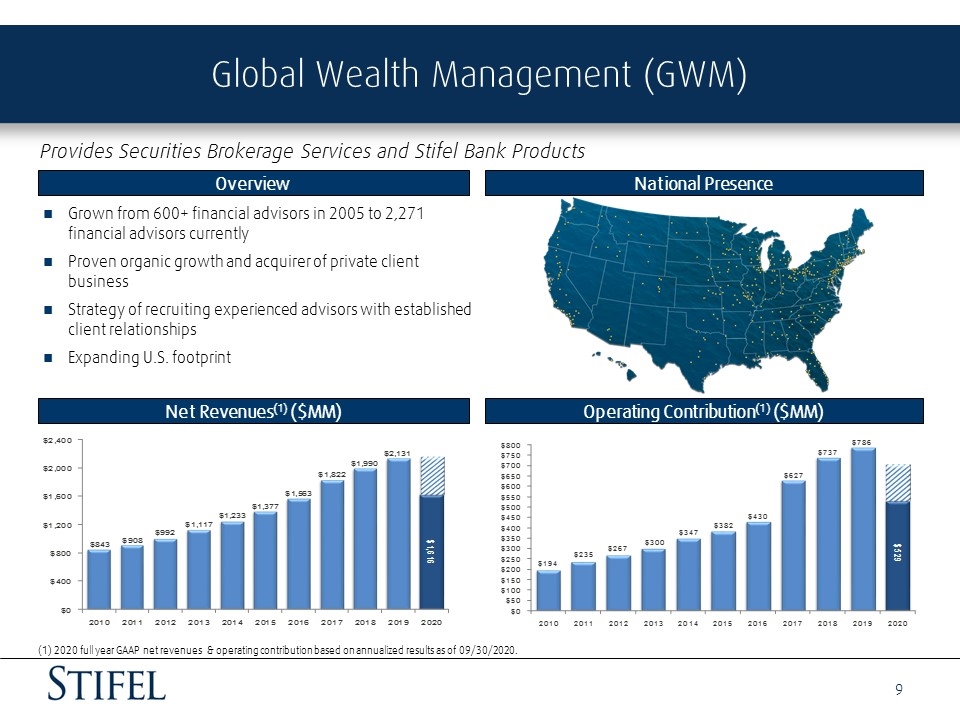
Global Wealth Management (GWM) Provides Securities Brokerage Services and Stifel Bank Products Overview National Presence Grown from 600+ financial advisors in 2005 to 2,271 financial advisors currently Proven organic growth and acquirer of private client business Strategy of recruiting experienced advisors with established client relationships Expanding U.S. footprint Net Revenues(1) ($MM) Operating Contribution(1) ($MM) 2017 full year net revenue and operating contribution based on annualized results as of 9/30/2017 2018 full year results based on annualized result as of 9/30/2018 (1) 2020 full year GAAP net revenues & operating contribution based on annualized results as of 09/30/2020.
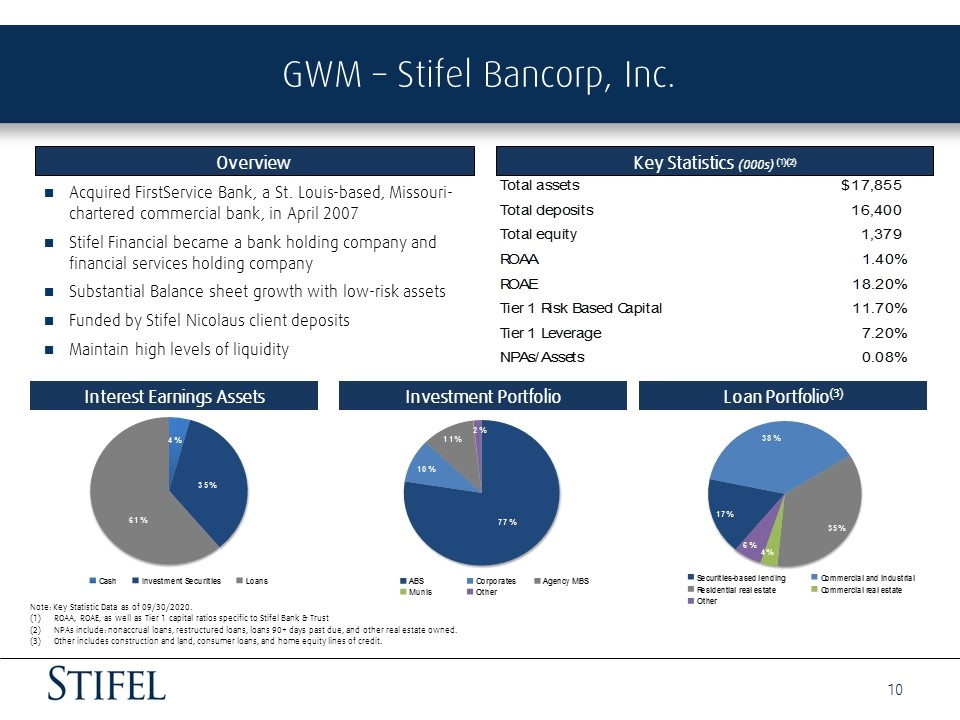
GWM – Stifel Bancorp, Inc. Acquired FirstService Bank, a St. Louis-based, Missouri-chartered commercial bank, in April 2007 Stifel Financial became a bank holding company and financial services holding company Substantial Balance sheet growth with low-risk assets Funded by Stifel Nicolaus client deposits Maintain high levels of liquidity Overview Key Statistics (000s) (1)(2) Investment Portfolio Loan Portfolio(3) Interest Earnings Assets Note: Key Statistic Data as of 09/30/2020. ROAA, ROAE, as well as Tier 1 capital ratios specific to Stifel Bank & Trust NPAs include: nonaccrual loans, restructured loans, loans 90+ days past due, and other real estate owned. Other includes construction and land, consumer loans, and home equity lines of credit.
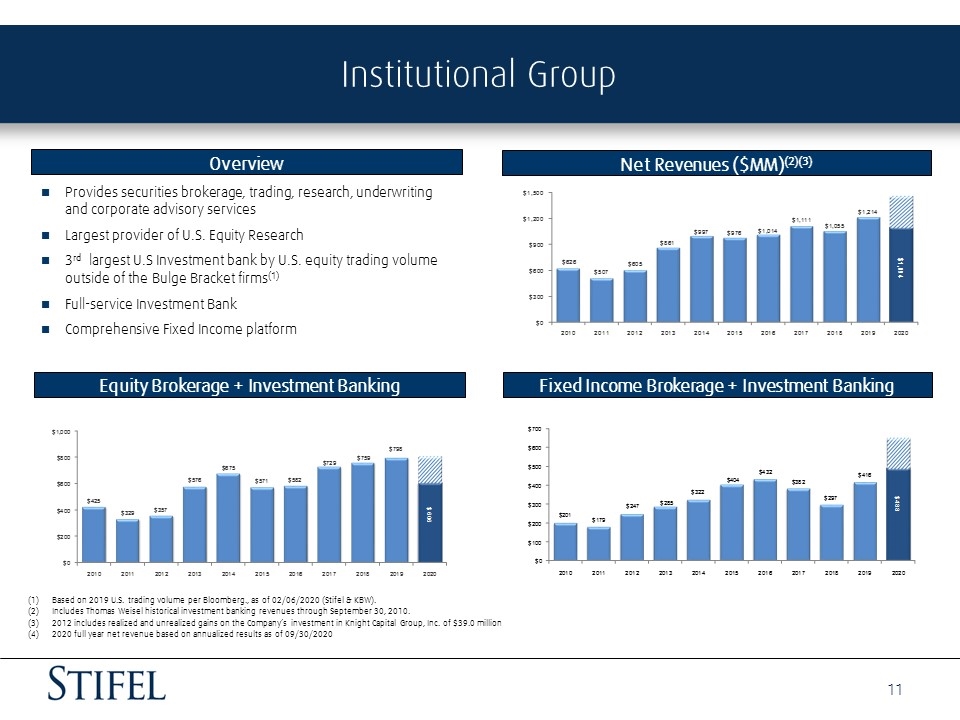
Institutional Group Net Revenues ($MM)(2)(3) Fixed Income Brokerage + Investment Banking Overview Equity Brokerage + Investment Banking Provides securities brokerage, trading, research, underwriting and corporate advisory services Largest provider of U.S. Equity Research 3rd largest U.S Investment bank by U.S. equity trading volume outside of the Bulge Bracket firms(1) Full-service Investment Bank Comprehensive Fixed Income platform Based on 2019 U.S. trading volume per Bloomberg., as of 02/06/2020 (Stifel & KBW). Includes Thomas Weisel historical investment banking revenues through September 30, 2010. 2012 includes realized and unrealized gains on the Company’s investment in Knight Capital Group, Inc. of $39.0 million 2020 full year net revenue based on annualized results as of 09/30/2020 2019 full year net revenues based on annualized net revenue as of 9/30/2019