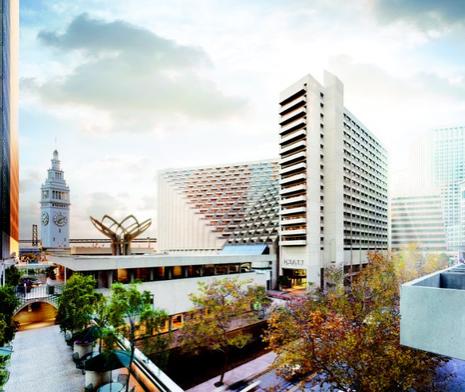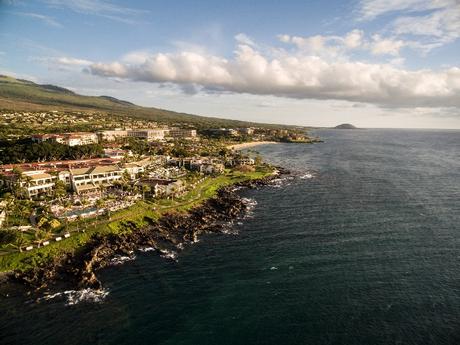
0001295810false0001295810us-gaap:SeriesFPreferredStockMember2021-05-032021-05-030001295810us-gaap:SeriesEPreferredStockMember2021-05-032021-05-030001295810us-gaap:CommonStockMember2021-05-032021-05-0300012958102021-05-032021-05-03


UNITED STATES

SECURITIES AND EXCHANGE COMMISSION

Washington, D.C. 20549

FORM 8-K

CURRENT REPORT

PURSUANT TO SECTION 13 OR 15(d) OF THE SECURITIES EXCHANGE ACT OF 1934

Date of Report (Date of earliest event reported): May 3, 2021

Sunstone Hotel Investors, Inc.

(Exact Name of Registrant as Specified in Its Charter)

​

​

​

​

​

​


Maryland


001-32319


20-1296886

(State or Other Jurisdiction of
Incorporation or Organization)


(Commission File Number)


(I.R.S. Employer
Identification Number)

​

​

​

​

200 Spectrum Center Drive, 21st Floor
Irvine, California


92618

(Address of Principal Executive Offices)


(Zip Code)

​

(949) 330-4000

(Registrant’s telephone number including area code)

​

N/A

(Former Name or Former Address, if Changed Since Last Report)

Check the appropriate box below if the Form 8-K filing is intended to simultaneously satisfy the filing obligation of the registrant under any of the following provisions:

​

​

☐

Written communications pursuant to Rule 425 under the Securities Act (17 CFR 230.425)

☐

Soliciting material pursuant to Rule 14a-12 under the Exchange Act (17 CFR 240.14a-12)

☐

Pre-commencement communications pursuant to Rule 14d-2(b) under the Exchange Act (17 CFR 240.14d-2(b))

☐

Pre-commencement communications pursuant to Rule 13e-4(c) under the Exchange Act (17 CFR 240.13e-4(c))

​

​

​

​

Securities registered pursuant to Section 12(b) of the Act:

​

​

Title of Each Class

Trading Symbol(s)

Name of Each Exchange on Which Registered

Common Stock, $0.01 par value

SHO

New York Stock Exchange

Series E Cumulative Redeemable Preferred Stock, $0.01 par value

SHO.PRE

New York Stock Exchange

Series F Cumulative Redeemable Preferred Stock, $0.01 par value

SHO.PRF

New York Stock Exchange

​

Indicate by check mark whether the registrant is an emerging growth company as defined in Rule 405 of the Securities Act of 1933 (§230.405 of this chapter) or Rule 12b-2 of the Securities Exchange Act of 1934 (§240.12b-2 of this chapter).

​

​

​

​

Emerging growth company

☐

​

If an emerging growth company, indicate by checkmark if the registrant has elected not to use the extended transition period for complying with any new or revised financial accounting standards provided pursuant to Section 13(a) of the Exchange Act.  ◻

​

​

​

​

​

Item 2.02.Results of Operations and Financial Condition.

​

On May 3, 2021, Sunstone Hotel Investors, Inc. (the “Company”) issued a press release regarding its financial results for the first quarter ended March 31, 2021. The press release referred to supplemental financial information that is available on the Company’s website, free of charge, at www.sunstonehotels.com. A copy of the press release and the supplemental financial information are attached hereto as Exhibits 99.1 and 99.2, respectively, and are incorporated herein by this reference.

​

The information furnished pursuant to this Item 2.02, including Exhibit 99.1 and Exhibit 99.2, shall not be deemed “filed” for purposes of Section 18 of the Securities Exchange Act of 1934, as amended (the “Exchange Act”), or otherwise subject to the liabilities under that Section, and shall not be deemed to be incorporated by reference into any filing of the Company under the Securities Act of 1933, as amended, or the Exchange Act, regardless of any general incorporation language in such filing.

​

​

​

Item 9.01.Financial Statements and Exhibits.

​

(d) The following exhibits are furnished herewith:

​

EXHIBIT INDEX

​

​

​

​

Exhibit No.


Description

99.1

​

Press Release, dated May 3, 2021.

99.2

​

Supplemental Financial Information for the first quarter ended March 31, 2021.

104

​

Cover Page Interactive Data File (embedded within the Inline XBRL document).

​

​

​

​

​

SIGNATURE

Pursuant to the requirements of the Securities Exchange Act of 1934, the Registrant has duly caused this report to be signed on its behalf by the undersigned thereunto duly authorized.

​

​

​

​

​

​


Sunstone Hotel Investors, Inc.

​

​

​

Date: May 3, 2021

​

By:

/s/ Bryan A. Giglia

​

​

​

Bryan A. Giglia
(Principal Financial Officer and Duly Authorized Officer)

​

​

​

​

​

​

​

​

​

​

​

​

​

​

Exhibit 99.1

2007 Logo Med

For Additional Information:

Bryan Giglia

Sunstone Hotel Investors, Inc.

(949) 382-3036

​

Aaron Reyes

Sunstone Hotel Investors, Inc.

(949) 382-3018

​

SUNSTONE HOTEL INVESTORS REPORTS RESULTS FOR FIRST QUARTER 2021

​

​

IRVINE, CA – May 3, 2021 – Sunstone Hotel Investors, Inc. (the “Company” or “Sunstone”) (NYSE: SHO), the owner of Long-Term Relevant Real Estate® in the hospitality sector, today announced results for the first quarter ended March 31, 2021.

​

First Quarter 2021 Operational Results (as compared to First Quarter 2020):

​

●Resumption of Hotel Operations: 15 of the Company’s 17 hotels were in operation for the entirety of the first quarter 2021.
●Net Loss: Net loss was $55.3 million as compared to $162.5 million.
●17 Hotel Portfolio RevPAR: 17 Hotel Portfolio RevPAR decreased 69.5% to $42.19.
●Adjusted EBITDAre: Adjusted EBITDAre, excluding noncontrolling interest decreased 203.7% to $(14.7) million.
●Adjusted FFO: Adjusted FFO attributable to common stockholders per diluted share decreased 1,200.0% to $(0.13).

​

Information regarding the non-GAAP financial measures disclosed in this release is provided below in “Non-GAAP Financial Measures.” Reconciliations of non-GAAP financial measures to the most comparable GAAP measure for each of the periods presented are included later in this release.

​

John Arabia, President and Chief Executive Officer, stated, “In the first quarter, our portfolio achieved sequential monthly growth in occupancy, ADR and RevPAR, and our March portfolio results materially exceeded our expectations and achieved breakeven EBITDA. Leisure demand is exceptionally strong and is expected to remain above pre-pandemic levels at many of our hotels for the foreseeable future. Furthermore, the nascent recovery in both commercial transient demand and traditional group business that started in the fourth quarter of 2020 is gaining steam and is expected to accelerate meaningfully in the second half of 2021 as vaccination distribution expands and state restrictions continue to ease. Several group functions have already transpired, and meeting planners remain confident that additional events will be held in the coming months at several of our hotels. The steady and robust increase in transient reservations and the material rebound in group production give us greater confidence that our portfolio is likely to experience rapid growth in revenues and profits as the year progresses.”

​

Mr. Arabia continued, “Consistent with our stated tactics, we have deployed a portion of our excess liquidity to fund the early-cycle acquisition of Montage Healdsburg, which is a spectacular resort, ideally located in one of the most sought-after and highest-rated leisure destinations in the U.S. The resort, which took over 15 years to develop, is a perfect example of Long-Term Relevant Real Estate, and its addition elevates the overall quality and growth prospects of our portfolio. Leveraging our industry relationships, we acquired the resort on an off-market basis and at a discount to what it would cost to develop today. Additionally, we funded 25% of the transaction with attractively structured perpetual preferred equity issued directly to the seller that aligns our interests and gives us additional optionality. With a strong balance sheet and a growing deal pipeline, we would expect Montage Healdsburg to be the first of several acquisitions of LTRR to be completed over the early stages of this new operating cycle.”

​

​

1


Unaudited Selected Statistical and Financial Data ($ in millions, except RevPAR, ADR and per share amounts)

​

​

​

​

​

​

​

​

​

​

​

Quarter Ended March 31,

​

2021


2020


Change

​

​

​

​

​

​

​

​

​

Net Loss

$

(55.3)

​

$

(162.5)

​

66.0

%

Loss Attributable to Common Stockholders per Diluted Share

$

(0.26)

​

$

(0.75)

​

65.3

%

​

​

​

​

​

​

​

​

​

17 Hotel Portfolio RevPAR (1)

$

42.19

​

$

138.54

​

(69.5)

%

​

​

​

​

​

​

​

​

​

17 Hotel Portfolio Occupancy (1)

​

21.6

%  

​

59.6

%  

(3,800)

bps

17 Hotel Portfolio ADR (1)

$

195.32

​

$

232.45

​

(16.0)

%

​

​

​

​

​

​

​

​

​

17 Hotel Portfolio Adjusted EBITDAre Margin (1) (2)

​

(32.5)

%  

​

13.1

%  

(4,560)

bps

​

​

​

​

​

​

​

​

​

Adjusted EBITDAre, excluding noncontrolling interest

$

(14.7)

​

$

14.1

​

(203.7)

%

Adjusted FFO Attributable to Common Stockholders

$

(28.9)

​

$

(1.4)

​

(1,961.2)

%

Adjusted FFO Attributable to Common Stockholders per Diluted Share

$

(0.13)

​

$

(0.01)

​

(1,200.0)

%

​

(1)The 17 Hotel Portfolio (the “17 Hotels”) includes all hotels owned by the Company as of March 31, 2021.
(2)The 17 Hotel Portfolio Adjusted EBITDAre Margins exclude prior year property tax adjustments, net.

​

Recent Developments

​

COVID-19: On April 1, 2021, the Hilton Garden Inn Chicago Downtown/Magnificent Mile, whose operations were temporarily suspended in March 2020 due to the COVID-19 pandemic, resumed operations. As of the date of this release, operations remain temporarily suspended at only the Renaissance Westchester (see table below).

​

Since the Company’s COVID-19-related occupancy low point of 1.6% in April 2020, the Company has experienced slow but steady improvements in hotel demand. During January, February and March 2021, as the number of COVID-19 cases decreased and the vaccine distribution program increased, occupancy at the 17 Hotels accelerated to 13.3%, 22.4% and 29.1%, respectively. In March 2021, the Embassy Suites La Jolla, the Oceans Edge Resort & Marina, the Renaissance Washington DC and the Wailea Beach Resort all achieved occupancies greater than 50.0%. The Company also experienced demand increases, most significantly in leisure travel over the President’s Day weekend and during Spring Break, at its hotels in Long Beach, New Orleans, Orlando and San Diego.

​

Leisure demand continues to accelerate and business transient and group demand, which have been slower to return, are both demonstrating positive growth. While the preponderance of recent group business has been composed primarily of government, emergency management and medical-related groups, several of our hotels have begun to host traditional group business, including corporate groups. In March 2021, both the Renaissance Orlando at SeaWorld® and the Wailea Beach Resort hosted traditional group events attracting attendance above their contracted levels. The Company is beginning to see events with more guests and events that take place over longer periods of time. A significant portion of the group business on-the-books for the second half of 2021 continues to hold to their contractual program dates, anticipating a continued improvement in conditions allowing for groups to meet. The Company believes that the return of traditional business transient and group business will ultimately depend on the speed and efficacy of the vaccine distribution and the degree to which that allows the Company to return to normal. The Company expects the demand recovery to extend past 2021, and it is encouraged by the recent pace of future group bookings, which leads the Company to believe that its portfolio will perform materially better in the second half of 2021 and specifically in the fourth quarter of 2021.

​

Acquisition: On April 22, 2021, the Company acquired the fee-simple interest in the 130-room Montage Healdsburg (the “Resort”). The newly constructed luxury Resort, which was completed in December 2020, was acquired for a gross purchase price of $265.0 million. The acquisition was funded with cash on hand and through the direct issuance of $66.25 million of Series G Cumulative Redeemable Preferred Stock (the “Series G preferred stock”) to the seller of the Resort. The Series G preferred stock, which is callable at the liquidation preference plus accrued and unpaid dividends by the Company at any time, will accrue dividends at an initial rate equal to the Resort’s annual net operating income yield on the Company’s investment in the Resort. The Series G preferred stock is not convertible into any other security. The Resort will continue to be managed by Montage Hotels & Resorts.

​

2


Montage Healdsburg sits adjacent to the separately owned Montage Residences Healdsburg, which, together with the Resort, comprise a 258-acre destination. Montage Residences Healdsburg will feature 40 to-be-built luxury homes that will be eligible to participate in the optional turn-key resort rental program. The seller of the Resort will continue to own and be responsible for the development and sales of Montage Residences Healdsburg.

​

Capital Investments: The Company invested $6.5 million into its portfolio during the first quarter ended March 31, 2021. In 2021, the Company expects to invest approximately $70 million to $80 million.

​

​

Balance Sheet/Liquidity Update

​

As of March 31, 2021, the Company had $365.3 million of cash and cash equivalents, including restricted cash of $45.0 million, total assets of $2.9 billion, including $2.4 billion of net investments in hotel properties, total consolidated debt of $747.1 million and stockholders’ equity of $2.0 billion. Adjusting for the cash used to fund the acquisition of Montage Healdsburg, pro forma cash and cash equivalents, including restricted cash, would have been $166.5 million as of March 31, 2021.

​

Operations Update

​

As of March 31, 2021 and through the date of this release, the status of the Company’s 17 Hotels owned at the end of the first quarter is as follows:

​

​

​

​

​

​

​

​

​

​

Hotel

​

Number of Rooms

​

% of Total Rooms

​

Suspension Date

​

Resumption Date

Boston Park Plaza (1)

​

1,060

​

11.8%

​

N/A

​

N/A

Embassy Suites La Jolla (1)

​

340

​

3.8%

​

N/A

​

N/A

Renaissance Long Beach (1)

​

374

​

4.1%

​

N/A

​

N/A

Oceans Edge Resort & Marina

​

175

​

1.9%

​

March 22, 2020

​

June 4, 2020

Embassy Suites Chicago

​

368

​

4.1%

​

April 1, 2020

​

July 1, 2020

Marriott Boston Long Wharf

​

415

​

4.6%

​

March 12, 2020

​

July 7, 2020

Hilton New Orleans St. Charles

​

252

​

2.8%

​

March 28, 2020

​

July 13, 2020

Hyatt Centric Chicago Magnificent Mile

​

419

​

4.6%

​

April 6, 2020

​

July 13, 2020

JW Marriott New Orleans

​

501

​

5.6%

​

March 28, 2020

​

July 14, 2020

Hilton San Diego Bayfront

​

1,190

​

13.2%

​

March 23, 2020

​

August 11, 2020

Renaissance Washington DC

​

807

​

8.9%

​

March 26, 2020

​

August 24, 2020

Hyatt Regency San Francisco

​

821

​

9.1%

​

March 22, 2020

​

October 1, 2020

Renaissance Orlando at SeaWorld®

​

781

​

8.7%

​

March 20, 2020

​

October 1, 2020

The Bidwell Marriott Portland

​

258

​

2.9%

​

March 27, 2020

​

October 5, 2020

Wailea Beach Resort

​

547

​

6.1%

​

March 25, 2020

​

November 1, 2020

Total of 15 Open Hotels

​

8,308

​

92.1%

​

​

​

​

​

​

​

​

​

​

​

​

​

Hilton Garden Inn Chicago Downtown/Magnificent Mile

​

361

​

4.0%

​

March 27, 2020

​

April 1, 2021

Renaissance Westchester

​

348

​

3.9%

​

April 4, 2020

​

​

Total of 2 Hotels with Suspended Operations

​

709

​

7.9%

​

​

​

​

​

(1)The Boston Park Plaza, Embassy Suites La Jolla and Renaissance Long Beach remained in operation throughout 2020.

​

Operating statistics for the 15 hotels that were open during all of the first quarter of 2021 are as follows:

​

​

​

​

​

​

​

​

​

​

​

​

​

​

​

​

​

​

​

​

January

​

February

​

March

​

First Quarter

​

​

2021

​

2021

​

2021

​

2021

15 Hotels Open the Entire First Quarter of 2021

​

​

​

​

​

​

​

​

​

​

​

​

​

​

​

​

Number of Hotels

​

​

15

​

​

​

15

​

​

​

15

​

​

​

15

​

Number of Rooms

​

​

8,308

​

​

​

8,308

​

​

​

8,308

​

​

​

8,308

​

RevPAR

​

$

26.83

​

​

$

45.78

​

​

$

64.71

​

​

$

45.70

​

Occupancy

​

​

14.4

%

​

​

24.4

%

​

​

31.6

%

​

​

23.4

%

Average Daily Rate

​

$

186.33

​

​

$

187.61

​

​

$

204.78

​

​

$

195.32

​

​

​

​

​

​

​

​

​

​

​

​

​

​

​

​

​

​

​

3


Preliminary April 2021 results for the first 28 days of the month for the 16 hotels open during the entire period and the Montage Healdsburg include the following ($ in millions, except RevPAR and ADR):

​

​

​

​

​

​

​

​

​

​

​

​

April

​

2021 (1)

​

2020

​

Change

16 Open Hotels Room Revenue

$

19.4

​

$

0.5

​

​

4,039.9

%

​

​

​

​

​

​

​

​

​

​

16 Open Hotels RevPAR

$

79.90

​

$

1.75

​

​

4,465.7

%

16 Open Hotels Occupancy

​

39.1

%

​

1.6

%

​

3,750

bps

16 Open Hotels ADR

$

204.35

​

$

109.20

​

​

87.1

%

​

​

​

​

​

​

​

​

​

​

Montage Healdsburg Room Revenue (2)

$

1.8

​

​

N/A

​

​

N/A

​

​

​

​

​

​

​

​

​

​

​

Montage Healdsburg RevPAR (2)

$

502.91

​

​

N/A

​

​

N/A

​

Montage Healdsburg Occupancy (2)

​

54.7

%

​

N/A

​

​

N/A

​

Montage Healdsburg ADR (2)

$

919.39

​

​

N/A

​

​

N/A

​

​

​

​

​

​

​

​

​

​

​

(1)April 2021 results are preliminary and may be adjusted during the Company’s month-end close process.
(2)Montage Healdsburg was acquired by the Company on April 22, 2021. Includes prior ownership results obtained by the Company from the prior owner of Montage Healdsburg during the due diligence period before acquiring the hotel. The Company performed a limited review of the information as part of its analysis of the acquisition. The newly developed hotel opened in December 2020; therefore, there is no prior year information.

​

Due to continued uncertainty regarding the duration and extent of the COVID-19 pandemic, the Company cannot provide further assurances regarding the pandemic’s effect on the Company’s results, and the Company does not intend to provide further updates unless deemed appropriate.

​

Dividend Update

​

On April 30, 2021, the Company’s Board of Directors declared cash dividends of $0.434375 per share payable to its Series E cumulative redeemable preferred stockholders and $0.403125 per share payable to its Series F cumulative redeemable preferred stockholders. The dividends will be paid on July 15, 2021 to stockholders of record as of June 30, 2021. On April 30, 2021, the Company’s Board of Directors also declared a cash dividend of $0.110259 per share payable to its Series G preferred stockholder. The dividends will be paid on July 15, 2021 to the stockholder of record as of June 30, 2021, and reflect a pro-rated amount for the days outstanding in the applicable dividend period.

​

The Company has suspended its quarterly common stock cash dividends. The resumption in quarterly common dividends will be determined by the Company’s Board of Directors after considering the Company’s obligations under its various financing agreements, projected taxable income, compliance with its debt covenants, long-term operating projections, expected capital requirements and risks affecting the Company’s business.

​

Supplemental Disclosures

​

Contemporaneous with this release, the Company has furnished a Form 8-K with unaudited financial information. This additional information is being provided as a supplement to the information in this release and other filings with the SEC. The Company has no obligation to update any of the information provided to conform to actual results or changes in the Company’s portfolio, capital structure or future expectations.

Earnings Call

​

The Company will host a conference call to discuss first quarter 2021 financial results on May 4, 2021, at 12:00 p.m. Eastern Time (9:00 a.m. Pacific Time). A live webcast of the call will be available via the Investor Relations section of the Company’s website at www.sunstonehotels.com. Alternatively, interested parties may dial 1-844-915-4230 and reference conference ID 5247223 to listen to the live call. A replay of the webcast will also be archived on the website.

About Sunstone Hotel Investors, Inc.

​

Sunstone Hotel Investors, Inc. is a lodging real estate investment trust (“REIT”) that as of the date of this release has interests in 18 hotels comprised of 9,147 rooms, the majority of which are operated under nationally recognized brands. Sunstone’s business is to acquire, own, asset manage and renovate or reposition hotels considered to be Long-Term Relevant Real Estate®. For further information, please visit Sunstone’s website at www.sunstonehotels.com.

4


​

Forward-Looking Statements

​

This press release contains forward-looking statements within the meaning of federal securities laws and regulations. These forward-looking statements are identified by their use of terms and phrases such as “anticipate,” “believe,” “continue,” “could,” “estimate,” “expect,” “intend,” “may,” “plan,” “predict,” “project,” “should,” “will” and other similar terms and phrases, including opinions, references to assumptions and forecasts of future results. Forward-looking statements are not guarantees of future performance and involve known and unknown risks, uncertainties and other factors that may cause the actual results to differ materially from those anticipated at the time the forward-looking statements are made. These risks include, but are not limited to: the impact the COVID-19 pandemic has on the Company’s business and the economy, as well as the response of governments and the Company to the pandemic, and how quickly and successfully effective vaccines and therapies are distributed and administered; increased risks related to employee matters, including increased employment litigation and claims for severance or other benefits tied to termination or furloughs as a result of temporary hotel suspensions or reduced hotel operations due to COVID-19; general economic and business conditions, including a U.S. recession, trade conflicts and tariffs, regional or global economic slowdowns and any type of flu or disease-related pandemic that impacts travel or the ability to travel, including COVID-19; the need for business-related travel, including the increased use of business-related technology; rising hotel operating costs due to labor costs, workers’ compensation and health-care related costs, utility costs, property and liability insurance costs, unanticipated costs such as acts of nature and their consequences and other costs that may not be offset by increased room rates; the ground, building or airspace leases for three of the hotels the Company has interests in as of the date of this release; the need for renovations, repositionings and other capital expenditures for the Company’s hotels; the impact, including any delays, of renovations and repositionings on hotel operations; new hotel supply, or alternative lodging options such as timeshare, vacation rentals or sharing services such as Airbnb, in the Company’s markets, which could harm its occupancy levels and revenue at its hotels; competition from hotels not owned by the Company; relationships with, and the requirements, performance and reputation of, the managers of the Company’s hotels; relationships with, and the requirements and reputation of, the Company’s franchisors and hotel brands; the Company’s hotels may become impaired, or its hotels which have previously become impaired may become further impaired in the future, which may adversely affect its financial condition and results of operations; competition for the acquisition of hotels, and the Company’s ability to complete acquisitions and dispositions; performance of hotels after they are acquired; changes in the Company’s business strategy or acquisition or disposition plans; the Company’s level of debt, including secured, unsecured, fixed and variable rate debt; financial and other covenants in the Company’s debt and preferred stock; the impact on the Company’s business of potential defaults by the Company on its debt agreements or leases; volatility in the capital markets and the effect on lodging demand or the Company’s ability to obtain capital on favorable terms or at all; the Company’s need to operate as a REIT and comply with other applicable laws and regulations, including new laws, interpretations or court decisions that may change the federal or state tax laws or the federal or state income tax consequences of the Company’s qualification as a REIT; potential adverse tax consequences in the event that the Company’s operating leases with its taxable REIT subsidiaries are not held to have been made on an arm’s-length basis; system security risks, data protection breaches, cyber-attacks, including those impacting the Company’s hotel managers or other third parties, and systems integration issues; other events beyond the Company’s control, including climate change, natural disasters, terrorist attacks or civil unrest; and other risks and uncertainties associated with the Company’s business described in its filings with the Securities and Exchange Commission. Although the Company believes the expectations reflected in such forward-looking statements are based upon reasonable assumptions, it can give no assurance that the expectations will be attained or that any deviation will not be material. All forward-looking information provided herein is as of the date of this release, and the Company undertakes no obligation to update any forward-looking statement to conform the statement to actual results or changes in the Company’s expectations.

​

This release should be read together with the consolidated financial statements and notes thereto included in our most recent reports on Form 10-K and Form 10-Q. Copies of these reports are available on our website at www.sunstonehotels.com and through the SEC’s Electronic Data Gathering Analysis and Retrieval System (“EDGAR”) at www.sec.gov.

​

Non-GAAP Financial Measures

​

We present the following non-GAAP financial measures that we believe are useful to investors as key supplemental measures of our operating performance: earnings before interest expense, taxes, depreciation and amortization for real estate, or EBITDAre; Adjusted EBITDAre, excluding noncontrolling interest (as defined below); funds from operations attributable to common stockholders, or FFO attributable to common stockholders; Adjusted FFO attributable to common stockholders (as defined below); hotel Adjusted EBITDAre; and hotel Adjusted EBITDAre margins. These measures should not be considered in isolation or as a substitute for measures of performance in accordance with GAAP. In addition, our calculation of these measures may not be comparable to other companies that do not define such terms exactly the same as the Company. These non-GAAP measures are used in addition to and in conjunction with results presented in accordance with GAAP. They should not be considered as alternatives to net income (loss), cash flow from operations, or any other operating performance measure prescribed by GAAP. These non-GAAP financial measures reflect additional ways of viewing our operations that we believe, when viewed with our GAAP results and the reconciliations to the corresponding GAAP financial measures, provide a more complete understanding of factors and trends affecting our business than

5


could be obtained absent this disclosure. We strongly encourage investors to review our financial information in its entirety and not to rely on a single financial measure.

​

We present EBITDAre in accordance with guidelines established by the National Association of Real Estate Investment Trusts (“NAREIT”), as defined in its September 2017 white paper “Earnings Before Interest, Taxes, Depreciation and Amortization for Real Estate.” We believe EBITDAre is a useful performance measure to help investors evaluate and compare the results of our operations from period to period in comparison to our peers. NAREIT defines EBITDAre as net income (calculated in accordance with GAAP) plus interest expense, income tax expense, depreciation and amortization, gains or losses on the disposition of depreciated property (including gains or losses on change in control), impairment write-downs of depreciated property and of investments in unconsolidated affiliates caused by a decrease in the value of depreciated property in the affiliate, and adjustments to reflect the entity’s share of EBITDAre of unconsolidated affiliates.

​

We make additional adjustments to EBITDAre when evaluating our performance because we believe that the exclusion of certain additional items described below provides useful information to investors regarding our operating performance, and that the presentation of Adjusted EBITDAre, excluding noncontrolling interest, when combined with the primary GAAP presentation of net income, is beneficial to an investor’s complete understanding of our operating performance. In addition, we use both EBITDAre and Adjusted EBITDAre, excluding noncontrolling interest as measures in determining the value of hotel acquisitions and dispositions.

​

We believe that the presentation of FFO attributable to common stockholders provides useful information to investors regarding our operating performance because it is a measure of our operations without regard to specified noncash items such as real estate depreciation and amortization, any real estate impairment loss and any gain or loss on sale of real estate assets, all of which are based on historical cost accounting and may be of lesser significance in evaluating our current performance. Our presentation of FFO attributable to common stockholders conforms to NAREIT’s definition of “FFO applicable to common shares.” Our presentation may not be comparable to FFO reported by other REITs that do not define the terms in accordance with the current NAREIT definition, or that interpret the current NAREIT definition differently than we do.

​

We also present Adjusted FFO attributable to common stockholders when evaluating our operating performance because we believe that the exclusion of certain additional items described below provides useful supplemental information to investors regarding our ongoing operating performance, and may facilitate comparisons of operating performance between periods and our peer companies.

​

We adjust EBITDAre and FFO attributable to common stockholders for the following items, which may occur in any period, and refer to these measures as either Adjusted EBITDAre, excluding noncontrolling interest or Adjusted FFO attributable to common stockholders:

​

●Amortization of favorable and unfavorable contracts: we exclude the noncash amortization of the favorable management contract asset recorded in conjunction with our acquisition of the Hilton Garden Inn Chicago Downtown/Magnificent Mile, along with the unfavorable tenant lease contracts recorded in conjunction with our acquisitions of the Boston Park Plaza and the Hilton Garden Inn Chicago Downtown/Magnificent Mile. We exclude the noncash amortization of favorable and unfavorable contracts because it is based on historical cost accounting and is of lesser significance in evaluating our actual performance for the current period.

​

●Gains or losses from debt transactions: we exclude the effect of finance charges and premiums associated with the extinguishment of debt, including the acceleration of deferred financing costs from the original issuance of the debt being redeemed or retired because, like interest expense, their removal helps investors evaluate and compare the results of our operations from period to period by removing the impact of our capital structure.

​

●Acquisition costs: under GAAP, costs associated with acquisitions that meet the definition of a business are expensed in the year incurred. We exclude the effect of these costs because we believe they are not reflective of the ongoing performance of the Company or our hotels.

​

●Cumulative effect of a change in accounting principle: from time to time, the FASB promulgates new accounting standards that require the consolidated statement of operations to reflect the cumulative effect of a change in accounting principle. We exclude these one-time adjustments, which include the accounting impact from prior periods, because they do not reflect our actual performance for that period.

​

●Other adjustments: we exclude other adjustments that we believe are outside the ordinary course of business because we do not believe these costs reflect our actual performance for the period and/or the ongoing operations of our hotels. Such items may include: lawsuit settlement costs; prior year property tax assessments or credits; the write-off of development

6


costs associated with abandoned projects; property-level restructuring, severance and management transition costs; debt resolution costs; lease terminations; and property insurance proceeds or uninsured losses.

​

In addition, to derive Adjusted EBITDAre, excluding noncontrolling interest we exclude the noncontrolling partner’s pro rata share of the net (income) loss allocated to the Hilton San Diego Bayfront partnership, as well as the noncontrolling partner’s pro rata share of any EBITDAre and Adjusted EBITDAre components. We also exclude the noncash expense incurred with the amortization of deferred stock compensation as this expense is based on historical stock prices at the date of grant to our corporate employees and does not reflect the underlying performance of our hotels. In addition, we exclude the amortization of our right-of-use assets and liabilities as these expenses are based on historical cost accounting and do not reflect the actual rent amounts due to the respective lessors or the underlying performance of our hotels. Additionally, we include an adjustment for the cash finance lease expense recorded on the building lease at the Hyatt Centric Chicago Magnificent Mile. We determined that the building lease is a finance lease, and, therefore, we include a portion of the lease payment each month in interest expense. We adjust EBITDAre for the finance lease in order to more accurately reflect the actual rent due to the hotel’s lessor in the current period, as well as the operating performance of the hotel. We also exclude the effect of gains and losses on the disposition of undepreciated assets because we believe that including them in Adjusted EBITDAre, excluding noncontrolling interest is not consistent with reflecting the ongoing performance of our assets.

​

To derive Adjusted FFO attributable to common stockholders, we also exclude the noncash interest on our derivatives and finance lease obligation, as we believe that these items are not reflective of our ongoing finance costs. Additionally, we exclude the noncontrolling partner’s pro rata share of any FFO adjustments related to our consolidated Hilton San Diego Bayfront partnership. We also exclude the real estate amortization of our right-of-use assets and liabilities, which includes the amortization of both our finance and operating lease intangibles (with the exception of our corporate operating lease), as these expenses are based on historical cost accounting and do not reflect the actual rent amounts due to the respective lessors or the underlying performance of our hotels. In addition, we exclude changes to deferred tax assets, liabilities or valuation allowances, and income tax benefits or provisions associated with the application of net operating loss carryforwards, uncertain tax positions or with the sale of assets other than real estate investments.

​

In presenting hotel Adjusted EBITDAre and hotel Adjusted EBITDAre margins, miscellaneous non-hotel items have been excluded. We believe the calculation of hotel Adjusted EBITDAre results in a more accurate presentation of the hotel Adjusted EBITDAre margins for our hotels, and that these non-GAAP financial measures are useful to investors in evaluating our property-level operating performance.

​

Reconciliations of net loss to EBITDAre, Adjusted EBITDAre, excluding noncontrolling interest, FFO attributable to common stockholders, Adjusted FFO attributable to common stockholders, hotel Adjusted EBITDAre and hotel Adjusted EBITDAre margins are set forth in the following pages of this release.

7


Sunstone Hotel Investors, Inc.

Consolidated Balance Sheets

(In thousands, except share data)

​

​

​

​

​

​

​

​

​

​

​

March 31,

​

December 31,


2021


2020

​

​

(unaudited)

​

​

Assets

​

​

​

​

​

​

Current assets:

​

​

​

​

​

​

Cash and cash equivalents

​

$

320,275

​

$

368,406

Restricted cash

​

​

44,982

​

​

47,733

Accounts receivable, net

​

​

13,163

​

​

8,566

Prepaid expenses and other current assets

​

​

11,434

​

​

10,440

Total current assets

​

​

389,854

​

​

435,145

​

​

​

​

​

​

​

Investment in hotel properties, net

​

​

2,439,963

​

​

2,461,498

Finance lease right-of-use asset, net

​

​

45,814

​

​

46,182

Operating lease right-of-use assets, net

​

​

25,196

​

​

26,093

Deferred financing costs, net

​

​

3,879

​

​

4,354

Other assets, net

​

​

11,968

​

​

12,445

​

​

​

​

​

​

​

Total assets

​

$

2,916,674

​

$

2,985,717

​

​

​

​

​

​

​

Liabilities and Equity

​

​

​

​

​

​

Current liabilities:

​

​

​

​

​

​

Accounts payable and accrued expenses

​

$

34,292

​

$

37,326

Accrued payroll and employee benefits

​

​

13,435

​

​

15,392

Dividends and distributions payable

​

​

3,207

​

​

3,208

Other current liabilities

​

​

31,013

​

​

32,606

Current portion of notes payable, net

​

​

2,295

​

​

2,261

Total current liabilities

​

​

84,242

​

​

90,793

​

​

​

​

​

​

​

Notes payable, less current portion, net

​

​

741,922

​

​

742,528

Finance lease obligation, less current portion

​

​

15,569

​

​

15,569

Operating lease obligations, less current portion

​

​

28,649

​

​

29,954

Other liabilities

​

​

14,679

​

​

17,494

Total liabilities

​

​

885,061

​

​

896,338

​

​

​

​

​

​

​

Commitments and contingencies

​

​

​

​

​

​

​

​

​

​

​

​

​

Equity:

​

​

​

​

​

​

Stockholders' equity:

​

​

​

​

​

​

Preferred stock, $0.01 par value, 100,000,000 shares authorized:

​

​

​

​

​

​

6.95% Series E Cumulative Redeemable Preferred Stock, 4,600,000 shares issued and outstanding at March 31, 2021 and December 31, 2020, stated at liquidation preference of $25.00 per share

​

​

115,000

​

​

115,000

6.45% Series F Cumulative Redeemable Preferred Stock, 3,000,000 shares issued and outstanding at March 31, 2021 and December 31, 2020, stated at liquidation preference of $25.00 per share

​

​

75,000

​

​

75,000

Common stock, $0.01 par value, 500,000,000 shares authorized, 216,175,084 shares issued and outstanding at March 31, 2021 and 215,593,401 shares issued and outstanding at December 31, 2020

​

​

2,162

​

​

2,156

Additional paid in capital

​

​

2,585,455

​

​

2,586,108

Retained earnings

​

​

860,454

​

​

913,766

Cumulative dividends and distributions

​

​

(1,646,593)

​

​

(1,643,386)

Total stockholders' equity

​

​

1,991,478

​

​

2,048,644

Noncontrolling interest in consolidated joint venture

​

​

40,135

​

​

40,735

Total equity

​

​

2,031,613

​

​

2,089,379

​

​

​

​

​

​

​

Total liabilities and equity

​

$

2,916,674

​

$

2,985,717

​

8


Sunstone Hotel Investors, Inc.

Unaudited Consolidated Statements of Operations

(In thousands, except per share data)

​

​

​

​

​

​

​

​

​

​

​

Quarter Ended March 31,

​


2021


2020

​

​

​

Revenues

​

​

​

​

​

​

Room

​

$

34,219

​

$

127,400

Food and beverage

​

​

4,971

​

​

47,990

Other operating

​

​

11,443

​

​

15,822

Total revenues

​

​

50,633

​

​

191,212

Operating expenses

​

​

​

​

​

​

Room

​

​

11,640

​

​

44,245

Food and beverage

​

​

5,979

​

​

41,760

Other operating

​

​

1,805

​

​

3,764

Advertising and promotion

​

​

4,875

​

​

12,462

Repairs and maintenance

​

​

5,545

​

​

10,049

Utilities

​

​

4,151

​

​

5,842

Franchise costs

​

​

991

​

​

5,336

Property tax, ground lease and insurance

​

​

14,661

​

​

20,051

Other property-level expenses

​

​

10,477

​

​

28,845

Corporate overhead

​

​

7,177

​

​

7,394

Depreciation and amortization

​

​

30,770

​

​

36,746

Impairment losses

​

​

—

​

​

115,366

Total operating expenses

​

​

98,071

​

​

331,860

Interest and other income (loss)

​

​

(379)

​

​

2,306

Interest expense

​

​

(7,649)

​

​

(17,507)

Gain on extinguishment of debt

​

​

222

​

​

—

Loss before income taxes

​

​

(55,244)

​

​

(155,849)

Income tax provision, net

​

​

(43)

​

​

(6,670)

Net loss

​

​

(55,287)

​

​

(162,519)

Loss from consolidated joint venture attributable to noncontrolling interest

​

​

1,975

​

​

458

Preferred stock dividends

​

​

(3,207)

​

​

(3,207)

Loss attributable to common stockholders

​

$

(56,519)

​

$

(165,268)

​

​

​

​

​

​

​

Basic and diluted per share amounts:

​

​

​

​

​

​

Basic and diluted loss attributable to common stockholders per common share

​

$

(0.26)

​

$

(0.75)

​

​

​

​

​

​

​

Basic and diluted weighted average common shares outstanding

​

​

214,438

​

​

221,036

​

​

​

​

​

​

​

Distributions declared per common share

​

$

—

​

$

0.05

​

​

9


Sunstone Hotel Investors, Inc.

Reconciliation of Net Loss to Non-GAAP Financial Measures

(Unaudited and in thousands)

​

Reconciliation of Net Loss to EBITDAre and Adjusted EBITDAre, Excluding Noncontrolling Interest

​

​

​

​

​

​

​

​

​

​

​

Quarter Ended March 31,

​


2021


2020

​

​

​

​

​

​

​

Net loss

​

$

(55,287)

​

$

(162,519)

Operations held for investment:

​

​

​

​

​

​

Depreciation and amortization

​

​

30,770

​

​

36,746

Interest expense

​

​

7,649

​

​

17,507

Income tax provision, net

​

​

43

​

​

6,670

Loss on sale of assets

​

​

70

​

​

—

Impairment losses - hotel properties

​

​

—

​

​

113,064

EBITDAre

​

​

(16,755)

​

​

11,468

​

​

​

​

​

​

​

Operations held for investment:

​

​

​

​

​

​

Amortization of deferred stock compensation

​

​

2,752

​

​

2,207

Amortization of right-of-use assets and liabilities

​

​

(331)

​

​

(261)

Finance lease obligation interest - cash ground rent

​

​

(351)

​

​

(351)

Gain on extinguishment of debt

​

​

(222)

​

​

—

Prior year property tax adjustments, net

​

​

(827)

​

​

(81)

Impairment loss - abandoned development costs

​

​

—

​

​

2,302

Noncontrolling interest:

​

​

​

​

​

​

Loss from consolidated joint venture attributable to noncontrolling interest

​

​

1,975

​

​

458

Depreciation and amortization

​

​

(810)

​

​

(804)

Interest expense

​

​

(161)

​

​

(420)

Amortization of right-of-use asset and liability

​

​

72

​

​

72

Impairment loss - abandoned development costs

​

​

—

​

​

(449)

Adjustments to EBITDAre, net

​

​

2,097

​

​

2,673

​

​

​

​

​

​

​

Adjusted EBITDAre, excluding noncontrolling interest

​

$

(14,658)

​

$

14,141

​

​

​

​

​

​

​

​

​

10


Sunstone Hotel Investors, Inc.

Reconciliation of Net Loss to Non-GAAP Financial Measures

(Unaudited and in thousands, except per share amounts)

​

Reconciliation of Net Loss to FFO Attributable to Common Stockholders and

Adjusted FFO Attributable to Common Stockholders

​

​

​

​

​

​

​

​

​

​

Quarter Ended March 31,

​

​

2021


2020

​

​

​

​

​

​

​

Net loss


$

(55,287)


$

(162,519)

Preferred stock dividends

​

​

(3,207)

​

​

(3,207)

Operations held for investment:

​

​

​

​

​

​

Real estate depreciation and amortization

​

​

30,143

​

​

36,122

Loss on sale of assets

​

​

70

​

​

—

Impairment losses - hotel properties

​

​

—

​

​

113,064

Noncontrolling interest:

​

​

​

​

​

​

Loss from consolidated joint venture attributable to noncontrolling interest

​

​

1,975

​

​

458

Real estate depreciation and amortization

​

​

(810)

​

​

(804)

FFO attributable to common stockholders

​

​

(27,116)

​

​

(16,886)

​

​

​

​

​

​

​

Operations held for investment:

​

​

​

​

​

​

Real estate amortization of right-of-use assets and liabilities

​

​

85

​

​

146

Noncash interest on derivatives

​

​

(869)

​

​

6,080

Gain on extinguishment of debt

​

​

(222)

​

​

—

Prior year property tax adjustments, net

​

​

(827)

​

​

(81)

Impairment loss - abandoned development costs

​

​

—

​

​

2,302

Noncash income tax provision, net

​

​

—

​

​

7,415

Noncontrolling interest:

​

​

​

​

​

​

Real estate amortization of right-of-use asset and liability

​

​

72

​

​

72

Impairment loss - abandoned development costs

​

​

—

​

​

(449)

Adjustments to FFO attributable to common stockholders, net

​

​

(1,761)

​

​

15,485

​

​

​

​

​

​

​

Adjusted FFO attributable to common stockholders

​

$

(28,877)

​

$

(1,401)

​

​

​

​

​

​

​

FFO attributable to common stockholders per diluted share

​

$

(0.13)

​

$

(0.08)

​

​

​

​

​

​

​

Adjusted FFO attributable to common stockholders per diluted share

​

$

(0.13)

​

$

(0.01)

​

​

​

​

​

​

​

Basic weighted average shares outstanding

​

​

214,438

​

​

221,036

Shares associated with unvested restricted stock awards

​

​

210

​

​

—

Diluted weighted average shares outstanding

​

​

214,648

​

​

221,036

​

​

​

​

11


Sunstone Hotel Investors, Inc.

Non-GAAP Financial Measures

Hotel Adjusted EBITDAre and Margins

(Unaudited and in thousands)

​

​

​

​

​

​

​

​

​

​

​

​

Quarter Ended March 31,

​

​

​

2021

​

2020

​

​

​

​

​

​

​

​

​

17 Hotel Portfolio Adjusted EBITDAre Margin, excluding prior year property tax adjustments, net (1)

​

​

(32.5)%

​

​

13.1%

​

​

​

​

​

​

​

​

​

​

​

​

​

​

​

​

​

Total revenues

​

$

50,633

​

$

191,212

​

Non-hotel revenues (2)

​

​

(22)

​

​

(22)

​

Reimbursements to offset net losses (3)

​

​

(4,041)

​

​

—

​

Total Actual Hotel Revenues

​

​

46,570

​

​

191,190

​

Sold/Disposed hotel revenues (4)

​

​

—

​

​

(19,170)

​

Total 17 Hotel Portfolio Revenues

​

$

46,570

​

$

172,020

​

​

​

​

​

​

​

​

​

​

​

​

​

​

​

​

​

Net loss

​

$

(55,287)

​

$

(162,519)

​

Non-hotel revenues (2)

​

​

(22)

​

​

(22)

​

Reimbursements to offset net losses (3)

​

​

(4,041)

​

​

—

​

Non-hotel operating expenses, net (5)

​

​

(1,564)

​

​

(533)

​

Property-level legal fees (6)

​

​

58

​

​

—

​

Property-level prior year property tax adjustments, net (7)

​

​

(72)

​

​

(81)

​

Taxes assessed on commercial rents (8)

​

​

—

​

​

136

​

Corporate overhead

​

​

7,177

​

​

7,394

​

Depreciation and amortization

​

​

30,770

​

​

36,746

​

Impairment losses

​

​

—

​

​

115,366

​

Interest and other (income) loss

​

​

379

​

​

(2,306)

​

Interest expense

​

​

7,649

​

​

17,507

​

Gain on extinguishment of debt

​

​

(222)

​

​

—

​

Income tax provision, net

​

​

43

​

​

6,670

​

Actual Hotel Adjusted EBITDAre

​

​

(15,132)

​

​

18,358

​

Sold/Disposed hotel Adjusted EBITDAre (4)

​

​

—

​

​

4,163

​

17 Hotel Portfolio Adjusted EBITDAre, excluding prior year property tax adjustments, net

​

$

(15,132)

​

$

22,521

​

​

​

*Footnotes on following page

12


​

(1)17 Hotel Portfolio Adjusted EBITDAre Margin, excluding prior year property tax adjustments, net is calculated as 17 Hotel Portfolio Adjusted EBITDAre, excluding prior year property tax adjustments, net divided by Total 17 Hotel Portfolio Revenues.
(2)Non-hotel revenues include the amortization of unfavorable tenant lease contracts recorded in conjunction with the Company's acquisitions of the Boston Park Plaza and the Hilton Garden Inn Chicago Downtown/Magnificent Mile.
(3)Reimbursements to offset net losses for the first quarters of 2021 and 2020 include $4.0 million and zero, respectively, at the Hyatt Regency San Francisco as stipulated by the hotel’s operating lease agreement.
(4)Sold/Disposed hotel includes hotel revenues and Adjusted EBITDAre generated during the Company's ownership period for the Renaissance Harborplace and the Renaissance Los Angeles Airport, sold in July 2020 and December 2020, respectively, along with the Hilton Times Square, which was assigned to the hotel’s mortgage holder in December 2020.
(5)Non-hotel operating expenses, net include the following: the amortization of hotel real estate-related right-of-use assets and liabilities; the amortization of a favorable management agreement; finance lease obligation interest - cash ground rent; and prior year property tax credits, net received in the first quarter of 2021 for the Renaissance Los Angeles Airport.
(6)Property-level legal fees include $0.1 million at the Renaissance Westchester.
(7)Property-level prior year property tax adjustments, net for the first quarter of 2021 include a credit of $0.1 million received by the Renaissance Washington DC. Property-level prior year property tax adjustments, net for the first quarter of 2020 include total net credits of $0.1 million received by the Embassy Suites Chicago and the Renaissance Harborplace.
(8)Taxes assessed on commercial rents for the first quarters of 2021 and 2020 include zero and $0.1 million, respectively, at the Hyatt Regency San Francisco.

13


Exhibit 99.2

Graphic

Supplemental Financial Information
May 3, 2021

​

​

​

​

​

Graphic

Graphic

​

​

Graphic

Graphic

Graphic

​

Graphic

Graphic

Graphic

Graphic

Graphic

Supplemental Financial Information

For the quarter ended March 31, 2021

May 3, 2021

​

Graphic

​

​

​


​

Graphic

Supplemental Financial Information
May 3, 2021

Table of Contents

​

​

​

​

​

​

​

​

​

CORPORATE PROFILE, FINANCIAL DISCLOSURES, AND SAFE HARBOR

3

About Sunstone

4

Forward-Looking Statement

5

Non-GAAP Financial Measures

6

CORPORATE FINANCIAL INFORMATION

9

Condensed Consolidated Balance Sheets Q1 2021 – Q1 2020

10

Consolidated Statements of Operations Q1 2021/2020

12

Reconciliation of Net Loss to EBITDAre and Adjusted EBITDAre, Excluding Noncontrolling Interest Q1 2021/2020

13

Reconciliation of Net Loss to FFO and Adjusted FFO Attributable to Common Stockholders Q1 2021/2020

14

Pro Forma Consolidated Statements of Operations Q1 2021 – Q2 2020, FY 2020

15

Pro Forma Consolidated Statements of Operations Q4 2019 – Q1 2019, FY 2019

16

Pro Forma Reconciliation of Net Loss to EBITDAre, Adjusted EBITDAre, Excluding Noncontrolling Interest, FFO and Adjusted FFO Attributable to Common Stockholders FY 2020

17

Pro Forma Reconciliation of Net Income to EBITDAre, Adjusted EBITDAre, Excluding Noncontrolling Interest, FFO and Adjusted FFO Attributable to Common Stockholders FY 2019

20

CAPITALIZATION

23

Comparative Capitalization Q1 2021 – Q1 2020

24

Consolidated Debt Summary Schedule

25

Consolidated Amortization and Debt Maturity Schedule as of March 31, 2021

26

PROPERTY-LEVEL DATA

27

Hotel Information as of May 3, 2021

28

​

​

​

​

Graphic

Graphic

BPP-Lobby-Bar

​

Wailea Beach Resort Slide

Graphic

Graphic

Graphic

Outside Shot

​

​


​

Graphic

Supplemental Financial Information
May 3, 2021

Table of Contents

​

​

​

​

​

​

​

​

​

PROPERTY-LEVEL OPERATING STATISTICS

29

Property-Level Operating Statistics Q1 2021/2020

30

Property-Level Operating Statistics Q1 2021/2019

31

Property-Level Operating Statistics January 2021/2020

32

Property-Level Operating Statistics January 2021/2019

33

Property-Level Operating Statistics February 2021/2020

34

Property-Level Operating Statistics February 2021/2019

35

Property-Level Operating Statistics March 2021/2020

36

Property-Level Operating Statistics March 2021/2019

37

PROPERTY-LEVEL ADJUSTED EBITDAre & ADJUSTED EBITDAre MARGINS

39

Property-Level Adjusted EBITDAre & Adjusted EBITDAre Margins Q1 2021

40

Property-Level Adjusted EBITDAre & Adjusted EBITDAre Margins Q1 2020

41

Property-Level Adjusted EBITDAre & Adjusted EBITDAre Margins Q1 2019

42

Property-Level Adjusted EBITDAre & Adjusted EBITDAre Margins January 2021

43

Property-Level Adjusted EBITDAre & Adjusted EBITDAre Margins January 2020

44

Property-Level Adjusted EBITDAre & Adjusted EBITDAre Margins January 2019

45

Property-Level Adjusted EBITDAre & Adjusted EBITDAre Margins February 2021

46

Property-Level Adjusted EBITDAre & Adjusted EBITDAre Margins February 2020

47

Property-Level Adjusted EBITDAre & Adjusted EBITDAre Margins February 2019

48

Property-Level Adjusted EBITDAre & Adjusted EBITDAre Margins March 2021

49

Property-Level Adjusted EBITDAre & Adjusted EBITDAre Margins March 2020

50

Property-Level Adjusted EBITDAre & Adjusted EBITDAre Margins March 2019

51

​

​

​

​

​

Graphic

Graphic

BPP-Lobby-Bar

​

Wailea Beach Resort Slide

Graphic

Graphic

Graphic

Outside Shot

​

​

​

​


​

Graphic

Supplemental Financial Information
May 3, 2021

​

CORPORATE PROFILE, FINANCIAL DISCLOSURES,
AND SAFE HARBOR

​

​

​

​

​

​

​

​

​

CORPORATE PROFILE, FINANCIAL DISCLOSURES, AND SAFE HARBOR

​

Page 3

​

​

​

Graphic

Graphic

BPP-Lobby-Bar

​

Wailea Beach Resort Slide

Graphic

Graphic

Graphic

Outside Shot

​

​

​

​


​

Graphic

Supplemental Financial Information
May 3, 2021

​

About Sunstone

Sunstone Hotel Investors, Inc. (the “Company,” “we,” and “our”) (NYSE: SHO) is a lodging real estate investment trust (“REIT”) that as of May 3, 2021 has interests in 18 hotels comprised of 9,147 rooms, the majority of which are operated under nationally recognized brands. Sunstone’s business is to acquire, own, asset manage and renovate or reposition hotels that the Company considers to be Long-Term Relevant Real Estate®.

As demand for lodging generally fluctuates with the overall economy, the Company seeks to own Long-Term Relevant Real Estate® that will maintain a high appeal with lodging travelers over long periods of time and will generate superior economic earnings materially in excess of recurring capital requirements. Sunstone’s strategy is to maximize stockholder value through focused asset management and disciplined capital recycling, which is likely to include selective acquisitions and dispositions, while maintaining balance sheet flexibility and strength. Sunstone’s goal is to maintain appropriate leverage and financial flexibility to position the Company to create value throughout all phases of the operating and financial cycles.

​

Corporate Headquarters
200 Spectrum Center Drive, 21st Floor
Irvine, CA 92618
(949) 330-4000

Company Contacts
John Arabia
President and Chief Executive Officer
(949) 382-3008

Bryan Giglia
Executive Vice President and Chief Financial Officer
(949) 382-3036

Aaron Reyes
Senior Vice President, Corporate Finance and Treasurer
(949) 382-3018

​

CORPORATE PROFILE, FINANCIAL DISCLOSURES, AND SAFE HARBOR

​

Page 4

​

​

​

Graphic

Graphic

BPP-Lobby-Bar

​

Wailea Beach Resort Slide

Graphic

Graphic

Graphic

Outside Shot

​

​

​


​

Graphic

Supplemental Financial Information
May 3, 2021

Forward-Looking Statement

This presentation contains forward-looking statements within the meaning of federal securities laws and regulations. These forward-looking statements are identified by their use of terms and phrases such as “anticipate,” “believe,” “continue,” “could,” “estimate,” “expect,” “intend,” “may,” “plan,” “predict,” “project,” “should,” “will” and other similar terms and phrases, including opinions, references to assumptions and forecasts of future results. Forward-looking statements are not guarantees of future performance and involve known and unknown risks, uncertainties and other factors that may cause the actual results to differ materially from those anticipated at the time the forward-looking statements are made. These risks include, but are not limited to: the impact the COVID-19 pandemic has on the Company’s business and the economy, as well as the response of governments and the Company to the pandemic, and how quickly and successfully effective vaccines and therapies are distributed and administered; increased risks related to employee matters, including increased employment litigation and claims for severance or other benefits tied to termination or furloughs as a result of temporary hotel suspensions or reduced hotel operations due to COVID-19; general economic and business conditions, including a U.S. recession, trade conflicts and tariffs, regional or global economic slowdowns and any type of flu or disease-related pandemic that impacts travel or the ability to travel, including the COVID-19 pandemic; the need for business-related travel, including the increased use of business-related technology; rising hotel operating costs due to labor costs, workers’ compensation and health-care related costs, utility costs, property and liability insurance costs, unanticipated costs such as acts of nature and their consequences and other costs that may not be offset by increased room rates; the ground, building or airspace leases for three of the hotels the Company has interests in as of the date of this presentation; the need for renovations, repositionings and other capital expenditures for the Company’s hotels; the impact, including any delays, of renovations and repositionings on hotel operations; new hotel supply, or alternative lodging options such as timeshare, vacation rentals or sharing services such as Airbnb, in the Company’s markets, which could harm its occupancy levels and revenue at its hotels; competition from hotels not owned by the Company; relationships with, and the requirements, performance and reputation of, the managers of the Company’s hotels; relationships with, and the requirements and reputation of, the Company’s franchisors and hotel brands; the Company’s hotels may become impaired, or its hotels which have previously become impaired may become further impaired in the future, which may adversely affect its financial condition and results of operations; competition for the acquisition of hotels, and the Company’s ability to complete acquisitions and dispositions; performance of hotels after they are acquired; changes in the Company’s business strategy or acquisition or disposition plans; the Company’s level of debt, including secured, unsecured, fixed and variable rate debt; financial and other covenants in the Company’s debt and preferred stock; the impact on the Company’s business of potential defaults by the Company on its debt agreements or leases; volatility in the capital markets and the effect on lodging demand or the Company’s ability to obtain capital on favorable terms or at all; the Company’s need to operate as a REIT and comply with other applicable laws and regulations, including new laws, interpretations or court decisions that may change the federal or state tax laws or the federal or state income tax consequences of the Company’s qualification as a REIT; potential adverse tax consequences in the event that the Company’s operating leases with its taxable REIT subsidiaries are not held to have been made on an arm’s-length basis; system security risks, data protection breaches, cyber-attacks, including those impacting the Company’s hotel managers or other third parties, and systems integration issues; other events beyond the Company’s control, including climate change, natural disasters, terrorist attacks or civil unrest; and other risks and uncertainties associated with the Company’s business described in its filings with the Securities and Exchange Commission. Although the Company believes the expectations reflected in such forward-looking statements are based upon reasonable assumptions, it can give no assurance that the expectations will be attained or that any deviation will not be material. All forward-looking information provided herein is as of the date of this presentation, and the Company undertakes no obligation to update any forward-looking statement to conform the statement to actual results or changes in the Company’s expectations.

​

This presentation contains unaudited information, and should be read together with the consolidated financial statements and notes thereto included in our most recent reports on Form 10-K and Form 10-Q. Copies of these reports are available on our website at www.sunstonehotels.com and through the SEC’s Electronic Data Gathering Analysis and Retrieval System (“EDGAR”) at www.sec.gov.

​

​

​

CORPORATE PROFILE, FINANCIAL DISCLOSURES, AND SAFE HARBOR

​

Page 5

​

​

​

Graphic

Graphic

BPP-Lobby-Bar

​

Wailea Beach Resort Slide

Graphic

Graphic

Graphic

Outside Shot

​

​


​

Graphic

Supplemental Financial Information
May 3, 2021

Non-GAAP Financial Measures

We present the following non-GAAP financial measures that we believe are useful to investors as key supplemental measures of our operating performance: earnings before interest expense, taxes, depreciation and amortization for real estate, or EBITDAre; Adjusted EBITDAre, excluding noncontrolling interest (as defined below); funds from operations attributable to common stockholders, or FFO attributable to common stockholders; Adjusted FFO attributable to common stockholders (as defined below); hotel Adjusted EBITDAre; and hotel Adjusted EBITDAre margins. These measures should not be considered in isolation or as a substitute for measures of performance in accordance with GAAP. In addition, our calculation of these measures may not be comparable to other companies that do not define such terms exactly the same as the Company. These non-GAAP measures are used in addition to and in conjunction with results presented in accordance with GAAP. They should not be considered as alternatives to net income (loss), cash flow from operations, or any other operating performance measure prescribed by GAAP. These non-GAAP financial measures reflect additional ways of viewing our operations that we believe, when viewed with our GAAP results and the reconciliations to the corresponding GAAP financial measures, provide a more complete understanding of factors and trends affecting our business than could be obtained absent this disclosure. We strongly encourage investors to review our financial information in its entirety and not to rely on a single financial measure.

We present EBITDAre in accordance with guidelines established by the National Association of Real Estate Investment Trusts (“NAREIT”), as defined in its September 2017 white paper “Earnings Before Interest, Taxes, Depreciation and Amortization for Real Estate.” We believe EBITDAre is a useful performance measure to help investors evaluate and compare the results of our operations from period to period in comparison to our peers. NAREIT defines EBITDAre as net income (calculated in accordance with GAAP) plus interest expense, income tax expense, depreciation and amortization, gains or losses on the disposition of depreciated property (including gains or losses on change in control), impairment write-downs of depreciated property and of investments in unconsolidated affiliates caused by a decrease in the value of depreciated property in the affiliate, and adjustments to reflect the entity’s share of EBITDAre of unconsolidated affiliates.

We make additional adjustments to EBITDAre when evaluating our performance because we believe that the exclusion of certain additional items described below provides useful information to investors regarding our operating performance, and that the presentation of Adjusted EBITDAre, excluding noncontrolling interest, when combined with the primary GAAP presentation of net income, is beneficial to an investor’s complete understanding of our operating performance. In addition, we use both EBITDAre and Adjusted EBITDAre, excluding noncontrolling interest as measures in determining the value of hotel acquisitions and dispositions.

We believe that the presentation of FFO attributable to common stockholders provides useful information to investors regarding our operating performance because it is a measure of our operations without regard to specified noncash items such as real estate depreciation and amortization, any real estate impairment loss and any gain or loss on sale of real estate assets, all of which are based on historical cost accounting and may be of lesser significance in evaluating our current performance. Our presentation of FFO attributable to common stockholders conforms to NAREIT’s definition of “FFO applicable to common shares.” Our presentation may not be comparable to FFO reported by other REITs that do not define the terms in accordance with the current NAREIT definition, or that interpret the current NAREIT definition differently that we do.

​

​

CORPORATE PROFILE, FINANCIAL DISCLOSURES, AND SAFE HARBOR

​

Page 6

​

​

​

Graphic

Graphic

BPP-Lobby-Bar

​

Wailea Beach Resort Slide

Graphic

Graphic

Graphic

Outside Shot

​

​


​

Graphic

Supplemental Financial Information
May 3, 2021

​

​

We also present Adjusted FFO attributable to common stockholders when evaluating our operating performance because we believe that the exclusion of certain additional items described below provides useful supplemental information to investors regarding our ongoing operating performance, and may facilitate comparisons of operating performance between periods and our peer companies.

We adjust EBITDAre and FFO attributable to common stockholders for the following items, which may occur in any period, and refer to these measures as either Adjusted EBITDAre, excluding noncontrolling interest or Adjusted FFO attributable to common stockholders:

●Amortization of favorable and unfavorable contracts: we exclude the noncash amortization of the favorable management contract asset recorded in conjunction with our acquisition of the Hilton Garden Inn Chicago Downtown/Magnificent Mile, along with the favorable and unfavorable tenant lease contracts, as applicable, recorded in conjunction with our acquisitions of the Boston Park Plaza, the Hilton Garden Inn Chicago Downtown/Magnificent Mile, the Hyatt Regency San Francisco and the Wailea Beach Resort. We exclude the noncash amortization of favorable and unfavorable contracts because it is based on historical cost accounting and is of lesser significance in evaluating our actual performance for the current period.
●Gains or losses from debt transactions: we exclude the effect of finance charges and premiums associated with the extinguishment of debt, including the acceleration of deferred financing costs from the original issuance of the debt being redeemed or retired because, like interest expense, their removal helps investors evaluate and compare the results of our operations from period to period by removing the impact of our capital structure.
●Acquisition costs: under GAAP, costs associated with acquisitions that meet the definition of a business are expensed in the year incurred. We exclude the effect of these costs because we believe they are not reflective of the ongoing performance of the Company or our hotels.
●Cumulative effect of a change in accounting principle: from time to time, the FASB promulgates new accounting standards that require the consolidated statement of operations to reflect the cumulative effect of a change in accounting principle. We exclude these one-time adjustments, which include the accounting impact from prior periods, because they do not reflect our actual performance for that period.
●Other adjustments: we exclude other adjustments that we believe are outside the ordinary course of business because we do not believe these costs reflect our actual performance for the period and/or the ongoing operations of our hotels. Such items may include: lawsuit settlement costs; prior year property tax assessments or credits; the write-off of development costs associated with abandoned projects; property-level restructuring, severance and management transition costs; debt resolution costs; lease terminations; and property insurance proceeds or uninsured losses.

In addition, to derive Adjusted EBITDAre, excluding noncontrolling interest we exclude the noncontrolling partner’s pro rata share of the net (income) loss allocated to the Hilton San Diego Bayfront partnership, as well as the noncontrolling partner’s pro rata share of any EBITDAre and Adjusted EBITDAre components. We also exclude the noncash expense incurred with the amortization of deferred stock compensation as this expense is based on historical stock prices at the date of grant to our corporate employees and does not reflect the underlying performance of our hotels. In addition, we exclude the amortization of our right-of-use assets and liabilities as these expenses are based on historical cost accounting and do not reflect the actual rent amounts due to the respective lessors or the underlying performance of our hotels. Additionally, we include an adjustment for the cash

​

CORPORATE PROFILE, FINANCIAL DISCLOSURES, AND SAFE HARBOR

​

Page 7

​

​

​

Graphic

Graphic

BPP-Lobby-Bar

​

Wailea Beach Resort Slide

Graphic

Graphic

Graphic

Outside Shot

​

​


​

Graphic

Supplemental Financial Information
May 3, 2021

​

​

finance lease expenses recorded on the ground lease at the Courtyard by Marriott Los Angeles (prior to the hotel’s sale in October 2019) and the building lease at the Hyatt Centric Chicago Magnificent Mile. We determined that both of these leases are finance leases, and, therefore, we include a portion of the lease payments each month in interest expense. We adjust EBITDAre for these two finance leases in order to more accurately reflect the actual rent due to both hotels’ lessors in the current period, as well as the operating performance of both hotels. We also exclude the effect of gains and losses on the disposition of undepreciated assets because we believe that including them in Adjusted EBITDAre, excluding noncontrolling interest is not consistent with reflecting the ongoing performance of our assets.

To derive Adjusted FFO attributable to common stockholders, we also exclude the noncash interest on our derivatives and finance lease obligations as we believe that these items are not reflective of our ongoing finance costs. Additionally, we exclude the noncontrolling partner’s pro rata share of any FFO adjustments related to our consolidated Hilton San Diego Bayfront partnership. We also exclude the real estate amortization of our right-of-use assets and liabilities, which includes the amortization of both our finance and operating lease intangibles (with the exception of our corporate operating lease), as these expenses are based on historical cost accounting and do not reflect the actual rent amounts due to the respective lessors or the underlying performance of our hotels. In addition, we exclude changes to deferred tax assets, liabilities or valuation allowances, and income tax benefits or provisions associated with the application of net operating loss carryforwards, uncertain tax positions or with the sale of assets other than real estate investments.

In presenting hotel Adjusted EBITDAre and hotel Adjusted EBITDAre margins, miscellaneous non-hotel items have been excluded. We believe the calculation of hotel Adjusted EBITDAre results in a more accurate presentation of the hotel Adjusted EBITDAre margins for our hotels, and that these non-GAAP financial measures are useful to investors in evaluating our property-level operating performance.

Reconciliations of net (loss) income to EBITDAre, Adjusted EBITDAre, excluding noncontrolling interest, FFO attributable to common stockholders, Adjusted FFO attributable to common stockholders, hotel Adjusted EBITDAre and hotel Adjusted EBITDAre margins are set forth in the following pages of this supplemental package.

The 17 Hotel Portfolio includes all hotels owned by the Company as of March 31, 2021. The 18 Hotel Pro Forma Portfolio includes the 17 Hotel Portfolio plus the Montage Healdsburg, acquired by the Company in April 2021.

​

​

​

​

​

​

​

​

​

​

CORPORATE PROFILE, FINANCIAL DISCLOSURES, AND SAFE HARBOR

​

Page 8

​

​

​

Graphic

Graphic

BPP-Lobby-Bar

​

Wailea Beach Resort Slide

Graphic

Graphic

Graphic

Outside Shot

​

​

​


​

​

Graphic

Supplemental Financial Information
May 3, 2021

​

CORPORATE FINANCIAL INFORMATION

​

​

​

​

​

​

​

​

​

​

​

​

​

​

​

​

CORPORATE FINANCIAL INFORMATION

​

Page 9

​

​

​

Graphic

Graphic

BPP-Lobby-Bar

​

Wailea Beach Resort Slide

Graphic

Graphic

Graphic

Outside Shot

​

​

​


​

Graphic

Supplemental Financial Information
May 3, 2021

​

Condensed Consolidated Balance Sheets
Q1 2021 – Q1 2020

​

​

​

​

​

​

​

​

​

​

​

​

​

​

​

​

​

​

(In thousands)

​

March 31, 2021 (1)

​

December 31, 2020 (2)

​

September 30, 2020 (3)

​

June 30, 2020 (4)

​

March 31, 2020 (5)

​

Assets


​

​

​

​

​


​


​


​


Investment in hotel properties:

​

​

​

​

​

​

​

​

​

​

​

​

​

​

​

​

Land

​

$

571,212

​

$

571,212

​

$

581,426

​

$

581,426

​

$

600,649

​

Buildings & improvements

​

​

2,527,654

​

​

2,523,750

​

​

2,707,102

​

​

2,694,935

​

​

2,800,187

​

Furniture, fixtures, & equipment

​

​

432,493

​

​

431,918

​

​

464,588

​

​

460,526

​

​

496,312

​

Other

​

​

41,868

​

​

37,766

​

​

64,880

​

​

72,775

​

​

71,327

​

​

​

​

3,573,227

​

​

3,564,646

​

​

3,817,996

​

​

3,809,662

​

​

3,968,475

​

Less accumulated depreciation & amortization

​

​

(1,133,264)

​

​

(1,103,148)

​

​

(1,196,520)

​

​

(1,164,181)

​

​

(1,212,063)

​

​

​

​

2,439,963

​

​

2,461,498

​

​

2,621,476

​

​

2,645,481

​

​

2,756,412

​

​

​

​

​

​

​

​

​

​

​

​

​

​

​

​

​

​

Finance lease right-of-use asset, net

​

​

45,814

​

​

46,182

​

​

46,549

​

​

46,917

​

​

47,284

​

Operating lease right-of-use assets, net

​

​

25,196

​

​

26,093

​

​

39,489

​

​

40,351

​

​

41,198

​

Other noncurrent assets, net

​

​

15,847

​

​

16,799

​

​

16,510

​

​

15,415

​

​

16,390

​

​

​

​

​

​

​

​

​

​

​

​

​

​

​

​

​

​

Current assets:

​

​

​

​

​

​

​

​

​

​

​

​

​

​

​

​

Cash and cash equivalents

​

​

320,275

​

​

368,406

​

​

461,288

​

​

540,420

​

​

847,445

​

Restricted cash

​

​

44,982

​

​

47,733

​

​

42,346

​

​

45,960

​

​

53,485

​

Other current assets, net

​

​

24,597

​

​

19,006

​

​

19,124

​

​

12,474

​

​

37,326

​

Assets held for sale, net

​

​

—

​

​

—

​

​

—

​

​

76,683

​

​

—

​

Total assets

​

$

2,916,674

​

$

2,985,717

​

$

3,246,782

​

$

3,423,701

​

$

3,799,540

​

​

*Footnotes on following page

​

​

​

​

​

​

​

​

​

​

​

CORPORATE FINANCIAL INFORMATION

​

Page 10

​

​

​

Graphic

Graphic

BPP-Lobby-Bar

​

Wailea Beach Resort Slide

Graphic

Graphic

Graphic

Outside Shot

​

​

​


​

Graphic

Supplemental Financial Information
May 3, 2021

​

Condensed Consolidated Balance Sheets
Q1 2021– Q1 2020 (continued)

​

​

​

​

​

​

​

​

​

​

​

​

​

​

​

​

​

​

​

(In thousands)

​

March 31, 2021 (1)

​

December 31, 2020 (2)

​

September 30, 2020 (3)

​

June 30, 2020 (4)

​

March 31, 2020 (5)

​

Liabilities


​

​

​

​

​


​


​


​


Current liabilities:

​

​

​

​

​

​

​

​

​

​

​

​

​

​

​

​

Current portion of notes payable, net

​

$

2,295

​

$

2,261

​

$

188,096

​

$

188,757

​

$

82,189

​

Other current liabilities

​

​

81,947

​

​

88,532

​

​

99,679

​

​

97,129

​

​

104,029

​

Total current liabilities

​

​

84,242

​

​

90,793

​

​

287,775

​

​

285,886

​

​

186,218

​

​

​

​

​

​

​

​

​

​

​

​

​

​

​

​

​

​

Notes payable, less current portion, net

​

​

741,922

​

​

742,528

​

​

743,545

​

​

829,673

​

​

1,187,468

​

Finance lease obligation, less current portion

​

​

15,569

​

​

15,569

​

​

15,569

​

​

15,570

​

​

15,570

​

Operating lease obligations, less current portion

​

​

28,649

​

​

29,954

​

​

45,939

​

​

47,206

​

​

48,460

​

Other liabilities

​

​

14,679

​

​

17,494

​

​

25,909

​

​

25,374

​

​

24,818

​

Total liabilities

​

​

885,061

​

​

896,338

​

​

1,118,737

​

​

1,203,709

​

​

1,462,534

​

​

​

​

​

​

​

​

​

​

​

​

​

​

​

​

​

​

Equity

​

​

​

​

​

​

​

​

​

​

​

​

​

​

​

​

Stockholders' equity:

​

​

​

​

​

​

​

​

​

​

​

​

​

​

​

​

6.95% Series E cumulative redeemable preferred stock

​

​

115,000

​

​

115,000

​

​

115,000

​

​

115,000

​

​

115,000

​

6.45% Series F cumulative redeemable preferred stock

​

​

75,000

​

​

75,000

​

​

75,000

​

​

75,000

​

​

75,000

​

Common stock, $0.01 par value, 500,000,000 shares authorized

​

​

2,162

​

​

2,156

​

​

2,156

​

​

2,156

​

​

2,155

​

Additional paid in capital

​

​

2,585,455

​

​

2,586,108

​

​

2,584,005

​

​

2,581,637

​

​

2,578,445

​

Retained earnings

​

​

860,454

​

​

913,766

​

​

951,765

​

​

1,041,056

​

​

1,156,394

​

Cumulative dividends and distributions

​

​

(1,646,593)

​

​

(1,643,386)

​

​

(1,640,178)

​

​

(1,636,970)

​

​

(1,633,763)

​

Total stockholders' equity

​

​

1,991,478

​

​

2,048,644

​

​

2,087,748

​

​

2,177,879

​

​

2,293,231

​

Noncontrolling interest in consolidated joint venture

​

​

40,135

​

​

40,735

​

​

40,297

​

​

42,113

​

​

43,775

​

Total equity

​

​

2,031,613

​

​

2,089,379

​

​

2,128,045

​

​

2,219,992

​

​

2,337,006

​

Total liabilities and equity

​

$

2,916,674

​

$

2,985,717

​

$

3,246,782

​

$

3,423,701

​

$

3,799,540

​

​

(1)As presented on Form 10-Q to be filed in May 2021.
(2)As presented on Form 10-K filed on February 12, 2021.
(3)As presented on Form 10-Q filed on November 6, 2020.
(4)As presented on Form 10-Q filed on August 5, 2020.
(5)As presented on Form 10-Q filed on May 11, 2020.

​

​

​

CORPORATE FINANCIAL INFORMATION

​

Page 11

​

​

​

Graphic

Graphic

BPP-Lobby-Bar

​

Wailea Beach Resort Slide

Graphic

Graphic

Graphic

Outside Shot

​

​


​

Graphic

Supplemental Financial Information
May 3, 2021

Consolidated Statements of Operations
Q1 2021/2020

​

​

​

​

​

​

​

​

​

​

Quarter Ended March 31,

(In thousands, except per share data)


    2021


    2020

Revenues

​

​

​

​

​

​

Room

​

$

34,219

​

$

127,400

Food and beverage

​

​

4,971

​

​

47,990

Other operating

​

​

11,443

​

​

15,822

Total revenues

​

​

50,633

​

​

191,212

Operating expenses

​

​

​

​

​

​

Room

​

​

11,640

​

​

44,245

Food and beverage

​

​

5,979

​

​

41,760

Other operating

​

​

1,805

​

​

3,764

Advertising and promotion

​

​

4,875

​

​

12,462

Repairs and maintenance

​

​

5,545

​

​

10,049

Utilities

​

​

4,151

​

​

5,842

Franchise costs

​

​

991

​

​

5,336

Property tax, ground lease and insurance

​

​

14,661

​

​

20,051

Other property-level expenses

​

​

10,477

​

​

28,845

Corporate overhead

​

​

7,177

​

​

7,394

Depreciation and amortization

​

​

30,770

​

​

36,746

Impairment losses

​

​

—

​

​

115,366

Total operating expenses

​

​

98,071

​

​

331,860

​

​

​

​

​

​

​

Interest and other income (loss)

​

​

(379)

​

​

2,306

Interest expense

​

​

(7,649)

​

​

(17,507)

Gain on extinguishment of debt

​

​

222

​

​

—

Loss before income taxes

​

​

(55,244)

​

​

(155,849)

Income tax provision, net

​

​

(43)

​

​

(6,670)

Net loss

​

​

(55,287)

​

​

(162,519)

Loss from consolidated joint venture attributable to noncontrolling interest

​

​

1,975

​

​

458

Preferred stock dividends

​

​

(3,207)

​

​

(3,207)

Loss attributable to common stockholders

​

$

(56,519)

​

$

(165,268)

​

​

​

​

​

​

​

Basic and diluted per share amounts:

​

​

​

​

​

​

Basic and diluted loss attributable to common stockholders per common share

​

$

(0.26)

​

$

(0.75)

​

​

​

​

​

​

​

Basic and diluted weighted average common shares outstanding

​

​

214,438

​

​

221,036

​

​

​

​

​

​

​

Distributions declared per common share

​

$

—

​

$

0.05

​

​

CORPORATE FINANCIAL INFORMATION

​

Page 12

​

​

​

Graphic

Graphic

BPP-Lobby-Bar

​

Wailea Beach Resort Slide

Graphic

Graphic

Graphic

Outside Shot

​

​


​

Graphic

Supplemental Financial Information
May 3, 2021

Reconciliation of Net Loss to EBITDAre and Adjusted EBITDAre, Excluding Noncontrolling Interest
Q1 2021/2020

​

​

​

​

​

​

​

​

​

​

Quarter Ended March 31,

(In thousands)


2021


2020

Net loss

​

$

(55,287)

​

$

(162,519)

Operations held for investment:

​

​

​

​

​

​

Depreciation and amortization

​

​

30,770

​

​

36,746

Interest expense

​

​

7,649

​

​

17,507

Income tax provision, net

​

​

43

​

​

6,670

Loss on sale of assets

​

​

70

​

​

—

Impairment losses - hotel properties

​

​

—

​

​

113,064

EBITDAre

​

​

(16,755)

​

​

11,468

​

​

​

​

​

​

​

Operations held for investment:

​

​

​

​

​

​

Amortization of deferred stock compensation

​

​

2,752

​

​

2,207

Amortization of right-of-use assets and liabilities

​

​

(331)

​

​

(261)

Finance lease obligation interest - cash ground rent

​

​

(351)

​

​

(351)

Gain on extinguishment of debt

​

​

(222)

​

​

—

Prior year property tax adjustments, net

​

​

(827)

​

​

(81)

Impairment loss - abandoned development costs

​

​

—

​

​

2,302

Noncontrolling interest:

​

​

​

​

​

​

Loss from consolidated joint venture attributable to noncontrolling interest

​

​

1,975

​

​

458

Depreciation and amortization

​

​

(810)

​

​

(804)

Interest expense

​

​

(161)

​

​

(420)

Amortization of right-of-use asset and liability

​

​

72

​

​

72

Impairment loss - abandoned development costs

​

​

—

​

​

(449)

Adjustments to EBITDAre, net

​

​

2,097

​

​

2,673

Adjusted EBITDAre, excluding noncontrolling interest

​

$

(14,658)

​

$

14,141

​

​

​

​

​

​

​

​

CORPORATE FINANCIAL INFORMATION

​

Page 13

​

​

​

Graphic

Graphic

BPP-Lobby-Bar

​

Wailea Beach Resort Slide

Graphic

Graphic

Graphic

Outside Shot

​

​

​


​

Graphic

Supplemental Financial Information
May 3, 2021

​

​

Reconciliation of Net Loss to FFO and Adjusted FFO Attributable to Common Stockholders
Q1 2021/2020

​

​

​

​

​

​

​

​

​

​

Quarter Ended March 31,

(In thousands, except per share data)


2021


2020

Net loss

​

$

(55,287)

​

$

(162,519)

Preferred stock dividends

​

​

(3,207)

​

​

(3,207)

Operations held for investment:

​

​

​

​

​

​

Real estate depreciation and amortization

​

​

30,143

​

​

36,122

Loss on sale of assets

​

​

70

​

​

—

Impairment losses - hotel properties

​

​

—

​

​

113,064

Noncontrolling interest:

​

​

​

​

​

​

Loss from consolidated joint venture attributable to noncontrolling interest

​

​

1,975

​

​

458

Real estate depreciation and amortization

​

​

(810)

​

​

(804)

FFO attributable to common stockholders

​

​

(27,116)

​

​

(16,886)

​

​

​

​

​

​

​

Operations held for investment:

​

​

​

​

​

​

Real estate amortization of right-of-use assets and liabilities

​

​

85

​

​

146

Noncash interest on derivatives

​

​

(869)

​

​

6,080

Gain on extinguishment of debt

​

​

(222)

​

​

—

Prior year property tax adjustments, net

​

​

(827)

​

​

(81)

Impairment loss - abandoned development costs

​

​

—

​

​

2,302

Noncash income tax provision, net

​

​

—

​

​

7,415

Noncontrolling interest:

​

​

​

​

​

​

Real estate amortization of right-of-use asset and liability

​

​

72

​

​

72

Impairment loss - abandoned development costs

​

​

—

​

​

(449)

Adjustments to FFO attributable to common stockholders, net

​

​

(1,761)

​

​

15,485

Adjusted FFO attributable to common stockholders

​

$

(28,877)

​

$

(1,401)

FFO attributable to common stockholders per diluted share

​

$

(0.13)

​

$

(0.08)

Adjusted FFO attributable to common stockholders per diluted share

​

$

(0.13)

​

$

(0.01)

​

​

​

​

​

​

​

Basic weighted average shares outstanding

​

​

214,438

​

​

221,036

Shares associated with unvested restricted stock awards

​

​

210

​

​

—

Diluted weighted average shares outstanding

​

​

214,648

​

​

221,036

​

​

​

​

CORPORATE FINANCIAL INFORMATION

​

Page 14

​

​

​

Graphic

Graphic

BPP-Lobby-Bar

​

Wailea Beach Resort Slide

Graphic

Graphic

Graphic

Outside Shot

​

​


​

Graphic

Supplemental Financial Information
May 3, 2021

Pro Forma Consolidated Statements of Operations

Q1 2021 – Q2 2020, FY 2020

​

​

​

​

​

​

​

​

​

​

​

​

​

​

​

​

​

​

Quarter Ended (1)

​

Year Ended (1)

​

(Unaudited and in thousands)

​

March 31,

​

December 31,

​

September 30,

​

June 30,

​

December 31,

​

​

​

2021


2020


2020


2020


2020

​

Revenues

​

​

​

​

​

​

​

​

​

​

​

​

​

​

​

Room

$

34,219

​

$

21,026

​

$

14,745

​

$

2,395

​

$

151,641

​

Food and beverage

​

4,971

​

​

4,493

​

​

1,979

​

​

142

​

​

50,986

​

Other operating

​

11,443

​

​

10,592

​

​

10,252

​

​

6,144

​

​

41,183

​

Total revenues

​

50,633

​

​

36,111

​

​

26,976

​

​

8,681

​

​

243,810

​

​

​

​

​

​

​

​

​

​

​

​

​

​

​

​

​

Operating Expenses

​

​

​

​

​

​

​

​

​

​

​

​

​

​

​

Room

​

11,640

​

​

11,519

​

​

9,326

​

​

4,995

​

​

63,081

​

Food and beverage

​

5,979

​

​

8,392

​

​

5,719

​

​

4,379

​

​

55,961

​

Other expenses

​

42,505

​

​

30,293

​

​

39,741

​

​

35,607

​

​

179,949

​

Corporate overhead

​

7,177

​

​

5,735

​

​

6,582

​

​

8,438

​

​

28,149

​

Depreciation and amortization

​

30,770

​

​

31,505

​

​

31,121

​

​

31,363

​

​

125,865

​

Impairment losses

​

—

​

​

13,478

​

​

—

​

​

—

​

​

20,987

​

Total operating expenses

​

98,071

​

​

100,922

​

​

92,489

​

​

84,782

​

​

473,992

​

​

​

​

​

​

​

​

​

​

​

​

​

​

​

​

​

​

​

​

​

​

​

​

​

​

​

​

​

​

​

​

​

Interest and other income (loss)

​

(379)

​

​

85

​

​

139

​

​

306

​

​

2,836

​

Interest expense

​

(7,649)

​

​

(7,676)

​

​

(8,999)

​

​

(9,322)

​

​

(40,642)

​

Gain (loss) on extinguishment of debt, net

​

222

​

​

—

​

​

(210)

​

​

—

​

​

(210)

​

Loss before income taxes

​

(55,244)

​

​

(72,402)

​

​

(74,583)

​

​

(85,117)

​

​

(268,198)

​

Income tax (provision) benefit, net

​

(43)

​

​

(15)

​

​

83

​

​

12

​

​

(6,590)

​

Net loss

$

(55,287)

​

$

(72,417)

​

$

(74,500)

​

$

(85,105)

​

$

(274,788)

​

​

​

​

​

​

​

​

​

​

​

​

​

​

​

​

​

Adjusted EBITDAre, excluding noncontrolling interest (2)

$

(14,658)

​

$

(14,886)

​

$

(30,656)

​

$

(39,588)

​

$

(66,826)

​

​

(1)Includes the Company's ownership results for the 17 Hotel Portfolio. Excludes the Company's ownership results for the Renaissance Harborplace and the Renaissance Los Angeles Airport due to their sales in July 2020 and December 2020, respectively. In addition, excludes the Company's ownership results for the Hilton Times Square due to the assignment-in-lieu agreement executed in December 2020 between the Company and the hotel's mortgage holder, which transferred the Company's leasehold interest in the hotel to the mortgage holder, as well as the elimination of interest expense and loss on extinguishment of debt on the mortgage loan secured by the Renaissance Washington DC due to its repayment in December 2020.
(2)Adjusted EBITDAre, excluding noncontrolling interest reconciliation for the year ended December 31, 2020 can be found on page 17 in this supplemental package.

​

​

​

CORPORATE FINANCIAL INFORMATION

​

Page 15

​

​

​

Graphic

Graphic

BPP-Lobby-Bar

​

Wailea Beach Resort Slide

Graphic

Graphic

Graphic

Outside Shot

​

​


​

Graphic

Supplemental Financial Information
May 3, 2021

Pro Forma Consolidated Statements of Operations

Q4 2019 – Q1 2019, FY 2019

​

​

​

​

​

​

​

​

​

​

​

​

​

​

​

​

​

Quarter Ended (1)

​

Year Ended (1)

(Unaudited and in thousands)

​

December 31,

​

September 30,

​

June 30,

​

March 31,

​

December 31,

​

​

2019


2019


2019


2019


2019

Revenues

​

​

​

​

​

​

​

​

​

​

​

​

​

​

Room

$

160,370

​

$

171,544

​

$

179,838

​

$

150,734

​

$

662,486

Food and beverage

​

60,403

​

​

56,052

​

​

68,588

​

​

63,819

​

​

248,862

Other operating

​

17,555

​

​

18,275

​

​

16,943

​

​

15,358

​

​

68,131

Total revenues

​

238,328

​

​

245,871

​

​

265,369

​

​

229,911

​

​

979,479

​

​

​

​

​

​

​

​

​

​

​

​

​

​

​

Operating Expenses

​

​

​

​

​

​

​

​

​

​

​

​

​

​

Room

​

42,414

​

​

43,947

​

​

43,744

​

​

40,711

​

​

170,816

Food and beverage

​

41,382

​

​

40,143

​

​

43,201

​

​

42,129

​

​

166,855

Other expenses

​

82,501

​

​

82,373

​

​

84,012

​

​

81,716

​

​

330,602

Corporate overhead

​

7,275

​

​

7,395

​

​

8,078

​

​

7,516

​

​

30,264

Depreciation and amortization

​

31,780

​

​

31,854

​

​

31,217

​

​

31,056

​

​

125,907

Total operating expenses

​

205,352

​

​

205,712

​

​

210,252

​

​

203,128

​

​

824,444

​

​

​

​

​

​

​

​

​

​

​

​

​

​

​

​

​

​

​

​

​

​

​

​

​

​

​

​

​

​

Interest and other income

​

3,060

​

​

3,762

​

​

4,811

​

​

4,924

​

​

16,557

Interest expense

​

(7,867)

​

​

(10,064)

​

​

(12,621)

​

​

(11,131)

​

​

(41,683)

Income before income taxes

​

28,169

​

​

33,857

​

​

47,307

​

​

20,576

​

​

129,909

Income tax (provision) benefit, net

​

(1,034)

​

​

749

​

​

(2,676)

​

​

3,112

​

​

151

Net income

$

27,135

​

$

34,606

​

$

44,631

​

$

23,688

​

$

130,060

​

​

​

​

​

​

​

​

​

​

​

​

​

​

​

Adjusted EBITDAre, excluding noncontrolling interest (2)

$

66,968

​

$

73,500

​

$

89,511

​

$

61,915

​

$

291,894

​

(1)Includes the Company's ownership results for the 17 Hotel Portfolio. Excludes the Company's ownership results for the Courtyard by Marriott Los Angeles, the Renaissance Harborplace and the Renaissance Los Angeles Airport due to their sales in October 2019, July 2020 and December 2020, respectively. In addition, excludes the Company's ownership results for the Hilton Times Square due to the assignment-in-lieu agreement executed in December 2020 between the Company and the hotel's mortgage holder, which transferred the Company's leasehold interest in the hotel to the mortgage holder, as well as the elimination of interest expense on the mortgage loan secured by the Renaissance Washington DC due to its repayment in December 2020.
(2)Adjusted EBITDAre, excluding noncontrolling interest reconciliation for the year ended December 31, 2019 can be found on page 20 in this supplemental package.

​

​

​

​

CORPORATE FINANCIAL INFORMATION

​

Page 16

​

​

​

Graphic

Graphic

BPP-Lobby-Bar

​

Wailea Beach Resort Slide

Graphic

Graphic

Graphic

Outside Shot

​

​


​

Graphic

Supplemental Financial Information
May 3, 2021

Pro Forma Reconciliation of Net Loss to EBITDAre and Adjusted EBITDAre, Excluding Noncontrolling Interest

FY 2020

​

​

​

​

​

​

​

​

​

​

​

​

​

​

​

Year Ended December 31, 2020

​

​

​

​

Disposition:

​

Disposition:

​

Disposition:

​

​

​

​

​

​

​

​

Renaissance

​

Renaissance

​

Hilton

​

Debt & Equity

​

Pro

(In thousands)

​

Actual (1)

​

Harborplace (2)

​

Los Angeles Airport (2)

​

Times Square (2)

​

Transactions (3)

​

Forma (4)

​

​

​

​

​

​

​

​

​

​

​

​

​

Net loss

$

(410,506)

$

23,386

$

(29,132)

$

134,845

$

6,619

$

(274,788)

Operations held for investment:

​

​

​

​

​

​

​

​

​

​

​

​

Depreciation and amortization

​

137,051

​

(2,622)

​

(3,897)

​

(4,667)

​

—

​

125,865

Interest expense

​

53,307

​

—

​

—

​

(6,079)

​

(6,586)

​

40,642

Income tax provision, net

​

6,590

​

—

​

—

​

—

​

—

​

6,590

Gain on sale of assets

​

(34,298)

​

189

​

34,109

​

—

​

—

​

—

Impairment losses

​

144,642

​

(18,100)

​

—

​

(107,857)

​

—

​

18,685

EBITDAre

​

(103,214)

​

2,853

​

1,080

​

16,242

​

33

​

(83,006)

​

​

​

​

​

​

​

​

​

​

​

​

​

Operations held for investment:

​

​

​

​

​

​

​

​

​

​

​

​

Amortization of deferred stock compensation

​

9,576

​

—

​

—

​

—

​

—

​

9,576

Amortization of right-of-use assets and liabilities

​

(1,260)

​

—

​

—

​

(34)

​

—

​

(1,294)

Finance lease obligation interest - cash ground rent

​

(1,404)

​

—

​

—

​

—

​

—

​

(1,404)

Gain on extinguishment of debt, net

​

(6,146)

​

—

​

—

​

6,389

​

(33)

​

210

Property-level severance

​

11,038

​

—

​

(109)

​

(5,637)

​

—

​

5,292

Prior year property tax adjustments, net

​

(276)

​

57

​

481

​

—

​

—

​

262

Impairment loss - abandoned development costs

​

2,302

​

—

​

—

​

—

​

—

​

2,302

Noncontrolling interest:

​

​

​

​

​

​

​

​

​

​

​

​

Loss from consolidated joint venture attributable to noncontrolling interest

​

5,817

​

—

​

—

​

—

​

—

​

5,817

Depreciation and amortization

​

(3,228)

​

—

​

—

​

—

​

—

​

(3,228)

Interest expense

​

(1,194)

​

—

​

—

​

—

​

—

​

(1,194)

Amortization of right-of-use asset and liability

​

290

​

—

​

—

​

—

​

—

​

290

Impairment loss - abandoned development costs

​

(449)

​

—

​

—

​

—

​

—

​

(449)

Adjustments to EBITDAre, net

​

15,066

​

57

​

372

​

718

​

(33)

​

16,180

​

​

​

​

​

​

​

​

​

​

​

​

​

Adjusted EBITDAre, excluding noncontrolling interest

$

(88,148)

$

2,910

$

1,452

$

16,960

$

—

$

(66,826)

​

*Footnotes on Page 19

​

​

​

​

CORPORATE FINANCIAL INFORMATION

​

Page 17

​

​

​

Graphic

Graphic

BPP-Lobby-Bar

​

Wailea Beach Resort Slide

Graphic

Graphic

Graphic

Outside Shot

​

​

​


​

Graphic

Supplemental Financial Information
May 3, 2021

Pro Forma Reconciliation of Net Loss to FFO and Adjusted FFO Attributable to Common Stockholders

FY 2020

​

​

​

​

​

​

​

​

​

​

​

​

​

​

​

Year Ended December 31, 2020

​

​

​

​

Disposition:

​

Disposition:

​

Disposition:

​

​

​

​

​

​

​

​

Renaissance

​

Renaissance

​

Hilton

​

Debt & Equity

​

Pro

(In thousands, except per share amounts)

​

Actual (1)

​

Harborplace (2)

​

Los Angeles Airport (2)

​

Times Square (2)

​

Transactions (3)

​

Forma (4)

​

​

​

​

​

​

​

​

​

​

​

​

​

Net loss

$

(410,506)

$

23,386

$

(29,132)

$

134,845

$

6,619

$

(274,788)

Preferred stock dividends

​

(12,830)

​

—

​

—

​

—

​

—

​

(12,830)

Operations held for investment:

​

​

​

​

​

​

​

​

​

​

​

​

Real estate depreciation and amortization

​

134,555

​

(2,622)

​

(3,897)

​

(4,667)

​

—

​

123,369

Gain on sale of assets

​

(34,298)

​

189

​

34,109

​

—

​

—

​

—

Impairment losses

​

144,642

​

(18,100)

​

—

​

(107,857)

​

—

​

18,685

Noncontrolling interest:

​

​

​

​

​

​

​

​

​

​

​

​

Loss from consolidated joint venture attributable to noncontrolling interest

​

5,817

​

—

​

—

​

—

​

—

​

5,817

Real estate depreciation and amortization

​

(3,228)

​

—

​

—

​

—

​

—

​

(3,228)

FFO attributable to common stockholders

​

(175,848)

​

2,853

​

1,080

​

22,321

​

6,619

​

(142,975)

​

​

​

​

​

​

​

​

​

​

​

​

​

Operations held for investment:

​

​

​

​

​

​

​

​

​

​

​

​

Real estate amortization of right-of-use assets and liabilities

​

376

​

—

​

—

​

(34)

​

—

​

342

Noncash interest on derivatives and finance lease obligation, net

​

4,740

​

—

​

—

​

—

​

—

​

4,740

Gain on extinguishment of debt, net

​

(6,146)

​

—

​

—

​

6,389

​

(33)

​

210

Property-level severance

​

11,038

​

—

​

(109)

​

(5,637)

​

—

​

5,292

Prior year property tax adjustments, net

​

(276)

​

57

​

481

​

—

​

—

​

262

Impairment loss - abandoned development costs

​

2,302

​

—

​

—

​

—

​

—

​

2,302

Noncash income tax provision, net

​

7,415

​

—

​

—

​

—

​

—

​

7,415

Noncontrolling interest:

​

​

​

​

​

​

​

​

​

​

​

​

Real estate amortization of right-of-use asset and liability

​

290

​

—

​

—

​

—

​

—

​

290

Noncash interest on derivatives, net

​

(27)

​

—

​

—

​

—

​

—

​

(27)

Impairment loss - abandoned development costs

​

(449)

​

—

​

—

​

—

​

—

​

(449)

Adjustments to FFO attributable to common stockholders, net

​

19,263

​

57

​

372

​

718

​

(33)

​

20,377

​

​

​

​

​

​

​

​

​

​

​

​

​

Adjusted FFO attributable to common stockholders

$

(156,585)

$

2,910

$

1,452

$

23,039

$

6,586

$

(122,598)

​

​

​

​

​

​

​

​

​

​

​

​

​

FFO attributable to common stockholders per diluted share

$

(0.81)

​

​

​

​

​

​

​

​

$

(0.67)

​

​

​

​

​

​

​

​

​

​

​

​

​

Adjusted FFO attributable to common stockholders per diluted share

$

(0.73)

​

​

​

​

​

​

​

​

$

(0.57)

​

​

​

​

​

​

​

​

​

​

​

​

​

Basic weighted average shares outstanding

​

215,934

​

​

​

​

​

​

​

(1,742)

​

214,192

Shares associated with unvested restricted stock awards

​

—

​

​

​

​

​

​

​

—

​

—

Diluted weighted average shares outstanding

​

215,934

​

​

​

​

​

​

​

(1,742)

​

214,192

​

*Footnotes on Page 19

​

​

CORPORATE FINANCIAL INFORMATION

​

Page 18

​

​

​

Graphic

Graphic

BPP-Lobby-Bar

​

Wailea Beach Resort Slide

Graphic

Graphic

Graphic

Outside Shot

​

​


​

Graphic

Supplemental Financial Information
May 3, 2021

Pro Forma Reconciliation of Net Loss to EBITDAre, Adjusted EBITDAre, Excluding Noncontrolling Interest,

FFO and Adjusted FFO Attributable to Common Stockholders

FY 2020 Footnotes

​

​

(1)Actual represents the Company's ownership results for the 17 hotels owned by the Company as of December 31, 2020, as well as results for the Renaissance Harborplace and the Renaissance Los Angeles Airport prior to their sales in July 2020 and December 2020, respectively. In addition, Actual includes the Company's ownership results for the Hilton Times Square prior to the assignment-in-lieu agreement executed in December 2020 between the Company and the hotel's mortgage holder, which transferred the Company's leasehold interest in the hotel to the mortgage holder.
(2)Disposition represents the Company's ownership results for the Renaissance Harborplace and the Renaissance Los Angeles Airport prior to their sales in July 2020 and December 2020, respectively. In addition, Disposition includes the Company's ownership results for the Hilton Times Square prior to the assignment-in-lieu agreement executed in December 2020 between the Company and the hotel's mortgage holder, which transferred the Company's leasehold interest in the hotel to the mortgage holder.
(3)Debt & Equity Transactions represent the elimination of interest expense and loss on extinguishment of debt on the mortgage loan secured by the Renaissance Washington DC due to its repayment in December 2020, along with the 9,770,081 shares repurchased in the first quarter of 2020.
(4)Pro Forma represents the Company's ownership results for the 17 Hotel Portfolio, as well as the Renaissance Washington DC loan repayment and the common stock repurchases in the first quarter of 2020.

​

​

​

​

​

​

​

​

​

​

​

​

​

​

​

​

​

​

​

​

​

​

CORPORATE FINANCIAL INFORMATION

​

Page 19

​

​

​

Graphic

Graphic

BPP-Lobby-Bar

​

Wailea Beach Resort Slide

Graphic

Graphic

Graphic

Outside Shot

​

​

​


​

Graphic

Supplemental Financial Information
May 3, 2021

Pro Forma Reconciliation of Net Income to EBITDAre and Adjusted EBITDAre, Excluding Noncontrolling Interest

FY 2019

​

​

​

​

​

​

​

​

​

​

​

​

​

​

​

​

​

Year Ended December 31, 2019

​

​

​

​

Disposition:

​

Disposition:

​

Disposition:

​

Disposition:

​

​

​

​

​

​

​

​

Courtyard by Marriott

​

Renaissance

​

Renaissance

​

Hilton

​

Debt & Equity

​

Pro

(In thousands)

​

Actual (1)

​

Los Angeles (2)

​

Harborplace (2)

​

Los Angeles Airport (2)

​

Times Square (2)

​

Transactions (3)

​

Forma (4)

​

​

​

​

​

​

​

​

​

​

​

​

​

​

​

Net income

$

142,793

$

(44,979)

$

21,507

$

(3,331)

$

7,284

$

6,786

$

130,060

Operations held for investment:

​

​

​

​

​

​

​

​

​

​

​

​

​

​

Depreciation and amortization

​

147,748

​

(760)

​

(6,719)

​

(4,205)

​

(10,157)

​

—

​

125,907

Interest expense

​

54,223

​

(955)

​

—

​

—

​

(4,799)

​

(6,786)

​

41,683

Income tax benefit, net

​

(151)

​

—

​

—

​

—

​

—

​

—

​

(151)

Gain on sale of assets

​

(42,935)

​

42,935

​

—

​

—

​

—

​

—

​

—

Impairment loss

​

24,713

​

—

​

(24,713)

​

—

​

—

​

—

​

—

EBITDAre

​

326,391

​

(3,759)

​

(9,925)

​

(7,536)

​

(7,672)

​

—

​

297,499

​

​

​

​

​

​

​

​

​

​

​

​

​

​

​

Operations held for investment:

​

​

​

​

​

​

​

​

​

​

​

​

​

​

Amortization of deferred stock compensation

​

9,313

​

—

​

—

​

—

​

—

​

—

​

9,313

Amortization of right-of-use assets and liabilities

​

(782)

​

—

​

—

​

—

​

(239)

​

—

​

(1,021)

Finance lease obligation interest - cash ground rent

​

(2,175)

​

772

​

—

​

—

​

—

​

—

​

(1,403)

Prior year property tax adjustments, net

​

168

​

—

​

—

​

9

​

—

​

—

​

177

Prior owner contingency funding

​

(900)

​

—

​

—

​

—

​

—

​

—

​

(900)

Noncontrolling interest:

​

​

​

​

​

​

​

​

​

​

​

​

​

​

Income from consolidated joint venture attributable to noncontrolling interest

​

(7,060)

​

—

​

—

​

—

​

—

​

—

​

(7,060)

Depreciation and amortization

​

(2,875)

​

—

​

—

​

—

​

—

​

—

​

(2,875)

Interest expense

​

(2,126)

​

—

​

—

​

—

​

—

​

—

​

(2,126)

Amortization of right-of-use asset and liability

​

290

​

—

​

—

​

—

​

—

​

—

​

290

Adjustments to EBITDAre, net

​

(6,147)

​

772

​

—

​

9

​

(239)

​

—

​

(5,605)

​

​

​

​

​

​

​

​

​

​

​

​

​

​

​

Adjusted EBITDAre, excluding noncontrolling interest

$

320,244

$

(2,987)

$

(9,925)

$

(7,527)

$

(7,911)

$

—

$

291,894

​

​

*Footnotes on Page 22

​

​

​

CORPORATE FINANCIAL INFORMATION

​

Page 20

​

​

​

Graphic

Graphic

BPP-Lobby-Bar

​

Wailea Beach Resort Slide

Graphic

Graphic

Graphic

Outside Shot

​

​

​


​

Graphic

Supplemental Financial Information
May 3, 2021

Pro Forma Reconciliation of Net Income to FFO and Adjusted FFO Attributable to Common Stockholders

FY 2019

​

​

​

​

​

​

​

​

​

​

​

​

​

​

​

​

​

Year Ended December 31, 2019

​

​

​

​

Disposition:

​

Disposition:

​

Disposition:

​

Disposition:

​

​

​

​

​

​

​

​

Courtyard by Marriott

​

Renaissance

​

Renaissance

​

Hilton

​

Debt & Equity

​

Pro

(In thousands, except per share amounts)

​

Actual (1)

​

Los Angeles (2)

​

Harborplace (2)

​

Los Angeles Airport (2)

​

Times Square (2)

​

Transactions (3)

​

Forma (4)

​

​

​

​

​

​

​

​

​

​

​

​

​

​

​

Net income

$

142,793

$

(44,979)

$

21,507

$

(3,331)

$

7,284

$

6,786

$

130,060

Preferred stock dividends

​

(12,830)

​

—

​

—

​

—

​

—

​

—

​

(12,830)

Operations held for investment:

​

​

​

​

​

​

​

​

​

​

​

​

​

​

Real estate depreciation and amortization

​

145,260

​

(760)

​

(6,719)

​

(4,205)

​

(10,157)

​

—

​

123,419

Gain on sale of assets

​

(42,935)

​

42,935

​

—

​

—

​

—

​

—

​

—

Impairment loss

​

24,713

​

—

​

(24,713)

​

—

​

—

​

—

​

—

Noncontrolling interest:

​

​

​

​

​

​

​

​

​

​

​

​

​

​

Income from consolidated joint venture attributable to noncontrolling interest

​

(7,060)

​

—

​

—

​

—

​

—

​

—

​

(7,060)

Real estate depreciation and amortization

​

(2,875)

​

—

​

—

​

—

​

—

​

—

​

(2,875)

FFO attributable to common stockholders

​

247,066

​

(2,804)

​

(9,925)

​

(7,536)

​

(2,873)

​

6,786

​

230,714

​

​

​

​

​

​

​

​

​

​

​

​

​

​

​

Operations held for investment:

​

​

​

​

​

​

​

​

​

​

​

​

​

​

Real estate amortization of right-of-use assets and liabilities

​

590

​

—

​

—

​

—

​

(239)

​

—

​

351

Noncash interest on derivatives and finance lease obligations, net

​

6,051

​

(183)

​

—

​

—

​

—

​

—

​

5,868

Prior year property tax adjustments, net

​

168

​

—

​

—

​

9

​

—

​

—

​

177

Prior owner contingency funding

​

(900)

​

—

​

—

​

—

​

—

​

—

​

(900)

Noncash income tax provision, net

​

688

​

—

​

—

​

—

​

—

​

—

​

688

Noncontrolling interest:

​

​

​

​

​

​

​

​

​

​

​

​

​

​

Real estate amortization of right-of-use asset and liability

​

290

​

—

​

—

​

—

​

—

​

—

​

290

Adjustments to FFO attributable to common stockholders, net

​

6,887

​

(183)

​

—

​

9

​

(239)

​

—

​

6,474

​

​

​

​

​

​

​

​

​

​

​

​

​

​

​

Adjusted FFO attributable to common stockholders

$

253,953

$

(2,987)

$

(9,925)

$

(7,527)

$

(3,112)

$

6,786

$

237,188

​

​

​

​

​

​

​

​

​

​

​

​

​

​

​

FFO attributable to common stockholders per diluted share

$

1.09

​

​

​

​

​

​

​

​

​

​

$

1.08

​

​

​

​

​

​

​

​

​

​

​

​

​

​

​

Adjusted FFO attributable to common stockholders per diluted share

$

1.12

​

​

​

​

​

​

​

​

​

​

$

1.11

​

​

​

​

​

​

​

​

​

​

​

​

​

​

​

Basic weighted average shares outstanding

​

225,681

​

​

​

​

​

​

​

​

​

(11,868)

​

213,813

Shares associated with unvested restricted stock awards

​

276

​

​

​

​

​

​

​

​

​

—

​

276

Diluted weighted average shares outstanding

​

225,957

​

​

​

​

​

​

​

​

​

(11,868)

​

214,089

​

*Footnotes on Page 22

​

​

CORPORATE FINANCIAL INFORMATION

​

Page 21

​

​

​

Graphic

Graphic

BPP-Lobby-Bar

​

Wailea Beach Resort Slide

Graphic

Graphic

Graphic

Outside Shot

​

​


​

Graphic

Supplemental Financial Information
May 3, 2021

Pro Forma Reconciliation of Net Income to EBITDAre, Adjusted EBITDAre, Excluding Noncontrolling Interest,

FFO and Adjusted FFO Attributable to Common Stockholders

FY 2019 Footnotes

​

​

(1)Actual represents the Company's ownership results for the 20 hotels owned by the Company as of December 31, 2019, as well as results for the Courtyard by Marriott Los Angeles prior to its sale in October 2019.
(2)Disposition represents the Company's ownership results for the Courtyard by Marriott Los Angeles, the Renaissance Harborplace and the Renaissance Los Angeles Airport prior to their sales in October 2019, July 2020 and December 2020, respectively. In addition, Disposition includes the Company's ownership results for the Hilton Times Square prior to the assignment-in-lieu agreement executed in December 2020 between the Company and the hotel's mortgage holder, which transferred the Company's leasehold interest in the hotel to the mortgage holder.
(3)Debt & Equity Transactions represent the elimination of interest expense on the mortgage loan secured by the Renaissance Washington DC due to its repayment in December 2020, along with the 3,783,936 shares of common stock repurchased in the second, third and fourth quarters of 2019, and the 9,770,081 shares repurchased in the first quarter of 2020.
(4)Pro Forma represents the Company's ownership results for the 17 Hotel Portfolio, as well as the Renaissance Washington DC loan repayment in 2020 and the common stock repurchases in 2019 and 2020.

​

​

​

​

​

​

​

​

​

​

​

​

​

​

​

​

​

​

​

CORPORATE FINANCIAL INFORMATION

​

Page 22

​

​

​

Graphic

Graphic

BPP-Lobby-Bar

​

Wailea Beach Resort Slide

Graphic

Graphic

Graphic

Outside Shot

​

​

​

​


​

​

Graphic

Supplemental Financial Information
May 3, 2021

​

CAPITALIZATION

​

​

​

​

​

​

​

​

​

​

​

​

​

​

​

​

​

​

CAPITALIZATION

​

Page 23

​

​

​

Graphic

Graphic

BPP-Lobby-Bar

​

Wailea Beach Resort Slide

Graphic

Graphic

Graphic

Outside Shot

​

​

​


​

Graphic

Supplemental Financial Information
May 3, 2021

Comparative Capitalization
Q1 2021 – Q1 2020

​

​

​

​

​

​

​

​

​

​

​

​

​

​

​

​

​

​

​

​

March 31,

​

December 31,

​

September 30,

​

June 30,

​

March 31,

​

(In thousands, except per share data)


2021


2020


2020


2020


2020

​

​

​

​

​

​

​

​

​

​

​

​

​

​

​

​

​

​

Common Share Price & Dividends

​

​

​

​

​

​

​

​

​

​

​

​

​

​

​

​

At the end of the quarter

​

$

12.46

​

$

11.33

​

$

7.94

​

$

8.15

​

$

8.71

​

High during quarter ended

​

$

13.57

​

$

11.42

​

$

8.70

​

$

10.65

​

$

13.81

​

Low during quarter ended

​

$

10.25

​

$

7.27

​

$

7.27

​

$

7.04

​

$

6.99

​

Common dividends per share

​

$

—

​

$

—

​

$

—

​

$

—

​

$

0.05

​

​

​

​

​

​

​

​

​

​

​

​

​

​

​

​

​

​

Common Shares & Units

​

​

​

​

​

​

​

​

​

​

​

​

​

​

​

​

Common shares outstanding

​

​

216,175

​

​

215,593

​

​

215,636

​

​

215,636

​

​

215,541

​

Units outstanding

​

​

—

​

​

—

​

​

—

​

​

—

​

​

—

​

Total common shares and units outstanding

​

​

216,175

​

​

215,593

​

​

215,636

​

​

215,636

​

​

215,541

​

​

​

​

​

​

​

​

​

​

​

​

​

​

​

​

​

​

Capitalization

​

​

​

​

​

​

​

​

​

​

​

​

​

​

​

​

Market value of common equity

​

$

2,693,542

​

$

2,442,673

​

$

1,712,146

​

$

1,757,430

​

$

1,877,363

​

Liquidation value of preferred equity - Series E

​

​

115,000

​

​

115,000

​

​

115,000

​

​

115,000

​

​

115,000

​

Liquidation value of preferred equity - Series F

​

​

75,000

​

​

75,000

​

​

75,000

​

​

75,000

​

​

75,000

​

Consolidated debt

​

​

747,113

​

​

747,945

​

​

934,673

​

​

1,021,247

​

​

1,272,965

​

Consolidated total capitalization

​

​

3,630,655

​

​

3,380,618

​

​

2,836,819

​

​

2,968,677

​

​

3,340,328

​

​

​

​

​

​

​

​

​

​

​

​

​

​

​

​

​

​

Noncontrolling interest in consolidated debt

​

​

(55,000)

​

​

(55,000)

​

​

(55,000)

​

​

(55,000)

​

​

(55,000)

​

Pro rata total capitalization

​

$

3,575,655

​

$

3,325,618

​

$

2,781,819

​

$

2,913,677

​

$

3,285,328

​

​

​

​

​

​

​

​

​

​

​

​

​

​

​

​

​

​

Consolidated debt to consolidated total capitalization

​

​

20.6

%  

​

22.1

%  

​

32.9

%  

​

34.4

%  

​

38.1

%  

Pro rata debt to pro rata total capitalization

​

​

19.4

%  

​

20.8

%  

​

31.6

%  

​

33.2

%  

​

37.1

%  

Consolidated debt and preferred equity to consolidated total capitalization

​

​

25.8

%  

​

27.7

%  

​

39.6

%  

​

40.8

%  

​

43.8

%  

Pro rata debt and preferred equity to pro rata total capitalization

​

​

24.7

%  

​

26.5

%  

​

38.5

%  

​

39.7

%  

​

42.9

%  

​

​

​

​

​

​

​

​

​

CAPITALIZATION

​

Page 24

​

​

​

Graphic

Graphic

BPP-Lobby-Bar

​

Wailea Beach Resort Slide

Graphic

Graphic

Graphic

Outside Shot

​

​

​


​

Graphic

Supplemental Financial Information
May 3, 2021

Consolidated Debt Summary Schedule

​

​

​

​

​

​

​

​

​

​

​

​

​

(In thousands)

​

​

​

Interest Rate /

​

Maturity

​

​

March 31, 2021

​

​

Balance At

Debt


Collateral


Spread


Date


​

Balance


​

Maturity

​

​

​

​

​

​

​

​

​

​

​

​

​

Fixed Rate Debt

​

​

​

​

​

​

​

​

​

​

​

​

Term Loan Facility (1)

​

Unsecured

​

3.94%

​

09/03/2022

​

$

85,000

​

$

85,000

Term Loan Facility (1)

​

Unsecured

​

4.20%

​

01/31/2023

​

​

100,000

​

​

100,000

Secured Mortgage Debt

​

JW Marriott New Orleans

​

4.15%

​

12/11/2024

​

​

79,572

​

​

72,071

Secured Mortgage Debt

​

Embassy Suites La Jolla

​

4.12%

​

01/06/2025

​

​

57,541

​

​

51,987

Series A Senior Notes (2)

​

Unsecured

​

5.94%

​

01/10/2026

​

​

90,000

​

​

90,000

Series B Senior Notes (2)

​

Unsecured

​

6.04%

​

01/10/2028

​

​

115,000

​

​

115,000

Total Fixed Rate Debt

​

​

​

​

​

​

​

​

527,113

​

​

514,058

Variable Rate Debt

​

​

​

​

​

​

​

​

​

​

​

​

Secured Mortgage Debt (3)

​

Hilton San Diego Bayfront

​

1.16%

​

12/09/2023

​

​

220,000

​

​

220,000

Credit Facility (1)

​

Unsecured

​

L + 1.40% - 2.40%

​

04/14/2023

​

​

—

​

​

—

Total Variable Rate Debt

​

​

​

​

​

​

​

​

220,000

​

​

220,000

​

​

​

​

​

​

​

​

​

​

​

​

​

TOTAL CONSOLIDATED DEBT

​

​

​

​

​

​

​

$

747,113

​

$

734,058

​

​

​

​

​

​

​

​

​

​

​

​

​

Preferred Stock

​

​

​

​

​

​

​

​

​

​

​

​

Series E cumulative redeemable preferred

​

​

​

6.95%

​

perpetual

​

$

115,000

​

​

​

Series F cumulative redeemable preferred

​

​

​

6.45%

​

perpetual

​

​

75,000

​

​

​

Total Preferred Stock

​

​

​

​

​

​

​

$

190,000

​

​

​

​

​

​

​

​

​

​

​

​

​

​

​

​

Debt Statistics

​

​

​

​

​

​

​

​

​

​

​

​

% Fixed Rate Debt

​

​

​

​

​

​

​

​

70.6

%  

​

​

% Floating Rate Debt

​

​

​

​

​

​

​

​

29.4

%  

​

​

Average Interest Rate (4)

​

​

​

​

​

​

​

​

3.76

%  

​

​

Weighted Average Maturity of Debt (3)

​

​

​

​

​

​

​

​

3.5 years

​

​

​

​

​

(1)In July and December 2020, the Company executed amendments to the agreement governing its revolving credit facility and term loan facilities, providing covenant relief through the first quarter of 2022, with the first quarterly covenant test as of the period ended March 31, 2022. Under the terms of the July 2020 amendment, a 25-basis point LIBOR floor was added for the remaining term of the facilities and the applicable LIBOR margin was increased to 225 basis points for the revolving credit facility and 220 basis points for the term loan facilities, the high points of the pricing grid. The December 2020 amendment fixed the applicable LIBOR margin at 240 basis points for the revolving credit facility and 235 basis points for the term loan facilities. After the covenant relief period, the LIBOR margin will revert back to the original terms of the pricing grid with a range of 140 to 225 basis points for the revolving credit facility and 135 to 220 basis points for the term loan facilities, depending on the Company’s leverage ratios. The interest rates presented reflect the terms of the amended agreements and the effects of the Company’s interest rate derivative agreements.
(2)In July and December 2020, the Company executed amendments to the agreement governing the Senior Notes, providing covenant relief through the first quarter of 2022, with the first quarterly covenant test as of the period ended March 31, 2022. The July and December 2020 amendments increased the annual interest rates on the Senior Notes by 1.0% and an additional 0.25%, respectively. After the covenant relief period, the interest rates on the Senior Notes will decrease by 0.25% until the Company’s leverage ratio is below 5.0x. The interest rates presented reflect the terms of the amended agreements.
(3)In December 2020, the Company exercised its first option to extend the maturity date of the $220.0 million loan secured by the Hilton San Diego Bayfront from December 2020 to December 2021. Two additional one-year options to extend remain, which the Company also intends to exercise, extending the maturity date to December 2023. By extending this loan, the Company's weighted average maturity of debt increases from 2.9 years to 3.5 years.
(4)Average Interest Rate is calculated based on rates at March 31, 2021, and includes the effect of the Company's interest rate derivative agreements.

​

​

CAPITALIZATION

​

Page 25

​

​

​

Graphic

Graphic

BPP-Lobby-Bar

​

Wailea Beach Resort Slide

Graphic

Graphic

Graphic

Outside Shot

​

​


​

Graphic

Supplemental Financial Information
May 3, 2021

Consolidated Amortization and Debt Maturity Schedule

As of March 31, 2021

Graphic

(1)In December 2020, the Company exercised its first option to extend the maturity date of the $220.0 million loan secured by the Hilton San Diego Bayfront from December 2020 to December 2021. Two additional one-year options to extend remain, which the Company also intends to exercise, extending the maturity date to December 2023.
(2)Percent of Current Total Capitalization is calculated by dividing the sum of scheduled principal amortization and maturity payments by the March 31, 2021 consolidated total capitalization as presented on page 24.

​

​

CAPITALIZATION

​

Page 26

​

​

​

Graphic

Graphic

BPP-Lobby-Bar

​

Wailea Beach Resort Slide

Graphic

Graphic

Graphic

Outside Shot

​

​

​


​

Graphic

Supplemental Financial Information
May 3, 2021

​

PROPERTY-LEVEL DATA

​

​

​

​

​

​

​

​

​

​

​

​

​

​

​

​

​

​

PROPERTY-LEVEL DATA

​

Page 27

​

​

​

Graphic

Graphic

BPP-Lobby-Bar

​

Wailea Beach Resort Slide

Graphic

Graphic

Graphic

Outside Shot

​

​

​


​

Graphic

Supplemental Financial Information
May 3, 2021

Hotel Information as of May 3, 2021

​

​

​

​

​

​

​

​

​

​

​

​

​

​

​

​

​

​

​

​

​

Hotel


Location


Brand


Number of
Rooms


% of Total
Rooms


Interest

​

Open / Suspension Date (1)


Resumption

Date (1)


Year Acquired

​

​

​

​

​

​

​

​

​

​

​

​

​

​

​

​

​

​

​

1


Hilton San Diego Bayfront (2) (3)

​

California

​

Hilton

​

1,190

​

13.01%

​

Leasehold

​

March 23, 2020

​

August 11, 2020

​

2011

2

​

Boston Park Plaza

​

Massachusetts

​

Independent

​

1,060

​

11.59%

​

Fee Simple

​

Open

​

N/A

​

2013

3

​

Hyatt Regency San Francisco

​

California

​

Hyatt

​

821

​

8.98%

​

Fee Simple

​

March 22, 2020

​

October 1, 2020

​

2013

4

​

Renaissance Washington DC

​

Washington DC

​

Marriott

​

807

​

8.82%

​

Fee Simple

​

March 26, 2020

​

August 24, 2020

​

2005

5

​

Renaissance Orlando at SeaWorld®

​

Florida

​

Marriott

​

781

​

8.54%

​

Fee Simple

​

March 20, 2020

​

October 1, 2020

​

2005

6

​

Wailea Beach Resort

​

Hawaii

​

Marriott

​

547

​

5.98%

​

Fee Simple

​

March 25, 2020

​

November 1, 2020

​

2014

7

​

JW Marriott New Orleans (4)

​

Louisiana

​

Marriott

​

501

​

5.48%

​

Fee Simple

​

March 28, 2020

​

July 14, 2020

​

2011

8

​

Hyatt Centric Chicago Magnificent Mile (3)

​

Illinois

​

Hyatt

​

419

​

4.58%

​

Leasehold

​

April 6, 2020

​

July 13, 2020

​

2012

9

​

Marriott Boston Long Wharf

​

Massachusetts

​

Marriott

​

415

​

4.54%

​

Fee Simple

​

March 12, 2020

​

July 7, 2020

​

2007

10

​

Renaissance Long Beach

​

California

​

Marriott

​

374

​

4.09%

​

Fee Simple

​

Open

​

N/A

​

2005

11

​

Embassy Suites Chicago

​

Illinois

​

Hilton

​

368

​

4.02%

​

Fee Simple

​

April 1, 2020

​

July 1, 2020

​

2002

12

​

Hilton Garden Inn Chicago Downtown/Magnificent Mile

​

Illinois

​

Hilton

​

361

​

3.95%

​

Fee Simple

​

March 27, 2020

​

April 1, 2021

​

2012

13

​

Renaissance Westchester

​

New York

​

Marriott

​

348

​

3.80%

​

Fee Simple

​

April 4, 2020

​

​

​

2010

14

​

Embassy Suites La Jolla

​

California

​

Hilton

​

340

​

3.72%

​

Fee Simple

​

Open

​

N/A

​

2006

15

​

The Bidwell Marriott Portland

​

Oregon

​

Marriott

​

258

​

2.82%

​

Fee Simple

​

March 27, 2020

​

October 5, 2020

​

2000

16

​

Hilton New Orleans St. Charles

​

Louisiana

​

Hilton

​

252

​

2.76%

​

Fee Simple

​

March 28, 2020

​

July 13, 2020

​

2013

17

​

Oceans Edge Resort & Marina

​

Florida

​

Independent

​

175

​

1.91%

​

Fee Simple

​

March 22, 2020

​

June 4, 2020

​

2017

18

​

Montage Healdsburg (5)

​

California

​

Montage

​

130

​

1.42%

​

Fee Simple

​

Open

​

N/A

​

2021

​

​

​

​

​

​

​

​

​

​

​

​

​

​

​

​

​

​

​

​

​

Total 18 Hotel Portfolio

​

​

​

​

​

9,147

​

100%

​

​

​

​

​

​

​

​

​

(1)In March 2020, the COVID-19 pandemic was declared a National Public Health Emergency, which led to material group cancellations, corporate and government travel restrictions and an unprecedented decline in hotel demand. As a result of these cancellations, restrictions and the health concerns related to COVID-19, the Company determined that it was in the best interest of its hotel employees and the communities in which its hotels operate to temporarily suspend operations at the majority of its hotels. As of the date of this presentation, operations continue to be temporarily suspended at one of the Company’s hotels, and 17 hotels are operating under a significantly reduced capacity.
(2)The Company owns 75% of the joint venture that owns the Hilton San Diego Bayfront.
(3)Assuming the full exercise of all lease extensions, the ground lease at the Hilton San Diego Bayfront and the building lease at the Hyatt Centric Chicago Magnificent Mile mature in 2071 and 2097, respectively.
(4)Hotel is subject to a municipal airspace lease that matures in 2044 and applies only to certain balcony space fronting Canal Street that is not integral to the hotel’s operations.
(5)In April 2021, the Company acquired the newly constructed luxury resort Montage Healdsburg, which was completed in December 2020.

​

​

​

​

​

​

PROPERTY-LEVEL DATA

​

Page 28

​

​

​

Graphic

Graphic

BPP-Lobby-Bar

​

Wailea Beach Resort Slide

Graphic

Graphic

Graphic

Outside Shot

​

​

​

​


​

Graphic

Supplemental Financial Information
May 3, 2021

​

PROPERTY-LEVEL OPERATING STATISTICS

​

​

​

​

​

​

​

​

​

​

​

​

​

​

​

​

​

​

PROPERTY-LEVEL OPERATING STATISTICS

​

Page 29

​

​

​

Graphic

Graphic

BPP-Lobby-Bar

​

Wailea Beach Resort Slide

Graphic

Graphic

Graphic

Outside Shot

​

​

​


​

Graphic

Supplemental Financial Information
May 3, 2021

Property-Level Operating Statistics

Q1 2021/2020

​

​

​

​

​

​

​

​

​

​

​

​

​

​

​

​

​

​

​

​

​

​

​

​

​

​

​

​

​

​

ADR

​

Occupancy

​

​

RevPAR

​

​

Hotels sorted by number of rooms

​

For the Three Months Ended March 31,

​

For the Three Months Ended March 31,

​

For the Three Months Ended March 31,

​

​

​


2021

​


2020


Change


2021


2020


Change


2021


2020


Change

1

​

Hilton San Diego Bayfront

​

$

141.47

​

$

242.45

​

(41.6)%

​

16.1%

​

59.5%

​

(72.9)%

​

$

22.78

​

$

144.26

​

(84.2)%

2

​

Boston Park Plaza

​

$

140.65

​

$

147.71

​

(4.8)%

​

15.3%

​

55.8%

​

(72.6)%

​

$

21.52

​

$

82.42

​

(73.9)%

3

​

Hyatt Regency San Francisco

​

$

193.28

​

$

320.43

​

(39.7)%

​

8.9%

​

60.1%

​

(85.2)%

​

$

17.20

​

$

192.58

​

(91.1)%

4

​

Renaissance Washington DC

​

$

142.23

​

$

223.48

​

(36.4)%

​

53.2%

​

56.6%

​

(6.0)%

​

$

75.67

​

$

126.49

​

(40.2)%

5

​

Renaissance Orlando at SeaWorld ®

​

$

124.87

​

$

193.68

​

(35.5)%

​

19.3%

​

58.4%

​

(67.0)%

​

$

24.10

​

$

113.11

​

(78.7)%

6

​

Wailea Beach Resort

​

$

531.17

​

$

550.69

​

(3.5)%

​

34.7%

​

76.0%

​

(54.3)%

​

$

184.32

​

$

418.52

​

(56.0)%

7

​

JW Marriott New Orleans

​

$

145.40

​

$

229.11

​

(36.5)%

​

23.5%

​

64.5%

​

(63.6)%

​

$

34.17

​

$

147.78

​

(76.9)%

8

​

Hyatt Centric Chicago Magnificent Mile

​

$

144.72

​

$

126.91

​

14.0%

​

12.5%

​

48.2%

​

(74.1)%

​

$

18.09

​

$

61.17

​

(70.4)%

9

​

Marriott Boston Long Wharf

​

$

231.39

​

$

228.33

​

1.3%

​

9.9%

​

60.5%

​

(83.6)%

​

$

22.91

​

$

138.14

​

(83.4)%

10

​

Renaissance Long Beach

​

$

134.05

​

$

188.10

​

(28.7)%

​

27.5%

​

66.5%

​

(58.6)%

​

$

36.86

​

$

125.09

​

(70.5)%

11

​

Embassy Suites Chicago

​

$

126.70

​

$

121.79

​

4.0%

​

14.5%

​

59.8%

​

(75.8)%

​

$

18.37

​

$

72.83

​

(74.8)%

12

​

Embassy Suites La Jolla

​

$

119.25

​

$

190.37

​

(37.4)%

​

47.9%

​

72.8%

​

(34.2)%

​

$

57.12

​

$

138.59

​

(58.8)%

13

​

The Bidwell Marriott Portland (1)

​

$

139.65

​

$

141.72

​

(1.5)%

​

9.9%

​

39.1%

​

(74.7)%

​

$

13.83

​

$

55.41

​

(75.0)%

14


Hilton New Orleans St. Charles

​

$

107.89

​

$

183.38

​

(41.2)%

​

23.6%

​

64.8%

​

(63.6)%

​

$

25.46

​

$

118.83

​

(78.6)%

15

​

Oceans Edge Resort & Marina

​

$

380.69

​

$

329.84

​

15.4%

​

77.2%

​

78.6%

​

(1.8)%

​

$

293.89

​

$

259.25

​

13.4%

​

​

​

​

​

​

​

​

​

​

​

​

​

​

​

​

​

​

​

​

​

​

​

​

​

​

​

15 Hotels Open for the Entire First Quarter of 2021

​

$

195.32

​

$

240.08

​

(18.6)%

​

23.4%

​

60.4%

​

(61.3)%

​

$

45.70

​

$

145.01

​

(68.5)%

​

​

​

​

​

​

​

​

​

​

​

​

​

​

​

​

​

​

​

​

​

​

​

​

​

​

​

2 Hotels with Suspended Operations During All of the First Quarter of 2021

​

$

—

​

$

123.88

​

(100.0)%

​

0.0%

​

49.7%

​

(100.0)%

​

$

—

​

$

61.57

​

(100.0)%

​

​

​

​

​

​

​

​

​

​

​

​

​

​

​

​

​

​

​

​

​

​

​

​

​

​

​

17 Hotel Portfolio (2)

​

$

195.32

​

$

232.45

​

(16.0)%

​

21.6%

​

59.6%

​

(63.8)%

​

$

42.19

​

$

138.54

​

(69.5)%

​

​

​

​

​

​

​

​

​

​

​

​

​

​

​

​

​

​

​

​

​

​

​

​

​

​

​

Sold/Disposed Hotels (3)

​

$

—

​

$

151.14

​

(100.0)%

​

0.0%

​

63.2%

​

(100.0)%

​

$

—

​

$

95.52

​

(100.0)%

​

​

​

​

​

​

​

​

​

​

​

​

​

​

​

​

​

​

​

​

​

​

​

​

​

​

​

Actual Portfolio (4)

​

$

195.32

​

$

219.54

​

(11.0)%

​

21.6%

​

60.1%

​

(64.1)%

​

$

42.19

​

$

131.94

​

(68.0)%

​

​

​

​

​

​

​

​

​

​

​

​

​

​

​

​

​

​

​

​

​

​

​

​

​

​

​

Montage Healdsburg (5)

​

$

875.29

​

​

N/A

​

N/A

​

20.4%

​

N/A

​

N/A

​

$

178.56

​

​

N/A

​

N/A

​

​

​

​

​

​

​

​

​

​

​

​

​

​

​

​

​

​

​

​

​

​

​

​

​

​

​

18 Hotel Pro Forma Portfolio (6)

​

$

204.45

​

​

​

​

​

​

21.6%

​

​

​

​

​

$

44.16

​

​

​

​

​

*Footnotes on page 38

​

PROPERTY-LEVEL OPERATING STATISTICS

​

Page 30

​

​

​

Graphic

Graphic

BPP-Lobby-Bar

​

Wailea Beach Resort Slide

Graphic

Graphic

Graphic

Outside Shot

​

​


​

Graphic

Supplemental Financial Information
May 3, 2021

Property-Level Operating Statistics

Q1 2021/2019

​

​

​

​

​

​

​

​

​

​

​

​

​

​

​

​

​

​

​

​

​

​

​

​

​

​

​

​

​

​

ADR

​

Occupancy

​

​

RevPAR

​

​

Hotels sorted by number of rooms

​

For the Three Months Ended March 31,

​

For the Three Months Ended March 31,

​

For the Three Months Ended March 31,

​

​

​


2021

​


2019


Change


2021


2019


Change


2021


2019


Change

1

​

Hilton San Diego Bayfront (1)

​

$

141.47

​

$

257.17

​

(45.0)%

​

16.1%

​

75.4%

​

(78.6)%

​

$

22.78

​

$

193.91

​

(88.3)%

2

​

Boston Park Plaza

​

$

140.65

​

$

155.36

​

(9.5)%

​

15.3%

​

80.8%

​

(81.1)%

​

$

21.52

​

$

125.53

​

(82.9)%

3

​

Hyatt Regency San Francisco

​

$

193.28

​

$

353.37

​

(45.3)%

​

8.9%

​

84.2%

​

(89.4)%

​

$

17.20

​

$

297.54

​

(94.2)%

4

​

Renaissance Washington DC

​

$

142.23

​

$

242.86

​

(41.4)%

​

53.2%

​

73.5%

​

(27.6)%

​

$

75.67

​

$

178.50

​

(57.6)%

5

​

Renaissance Orlando at SeaWorld ®

​

$

124.87

​

$

197.30

​

(36.7)%

​

19.3%

​

83.8%

​

(77.0)%

​

$

24.10

​

$

165.34

​

(85.4)%

6

​

Wailea Beach Resort

​

$

531.17

​

$

496.33

​

7.0%

​

34.7%

​

92.8%

​

(62.6)%

​

$

184.32

​

$

460.59

​

(60.0)%

7

​

JW Marriott New Orleans

​

$

145.40

​

$

226.85

​

(35.9)%

​

23.5%

​

86.4%

​

(72.8)%

​

$

34.17

​

$

196.00

​

(82.6)%

8

​

Hyatt Centric Chicago Magnificent Mile

​

$

144.72

​

$

125.94

​

14.9%

​

12.5%

​

68.9%

​

(81.9)%

​

$

18.09

​

$

86.77

​

(79.2)%

9

​

Marriott Boston Long Wharf

​

$

231.39

​

$

231.95

​

(0.2)%

​

9.9%

​

78.5%

​

(87.4)%

​

$

22.91

​

$

182.08

​

(87.4)%

10

​

Renaissance Long Beach

​

$

134.05

​

$

192.79

​

(30.5)%

​

27.5%

​

82.7%

​

(66.7)%

​

$

36.86

​

$

159.44

​

(76.9)%

11

​

Embassy Suites Chicago

​

$

126.70

​

$

126.11

​

0.5%

​

14.5%

​

80.6%

​

(82.0)%

​

$

18.37

​

$

101.64

​

(81.9)%

12

​

Embassy Suites La Jolla

​

$

119.25

​

$

195.39

​

(39.0)%

​

47.9%

​

87.7%

​

(45.4)%

​

$

57.12

​

$

171.36

​

(66.7)%

13

​

The Bidwell Marriott Portland

​

$

139.65

​

$

162.13

​

(13.9)%

​

9.9%

​

79.0%

​

(87.5)%

​

$

13.83

​

$

128.08

​

(89.2)%

14


Hilton New Orleans St. Charles

​

$

107.89

​

$

189.41

​

(43.0)%

​

23.6%

​

79.6%

​

(70.4)%

​

$

25.46

​

$

150.77

​

(83.1)%

15

​

Oceans Edge Resort & Marina

​

$

380.69

​

$

313.20

​

21.5%

​

77.2%

​

95.0%

​

(18.7)%

​

$

293.89

​

$

297.54

​

(1.2)%

​

​

​

​

​

​

​

​

​

​

​

​

​

​

​

​

​

​

​

​

​

​

​

​

​

​

​

15 Hotels Open for the Entire First Quarter of 2021

​

$

195.32

​

$

241.08

​

(19.0)%

​

23.4%

​

80.9%

​

(71.1)%

​

$

45.70

​

$

195.03

​

(76.6)%

​

​

​

​

​

​

​

​

​

​

​

​

​

​

​

​

​

​

​

​

​

​

​

​

​

​

​

2 Hotels with Suspended Operations During All of the First Quarter of 2021

​

$

—

​

$

124.49

​

(100.0)%

​

0.0%

​

67.3%

​

(100.0)%

​

$

—

​

$

83.78

​

(100.0)%

​

​

​

​

​

​

​

​

​

​

​

​

​

​

​

​

​

​

​

​

​

​

​

​

​

​

​

17 Hotel Portfolio (2)

​

$

195.32

​

$

233.33

​

(16.3)%

​

21.6%

​

79.8%

​

(72.9)%

​

$

42.19

​

$

186.20

​

(77.3)%

​

​

​

​

​

​

​

​

​

​

​

​

​

​

​

​

​

​

​

​

​

​

​

​

​

​

​

Sold/Disposed Hotels (3) (1)

​

$

—

​

$

173.20

​

(100.0)%

​

0.0%

​

75.8%

​

(100.0)%

​

$

—

​

$

131.29

​

(100.0)%

​

​

​

​

​

​

​

​

​

​

​

​

​

​

​

​

​

​

​

​

​

​

​

​

​

​

​

Actual Portfolio (4)

​

$

195.32

​

$

223.78

​

(12.7)%

​

21.6%

​

79.2%

​

(72.7)%

​

$

42.19

​

$

177.23

​

(76.2)%

​

​

​

​

​

​

​

​

​

​

​

​

​

​

​

​

​

​

​

​

​

​

​

​

​

​

​

Montage Healdsburg (5)

​

$

875.29

​

​

N/A

​

N/A

​

20.4%

​

N/A

​

N/A

​

$

178.56

​

​

N/A

​

N/A

​

​

​

​

​

​

​

​

​

​

​

​

​

​

​

​

​

​

​

​

​

​

​

​

​

​

​

18 Hotel Pro Forma Portfolio (6)

​

$

204.45

​

​

​

​

​

​

21.6%

​

​

​

​

​

$

44.16

​

​

​

​

​

*Footnotes on page 38

​

​

PROPERTY-LEVEL OPERATING STATISTICS

​

Page 31

​

​

​

Graphic

Graphic

BPP-Lobby-Bar

​

Wailea Beach Resort Slide

Graphic

Graphic

Graphic

Outside Shot

​

​


​

Graphic

Supplemental Financial Information
May 3, 2021

Property-Level Operating Statistics

January 2021/2020

​

​

​

​

​

​

​

​

​

​

​

​

​

​

​

​

​

​

​

​

​

​

​

​

​

​

​

​

​

​

ADR

​

Occupancy

​

​

RevPAR

​

​

Hotels sorted by number of rooms

​

January

​

January

​

January

​

​

​


2021

​


2020


Change


2021


2020


Change


2021


2020


Change

1

​

Hilton San Diego Bayfront

​

$

119.40

​

$

221.94

​

(46.2)%

​

8.3%

​

77.2%

​

(89.2)%

​

$

9.91

​

$

171.34

​

(94.2)%

2

​

Boston Park Plaza

​

$

143.52

​

$

138.41

​

3.7%

​

11.2%

​

66.8%

​

(83.2)%

​

$

16.07

​

$

92.46

​

(82.6)%

3

​

Hyatt Regency San Francisco

​

$

169.87

​

$

351.67

​

(51.7)%

​

6.9%

​

77.6%

​

(91.1)%

​

$

11.72

​

$

272.90

​

(95.7)%

4

​

Renaissance Washington DC

​

$

173.46

​

$

180.18

​

(3.7)%

​

29.4%

​

62.6%

​

(53.0)%

​

$

51.00

​

$

112.79

​

(54.8)%

5

​

Renaissance Orlando at SeaWorld ®

​

$

122.51

​

$

196.55

​

(37.7)%

​

7.9%

​

68.8%

​

(88.5)%

​

$

9.68

​

$

135.23

​

(92.8)%

6

​

Wailea Beach Resort

​

$

524.04

​

$

556.25

​

(5.8)%

​

19.3%

​

88.0%

​

(78.1)%

​

$

101.14

​

$

489.50

​

(79.3)%

7

​

JW Marriott New Orleans

​

$

138.06

​

$

219.30

​

(37.0)%

​

16.6%

​

79.8%

​

(79.2)%

​

$

22.92

​

$

175.00

​

(86.9)%

8

​

Hyatt Centric Chicago Magnificent Mile

​

$

134.84

​

$

117.17

​

15.1%

​

8.0%

​

62.0%

​

(87.1)%

​

$

10.79

​

$

72.65

​

(85.1)%

9

​

Marriott Boston Long Wharf

​

$

214.80

​

$

216.35

​

(0.7)%

​

5.1%

​

74.7%

​

(93.2)%

​

$

10.95

​

$

161.61

​

(93.2)%

10

​

Renaissance Long Beach

​

$

137.63

​

$

182.47

​

(24.6)%

​

13.8%

​

80.6%

​

(82.9)%

​

$

18.99

​

$

147.07

​

(87.1)%

11

​

Embassy Suites Chicago

​

$

115.27

​

$

111.74

​

3.2%

​

9.2%

​

73.7%

​

(87.5)%

​

$

10.60

​

$

82.35

​

(87.1)%

12

​

Embassy Suites La Jolla

​

$

109.48

​

$

188.27

​

(41.8)%

​

37.6%

​

83.1%

​

(54.8)%

​

$

41.16

​

$

156.45

​

(73.7)%

13

​

The Bidwell Marriott Portland (1)

​

$

128.62

​

$

143.32

​

(10.3)%

​

7.0%

​

47.0%

​

(85.1)%

​

$

9.00

​

$

67.36

​

(86.6)%

14


Hilton New Orleans St. Charles

​

$

108.68

​

$

171.82

​

(36.7)%

​

16.9%

​

79.5%

​

(78.7)%

​

$

18.37

​

$

136.60

​

(86.6)%

15

​

Oceans Edge Resort & Marina

​

$

263.07

​

$

304.52

​

(13.6)%

​

60.8%

​

89.7%

​

(32.2)%

​

$

159.95

​

$

273.15

​

(41.4)%

​

​

​

​

​

​

​

​

​

​

​

​

​

​

​

​

​

​

​

​

​

​

​

​

​

​

​

15 Hotels Open for the Entire First Quarter of 2021

​

$

186.33

​

$

232.14

​

(19.7)%

​

14.4%

​

73.4%

​

(80.4)%

​

$

26.83

​

$

170.39

​

(84.3)%

​

​

​

​

​

​

​

​

​

​

​

​

​

​

​

​

​

​

​

​

​

​

​

​

​

​

​

2 Hotels with Suspended Operations During All of the First Quarter of 2021

​

$

—

​

$

125.22

​

(100.0)%

​

0.0%

​

59.2%

​

(100.0)%

​

$

—

​

$

74.13

​

(100.0)%

​

​

​

​

​

​

​

​

​

​

​

​

​

​

​

​

​

​

​

​

​

​

​

​

​

​

​

17 Hotel Portfolio (2)

​

$

186.33

​

$

225.24

​

(17.3)%

​

13.3%

​

72.2%

​

(81.6)%

​

$

24.78

​

$

162.62

​

(84.8)%

​

​

​

​

​

​

​

​

​

​

​

​

​

​

​

​

​

​

​

​

​

​

​

​

​

​

​

Sold/Disposed Hotels (3)

​

$

—

​

$

154.08

​

(100.0)%

​

0.0%

​

76.0%

​

(100.0)%

​

$

—

​

$

117.10

​

(100.0)%

​

​

​

​

​

​

​

​

​

​

​

​

​

​

​

​

​

​

​

​

​

​

​

​

​

​

​

Actual Portfolio (4)

​

$

186.33

​

$

214.02

​

(12.9)%

​

13.3%

​

72.8%

​

(81.7)%

​

$

24.78

​

$

155.81

​

(84.1)%

​

​

​

​

​

​

​

​

​

​

​

​

​

​

​

​

​

​

​

​

​

​

​

​

​

​

​

Montage Healdsburg (5)

​

$

762.81

​

​

N/A

​

N/A

​

4.9%

​

N/A

​

N/A

​

$

37.38

​

​

N/A

​

N/A

​

​

​

​

​

​

​

​

​

​

​

​

​

​

​

​

​

​

​

​

​

​

​

​

​

​

​

18 Hotel Pro Forma Portfolio (6)

​

$

189.39

​

​

​

​

​

​

13.2%

​

​

​

​

​

$

25.00

​

​

​

​

​

*Footnotes on page 38

​

​

PROPERTY-LEVEL OPERATING STATISTICS

​

Page 32

​

​

​

Graphic

Graphic

BPP-Lobby-Bar

​

Wailea Beach Resort Slide

Graphic

Graphic

Graphic

Outside Shot

​

​


​

Graphic

Supplemental Financial Information
May 3, 2021

Property-Level Operating Statistics

January 2021/2019

​

​

​

​

​

​

​

​

​

​

​

​

​

​

​

​

​

​

​

​

​

​

​

​

​

​

​

​

​

​

ADR

​

Occupancy

​

​

RevPAR

​

​

Hotels sorted by number of rooms

​

January

​

January

​

January

​

​

​


2021

​


2019


Change


2021


2019


Change


2021


2019


Change

1

​

Hilton San Diego Bayfront (1)

​

$

119.40

​

$

231.72

​

(48.5)%

​

8.3%

​

68.2%

​

(87.8)%

​

$

9.91

​

$

158.03

​

(93.7)%

2

​

Boston Park Plaza

​

$

143.52

​

$

142.16

​

1.0%

​

11.2%

​

75.6%

​

(85.2)%

​

$

16.07

​

$

107.47

​

(85.0)%

3

​

Hyatt Regency San Francisco

​

$

169.87

​

$

396.40

​

(57.1)%

​

6.9%

​

77.0%

​

(91.0)%

​

$

11.72

​

$

305.23

​

(96.2)%

4

​

Renaissance Washington DC

​

$

173.46

​

$

185.07

​

(6.3)%

​

29.4%

​

61.0%

​

(51.8)%

​

$

51.00

​

$

112.89

​

(54.8)%

5

​

Renaissance Orlando at SeaWorld ®

​

$

122.51

​

$

194.14

​

(36.9)%

​

7.9%

​

78.9%

​

(90.0)%

​

$

9.68

​

$

153.18

​

(93.7)%

6

​

Wailea Beach Resort

​

$

524.04

​

$

491.86

​

6.5%

​

19.3%

​

91.0%

​

(78.8)%

​

$

101.14

​

$

447.59

​

(77.4)%

7

​

JW Marriott New Orleans

​

$

138.06

​

$

196.26

​

(29.7)%

​

16.6%

​

84.9%

​

(80.4)%

​

$

22.92

​

$

166.62

​

(86.2)%

8

​

Hyatt Centric Chicago Magnificent Mile

​

$

134.84

​

$

106.52

​

26.6%

​

8.0%

​

55.7%

​

(85.6)%

​

$

10.79

​

$

59.33

​

(81.8)%

9

​

Marriott Boston Long Wharf

​

$

214.80

​

$

209.78

​

2.4%

​

5.1%

​

68.5%

​

(92.6)%

​

$

10.95

​

$

143.70

​

(92.4)%

10

​

Renaissance Long Beach

​

$

137.63

​

$

183.97

​

(25.2)%

​

13.8%

​

71.7%

​

(80.8)%

​

$

18.99

​

$

131.91

​

(85.6)%

11

​

Embassy Suites Chicago

​

$

115.27

​

$

101.67

​

13.4%

​

9.2%

​

66.0%

​

(86.1)%

​

$

10.60

​

$

67.10

​

(84.2)%

12

​

Embassy Suites La Jolla

​

$

109.48

​

$

189.14

​

(42.1)%

​

37.6%

​

85.2%

​

(55.9)%

​

$

41.16

​

$

161.15

​

(74.5)%

13

​

The Bidwell Marriott Portland

​

$

128.62

​

$

153.75

​

(16.3)%

​

7.0%

​

72.4%

​

(90.3)%

​

$

9.00

​

$

111.32

​

(91.9)%

14


Hilton New Orleans St. Charles

​

$

108.68

​

$

161.66

​

(32.8)%

​

16.9%

​

74.2%

​

(77.2)%

​

$

18.37

​

$

119.95

​

(84.7)%

15

​

Oceans Edge Resort & Marina

​

$

263.07

​

$

252.45

​

4.2%

​

60.8%

​

94.0%

​

(35.3)%

​

$

159.95

​

$

237.30

​

(32.6)%

​

​

​

​

​

​

​

​

​

​

​

​

​

​

​

​

​

​

​

​

​

​

​

​

​

​

​

15 Hotels Open for the Entire First Quarter of 2021

​

$

186.33

​

$

228.87

​

(18.6)%

​

14.4%

​

73.8%

​

(80.5)%

​

$

26.83

​

$

168.91

​

(84.1)%

​

​

​

​

​

​

​

​

​

​

​

​

​

​

​

​

​

​

​

​

​

​

​

​

​

​

​

2 Hotels with Suspended Operations During All of the First Quarter of 2021

​

$

—

​

$

115.70

​

(100.0)%

​

0.0%

​

60.1%

​

(100.0)%

​

$

—

​

$

69.54

​

(100.0)%

​

​

​

​

​

​

​

​

​

​

​

​

​

​

​

​

​

​

​

​

​

​

​

​

​

​

​

17 Hotel Portfolio (2)

​

$

186.33

​

$

221.50

​

(15.9)%

​

13.3%

​

72.7%

​

(81.7)%

​

$

24.78

​

$

161.03

​

(84.6)%

​

​

​

​

​

​

​

​

​

​

​

​

​

​

​

​

​

​

​

​

​

​

​

​

​

​

​

Sold/Disposed Hotels (3) (1)

​

$

—

​

$

161.03

​

(100.0)%

​

0.0%

​

72.6%

​

(100.0)%

​

$

—

​

$

116.91

​

(100.0)%

​

​

​

​

​

​

​

​

​

​

​

​

​

​

​

​

​

​

​

​

​

​

​

​

​

​

​

Actual Portfolio (4)

​

$

186.33

​

$

211.48

​

(11.9)%

​

13.3%

​

72.7%

​

(81.7)%

​

$

24.78

​

$

153.75

​

(83.9)%

​

​

​

​

​

​

​

​

​

​

​

​

​

​

​

​

​

​

​

​

​

​

​

​

​

​

​

Montage Healdsburg (5)

​

$

762.81

​

​

N/A

​

N/A

​

4.9%

​

N/A

​

N/A

​

$

37.38

​

​

N/A

​

N/A

​

​

​

​

​

​

​

​

​

​

​

​

​

​

​

​

​

​

​

​

​

​

​

​

​

​

​

18 Hotel Pro Forma Portfolio (6)

​

$

189.39

​

​

​

​

​

​

13.2%

​

​

​

​

​

$

25.00

​

​

​

​

​

​

*Footnotes on page 38

​

​

PROPERTY-LEVEL OPERATING STATISTICS

​

Page 33

​

​

​

Graphic

Graphic

BPP-Lobby-Bar

​

Wailea Beach Resort Slide

Graphic

Graphic

Graphic

Outside Shot

​

​


​

Graphic

Supplemental Financial Information
May 3, 2021

Property-Level Operating Statistics

February 2021/2020

​

​

​

​

​

​

​

​

​

​

​

​

​

​

​

​

​

​

​

​

​

​

​

​

​

​

​

​

​

​

ADR

​

Occupancy

​

​

RevPAR

​

​

Hotels sorted by number of rooms

​

February

​

February

​

February

​

​

​


2021

​


2020


Change


2021


2020


Change


2021


2020


Change

1

​

Hilton San Diego Bayfront

​

$

147.03

​

$

261.15

​

(43.7)%

​

16.2%

​

83.9%

​

(80.7)%

​

$

23.82

​

$

219.10

​

(89.1)%

2

​

Boston Park Plaza

​

$

141.00

​

$

145.74

​

(3.3)%

​

16.4%

​

69.5%

​

(76.4)%

​

$

23.12

​

$

101.29

​

(77.2)%

3

​

Hyatt Regency San Francisco

​

$

197.02

​

$

301.04

​

(34.6)%

​

8.5%

​

82.6%

​

(89.7)%

​

$

16.75

​

$

248.66

​

(93.3)%

4

​

Renaissance Washington DC

​

$

134.84

​

$

232.97

​

(42.1)%

​

67.8%

​

75.8%

​

(10.6)%

​

$

91.42

​

$

176.59

​

(48.2)%

5

​

Renaissance Orlando at SeaWorld ®

​

$

114.77

​

$

192.31

​

(40.3)%

​

15.8%

​

87.7%

​

(82.0)%

​

$

18.13

​

$

168.66

​

(89.3)%

6

​

Wailea Beach Resort

​

$

510.37

​

$

580.48

​

(12.1)%

​

33.0%

​

92.1%

​

(64.2)%

​

$

168.42

​

$

534.62

​

(68.5)%

7

​

JW Marriott New Orleans

​

$

142.97

​

$

240.41

​

(40.5)%

​

18.2%

​

82.2%

​

(77.9)%

​

$

26.02

​

$

197.62

​

(86.8)%

8

​

Hyatt Centric Chicago Magnificent Mile

​

$

150.18

​

$

132.27

​

13.5%

​

12.4%

​

61.1%

​

(79.7)%

​

$

18.62

​

$

80.82

​

(77.0)%

9

​

Marriott Boston Long Wharf

​

$

222.93

​

$

229.82

​

(3.0)%

​

10.5%

​

84.9%

​

(87.6)%

​

$

23.41

​

$

195.12

​

(88.0)%

10

​

Renaissance Long Beach

​

$

131.96

​

$

191.70

​

(31.2)%

​

31.1%

​

84.9%

​

(63.4)%

​

$

41.04

​

$

162.75

​

(74.8)%

11

​

Embassy Suites Chicago

​

$

128.85

​

$

123.88

​

4.0%

​

12.3%

​

73.9%

​

(83.4)%

​

$

15.85

​

$

91.55

​

(82.7)%

12

​

Embassy Suites La Jolla

​

$

118.27

​

$

197.95

​

(40.3)%

​

48.7%

​

85.8%

​

(43.2)%

​

$

57.60

​

$

169.84

​

(66.1)%

13

​

The Bidwell Marriott Portland (1)

​

$

138.90

​

$

143.86

​

(3.4)%

​

11.3%

​

48.8%

​

(76.8)%

​

$

15.70

​

$

70.20

​

(77.6)%

14


Hilton New Orleans St. Charles

​

$

98.83

​

$

195.75

​

(49.5)%

​

21.1%

​

84.3%

​

(75.0)%

​

$

20.85

​

$

165.02

​

(87.4)%

15

​

Oceans Edge Resort & Marina

​

$

374.45

​

$

362.28

​

3.4%

​

79.7%

​

91.6%

​

(13.0)%

​

$

298.44

​

$

331.85

​

(10.1)%

​

​

​

​

​

​

​

​

​

​

​

​

​

​

​

​

​

​

​

​

​

​

​

​

​

​

​

15 Hotels Open for the Entire First Quarter of 2021

​

$

187.61

​

$

245.44

​

(23.6)%

​

24.4%

​

79.6%

​

(69.3)%

​

$

45.78

​

$

195.37

​

(76.6)%

​

​

​

​

​

​

​

​

​

​

​

​

​

​

​

​

​

​

​

​

​

​

​

​

​

​

​

2 Hotels with Suspended Operations During All of the First Quarter of 2021

​

$

—

​

$

120.04

​

(100.0)%

​

0.0%

​

65.9%

​

(100.0)%

​

$

—

​

$

79.11

​

(100.0)%

​

​

​

​

​

​

​

​

​

​

​

​

​

​

​

​

​

​

​

​

​

​

​

​

​

​

​

17 Hotel Portfolio (2)

​

$

187.61

​

$

237.16

​

(20.9)%

​

22.4%

​

78.6%

​

(71.5)%

​

$

42.02

​

$

186.41

​

(77.5)%

​

​

​

​

​

​

​

​

​

​

​

​

​

​

​

​

​

​

​

​

​

​

​

​

​

​

​

Sold/Disposed Hotels (3)

​

$

—

​

$

150.15

​

(100.0)%

​

0.0%

​

79.9%

​

(100.0)%

​

$

—

​

$

119.97

​

(100.0)%

​

​

​

​

​

​

​

​

​

​

​

​

​

​

​

​

​

​

​

​

​

​

​

​

​

​

​

Actual Portfolio (4)

​

$

187.61

​

$

223.83

​

(16.2)%

​

22.4%

​

78.8%

​

(71.6)%

​

$

42.02

​

$

176.38

​

(76.2)%

​

​

​

​

​

​

​

​

​

​

​

​

​

​

​

​

​

​

​

​

​

​

​

​

​

​

​

Montage Healdsburg (5)

​

$

873.17

​

​

N/A

​

N/A

​

22.6%

​

N/A

​

N/A

​

$

197.34

​

​

N/A

​

N/A

​

​

​

​

​

​

​

​

​

​

​

​

​

​

​

​

​

​

​

​

​

​

​

​

​

​

​

18 Hotel Pro Forma Portfolio (6)

​

$

197.42

​

​

​

​

​

​

22.4%

​

​

​

​

​

$

44.22

​

​

​

​

​

*Footnotes on page 38

​

​

PROPERTY-LEVEL OPERATING STATISTICS

​

Page 34

​

​

​

Graphic

Graphic

BPP-Lobby-Bar

​

Wailea Beach Resort Slide

Graphic

Graphic

Graphic

Outside Shot

​

​


​

Graphic

Supplemental Financial Information
May 3, 2021

Property-Level Operating Statistics

February 2021/2019

​

​

​

​

​

​

​

​

​

​

​

​

​

​

​

​

​

​

​

​

​

​

​

​

​

​

​

​

​

​

ADR

​

Occupancy

​

​

RevPAR

​

​

Hotels sorted by number of rooms

​

February

​

February

​

February

​

​

​


2021

​


2019


Change


2021


2019


Change


2021


2019


Change

1

​

Hilton San Diego Bayfront (1)

​

$

147.03

​

$

279.63

​

(47.4)%

​

16.2%

​

79.8%

​

(79.7)%

​

$

23.82

​

$

223.14

​

(89.3)%

2

​

Boston Park Plaza

​

$

141.00

​

$

136.62

​

3.2%

​

16.4%

​

75.7%

​

(78.3)%

​

$

23.12

​

$

103.42

​

(77.6)%

3

​

Hyatt Regency San Francisco

​

$

197.02

​

$

340.71

​

(42.2)%

​

8.5%

​

87.2%

​

(90.3)%

​

$

16.75

​

$

297.10

​

(94.4)%

4

​

Renaissance Washington DC

​

$

134.84

​

$

229.44

​

(41.2)%

​

67.8%

​

71.7%

​

(5.4)%

​

$

91.42

​

$

164.51

​

(44.4)%

5

​

Renaissance Orlando at SeaWorld ®

​

$

114.77

​

$

205.95

​

(44.3)%

​

15.8%

​

85.2%

​

(81.5)%

​

$

18.13

​

$

175.47

​

(89.7)%

6

​

Wailea Beach Resort

​

$

510.37

​

$

518.96

​

(1.7)%

​

33.0%

​

93.3%

​

(64.6)%

​

$

168.42

​

$

484.19

​

(65.2)%

7

​

JW Marriott New Orleans

​

$

142.97

​

$

234.70

​

(39.1)%

​

18.2%

​

82.5%

​

(77.9)%

​

$

26.02

​

$

193.63

​

(86.6)%

8

​

Hyatt Centric Chicago Magnificent Mile

​

$

150.18

​

$

118.87

​

26.3%

​

12.4%

​

71.1%

​

(82.6)%

​

$

18.62

​

$

84.52

​

(78.0)%

9

​

Marriott Boston Long Wharf

​

$

222.93

​

$

213.35

​

4.5%

​

10.5%

​

81.1%

​

(87.1)%

​

$

23.41

​

$

173.03

​

(86.5)%

10

​

Renaissance Long Beach

​

$

131.96

​

$

198.49

​

(33.5)%

​

31.1%

​

86.5%

​

(64.0)%

​

$

41.04

​

$

171.69

​

(76.1)%

11

​

Embassy Suites Chicago

​

$

128.85

​

$

116.27

​

10.8%

​

12.3%

​

81.6%

​

(84.9)%

​

$

15.85

​

$

94.88

​

(83.3)%

12

​

Embassy Suites La Jolla

​

$

118.27

​

$

199.90

​

(40.8)%

​

48.7%

​

85.8%

​

(43.2)%

​

$

57.60

​

$

171.51

​

(66.4)%

13

​

The Bidwell Marriott Portland

​

$

138.90

​

$

159.01

​

(12.6)%

​

11.3%

​

85.5%

​

(86.8)%

​

$

15.70

​

$

135.95

​

(88.5)%

14


Hilton New Orleans St. Charles

​

$

98.83

​

$

200.35

​

(50.7)%

​

21.1%

​

74.0%

​

(71.5)%

​

$

20.85

​

$

148.26

​

(85.9)%

15

​

Oceans Edge Resort & Marina

​

$

374.45

​

$

341.63

​

9.6%

​

79.7%

​

95.8%

​

(16.8)%

​

$

298.44

​

$

327.28

​

(8.8)%

​

​

​

​

​

​

​

​

​

​

​

​

​

​

​

​

​

​

​

​

​

​

​

​

​

​

​

15 Hotels Open for the Entire First Quarter of 2021

​

$

187.61

​

$

243.23

​

(22.9)%

​

24.4%

​

81.4%

​

(70.0)%

​

$

45.78

​

$

197.99

​

(76.9)%

​

​

​

​

​

​

​

​

​

​

​

​

​

​

​

​

​

​

​

​

​

​

​

​

​

​

​

2 Hotels with Suspended Operations During All of the First Quarter of 2021

​

$

—

​

$

121.53

​

(100.0)%

​

0.0%

​

66.1%

​

(100.0)%

​

$

—

​

$

80.33

​

(100.0)%

​

​

​

​

​

​

​

​

​

​

​

​

​

​

​

​

​

​

​

​

​

​

​

​

​

​

​

17 Hotel Portfolio (2)

​

$

187.61

​

$

235.32

​

(20.3)%

​

22.4%

​

80.2%

​

(72.1)%

​

$

42.02

​

$

188.73

​

(77.7)%

​

​

​

​

​

​

​

​

​

​

​

​

​

​

​

​

​

​

​

​

​

​

​

​

​

​

​

Sold/Disposed Hotels (3) (1)

​

$

—

​

$

165.29

​

(100.0)%

​

0.0%

​

76.8%

​

(100.0)%

​

$

—

​

$

126.94

​

(100.0)%

​

​

​

​

​

​

​

​

​

​

​

​

​

​

​

​

​

​

​

​

​

​

​

​

​

​

​

Actual Portfolio (4)

​

$

187.61

​

$

224.11

​

(16.3)%

​

22.4%

​

79.6%

​

(71.9)%

​

$

42.02

​

$

178.39

​

(76.4)%

​

​

​

​

​

​

​

​

​

​

​

​

​

​

​

​

​

​

​

​

​

​

​

​

​

​

​

Montage Healdsburg (5)

​

$

873.17

​

​

N/A

​

N/A

​

22.6%

​

N/A

​

N/A

​

$

197.34

​

​

N/A

​

N/A

​

​

​

​

​

​

​

​

​

​

​

​

​

​

​

​

​

​

​

​

​

​

​

​

​

​

​

18 Hotel Pro Forma Portfolio (6)

​

$

197.42

​

​

​

​

​

​

22.4%

​

​

​

​

​

$

44.22

​

​

​

​

​

*Footnotes on page 38

​

​

PROPERTY-LEVEL OPERATING STATISTICS

​

Page 35

​

​

​

Graphic

Graphic

BPP-Lobby-Bar

​

Wailea Beach Resort Slide

Graphic

Graphic

Graphic

Outside Shot

​

​


​

Graphic

Supplemental Financial Information
May 3, 2021

Property-Level Operating Statistics

March 2021/2020

​

​

​

​

​

​

​

​

​

​

​

​

​

​

​

​

​

​

​

​

​

​

​

​

​

​

​

​

​

​

ADR

​

Occupancy

​

​

RevPAR

​

​

Hotels sorted by number of rooms

​

March

​

March

​

March

​

​

​


2021

​


2020


Change


2021


2020


Change


2021


2020


Change

1

​

Hilton San Diego Bayfront

​

$

145.79

​

$

248.59

​

(41.4)%

​

23.8%

​

18.9%

​

25.9%

​

$

34.70

​

$

46.98

​

(26.1)%

2

​

Boston Park Plaza

​

$

138.64

​

$

171.07

​

(19.0)%

​

18.5%

​

32.1%

​

(42.4)%

​

$

25.65

​

$

54.91

​

(53.3)%

3

​

Hyatt Regency San Francisco

​

$

205.20

​

$

277.68

​

(26.1)%

​

11.2%

​

21.6%

​

(48.1)%

​

$

22.98

​

$

59.98

​

(61.7)%

4

​

Renaissance Washington DC

​

$

134.93

​

$

286.36

​

(52.9)%

​

63.8%

​

32.4%

​

96.9%

​

$

86.09

​

$

92.78

​

(7.2)%

5

​

Renaissance Orlando at SeaWorld ®

​

$

129.68

​

$

189.54

​

(31.6)%

​

33.9%

​

20.6%

​

64.6%

​

$

43.96

​

$

39.05

​

12.6%

6

​

Wailea Beach Resort

​

$

545.90

​

$

488.43

​

11.8%

​

51.5%

​

49.1%

​

4.9%

​

$

281.14

​

$

239.82

​

17.2%

7

​

JW Marriott New Orleans

​

$

150.03

​

$

226.47

​

(33.8)%

​

35.0%

​

32.5%

​

7.7%

​

$

52.51

​

$

73.60

​

(28.7)%

8

​

Hyatt Centric Chicago Magnificent Mile

​

$

145.79

​

$

140.23

​

4.0%

​

16.9%

​

22.3%

​

(24.2)%

​

$

24.64

​

$

31.27

​

(21.2)%

9

​

Marriott Boston Long Wharf

​

$

243.09

​

$

261.53

​

(7.1)%

​

14.1%

​

23.4%

​

(39.7)%

​

$

34.28

​

$

61.20

​

(44.0)%

10

​

Renaissance Long Beach

​

$

134.29

​

$

192.85

​

(30.4)%

​

37.9%

​

35.3%

​

7.4%

​

$

50.90

​

$

68.08

​

(25.2)%

11

​

Embassy Suites Chicago

​

$

130.41

​

$

139.94

​

(6.8)%

​

21.7%

​

32.8%

​

(33.8)%

​

$

28.30

​

$

45.90

​

(38.3)%

12

​

Embassy Suites La Jolla

​

$

126.40

​

$

181.72

​

(30.4)%

​

57.4%

​

50.2%

​

14.3%

​

$

72.55

​

$

91.22

​

(20.5)%

13

​

The Bidwell Marriott Portland (1)

​

$

147.10

​

$

133.96

​

9.8%

​

11.4%

​

22.2%

​

(48.6)%

​

$

16.77

​

$

29.74

​

(43.6)%

14


Hilton New Orleans St. Charles

​

$

112.78

​

$

181.61

​

(37.9)%

​

32.6%

​

31.8%

​

2.5%

​

$

36.77

​

$

57.75

​

(36.3)%

15

​

Oceans Edge Resort & Marina

​

$

463.81

​

$

320.63

​

44.7%

​

91.4%

​

55.2%

​

65.6%

​

$

423.92

​

$

176.99

​

139.5%

​

​

​

​

​

​

​

​

​

​

​

​

​

​

​

​

​

​

​

​

​

​

​

​

​

​

​

15 Hotels Open for the Entire First Quarter of 2021

​

$

204.78

​

$

246.31

​

(16.9)%

​

31.6%

​

29.4%

​

7.5%

​

$

64.71

​

$

72.42

​

(10.6)%

​

​

​

​

​

​

​

​

​

​

​

​

​

​

​

​

​

​

​

​

​

​

​

​

​

​

​

2 Hotels with Suspended Operations During All of the First Quarter of 2021

​

$

—

​

$

130.17

​

(100.0)%

​

0.0%

​

25.0%

​

(100.0)%

​

$

—

​

$

32.54

​

(100.0)%

​

​

​

​

​

​

​

​

​

​

​

​

​

​

​

​

​

​

​

​

​

​

​

​

​

​

​

17 Hotel Portfolio (2)

​

$

204.78

​

$

238.46

​

(14.1)%

​

29.1%

​

29.1%

​

0.0%

​

$

59.59

​

$

69.39

​

(14.1)%

​

​

​

​

​

​

​

​

​

​

​

​

​

​

​

​

​

​

​

​

​

​

​

​

​

​

​

Sold/Disposed Hotels (3)

​

$

—

​

$

146.83

​

(100.0)%

​

0.0%

​

34.8%

​

(100.0)%

​

$

—

​

$

51.10

​

(100.0)%

​

​

​

​

​

​

​

​

​

​

​

​

​

​

​

​

​

​

​

​

​

​

​

​

​

​

​

Actual Portfolio (4)

​

$

204.78

​

$

222.39

​

(7.9)%

​

29.1%

​

29.9%

​

(2.7)%

​

$

59.59

​

$

66.49

​

(10.4)%

​

​

​

​

​

​

​

​

​

​

​

​

​

​

​

​

​

​

​

​

​

​

​

​

​

​

​

Montage Healdsburg (5)

​

$

892.86

​

​

N/A

​

N/A

​

33.9%

​

N/A

​

N/A

​

$

302.68

​

​

N/A

​

N/A

​

​

​

​

​

​

​

​

​

​

​

​

​

​

​

​

​

​

​

​

​

​

​

​

​

​

​

18 Hotel Pro Forma Portfolio (6)

​

$

216.14

​

​

​

​

​

​

29.2%

​

​

​

​

​

$

63.11

​

​

​

​

​

*Footnotes on page 38

​

​

PROPERTY-LEVEL OPERATING STATISTICS

​

Page 36

​

​

​

Graphic

Graphic

BPP-Lobby-Bar

​

Wailea Beach Resort Slide

Graphic

Graphic

Graphic

Outside Shot

​

​


​

Graphic

Supplemental Financial Information
May 3, 2021

Property-Level Operating Statistics

March 2021/2019

​

​

​

​

​

​

​

​

​

​

​

​

​

​

​

​

​

​

​

​

​

​

​

​

​

​

​

​

​

​

ADR

​

Occupancy

​

​

RevPAR

​

​

Hotels sorted by number of rooms

​

March

​

March

​

March

​

​

​


2021

​


2019


Change


2021


2019


Change


2021


2019


Change

1

​

Hilton San Diego Bayfront (1)

​

$

145.79

​

$

258.62

​

(43.6)%

​

23.8%

​

78.5%

​

(69.7)%

​

$

34.70

​

$

203.02

​

(82.9)%

2

​

Boston Park Plaza

​

$

138.64

​

$

180.55

​

(23.2)%

​

18.5%

​

90.5%

​

(79.6)%

​

$

25.65

​

$

163.40

​

(84.3)%

3

​

Hyatt Regency San Francisco

​

$

205.20

​

$

327.27

​

(37.3)%

​

11.2%

​

88.7%

​

(87.4)%

​

$

22.98

​

$

290.29

​

(92.1)%

4

​

Renaissance Washington DC

​

$

134.93

​

$

292.95

​

(53.9)%

​

63.8%

​

87.7%

​

(27.3)%

​

$

86.09

​

$

256.92

​

(66.5)%

5

​

Renaissance Orlando at SeaWorld ®

​

$

129.68

​

$

192.53

​

(32.6)%

​

33.9%

​

87.4%

​

(61.2)%

​

$

43.96

​

$

168.27

​

(73.9)%

6

​

Wailea Beach Resort

​

$

545.90

​

$

480.37

​

13.6%

​

51.5%

​

94.0%

​

(45.2)%

​

$

281.14

​

$

451.55

​

(37.7)%

7

​

JW Marriott New Orleans

​

$

150.03

​

$

248.88

​

(39.7)%

​

35.0%

​

91.3%

​

(61.7)%

​

$

52.51

​

$

227.23

​

(76.9)%

8

​

Hyatt Centric Chicago Magnificent Mile

​

$

145.79

​

$

145.08

​

0.5%

​

16.9%

​

80.2%

​

(78.9)%

​

$

24.64

​

$

116.35

​

(78.8)%

9

​

Marriott Boston Long Wharf

​

$

243.09

​

$

265.41

​

(8.4)%

​

14.1%

​

86.1%

​

(83.6)%

​

$

34.28

​

$

228.52

​

(85.0)%

10

​

Renaissance Long Beach

​

$

134.29

​

$

194.86

​

(31.1)%

​

37.9%

​

90.2%

​

(58.0)%

​

$

50.90

​

$

175.76

​

(71.0)%

11

​

Embassy Suites Chicago

​

$

130.41

​

$

150.89

​

(13.6)%

​

21.7%

​

94.3%

​

(77.0)%

​

$

28.30

​

$

142.29

​

(80.1)%

12

​

Embassy Suites La Jolla

​

$

126.40

​

$

197.38

​

(36.0)%

​

57.4%

​

91.9%

​

(37.5)%

​

$

72.55

​

$

181.39

​

(60.0)%

13

​

The Bidwell Marriott Portland

​

$

147.10

​

$

172.77

​

(14.9)%

​

11.4%

​

79.6%

​

(85.7)%

​

$

16.77

​

$

137.52

​

(87.8)%

14


Hilton New Orleans St. Charles

​

$

112.78

​

$

204.11

​

(44.7)%

​

32.6%

​

90.2%

​

(63.9)%

​

$

36.77

​

$

184.11

​

(80.0)%

15

​

Oceans Edge Resort & Marina

​

$

463.81

​

$

347.36

​

33.5%

​

91.4%

​

95.2%

​

(4.0)%

​

$

423.92

​

$

330.69

​

28.2%

​

​

​

​

​

​

​

​

​

​

​

​

​

​

​

​

​

​

​

​

​

​

​

​

​

​

​

15 Hotels Open for the Entire First Quarter of 2021

​

$

204.78

​

$

249.58

​

(18.0)%

​

31.6%

​

87.6%

​

(63.9)%

​

$

64.71

​

$

218.63

​

(70.4)%

​

​

​

​

​

​

​

​

​

​

​

​

​

​

​

​

​

​

​

​

​

​

​

​

​

​

​

2 Hotels with Suspended Operations During All of the First Quarter of 2021

​

$

—

​

$

133.80

​

(100.0)%

​

0.0%

​

75.7%

​

(100.0)%

​

$

—

​

$

101.29

​

(100.0)%

​

​

​

​

​

​

​

​

​

​

​

​

​

​

​

​

​

​

​

​

​

​

​

​

​

​

​

17 Hotel Portfolio (2)

​

$

204.78

​

$

241.60

​

(15.2)%

​

29.1%

​

86.6%

​

(66.4)%

​

$

59.59

​

$

209.23

​

(71.5)%

​

​

​

​

​

​

​

​

​

​

​

​

​

​

​

​

​

​

​

​

​

​

​

​

​

​

​

Sold/Disposed Hotels (3) (1)

​

$

—

​

$

191.57

​

(100.0)%

​

0.0%

​

78.0%

​

(100.0)%

​

$

—

​

$

149.42

​

(100.0)%

​

​

​

​

​

​

​

​

​

​

​

​

​

​

​

​

​

​

​

​

​

​

​

​

​

​

​

Actual Portfolio (4)

​

$

204.78

​

$

234.01

​

(12.5)%

​

29.1%

​

85.2%

​

(65.8)%

​

$

59.59

​

$

199.38

​

(70.1)%

​

​

​

​

​

​

​

​

​

​

​

​

​

​

​

​

​

​

​

​

​

​

​

​

​

​

​

Montage Healdsburg (5)

​

$

892.86

​

​

N/A

​

N/A

​

33.9%

​

N/A

​

N/A

​

$

302.68

​

​

N/A

​

N/A

​

​

​

​

​

​

​

​

​

​

​

​

​

​

​

​

​

​

​

​

​

​

​

​

​

​

​

18 Hotel Pro Forma Portfolio (6)

​

$

216.14

​

​

​

​

​

​

29.2%

​

​

​

​

​

$

63.11

​

​

​

​

​

*Footnotes on page 38

​

​

PROPERTY-LEVEL OPERATING STATISTICS

​

Page 37

​

​

​

Graphic

Graphic

BPP-Lobby-Bar

​

Wailea Beach Resort Slide

Graphic

Graphic

Graphic

Outside Shot

​

​


​

Graphic

Supplemental Financial Information
May 3, 2021

Property-Level Operating Statistics

Q1, January, February and March 2021/2020 and 2021/2019

​

​

(1)Operating statistics for the first quarter, January, February and March of 2020 are impacted by a room renovation at The Bidwell Marriott Portland. Operating statistics for the first quarter, January, February and March of 2019 are impacted by room renovations at the Hilton San Diego Bayfront and the Renaissance Harborplace.
(2)17 Hotel Portfolio includes all hotels owned by the Company as of March 31, 2021.
(3)Sold/Disposed Hotels for the first quarter, January, February and March of 2020 include results for the Renaissance Harborplace and the Renaissance Los Angeles Airport, sold in July 2020 and December 2020, respectively, and the Hilton Times Square, assigned to its mortgage holder in December 2020. Sold/Disposed Hotels for the first quarter, January, February and March of 2019 also include results for the Courtyard by Marriott Los Angeles, sold in October 2019.
(4)Actual Portfolio includes the 17 Hotel Portfolio plus the Sold/Disposed Hotels.
(5)Montage Healdsburg was acquired by the Company in April 2021. Includes prior ownership results obtained by the Company from the prior owner of the Montage Healdsburg during the due diligence period before acquiring the hotel. The Company performed a limited review of the information as part of its analysis of the acquisition. The newly developed hotel opened in December 2020; therefore, there is no prior year information.
(6)18 Hotel Pro Forma Portfolio includes the 17 Hotel Portfolio plus the Montage Healdsburg, acquired by the Company in April 2021.

​

​

​

​

​

​

​

​

​

​

​

​

​

​

​

​

​

​

PROPERTY-LEVEL OPERATING STATISTICS

​

Page 38

​

​

​

Graphic

Graphic

BPP-Lobby-Bar

​

Wailea Beach Resort Slide

Graphic

Graphic

Graphic

Outside Shot

​

​

​

​


​

​

​

​

Graphic

Supplemental Financial Information
May 3, 2021

​

PROPERTY-LEVEL ADJUSTED EBITDAre &

ADJUSTED EBITDAre MARGINS

​

​

​

​

​

​

​

​

​

​

​

​

PROPERTY-LEVEL ADJUSTED EBITDAre & ADJUSTED EBITDAre MARGINS

​

Page 39

​

​

​

Graphic

Graphic

BPP-Lobby-Bar

​

Wailea Beach Resort Slide

Graphic

Graphic

Graphic

Outside Shot

​

​

​


​

Graphic

Supplemental Financial Information
May 3, 2021

Property-Level Adjusted EBITDAre and Adjusted EBITDAre Margins

Q1 2021

​

​

​

​

​

​

​

​

​

​

​

​

​

​

​

​

​

​

​

​

​

​

​

​

​

​

Hotels sorted by number of rooms

​

For the Three Months Ended March 31, 2021

​

​

(In thousands)

​

​

​

​

​

Plus:

​

Plus:

​

Plus:

​

Equals:

​

Hotel

​

​

​

​

Total

​

Net Income /

​

Other

​

​

​

​

​

Hotel Adjusted

​

Adjusted EBITDAre

​

​

​


Revenues


(Loss)


Adjustments (1)


Depreciation


Interest Expense


EBITDAre (2)


Margins (2)

1

​

Hilton San Diego Bayfront

​

$

3,955

​

$

(7,899)

​

$

(289)

​

$

3,241

​

$

643

​

$

(4,304)

​

(108.8)%

2

​

Boston Park Plaza

​

​

2,716

​

​

(8,298)

​

​

—

​

​

4,481

​

​

—

​

​

(3,817)

​

(140.5)%

3

​

Hyatt Regency San Francisco

​

​

1,649

​

​

(7,342)

​

​

—

​

​

3,244

​

​

—

​

​

(4,098)

​

(248.5)%

4

​

Renaissance Washington DC

​

​

5,843

​

​

(189)

​

​

(72)

​

​

1,875

​

​

—

​

​

1,614

​

27.6%

5

​

Renaissance Orlando at SeaWorld ®

​

​

3,590

​

​

(3,504)

​

​

—

​

​

2,220

​

​

—

​

​

(1,284)

​

(35.8)%

6

​

Wailea Beach Resort

​

​

12,259

​

​

(480)

​

​

—

​

​

4,081

​

​

—

​

​

3,601

​

29.4%

7

​

JW Marriott New Orleans

​

​

1,933

​

​

(2,998)

​

​

2

​

​

1,612

​

​

842

​

​

(542)

​

(28.0)%

8

​

Hyatt Centric Chicago Magnificent Mile

​

​

769

​

​

(3,395)

​

​

(351)

​

​

1,145

​

​

351

​

​

(2,250)

​

(292.6)%

9

​

Marriott Boston Long Wharf

​

​

1,230

​

​

(4,845)

​

​

—

​

​

2,779

​

​

—

​

​

(2,066)

​

(168.0)%

10

​

Renaissance Long Beach

​

​

1,600

​

​

(1,213)

​

​

—

​

​

845

​

​

—

​

​

(368)

​

(23.0)%

11

​

Embassy Suites Chicago

​

​

867

​

​

(1,984)

​

​

—

​

​

757

​

​

—

​

​

(1,227)

​

(141.5)%

12

​

Embassy Suites La Jolla

​

​

2,104

​

​

(1,588)

​

​

—

​

​

988

​

​

605

​

​

5

​

0.2%

13

​

The Bidwell Marriott Portland

​

​

422

​

​

(1,562)

​

​

—

​

​

807

​

​

—

​

​

(755)

​

(178.9)%

14


Hilton New Orleans St. Charles

​

​

746

​

​

(926)

​

​

—

​

​

619

​

​

—

​

​

(307)

​

(41.2)%

15

​

Oceans Edge Resort & Marina

​

​

6,649

​

​

2,066

​

​

—

​

​

879

​

​

—

​

​

2,945

​

44.3%

​

​

​

​

​

​

​

​

​

​

​

​

​

​

​

​

​

​

​

​

​

​

​

​

​

15 Hotels Open for the Entire First Quarter of 2021

​

​

46,332

​

​

(44,157)

​

​

(710)

​

​

29,573

​

​

2,441

​

​

(12,853)

​

(27.7)%

​

​

​

​

​

​

​

​

​

​

​

​

​

​

​

​

​

​

​

​

​

​

​

​

​

2 Hotels with Suspended Operations During All of the First Quarter of 2021

​

​

238

​

​

(3,278)

​

​

63

​

​

936

​

​

—

​

​

(2,279)

​

(957.6)%

​

​

​

​

​

​

​

​

​

​

​

​

​

​

​

​

​

​

​

​

​

​

​

​

​

17 Hotel Portfolio (3)

​

$

46,570

​

$

(47,435)

​

$

(647)

​

$

30,509

​

$

2,441

​

$

(15,132)

​

(32.5)%

​

*Footnotes on pages 52 and 53

​

​

​

​

PROPERTY-LEVEL ADJUSTED EBITDAre & ADJUSTED EBITDAre MARGINS

​

Page 40

​

​

​

Graphic

Graphic

BPP-Lobby-Bar

​

Wailea Beach Resort Slide

Graphic

Graphic

Graphic

Outside Shot

​

​


​

Graphic

Supplemental Financial Information
May 3, 2021

Property-Level Adjusted EBITDAre and Adjusted EBITDAre Margins

Q1 2020

​

​

​

​

​

​

​

​

​

​

​

​

​

​

​

​

​

​

​

​

​

​

​

​

​

​

Hotels sorted by number of rooms

​

For the Three Months Ended March 31, 2020

​

​

(In thousands)

​

​

​

​

​

Plus:

​

Plus:

​

Plus:

​

Equals:

​

Hotel

​

​

​

​

Total

​

Net Income /

​

Other

​

​

​

​

​

Hotel Adjusted

​

Adjusted EBITDAre

​

​

​


Revenues


(Loss)


Adjustments (1)


Depreciation


Interest Expense


EBITDAre (2)


Margins (2)

1

​

Hilton San Diego Bayfront (4)

​

$

27,040

​

$

(30)

​

$

(290)

​

$

3,217

​

$

1,679

​

$

4,576

​

16.9%

2

​

Boston Park Plaza (4)

​

​

11,357

​

​

(6,771)

​

​

—

​

​

4,514

​

​

—

​

​

(2,257)

​

(19.9)%

3

​

Hyatt Regency San Francisco (4)

​

​

20,779

​

​

(1,136)

​

​

136

​

​

3,230

​

​

—

​

​

2,230

​

10.7%

4

​

Renaissance Washington DC (4)

​

​

14,862

​

​

(2,782)

​

​

—

​

​

2,067

​

​

1,669

​

​

954

​

6.4%

5

​

Renaissance Orlando at SeaWorld ® (4)

​

​

18,805

​

​

2,637

​

​

—

​

​

2,607

​

​

—

​

​

5,244

​

27.9%

6

​

Wailea Beach Resort (4)

​

​

28,817

​

​

6,216

​

​

—

​

​

3,969

​

​

—

​

​

10,185

​

35.3%

7

​

JW Marriott New Orleans (4)

​

​

9,257

​

​

526

​

​

2

​

​

1,636

​

​

871

​

​

3,035

​

32.8%

8

​

Hyatt Centric Chicago Magnificent Mile (4)

​

​

3,304

​

​

(3,683)

​

​

(351)

​

​

1,446

​

​

351

​

​

(2,237)

​

(67.7)%

9

​

Marriott Boston Long Wharf (4)

​

​

8,128

​

​

(3,482)

​

​

—

​

​

2,737

​

​

—

​

​

(745)

​

(9.2)%

10

​

Renaissance Long Beach (4)

​

​

5,765

​

​

(111)

​

​

—

​

​

990

​

​

—

​

​

879

​

15.2%

11

​

Embassy Suites Chicago (4)

​

​

2,929

​

​

(1,513)

​

​

(24)

​

​

753

​

​

—

​

​

(784)

​

(26.8)%

12

​

Embassy Suites La Jolla (4)

​

​

4,991

​

​

(192)

​

​

—

​

​

1,052

​

​

626

​

​

1,486

​

29.8%

13

​

The Bidwell Marriott Portland (4) (5)

​

​

1,413

​

​

(890)

​

​

—

​

​

381

​

​

—

​

​

(509)

​

(36.0)%

14


Hilton New Orleans St. Charles (4)

​

​

3,139

​

​

126

​

​

—

​

​

645

​

​

—

​

​

771

​

24.6%

15

​

Oceans Edge Resort & Marina

​

​

5,965

​

​

1,490

​

​

—

​

​

826

​

​

—

​

​

2,316

​

38.8%

​

​

​

​

​

​

​

​

​

​

​

​

​

​

​

​

​

​

​

​

​

​

​

​

​

15 Hotels Open for the Entire First Quarter of 2021

​

​

166,551

​

​

(9,595)

​

​

(527)

​

​

30,070

​

​

5,196

​

​

25,144

​

15.1%

​

​

​

​

​

​

​

​

​

​

​

​

​

​

​

​

​

​

​

​

​

​

​

​


2 Hotels with Suspended Operations During All of the First Quarter of 2021 (4)

​

​

5,469

​

​

(4,180)

​

​

7

​

​

1,550

​

​

—

​

​

(2,623)

​

(48.0)%

​

​

​

​

​

​

​

​

​

​

​

​

​

​

​

​

​

​

​

​

​

​

​

​

​

17 Hotel Portfolio (3)

​

​

172,020

​

​

(13,775)

​

​

(520)

​

​

31,620

​

​

5,196

​

​

22,521

​

13.1%

​

​

​

​

​

​

​

​

​

​

​

​

​

​

​

​

​

​

​

​

​

​

​

​

​

Add: Sold/Disposed Hotels (6)

​

​

​

​

​

​

​

​

​

​

​

​

​

​

​

​

​

​

​

​

​

​

Renaissance Harborplace (4)

​

​

5,604

​

​

(2,292)

​

​

(57)

​

​

1,329

​

​

—

​

​

(1,020)

​

(18.2)%

​

​

Renaissance Los Angeles Airport (4)

​

​

6,646

​

​

(476)

​

​

—

​

​

1,063

​

​

—

​

​

587

​

8.8%

​

​

Hilton Times Square (4)

​

​

6,920

​

​

(7,459)

​

​

58

​

​

2,478

​

​

1,193

​

​

(3,730)

​

(53.9)%

​

​

​

​

​

​

​

​

​

​

​

​

​

​

​

​

​

​

​

​

​

​

​

​

​

Actual Portfolio (7)

​

$

191,190

​

$

(24,002)

​

$

(519)

​

$

36,490

​

$

6,389

​

$

18,358

​

9.6%

*Footnotes on pages 52 and 53

​

PROPERTY-LEVEL ADJUSTED EBITDAre & ADJUSTED EBITDAre MARGINS

​

Page 41

​

​

​

Graphic

Graphic

BPP-Lobby-Bar

​

Wailea Beach Resort Slide

Graphic

Graphic

Graphic

Outside Shot

​

​


​

Graphic

Supplemental Financial Information
May 3, 2021

Property-Level Adjusted EBITDAre and Adjusted EBITDAre Margins

Q1 2019

​

​

​

​

​

​

​

​

​

​

​

​

​

​

​

​

​

​

​

​

​

​

​

​

​

​

Hotels sorted by number of rooms

​

For the Three Months Ended March 31, 2019

​

​

(In thousands)

​

​

​

​

​

Plus:

​

Plus:

​

Plus:

​

Equals:

​

Hotel

​

​

​

​

Total

​

Net Income /

​

Other

​

​

​

​

​

Hotel Adjusted

​

Adjusted EBITDAre

​

​

​


Revenues


(Loss)


Adjustments (1)


Depreciation


Interest Expense


EBITDAre (2)


Margins (2)

1

​

Hilton San Diego Bayfront (5)

​

$

36,686

​

$

6,405

​

$

(290)

​

$

2,558

​

$

2,238

​

$

10,911

​

29.7%

2

​

Boston Park Plaza

​

​

17,860

​

​

(3,177)

​

​

—

​

​

4,446

​

​

—

​

​

1,269

​

7.1%

3

​

Hyatt Regency San Francisco

​

​

31,197

​

​

5,367

​

​

360

​

​

3,127

​

​

—

​

​

8,854

​

28.4%

4

​

Renaissance Washington DC

​

​

20,896

​

​

1,419

​

​

—

​

​

2,455

​

​

1,713

​

​

5,587

​

26.7%

5

​

Renaissance Orlando at SeaWorld ®

​

​

25,713

​

​

7,670

​

​

—

​

​

2,554

​

​

—

​

​

10,224

​

39.8%

6

​

Wailea Beach Resort

​

​

31,669

​

​

9,340

​

​

—

​

​

3,879

​

​

—

​

​

13,219

​

41.7%

7

​

JW Marriott New Orleans

​

​

11,732

​

​

2,944

​

​

2

​

​

1,597

​

​

880

​

​

5,423

​

46.2%

8

​

Hyatt Centric Chicago Magnificent Mile

​

​

5,108

​

​

(2,493)

​

​

(350)

​

​

1,442

​

​

350

​

​

(1,051)

​

(20.6)%

9

​

Marriott Boston Long Wharf

​

​

10,094

​

​

(1,104)

​

​

—

​

​

2,693

​

​

—

​

​

1,589

​

15.7%

10

​

Renaissance Long Beach

​

​

7,591

​

​

1,469

​

​

—

​

​

946

​

​

—

​

​

2,415

​

31.8%

11

​

Embassy Suites Chicago

​

​

4,166

​

​

(645)

​

​

—

​

​

743

​

​

—

​

​

98

​

2.4%

12

​

Embassy Suites La Jolla

​

​

6,054

​

​

712

​

​

—

​

​

1,031

​

​

632

​

​

2,375

​

39.2%

13

​

The Bidwell Marriott Portland

​

​

3,337

​

​

644

​

​

—

​

​

396

​

​

—

​

​

1,040

​

31.2%

14


Hilton New Orleans St. Charles

​

​

3,877

​

​

543

​

​

—

​

​

623

​

​

—

​

​

1,166

​

30.1%

15

​

Oceans Edge Resort & Marina

​

​

6,732

​

​

1,777

​

​

189

​

​

777

​

​

—

​

​

2,743

​

40.7%

​

​

​

​

​

​

​

​

​

​

​

​

​

​

​

​

​

​

​

​

​

​

​

​

​

15 Hotels Open for the Entire First Quarter of 2021

​

​

222,712

​

​

30,871

​

​

(89)

​

​

29,267

​

​

5,813

​

​

65,862

​

29.6%

​

​

​

​

​

​

​

​

​

​

​

​

​

​

​

​

​

​

​

​

​

​

​

​

​

2 Hotels with Suspended Operations During All of the First Quarter of 2021

​

​

7,176

​

​

(2,120)

​

​

9

​

​

1,538

​

​

—

​

​

(573)

​

(8.0)%

​

​

​

​

​

​

​

​

​

​

​

​

​

​

​

​

​

​

​

​

​

​

​

​

​

17 Hotel Portfolio (3)

​

​

229,888

​

​

28,751

​

​

(80)

​

​

30,805

​

​

5,813

​

​

65,289

​

28.4%

​

​

​

​

​

​

​

​

​

​

​

​

​

​

​

​

​

​

​

​

​

​

​

​

​

Add: Sold/Disposed Hotels (6)

​

​

​

​

​

​

​

​

​

​

​

​

​

​

​

​

​

​

​

​

​

​

Courtyard by Marriott Los Angeles

​

​

3,070

​

​

567

​

​

(239)

​

​

253

​

​

294

​

​

875

​

28.5%

​

​

Renaissance Harborplace (5)

​

​

6,970

​

​

(1,133)

​

​

—

​

​

1,490

​

​

—

​

​

357

​

5.1%

​

​

Renaissance Los Angeles Airport

​

​

7,962

​

​

853

​

​

—

​

​

1,043

​

​

—

​

​

1,896

​

23.8%

​

​

Hilton Times Square

​

​

9,767

​

​

(4,346)

​

​

64

​

​

2,545

​

​

1,188

​

​

(549)

​

(5.6)%

​

​

​

​

​

​

​

​

​

​

​

​

​

​

​

​

​

​

​

​

​

​

​

​

​

Actual Portfolio (7)

​

$

257,657

​

$

24,692

​

$

(255)

​

$

36,136

​

$

7,295

​

$

67,868

​

26.3%

​

*Footnotes on pages 52 and 53

​

PROPERTY-LEVEL ADJUSTED EBITDAre & ADJUSTED EBITDAre MARGINS

​

Page 42

​

​

​

Graphic

Graphic

BPP-Lobby-Bar

​

Wailea Beach Resort Slide

Graphic

Graphic

Graphic

Outside Shot

​

​


​

Graphic

Supplemental Financial Information
May 3, 2021

Property-Level Adjusted EBITDAre and Adjusted EBITDAre Margins

January 2021

​

​

​

​

​

​

​

​

​

​

​

​

​

​

​

​

​

​

​

​

​

​

​

​

​

​

Hotels sorted by number of rooms

​

For the Month of January 2021

​

​

(In thousands)

​

​

​

​

​

Plus:

​

Plus:

​

Plus:

​

Equals:

​

Hotel

​

​

​

​

Total

​

Net Income /

​

Other

​

​

​

​

​

Hotel Adjusted

​

Adjusted EBITDAre

​

​

​


Revenues


(Loss)


Adjustments (8)


Depreciation


Interest Expense


EBITDAre


Margins

1

​

Hilton San Diego Bayfront

​

$

648

​

$

(3,156)

​

$

(97)

​

$

1,080

​

$

224

​

$

(1,949)

​

(300.8)%

2

​

Boston Park Plaza

​

​

654

​

​

(2,976)

​

​

—

​

​

1,504

​

​

—

​

​

(1,472)

​

(225.1)%

3

​

Hyatt Regency San Francisco

​

​

381

​

​

(2,654)

​

​

—

​

​

1,081

​

​

—

​

​

(1,573)

​

(412.9)%

4

​

Renaissance Washington DC

​

​

1,386

​

​

(781)

​

​

—

​

​

625

​

​

—

​

​

(156)

​

(11.3)%

5

​

Renaissance Orlando at SeaWorld ®

​

​

886

​

​

(1,358)

​

​

—

​

​

743

​

​

—

​

​

(615)

​

(69.4)%

6

​

Wailea Beach Resort

​

​

2,367

​

​

(1,387)

​

​

—

​

​

1,357

​

​

—

​

​

(30)

​

(1.3)%

7

​

JW Marriott New Orleans

​

​

472

​

​

(1,150)

​

​

—

​

​

538

​

​

290

​

​

(322)

​

(68.2)%

8

​

Hyatt Centric Chicago Magnificent Mile

​

​

181

​

​

(1,175)

​

​

(117)

​

​

382

​

​

117

​

​

(793)

​

(438.1)%

9

​

Marriott Boston Long Wharf

​

​

226

​

​

(1,912)

​

​

—

​

​

926

​

​

—

​

​

(986)

​

(436.3)%

10

​

Renaissance Long Beach

​

​

285

​

​

(596)

​

​

—

​

​

314

​

​

—

​

​

(282)

​

(98.9)%

11

​

Embassy Suites Chicago

​

​

186

​

​

(729)

​

​

—

​

​

253

​

​

—

​

​

(476)

​

(255.9)%

12

​

Embassy Suites La Jolla

​

​

509

​

​

(662)

​

​

—

​

​

330

​

​

209

​

​

(123)

​

(24.2)%

13

​

The Bidwell Marriott Portland

​

​

92

​

​

(546)

​

​

—

​

​

268

​

​

—

​

​

(278)

​

(302.2)%

14


Hilton New Orleans St. Charles

​

​

190

​

​

(354)

​

​

—

​

​

207

​

​

—

​

​

(147)

​

(77.4)%

15

​

Oceans Edge Resort & Marina

​

​

1,479

​

​

90

​

​

—

​

​

293

​

​

—

​

​

383

​

25.9%

​

​

​

​

​

​

​

​

​

​

​

​

​

​

​

​

​

​

​

​

​

​

​

​

​

15 Hotels Open for the Entire First Quarter of 2021

​

​

9,942

​

​

(19,346)

​

​

(214)

​

​

9,901

​

​

840

​

​

(8,819)

​

(88.7)%

​

​

​

​

​

​

​

​

​

​

​

​

​

​

​

​

​

​

​

​

​

​

​

​

​

2 Hotels with Suspended Operations During All of the First Quarter of 2021

​

​

70

​

​

(1,061)

​

​

2

​

​

312

​

​

—

​

​

(747)

​

(1067.1)%

​

​

​

​

​

​

​

​

​

​

​

​

​

​

​

​

​

​

​

​

​

​

​

​

​

17 Hotel Portfolio (3)

​

$

10,012

​

$

(20,407)

​

$

(212)

​

$

10,213

​

$

840

​

$

(9,566)

​

(95.5)%

​

*Footnotes on pages 52 and 53

​

​

​

​

​

PROPERTY-LEVEL ADJUSTED EBITDAre & ADJUSTED EBITDAre MARGINS

​

Page 43

​

​

​

Graphic

Graphic

BPP-Lobby-Bar

​

Wailea Beach Resort Slide

Graphic

Graphic

Graphic

Outside Shot

​

​

​


​

Graphic

Supplemental Financial Information
May 3, 2021

Property-Level Adjusted EBITDAre and Adjusted EBITDAre Margins

January 2020

​

​

​

​

​

​

​

​

​

​

​

​

​

​

​

​

​

​

​

​

​

​

​

​

​

​

Hotels sorted by number of rooms

​

For the Month of January 2020

​

​

(In thousands)

​

​

​

​

​

Plus:

​

Plus:

​

Plus:

​

Equals:

​

Hotel

​

​

​

​

Total

​

Net Income /

​

Other

​

​

​

​

​

Hotel Adjusted

​

Adjusted EBITDAre

​

​

​


Revenues


(Loss)


Adjustments (8)


Depreciation


Interest Expense


EBITDAre (2)


Margins (2)

1

​

Hilton San Diego Bayfront

​

$

11,202

​

$

462

​

$

(97)

​

$

1,072

​

$

616

​

$

2,053

​

18.3%

2

​

Boston Park Plaza

​

​

4,444

​

​

(2,132)

​

​

—

​

​

1,511

​

​

—

​

​

(621)

​

(14.0)%

3

​

Hyatt Regency San Francisco

​

​

9,327

​

​

1,089

​

​

90

​

​

1,074

​

​

—

​

​

2,253

​

24.2%

4

​

Renaissance Washington DC

​

​

4,404

​

​

(1,423)

​

​

—

​

​

699

​

​

557

​

​

(167)

​

(3.8)%

5

​

Renaissance Orlando at SeaWorld ®

​

​

7,584

​

​

1,555

​

​

—

​

​

868

​

​

—

​

​

2,423

​

31.9%

6

​

Wailea Beach Resort

​

​

11,333

​

​

3,191

​

​

—

​

​

1,320

​

​

—

​

​

4,511

​

39.8%

7

​

JW Marriott New Orleans

​

​

3,804

​

​

563

​

​

1

​

​

558

​

​

297

​

​

1,419

​

37.3%

8

​

Hyatt Centric Chicago Magnificent Mile

​

​

1,469

​

​

(1,076)

​

​

(117)

​

​

482

​

​

117

​

​

(594)

​

(40.4)%

9

​

Marriott Boston Long Wharf

​

​

3,243

​

​

(805)

​

​

—

​

​

916

​

​

—

​

​

111

​

3.4%

10

​

Renaissance Long Beach

​

​

2,425

​

​

296

​

​

—

​

​

330

​

​

—

​

​

626

​

25.8%

11

​

Embassy Suites Chicago

​

​

1,091

​

​

(551)

​

​

—

​

​

247

​

​

—

​

​

(304)

​

(27.9)%

12

​

Embassy Suites La Jolla

​

​

1,918

​

​

75

​

​

—

​

​

353

​

​

213

​

​

641

​

33.4%

13

​

The Bidwell Marriott Portland (5)

​

​

589

​

​

(211)

​

​

—

​

​

135

​

​

—

​

​

(76)

​

(12.9)%

14


Hilton New Orleans St. Charles

​

​

1,204

​

​

117

​

​

—

​

​

218

​

​

—

​

​

335

​

27.8%

15

​

Oceans Edge Resort & Marina

​

​

2,135

​

​

535

​

​

—

​

​

273

​

​

—

​

​

808

​

37.8%

​

​

​

​

​

​

​

​

​

​

​

​

​

​

​

​

​

​

​

​

​

​

​

​

​

15 Hotels Open for the Entire First Quarter of 2021

​

​

66,172

​

​

1,685

​

​

(123)

​

​

10,056

​

​

1,800

​

​

13,418

​

20.3%

​

​

​

​

​

​

​

​

​

​

​

​

​

​

​

​

​

​

​

​

​

​

​

​

​

2 Hotels with Suspended Operations During All of the First Quarter of 2021

​

​

2,413

​

​

(857)

​

​

3

​

​

517

​

​

—

​

​

(337)

​

(14.0)%

​

​

​

​

​

​

​

​

​

​

​

​

​

​

​

​

​

​

​

​

​

​

​

​

​

17 Hotel Portfolio (3)

​

​

68,585

​

​

828

​

​

(120)

​

​

10,573

​

​

1,800

​

​

13,081

​

19.1%

​

​

​

​

​

​

​

​

​

​

​

​

​

​

​

​

​

​

​

​

​

​

​

​

​

Add: Sold/Disposed Hotels (6)

​

​

​

​

​

​

​

​

​

​

​

​

​

​

​

​

​

​

​

​

​

​

Renaissance Harborplace

​

​

2,161

​

​

(641)

​

​

—

​

​

471

​

​

—

​

​

(170)

​

(7.9)%

​

​

Renaissance Los Angeles Airport

​

​

2,567

​

​

49

​

​

—

​

​

353

​

​

—

​

​

402

​

15.7%

​

​

Hilton Times Square

​

​

3,012

​

​

(1,815)

​

​

19

​

​

845

​

​

405

​

​

(546)

​

(18.1)%

​

​

​

​

​

​

​

​

​

​

​

​

​

​

​

​

​

​

​

​

​

​

​

​

​

Actual Portfolio (7)

​

$

76,325

​

$

(1,579)

​

$

(101)

​

$

12,242

​

$

2,205

​

$

12,767

​

16.7%

​

*Footnotes on pages 52 and 53

​

PROPERTY-LEVEL ADJUSTED EBITDAre & ADJUSTED EBITDAre MARGINS

​

Page 44

​

​

​

Graphic

Graphic

BPP-Lobby-Bar

​

Wailea Beach Resort Slide

Graphic

Graphic

Graphic

Outside Shot

​

​


​

Graphic

Supplemental Financial Information
May 3, 2021

Property-Level Adjusted EBITDAre and Adjusted EBITDAre Margins

January 2019

​

​

​

​

​

​

​

​

​

​

​

​

​

​

​

​

​

​

​

​

​

​

​

​

​

​

Hotels sorted by number of rooms

​

For the Month of January 2019

​

​

(In thousands)

​

​

​

​

​

Plus:

​

Plus:

​

Plus:

​

Equals:

​

Hotel

​

​

​

​

Total

​

Net Income /

​

Other

​

​

​

​

​

Hotel Adjusted

​

Adjusted EBITDAre

​

​

​


Revenues


(Loss)


Adjustments (8)


Depreciation


Interest Expense


EBITDAre


Margins

1

​

Hilton San Diego Bayfront (5)

​

$

10,612

​

$

470

​

$

(97)

​

$

856

​

$

767

​

​

1,996

​

18.8%

2

​

Boston Park Plaza

​

​

6,479

​

​

(1,079)

​

​

—

​

​

1,481

​

​

—

​

$

402

​

6.2%

3

​

Hyatt Regency San Francisco

​

​

10,468

​

​

1,767

​

​

118

​

​

1,042

​

​

—

​

​

2,927

​

28.0%

4

​

Renaissance Washington DC

​

​

4,640

​

​

(1,079)

​

​

—

​

​

819

​

​

572

​

​

312

​

6.7%

5

​

Renaissance Orlando at SeaWorld ®

​

​

8,643

​

​

2,431

​

​

—

​

​

841

​

​

—

​

​

3,272

​

37.9%

6

​

Wailea Beach Resort

​

​

10,842

​

​

2,949

​

​

—

​

​

1,291

​

​

—

​

​

4,240

​

39.1%

7

​

JW Marriott New Orleans

​

​

3,609

​

​

642

​

​

1

​

​

532

​

​

304

​

​

1,479

​

41.0%

8

​

Hyatt Centric Chicago Magnificent Mile

​

​

1,186

​

​

(1,237)

​

​

(117)

​

​

480

​

​

117

​

​

(757)

​

(63.8)%

9

​

Marriott Boston Long Wharf

​

​

3,083

​

​

(680)

​

​

—

​

​

899

​

​

—

​

​

219

​

7.1%

10

​

Renaissance Long Beach

​

​

2,105

​

​

118

​

​

—

​

​

315

​

​

—

​

​

433

​

20.6%

11

​

Embassy Suites Chicago

​

​

972

​

​

(577)

​

​

—

​

​

246

​

​

—

​

​

(331)

​

(34.1)%

12

​

Embassy Suites La Jolla

​

​

1,949

​

​

100

​

​

—

​

​

345

​

​

218

​

​

663

​

34.0%

13

​

The Bidwell Marriott Portland

​

​

1,015

​

​

118

​

​

—

​

​

132

​

​

—

​

​

250

​

24.6%

14


Hilton New Orleans St. Charles

​

​

1,058

​

​

16

​

​

—

​

​

207

​

​

—

​

​

223

​

21.1%

15

​

Oceans Edge Resort & Marina

​

​

1,963

​

​

376

​

​

—

​

​

258

​

​

—

​

​

634

​

32.3%

​

​

​

​

​

​

​

​

​

​

​

​

​

​

​

​

​

​

​

​

​

​

​

​

​

15 Hotels Open for the Entire First Quarter of 2021

​

​

68,624

​

​

4,335

​

​

(95)

​

​

9,744

​

​

1,978

​

​

15,962

​

23.3%

​

​

​

​

​

​

​

​

​

​

​

​

​

​

​

​

​

​

​

​

​

​

​

​

​

2 Hotels with Suspended Operations During All of the First Quarter of 2021

​

​

2,072

​

​

(1,033)

​

​

3

​

​

512

​

​

—

​

​

(518)

​

(25.0)%

​

​

​

​

​

​

​

​

​

​

​

​

​

​

​

​

​

​

​

​

​

​

​

​

​

17 Hotel Portfolio (3)

​

​

70,696

​

​

3,302

​

​

(92)

​

​

10,256

​

​

1,978

​

​

15,444

​

21.8%

​

​

​

​

​

​

​

​

​

​

​

​

​

​

​

​

​

​

​

​

​

​

​

​

​

Add: Sold/Disposed Hotels (6)

​

​

​

​

​

​

​

​

​

​

​

​

​

​

​

​

​

​

​

​

​

​

Courtyard by Marriott Los Angeles

​

​

940

​

​

107

​

​

(80)

​

​

84

​

​

98

​

​

209

​

22.2%

​

​

Renaissance Harborplace (5)

​

​

1,816

​

​

(717)

​

​

—

​

​

499

​

​

—

​

​

(218)

​

(12.0)%

​

​

Renaissance Los Angeles Airport

​

​

2,611

​

​

212

​

​

—

​

​

348

​

​

—

​

​

560

​

21.4%

​

​

Hilton Times Square

​

​

3,033

​

​

(1,835)

​

​

21

​

​

849

​

​

407

​

​

(558)

​

(18.4)%

​

​

​

​

​

​

​

​

​

​

​

​

​

​

​

​

​

​

​

​

​

​

​

​

​

Actual Portfolio (7)

​

$

79,096

​

$

1,069

​

$

(151)

​

$

12,036

​

$

2,483

​

$

15,437

​

19.5%

​

*Footnotes on pages 52 and 53

​

PROPERTY-LEVEL ADJUSTED EBITDAre & ADJUSTED EBITDAre MARGINS

​

Page 45

​

​

​

Graphic

Graphic

BPP-Lobby-Bar

​

Wailea Beach Resort Slide

Graphic

Graphic

Graphic

Outside Shot

​

​


​

Graphic

Supplemental Financial Information
May 3, 2021

Property-Level Adjusted EBITDAre and Adjusted EBITDAre Margins

February 2021

​

​

​

​

​

​

​

​

​

​

​

​

​

​

​

​

​

​

​

​

​

​

​

​

​

​

Hotels sorted by number of rooms

​

For the Month of February 2021

​

​

(In thousands)

​

​

​

​

​

Plus:

​

Plus:

​

Plus:

​

Equals:

​

Hotel

​

​

​

​

Total

​

Net Income /

​

Other

​

​

​

​

​

Hotel Adjusted

​

Adjusted EBITDAre

​

​

​


Revenues


(Loss)


Adjustments (9)


Depreciation


Interest Expense


EBITDAre (2)


Margins (2)

1

​

Hilton San Diego Bayfront

​

$

1,232

​

$

(2,634)

​

$

(96)

​

$

1,080

​

$

199

​

$

(1,451)

​

(117.8)%

2

​

Boston Park Plaza

​

​

909

​

​

(2,745)

​

​

—

​

​

1,490

​

​

—

​

​

(1,255)

​

(138.1)%

3

​

Hyatt Regency San Francisco

​

​

499

​

​

(2,395)

​

​

—

​

​

1,081

​

​

—

​

​

(1,314)

​

(263.3)%

4

​

Renaissance Washington DC

​

​

2,121

​

​

98

​

​

1

​

​

625

​

​

—

​

​

724

​

34.1%

5

​

Renaissance Orlando at SeaWorld ®

​

​

751

​

​

(1,397)

​

​

—

​

​

743

​

​

—

​

​

(654)

​

(87.1)%

6

​

Wailea Beach Resort

​

​

3,471

​

​

(629)

​

​

—

​

​

1,358

​

​

—

​

​

729

​

21.0%

7

​

JW Marriott New Orleans

​

​

468

​

​

(1,064)

​

​

—

​

​

537

​

​

262

​

​

(265)

​

(56.6)%

8

​

Hyatt Centric Chicago Magnificent Mile

​

​

238

​

​

(1,126)

​

​

(117)

​

​

382

​

​

117

​

​

(744)

​

(312.6)%

9

​

Marriott Boston Long Wharf

​

​

409

​

​

(1,623)

​

​

—

​

​

927

​

​

—

​

​

(696)

​

(170.2)%

10

​

Renaissance Long Beach

​

​

556

​

​

(402)

​

​

—

​

​

266

​

​

—

​

​

(136)

​

(24.5)%

11

​

Embassy Suites Chicago

​

​

246

​

​

(687)

​

​

—

​

​

252

​

​

—

​

​

(435)

​

(176.8)%

12

​

Embassy Suites La Jolla

​

​

688

​

​

(513)

​

​

—

​

​

329

​

​

189

​

​

5

​

0.7%

13

​

The Bidwell Marriott Portland

​

​

152

​

​

(486)

​

​

—

​

​

270

​

​

—

​

​

(216)

​

(142.1)%

14


Hilton New Orleans St. Charles

​

​

190

​

​

(345)

​

​

—

​

​

207

​

​

—

​

​

(138)

​

(72.6)%

15

​

Oceans Edge Resort & Marina

​

​

2,121

​

​

634

​

​

—

​

​

293

​

​

—

​

​

927

​

43.7%

​

​

​

​

​

​

​

​

​

​

​

​

​

​

​

​

​

​

​

​

​

​

​

​

​

15 Hotels Open for the Entire First Quarter of 2021

​

​

14,051

​

​

(15,314)

​

​

(212)

​

​

9,840

​

​

767

​

​

(4,919)

​

(35.0)%

​

​

​

​

​

​

​

​

​

​

​

​

​

​

​

​

​

​

​

​

​

​

​

​

​

2 Hotels with Suspended Operations During All of the First Quarter of 2021

​

​

95

​

​

(1,041)

​

​

19

​

​

312

​

​

—

​

​

(710)

​

(747.4)%

​

​

​

​

​

​

​

​

​

​

​

​

​

​

​

​

​

​

​

​

​

​

​

​

​

17 Hotel Portfolio (3)

​

$

14,146

​

$

(16,355)

​

$

(193)

​

$

10,152

​

$

767

​

$

(5,629)

​

(39.8)%

​

​

*Footnotes on pages 52 and 53

​

​

​

​

PROPERTY-LEVEL ADJUSTED EBITDAre & ADJUSTED EBITDAre MARGINS

​

Page 46

​

​

​

Graphic

Graphic

BPP-Lobby-Bar

​

Wailea Beach Resort Slide

Graphic

Graphic

Graphic

Outside Shot

​

​

​


​

Graphic

Supplemental Financial Information
May 3, 2021

Property-Level Adjusted EBITDAre and Adjusted EBITDAre Margins

February 2020

​

​

​

​

​

​

​

​

​

​

​

​

​

​

​

​

​

​

​

​

​

​

​

​

​

​

Hotels sorted by number of rooms

​

For the Month of February 2020

​

​

(In thousands)

​

​

​

​

​

Plus:

​

Plus:

​

Plus:

​

Equals:

​

Hotel

​

​

​

​

Total

​

Net Income /

​

Other

​

​

​

​

​

Hotel Adjusted

​

Adjusted EBITDAre

​

​

​


Revenues


(Loss)


Adjustments (9)


Depreciation


Interest Expense


EBITDAre (2)


Margins (2)

1

​

Hilton San Diego Bayfront

​

$

12,928

​

$

2,511

​

$

(96)

​

$

1,074

​

$

576

​

$

4,065

​

31.4%

2

​

Boston Park Plaza

​

​

4,204

​

​

(1,931)

​

​

—

​

​

1,497

​

​

—

​

​

(434)

​

(10.3)%

3

​

Hyatt Regency San Francisco

​

​

8,946

​

​

1,052

​

​

90

​

​

1,076

​

​

—

​

​

2,218

​

24.8%

4

​

Renaissance Washington DC

​

​

7,011

​

​

971

​

​

—

​

​

679

​

​

556

​

​

2,206

​

31.5%

5

​

Renaissance Orlando at SeaWorld ®

​

​

8,805

​

​

2,642

​

​

—

​

​

868

​

​

—

​

​

3,510

​

39.9%

6

​

Wailea Beach Resort

​

​

11,912

​

​

3,864

​

​

—

​

​

1,324

​

​

—

​

​

5,188

​

43.6%

7

​

JW Marriott New Orleans

​

​

3,820

​

​

808

​

​

—

​

​

532

​

​

278

​

​

1,618

​

42.4%

8

​

Hyatt Centric Chicago Magnificent Mile

​

​

1,273

​

​

(1,088)

​

​

(117)

​

​

482

​

​

117

​

​

(606)

​

(47.6)%

9

​

Marriott Boston Long Wharf

​

​

3,658

​

​

(251)

​

​

—

​

​

910

​

​

—

​

​

659

​

18.0%

10

​

Renaissance Long Beach

​

​

2,375

​

​

396

​

​

—

​

​

330

​

​

—

​

​

726

​

30.6%

11

​

Embassy Suites Chicago

​

​

1,160

​

​

(346)

​

​

(24)

​

​

253

​

​

—

​

​

(117)

​

(10.1)%

12

​

Embassy Suites La Jolla

​

​

1,933

​

​

143

​

​

—

​

​

348

​

​

200

​

​

691

​

35.7%

13

​

The Bidwell Marriott Portland (5)

​

​

565

​

​

(222)

​

​

—

​

​

135

​

​

—

​

​

(87)

​

(15.4)%

14


Hilton New Orleans St. Charles

​

​

1,373

​

​

259

​

​

—

​

​

211

​

​

—

​

​

470

​

34.2%

15

​

Oceans Edge Resort & Marina

​

​

2,344

​

​

763

​

​

—

​

​

275

​

​

—

​

​

1,038

​

44.3%

​

​

​

​

​

​

​

​

​

​

​

​

​

​

​

​

​

​

​

​

​

​

​

​

​

15 Hotels Open for the Entire First Quarter of 2021

​

​

72,307

​

​

9,571

​

​

(147)

​

​

9,994

​

​

1,727

​

​

21,145

​

29.2%

​

​

​

​

​

​

​

​

​

​

​

​

​

​

​

​

​

​

​

​

​

​

​

​

​

2 Hotels with Suspended Operations During All of the First Quarter of 2021

​

​

2,078

​

​

(929)

​

​

2

​

​

517

​

​

—

​

​

(410)

​

(19.7)%

​

​

​

​

​

​

​

​

​

​

​

​

​

​

​

​

​

​

​

​

​

​

​

​

​

17 Hotel Portfolio (3)

​

​

74,385

​

​

8,642

​

​

(145)

​

​

10,511

​

​

1,727

​

​

20,735

​

27.9%

​

​

​

​

​

​

​

​

​

​

​

​

​

​

​

​

​

​

​

​

​

​

​

​

​

Add: Sold /Disposed Hotels (6)

​

​

​

​

​

​

​

​

​

​

​

​

​

​

​

​

​

​

​

​

​

​

Renaissance Harborplace

​

​

2,342

​

​

(355)

​

​

—

​

​

426

​

​

—

​

​

71

​

3.0%

​

​

Renaissance Los Angeles Airport

​

​

2,716

​

​

377

​

​

—

​

​

353

​

​

—

​

​

730

​

26.9%

​

​

Hilton Times Square

​

​

2,790

​

​

(1,686)

​

​

19

​

​

844

​

​

383

​

​

(440)

​

(15.8)%

​

​

​

​

​

​

​

​

​

​

​

​

​

​

​

​

​

​

​

​

​

​

​

​

​

Actual Portfolio (7)

​

$

82,233

​

$

6,978

​

$

(126)

​

$

12,134

​

$

2,110

​

$

21,096

​

25.7%

​

*Footnotes on pages 52 and 53

​

PROPERTY-LEVEL ADJUSTED EBITDAre & ADJUSTED EBITDAre MARGINS

​

Page 47

​

​

​

Graphic

Graphic

BPP-Lobby-Bar

​

Wailea Beach Resort Slide

Graphic

Graphic

Graphic

Outside Shot

​

​


​

Graphic

Supplemental Financial Information
May 3, 2021

Property-Level Adjusted EBITDAre and Adjusted EBITDAre Margins

February 2019

​

​

​

​

​

​

​

​

​

​

​

​

​

​

​

​

​

​

​

​

​

​

​

​

​

​

Hotels sorted by number of rooms

​

For the Month of February 2019

​

​

(In thousands)

​

​

​

​

​

Plus:

​

Plus:

​

Plus:

​

Equals:

​

Hotel

​

​

​

​

Total

​

Net Income /

​

Other

​

​

​

​

​

Hotel Adjusted

​

Adjusted EBITDAre

​

​

​


Revenues


(Loss)


Adjustments (9)


Depreciation


Interest Expense


EBITDAre (2)


Margins (2)

1

​

Hilton San Diego Bayfront (5)

​

$

12,301

​

$

2,642

​

$

(96)

​

$

857

​

$

703

​

​

4,106

​

33.4%

2

​

Boston Park Plaza

​

​

4,113

​

​

(2,071)

​

​

—

​

​

1,483

​

​

—

​

$

(588)

​

(14.3)%

3

​

Hyatt Regency San Francisco

​

​

10,054

​

​

1,690

​

​

118

​

​

1,042

​

​

—

​

​

2,850

​

28.3%

4

​

Renaissance Washington DC

​

​

6,121

​

​

234

​

​

—

​

​

815

​

​

571

​

​

1,620

​

26.5%

5

​

Renaissance Orlando at SeaWorld ®

​

​

8,918

​

​

2,848

​

​

—

​

​

856

​

​

—

​

​

3,704

​

41.5%

6

​

Wailea Beach Resort

​

​

10,345

​

​

3,178

​

​

—

​

​

1,294

​

​

—

​

​

4,472

​

43.2%

7

​

JW Marriott New Orleans

​

​

3,429

​

​

687

​

​

1

​

​

532

​

​

274

​

​

1,494

​

43.6%

8

​

Hyatt Centric Chicago Magnificent Mile

​

​

1,608

​

​

(875)

​

​

(117)

​

​

481

​

​

117

​

​

(394)

​

(24.5)%

9

​

Marriott Boston Long Wharf

​

​

2,989

​

​

(569)

​

​

—

​

​

897

​

​

—

​

​

328

​

11.0%

10

​

Renaissance Long Beach

​

​

2,500

​

​

575

​

​

—

​

​

315

​

​

—

​

​

890

​

35.6%

11

​

Embassy Suites Chicago

​

​

1,253

​

​

(275)

​

​

—

​

​

247

​

​

—

​

​

(28)

​

(2.2)%

12

​

Embassy Suites La Jolla

​

​

1,918

​

​

249

​

​

—

​

​

343

​

​

197

​

​

789

​

41.1%

13

​

The Bidwell Marriott Portland

​

​

1,100

​

​

240

​

​

—

​

​

132

​

​

—

​

​

372

​

33.8%

14


Hilton New Orleans St. Charles

​

​

1,178

​

​

91

​

​

—

​

​

208

​

​

—

​

​

299

​

25.4%

15

​

Oceans Edge Resort & Marina

​

​

2,195

​

​

509

​

​

189

​

​

258

​

​

—

​

​

956

​

43.6%

​

​

​

​

​

​

​

​

​

​

​

​

​

​

​

​

​

​

​

​

​

​

​

​

​

15 Hotels Open for the Entire First Quarter of 2021

​

​

70,022

​

​

9,153

​

​

95

​

​

9,760

​

​

1,862

​

​

20,870

​

29.8%

​

​

​

​

​

​

​

​

​

​

​

​

​

​

​

​

​

​

​

​

​

​

​

​

​

2 Hotels with Suspended Operations During All of the First Quarter of 2021

​

​

2,175

​

​

(732)

​

​

3

​

​

513

​

​

—

​

​

(216)

​

(9.9)%

​

​

​

​

​

​

​

​

​

​

​

​

​

​

​

​

​

​

​

​

​

​

​

​

​

17 Hotel Portfolio (3)

​

​

72,197

​

​

8,421

​

​

98

​

​

10,273

​

​

1,862

​

​

20,654

​

28.6%

​

​

​

​

​

​

​

​

​

​

​

​

​

​

​

​

​

​

​

​

​

​

​

​

​

Add: Sold /Disposed Hotels (6)

​

​

​

​

​

​

​

​

​

​

​

​

​

​

​

​

​

​

​

​

​

​

Courtyard by Marriott Los Angeles

​

​

1,011

​

​

215

​

​

(80)

​

​

85

​

​

98

​

​

318

​

31.5%

​

​

Renaissance Harborplace (5)

​

​

1,890

​

​

(721)

​

​

—

​

​

494

​

​

—

​

​

(227)

​

(12.0)%

​

​

Renaissance Los Angeles Airport

​

​

2,671

​

​

362

​

​

—

​

​

347

​

​

—

​

​

709

​

26.5%

​

​

Hilton Times Square

​

​

2,773

​

​

(1,664)

​

​

21

​

​

848

​

​

374

​

​

(421)

​

(15.2)%

​

​

​

​

​

​

​

​

​

​

​

​

​

​

​

​

​

​

​

​

​

​

​

​

​

Actual Portfolio (7)

​

$

80,542

​

$

6,613

​

$

39

​

$

12,047

​

$

2,334

​

$

21,033

​

26.1%

​

*Footnotes on pages 52 and 53

​

PROPERTY-LEVEL ADJUSTED EBITDAre & ADJUSTED EBITDAre MARGINS

​

Page 48

​

​

​

Graphic

Graphic

BPP-Lobby-Bar

​

Wailea Beach Resort Slide

Graphic

Graphic

Graphic

Outside Shot

​

​


​

Graphic

Supplemental Financial Information
May 3, 2021

Property-Level Adjusted EBITDAre and Adjusted EBITDAre Margins

March 2021

​

​

​

​

​

​

​

​

​

​

​

​

​

​

​

​

​

​

​

​

​

​

​

​

​

​

Hotels sorted by number of rooms

​

For the Month of March 2021

​

​

(In thousands)

​

​

​

​

​

Plus:

​

Plus:

​

Plus:

​

Equals:

​

Hotel

​

​

​

​

Total

​

Net Income /

​

Other

​

​

​

​

​

Hotel Adjusted

​

Adjusted EBITDAre

​

​

​


Revenues


(Loss)


Adjustments (10)


Depreciation


Interest Expense


EBITDAre (2)


Margins (2)

1

​

Hilton San Diego Bayfront

​

$

2,075

​

$

(2,109)

​

$

(96)

​

$

1,081

​

$

220

​

$

(904)

​

(43.6)%

2

​

Boston Park Plaza

​

​

1,153

​

​

(2,577)

​

​

—

​

​

1,487

​

​

—

​

​

(1,090)

​

(94.5)%

3

​

Hyatt Regency San Francisco

​

​

769

​

​

(2,293)

​

​

—

​

​

1,082

​

​

—

​

​

(1,211)

​

(157.5)%

4

​

Renaissance Washington DC

​

​

2,336

​

​

494

​

​

(73)

​

​

625

​

​

—

​

​

1,046

​

44.8%

5

​

Renaissance Orlando at SeaWorld ®

​

​

1,953

​

​

(749)

​

​

—

​

​

734

​

​

—

​

​

(15)

​

(0.8)%

6

​

Wailea Beach Resort

​

​

6,421

​

​

1,536

​

​

—

​

​

1,366

​

​

—

​

​

2,902

​

45.2%

7

​

JW Marriott New Orleans

​

​

993

​

​

(784)

​

​

2

​

​

537

​

​

290

​

​

45

​

4.5%

8

​

Hyatt Centric Chicago Magnificent Mile

​

​

350

​

​

(1,094)

​

​

(117)

​

​

381

​

​

117

​

​

(713)

​

(203.7)%

9

​

Marriott Boston Long Wharf

​

​

595

​

​

(1,310)

​

​

—

​

​

926

​

​

—

​

​

(384)

​

(64.5)%

10

​

Renaissance Long Beach

​

​

759

​

​

(215)

​

​

—

​

​

265

​

​

—

​

​

50

​

6.6%

11

​

Embassy Suites Chicago

​

​

435

​

​

(568)

​

​

—

​

​

252

​

​

—

​

​

(316)

​

(72.6)%

12

​

Embassy Suites La Jolla

​

​

907

​

​

(413)

​

​

—

​

​

329

​

​

207

​

​

123

​

13.6%

13

​

The Bidwell Marriott Portland

​

​

178

​

​

(530)

​

​

—

​

​

269

​

​

—

​

​

(261)

​

(146.6)%

14


Hilton New Orleans St. Charles

​

​

366

​

​

(227)

​

​

—

​

​

205

​

​

—

​

​

(22)

​

(6.0)%

15

​

Oceans Edge Resort & Marina

​

​

3,049

​

​

1,342

​

​

—

​

​

293

​

​

—

​

​

1,635

​

53.6%

​

​

​

​

​

​

​

​

​

​

​

​

​

​

​

​

​

​

​

​

​

​

​

​

​

15 Hotels Open for the Entire First Quarter of 2021

​

​

22,339

​

​

(9,497)

​

​

(284)

​

​

9,832

​

​

834

​

​

885

​

4.0%

​

​

​

​

​

​

​

​

​

​

​

​

​

​

​

​

​

​

​

​

​

​

​

​

​

2 Hotels with Suspended Operations During All of the First Quarter of 2021

​

​

73

​

​

(1,176)

​

​

42

​

​

312

​

​

—

​

​

(822)

​

(1126.0)%

​

​

​

​

​

​

​

​

​

​

​

​

​

​

​

​

​

​

​

​

​

​

​

​

​

17 Hotel Portfolio (3)

​

$

22,412

​

$

(10,673)

​

$

(242)

​

$

10,144

​

$

834

​

$

63

​

0.3%

​

​

​

​

​

*Footnotes on pages 52 and 53

​

​

PROPERTY-LEVEL ADJUSTED EBITDAre & ADJUSTED EBITDAre MARGINS

​

Page 49

​

​

​

Graphic

Graphic

BPP-Lobby-Bar

​

Wailea Beach Resort Slide

Graphic

Graphic

Graphic

Outside Shot

​

​

​


​

Graphic

Supplemental Financial Information
May 3, 2021

Property-Level Adjusted EBITDAre and Adjusted EBITDAre Margins

March 2020

​

​

​

​

​

​

​

​

​

​

​

​

​

​

​

​

​

​

​

​

​

​

​

​

​

​

Hotels sorted by number of rooms

​

For the Month of March 2020

​

​

(In thousands)

​

​

​

​

​

Plus:

​

Plus:

​

Plus:

​

Equals:

​

Hotel

​

​

​

​

Total

​

Net Income /

​

Other

​

​

​

​

​

Hotel Adjusted

​

Adjusted EBITDAre

​

​

​


Revenues


(Loss)


Adjustments (10)


Depreciation


Interest Expense


EBITDAre (2)


Margins (2)

1

​

Hilton San Diego Bayfront (4)

​

$

2,910

​

$

(3,003)

​

$

(97)

​

$

1,071

​

$

487

​

$

(1,542)

​

(53.0)%

2

​

Boston Park Plaza (4)

​

​

2,709

​

​

(2,708)

​

​

—

​

​

1,506

​

​

—

​

​

(1,202)

​

(44.4)%

3

​

Hyatt Regency San Francisco (4)

​

​

2,506

​

​

(3,277)

​

​

(44)

​

​

1,080

​

​

—

​

​

(2,241)

​

(89.4)%

4

​

Renaissance Washington DC (4)

​

​

3,447

​

​

(2,330)

​

​

—

​

​

689

​

​

556

​

​

(1,085)

​

(31.5)%

5

​

Renaissance Orlando at SeaWorld ® (4)

​

​

2,416

​

​

(1,560)

​

​

—

​

​

871

​

​

—

​

​

(689)

​

(28.5)%

6

​

Wailea Beach Resort (4)

​

​

5,572

​

​

(839)

​

​

—

​

​

1,325

​

​

—

​

​

486

​

8.7%

7

​

JW Marriott New Orleans (4)

​

​

1,633

​

​

(845)

​

​

1

​

​

546

​

​

296

​

​

(2)

​

(0.1)%

8

​

Hyatt Centric Chicago Magnificent Mile (4)

​

​

562

​

​

(1,519)

​

​

(117)

​

​

482

​

​

117

​

​

(1,037)

​

(184.5)%

9

​

Marriott Boston Long Wharf (4)

​

​

1,227

​

​

(2,426)

​

​

—

​

​

911

​

​

—

​

​

(1,515)

​

(123.5)%

10

​

Renaissance Long Beach (4)

​

​

965

​

​

(803)

​

​

—

​

​

330

​

​

—

​

​

(473)

​

(49.0)%

11

​

Embassy Suites Chicago (4)

​

​

678

​

​

(616)

​

​

—

​

​

253

​

​

—

​

​

(363)

​

(53.5)%

12

​

Embassy Suites La Jolla (4)

​

​

1,140

​

​

(410)

​

​

—

​

​

351

​

​

213

​

​

154

​

13.5%

13

​

The Bidwell Marriott Portland (4) (5)

​

​

259

​

​

(457)

​

​

—

​

​

111

​

​

—

​

​

(346)

​

(133.6)%

14


Hilton New Orleans St. Charles (4)

​

​

562

​

​

(250)

​

​

—

​

​

216

​

​

—

​

​

(34)

​

(6.0)%

15

​

Oceans Edge Resort & Marina

​

​

1,486

​

​

192

​

​

—

​

​

278

​

​

—

​

​

470

​

31.6%

​

​

​

​

​

​

​

​

​

​

​

​

​

​

​

​

​

​

​

​

​

​

​

​

​

15 Hotels Open for the Entire First Quarter of 2021

​

​

28,072

​

​

(20,851)

​

​

(257)

​

​

10,020

​

​

1,669

​

​

(9,419)

​

(33.6)%

​

​

​

​

​

​

​

​

​

​

​

​

​

​

​

​

​

​

​

​

​

​

​

​


2 Hotels with Suspended Operations During All of the First Quarter of 2021 (4)

​

​

978

​

​

(2,394)

​

​

2

​

​

516

​

​

—

​

​

(1,876)

​

(191.8)%

​

​

​

​

​

​

​

​

​

​

​

​

​

​

​

​

​

​

​

​

​

​

​

​

​

17 Hotel Portfolio (3)

​

​

29,050

​

​

(23,245)

​

​

(255)

​

​

10,536

​

​

1,669

​

​

(11,295)

​

(38.9)%

​

​

​

​

​

​

​

​

​

​

​

​

​

​

​

​

​

​

​

​

​

​

​

​

​

Add: Sold/Disposed Hotels (6)

​

​

​

​

​

​

​

​

​

​

​

​

​

​

​

​

​

​

​

​

​

​

Renaissance Harborplace (4)

​

​

1,101

​

​

(1,296)

​

​

(57)

​

​

432

​

​

—

​

​

(921)

​

(83.7)%

​

​

Renaissance Los Angeles Airport (4)

​

​

1,363

​

​

(902)

​

​

—

​

​

357

​

​

—

​

​

(545)

​

(40.0)%

​

​

Hilton Times Square (4)

​

​

1,118

​

​

(3,958)

​

​

20

​

​

789

​

​

405

​

​

(2,744)

​

(245.4)%

​

​

​

​

​

​

​

​

​

​

​

​

​

​

​

​

​

​

​

​

​

​

​

​

​

Actual Portfolio (7)

​

$

32,632

​

$

(29,401)

​

$

(292)

​

$

12,114

​

$

2,074

​

$

(15,505)

​

(47.5)%

​

​

*Footnotes on pages 52 and 53

​

PROPERTY-LEVEL ADJUSTED EBITDAre & ADJUSTED EBITDAre MARGINS

​

Page 50

​

​

​

Graphic

Graphic

BPP-Lobby-Bar

​

Wailea Beach Resort Slide

Graphic

Graphic

Graphic

Outside Shot

​

​


​

Graphic

Supplemental Financial Information
May 3, 2021

Property-Level Adjusted EBITDAre and Adjusted EBITDAre Margins

March 2019

​

​

​

​

​

​

​

​

​

​

​

​

​

​

​

​

​

​

​

​

​

​

​

​

​

​

Hotels sorted by number of rooms

​

For the Month of March 2019

​

​

(In thousands)

​

​

​

​

​

Plus:

​

Plus:

​

Plus:

​

Equals:

​

Hotel

​

​

​

​

Total

​

Net Income /

​

Other

​

​

​

​

​

Hotel Adjusted

​

Adjusted EBITDAre

​

​

​


Revenues


(Loss)


Adjustments (10)


Depreciation


Interest Expense


EBITDAre


Margins

1

​

Hilton San Diego Bayfront (5)

​

$

13,773

​

$

3,293

​

$

(97)

​

$

845

​

$

768

​

$

4,809

​

34.9%

2

​

Boston Park Plaza

​

​

7,268

​

​

(27)

​

​

—

​

​

1,482

​

​

—

​

​

1,455

​

20.0%

3

​

Hyatt Regency San Francisco

​

​

10,675

​

​

1,910

​

​

124

​

​

1,043

​

​

—

​

​

3,077

​

28.8%

4

​

Renaissance Washington DC

​

​

10,135

​

​

2,264

​

​

—

​

​

821

​

​

570

​

​

3,655

​

36.1%

5

​

Renaissance Orlando at SeaWorld ®

​

​

8,152

​

​

2,391

​

​

—

​

​

857

​

​

—

​

​

3,248

​

39.8%

6

​

Wailea Beach Resort

​

​

10,482

​

​

3,213

​

​

—

​

​

1,294

​

​

—

​

​

4,507

​

43.0%

7

​

JW Marriott New Orleans

​

​

4,694

​

​

1,615

​

​

—

​

​

533

​

​

302

​

​

2,450

​

52.2%

8

​

Hyatt Centric Chicago Magnificent Mile

​

​

2,314

​

​

(381)

​

​

(116)

​

​

481

​

​

116

​

​

100

​

4.3%

9

​

Marriott Boston Long Wharf

​

​

4,022

​

​

145

​

​

—

​

​

897

​

​

—

​

​

1,042

​

25.9%

10

​

Renaissance Long Beach

​

​

2,986

​

​

776

​

​

—

​

​

316

​

​

—

​

​

1,092

​

36.6%

11

​

Embassy Suites Chicago

​

​

1,941

​

​

207

​

​

—

​

​

250

​

​

—

​

​

457

​

23.5%

12

​

Embassy Suites La Jolla

​

​

2,187

​

​

363

​

​

—

​

​

343

​

​

217

​

​

923

​

42.2%

13

​

The Bidwell Marriott Portland

​

​

1,222

​

​

286

​

​

—

​

​

132

​

​

—

​

​

418

​

34.2%

14


Hilton New Orleans St. Charles

​

​

1,641

​

​

436

​

​

—

​

​

208

​

​

—

​

​

644

​

39.2%

15

​

Oceans Edge Resort & Marina

​

​

2,574

​

​

892

​

​

—

​

​

261

​

​

—

​

​

1,153

​

44.8%

​

​

​

​

​

​

​

​

​

​

​

​

​

​

​

​

​

​

​

​

​

​

​

​

​

15 Hotels Open for the Entire First Quarter of 2021

​

​

84,066

​

​

17,383

​

​

(89)

​

​

9,763

​

​

1,973

​

​

29,030

​

34.5%

​

​

​

​

​

​

​

​

​

​

​

​

​

​

​

​

​

​

​

​

​

​

​

​

​

2 Hotels with Suspended Operations During All of the First Quarter of 2021

​

​

2,929

​

​

(355)

​

​

3

​

​

513

​

​

—

​

​

161

​

5.5%

​

​

​

​

​

​

​

​

​

​

​

​

​

​

​

​

​

​

​

​

​

​

​

​

​

17 Hotel Portfolio (3)

​

​

86,995

​

​

17,028

​

​

(86)

​

​

10,276

​

​

1,973

​

​

29,191

​

33.6%

​

​

​

​

​

​

​

​

​

​

​

​

​

​

​

​

​

​

​

​

​

​

​

​

​

Add: Sold/Disposed Hotels (6)

​

​

​

​

​

​

​

​

​

​

​

​

​

​

​

​

​

​

​

​

​

​

Courtyard by Marriott Los Angeles

​

​

1,119

​

​

245

​

​

(79)

​

​

84

​

​

98

​

​

348

​

31.1%

​

​

Renaissance Harborplace (5)

​

​

3,264

​

​

305

​

​

—

​

​

497

​

​

—

​

​

802

​

24.6%

​

​

Renaissance Los Angeles Airport

​

​

2,680

​

​

279

​

​

—

​

​

348

​

​

—

​

​

627

​

23.4%

​

​

Hilton Times Square

​

​

3,961

​

​

(847)

​

​

22

​

​

848

​

​

407

​

​

430

​

10.9%

​

​

​

​

​

​

​

​

​

​

​

​

​

​

​

​

​

​

​

​

​

​

​

​

​

Actual Portfolio (7)

​

$

98,019

​

$

17,010

​

$

(143)

​

$

12,053

​

$

2,478

​

$

31,398

​

32.0%

​

*Footnotes on pages 52 and 53

​

PROPERTY-LEVEL ADJUSTED EBITDAre & ADJUSTED EBITDAre MARGINS

​

Page 51

​

​

​

Graphic

Graphic

BPP-Lobby-Bar

​

Wailea Beach Resort Slide

Graphic

Graphic

Graphic

Outside Shot

​

​


​

Graphic

Supplemental Financial Information
May 3, 2021

Property-Level Adjusted EBITDAre and Adjusted EBITDAre Margins

Q1, January, February and March 2021/2020/2019 Footnotes

​

(1)Other Adjustments for the first quarter of 2021 include: a total of $(0.3) million in amortization of the operating lease right-of-use assets and liabilities at the Hilton Garden Inn Chicago Downtown/Magnificent Mile, the Hilton San Diego Bayfront, and the JW Marriott New Orleans; $(0.3) million in finance lease obligation interest - cash ground rent at the Hyatt Centric Chicago Magnificent Mile; a $(0.1) million prior year property tax net credit received at the Renaissance Washington DC; and $0.1 million in legal fees at the Renaissance Westchester. Other Adjustments for the first quarter of 2020 include: $(0.3) million in amortization of the operating lease right-of-use assets and liabilities at the Hilton Garden Inn Chicago Downtown/Magnificent Mile, the Hilton San Diego Bayfront, the Hilton Times Square and the JW Marriott New Orleans; $(0.3) million in finance lease obligation interest - cash ground rent at the Hyatt Centric Chicago Magnificent Mile; $0.1 million in city taxes assessed on commercial rents at the Hyatt Regency San Francisco; and a total of $(0.1) million in prior year property tax credits, net of appeal fees received at the Embassy Suites Chicago and the Renaissance Harborplace. Other Adjustments for the first quarter of 2019 include: a total of $(0.3) million in amortization of the operating lease right-of-use assets and liabilities at the Hilton Garden Inn Chicago Downtown/Magnificent Mile, the Hilton San Diego Bayfront, the Hilton Times Square and the JW Marriott New Orleans; a total of $(0.6) million in finance lease obligation interest - cash ground rent at the Courtyard by Marriott Los Angeles and the Hyatt Centric Chicago Magnificent Mile; $0.4 million in city taxes assessed on commercial rents at the Hyatt Regency San Francisco; and a $0.2 million prior year property tax assessment received at the Oceans Edge Resort & Marina.
(2)Both Hotel Adjusted EBITDAre and Hotel Adjusted EBITDAre Margins are presented excluding any prior year property tax assessments and credits, net of any appeal fees. In the first quarters of 2021, 2020 and 2019, a $(0.1) million prior year property tax credit was received at the Renaissance Washington DC, a total of $(0.1) million in prior year property tax credits, net of appeal fees was received at the Embassy Suites Chicago and the Renaissance Harborplace and a $0.2 million prior year property tax assessment was received at the Oceans Edge Resort & Marina, respectively.
(3)17 Hotel Portfolio includes all hotels owned by the Company as of March 31, 2021.
(4)During the first quarter of 2020, a total of $10.1 million in COVID-19-related costs consisting of additional wages and benefits for furloughed or laid off employees was incurred at the following hotels: $0.1 million Boston Park Plaza; $0.1 million Embassy Suites Chicago; $0.1 million Embassy Suites La Jolla; $0.1 million Hilton Garden Inn Chicago Downtown/Magnificent Mile; $45,000 Hilton New Orleans St. Charles; $0.2 million Hilton San Diego Bayfront; $1.4 million Hilton Times Square; $0.1 million Hyatt Centric Chicago Magnificent Mile; $0.8 million Hyatt Regency San Francisco; $0.3 million JW Marriott New Orleans; $1.0 million Marriott Boston Long Wharf; $0.1 million The Bidwell Marriott Portland; $0.4 million Renaissance Harborplace; $0.3 million Renaissance Long Beach; $0.4 million Renaissance Los Angeles Airport; $0.8 million Renaissance Orlando at SeaWorld®; $1.3 million Renaissance Washington DC; $0.8 million Renaissance Westchester; and $1.8 million Wailea Beach Resort.
(5)Hotel Adjusted EBITDAre for the first quarter of 2020 is impacted by a room renovation at The Bidwell Marriott Portland. Hotel Adjusted EBITDAre for the first quarter of 2019 is impacted by room renovations at the Hilton San Diego Bayfront and the Renaissance Harborplace.
(6)Sold/Disposed Hotels includes results for the Renaissance Harborplace and the Renaissance Los Angeles Airport, sold in July 2020 and December 2020, respectively, and the Hilton Times Square, assigned to its mortgage holder in December 2020. Sold/Disposed Hotels for the first quarter of 2019 also includes results for the Courtyard by Marriott Los Angeles, sold in October 2019

​

​

PROPERTY-LEVEL ADJUSTED EBITDAre & ADJUSTED EBITDAre MARGINS

​

Page 52

​

​

​

Graphic

Graphic

BPP-Lobby-Bar

​

Wailea Beach Resort Slide

Graphic

Graphic

Graphic

Outside Shot

​

​


​

Graphic

Supplemental Financial Information
May 3, 2021

Property-Level Adjusted EBITDAre and Adjusted EBITDAre Margins

Q1, January, February and March 2021/2020/2019 Footnotes (continued)

​

(7)Actual Portfolio includes the 17 Hotel Portfolio plus the Sold/Disposed Hotels.
(8)Other Adjustments for January 2021 include: a total of $(0.1) million in amortization of the operating lease right-of-use assets and liabilities at the Hilton Garden Inn Chicago Downtown/Magnificent Mile, the Hilton San Diego Bayfront, and the JW Marriott New Orleans; and $(0.1) million in finance lease obligation interest - cash ground rent at the Hyatt Centric Chicago Magnificent Mile. Other Adjustments for January 2020 include: a total of $(0.1) million in amortization of the operating lease right-of-use assets and liabilities at the Hilton Garden Inn Chicago Downtown/Magnificent Mile, the Hilton San Diego Bayfront, the Hilton Times Square and the JW Marriott New Orleans; $(0.1) million in finance lease obligation interest - cash ground rent at the Hyatt Centric Chicago Magnificent Mile; and $0.1 million in city taxes assessed on commercial rents at the Hyatt Regency San Francisco. Other Adjustments for January 2019 include: a total of $(0.1) million in amortization of the operating lease right-of-use assets and liabilities at the Hilton Garden Inn Chicago Downtown/Magnificent Mile, the Hilton San Diego Bayfront, the Hilton Times Square and the JW Marriott New Orleans; $(0.2) million in finance lease obligation interest - cash ground rent at the Courtyard by Marriott Los Angeles and the Hyatt Centric Chicago Magnificent Mile; and $0.1 million in city taxes assessed on commercial rents at the Hyatt Regency San Francisco.
(9)Other Adjustments for February 2021 include: a total of $(0.1) million in amortization of the operating lease right-of-use assets and liabilities at the Hilton Garden Inn Chicago Downtown/Magnificent Mile, the Hilton San Diego Bayfront, and the JW Marriott New Orleans; $(0.1) million in finance lease obligation interest - cash ground rent at the Hyatt Centric Chicago Magnificent Mile; a nominal prior year property tax assessment received at the Renaissance Washington DC; and $17,000 in legal fees at the Renaissance Westchester. Other adjustments for February 2020 include: a total of $(0.1) million in amortization of the operating lease right-of-use assets and liabilities at the Hilton Garden Inn Chicago Downtown/Magnificent Mile, the Hilton San Diego Bayfront, the Hilton Times Square and the JW Marriott New Orleans; $(0.1) million in finance lease obligation interest - cash ground rent at the Hyatt Centric Chicago Magnificent Mile; $0.1 million in city taxes assessed on commercial rents at the Hyatt Regency San Francisco; and a $(24,000) prior year property tax credit received at the Embassy Suites Chicago. Other adjustments for February 2019 include: a total of $(0.1) million in amortization of the operating lease right-of-use assets and liabilities at the Hilton Garden Inn Chicago Downtown/Magnificent Mile, the Hilton San Diego Bayfront, the Hilton Times Square and the JW Marriott New Orleans; $(0.2) million in finance lease obligation interest - cash ground rent at the Courtyard by Marriott Los Angeles and the Hyatt Centric Chicago Magnificent Mile; $0.1 million in city taxes assessed on commercial rents at the Hyatt Regency San Francisco; and a $0.2 million prior year property tax assessment received at the Oceans Edge Resort & Marina.
(10)Other Adjustments for March 2021 include: a total of $(0.1) million in amortization of the operating lease right-of-use assets and liabilities at the Hilton Garden Inn Chicago Downtown/Magnificent Mile, the Hilton San Diego Bayfront, and the JW Marriott New Orleans; $(0.1) million in finance lease obligation interest - cash ground rent at the Hyatt Centric Chicago Magnificent Mile; a $(0.1) million prior year property tax credit received at the Renaissance Washington DC; and $41,000 in legal fees at the Renaissance Westchester. Other Adjustments for March 2020 include: $(0.1) million in amortization of the operating lease right-of-use assets and liabilities at the Hilton Garden Inn Chicago Downtown/Magnificent Mile, the Hilton San Diego Bayfront, the Hilton Times Square and the JW Marriott New Orleans; $(0.1) million in finance lease obligation interest - cash ground rent at the Hyatt Centric Chicago Magnificent Mile; a $(44,000) true-up in city taxes assessed on commercial rents at the Hyatt Regency San Francisco; and a $(0.1) million prior year property tax credit, net of appeal fees at the Renaissance Harborplace. Other Adjustments for March 2019 include: a total of $(0.1) million in amortization of the operating lease right-of-use assets and liabilities at the Hilton Garden Inn Chicago Downtown/Magnificent Mile, the Hilton San Diego Bayfront, the Hilton Times Square and the JW Marriott New Orleans; a total of $(0.2) million in finance lease obligation interest - cash ground rent at the Courtyard by Marriott Los Angeles and the Hyatt Centric Chicago Magnificent Mile; and $0.1 million in city taxes assessed on commercial rents at the Hyatt Regency San Francisco.

​

​

PROPERTY-LEVEL ADJUSTED EBITDAre & ADJUSTED EBITDAre MARGINS

​

Page 53

​

​

​

Graphic

Graphic

BPP-Lobby-Bar

​

Wailea Beach Resort Slide

Graphic

Graphic

Graphic

Outside Shot

​

​