0001023459
false
0001023459
2021-01-06
2021-01-06
iso4217:USD
xbrli:shares
iso4217:USD
xbrli:shares
UNITED STATES
SECURITIES AND EXCHANGE COMMISSION
WASHINGTON, D.C. 20549
FORM 8-K
CURRENT REPORT
PURSUANT TO SECTION 13 OR 15(d) OF THE SECURITIES
EXCHANGE ACT OF 1934
January
6, 2022
(Date of the
earliest event reported)

Simulations Plus, Inc.
(Exact name of
registrant as specified in its charter)
| California |
001-32046 |
95-4595609 |
| (State or other jurisdiction of incorporation) |
(Commission File Number) |
(I.R.S. Employer Identification No.) |
42505 10th Street West, Lancaster,
California 93534-7059
(Address of principal
executive offices) (Zip Code)
661-723-7723
Registrant's
telephone number, including area code
Check the appropriate box below if
the Form 8-K filing is intended to simultaneously satisfy the filing obligation of the registrant under any of the following provisions:
☐ Written communications pursuant to Rule 425 under the Securities Act (17 CFR 230.425)
☐ Soliciting material pursuant to Rule 14z-12 under Exchange Act (17 CFR 240.14a-12)
☐ Pre-commencement communications pursuant to Rule 14d-2(b) under Exchange Act (17 CFR 240.14d-2(b))
☐ Pre-commencement communications pursuant to Rule 13e-4(c) under Exchange Act (17 CFR 240.13e-4(c))
Securities registered pursuant to Section 12(b) of the Act:
| Title of each class |
Trading Symbol(s) |
Name of each exchange on which registered |
| Common Stock, par value $0.001 per share |
SLP |
The Nasdaq Stock Market LLC |
Indicate by check mark whether the
registrant is an emerging growth company as defined in Rule 405 of the Securities Act of 1933 (§230.405 of this chapter) or Rule
12b-2 of the Securities Exchange Act of 1934 (§240.12b-2 of this chapter).
Emerging Growth Company ☐
If an emerging growth company, indicate
by check mark if the registrant has elected not to use the extended transition period for complying with any new or revised financial
accounting standards provided pursuant to Section 13(a) of the Exchange Act. ☐
| Item 2.02 | Results of Operations and Financial Condition |
On January 6, 2022, Simulations Plus, Inc., a
California corporation (the “Company”), issued a press release announcing financial results for its first quarter of fiscal
year 2022 ended November 30, 2021. The press release is furnished as Exhibit 99.1 to this Current Report on Form 8-K (this “Report”).
| Item 7.01 | Regulation FD Disclosure |
On January 6, 2022, as part of the press release
referenced above, the Company announced that its board of directors has declared a quarterly cash dividend of $0.06 per share of common
stock, payable on February 7, 2022 to shareholders of record as of January 31, 2022.
In addition, on January 6, 2022, the Company held
an investor conference call reporting its financial results for its first quarter of fiscal year 2022 ended November 30, 2021. The PowerPoint
presentation, which was used for this investor conference call, is attached as Exhibit 99.2 to this Report.
In accordance with General Instructions B.2 of
Form 8-K, the information in this Report, including Exhibits 99.1 and 99.2, is being furnished and shall not be deemed “filed”
for purposes of Section 18 of the Securities Exchange Act of 1934, as amended (the “Exchange Act”), or otherwise subject to
the liability of that section, nor shall it be deemed incorporated by reference in any filing under the Securities Act of 1933, as amended,
or the Exchange Act, whether made before or after the date hereof, except as expressly set forth by specific reference in such filing
to this Report.
CAUTION REGARDING FORWARD-LOOKING STATEMENTS
This Report, including the disclosures set forth
herein and Exhibits 99.1 and 99.2 attached hereto, contains certain forward-looking statements that involve substantial risks and uncertainties.
When used herein, the terms "anticipates," "expects," "estimates," "believes" and similar expressions,
as they relate to us or our management, are intended to identify such forward-looking statements.
Forward-looking statements in this Report or reports
hereafter furnished, including in other publicly available documents filed with the Securities and Exchange Commission (the "Commission"),
to the Company’s stockholders and other publicly available statements issued or released by us involve known and unknown risks,
uncertainties and other factors which could cause our actual results, performance (financial or operating) or achievements to differ from
the future results, performance (financial or operating) or achievements expressed or implied by such forward-looking statements. Such
future results are based upon management's best estimates based upon current conditions and the most recent results of operations. These
risks include, but are not limited to, the risks set forth herein and in such other documents filed with the Commission, each of which
could adversely affect our business and the accuracy of the forward-looking statements contained herein. Our actual results, performance
or achievements may differ materially from those expressed or implied by such forward-looking statements.
| Item 9.01 |
Financial Statements and Exhibits. |
(d) Exhibits.
SIGNATURES
Pursuant to the requirements of the Securities
Exchange Act of 1934, the registrant has duly caused this report to be signed on its behalf by the undersigned thereunto duly authorized.
|
SIMULATIONS PLUS, INC. |
| |
|
| |
|
| Dated: January 6, 2022 |
By: /s/ Will Frederick |
| |
Will Frederick |
| |
Chief Financial Officer |
Exhibit 99.1

Simulations Plus
Reports First Quarter Fiscal 2022 Financial Results
Total revenue
growth of 16%; Software revenue growth of 19%; Diluted Earnings Per Share (EPS) growth of 25%
Board of Directors
announces quarterly dividend of $0.06 per share
LANCASTER, CA, January 6, 2022 –
Simulations Plus, Inc. (Nasdaq: SLP), a leading provider of modeling and simulation software and services for pharmaceutical safety and
efficacy, today reported financial results for its first quarter of fiscal 2022, ended November 30, 2021.
Shawn O’Connor, chief executive officer
of Simulations Plus, said, “Our software business continued to deliver higher revenue and margins in the first quarter, supplemented
by improving momentum in our services business, which returned the company to overall double-digit revenue growth. The reinvigorated growth
enabled a 22% improvement in net income, demonstrating both the benefit of a higher software versus services revenue mix and the inherent
leverage in our operating model.”
First Quarter Fiscal 2022 Financial Highlights
(compared with the corresponding period last fiscal year):
| · | Total revenue increased 16% to $12.4 million; |
| · | Software revenue increased 19% to $7.4 million, representing 59% of total revenue; |
| · | Services revenue increased 13% to $5.0 million, representing 41% of total revenue; |
| · | Gross profit increased 17% to $9.7 million; gross margin was 78%; |
| · | Net income and diluted EPS of $3.0 million and $0.15 compared to $2.5 million and $0.12, respectively; |
| · | Adjusted EBITDA of $5.3 million, representing 42% of total revenue. |
Mr. O’Connor concluded, “Looking forward,
we remain focused on our organic growth strategy driven by key initiatives, including investing in our sales and marketing function, cross-selling
products and services, and continuing to enhance our industry leading software offerings with new and improved functionality and incremental
capabilities. With a software business that continues to generate consistently high growth rates, and a consulting services business that’s
growing its pipeline and backlog, we remain confident in achieving our 10-15% total revenue guidance for fiscal 2022.”
Quarterly Dividend
The company’s Board of Directors declared
a cash dividend of $0.06 per share of the company’s common stock, payable on February 7, 2022, to shareholders of record as of January
31, 2022. The declaration of any future dividends will be determined by the Board of Directors each quarter and will depend on earnings,
financial condition, capital requirements, and other factors.
Environmental, Social, and Governance (ESG)
We focus our Environmental,
Social, and Governance (ESG) efforts where we can have the most positive impact. To learn more about our latest initiatives and priorities,
please visit our website to read our ESG Report.
Webcast and Conference Call Details
Shawn O’Connor,
chief executive officer, and Will Frederick, chief financial officer, will host a conference call and webcast today at 5 p.m. Eastern
Time to discuss details of the company’s performance for the quarter and certain forward-looking information. The call may be accessed
by registering here or by calling 1-201-389-0879. The webcast will be available on our website under
Conference Calls & Presentations. A replay of the webcast will be available on the website approximately
one hour following the call.
Non-GAAP Definition
Adjusted EBITDA is defined as earnings (loss)
before interest, taxes, depreciation and amortization, stock-based compensation, and any acquisition or financial transaction-related
expenses. Adjusted EBITDA represents a measure that we believe is customarily used by investors and analysts to evaluate the financial
performance of companies in addition to the GAAP measures that we present. Our management also believes that Adjusted EBITDA is useful
in evaluating our core operating results. However, Adjusted EBITDA is not a measure of financial performance under accounting principles
generally accepted in the United States of America and should not be considered an alternative to net income or operating income as an
indicator of our operating performance or to net cash provided by operating activities as a measure of our liquidity. The company’s
Adjusted EBITDA measure may not provide information that is directly comparable to that provided by other companies in its industry, as
other companies in its industry may calculate non-GAAP financial results differently, particularly related to non-recurring, unusual items.
About Simulations Plus
Serving clients
worldwide for 25 years, Simulations Plus is a leading provider of modeling and simulation software and consulting services supporting
drug discovery, development, research, and regulatory submissions. We offer solutions that bridge machine learning, physiologically based
pharmacokinetics, quantitative systems pharmacology/toxicology, and population PK/PD modeling approaches. Our technology is licensed and
applied by major pharmaceutical, biotechnology, chemical, consumer goods companies, and regulatory agencies worldwide. For more information,
visit our website at www.simulations-plus.com. Follow us on Twitter |
LinkedIn.
Forward-Looking Statements
Except for historical information, the matters
discussed in this press release are forward-looking statements that involve risks and uncertainties. Words like “believe,”
“expect,” and “anticipate” mean that these are our best estimates as of this writing, but that there can be no
assurances that expected or anticipated results or events will actually take place, so our actual future results could differ significantly
from those statements. Factors that could cause or contribute to such differences include, but are not limited to: our ability to maintain
our competitive advantages, acceptance of new software and improved versions of our existing software by our customers, the general economics
of the pharmaceutical industry, our ability to finance growth, our ability to continue to attract and retain highly qualified technical
staff, our ability to identify and close acquisitions on terms favorable to the company, and a sustainable market. Further information
on our risk factors is contained in our quarterly and annual reports and filed with the U.S. Securities and Exchange Commission.
Investor Relations Contacts:
Renee Bouche
Simulations Plus Investor Relations
661-723-7723
[email protected]
Brian Siegel
Hayden IR
346-396-8696
[email protected]
--Tables follow—
SIMULATIONS PLUS, INC.
CONDENSED CONSOLIDATED STATEMENTS OF OPERATIONS AND COMPREHENSIVE INCOME
(Unaudited)
| | |
Three months ended November 30, | |
| (in thousands, except per common share amounts) | |
2021 | | |
2020 | |
| | |
| | |
| |
| Revenue | |
| | | |
| | |
| Software | |
$ | 7,362 | | |
$ | 6,212 | |
| Services | |
| 5,055 | | |
| 4,489 | |
| Total revenue | |
| 12,417 | | |
| 10,701 | |
| Cost of revenue | |
| | | |
| | |
| Software | |
| 735 | | |
| 812 | |
| Services | |
| 2,021 | | |
| 1,621 | |
| Total cost of revenue | |
| 2,756 | | |
| 2,433 | |
| Gross profit | |
| 9,661 | | |
| 8,268 | |
| Operating expenses | |
| | | |
| | |
| Research and development | |
| 882 | | |
| 809 | |
| Selling, general and administrative | |
| 4,988 | | |
| 4,408 | |
| Total operating expenses | |
| 5,870 | | |
| 5,217 | |
| | |
| | | |
| | |
| Income from operations | |
| 3,791 | | |
| 3,051 | |
| | |
| | | |
| | |
| Other income (expense) | |
| | | |
| | |
| Interest income | |
| 64 | | |
| 61 | |
| Change in value of contingent consideration | |
| (121 | ) | |
| (121 | ) |
| Gain on sale of assets | |
| 1 | | |
| – | |
| Gain on currency exchange | |
| 121 | | |
| 5 | |
| Total other income (expense), net | |
| 65 | | |
| (55 | ) |
| | |
| | | |
| | |
| Income before income taxes | |
| 3,856 | | |
| 2,996 | |
| Provision for income taxes | |
| (830 | ) | |
| (517 | ) |
| Net Income | |
$ | 3,026 | | |
$ | 2,479 | |
| | |
| | | |
| | |
| Earnings per share | |
| | | |
| | |
| Basic | |
$ | 0.15 | | |
$ | 0.12 | |
| Diluted | |
$ | 0.15 | | |
$ | 0.12 | |
| | |
| | | |
| | |
| Weighted-average common shares outstanding | |
| | | |
| | |
| Basic | |
| 20,150 | | |
| 19,930 | |
| Diluted | |
| 20,746 | | |
| 20,799 | |
| | |
| | | |
| | |
| Other comprehensive income (loss), net of tax | |
| | | |
| | |
| Foreign currency translation adjustments | |
| (237 | ) | |
| – | |
| Comprehensive income | |
$ | 2,789 | | |
$ | 2,479 | |
SIMULATIONS PLUS, INC.
CONDENSED CONSOLIDATED BALANCE SHEETS
| | |
(Unaudited) | | |
(Audited) | |
| (In thousands, except share and per share amounts) | |
November 30, 2021 | | |
August 31, 2021 | |
| ASSETS | |
| | | |
| | |
| Current assets | |
| | | |
| | |
| Cash and cash equivalents | |
$ | 41,680 | | |
$ | 36,984 | |
| Accounts receivable, net of allowance for doubtful accounts of $12 and $78 | |
| 11,823 | | |
| 9,851 | |
| Revenue in excess of billings | |
| 1,483 | | |
| 3,150 | |
| Prepaid income taxes | |
| 584 | | |
| 1,012 | |
| Prepaid expenses and other current assets | |
| 1,676 | | |
| 1,696 | |
| Short-term investments | |
| 82,660 | | |
| 86,620 | |
| Total current assets | |
| 139,906 | | |
| 139,313 | |
| Long-term assets | |
| | | |
| | |
| Capitalized computer software development costs, | |
| | | |
| | |
| net of accumulated amortization of $14,734 and $14,438 | |
| 8,189 | | |
| 7,646 | |
| Property and equipment, net | |
| 2,339 | | |
| 1,838 | |
| Operating lease right of use asset | |
| 1,146 | | |
| 1,276 | |
| Intellectual property, net of accumulated amortization of $6,873 and $6,516 | |
| 10,112 | | |
| 10,469 | |
| Other intangible assets, net of accumulated amortization of $2,319 and $2,186 | |
| 6,331 | | |
| 6,464 | |
| Goodwill | |
| 12,921 | | |
| 12,921 | |
| Other assets | |
| 50 | | |
| 51 | |
| Total assets | |
$ | 180,994 | | |
$ | 179,978 | |
| | |
| | | |
| | |
| LIABILITIES AND SHAREHOLDERS' EQUITY | |
| | | |
| | |
| Current liabilities | |
| | | |
| | |
| Accounts payable | |
$ | 19 | | |
$ | 387 | |
| Accrued payroll and other expenses | |
| 3,967 | | |
| 5,604 | |
| Contracts payable - current portion | |
| 4,671 | | |
| 4,550 | |
| Billings in excess of revenue | |
| 52 | | |
| 117 | |
| Operating lease liability, current portion | |
| 338 | | |
| 382 | |
| Deferred revenue | |
| 568 | | |
| 534 | |
| Total current liabilities | |
| 9,615 | | |
| 11,574 | |
| | |
| | | |
| | |
| Long-term liabilities | |
| | | |
| | |
| Deferred income taxes, net | |
| 2,113 | | |
| 1,726 | |
| Operating lease liability | |
| 810 | | |
| 896 | |
| Total liabilities | |
| 12,538 | | |
| 14,196 | |
| | |
| | | |
| | |
| Commitments and contingencies | |
| | | |
| | |
| | |
| | | |
| | |
| Shareholders' equity | |
| | | |
| | |
| Preferred stock, $0.001 par value 10,000,000 shares authorized no shares issued and outstanding | |
| – | | |
| – | |
| Common stock, $0.001 par value and additional paid-in capital — 50,000,000 shares authorized, 20,168,796 and 20,141,521 shares issued and outstanding | |
| 134,512 | | |
| 133,418 | |
| Retained earnings | |
| 34,224 | | |
| 32,407 | |
| Accumulated other comprehensive loss | |
| (280 | ) | |
| (43 | ) |
| Total shareholders' equity | |
| 168,456 | | |
| 165,782 | |
| Total liabilities and shareholders' equity | |
$ | 180,994 | | |
$ | 179,978 | |
SIMULATIONS PLUS, INC.
Trended Financial Information*
(Unaudited)
| | |
2021 | | |
2022 | | |
2021 | | |
2022 | |
| (in millions except earnings per share amounts) | |
Q1 | | |
Q2 | | |
Q3 | | |
Q4 | | |
Q1 | | |
Fiscal Year | | |
Fiscal YTD | |
| Software revenue | |
| | | |
| | | |
| | | |
| | | |
| | | |
| | | |
| | |
| Gastroplus | |
$ | 3.3 | | |
$ | 4.5 | | |
$ | 5.4 | | |
$ | 3.1 | | |
$ | 4.0 | | |
$ | 16.3 | | |
$ | 4.0 | |
| MonolixSuite | |
| 1.2 | | |
| 1.6 | | |
| 0.9 | | |
| 0.8 | | |
| 1.6 | | |
| 4.4 | | |
| 1.6 | |
| ADMET Predictor | |
| 1.2 | | |
| 1.2 | | |
| 1.5 | | |
| 1.2 | | |
| 1.5 | | |
| 5.0 | | |
| 1.5 | |
| Other | |
| 0.5 | | |
| 0.6 | | |
| 0.5 | | |
| 0.3 | | |
| 0.3 | | |
| 1.9 | | |
| 0.3 | |
| Total software revenue | |
$ | 6.2 | | |
$ | 7.8 | | |
$ | 8.3 | | |
$ | 5.4 | | |
$ | 7.4 | | |
$ | 27.7 | | |
$ | 7.4 | |
| Services revenue | |
| | | |
| | | |
| | | |
| | | |
| | | |
| | | |
| | |
| PKPD | |
$ | 2.2 | | |
$ | 2.6 | | |
$ | 1.9 | | |
$ | 2.3 | | |
$ | 2.3 | | |
$ | 9.1 | | |
$ | 2.3 | |
| QSP/QST | |
| 1.1 | | |
| 1.7 | | |
| 1.2 | | |
| 1.1 | | |
| 1.5 | | |
| 5.1 | | |
| 1.5 | |
| PBPK | |
| 0.6 | | |
| 0.9 | | |
| 0.7 | | |
| 0.7 | | |
| 0.9 | | |
| 3.0 | | |
| 0.9 | |
| Other | |
| 0.5 | | |
| – | | |
| 0.6 | | |
| 0.3 | | |
| 0.4 | | |
| 1.4 | | |
| 0.4 | |
| Total services revenue | |
$ | 4.5 | | |
$ | 5.3 | | |
$ | 4.4 | | |
$ | 4.4 | | |
$ | 5.1 | | |
$ | 18.8 | | |
$ | 5.1 | |
| Total consolidated revenue | |
$ | 10.7 | | |
$ | 13.1 | | |
$ | 12.8 | | |
$ | 9.8 | | |
$ | 12.4 | | |
$ | 46.5 | | |
$ | 12.4 | |
| | |
| | | |
| | | |
| | | |
| | | |
| | | |
| | | |
| | |
| Gross Margin | |
| | | |
| | | |
| | | |
| | | |
| | | |
| | | |
| | |
| Software | |
| 86.9% | | |
| 89.0% | | |
| 90.0% | | |
| 85.0% | | |
| 90.0% | | |
| 88.0% | | |
| 90.0% | |
| Services | |
| 63.9% | | |
| 61.0% | | |
| 63.0% | | |
| 55.0% | | |
| 60.0% | | |
| 61.0% | | |
| 60.0% | |
| Total | |
| 77.3% | | |
| 77.9% | | |
| 80.7% | | |
| 71.7% | | |
| 77.8% | | |
| 77.2% | | |
| 77.8% | |
| | |
| | | |
| | | |
| | | |
| | | |
| | | |
| | | |
| | |
| Income from operations | |
$ | 3.1 | | |
$ | 3.5 | | |
$ | 4.5 | | |
$ | 0.2 | | |
$ | 3.8 | | |
$ | 11.3 | | |
$ | 3.8 | |
| Operating Margin | |
| 28.5% | | |
| 26.6% | | |
| 35.6% | | |
| 1.8% | | |
| 30.5% | | |
| 24.2% | | |
| 30.5% | |
| Net Income | |
$ | 2.5 | | |
$ | 3.2 | | |
$ | 3.8 | | |
$ | 0.3 | | |
$ | 3.0 | | |
$ | 9.8 | | |
$ | 3.0 | |
| Diluted Earnings Per Share | |
$ | 0.12 | | |
$ | 0.15 | | |
$ | 0.18 | | |
$ | 0.01 | | |
$ | 0.15 | | |
$ | 0.47 | | |
$ | 0.15 | |
| Adjusted EBITDA | |
$ | 4.3 | | |
$ | 5.0 | | |
$ | 5.9 | | |
$ | 1.7 | | |
$ | 5.3 | | |
| 16.9 | | |
$ | 5.3 | |
| Cash Flow from Operations | |
$ | 5.3 | | |
$ | 1.3 | | |
$ | 4.3 | | |
$ | 8.3 | | |
$ | 3.6 | | |
| 19.2 | | |
$ | 3.6 | |
| | |
| | | |
| | | |
| | | |
| | | |
| | | |
| | | |
| | |
| Revenue Breakdown by Region | |
| | | |
| | | |
| | | |
| | | |
| | | |
| | | |
| | |
| Americas | |
$ | 7.1 | | |
$ | 8.7 | | |
$ | 9.7 | | |
$ | 7.1 | | |
$ | 8.5 | | |
| 32.5 | | |
$ | 8.5 | |
| EMEA | |
| 2.5 | | |
| 3.1 | | |
| 1.5 | | |
| 0.9 | | |
| 3.0 | | |
| 7.9 | | |
| 3.0 | |
| Asia Pacific | |
| 1.1 | | |
| 1.4 | | |
| 1.7 | | |
| 1.8 | | |
| 0.9 | | |
| 6.0 | | |
| 0.9 | |
| Total consolidated revenue | |
$ | 10.7 | | |
$ | 13.1 | | |
$ | 12.8 | | |
$ | 9.8 | | |
$ | 12.4 | | |
$ | 46.6 | | |
$ | 12.4 | |
| | |
| | | |
| | | |
| | | |
| | | |
| | | |
| | | |
| | |
| Software Performance Metrics | |
| | | |
| | | |
| | | |
| | | |
| | | |
| | | |
| | |
| Average Revenue per Customer (in thousands) | |
| | | |
| | | |
| | | |
| | | |
| | | |
| | | |
| | |
| Commercial | |
$ | 74.0 | | |
$ | 84.0 | | |
$ | 98.0 | | |
$ | 65.0 | | |
$ | 71.0 | | |
| | | |
| | |
| | |
| | | |
| | | |
| | | |
| | | |
| | | |
| | | |
| | |
| Services Performance Metrics | |
| | | |
| | | |
| | | |
| | | |
| | | |
| | | |
| | |
| Backlog | |
$ | 12.0 | | |
$ | 11.2 | | |
$ | 12.4 | | |
$ | 13.0 | | |
$ | 15.4 | | |
| | | |
| | |
*Numbers may not add due to rounding
SIMULATIONS PLUS, INC.
Reconciliation of Adjusted EBITDA to Net Income
(Unaudited)
| | |
2021 | | |
2022 | | |
2021 | | |
2022 | |
| (in millions) | |
Q1 | | |
Q2 | | |
Q3 | | |
Q4 | | |
Q1 | | |
Fiscal Year | | |
Fiscal YTD | |
| Net Income | |
$ | 2.5 | | |
$ | 3.2 | | |
$ | 3.8 | | |
$ | 0.3 | | |
$ | 3.0 | | |
$ | 9.8 | | |
$ | 3.0 | |
| Excluding: | |
| | | |
| | | |
| | | |
| | | |
| | | |
| | | |
| | |
| Interest income and expense, net | |
| (0.1 | ) | |
| (0.0 | ) | |
| (0.0 | ) | |
| (0.0 | ) | |
| (0.1 | ) | |
| (0.2 | ) | |
| (0.1 | ) |
| Provision for income taxes | |
| 0.5 | | |
| 0.2 | | |
| 0.7 | | |
| (0.1 | ) | |
| 0.8 | | |
| 1.3 | | |
| 0.8 | |
| Depreciation and amortization | |
| 0.9 | | |
| 0.9 | | |
| 0.9 | | |
| 1.0 | | |
| 0.8 | | |
| 3.6 | | |
| 0.8 | |
| Stock-based compensation | |
| 0.5 | | |
| 0.7 | | |
| 0.6 | | |
| 0.6 | | |
| 0.6 | | |
| 2.4 | | |
| 0.6 | |
| | |
| | | |
| | | |
| | | |
| | | |
| | | |
| | | |
| | |
| Adjusted EBITDA | |
$ | 4.3 | | |
$ | 5.0 | | |
$ | 5.9 | | |
$ | 1.7 | | |
$ | 5.3 | | |
$ | 16.9 | | |
$ | 5.3 | |
Exhibit 99.2
1 | NASDAQ: SLP Earnings Call – Q1 FY22 January 6, 2022 1
2 | NASDAQ: SLP With the exception of historical information, the matters discussed in this presentation are forward - looking statements that involve a number of risks and uncertainties . Words like “believe,” “expect” and “anticipate” mean that these are our best estimates as of this writing, but that there can be no assurances that expected or anticipated results or events will actually take place, so our actual future results could differ significantly from those statements . Factors that could cause or contribute to such differences include, but are not limited to : our ability to maintain our competitive advantages, acceptance of new software and improved versions of our existing software by our customers, the general economics of the pharmaceutical industry, our ability to finance growth, our ability to continue to attract and retain highly qualified technical staff, our ability to identify and close acquisitions on terms favorable to the Company, and a sustainable market . Further information on our risk factors is contained in our quarterly and annual reports and filed with the U . S . Securities and Exchange Commission . Safe Harbor Statement
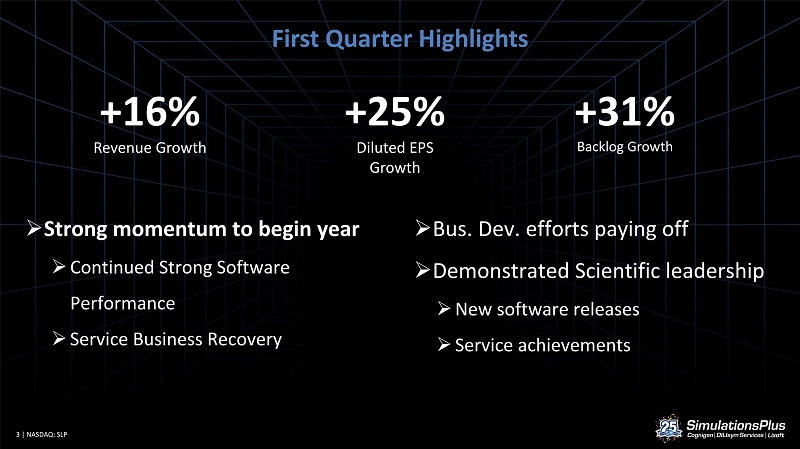
3 | NASDAQ: SLP First Quarter Highlights » Strong momentum to begin year » Continued Strong Software Performance » Service Business Recovery +16% Revenue Growth +25% Diluted EPS Growth +31% Backlog Growth » Bus. Dev. efforts paying off » Demonstrated Scientific leadership » New software releases » Service achievements
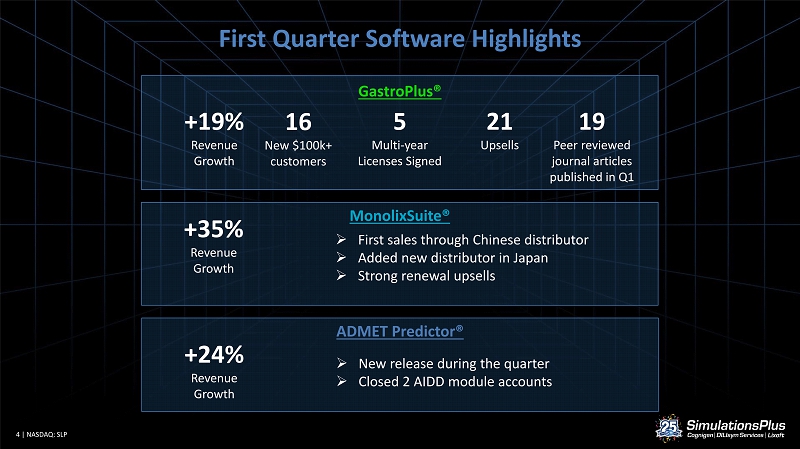
4 | NASDAQ: SLP MonolixSuite® GastroPlus® +35% Revenue Growth 5 Multi - year Licenses Signed 16 New $100k+ customers 21 Upsells » First sales through Chinese distributor » Added new distributor in Japan » Strong renewal upsells First Quarter Software Highlights +19% Revenue Growth 19 Peer reviewed journal articles published in Q1 ADMET Predictor® » New release during the quarter » Closed 2 AIDD module accounts +24% Revenue Growth
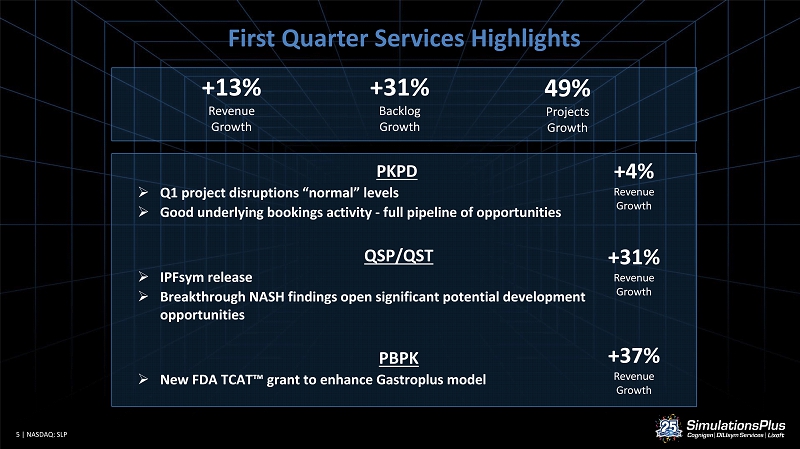
5 | NASDAQ: SLP First Quarter Services Highlights PKPD » Q1 project disruptions “normal” levels » Good underlying bookings activity - full pipeline of opportunities QSP/QST » IPFsym release » Breakthrough NASH findings open significant potential development opportunities PBPK » New FDA TCAT Ρ grant to enhance Gastroplus model +31% Backlog Growth 49% Projects Growth +13% Revenue Growth +4% Revenue Growth +31% Revenue Growth +37% Revenue Growth
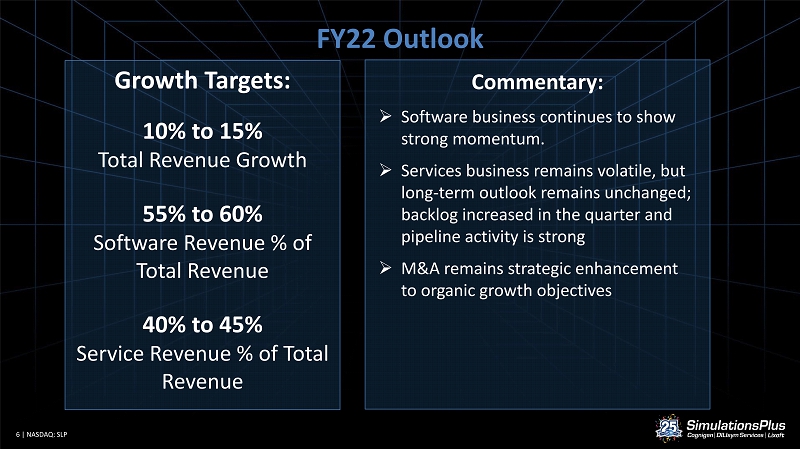
6 | NASDAQ: SLP FY22 Outlook Growth Targets: 10% to 15% Total Revenue Growth 55% to 60% Software Revenue % of Total Revenue 40% to 45% Service Revenue % of Total Revenue Commentary: » Software business continues to show strong momentum. » Services business remains volatile, but long - term outlook remains unchanged; backlog increased in the quarter and pipeline activity is strong » M&A remains strategic enhancement to organic growth objectives
7 | NASDAQ: SLP Financial Results
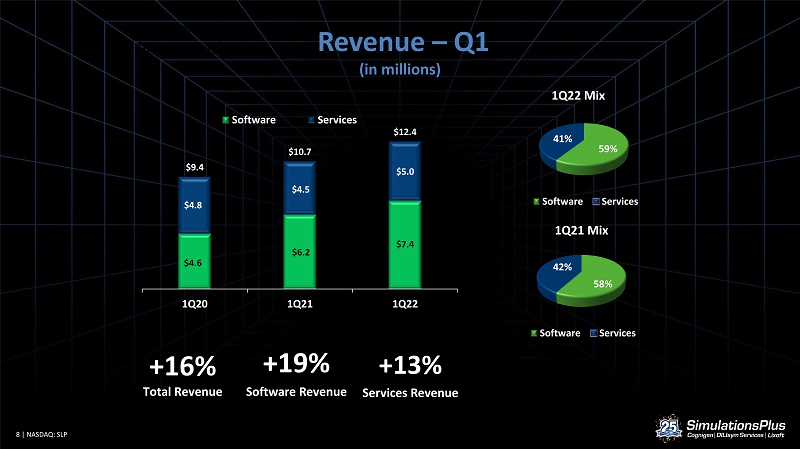
8 | NASDAQ: SLP Q4 Revenue (in millions) +16% Total Revenue $4.6 $6.2 $7.4 $4.8 $4.5 $5.0 $9.4 $10.7 $12.4 1Q20 1Q21 1Q22 Software Services 58% 42% 1Q21 Mix Software Services 59% 41% 1Q22 Mix Software Services +19% Software Revenue +13% Services Revenue Revenue – Q1 (in millions)
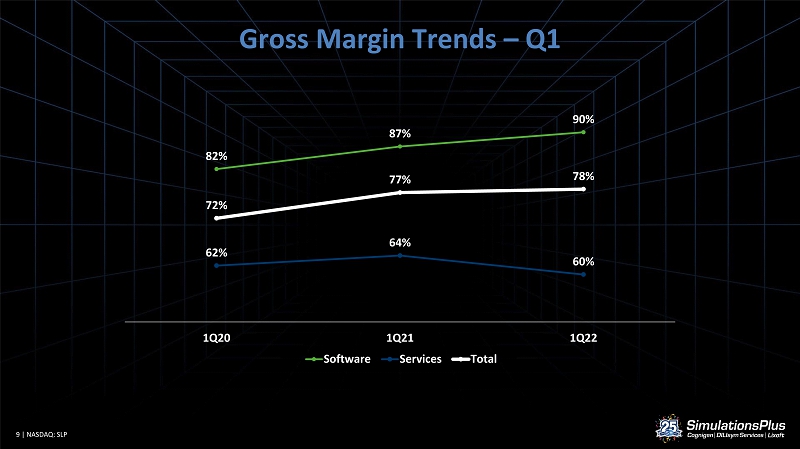
9 | NASDAQ: SLP 82% 87% 90% 62% 64% 60% 72% 77% 78% 1Q20 1Q21 1Q22 Software Services Total Gross Margin Trends – Q1
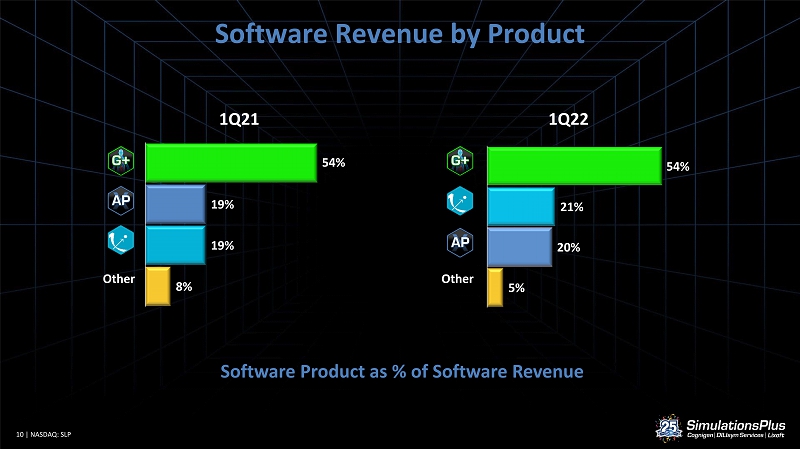
10 | NASDAQ: SLP Software Revenue by Product Software Product as % of Software Revenue 54% 19% 19% 8% 1Q21 Other 54% 21% 20% 5% 1Q22 Other
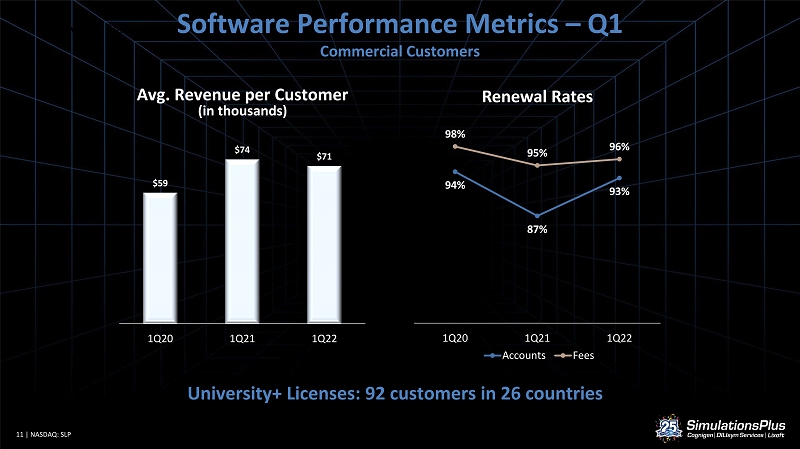
11 | NASDAQ: SLP Software Performance Metrics – Q4 Avg. Revenue per Customer (in thousands) $59 $74 $71 1Q20 1Q21 1Q22 94% 87% 93% 98% 95% 96% 1Q20 1Q21 1Q22 Accounts Fees Software Performance Metrics – Q1 Commercial Customers University+ Licenses: 92 customers in 26 countries Renewal Rates
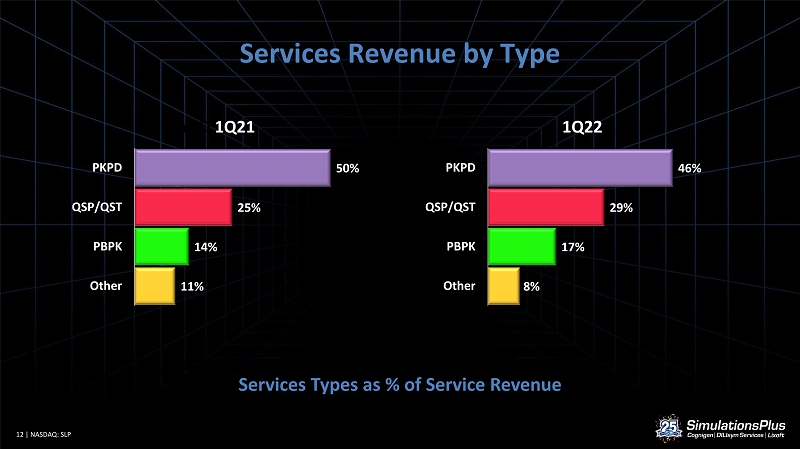
12 | NASDAQ: SLP Services Revenue by Type Services Types as % of Service Revenue 50% 25% 14% 11% PKPD QSP/QST PBPK Other YTD 1Q21 46% 29% 17% 8% PKPD QSP/QST PBPK Other 1Q22
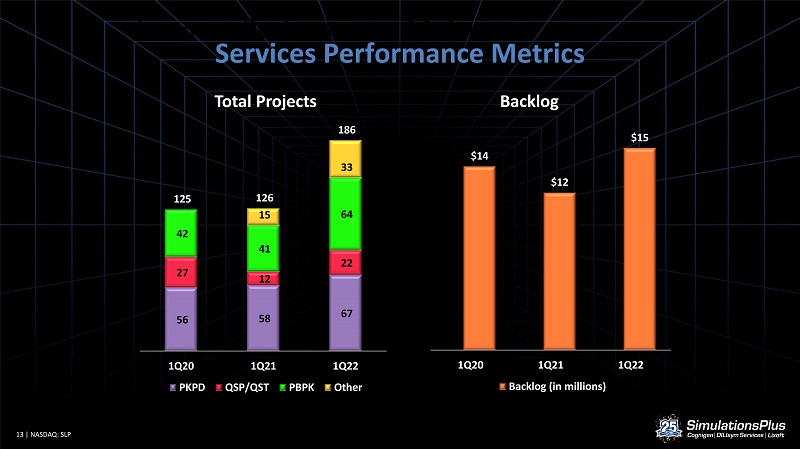
13 | NASDAQ: SLP Services Performance Metrics $14 $12 $15 1Q20 1Q21 1Q22 Backlog (in millions) 56 58 67 27 12 22 42 41 64 15 33 125 126 186 1Q20 1Q21 1Q22 PKPD QSP/QST PBPK Other Backlog Services Performance Metrics Total Projects
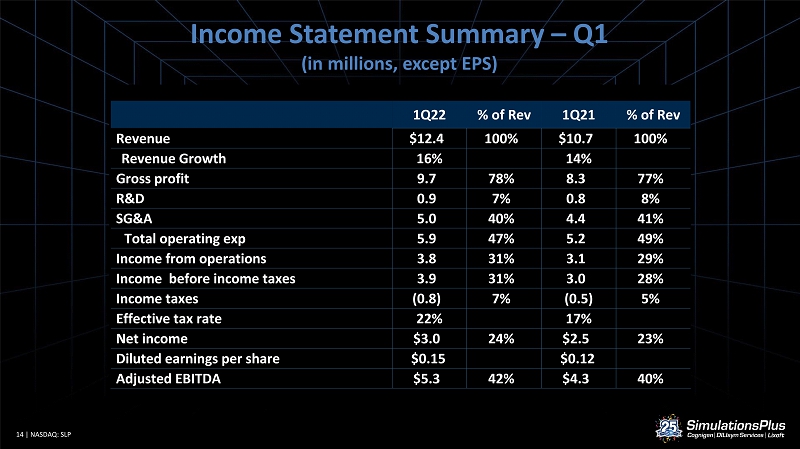
14 | NASDAQ: SLP Income Statement Summary – Q1 (in millions, except EPS) 1Q22 % of Rev 1Q21 % of Rev Revenue $12.4 100% $10.7 100% Revenue Growth 16% 14% Gross profit 9.7 78% 8.3 77% R&D 0.9 7% 0.8 8% SG&A 5.0 40% 4.4 41% Total operating exp 5.9 47% 5.2 49% Income from operations 3.8 31% 3.1 29% Income before income taxes 3.9 31% 3.0 28% Income taxes (0.8) 7% (0.5) 5% Effective tax rate 22% 17% Net income $3.0 24% $2.5 23% Diluted earnings per share $0.15 $0.12 Adjusted EBITDA $5.3 42% $4.3 40%
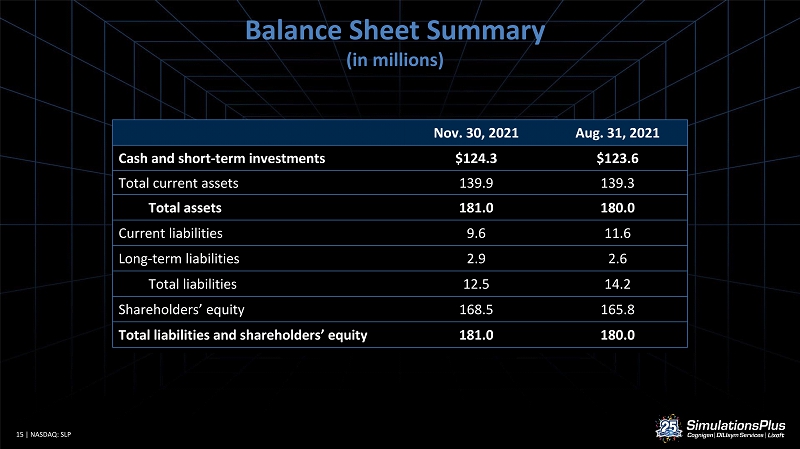
15 | NASDAQ: SLP Balance Sheet Summary (in millions) Nov. 30, 2021 Aug. 31, 2021 Cash and short - term investments $124.3 $123.6 Total current assets 139.9 139.3 Total assets 181.0 180.0 Current liabilities 9.6 11.6 Long - term liabilities 2.9 2.6 Total liabilities 12.5 14.2 Shareholders’ equity 168.5 165.8 Total liabilities and shareholders’ equity 181.0 180.0
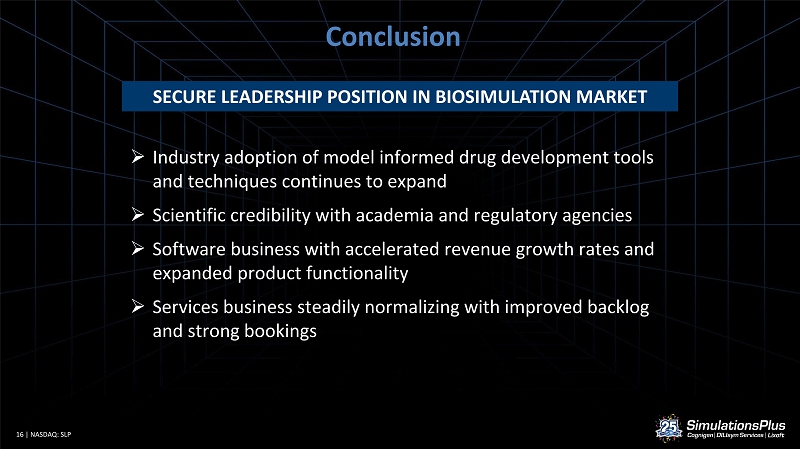
16 | NASDAQ: SLP Conclusion » Industry adoption of model informed drug development tools and techniques continues to expand » Scientific credibility with academia and regulatory agencies » Software business with accelerated revenue growth rates and expanded product functionality » Services business steadily normalizing with improved backlog and strong bookings SECURE LEADERSHIP POSITION IN BIOSIMULATION MARKET