UNITED STATES
SECURITIES AND EXCHANGE COMMISSION

Washington, D.C. 20549
_______________

Form 8-K
Current Report
_______________

Pursuant to Section 13 or 15(d)
of the Securities Exchange Act of 1934

Date of Report (Date of earliest event reported): February 8, 2021

SELECTQUOTE, INC.
(Exact name of registrant as specified in its charter)
_____________
Commission file number: 001-39295
Delaware94-3339273
(State of incorporation)
(I.R.S. Employer Identification No.)
6800 West 115th Street, Suite 2511
Overland Park, Kansas66211
(Address of principal executive offices)
(Zip Code)
(913) 599-9225
(Registrant’s telephone number, including area code)

Check the appropriate box below if the Form 8-K filing is intended to simultaneously satisfy the filing obligation of the registrant under any of the following provisions:

Written communications pursuant to Rule 425 under the Securities Act (17 CFR 230.425)
Soliciting material pursuant to Rule 14a-12 under the Exchange Act (17 CFR 240.14a-12)
Pre-commencement communications pursuant to Rule 14d-2(b) under the Exchange Act (17 CFR 240.14d-2(b))
Pre-commencement communications pursuant to Rule 13e-4(c) under the Exchange Act (17 CFR 240.13e-4(c))

Securities registered pursuant to Section 12(b) of the Act:
Title of each class: Common StockTrading SymbolName of each exchange on which registered
$0.01 par valueSLQTNew York Stock Exchange
Indicate by check mark whether the registrant is an emerging growth company as defined in Rule 405 of the Securities Act of 1933 (§230.405 of this chapter) or Rule 12b-2 of the Securities Exchange Act of 1934 (§240.12b-2 of this chapter).

Emerging growth company ☒

If an emerging growth company, indicate by check mark if the registrant has elected not to use the extended transition period for complying with any new or revised financial accounting standards provided pursuant to Section 13(a) of the Exchange Act. ☐


Item 2.02. Results of Operations and Financial Condition.

On February 8, 2021, SelectQuote, Inc. reported its financial results for the second quarter ended December 31, 2020. A copy of the related press release and earnings presentation are attached hereto as Exhibits 99.1 and 99.2, respectively.

These exhibits are being furnished pursuant to Item 2.02, and the information contained therein shall not be deemed “filed” for the purposes of Section 18 of the Securities Exchange Act of 1934, as amended (the “Exchange Act”), or otherwise subject to the liabilities of that section, nor shall either of them be deemed incorporated by reference in any filing under the Securities Act of 1933, as amended, or the Exchange Act, except as shall be expressly set forth by specific reference in such filing.

Item 9.01 Financial Statements and Exhibits.

(d)    Exhibits
Exhibit No.
Description of Exhibit

Press Release
Investor Presentation


SIGNATURES

Pursuant to the requirements of the Securities Exchange Act of 1934, the registrant has duly caused this report to be signed on its behalf by the undersigned hereunto duly authorized.

SELECTQUOTE, INC.

Date: February 8, 2021
By: /s/ Raffaele Sadun         
Name: Raffaele Sadun
Title: Chief Financial Officer


Exhibit 99.1
SelectQuote, Inc. Reports Second Quarter and Fiscal Year to Date 2021 Results

Second Quarter of Fiscal Year 2021 - Consolidated Earnings Highlights

Revenue of $358.3 million, Up 103% Year-Over-Year
Net Income of $90.4 million, improvement of $51.3 million Year-Over-Year
Adjusted EBITDA of $129.5 million, Up 88% Year-Over-Year*

Raising Full-Year 2021 Revenue, Net Income and Adjusted EBITDA Guidance:
Revenue expected in a range of $920 million to $940 million
Net Income expected in a range of $138 million to $146 million
Adjusted EBITDA expected in a range of $230 million to $240 million*

Second Quarter of Fiscal Year 2021 - Segment Highlights

Senior
Revenue of $315.5 million, Up 127% Year-Over-Year
Adjusted EBITDA of $134.6 million, Up 98% Year-Over-Year*
Approved Medicare Advantage policies grew 132% Year-Over-Year

Life
Revenue of $36.4 million, Up 26% Year-Over-Year
Adjusted EBITDA of $6.4 million, Up 3% Year-Over-Year*
Final expense premiums grew 229% Year-Over-Year

Auto & Home
Revenue of $7.2 million, Down 15% Year-Over-Year
Adjusted EBITDA of $2.2 million, Up 42% Year-Over-Year*
Total Auto & Home premiums declined 10% Year-Over-Year

OVERLAND PARK, Kan., February 8, 2021--(BUSINESS WIRE)--SelectQuote, Inc. (NYSE: SLQT), reported consolidated revenue for the second quarter of fiscal year 2021 of $358.3 million, which was a 103% increase over consolidated revenue for the second quarter of fiscal year 2020 of $176.3 million. Consolidated net income for the second quarter of fiscal year 2021 was $90.4 million, which was a $51.3 million increase over consolidated net income for the second quarter of fiscal year 2020 of $39.1 million. Finally, consolidated Adjusted EBITDA for the second quarter of fiscal year 2021 was $129.5 million, which was an 88% increase over consolidated Adjusted EBITDA for the second quarter of fiscal year 2020 of $69.0 million.

Consolidated revenue for the six months ended December 31, 2020, was $482.4 million, a 100% increase over consolidated revenue for the six months ended December 31, 2019, of $241.5 million. Consolidated net income for the six months ended December 31, 2020, was $91.3 million, an increase of $53.9 million over consolidated net income for the six months ended December 31, 2019, of $37.4 million. Finally, consolidated Adjusted EBITDA for the six months ended December 31, 2020, was $141.6 million compared to consolidated Adjusted EBITDA of $69.8 million for the six months ended December 31, 2019, a 103% increase.

Chief Executive Officer Tim Danker commented, “Our Second Quarter results again demonstrated our strong growth potential, exceeding our internal expectations. The quarter was led by a strong AEP, where our Medicare Advantage approved policies grew by 132% year-over-year. We continue to show our differentiated model delivers superior financial results driven by a 32% increase in average agent productivity despite adding 70% more agents. We continue to excel in a fast-growing industry, and we’re pleased that our results continue to validate our strategy.”

Chief Financial Officer Raffaele Sadun added, “With Senior revenue growth of 127% year-over-year, this was the fourth consecutive quarter of Senior revenue growth in excess of 100%. This is especially impressive given all of our hiring, onboarding, training, and licensing was done virtually. We continue to deliver industry leading and stable LTVs, which demonstrates the soundness of our strategy. As a result of our strong results during AEP, we are raising our fiscal year 2021 guidance for the third time this year.”

*See reconciliation from non-GAAP measure, Adjusted EBITDA, to net income on pages 11-13


Segment Results

We currently report on three segments: 1) Senior, 2) Life and 3) Auto & Home. The performance measures of the segments include total revenue and Adjusted EBITDA. Costs of revenue, marketing and advertising, and technical development operating costs and expenses that are directly attributable to a segment are reported within the applicable segment. Indirect costs of revenue, marketing and advertising, and technical development operating costs and expenses are allocated to each segment based on varying metrics such as headcount. Adjusted EBITDA is calculated as total revenue for the applicable segment less direct and allocated costs of revenue, marketing and advertising, technical development, and general and administrative operating costs and expenses, excluding depreciation and amortization expense; gain or loss on disposal of property, equipment, and software; share-based compensation expense; restructuring expenses; and non-recurring expenses such as severance payments and transaction costs.

Senior

Financial Results

The following table provides the financial results for the Senior segment for the periods presented:

Three Months Ended December 31,Six Months Ended December 31,
(in thousands)20202019% Change20202019% Change
Revenue$315,510 $138,875 127 %$388,709 $166,458 134 %
Adjusted EBITDA*134,555 68,110 98 %143,457 66,170 117 %
Adjusted EBITDA Margin*43 %49 %37 %40 %


Operating Metrics

Submitted Policies

Submitted policies are counted when an individual completes an application with our licensed agent and provides authorization to them to submit it to the insurance carrier partner. The applicant may have additional actions to take before the application will be reviewed by the insurance carrier, such as providing additional information.

The following table shows the number of submitted policies for the periods presented:

Three Months Ended December 31,Six Months Ended December 31,
20202019% Change20202019% Change
Medicare Advantage246,548 108,223 128 %294,539 129,074 128 %
Medicare Supplement13,273 9,179 45 %20,549 12,680 62 %
Dental, Vision and Hearing43,020 23,946 80 %63,062 33,871 86 %
Prescription Drug Plan6,250 8,374 (25)%8,675 9,901 (12)%
Other3,939 1,021 286 %5,822 1,690 244 %
Total313,030 150,743 108 %392,647 187,216 110 %


*See reconciliation from non-GAAP measure, Adjusted EBITDA, to net income on pages 11-13
2


Approved Policies

Approved policies represents the number of submitted policies that were approved by our insurance carrier partners for the identified product during the indicated period. Not all approved policies will go in force.

The following table shows the number of approved policies for the periods presented:

Three Months Ended December 31,Six Months Ended December 31,
20202019% Change20202019% Change
Medicare Advantage208,714 89,920 132 %251,187 108,399 132 %
Medicare Supplement10,451 6,412 63 %16,776 9,038 86 %
Dental, Vision and Hearing33,614 15,630 115 %49,853 22,924 117 %
Prescription Drug Plan4,815 7,379 (35)%7,447 8,881 (16)%
Other3,256 779 318 %5,080 1,197 324 %
Total260,850 120,120 117 %330,343 150,439 120 %

Lifetime Value of Commissions per Approved Policy

Lifetime value of commissions per approved policy represents commissions estimated to be collected over the estimated life of an approved policy based on multiple factors, including but not limited to, contracted commission rates, carrier mix and expected policy persistency with applied constraints. The lifetime value of commissions per approved policy is equal to the sum of the commission revenue due upon the initial sale of a policy, and when applicable, an estimate of future renewal commissions.

The following table shows the lifetime value of commissions per approved policy for the periods presented:

Three Months Ended December 31,Six Months Ended December 31,
(dollars per policy):20202019% Change20202019% Change
Medicare Advantage$1,268 $1,268 %$1,251 $1,250 %
Medicare Supplement1,233 1,367 (10)%1,248 1,340 (7)%
Dental, Vision and Hearing138 140 (2)%148 140 %
Prescription Drug Plan232 226 %235 232 %
Other127 211 (40)%130 106 23 %

Per Unit Economics

Per unit economics represents total Medicare Advantage and Medicare Supplement commissions, other product commissions, other revenues, and costs associated with the Senior segment, each shown as per number of approved Medicare Advantage and Medicare Supplement approved policies over a given time period. Management assesses the business on a per unit basis to help ensure that the revenue opportunity associated with a successful policy sale is attractive relative to the marketing acquisition cost. Because not all acquired leads result in a successful policy sale, all per policy metrics are based on approved policies which is the measure that triggers revenue recognition.

The Medicare Advantage and Medicare Supplement commission per MA/MS policy represents the lifetime value of commissions for policies sold in the period. Other commission per MA/MS policy represents the lifetime value of commissions for other products sold in the period, including dental, vision and hearing, prescription drug plan, and other products, which management views as additional commission revenue on our agents’ core function of MA/MS policy sales. Other per MA/MS policy represents the production bonuses, lead sales revenue from InsideResponse, and updated estimates of prior period variable consideration based on actual policy renewals in the current period. Total operating expenses per MA/MS policy represent all of the operating expenses within the Senior segment. The Revenue to customer acquisition cost (“CAC”) multiple represents total revenue per MA/MS policy as a multiple of
3


total marketing acquisition cost, which represents the direct costs of acquiring leads which is included in marketing and advertising expense within the total operating expenses per MA/MS policy.

The following table shows per unit economics for the periods presented. Based on the seasonality of the Senior segment and the fluctuations between quarters, we believe that the most relevant view of per unit economics is on a rolling 12-month basis. All per MA/MS policy metrics below are based on the sum of approved MA/MS policies, as both products have similar commission profiles. These metrics are the basis on which management assesses the business:

Twelve Months Ended December 31,
(dollars per approved policy):20202019% Change
Medicare Advantage and Medicare Supplement approved policies394,032 170,043 132 %
Medicare Advantage and Medicare Supplement commission per MA / MS policy$1,276 $1,281 %
Other commission per MA/MS policy39 57 (32)%
Other per MA / MS policy168 141 19 %
Total revenue per MA / MS policy1,483 1,479 %
Total operating expenses per MA / MS policy(916)(837)%
Adjusted EBITDA per MA / MS policy*$567 $642 (12)%
Adjusted EBITDA Margin per MA / MS policy*38 %43 %
Revenue / CAC multiple3.2X4.1X

Life

Financial Results

The following table provides the financial results for the Life segment for the periods presented:

Three Months Ended December 31,Six Months Ended December 31,
(in thousands)20202019% Change20202019% Change
Revenue$36,375 $28,980 26 %$79,198 $56,587 40 %
Adjusted EBITDA*6,414 6,240 %16,891 12,059 40 %
Adjusted EBITDA Margin*18 %22 %21 %21 %

Operating Metrics

Life premium represents the total premium value for all policies that were approved by the relevant insurance carrier partner and for which the policy document was sent to the policyholder and payment information was received by the relevant insurance carrier partner during the indicated period. Core premiums include term life and permanent life insurance policies while ancillary premiums include various smaller products. Because our commissions are earned based on a percentage of total premium, total premium volume for a given period is the key driver of revenue for our Life segment.


*See reconciliation from non-GAAP measure, Adjusted EBITDA, to net income on pages 11-13
4


The following table shows core, final expense, and ancillary premiums for the periods presented:

Three Months Ended December 31,Six Months Ended December 31,
(in thousands)20202019% Change20202019% Change
Core Premiums$18,751 $19,469 (4)%$37,317 $37,849 (1)%
Final Expense Premiums11,263 3,424 229 %30,713 7,339 318 %
Ancillary Premiums505 750 (33)%1,162 1,251 (7)%

Auto & Home

Financial Results

The following table provides the financial results for the Auto & Home segment for the periods presented:

Three Months Ended December 31,Six Months Ended December 31,
(in thousands)20202019% Change20202019% Change
Revenue$7,241 $8,566 (15)%$16,779 $18,619 (10)%
Adjusted EBITDA*2,150 1,517 42 %5,767 4,007 44 %
Adjusted EBITDA Margin*30 %18 %34 %22 %
Operating Metrics

Auto & Home premium represents the total premium value of all new policies that were approved by our insurance carrier partners during the indicated period. Because our commissions are earned based on a percentage of total premium, total premium volume for a given period is the key driver of revenue for our Auto & Home segment.

The following table shows premiums for the periods presented:

Three Months Ended December 31,Six Months Ended December 31,
(in thousands):20202019% Change20202019% Change
Premiums$13,255 $14,716 (10)%$30,155 $32,002 (6)%

Update on Fiscal Year 2021 Guidance

SelectQuote is raising the guidance originally provided for the full-year ending June 30, 2021. As a reminder, these expectations are forward-looking statements and actual results may be materially different and are affected by the risk factors and uncertainties identified in this press release and in our annual and quarterly filings with the Securities and Exchange Commission.

SelectQuote is raising guidance for the full-year ending June 30, 2021 as follows:

Consolidated Revenue is expected to be in the range of $920 million to $940 million
Consolidated Net Income is expected to be in the range of $138 million to $146 million
Consolidated Adjusted EBITDA is expected to be in the range of $230 million to $240 million*


*See reconciliation from non-GAAP measure, Adjusted EBITDA, to net income on pages 11-13
5


Review of Financial Results

SelectQuote, Inc. will host a conference call with the investment community today, Monday, February 8, 2021, beginning at 5 p.m. ET. To register for this conference call, please use this link: http://www.directeventreg.com/registration/event/6593229. After registering, a confirmation will be sent via email, including dial in details and unique conference call codes for entry. Registration is open through the live call, but to ensure you are connected for the full call we suggest registering a day in advance or, at minimum, 10 minutes before the start of the call. The event will also be webcasted live via our investor relations website https://ir.selectquote.com/investor-home/default.aspx or via this link.

Non-GAAP Financial Measures

This release includes certain non-GAAP financial measures intended to supplement, not substitute for, comparable GAAP measures. To supplement our financial statements presented in accordance with GAAP and to provide investors with additional information regarding our GAAP financial results, we have presented in this release Adjusted EBITDA and Adjusted EBITDA Margin, which are non-GAAP financial measures. These non-GAAP financial measures are not based on any standardized methodology prescribed by GAAP and are not necessarily comparable to similarly titled measures presented by other companies. We define Adjusted EBITDA as income before interest expense, income tax expense, depreciation and amortization, and certain add-backs for non-cash or non-recurring expenses, including restructuring and share-based compensation expenses. The most directly comparable GAAP measure is net income. We monitor and have presented in this release Adjusted EBITDA because it is a key measure used by our management and Board of Directors to understand and evaluate our operating performance, to establish budgets and to develop operational goals for managing our business. In particular, we believe that excluding the impact of these expenses in calculating Adjusted EBITDA can provide a useful measure for period-to-period comparisons of our core operating performance.

We believe that this non-GAAP financial measure helps identify underlying trends in our business that could otherwise be masked by the effect of the expenses that we exclude in the calculations of this non-GAAP financial measure. Accordingly, we believe that this financial measure provides useful information to investors and others in understanding and evaluating our operating results, enhancing the overall understanding of our past performance and future prospects.

Forward Looking Statement

This release contains forward-looking statements. These forward-looking statements reflect our current views with respect to, among other things, future events and our financial performance. These statements are often, but not always, made through the use of words or phrases such as “may,” “should,” “could,” “predict,” “potential,” “believe,” “will likely result,” “expect,” “continue,” “will,” “anticipate,” “seek,” “estimate,” “intend,” “plan,” “projection,” “would” and “outlook,” or the negative version of those words or other comparable words or phrases of a future or forward-looking nature. These forward-looking statements are not historical facts, and are based on current expectations, estimates and projections about our industry, management’s beliefs and certain assumptions made by management, many of which, by their nature, are inherently uncertain and beyond our control. Accordingly, we caution you that any such forward-looking statements are not guarantees of future performance and are subject to risks, assumptions and uncertainties that are difficult to predict. Although we believe that the expectations reflected in these forward-looking statements are reasonable as of the date made, actual results may prove to be materially different from the results expressed or implied by the forward-looking statements.
 
There are or will be important factors that could cause our actual results to differ materially from those indicated in these forward-looking statements, including, but not limited to, the following: the ultimate duration and impact of the ongoing COVID-19 pandemic, our reliance on a limited number of insurance carrier partners and any potential termination of those relationships or failure to develop new relationships; existing and future laws and regulations affecting the health insurance market; changes in health insurance products offered by our insurance carrier partners and the health insurance market generally; insurance carriers offering products and services directly to consumers; changes to commissions paid by insurance carriers and underwriting practices; competition with brokers, exclusively online brokers and carriers who opt to sell policies directly to consumers; competition from government-run health insurance exchanges; developments in the U.S. health insurance system; our dependence on revenue from carriers in our senior segment and downturns in the senior health as well as life, automotive and home
6


insurance industries; our ability to develop new offerings and penetrate new vertical markets; risks from third-party products; failure to enroll individuals during the Medicare annual enrollment period; our ability to attract, integrate and retain qualified personnel; our dependence on lead providers and ability to compete for leads; failure to obtain and/or convert sales leads to actual sales of insurance policies; access to data from consumers and insurance carriers; accuracy of information provided from and to consumers during the insurance shopping process; cost-effective advertisement through internet search engines; ability to contact consumers and market products by telephone; global economic conditions; disruption to operations as a result of future acquisitions; significant estimates and assumptions in the preparation of our financial statements; impairment of goodwill; potential litigation and claims, including IP litigation; our existing and future indebtedness; developments with respect to LIBOR; access to additional capital; failure to protect our intellectual property and our brand; fluctuations in our financial results caused by seasonality; accuracy and timeliness of commissions reports from insurance carriers; timing of insurance carriers’ approval and payment practices; factors that impact our estimate of the constrained lifetime value of commissions per policyholder; changes in accounting rules, tax legislation and other legislation; disruptions or failures of our technological infrastructure and platform; failure to maintain relationships with third-party service providers; cybersecurity breaches or other attacks involving our systems or those of our insurance carrier partners or third-party service providers; our ability to protect consumer information and other data; and failure to market and sell Medicare plans effectively or in compliance with laws. For a further discussion of these and other risk factors that could impact our future results and performance, see the section entitled “Risk Factors” in the most recent Annual Report on Form 10-K (the “Annual Report”) filed by us with the Securities Exchange Commission. Accordingly, you should not place undue reliance on any such forward-looking statements. Any forward-looking statement speaks only as of the date on which it is made, and, except as otherwise required by law, we do not undertake any obligation to publicly update or review any forward-looking statement, whether as a result of new information, future developments or otherwise.

About SelectQuote:

Founded in 1985, SelectQuote (NYSE: SLQT) provides solutions that help consumers protect their most valuable assets: their families, health and property. The company pioneered the direct-to-consumer model of providing unbiased comparisons from multiple, highly-rated insurance companies allowing consumers to choose the policy and terms that best meet their unique needs. Two foundational pillars underpin SelectQuote’s success: a strong force of highly-trained and skilled agents who provide a consultative needs analysis for every consumer, and proprietary technology that sources, scores, and routes high-quality sales leads. The company has three core business lines: SelectQuote Senior, SelectQuote Life and SelectQuote Auto and Home. SelectQuote Senior, the largest and fastest-growing business, serves the needs of a demographic that sees 10,000 people turn 65 each day with a range of Medicare Advantage and Medicare Supplement plans from leading, nationally-recognized carriers, as well as prescription drug plans, dental, vision and hearing plans.

Investor Relations:
Sloan Bohlen
877-678-4083
[email protected]

Media:
Matt Gunter
913-286-4931
[email protected]

Kelly Hale
913-653-4375
[email protected]

Source: SelectQuote, Inc.

7


SELECTQUOTE, INC. AND SUBSIDIARIES
CONDENSED CONSOLIDATED BALANCE SHEETS
(Unaudited)
(In thousands)
December 31, 2020June 30, 2020
ASSETS
CURRENT ASSETS:
Cash and cash equivalents$209,739 $321,065 
Restricted cash36,168 47,805 
Accounts receivable146,989 83,634 
Commissions receivable-current76,265 51,209 
Other current assets7,383 10,121 
Total current assets476,544 513,834 
COMMISSIONS RECEIVABLE—Net655,828 461,752 
PROPERTY AND EQUIPMENT—Net24,512 22,150 
SOFTWARE—Net10,085 8,399 
OPERATING LEASE RIGHT-OF-USE ASSETS29,182 — 
INTANGIBLE ASSETS—NET18,015 19,673 
GOODWILL46,456 46,577 
OTHER ASSETS1,427 1,408 
TOTAL ASSETS$1,262,049 $1,073,793 
LIABILITIES AND SHAREHOLDERS’ EQUITY
CURRENT LIABILITIES:
Accounts payable$32,420 $22,891 
Accrued expenses15,535 14,936 
Accrued compensation and benefits35,067 22,228 
Earnout liability31,966 30,812 
Operating lease liabilities—current5,093 — 
Other current liabilities20,938 4,944 
Total current liabilities141,019 95,811 
DEBT313,336 311,814 
DEFERRED INCOME TAXES131,121 105,844 
OPERATING LEASE LIABILITIES36,958 — 
OTHER LIABILITIES5,480 14,635 
Total liabilities627,914 528,104 
COMMITMENTS AND CONTINGENCIES
SHAREHOLDERS’ EQUITY:
Common stock, $.01 par value
1,628 1,622 
Additional paid-in capital545,441 548,113 
Retained earnings (accumulated deficit)88,461 (2,792)
Accumulated other comprehensive loss(1,395)(1,254)
Total shareholders’ equity634,135 545,689 
TOTAL LIABILITIES AND SHAREHOLDERS’ EQUITY$1,262,049 $1,073,793 
8


SELECTQUOTE, INC. AND SUBSIDIARIES
CONDENSED CONSOLIDATED STATEMENTS OF COMPREHENSIVE INCOME
(Unaudited)
(In thousands)

Three Months Ended December 31,Six Months Ended December 31,
2020201920202019
REVENUE:
Commission
$320,974 $158,650 $427,519 $216,472 
Production bonus and other
37,300 17,647 54,924 24,992 
Total revenue
358,274 176,297 482,443 241,464 
OPERATING COSTS AND EXPENSES:
Cost of revenue
84,121 50,484 135,166 83,121 
Marketing and advertising
132,206 50,871 182,006 76,972 
General and administrative
13,043 13,997 25,245 19,123 
Technical development
4,750 3,510 8,598 6,223 
Total operating costs and expenses
234,120 118,862 351,015 185,439 
INCOME FROM OPERATIONS124,154 57,435 131,428 56,025 
INTEREST EXPENSE, NET(6,782)(6,178)(13,543)(6,883)
OTHER EXPENSES, NET(416)(3)(1,196)(16)
INCOME BEFORE INCOME TAX EXPENSE116,956 51,254 116,689 49,126 
INCOME TAX EXPENSE26,540 12,184 25,436 11,744 
NET INCOME$90,416 $39,070 $91,253 $37,382 
NET INCOME (LOSS) PER SHARE:
Basic$0.56 $(0.56)$0.56 $(0.62)
Diluted$0.55 $(0.56)$0.55 $(0.62)
WEIGHTED-AVERAGE COMMON STOCK OUTSTANDING USED IN PER SHARE AMOUNTS:
Basic162,645 90,374 162,546 88,945 
Diluted165,563 90,374 165,377 88,945 
OTHER COMPREHENSIVE GAIN (LOSS) NET OF TAX:
Gain (loss) on cash flow hedge116 — (141)— 
OTHER COMPREHENSIVE GAIN (LOSS)116 — (141)— 
COMPREHENSIVE INCOME$90,532 $39,070 $91,112 $37,382 
9


SELECTQUOTE, INC. AND SUBSIDIARIES
CONDENSED CONSOLIDATED STATEMENTS OF CASH FLOWS
(Unaudited)
(In thousands)
Six Months Ended December 31,
20202019
CASH FLOWS FROM OPERATING ACTIVITIES:
Net income$91,253 $37,382 
Adjustments to reconcile net income to net cash, cash equivalents, and restricted cash used in operating activities:
Depreciation and amortization6,937 3,168 
Loss (gain) on disposal of property, equipment, and software162 (2)
Share-based compensation expense2,259 9,263 
Deferred income taxes25,321 11,759 
Amortization of debt issuance costs and debt discount1,644 592 
Fair value adjustments to contingent earnout obligations1,153 — 
Non-cash lease expense1,887 — 
Changes in operating assets and liabilities:
Accounts receivable(63,355)(13,050)
Commissions receivable(219,132)(110,792)
Other assets1,906 856 
Accounts payable and accrued expenses15,692 4,985 
Operating lease liabilities(1,245)— 
Other liabilities32,371 5,237 
Net cash used in operating activities(103,147)(50,602)
CASH FLOWS FROM INVESTING ACTIVITIES:
Purchases of property and equipment(5,768)(5,499)
Proceeds from sales of property and equipment— 
Purchases of software and capitalized software development costs(3,449)(2,434)
Acquisition of business121 — 
Net cash used in investing activities(9,096)(7,930)
CASH FLOWS FROM FINANCING ACTIVITIES:
Proceeds from revolving line of credit— 83,602 
Payments on revolving line of credit— (91,778)
Net proceeds from Term Loan— 416,500 
Proceeds from other debt— 8,425 
Payments on other debt(108)(1,440)
Proceeds from common stock option exercises391 4,819 
Cash dividends paid— (275,000)
Payments of tax withholdings related to net share settlement of equity awards(5,320)— 
Payments of debt issuance costs— (7,694)
Payments of costs incurred in connection with private placement(1,771)— 
Payments of costs incurred in connection with initial public offering(3,911)(1,603)
Net cash (used in) provided by financing activities(10,719)135,831 
NET (DECREASE) INCREASE IN CASH, CASH EQUIVALENTS, AND RESTRICTED CASH(122,962)77,299 
CASH, CASH EQUIVALENTS, AND RESTRICTED CASH—Beginning of period368,869 570 
CASH, CASH EQUIVALENTS, AND RESTRICTED CASH—End of period$245,907 $77,869 
10


SELECTQUOTE, INC. AND SUBSIDIARIES
Adjusted EBITDA to Net Income Reconciliation
(Unaudited)

Three Months Ended December 31, 2020
(in thousands)SeniorLifeAuto & HomeCorp & ElimsConsolidated
Revenue$315,510 $36,375 $7,241 $(852)$358,274 
Operating expenses(180,955)(29,961)(5,091)(12,746)(228,753)
Other expenses, net— — — (21)(21)
Adjusted EBITDA134,555 6,414 2,150 (13,619)129,500 
Share-based compensation expense(1,336)
Non-recurring expenses(362)
Fair value adjustments to contingent earnout obligations(395)
Depreciation and amortization(3,590)
Loss on disposal of property, equipment, and software(79)
Interest expense, net(6,782)
Income tax expense(26,540)
Net income$90,416 

Three Months Ended December 31, 2019
(in thousands)SeniorLifeAuto & HomeCorp & ElimsConsolidated
Revenue$138,875 $28,980 $8,566 $(124)$176,297 
Operating expenses(70,765)(22,740)(7,049)(6,775)(107,329)
Other expenses, net— — — (3)(3)
Adjusted EBITDA68,110 6,240 1,517 (6,902)68,965 
Share-based compensation expense(9,241)
Non-recurring expenses(564)
Depreciation and amortization(1,728)
Interest expense, net(6,178)
Income tax expense(12,184)
Net income$39,070 


11


SELECTQUOTE, INC. AND SUBSIDIARIES
Adjusted EBITDA to Net Income Reconciliation
(Unaudited)

Six Months Ended December 31, 2020
(in thousands)SeniorLifeAuto & HomeCorp & ElimsConsolidated
Revenue$388,709 $79,198 $16,779 $(2,243)$482,443 
Operating expenses(245,252)(62,307)(11,012)(22,264)(340,835)
Other expenses, net— — — (43)(43)
Adjusted EBITDA143,457 16,891 5,767 (24,550)141,565 
Share-based compensation expense(2,259)
Non-recurring expenses (822)
Fair value adjustments to contingent earnout obligations(1,153)
Depreciation and amortization(6,937)
Loss on disposal of property, equipment, and software(162)
Interest expense, net(13,543)
Income tax expense(25,436)
Net income$91,253 

Six Months Ended December 31, 2019
(in thousands)SeniorLifeAuto & HomeCorp & ElimsConsolidated
Revenue$166,458 $56,587 $18,619 $(200)$241,464 
Operating expenses(100,288)(44,528)(14,612)(12,188)(171,616)
Other expenses, net— — — (16)(16)
Adjusted EBITDA$66,170 $12,059 $4,007 $(12,404)69,832 
Share-based compensation expense(9,263)
Non-recurring expenses(1,394)
Depreciation and amortization(3,168)
Gain on disposal of property, equipment, and software
Interest expense, net(6,883)
Income tax expense(11,744)
Net Income$37,382 
12


SELECTQUOTE, INC. AND SUBSIDIARIES
Adjusted EBITDA to Net Income Reconciliation
(Unaudited)


Guidance net income to Adjusted EBITDA reconciliation, year ending June 30, 2021:

(in thousands)Range
Net Income$138,000 $146,000 
Income tax expense42,000 44,000 
Interest expense, net28,000 28,000 
Depreciation and amortization14,000 14,000 
Fair value adjustments to contingent earnout obligations1,000 1,000 
Non-recurring expenses2,000 2,000 
Share-based compensation expense5,000 5,000 
Adjusted EBITDA$230,000 $240,000 
13
2nd Quarter and Fiscal Year to Date 2021 Earnings Conference Call Presentation February 8, 2021 Exhibit 99.2

 
2 Forward-Looking Statements This presentation contains forward-looking statements. These forward-looking statements reflect our current views with respect to, among other things, future events and our financial performance. These statements are often, but not always, made through the use of words or phrases such as “may,” “should,” “could,” “predict,” “potential,” “believe,” “will likely result,” “expect,” “continue,” “will,” “anticipate,” “seek,” “estimate,” “intend,” “plan,” “projection,” “would” and “outlook,” or the negative version of those words or other comparable words or phrases of a future or forward-looking nature. These forward-looking statements are not historical facts, and are based on current expectations, estimates and projections about our industry, management’s beliefs and certain assumptions made by management, many of which, by their nature, are inherently uncertain and beyond our control. Accordingly, we caution you that any such forward-looking statements are not guarantees of future performance and are subject to risks, assumptions and uncertainties that are difficult to predict. Although we believe that the expectations reflected in these forward-looking statements are reasonable as of the date made, actual results may prove to be materially different from the results expressed or implied by the forward-looking statements. There are or will be important factors that could cause our actual results to differ materially from those indicated in these forward-looking statements, including, but not limited to, the following: the ultimate duration and impact of the ongoing COVID-19 pandemic, our reliance on a limited number of insurance carrier partners and any potential termination of those relationships or failure to develop new relationships; existing and future laws and regulations affecting the health insurance market; changes in health insurance products offered by our insurance carrier partners and the health insurance market generally; insurance carriers offering products and services directly to consumers; changes to commissions paid by insurance carriers and underwriting practices; competition with brokers, exclusively online brokers and carriers who opt to sell policies directly to consumers; competition from government-run health insurance exchanges; developments in the U.S. health insurance system; our dependence on revenue from carriers in our senior segment and downturns in the senior health as well as life, automotive and home insurance industries; our ability to develop new offerings and penetrate new vertical markets; risks from third-party products; failure to enroll individuals during the Medicare annual enrollment period; our ability to attract, integrate and retain qualified personnel; our dependence on lead providers and ability to compete for leads; failure to obtain and/or convert sales leads to actual sales of insurance policies; access to data from consumers and insurance carriers; accuracy of information provided from and to consumers during the insurance shopping process; cost-effective advertisement through internet search engines; ability to contact consumers and market products by telephone; global economic conditions; disruption to operations as a result of future acquisitions; significant estimates and assumptions in the preparation of our financial statements; impairment of goodwill; potential litigation and claims, including IP litigation; our existing and future indebtedness; developments with respect to LIBOR; access to additional capital; failure to protect our intellectual property and our brand; fluctuations in our financial results caused by seasonality; accuracy and timeliness of commissions reports from insurance carriers; timing of insurance carriers’ approval and payment practices; factors that impact our estimate of the constrained lifetime value of commissions per policyholder; changes in accounting rules, tax legislation and other legislation; disruptions or failures of our technological infrastructure and platform; failure to maintain relationships with third-party service providers; cybersecurity breaches or other attacks involving our systems or those of our insurance carrier partners or third-party service providers; our ability to protect consumer information and other data; and failure to market and sell Medicare plans effectively or in compliance with laws. For a further discussion of these and other risk factors that could impact our future results and performance, see the section entitled “Risk Factors” in the most recent Annual Report on Form 10-K (the “Annual Report”) filed by us with the Securities Exchange Commission. Accordingly, you should not place undue reliance on any such forward-looking statements. Any forward-looking statement speaks only as of the date on which it is made, and, except as otherwise required by law, we do not undertake any obligation to publicly update or review any forward-looking statement, whether as a result of new information, future developments or otherwise. Certain information contained in this presentation and statements made orally during this presentation relates to or are based on publications and other data obtained from third-party sources. While we believe these third-party sources to be reliable as of the date of this presentation, we have not independently verified, and make no representation as to the adequacy, fairness, accuracy or completeness of, any information obtained from such third-party sources. No Offer or Solicitation; Further Information This presentation is for informational purposes only and is not an offer to sell with respect to any securities. This presentation should be read together with “Management’s Discussion and Analysis of Financial Condition and Results of Operations” and the consolidated financial statements and the related notes thereto included in the Annual Report and subsequent quarterly reports.. Non-GAAP Financial Measures This presentation includes certain non-GAAP financial measures intended to supplement, not substitute for, comparable GAAP measures. To supplement our financial statements presented in accordance with GAAP and to provide investors with additional information regarding our GAAP financial results, we have presented in this presentation Adjusted EBITDA and Adjusted EBITDA Margin, which are non-GAAP financial measures. These non-GAAP financial measures are not based on any standardized methodology prescribed by GAAP and are not necessarily comparable to similarly titled measures presented by other companies. We define Adjusted EBITDA as income before interest expense, income tax expense, depreciation and amortization, and certain add-backs for non-cash or non-recurring expenses, including restructuring and share-based compensation expenses. The most directly comparable GAAP measure is net income. We monitor and have presented in this presentation Adjusted EBITDA because it is a key measure used by our management and Board of Directors to understand and evaluate our operating performance, to establish budgets and to develop operational goals for managing our business. In particular, we believe that excluding the impact of these expenses in calculating Adjusted EBITDA can provide a useful measure for period-to-period comparisons of our core operating performance. For further discussion regarding this non-GAAP measure, please see today’s press release. Disclaimer
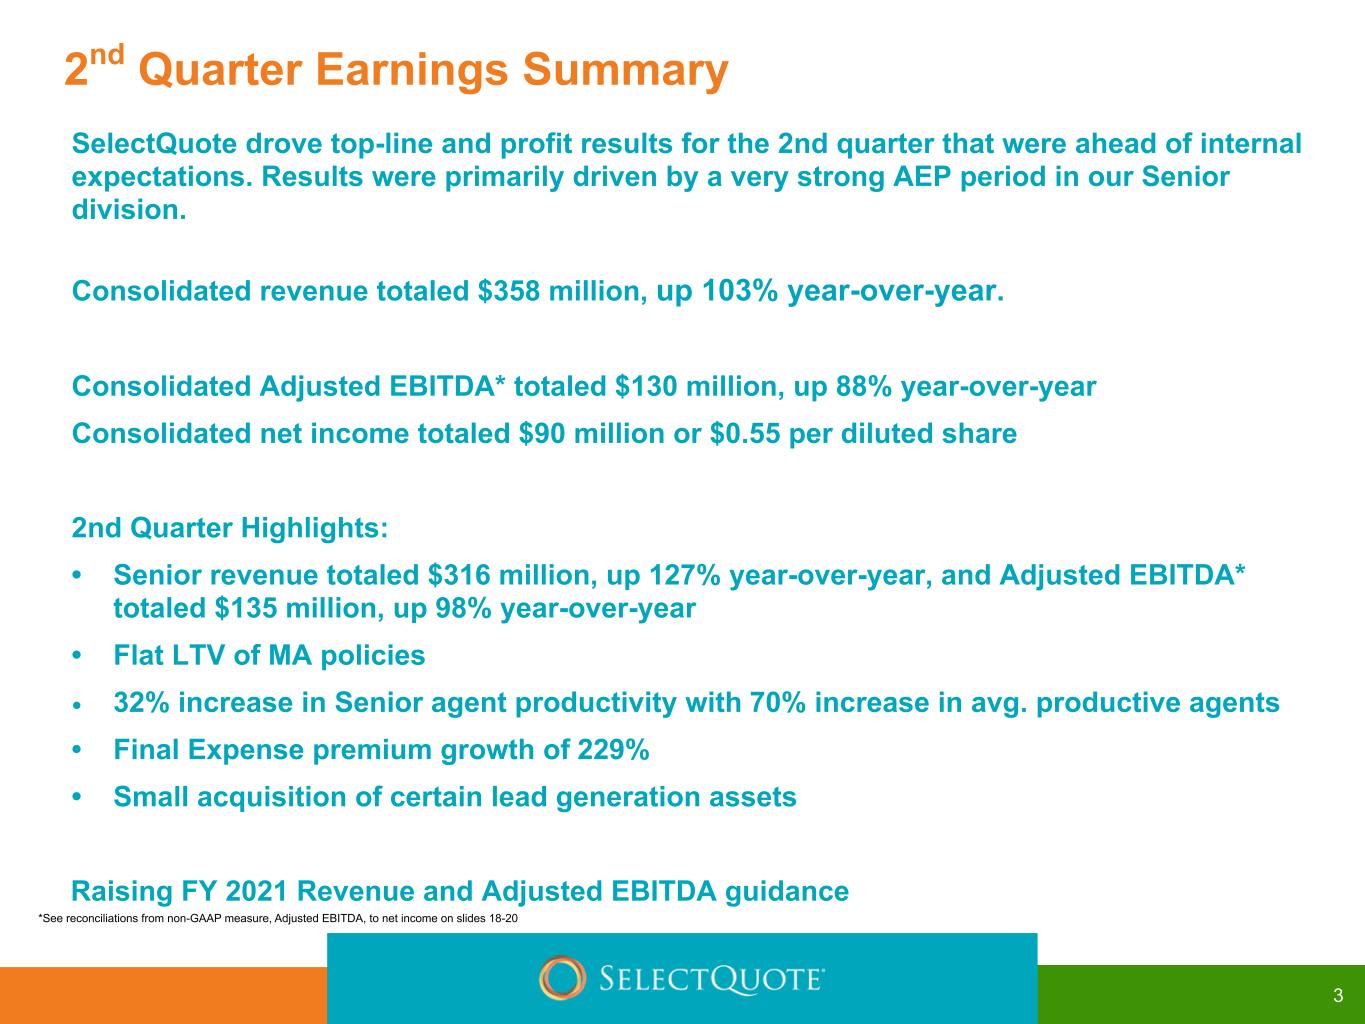

 
SelectQuote drove top-line and profit results for the 2nd quarter that were ahead of internal expectations. Results were primarily driven by a very strong AEP period in our Senior division. Consolidated revenue totaled $358 million, up 103% year-over-year. Consolidated Adjusted EBITDA* totaled $130 million, up 88% year-over-year Consolidated net income totaled $90 million or $0.55 per diluted share 2nd Quarter Highlights: • Senior revenue totaled $316 million, up 127% year-over-year, and Adjusted EBITDA* totaled $135 million, up 98% year-over-year • Flat LTV of MA policies • 32% increase in Senior agent productivity with 70% increase in avg. productive agents • Final Expense premium growth of 229% • Small acquisition of certain lead generation assets Raising FY 2021 Revenue and Adjusted EBITDA guidance 2nd Quarter Earnings Summary 3 *See reconciliations from non-GAAP measure, Adjusted EBITDA, to net income on slides 18-20
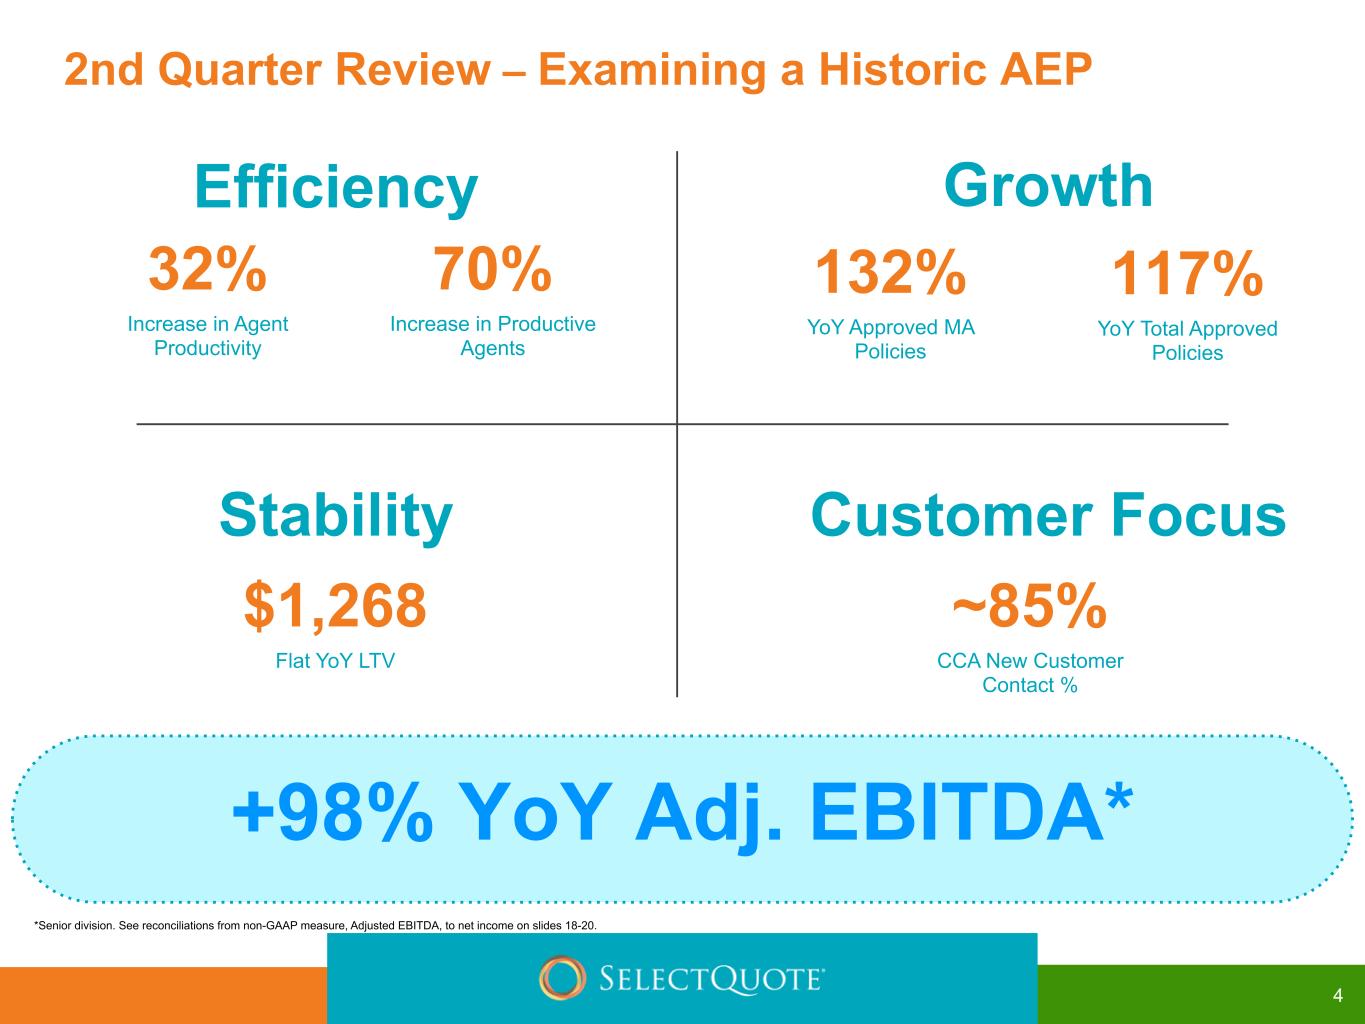

 
4 2nd Quarter Review – Examining a Historic AEP Growth 132% YoY Approved MA Policies 117% YoY Total Approved Policies Efficiency 70% Increase in Productive Agents 32% Increase in Agent Productivity Stability $1,268 Flat YoY LTV Customer Focus ~85% CCA New Customer Contact % +98% YoY Adj. EBITDA* *Senior division. See reconciliations from non-GAAP measure, Adjusted EBITDA, to net income on slides 18-20.
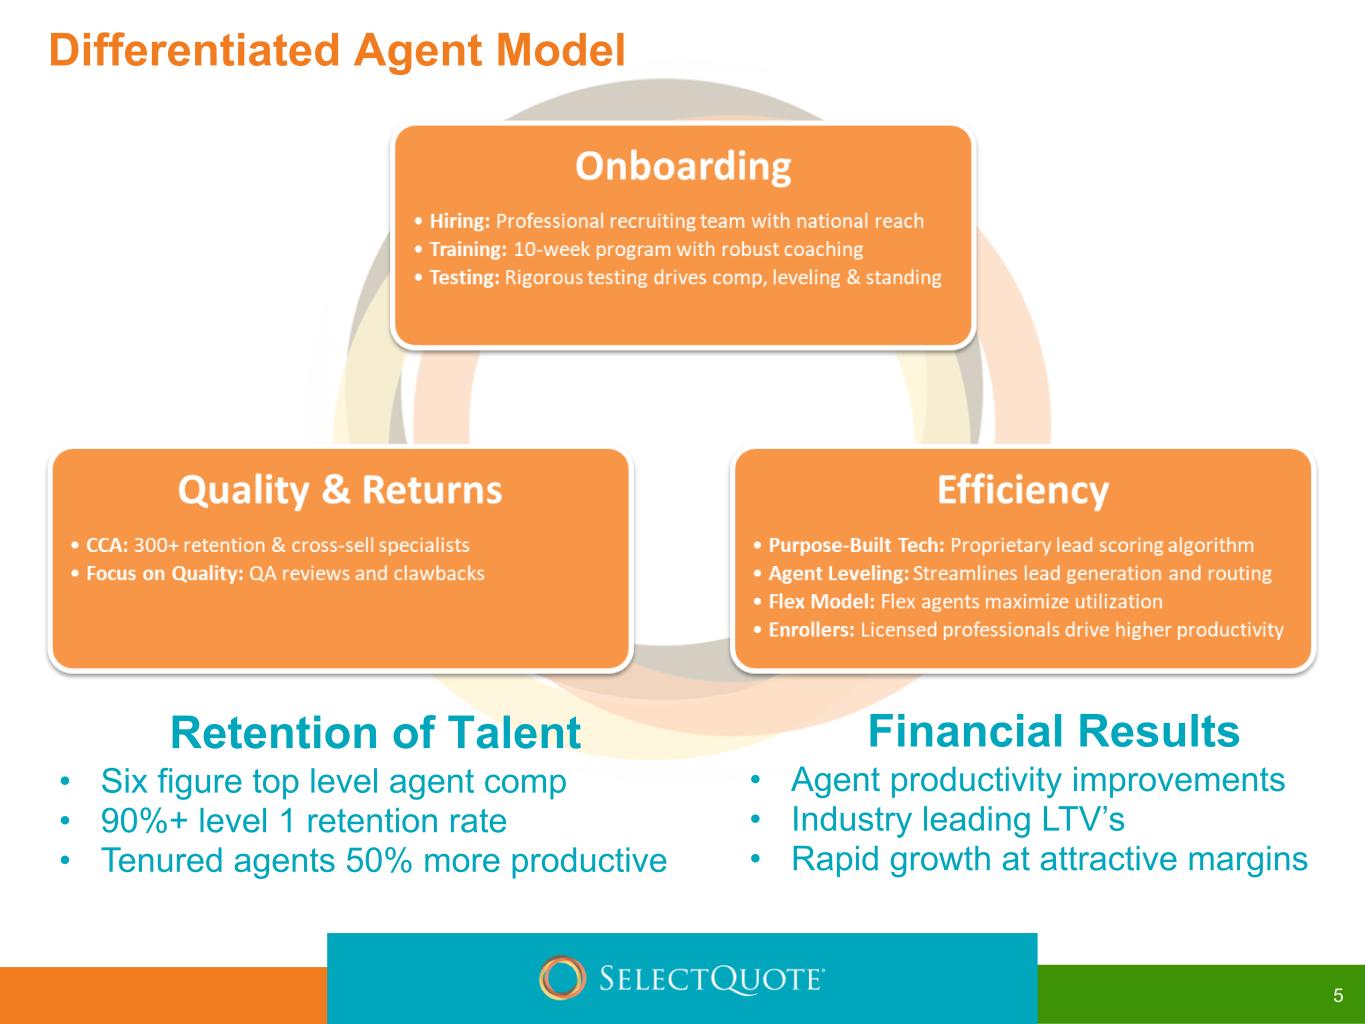

 
Differentiated Agent Model Retention of Talent • Six figure top level agent comp • 90%+ level 1 retention rate • Tenured agents 50% more productive Financial Results • Agent productivity improvements • Industry leading LTV’s • Rapid growth at attractive margins 5
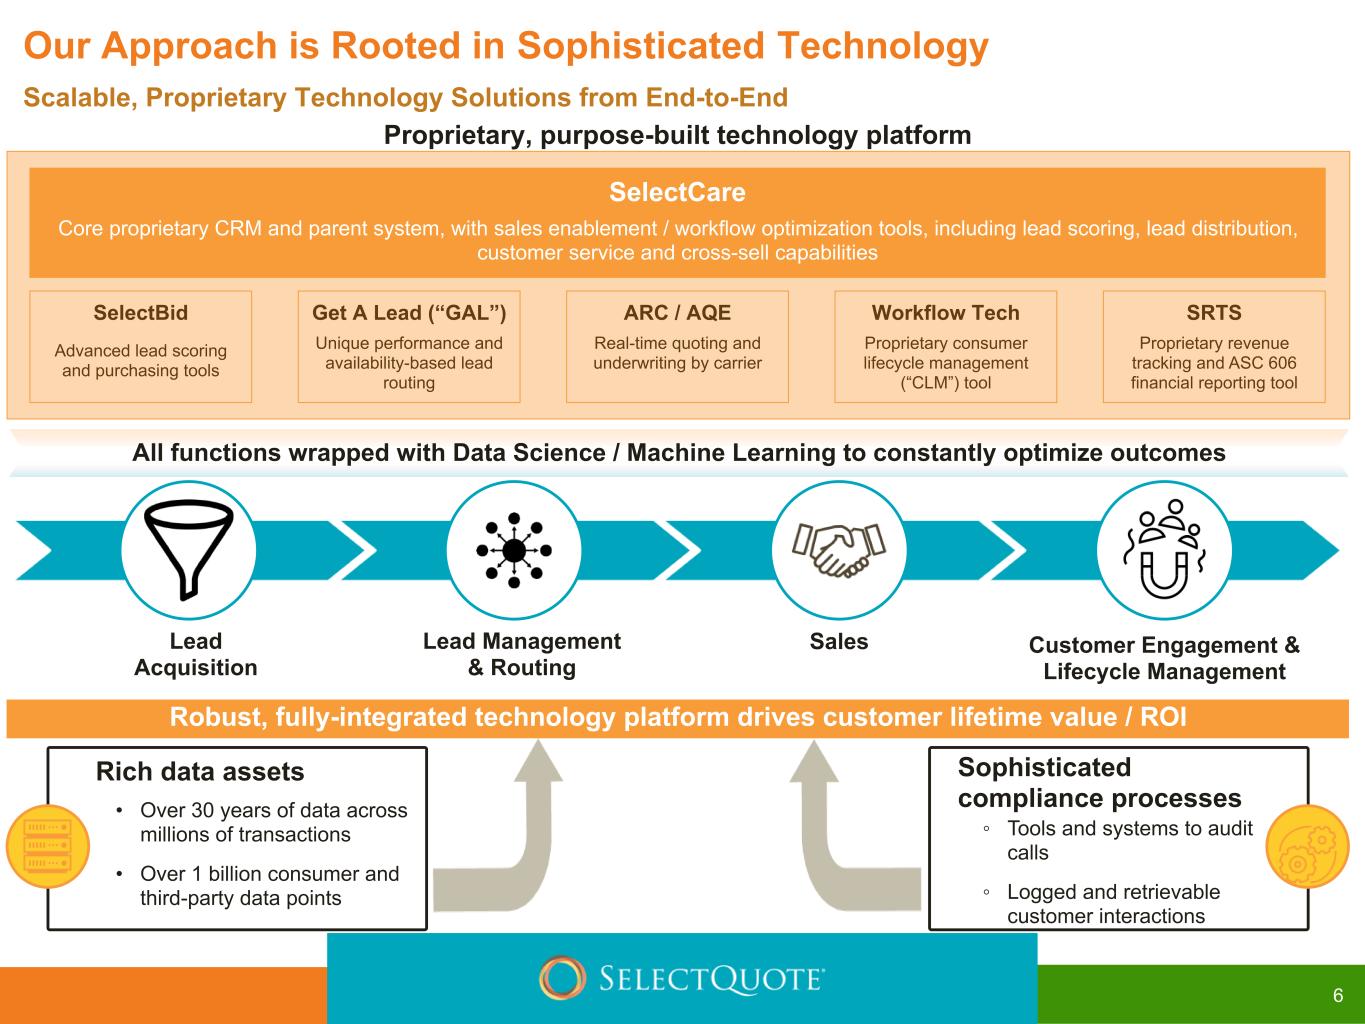

 
Our Approach is Rooted in Sophisticated Technology Robust, fully-integrated technology platform drives customer lifetime value / ROI Lead Acquisition Lead Management & Routing Sales Customer Engagement & Lifecycle Management SelectCare Core proprietary CRM and parent system, with sales enablement / workflow optimization tools, including lead scoring, lead distribution, customer service and cross-sell capabilities All functions wrapped with Data Science / Machine Learning to constantly optimize outcomes Proprietary, purpose-built technology platform SelectBid Advanced lead scoring and purchasing tools Get A Lead (“GAL”) Unique performance and availability-based lead routing Workflow Tech Proprietary consumer lifecycle management (“CLM”) tool ARC / AQE Real-time quoting and underwriting by carrier SRTS Proprietary revenue tracking and ASC 606 financial reporting tool Sophisticated compliance processes ◦ Tools and systems to audit calls ◦ Logged and retrievable customer interactions Rich data assets • Over 30 years of data across millions of transactions • Over 1 billion consumer and third-party data points Scalable, Proprietary Technology Solutions from End-to-End 6
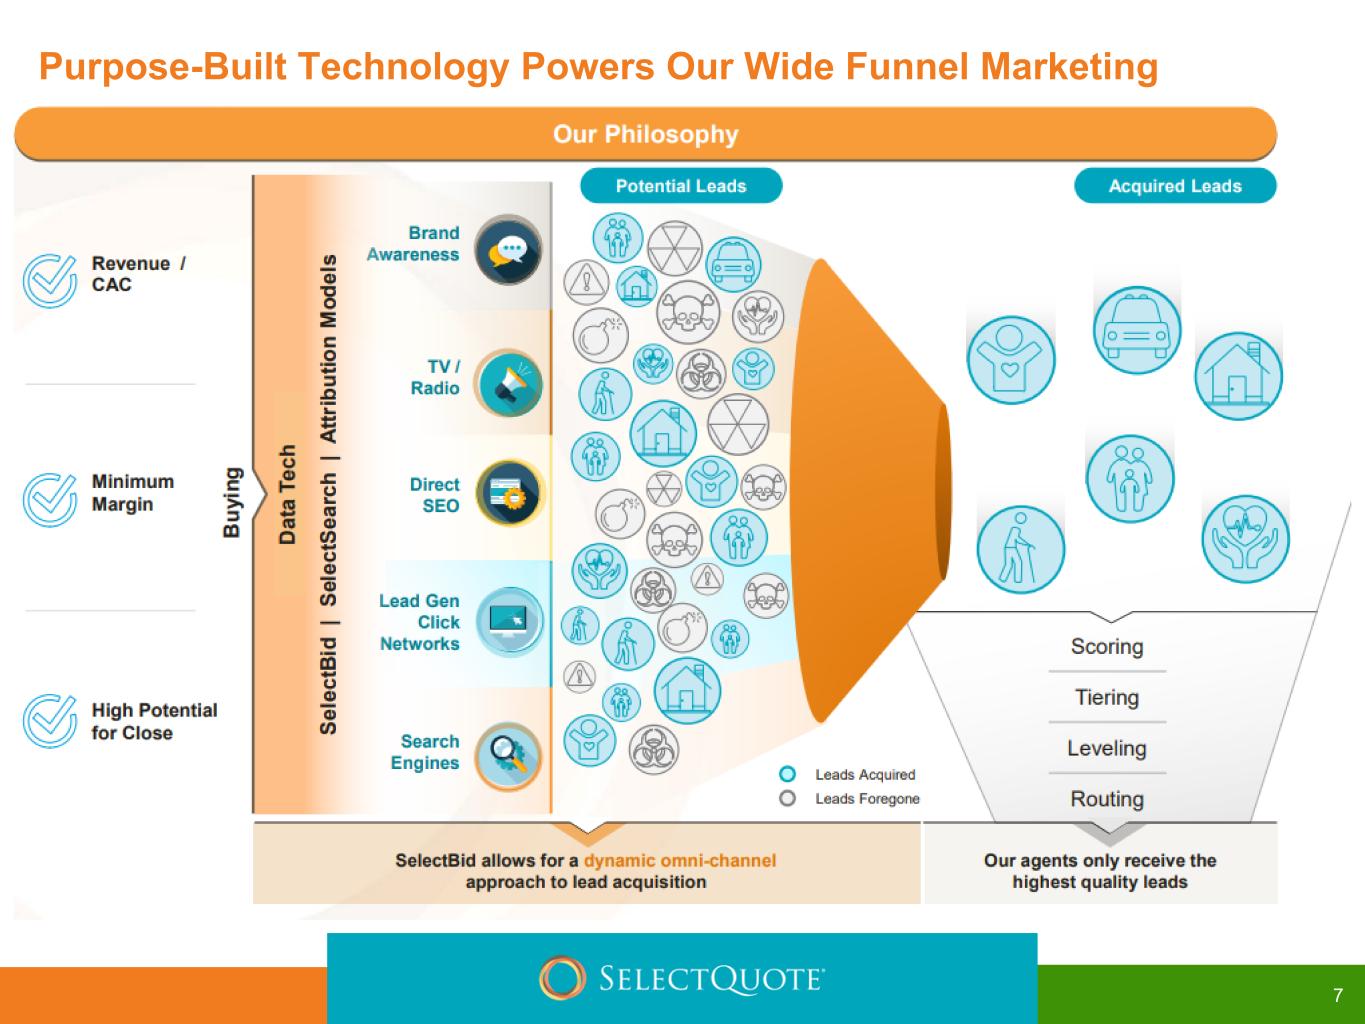

 
Purpose-Built Technology Powers Our Wide Funnel Marketing 7
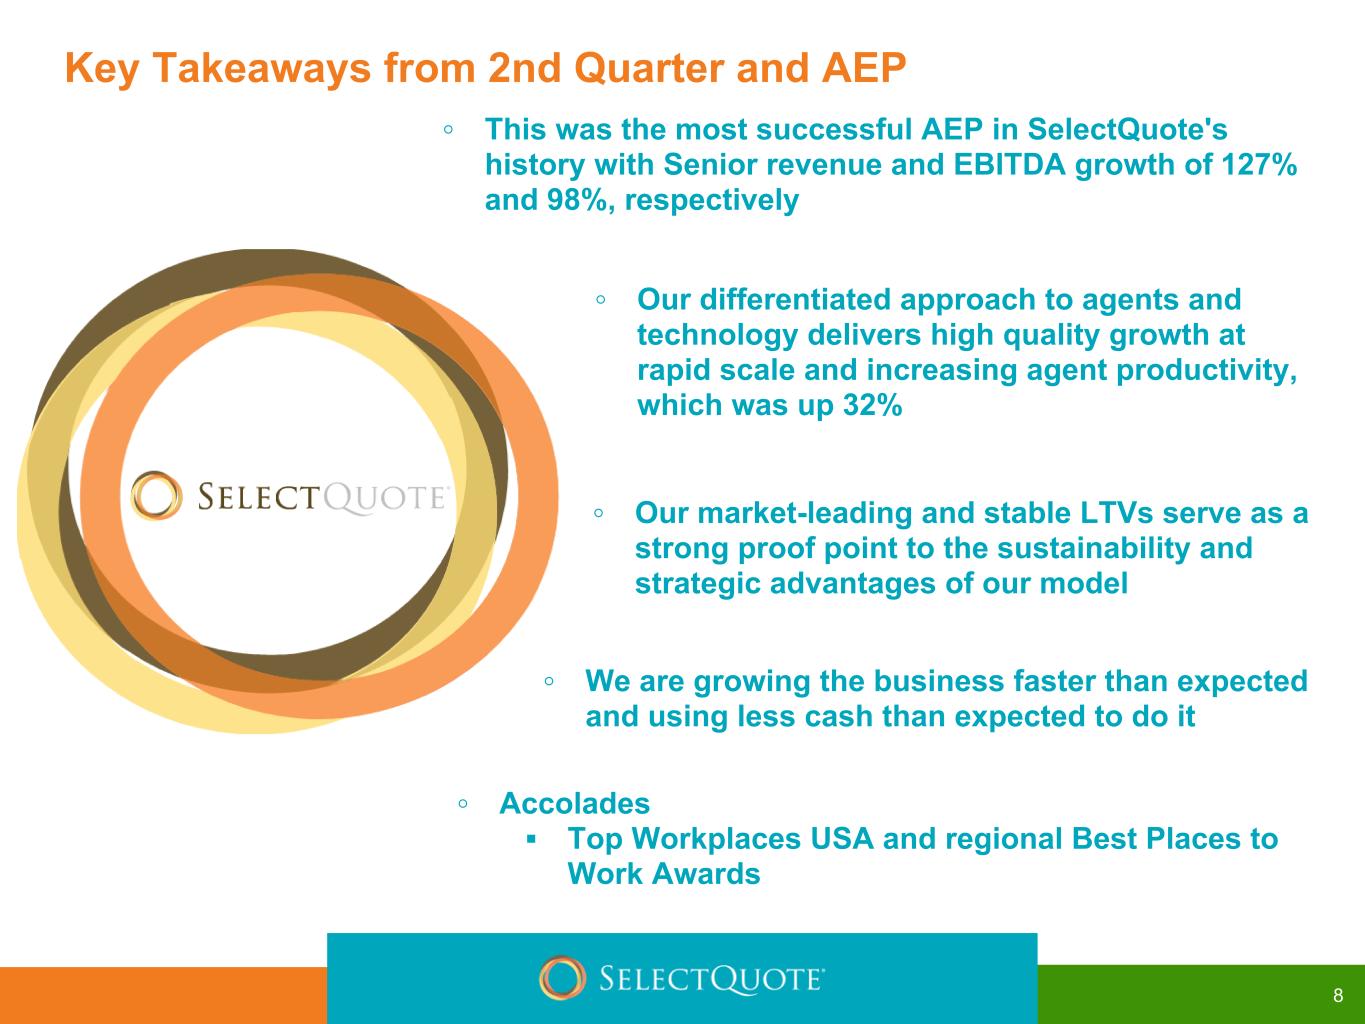

 
◦ Our market-leading and stable LTVs serve as a strong proof point to the sustainability and strategic advantages of our model ◦ Our differentiated approach to agents and technology delivers high quality growth at rapid scale and increasing agent productivity, which was up 32% Key Takeaways from 2nd Quarter and AEP 8 ◦ This was the most successful AEP in SelectQuote's history with Senior revenue and EBITDA growth of 127% and 98%, respectively ◦ We are growing the business faster than expected and using less cash than expected to do it ◦ Accolades ▪ Top Workplaces USA and regional Best Places to Work Awards
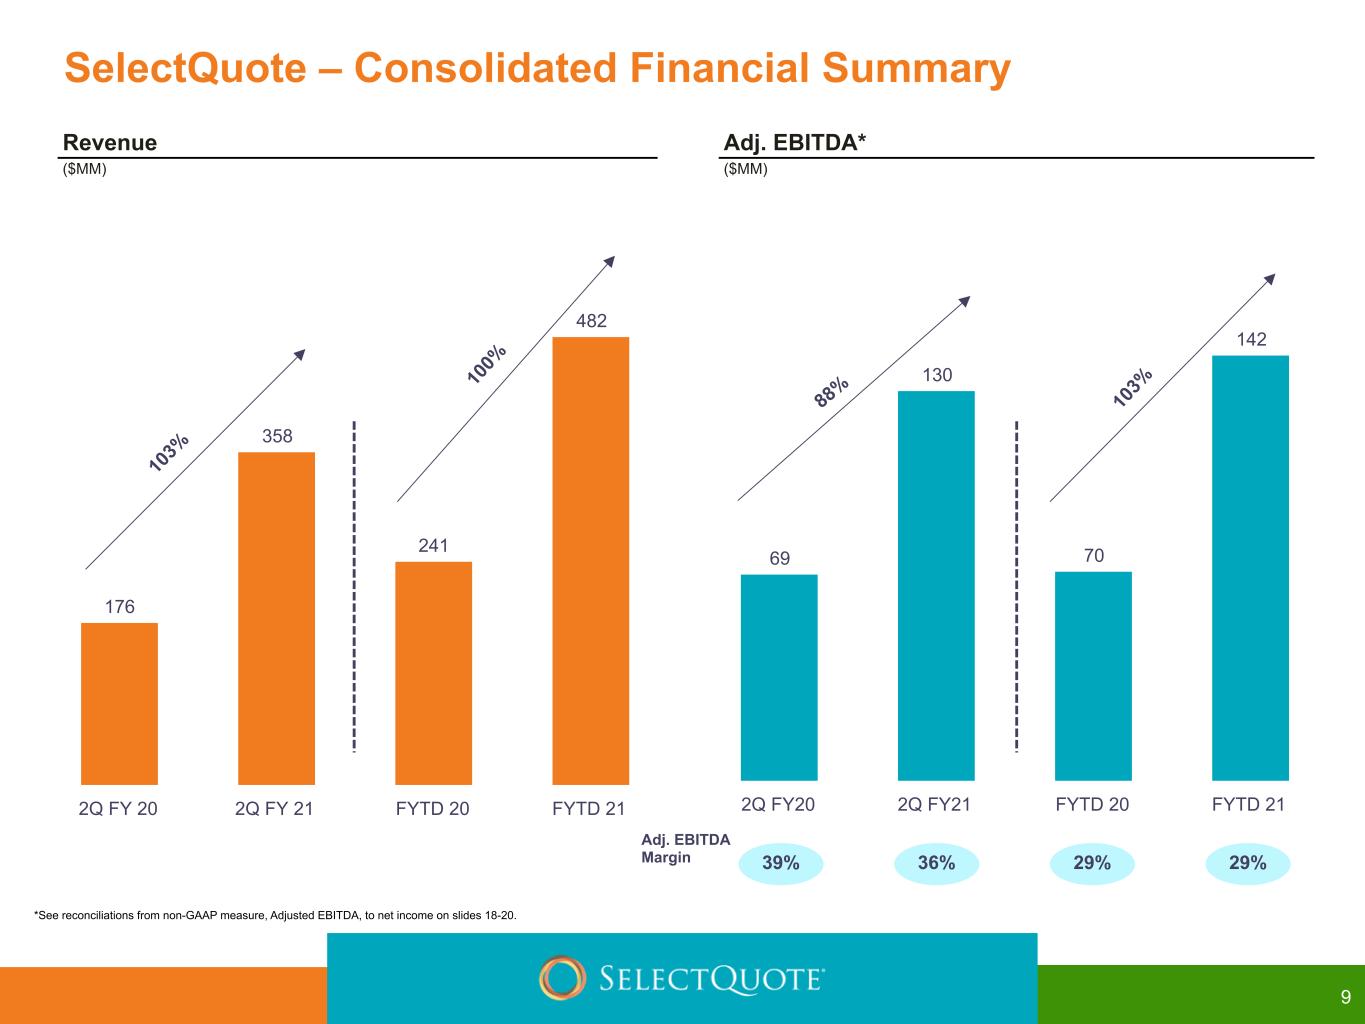

 
9 69 130 70 142 2Q FY20 2Q FY21 FYTD 20 FYTD 21 176 358 241 482 2Q FY 20 2Q FY 21 FYTD 20 FYTD 21 36% Adj. EBITDA Margin 39% 10 3% *See reconciliations from non-GAAP measure, Adjusted EBITDA, to net income on slides 18-20. SelectQuote – Consolidated Financial Summary Revenue ($MM) Adj. EBITDA* ($MM) 10 0% 29%29% 88 % 10 3%
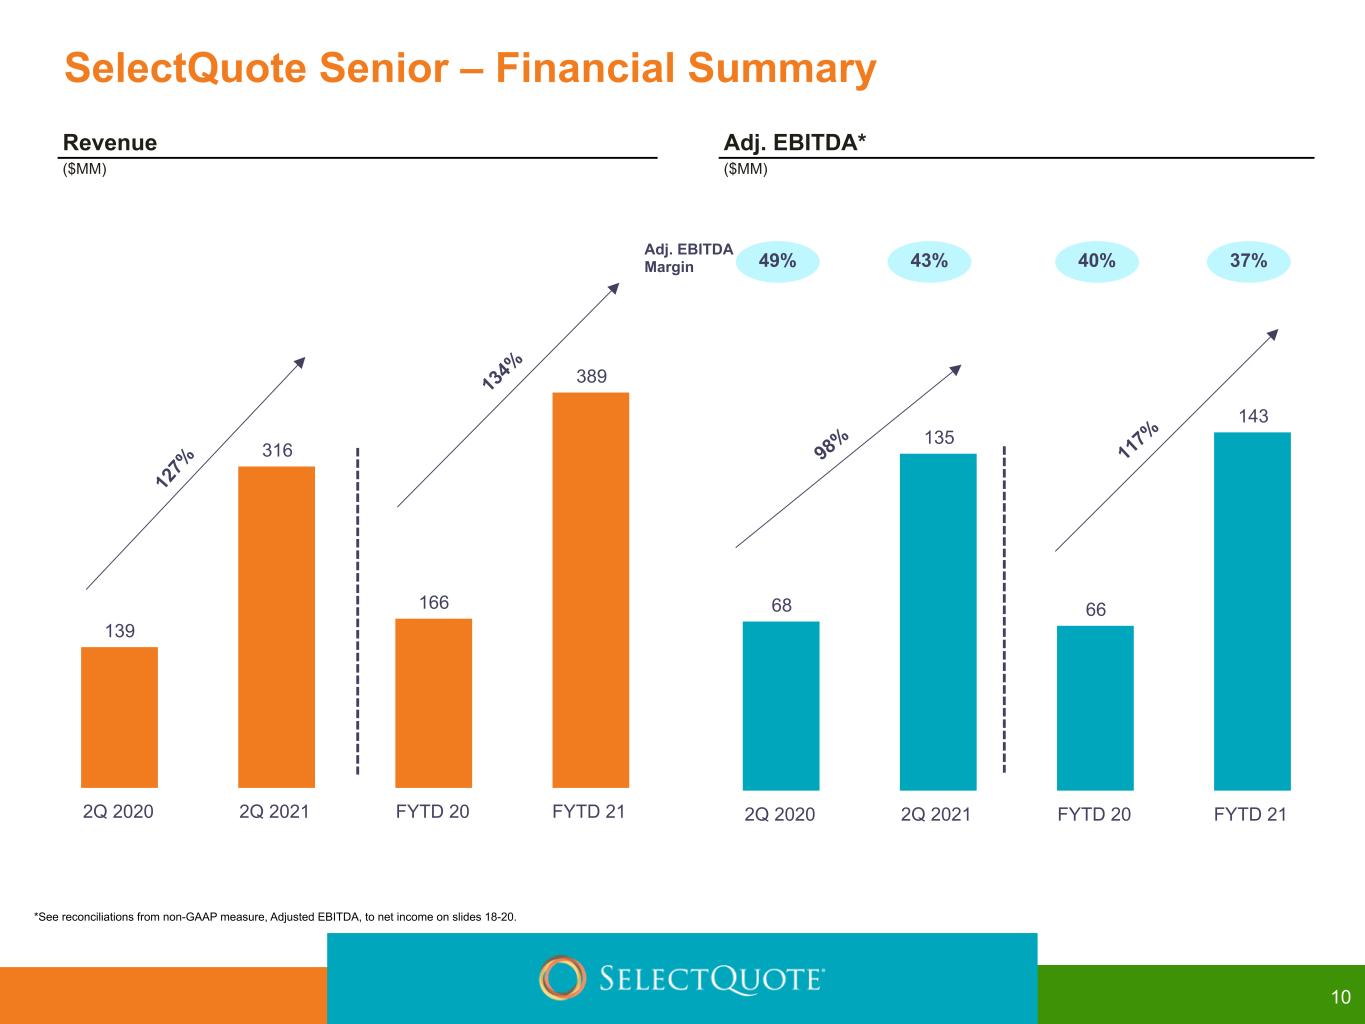

 
10 68 135 66 143 2Q 2020 2Q 2021 FYTD 20 FYTD 21 139 316 166 389 2Q 2020 2Q 2021 FYTD 20 FYTD 21 43% Adj. EBITDA Margin 49% 12 7% SelectQuote Senior – Financial Summary Revenue ($MM) Adj. EBITDA* ($MM) 13 4% 37%40% 98 % 11 7% *See reconciliations from non-GAAP measure, Adjusted EBITDA, to net income on slides 18-20.
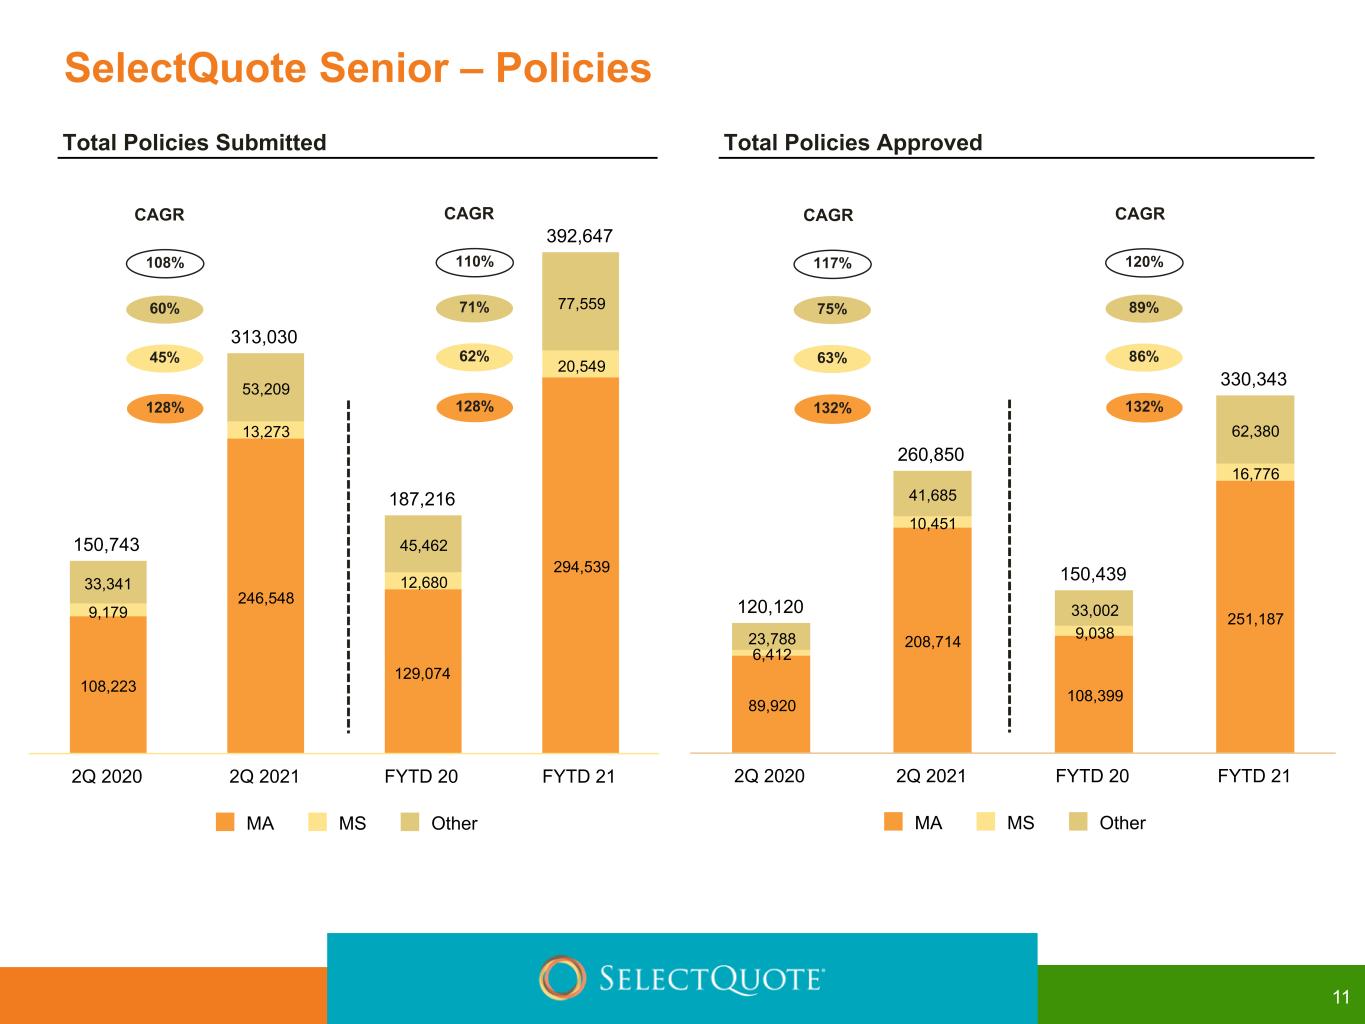

 
11 120,120 260,850 150,439 330,343 89,920 208,714 108,399 251,187 6,412 10,451 9,038 16,776 23,788 41,685 33,002 62,380 MA MS Other 2Q 2020 2Q 2021 FYTD 20 FYTD 21 150,743 313,030 187,216 392,647 108,223 246,548 129,074 294,539 9,179 13,273 12,680 20,549 33,341 53,209 45,462 77,559 MA MS Other 2Q 2020 2Q 2021 FYTD 20 FYTD 21 60% 108% 128% CAGR 45% 75% 117% 132% CAGR 63% Total Policies Submitted Total Policies Approved SelectQuote Senior – Policies 71% 110% 128% CAGR 62% 89% 120% 132% CAGR 86%


12 24 31 46 69 19 19 38 373 11 7 31 1 1 1 1 Core Premium Final Expense Ancillary Premium Q2 FY2020 Q2 FY2021 FYTD 20 FYTD 21 6 6 12 17 Q2 FY2020 Q2 FY2021 FYTD 20 FYTD 21 29 36 57 79 Q2 FY2020 Q2 FY2021 FYTD 20 FYTD 21 Adj. EBITDA Margin 18%22% 229% 29% (4)% CAGR 3% 26% Life Premium ($MM) Revenue ($MM) Adj. EBITDA* ($MM) SelectQuote Life – Financial Summary (33)% 318% 49% (1)% CAGR (7)% 40% 40% 21%21% *See reconciliations from non-GAAP measure, Adjusted EBITDA, to net income on slides 18-20.


13 2 2 4 6 Q2 FY2020 Q2 FY2021 FYTD 20 FYTD 21 9 7 19 17 2Q 2020 2Q 2021 FYTD 20 FYTD 21 15 13 32 30 2Q 2020 2Q 2021 FYTD 20 FYTD 21 Adj. EBITDA Margin 30%18% (15)% 42% (10)% Net New Effective Premium ($MM) Revenue ($MM) Adj. EBITDA* ($MM) *See reconciliations from non-GAAP measure, Adjusted EBITDA, to net income on slides 18-20. SelectQuote Auto & Home – Financial Summary (6)% (10)% 44% 34%22%
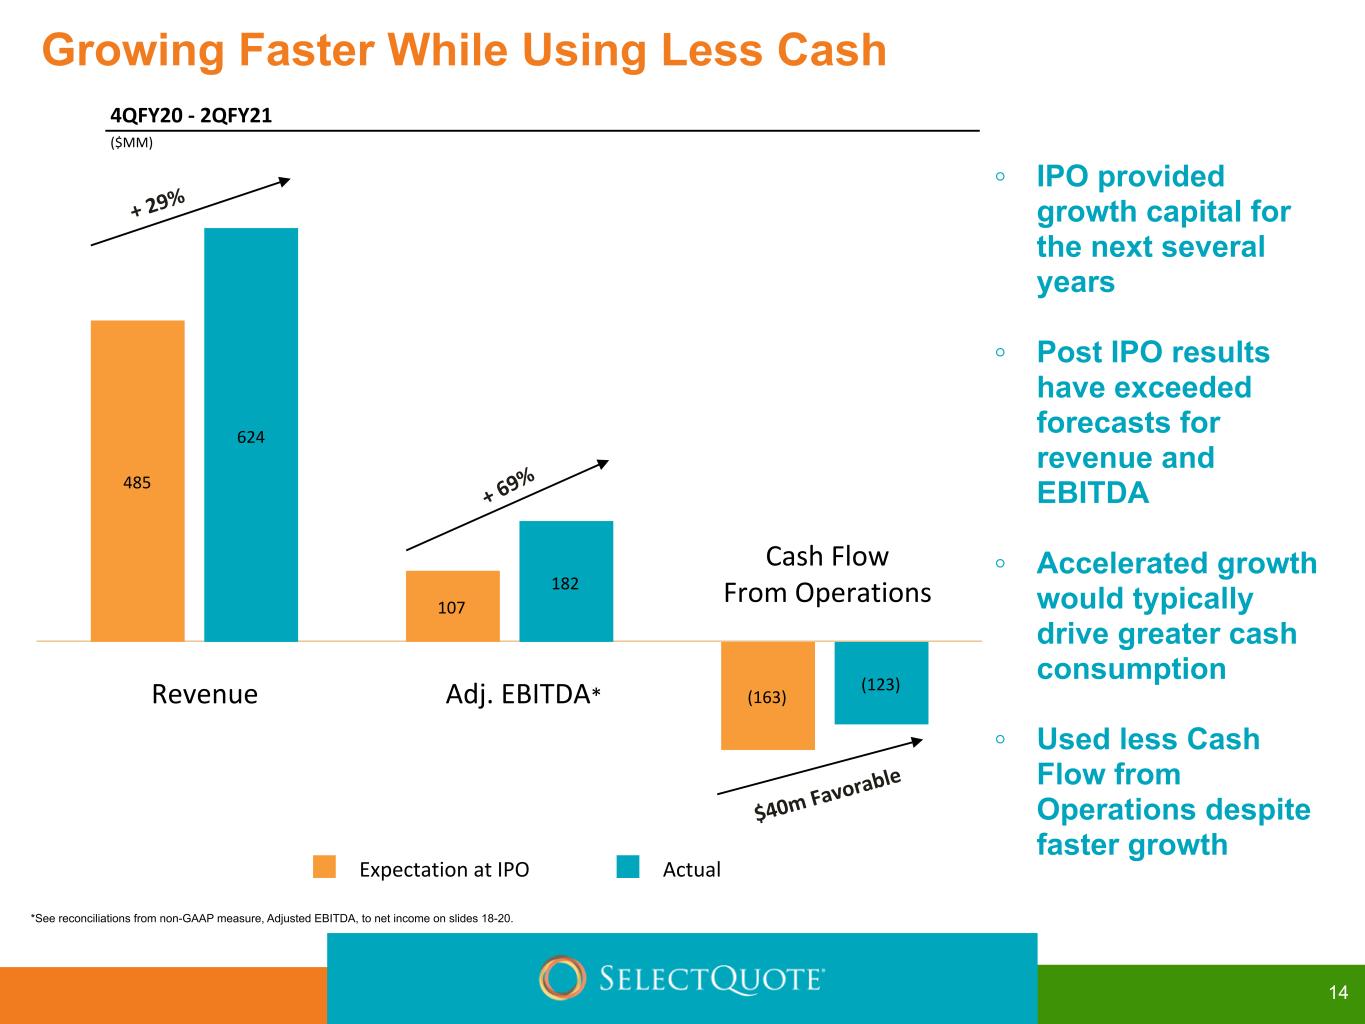

 
Growing Faster While Using Less Cash *See reconciliations from non-GAAP measure, Adjusted EBITDA, to net income on slides 18-20. ◦ IPO provided growth capital for the next several years ◦ Post IPO results have exceeded forecasts for revenue and EBITDA ◦ Accelerated growth would typically drive greater cash consumption ◦ Used less Cash Flow from Operations despite faster growth 4QFY20 - 2QFY21 ($MM) 14 485 107 (163) 624 182 (123) Expectation at IPO Actual + 29 % + 6 9% $40m Favo rable Revenue Adj. EBITDA* Cash Flow From Operations


• Net cash position of ($79) million ◦ $246 million of cash, cash equivalents, and restricted cash ◦ $325 million of term debt • Available borrowing capacity of $75 million on undrawn revolver • Accounts receivable, short and long term commissions receivable balance of $879 million • Expect to pay full InsideResponse earnout in cash 15 Note: As of December 31, 2020 Capitalization Summary


16 ($'s in millions) Range Implied YoY Growth Revenue $920 - $940 73% - 77% Net Income $138 - $146 70% - 80% Adjusted EBITDA* $230 - $240 49% - 56% *See reconciliations from non-GAAP measure, Adjusted EBITDA, to net income on slides 18-20. SelectQuote – FY2021 Consolidated Guidance


Supplemental information 17
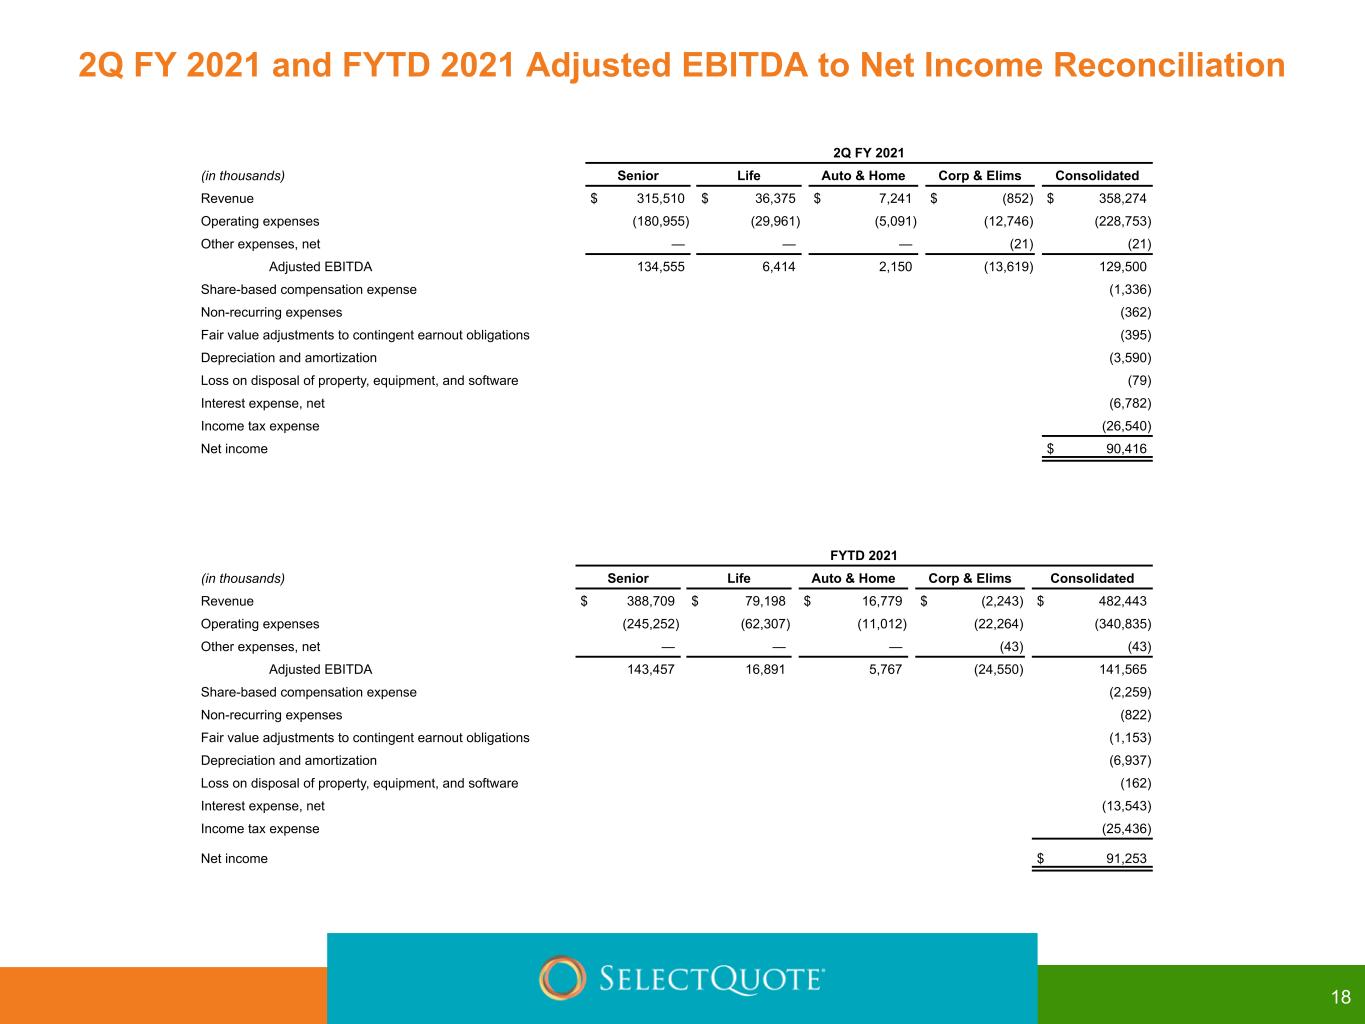

 
18 2Q FY 2021 (in thousands) Senior Life Auto & Home Corp & Elims Consolidated Revenue $ 315,510 $ 36,375 $ 7,241 $ (852) $ 358,274 Operating expenses (180,955) (29,961) (5,091) (12,746) (228,753) Other expenses, net — — — (21) (21) Adjusted EBITDA 134,555 6,414 2,150 (13,619) 129,500 Share-based compensation expense (1,336) Non-recurring expenses (362) Fair value adjustments to contingent earnout obligations (395) Depreciation and amortization (3,590) Loss on disposal of property, equipment, and software (79) Interest expense, net (6,782) Income tax expense (26,540) Net income $ 90,416 FYTD 2021 (in thousands) Senior Life Auto & Home Corp & Elims Consolidated Revenue $ 388,709 $ 79,198 $ 16,779 $ (2,243) $ 482,443 Operating expenses (245,252) (62,307) (11,012) (22,264) (340,835) Other expenses, net — — — (43) (43) Adjusted EBITDA 143,457 16,891 5,767 (24,550) 141,565 Share-based compensation expense (2,259) Non-recurring expenses (822) Fair value adjustments to contingent earnout obligations (1,153) Depreciation and amortization (6,937) Loss on disposal of property, equipment, and software (162) Interest expense, net (13,543) Income tax expense (25,436) Net income $ 91,253 2Q FY 2021 and FYTD 2021 Adjusted EBITDA to Net Income Reconciliation
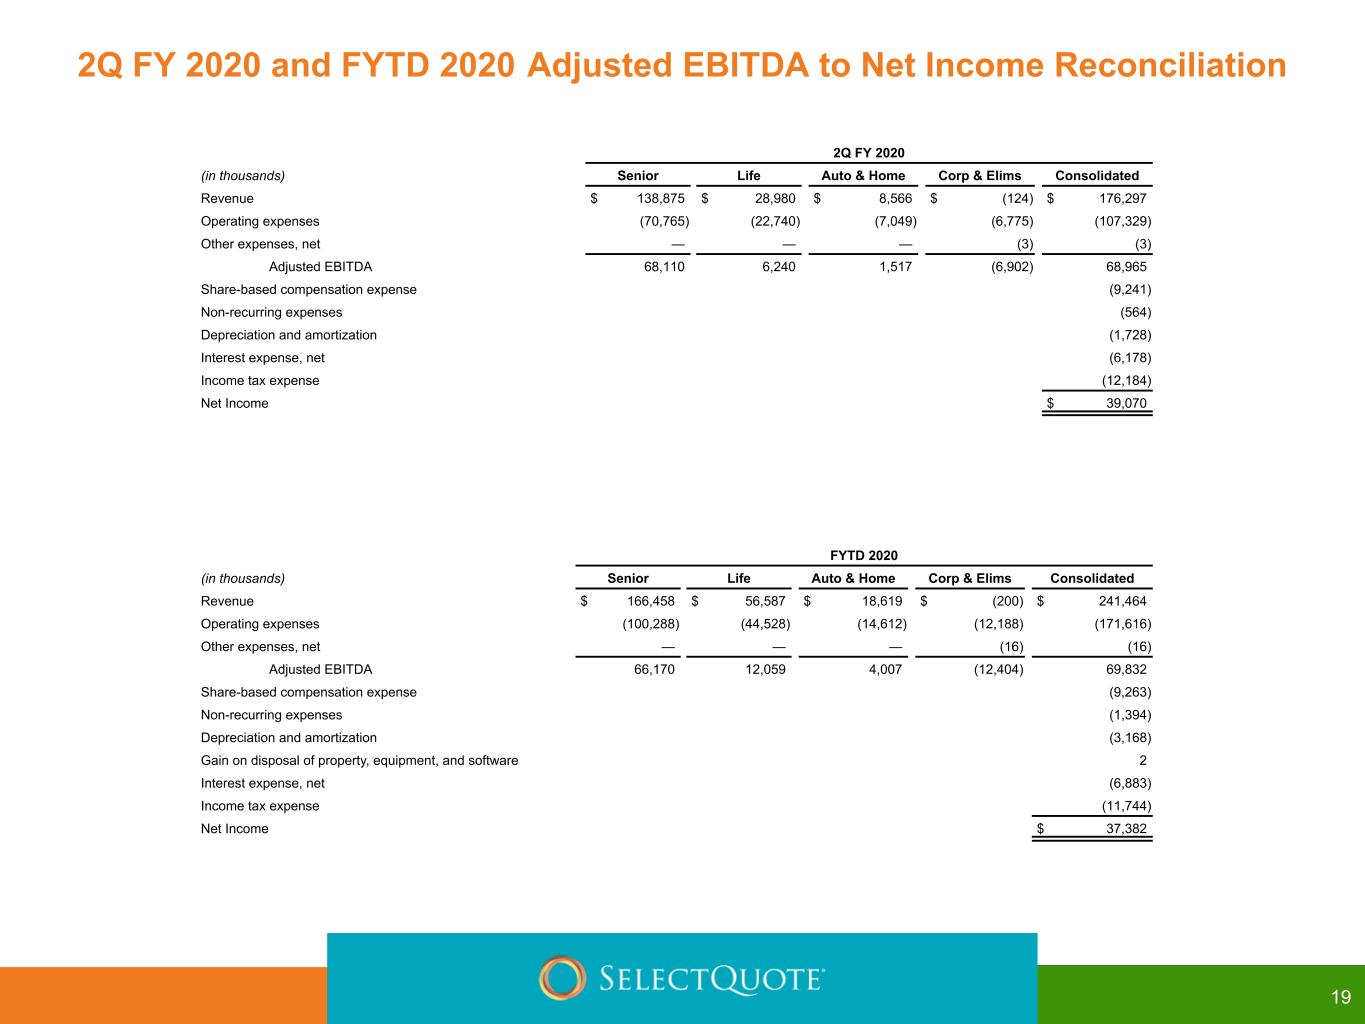

 
19 2Q FY 2020 (in thousands) Senior Life Auto & Home Corp & Elims Consolidated Revenue $ 138,875 $ 28,980 $ 8,566 $ (124) $ 176,297 Operating expenses (70,765) (22,740) (7,049) (6,775) (107,329) Other expenses, net — — — (3) (3) Adjusted EBITDA 68,110 6,240 1,517 (6,902) 68,965 Share-based compensation expense (9,241) Non-recurring expenses (564) Depreciation and amortization (1,728) Interest expense, net (6,178) Income tax expense (12,184) Net Income $ 39,070 FYTD 2020 (in thousands) Senior Life Auto & Home Corp & Elims Consolidated Revenue $ 166,458 $ 56,587 $ 18,619 $ (200) $ 241,464 Operating expenses (100,288) (44,528) (14,612) (12,188) (171,616) Other expenses, net — — — (16) (16) Adjusted EBITDA 66,170 12,059 4,007 (12,404) 69,832 Share-based compensation expense (9,263) Non-recurring expenses (1,394) Depreciation and amortization (3,168) Gain on disposal of property, equipment, and software 2 Interest expense, net (6,883) Income tax expense (11,744) Net Income $ 37,382 2Q FY 2020 and FYTD 2020 Adjusted EBITDA to Net Income Reconciliation
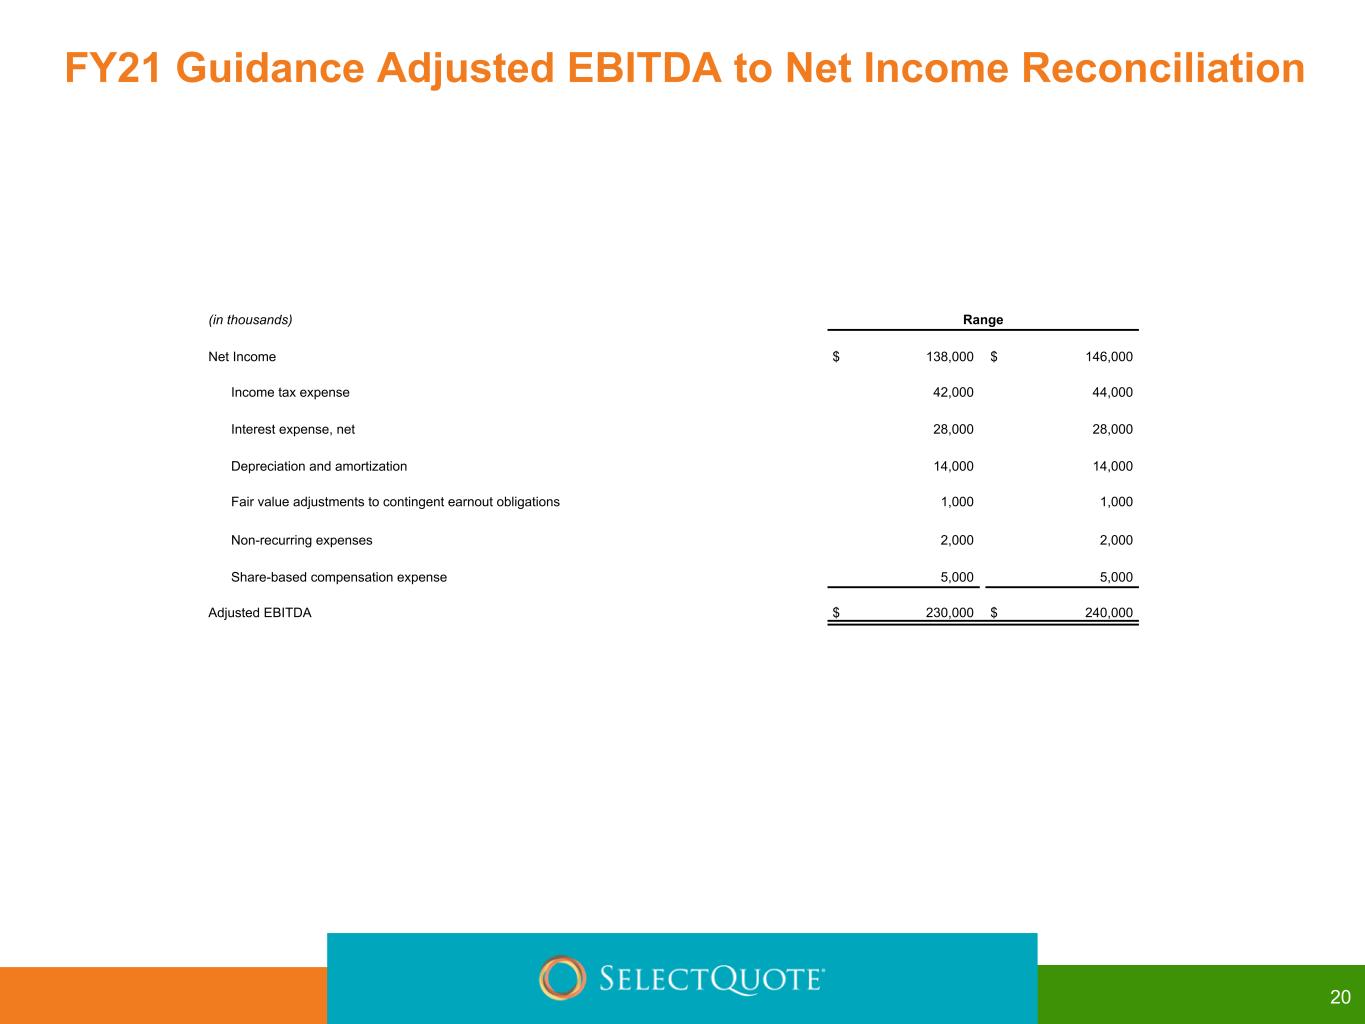

 
20 (in thousands) Range Net Income $ 138,000 $ 146,000 Income tax expense 42,000 44,000 Interest expense, net 28,000 28,000 Depreciation and amortization 14,000 14,000 Fair value adjustments to contingent earnout obligations 1,000 1,000 Non-recurring expenses 2,000 2,000 Share-based compensation expense 5,000 5,000 Adjusted EBITDA $ 230,000 $ 240,000 FY21 Guidance Adjusted EBITDA to Net Income Reconciliation