Exhibit 99.1
|
For Immediate Release
|
|
|
For more information, contact:
|
|
|
Anthony (Tony) Cristello
|
|
|
Standard Motor Products, Inc.
|
|
|
(972) 316-8107
|
|
Standard Motor Products, Inc. Releases
Fourth Quarter and 2022 Year-End Results;
Announces Segment Reporting Changes
New York, NY, February 22, 2023......Standard Motor Products, Inc. (NYSE: SMP), a leading automotive parts manufacturer and distributor, reported today its consolidated
financial results for the three and twelve months ended December 31, 2022.
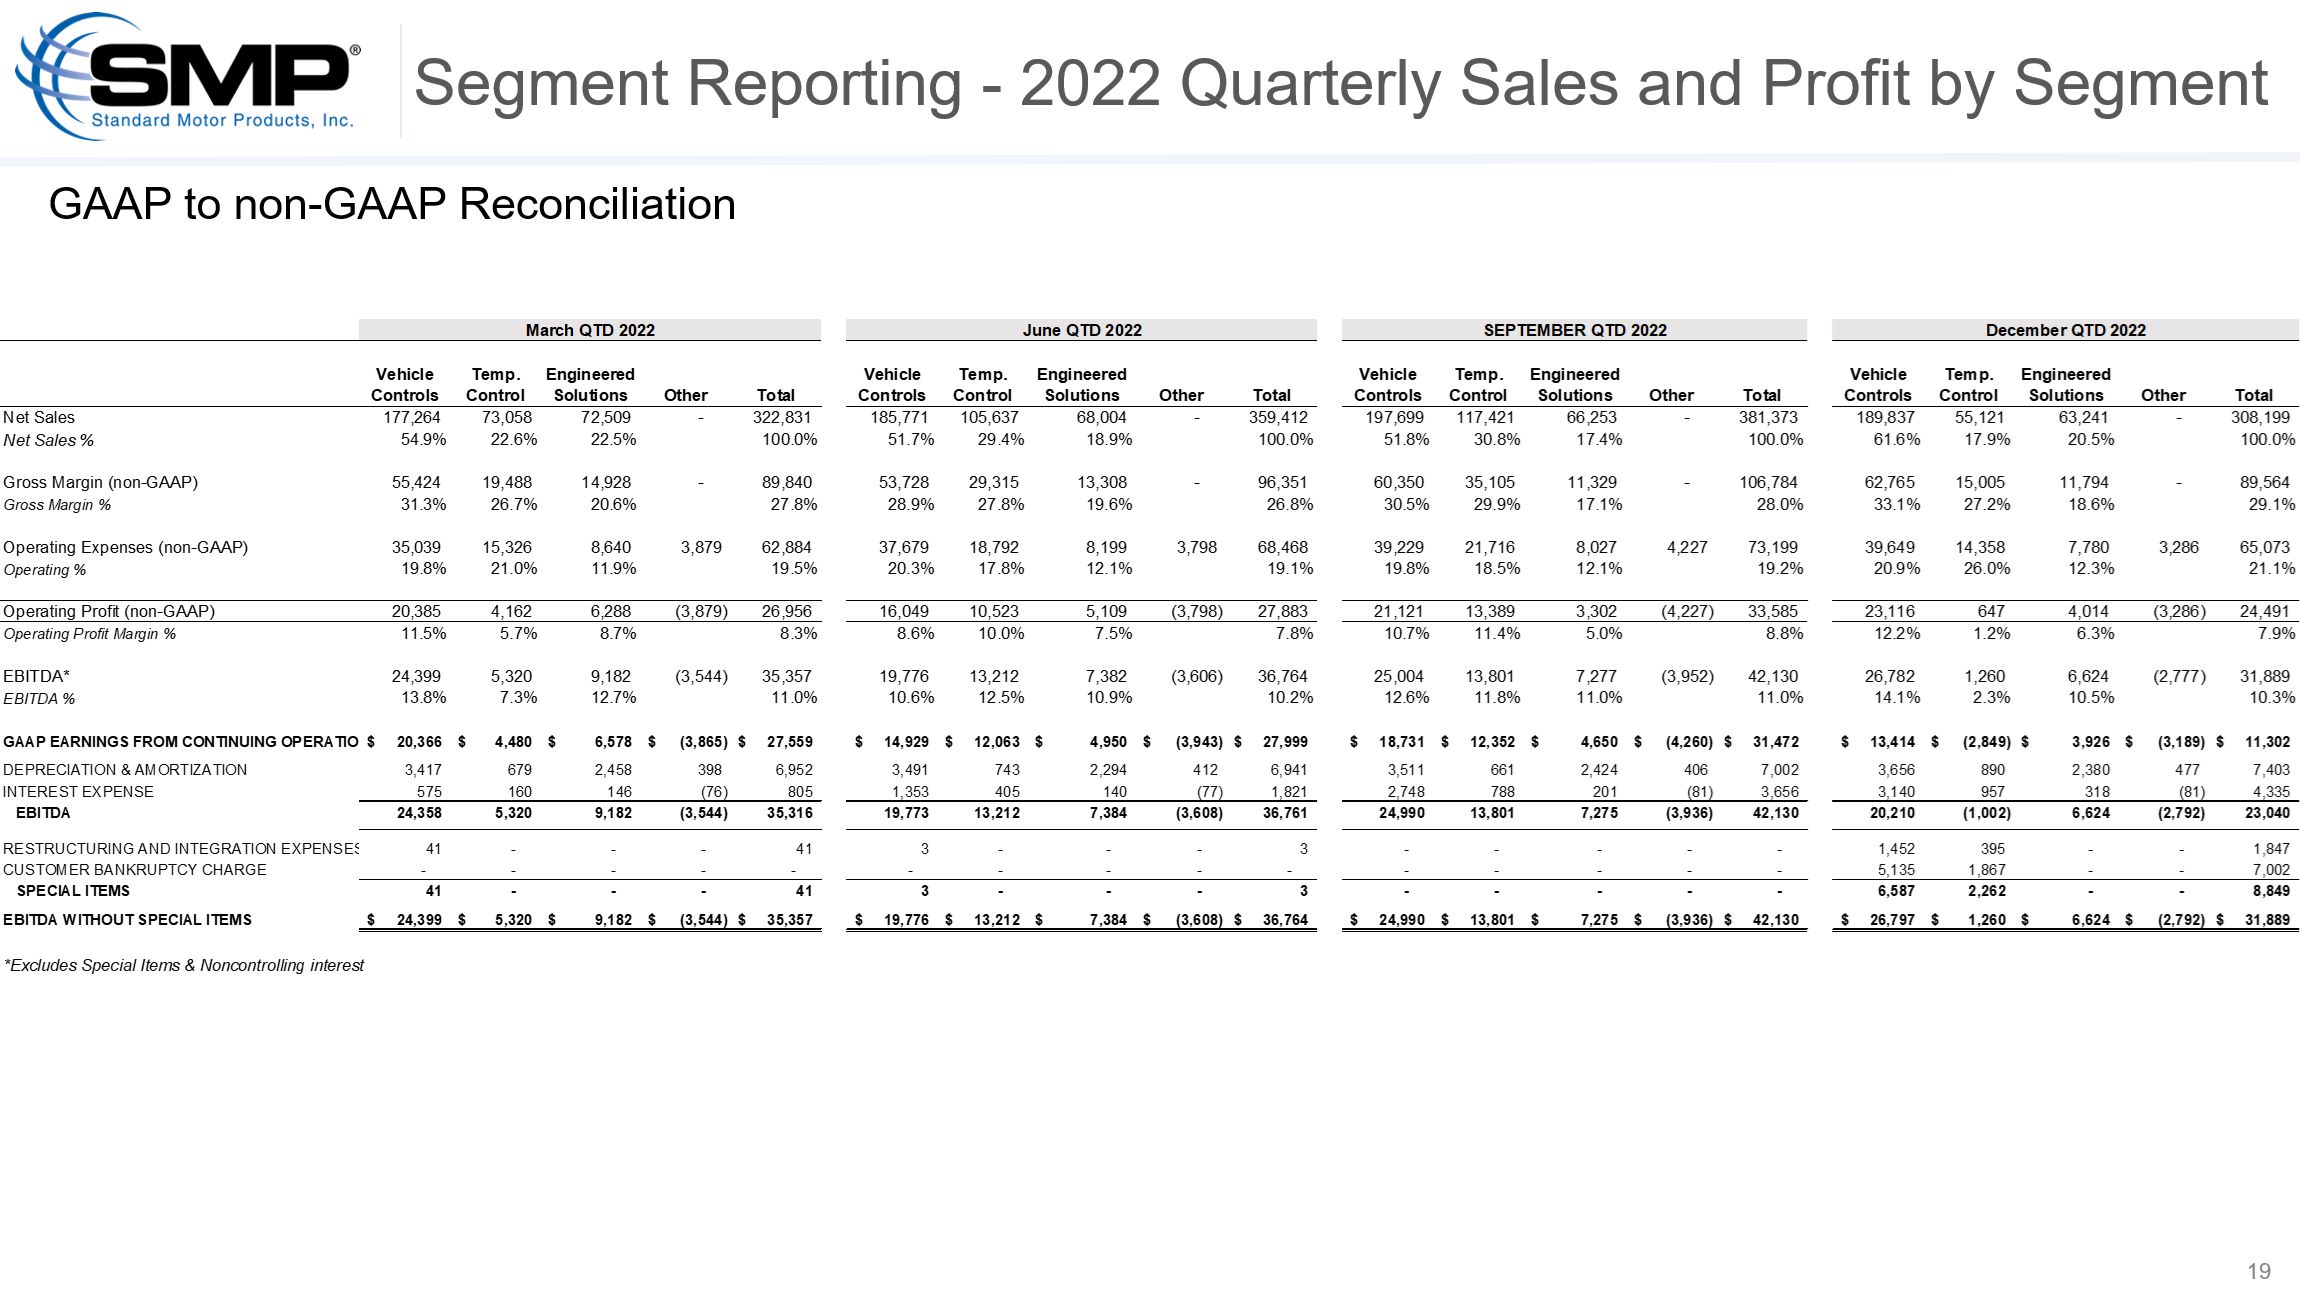
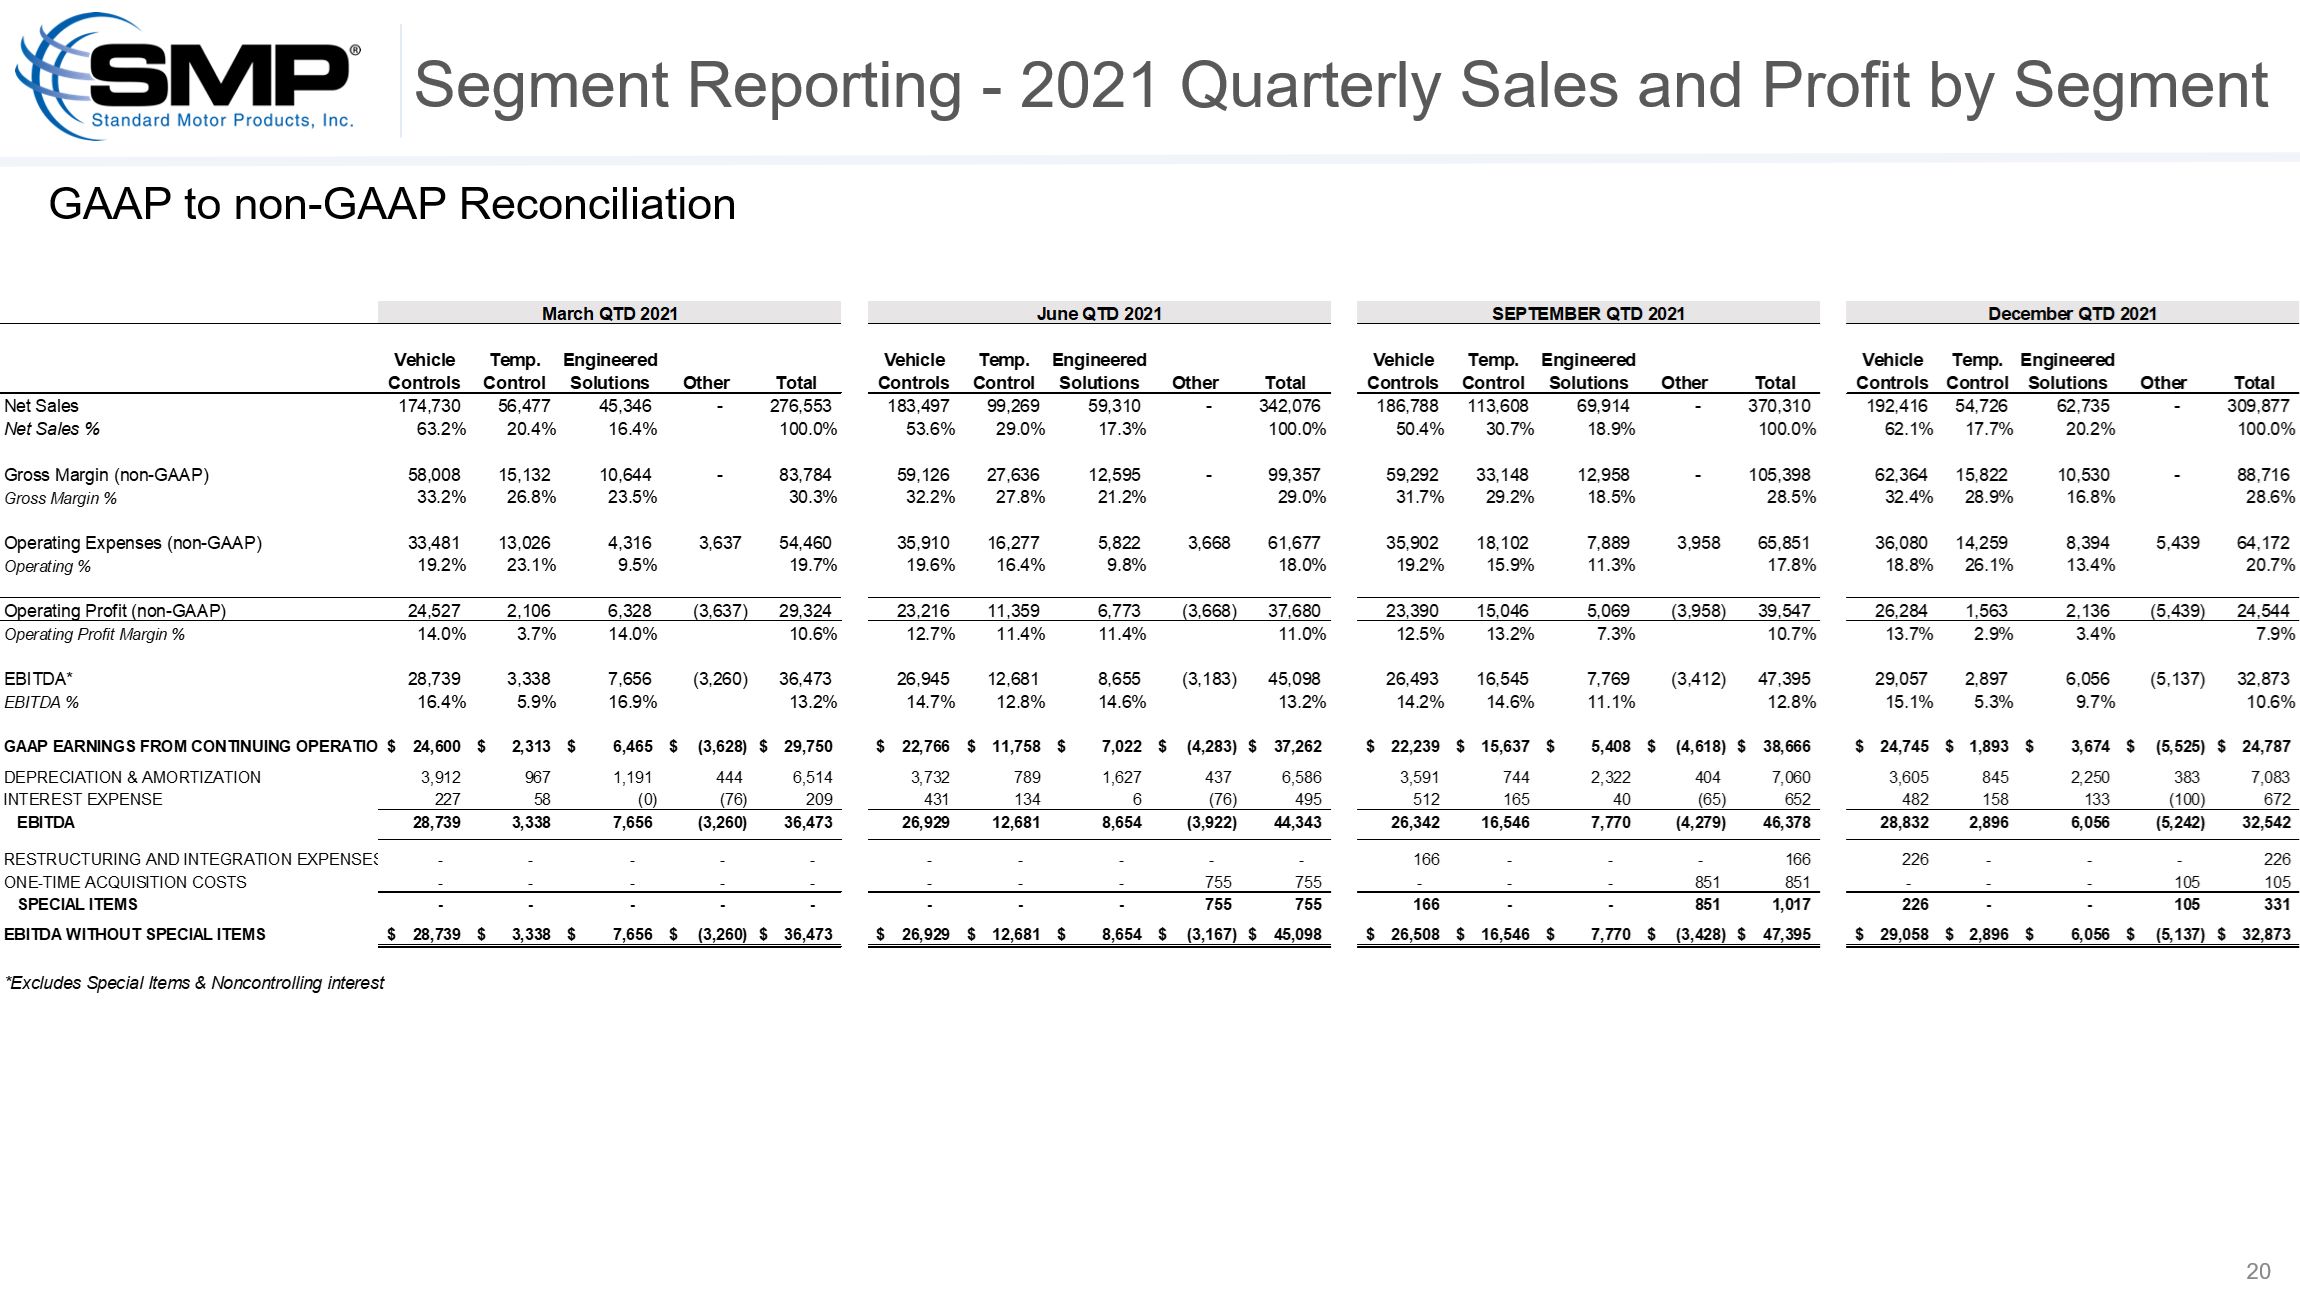
Net sales for the fourth quarter of 2022 were $308.2 million, compared to consolidated net sales of $309.9 million during the same quarter in 2021. Earnings from
continuing operations for the fourth quarter of 2022 were $8.5 million or $0.39 per diluted share, compared to $20.0 million or $0.89 per diluted share in the fourth quarter of 2021. Excluding non-operational gains and losses identified on the
attached reconciliation of GAAP and non-GAAP measures, earnings from continuing operations for the fourth quarter of 2022 were $15.1 million or $0.69 per diluted share, compared to $20.3 million or $0.90 per diluted share in the fourth quarter of
2021.
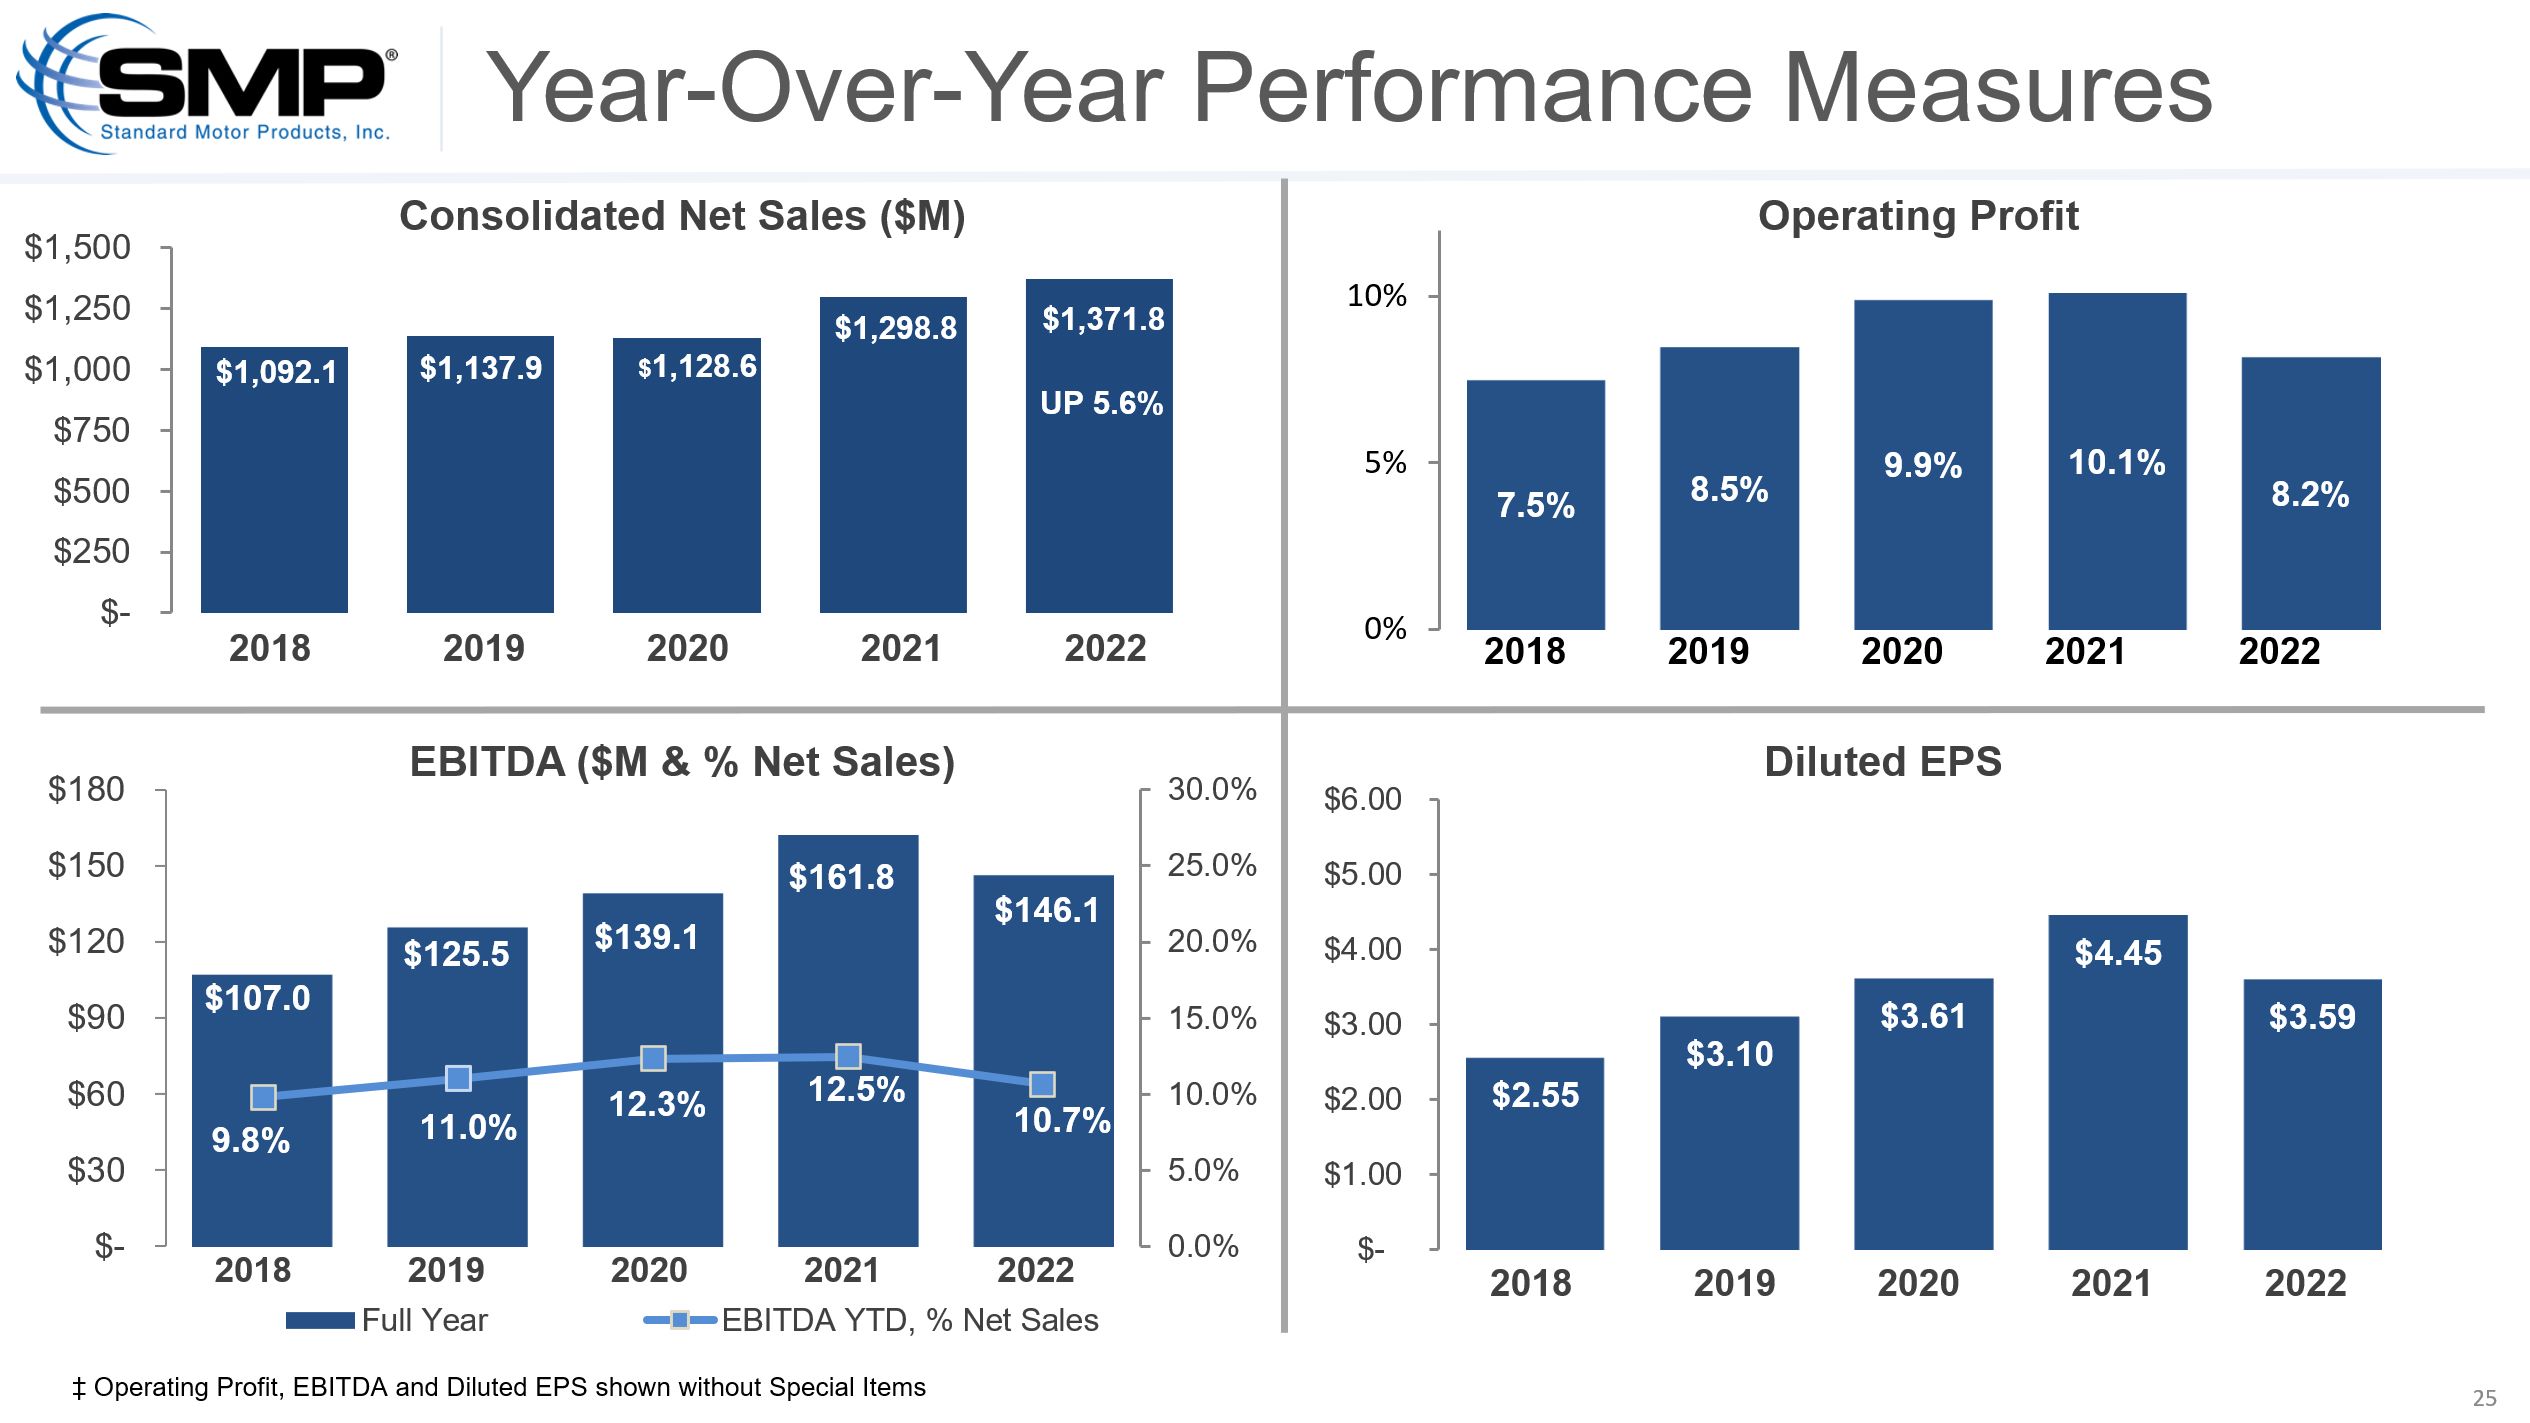
Consolidated net sales for the twelve months ended December 31, 2022, were $1.37 billion, compared to consolidated net sales of $1.30 billion during the comparable period
in 2021. Earnings from continuing operations for the twelve months ended December 31, 2022, were $73.0 million or $3.30 per diluted share, compared to $99.4 million or $4.39 per diluted share in the comparable period of 2021. Excluding
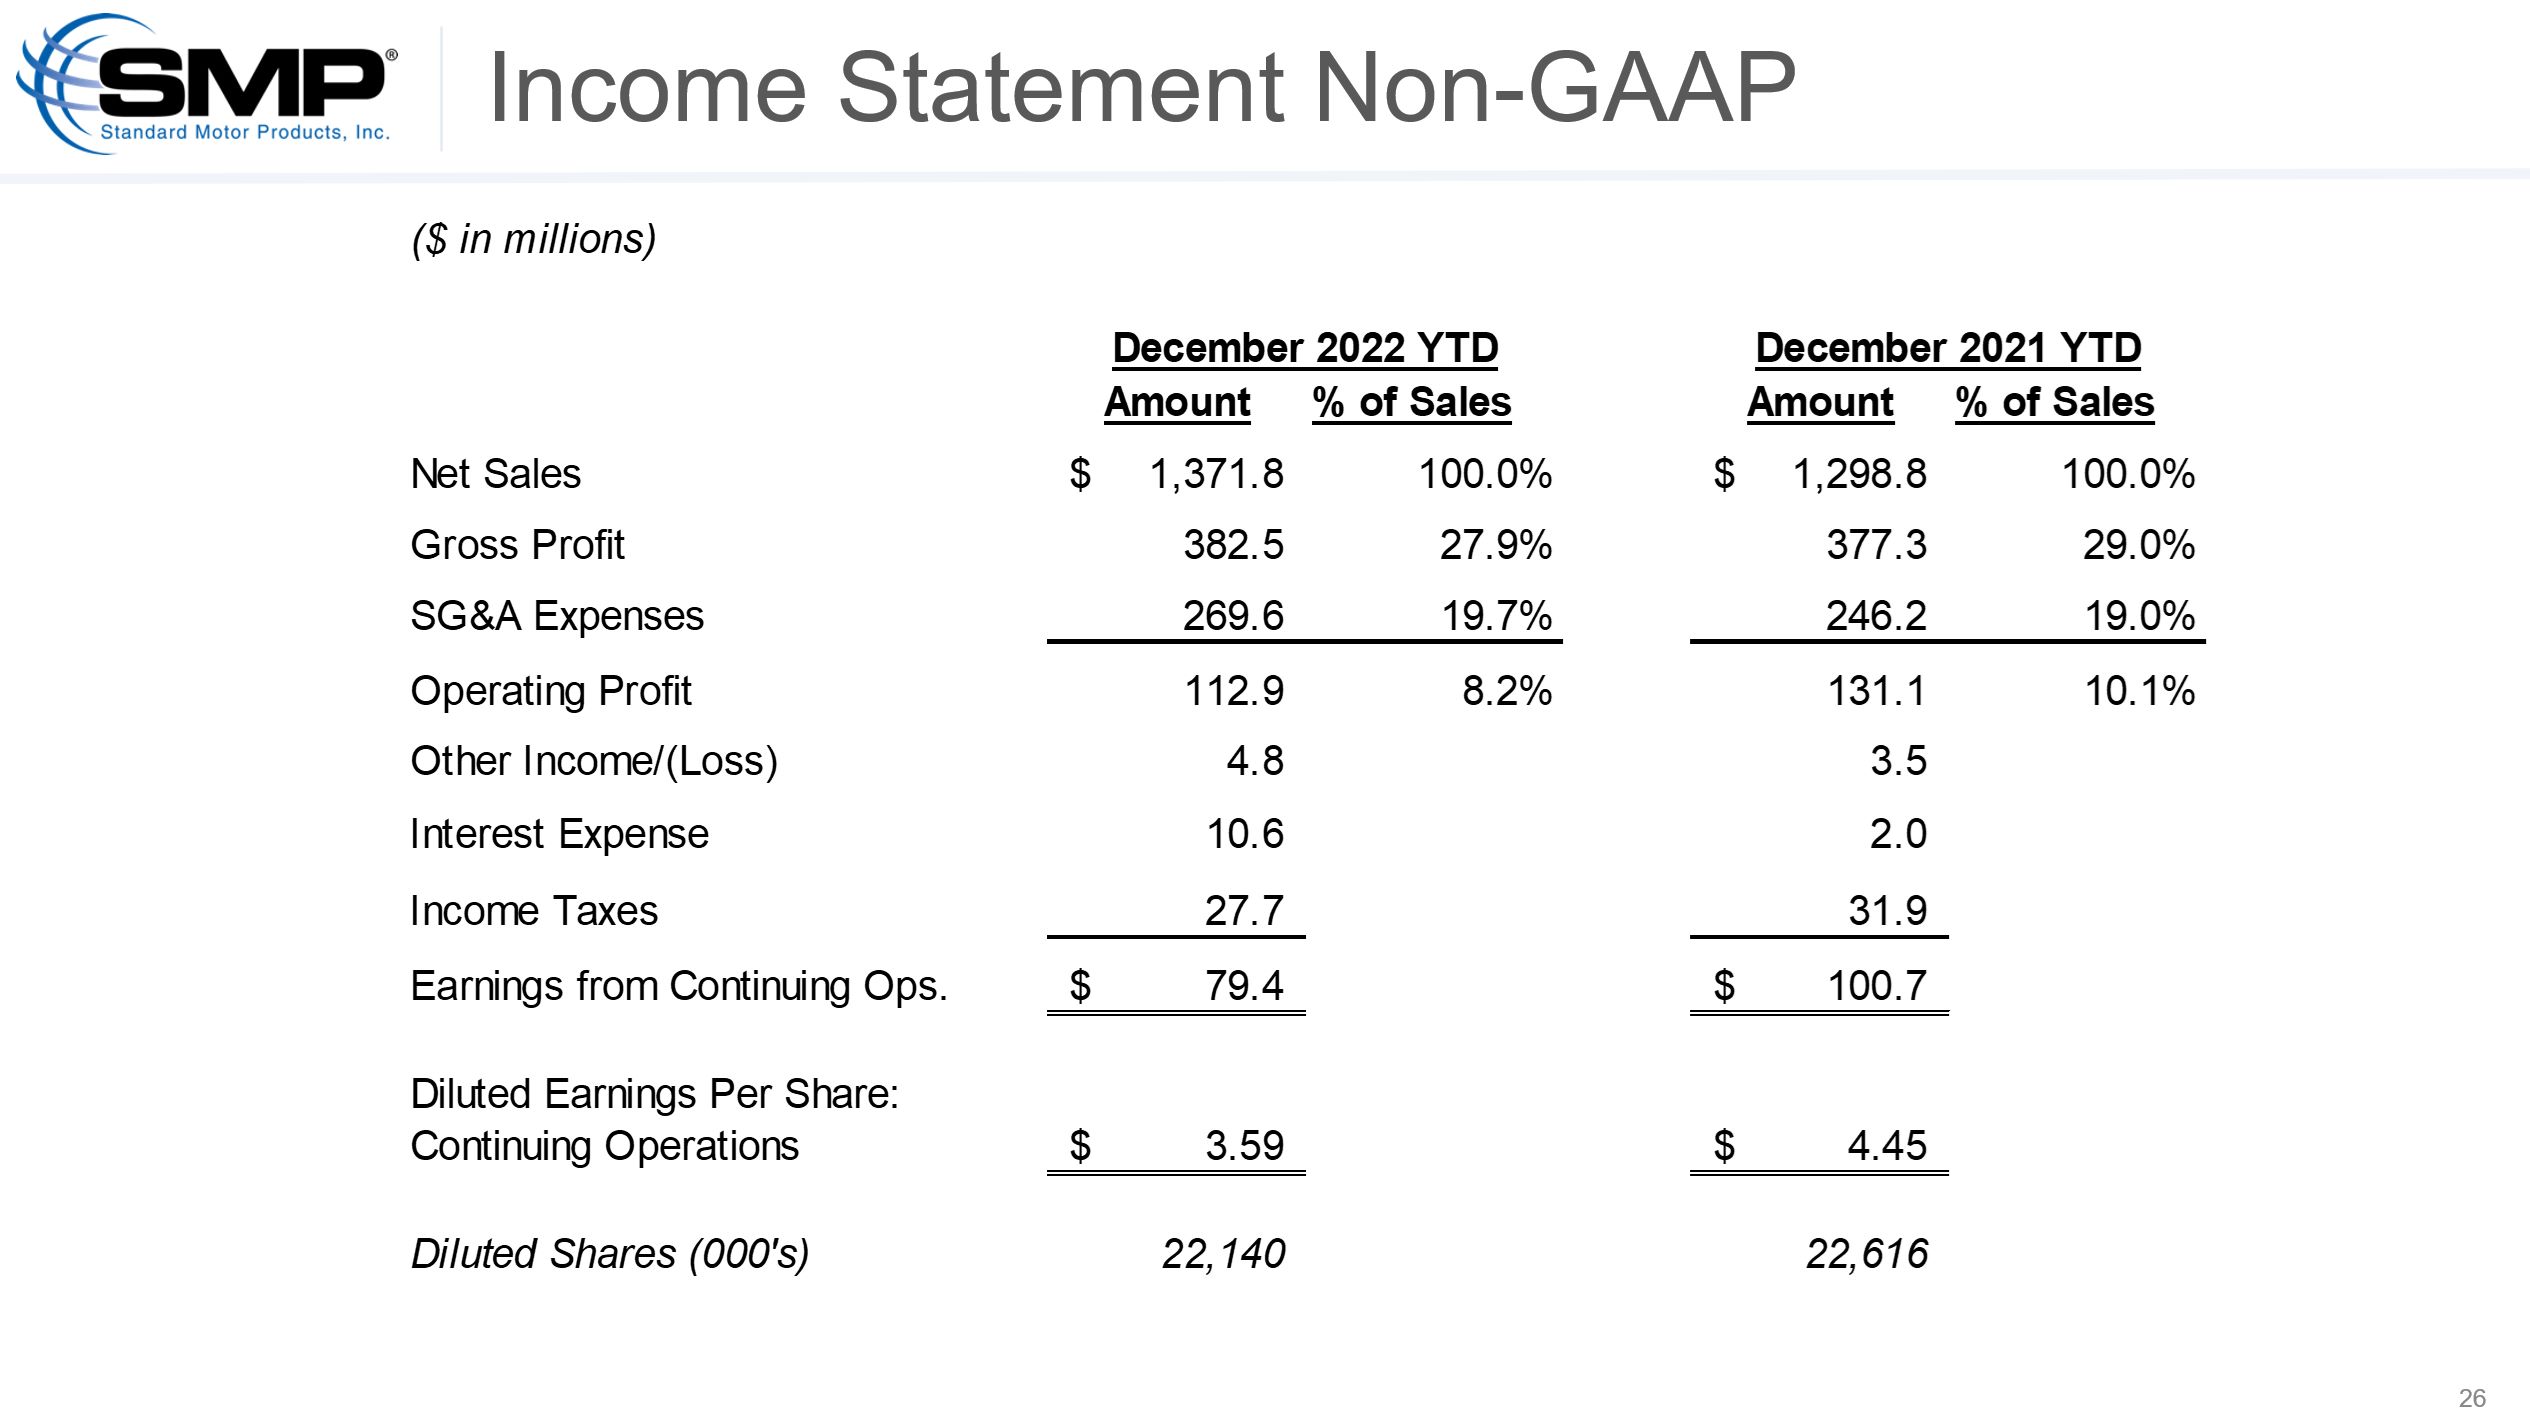
non-operational gains and losses identified on the attached reconciliation of GAAP and non-GAAP measures, earnings from continuing operations for the twelve months ended December 31, 2022 and 2021 were $79.4 million or $3.59 per diluted share and
$100.7 million or $4.45 per diluted share, respectively. Our earnings for both the fourth quarter and the full-year 2022 were impacted by the recent announcement of a bankruptcy filing by an Aftermarket customer. We recorded a pre-tax charge of
$7.0 million in the fourth quarter related to anticipated losses from this event, which has been treated as a non-operational loss on our GAAP to non-GAAP reconciliation.
Mr. Eric Sills, Standard Motor Products’ Chief Executive Officer and President stated, “We are pleased with our full year sales results, up 5.6% from 2021, with both
Engine Management and Temperature Control segments performing well. Against a challenging comparison, sales for the fourth quarter dropped a half a percentage point from the same period last year, which was up nearly 10% from 2020.”
By segment, Engine Management sales increased 4% for the full year, on top of 12% growth in 2021. However, fourth quarter sales were down slightly, just over 1%, versus a
very strong 2021, which was up 6% over the prior year. Our customers’ Engine Management POS sales remained robust in the quarter, reflecting continued market strength and demand for our products.
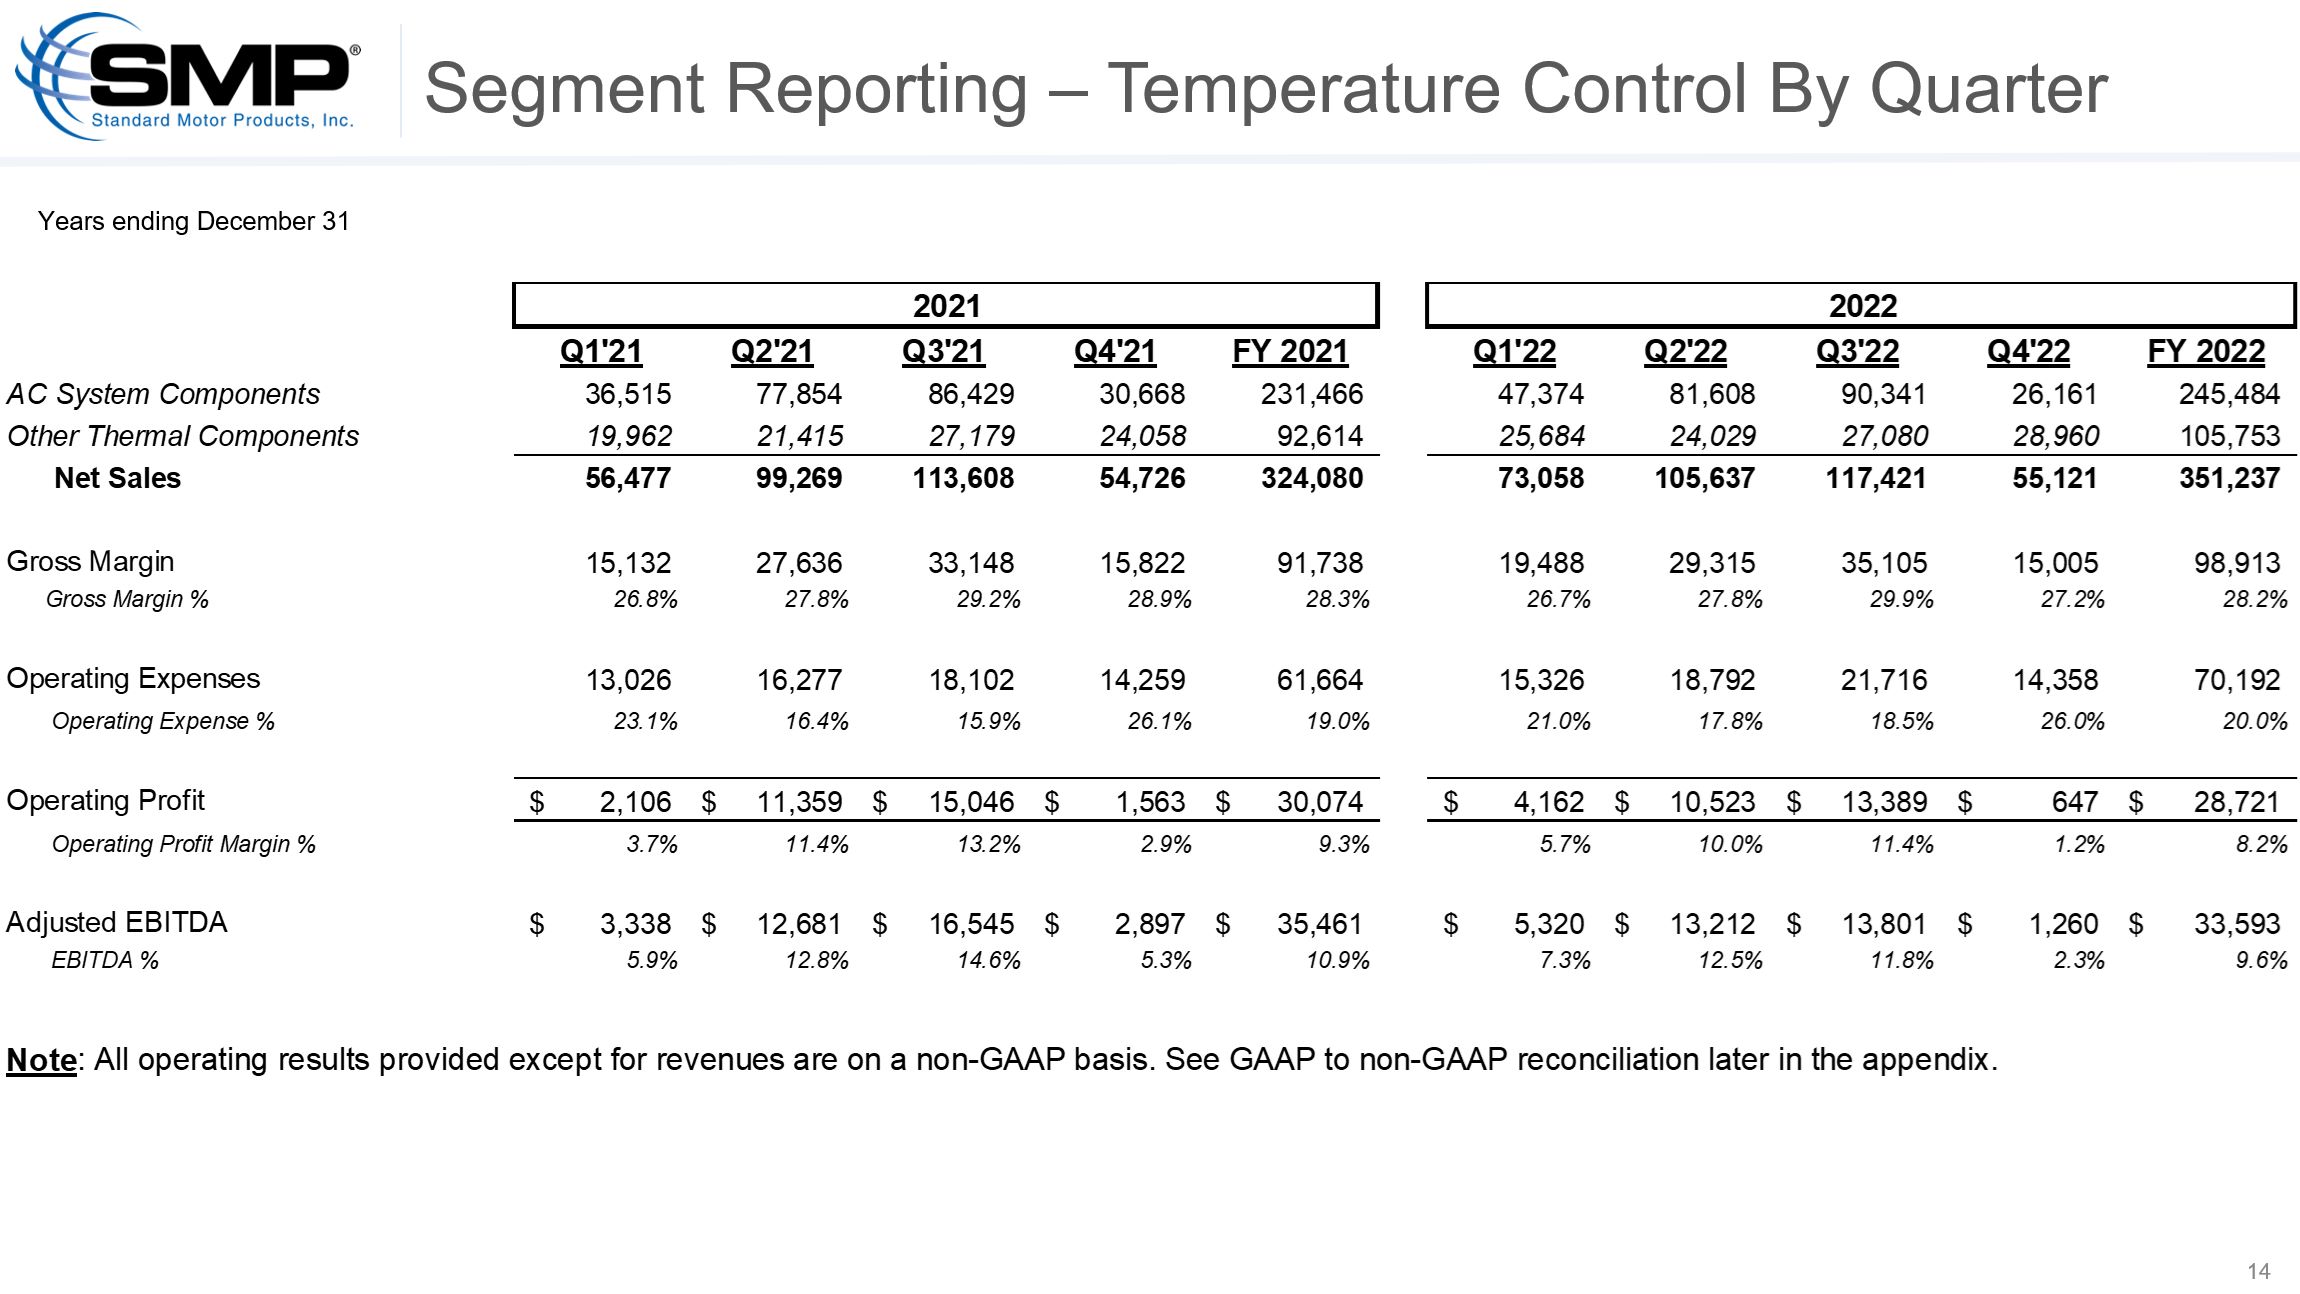
Temperature Control sales remained strong in the fourth quarter on the strength of winter related products and from another long, hot summer. Sales grew 5.2% in the
quarter versus last year, and were up nearly 10% for the full year due to a combination of favorable weather, successful pricing initiatives and overall strength in customer demand.
Consolidated operating profit for the quarter, excluding non-operational gains and losses, was 7.9%, in line with the fourth quarter of 2021. Pricing actions taken
earlier in 2022, along with various cost reduction initiatives, largely offset ongoing inflationary pressures.
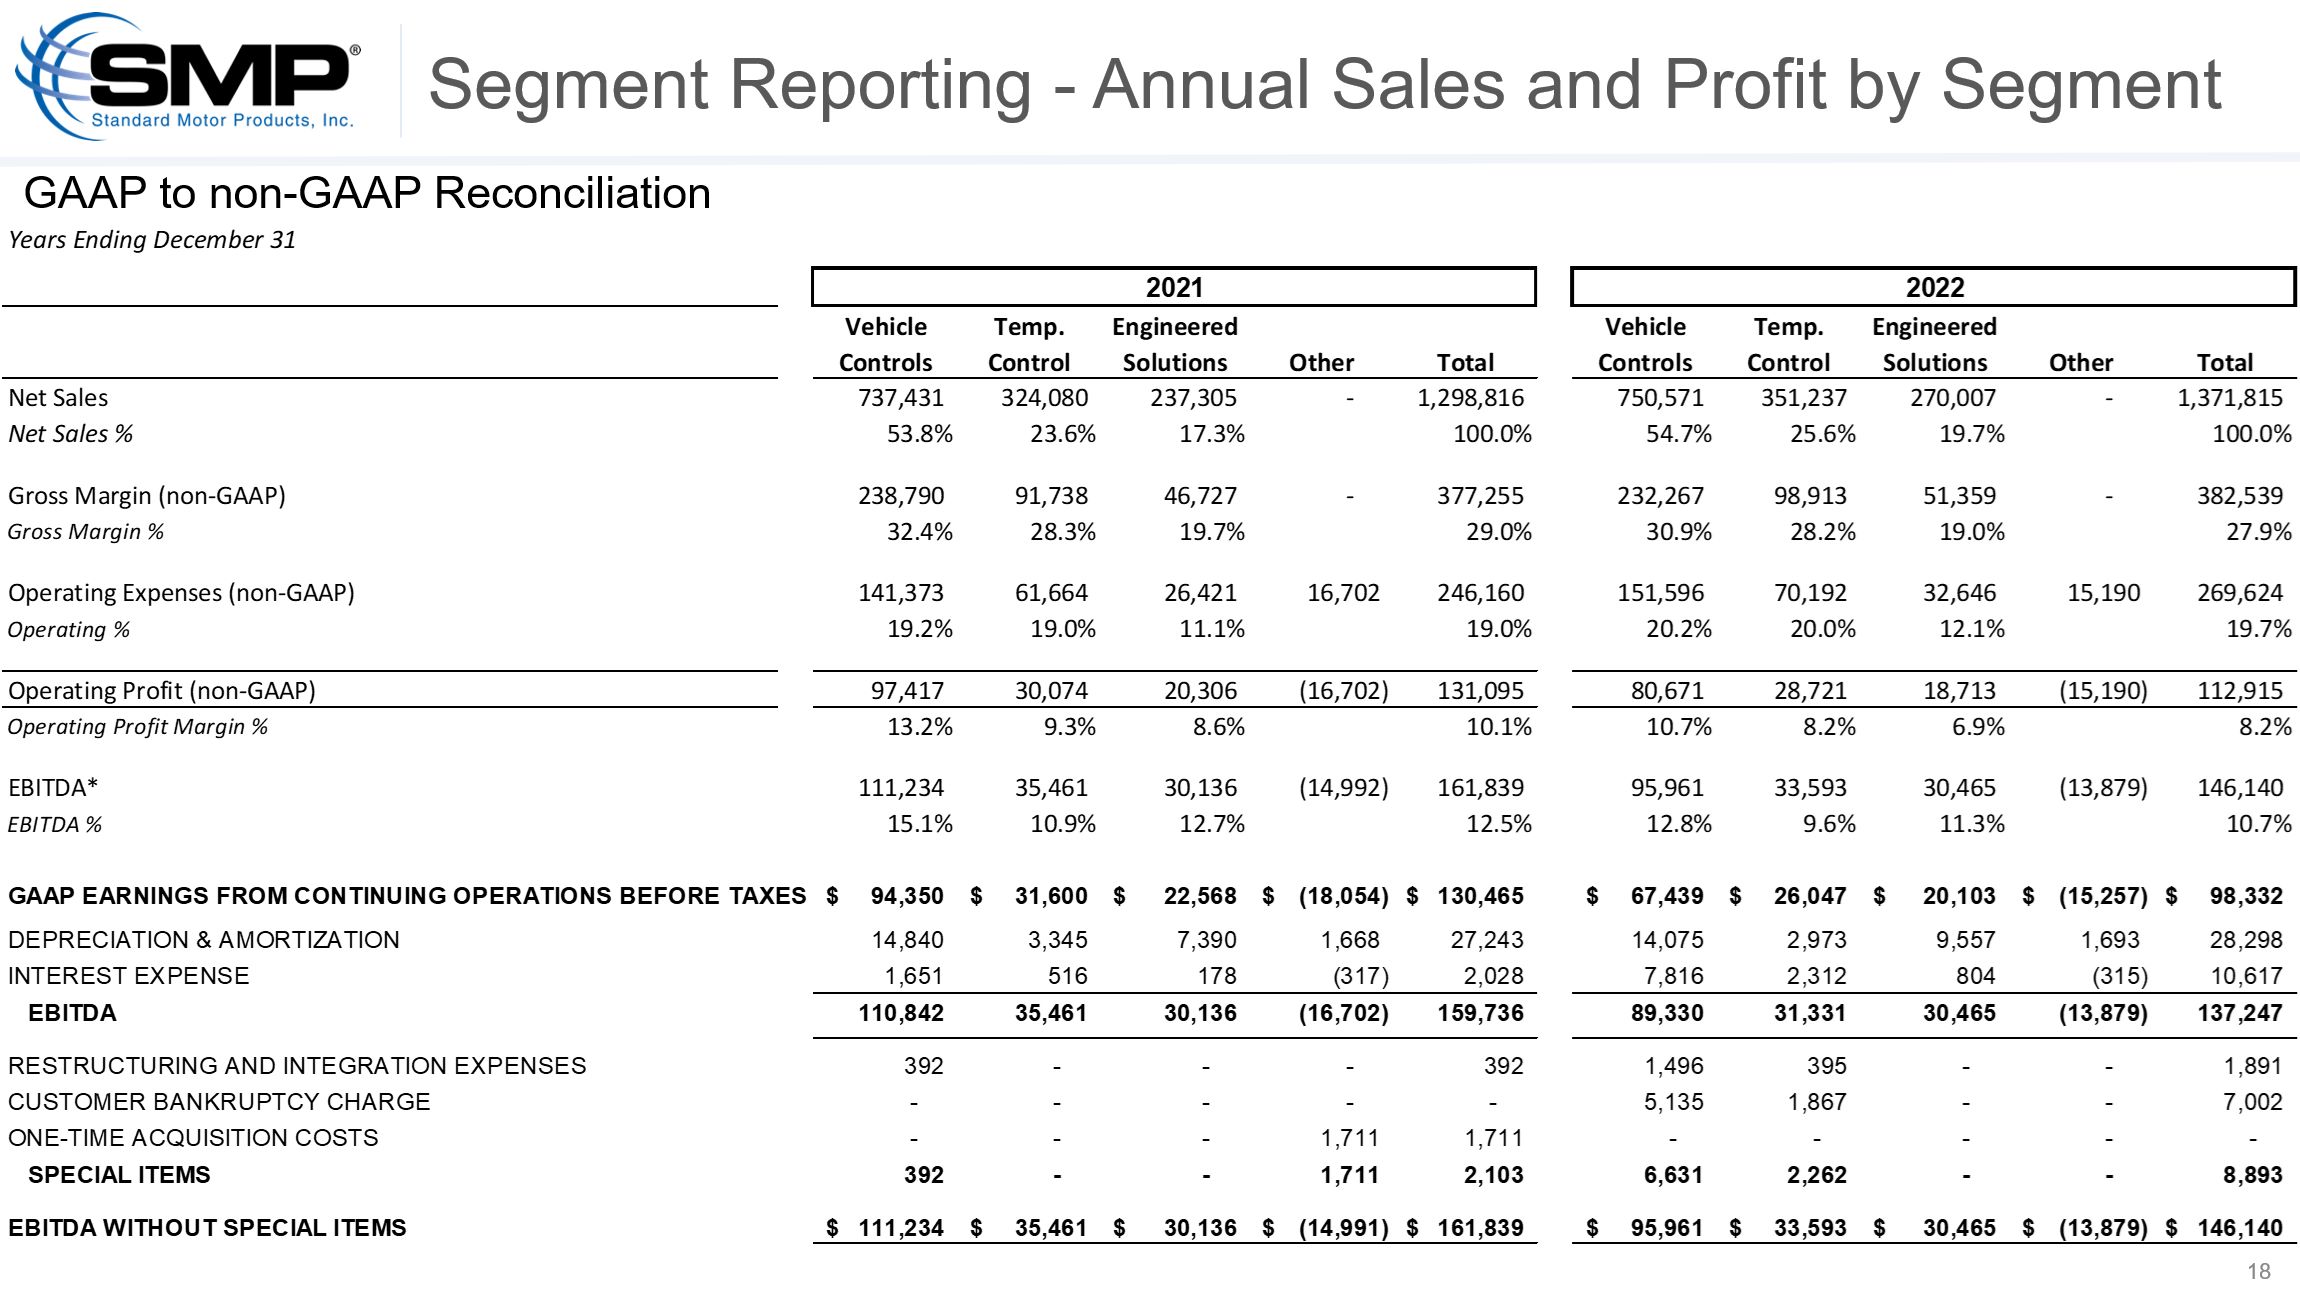
Consolidated operating profit for the full year, excluding non-operational gains and losses, finished at 8.2%, vs. 10.1% in 2021. As we’ve noted many times, 2021 was an
anomaly year with many non-recurring benefits associated with emerging from COVID lockdowns while still operating in a very low interest rate environment. Our operating profit of 8.2% was more in line with historical trends despite incurring an
additional $20.6 million of customer factoring costs, which negatively affected operating profit by 150 basis points as compared to 2021.
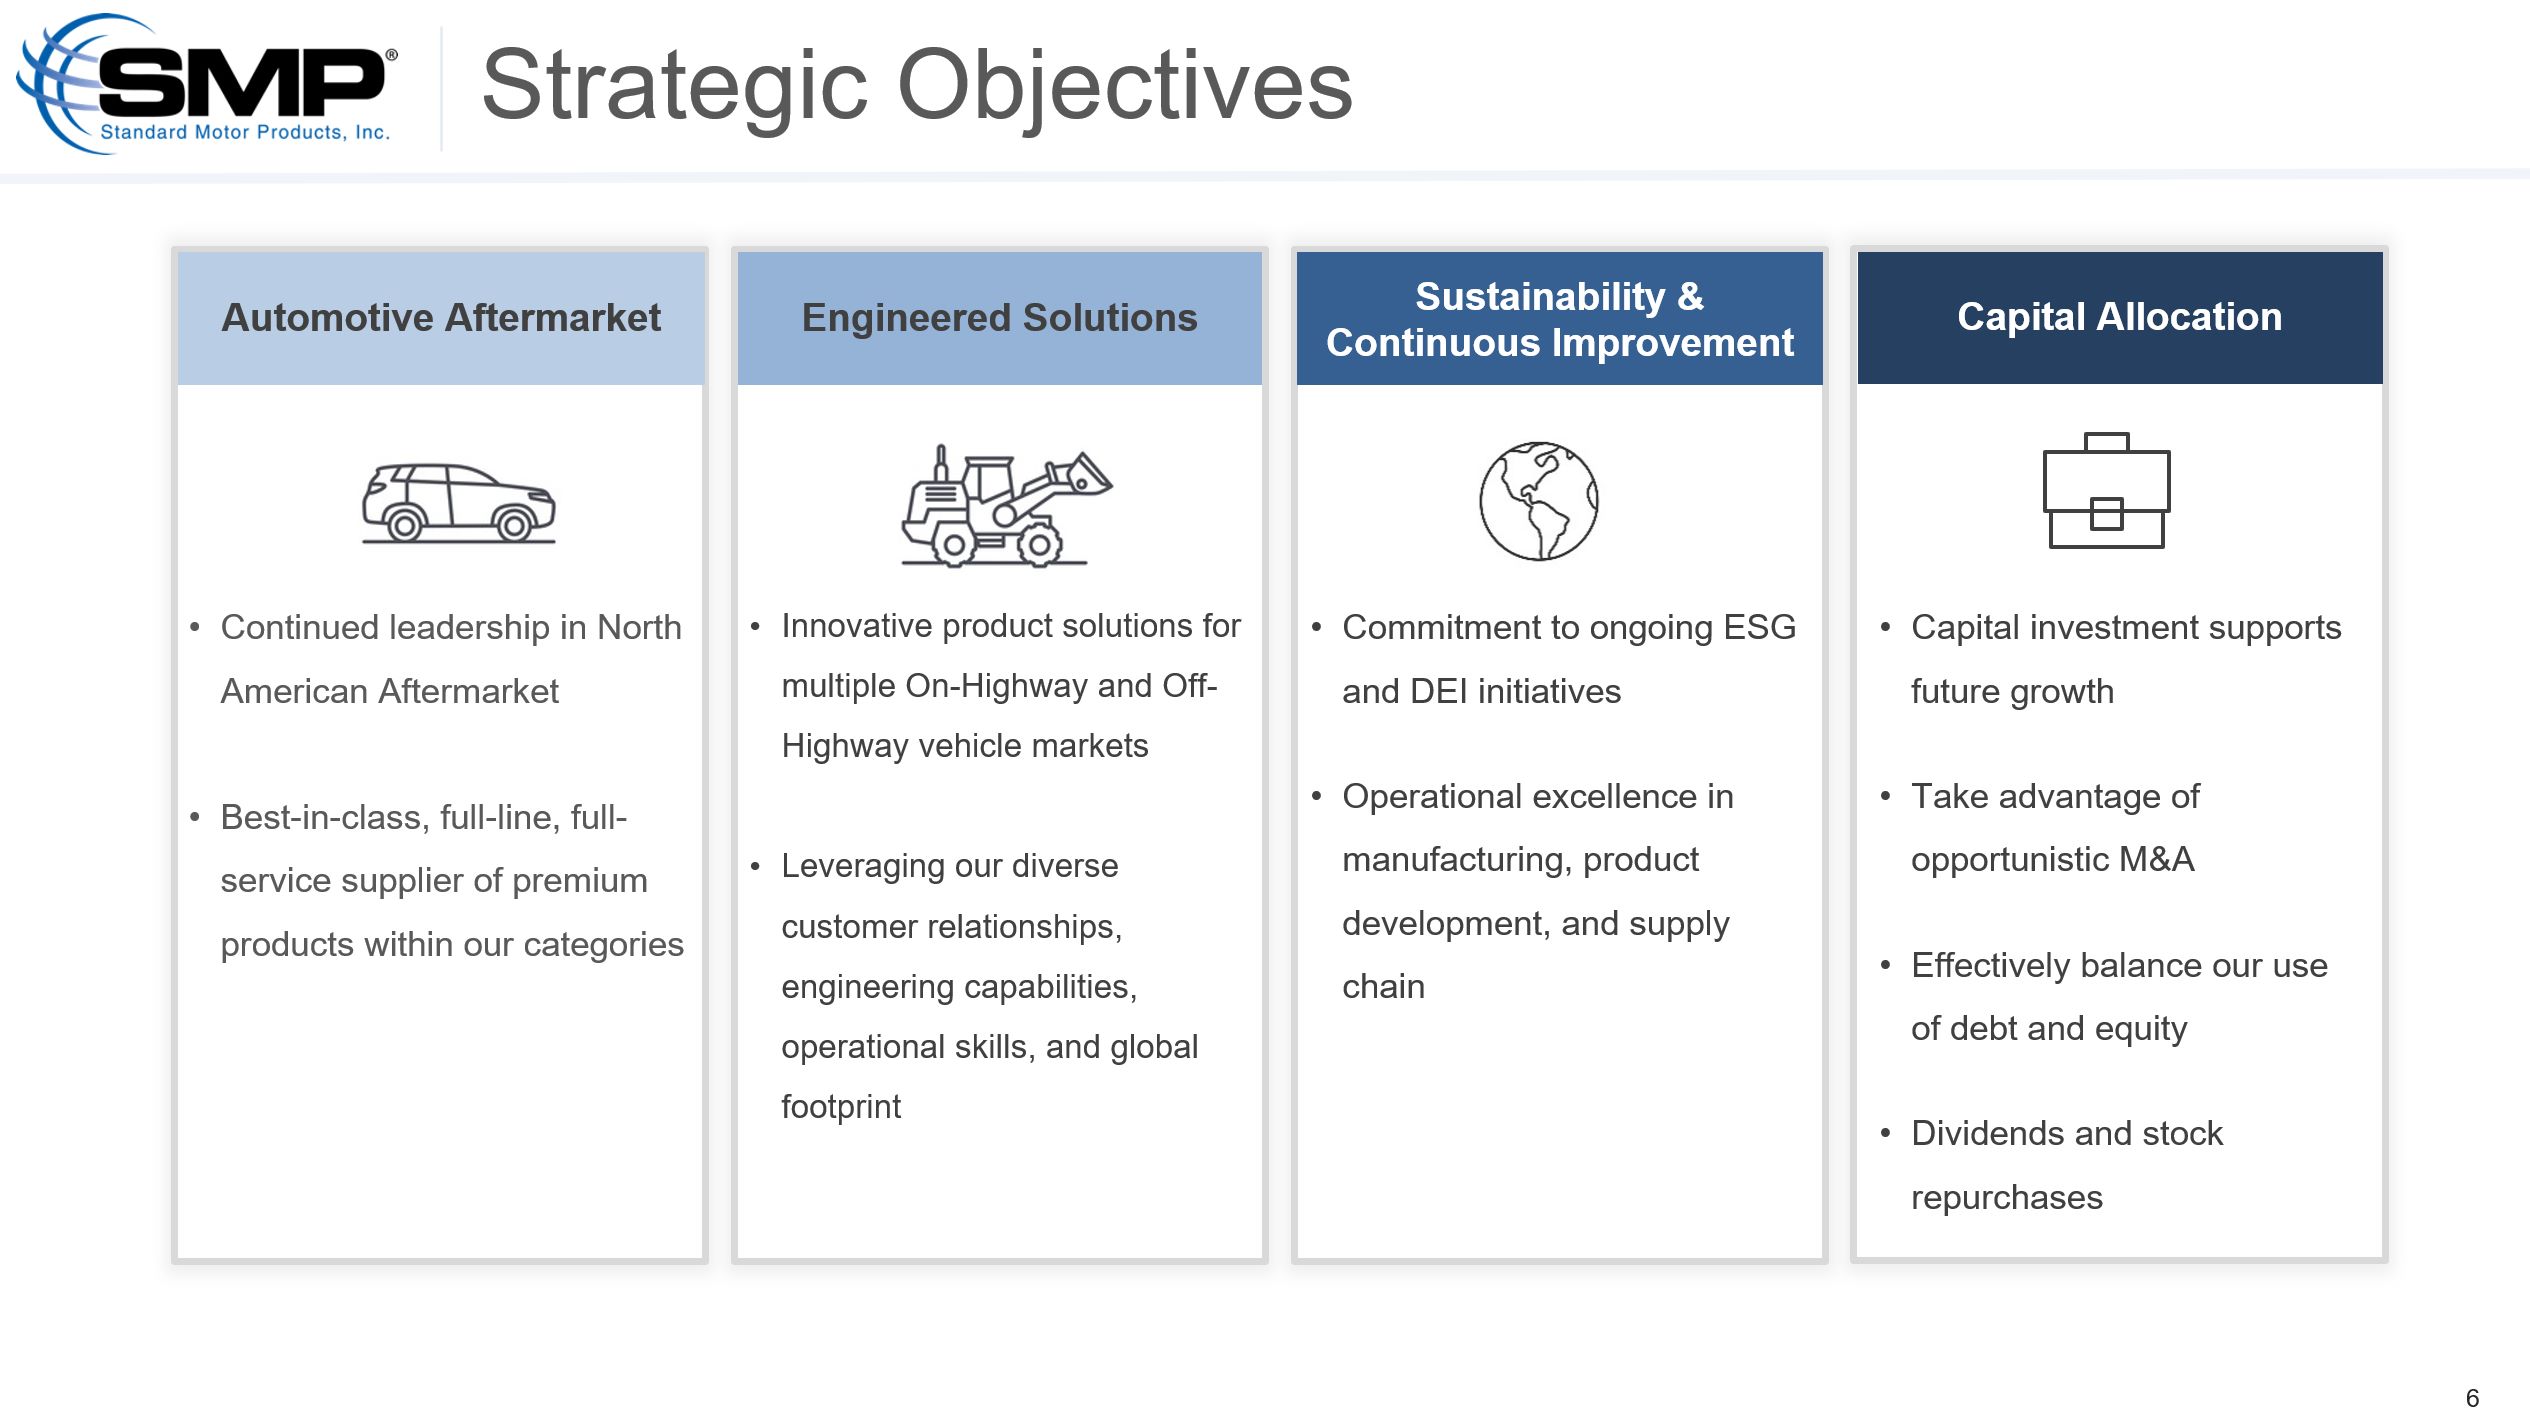
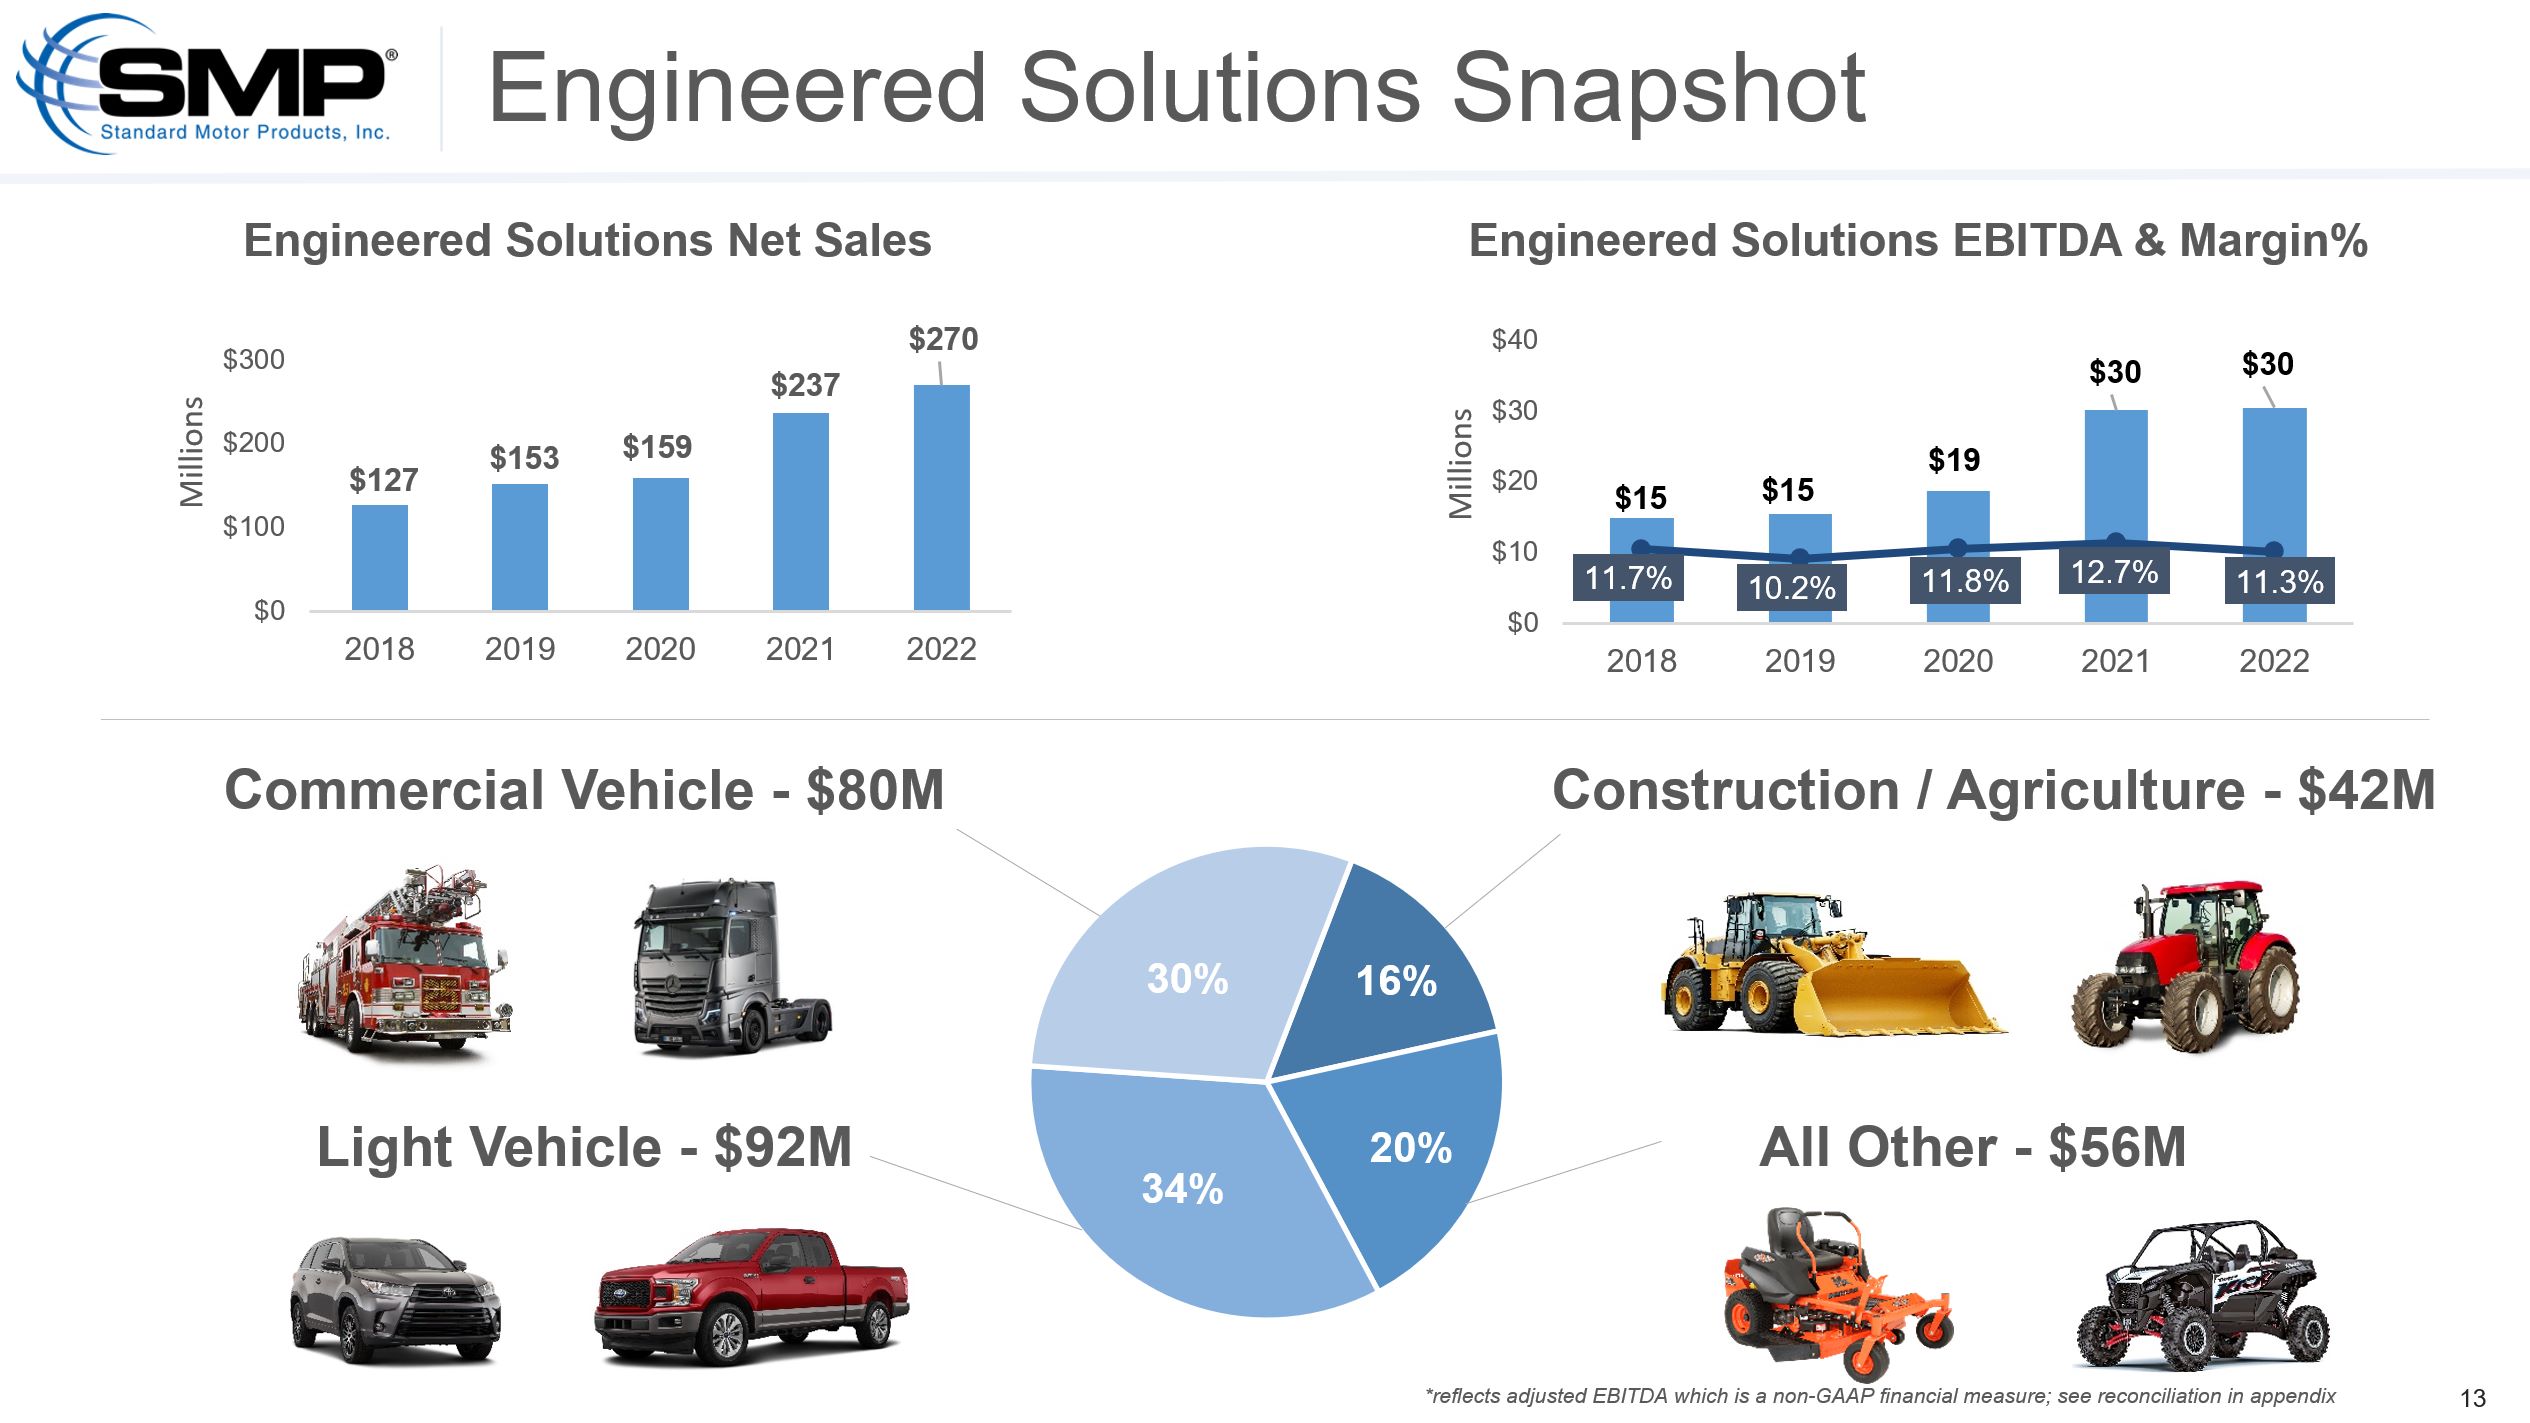
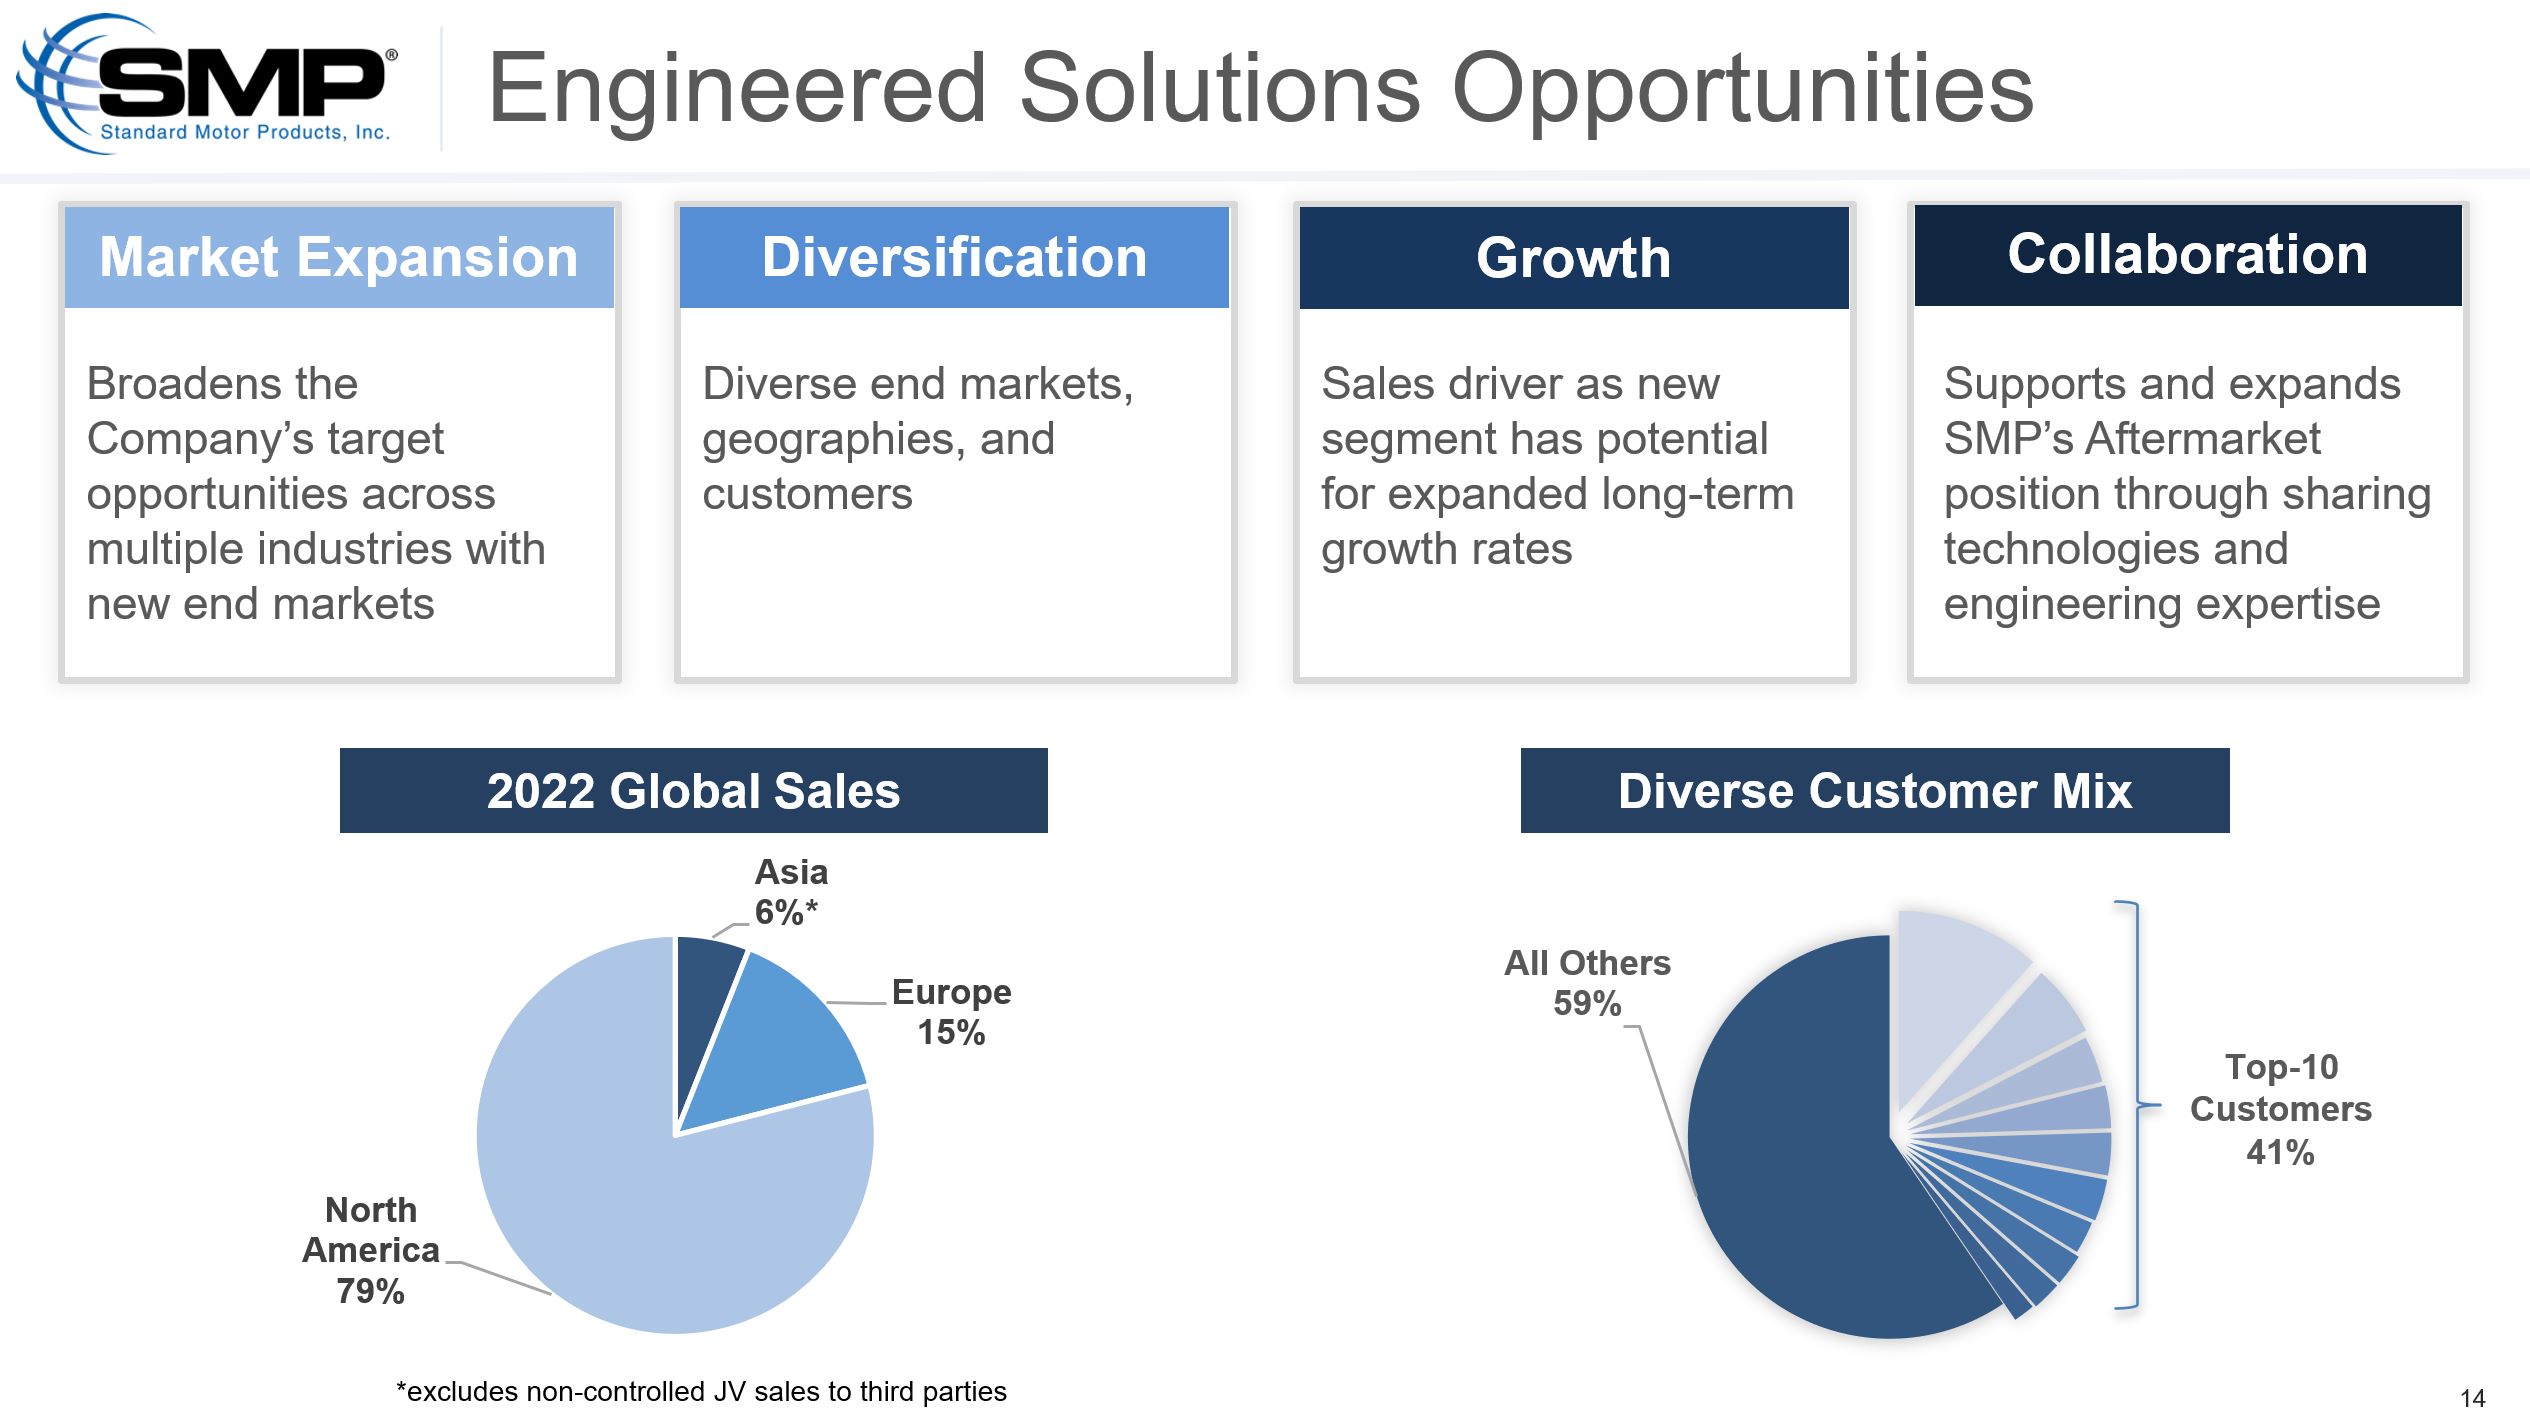
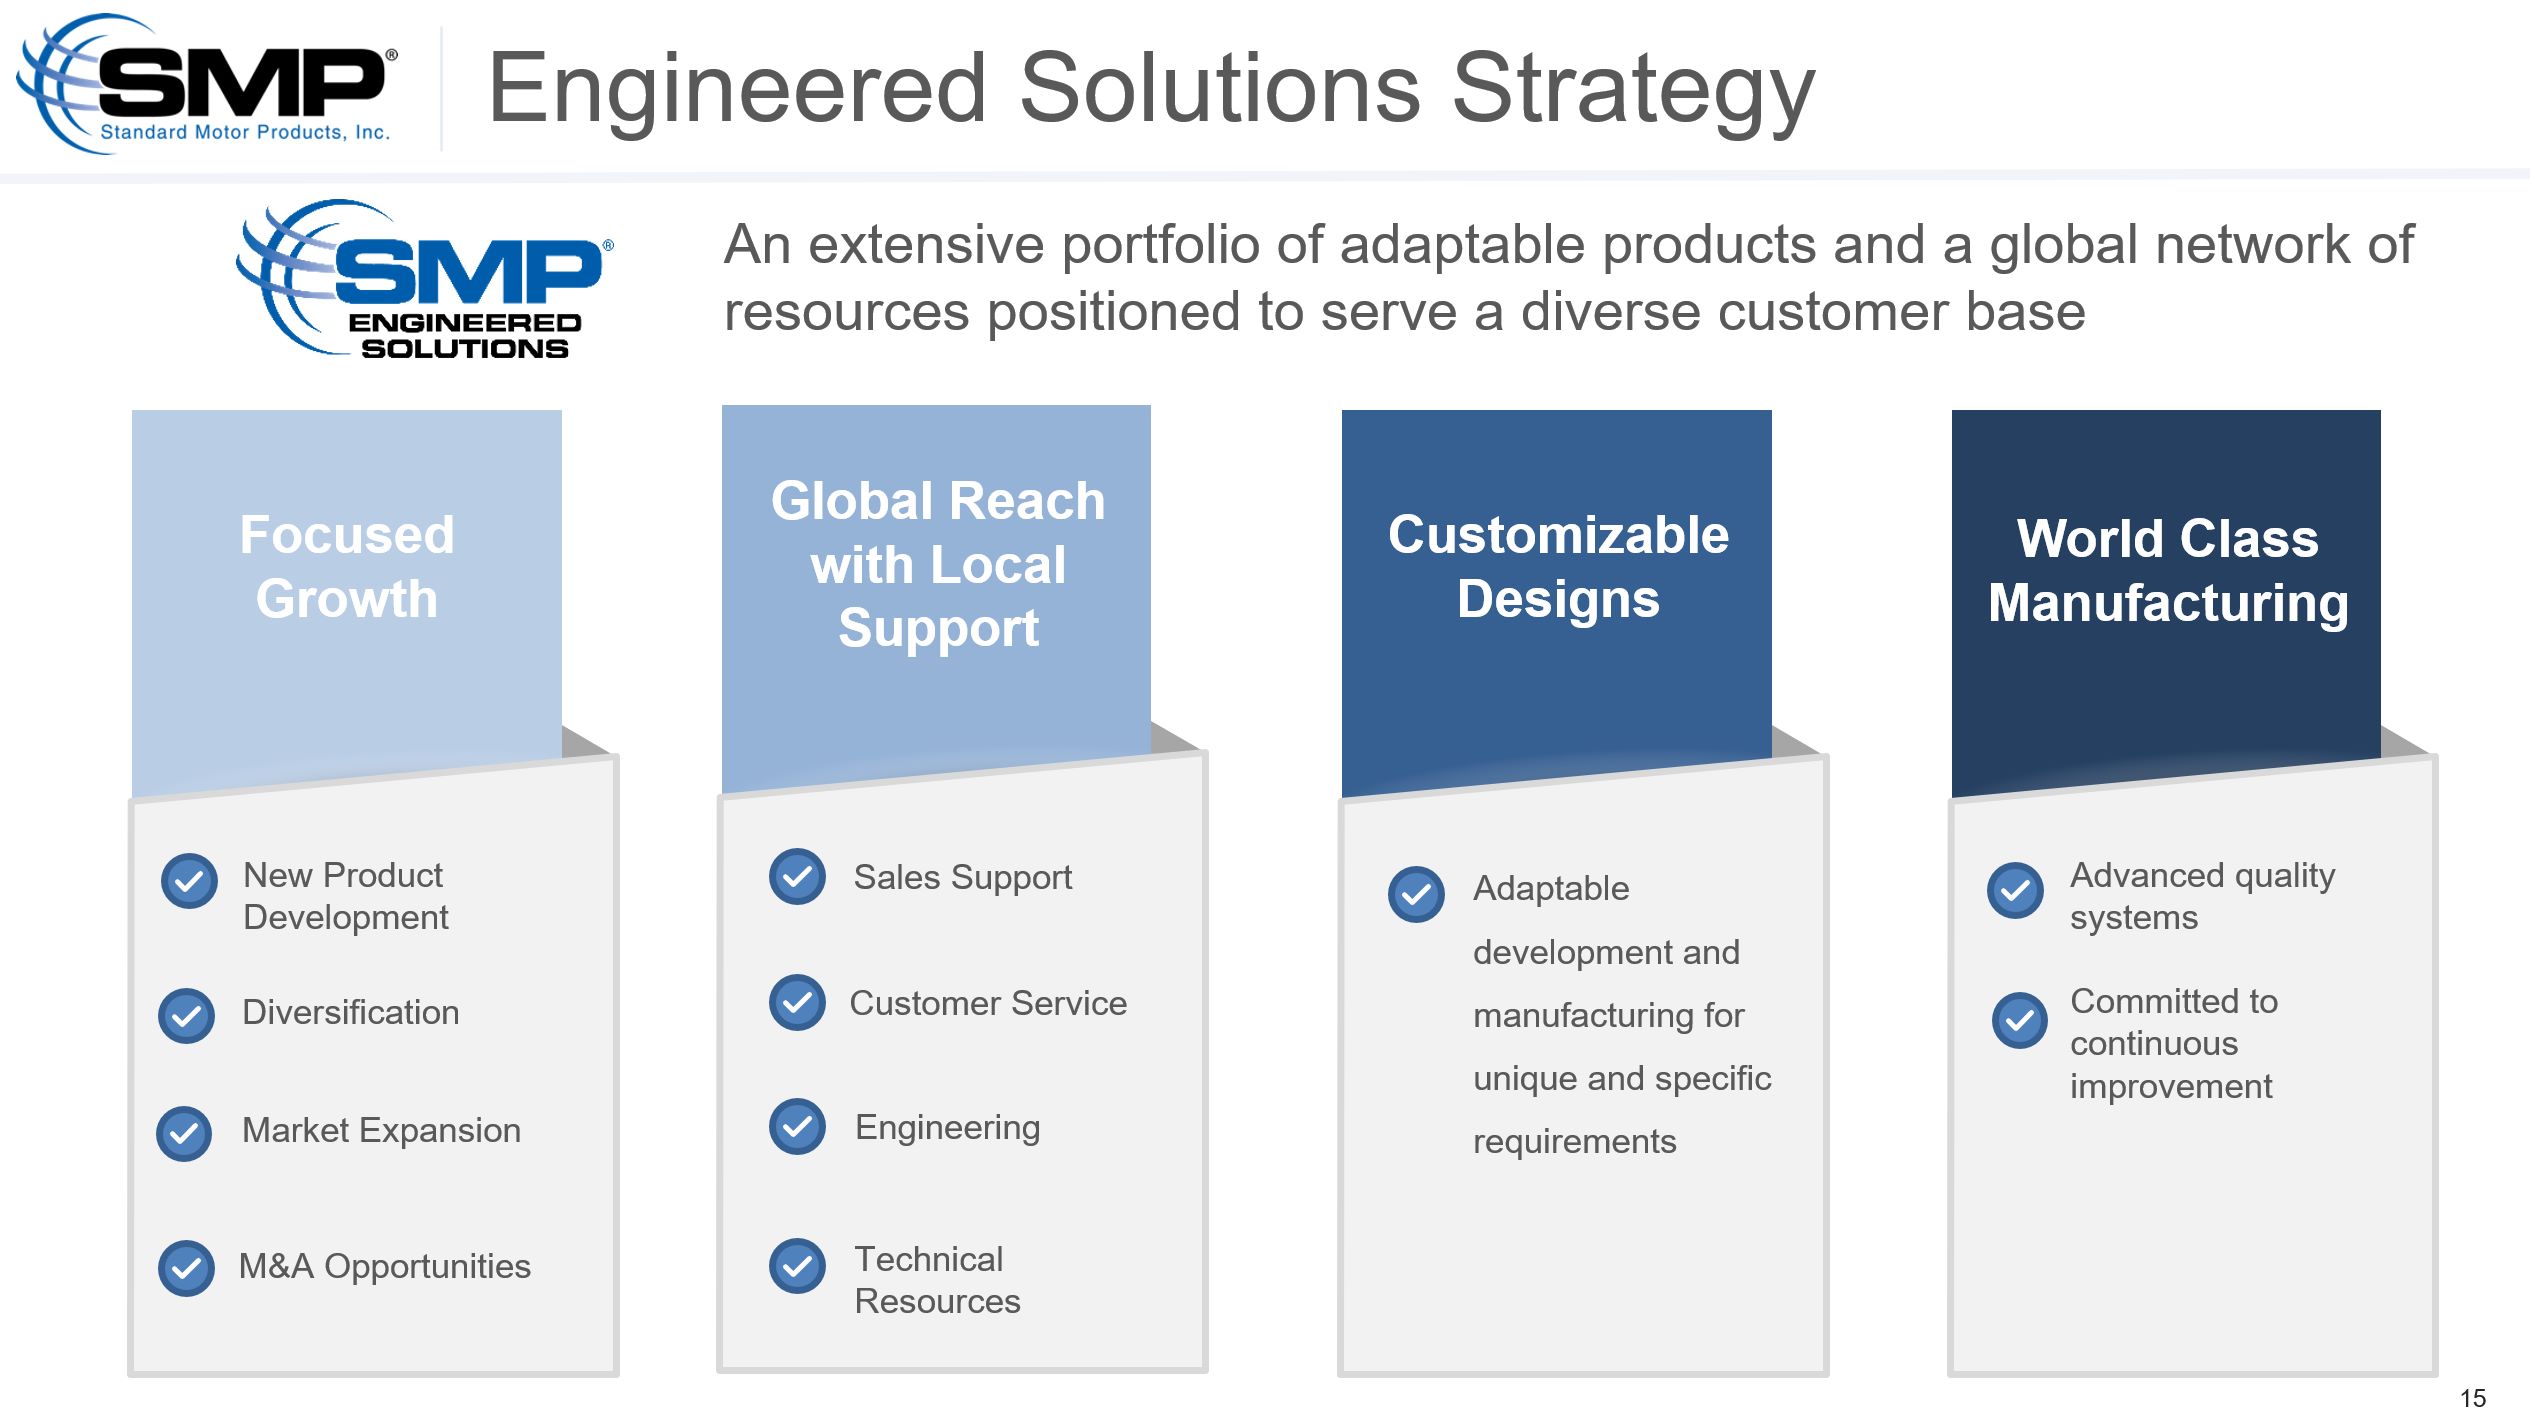
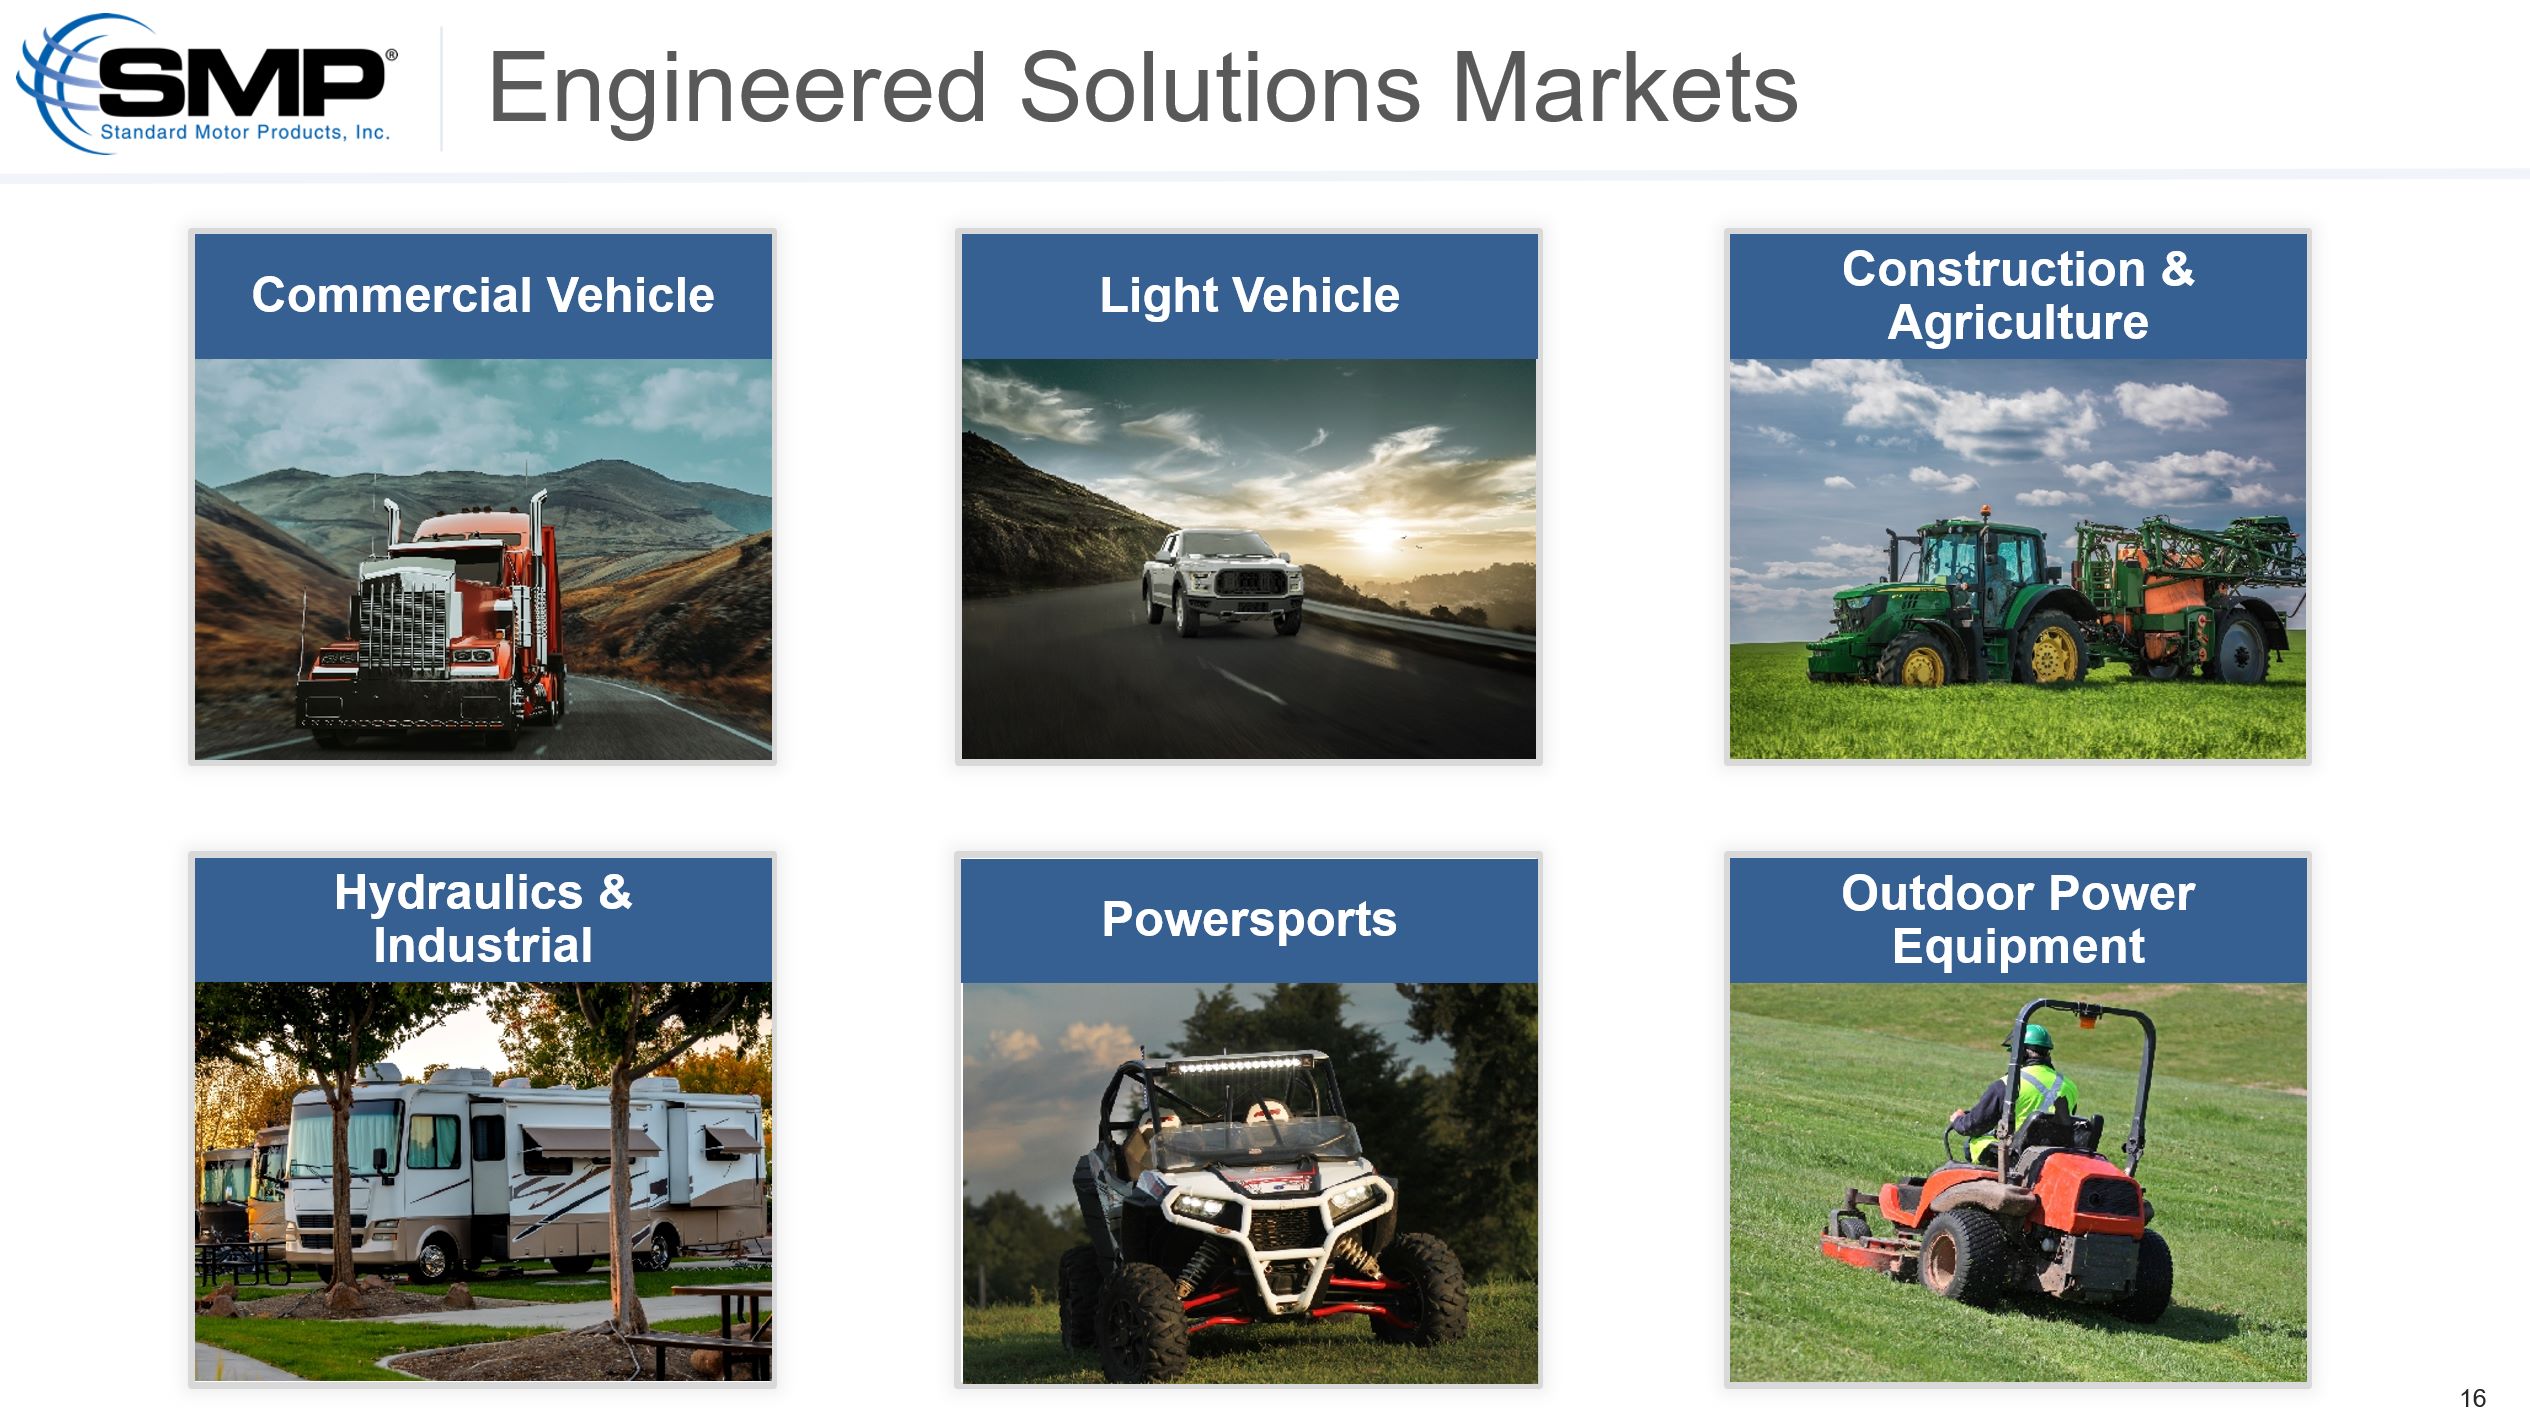
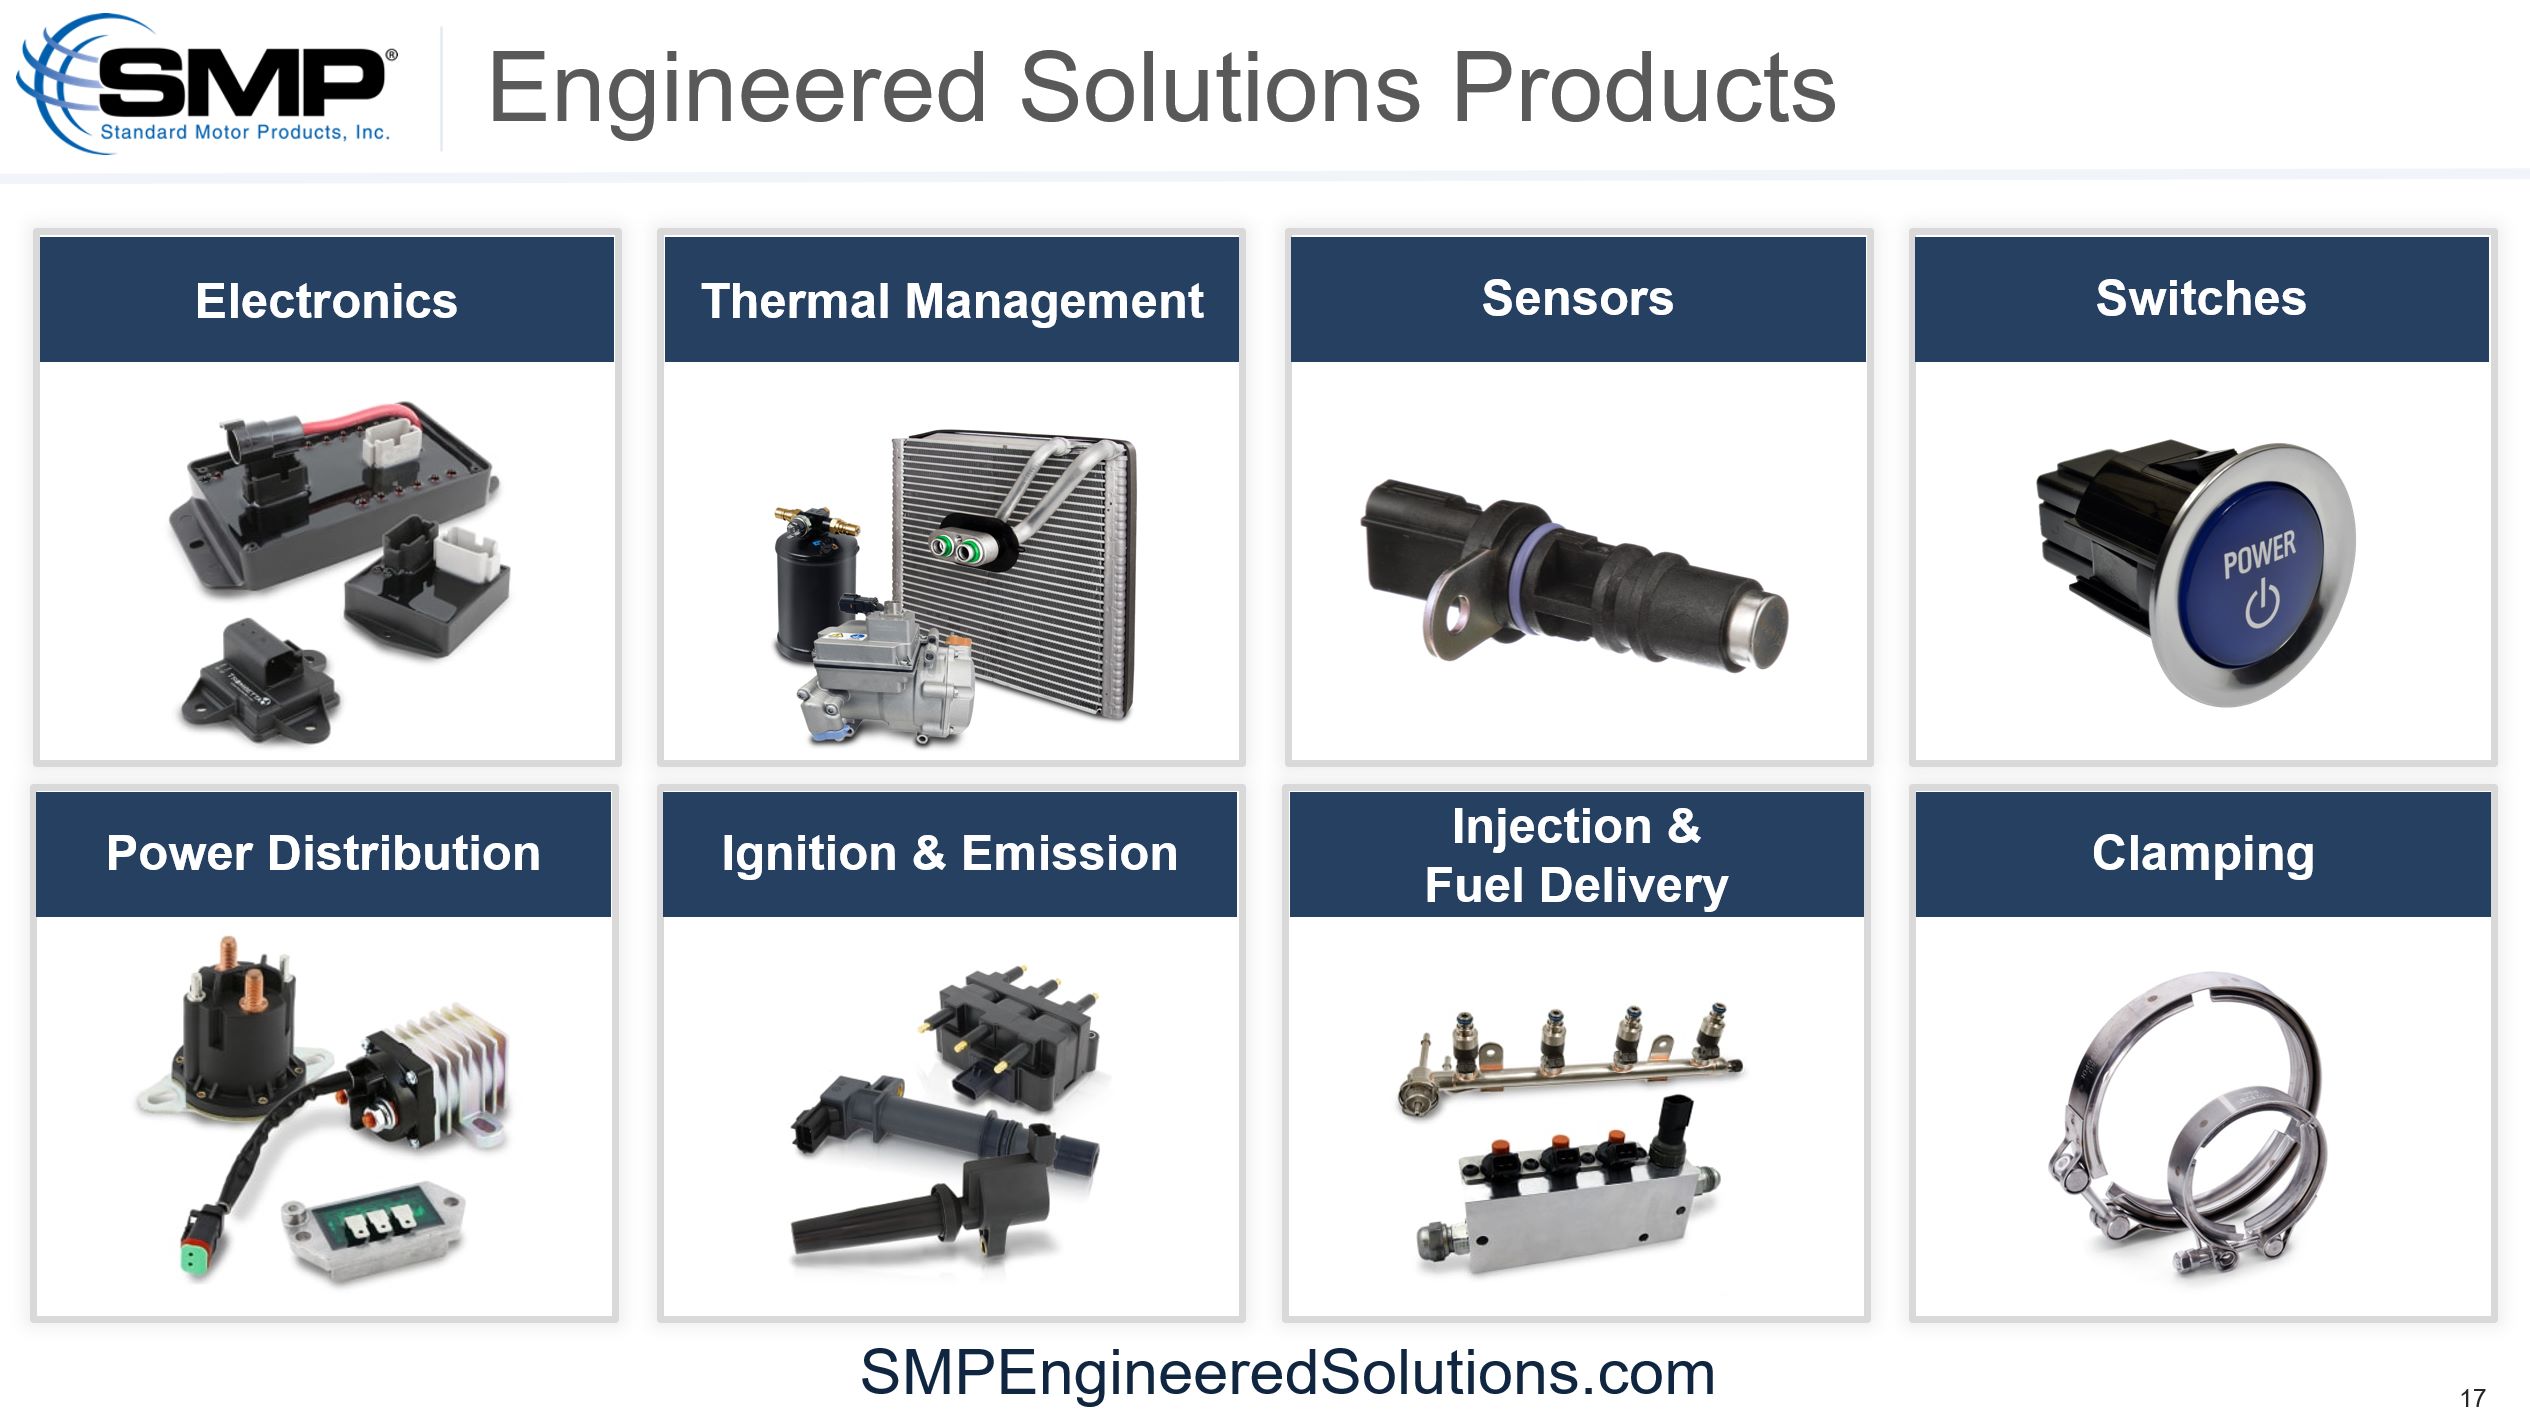
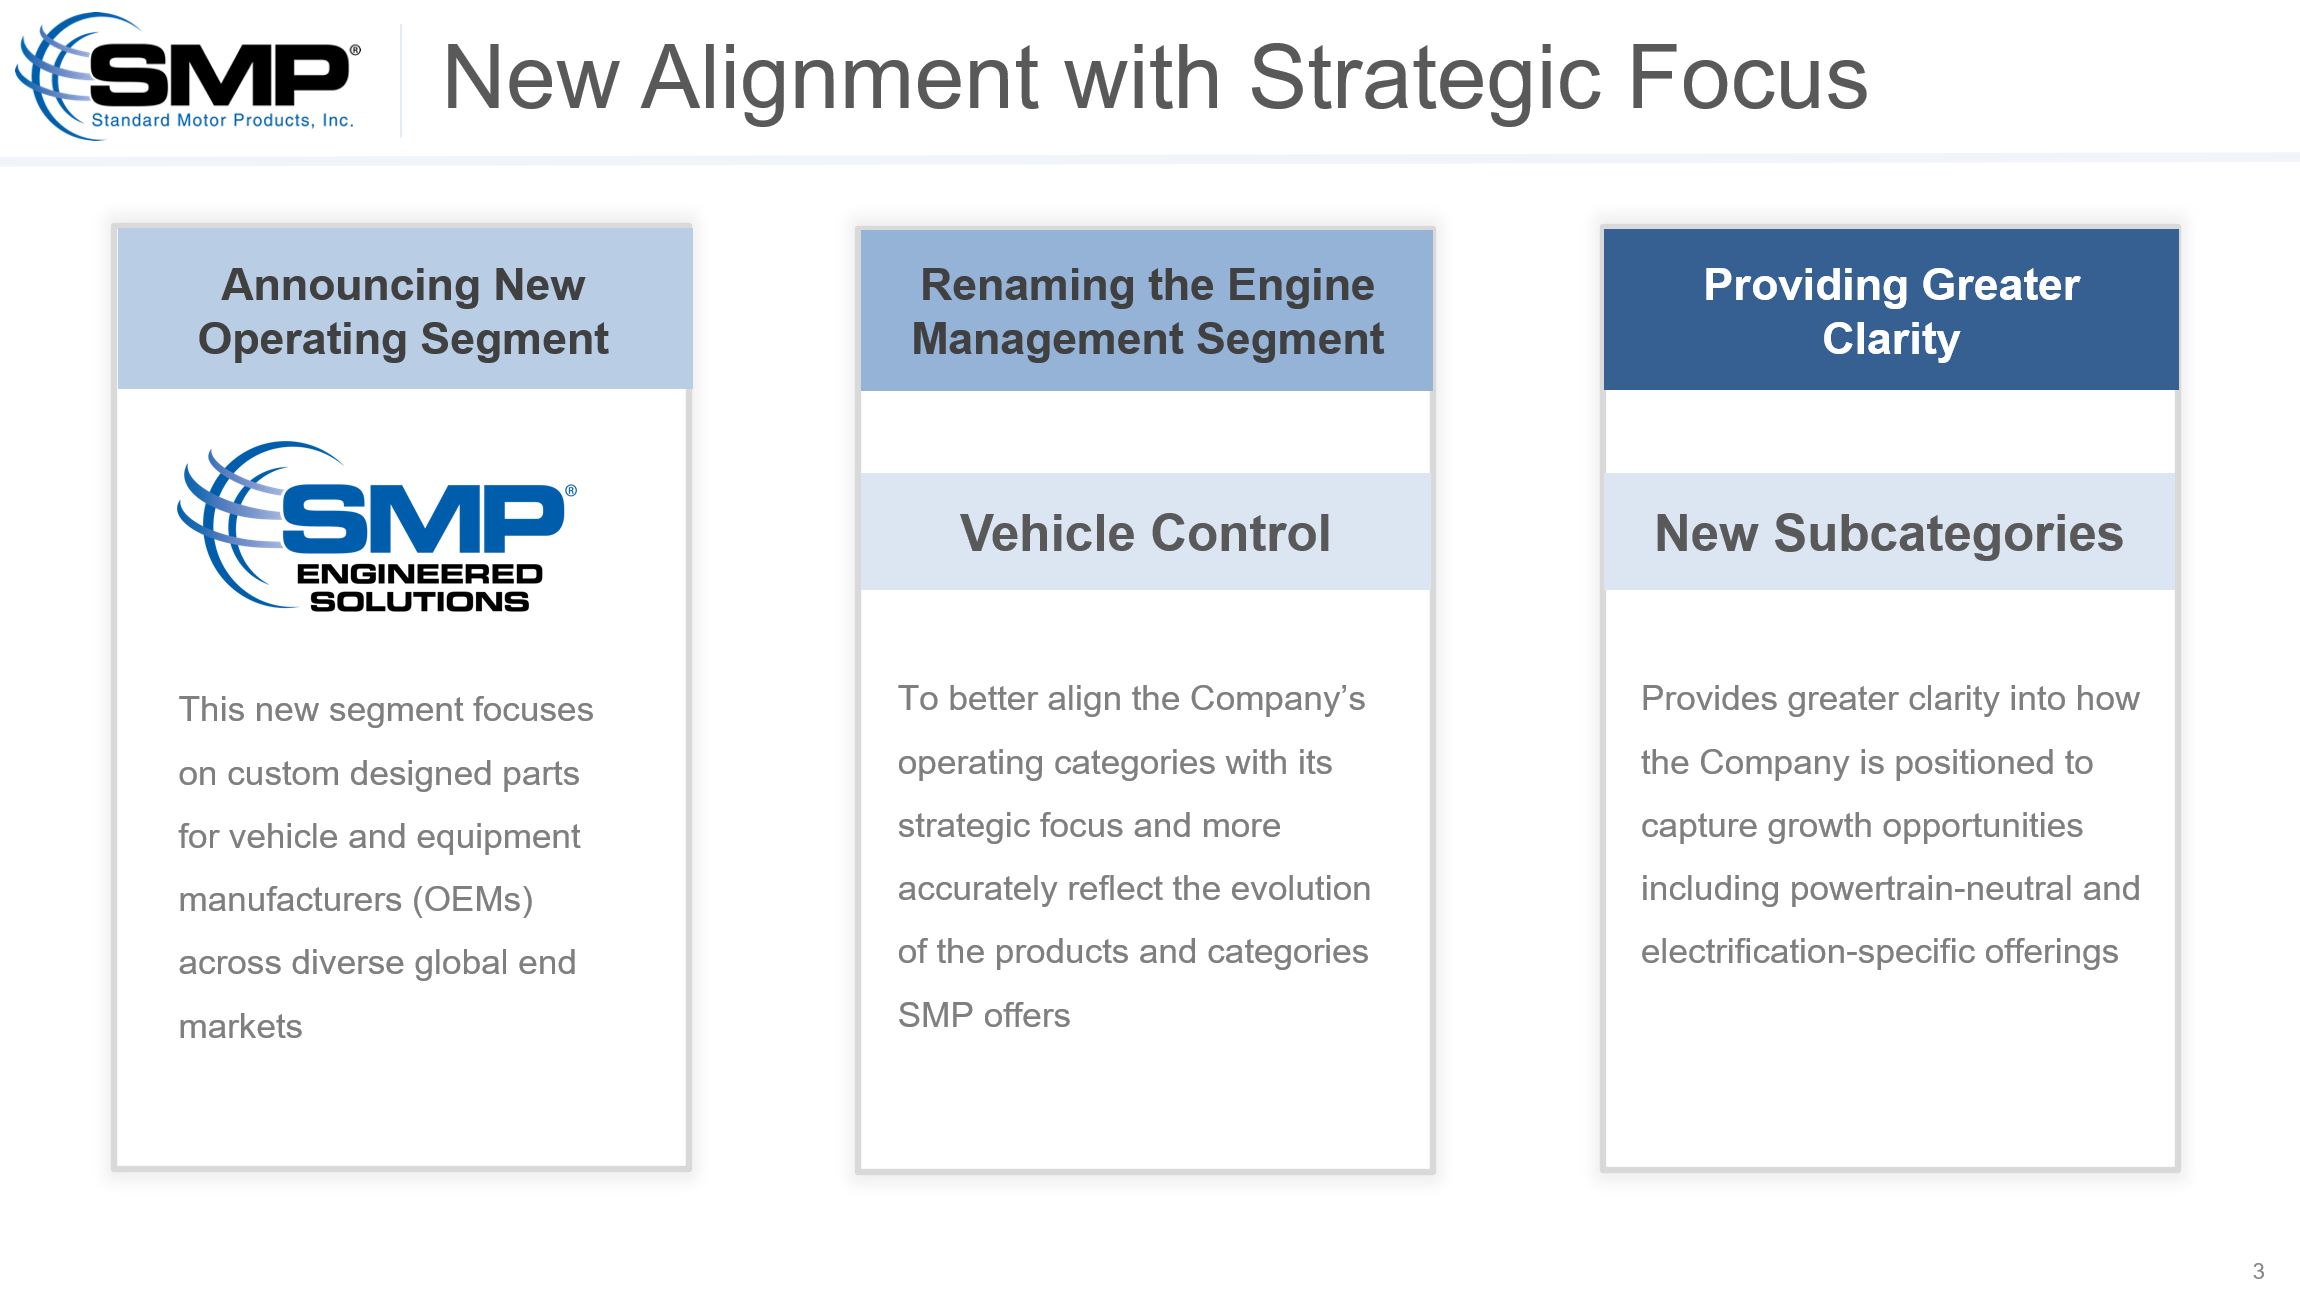
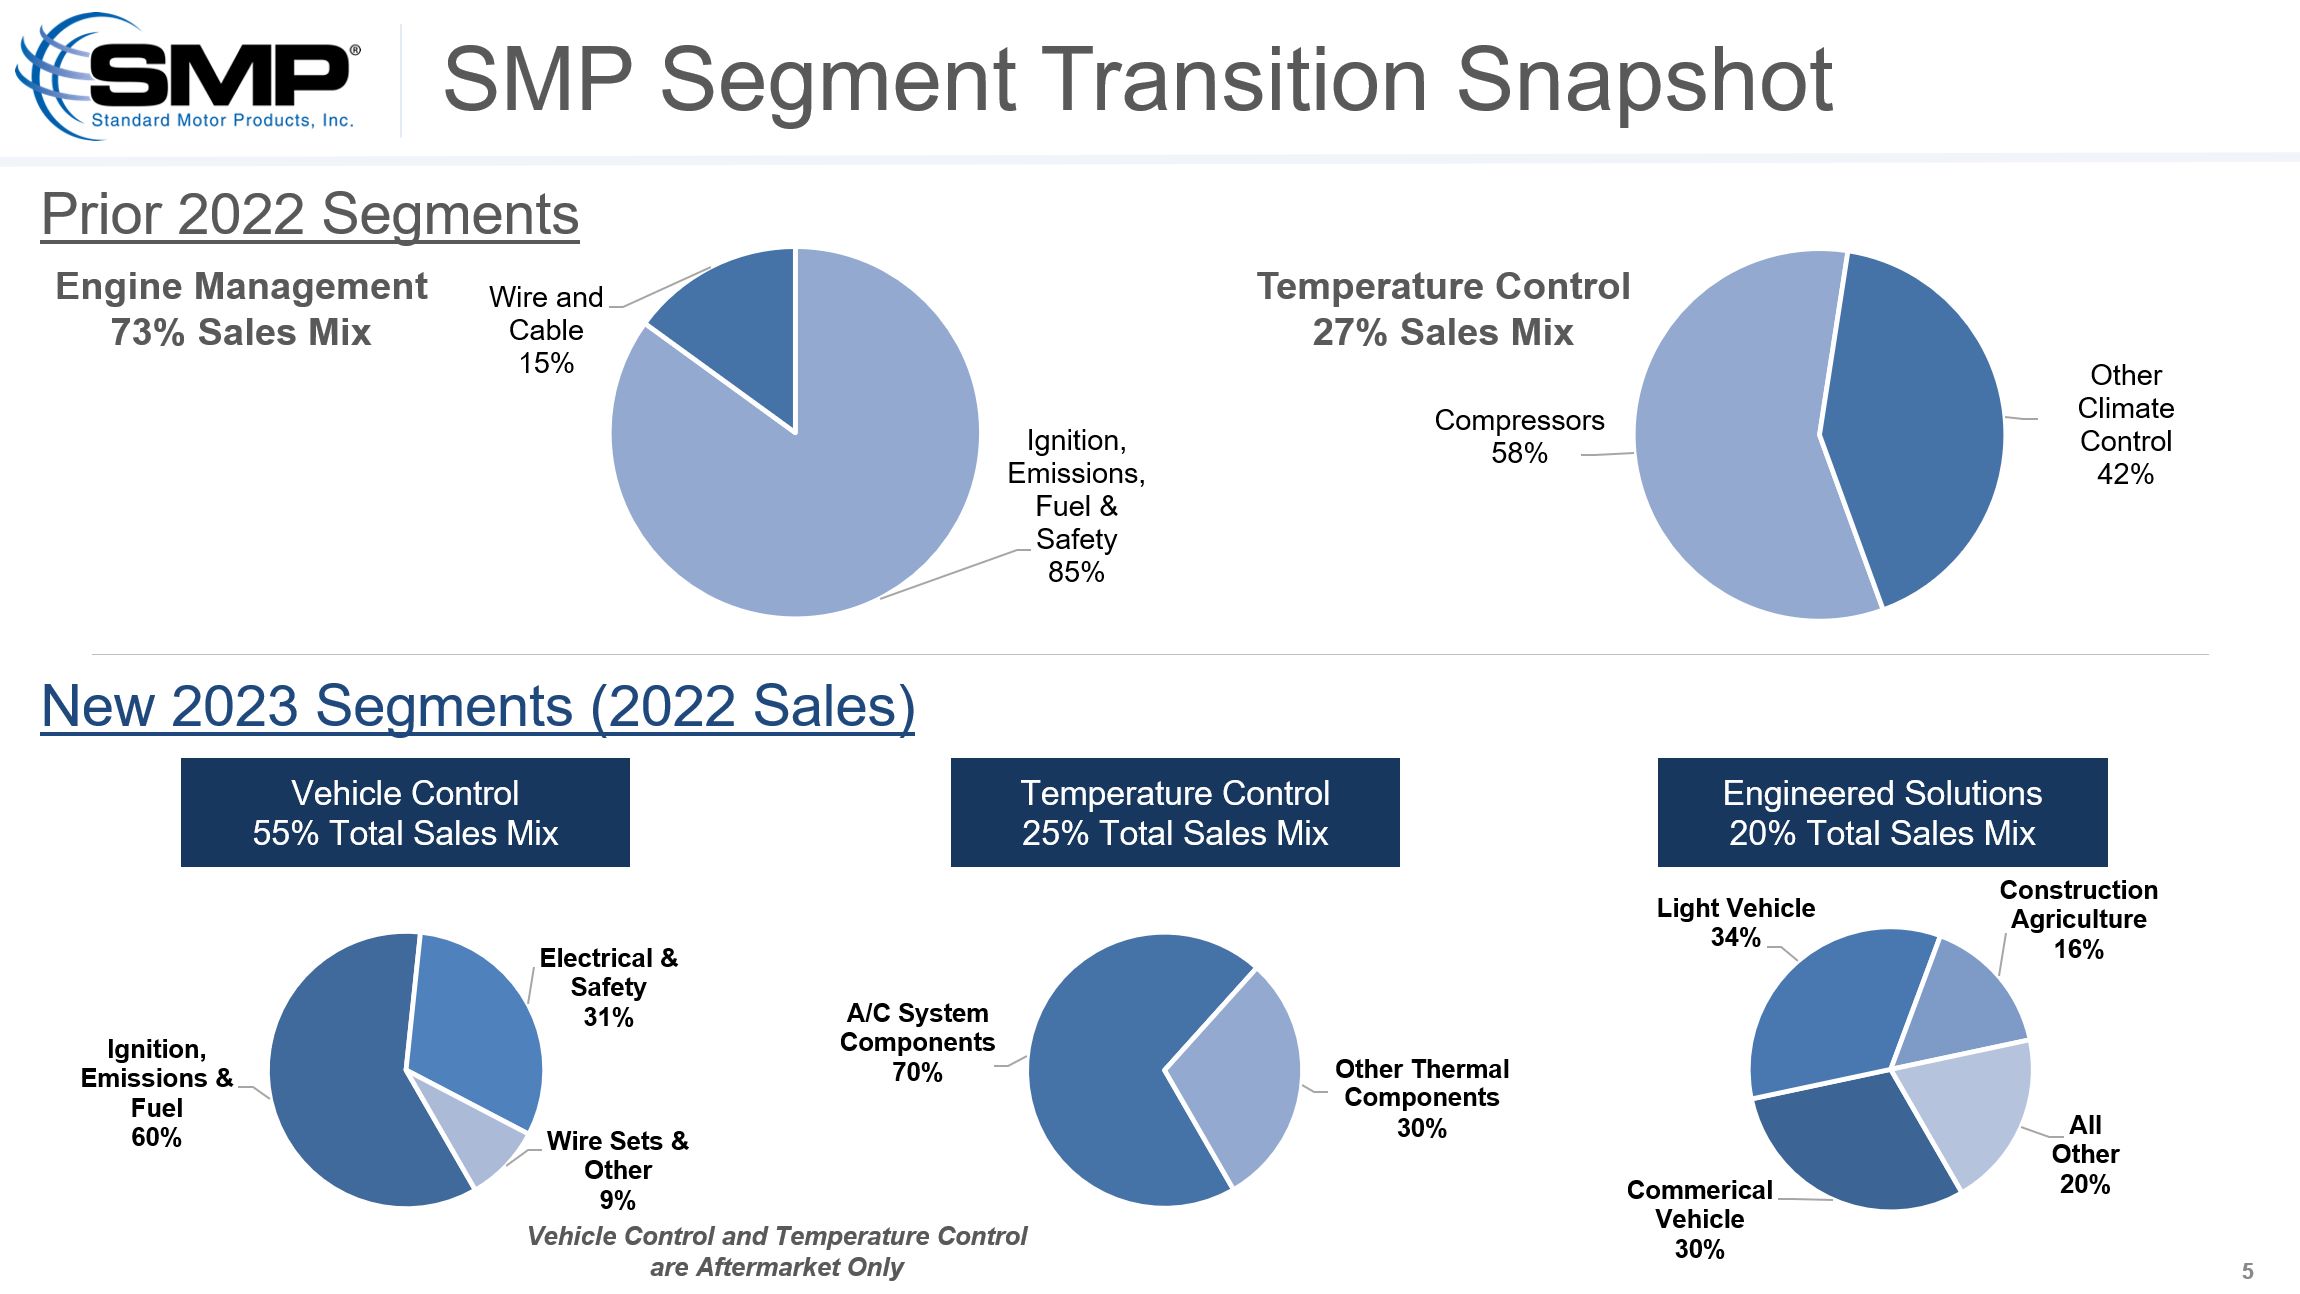
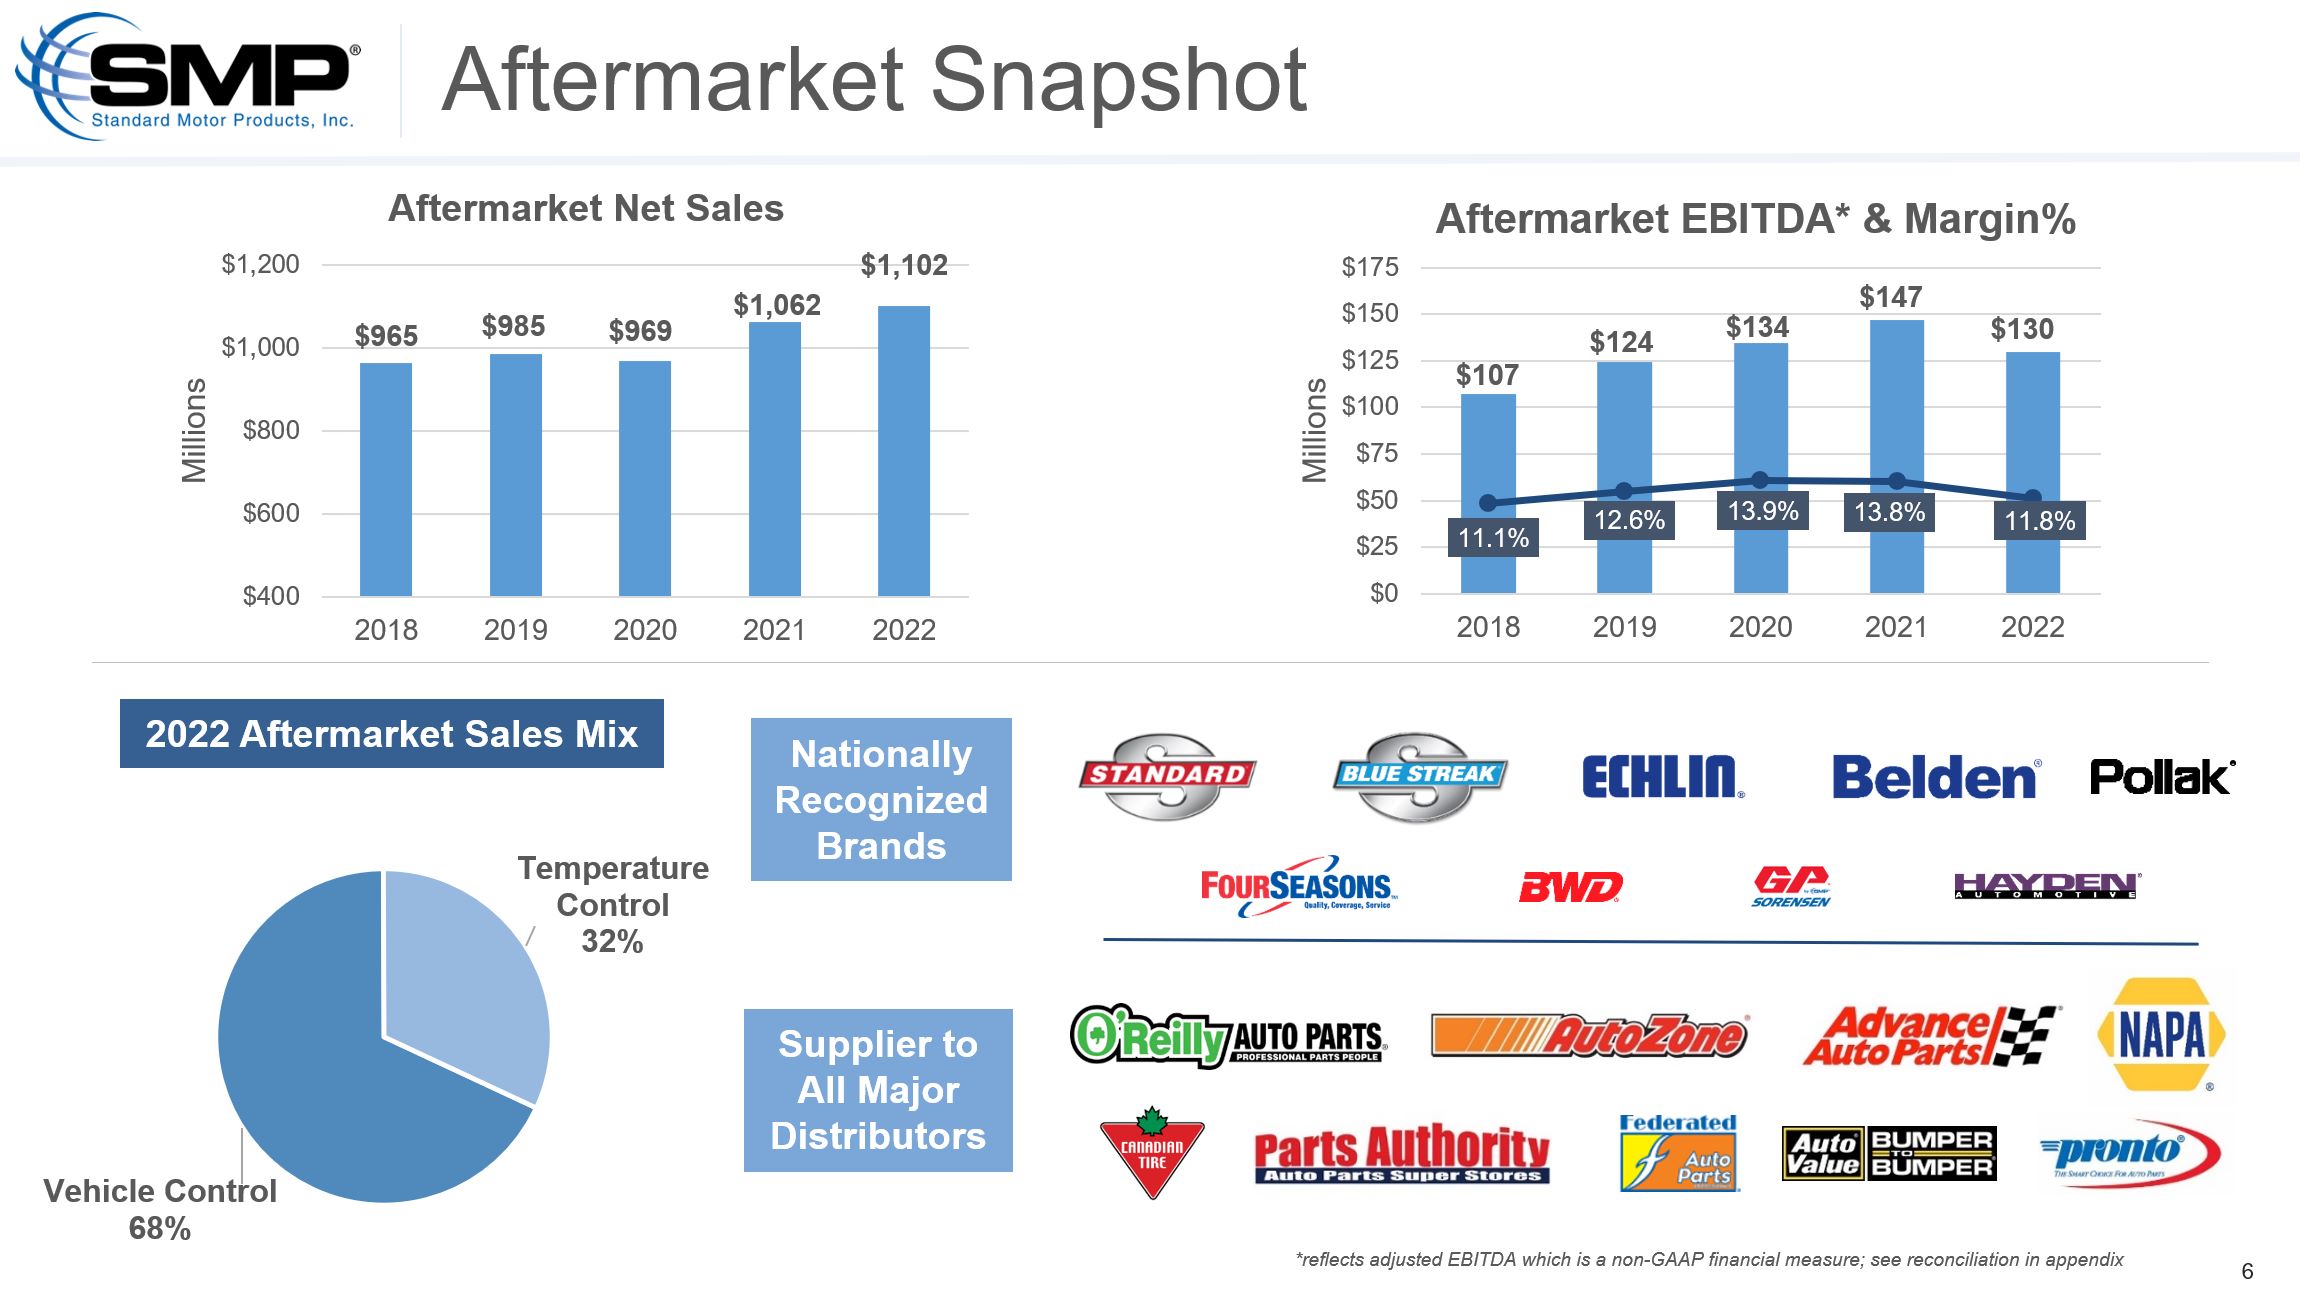
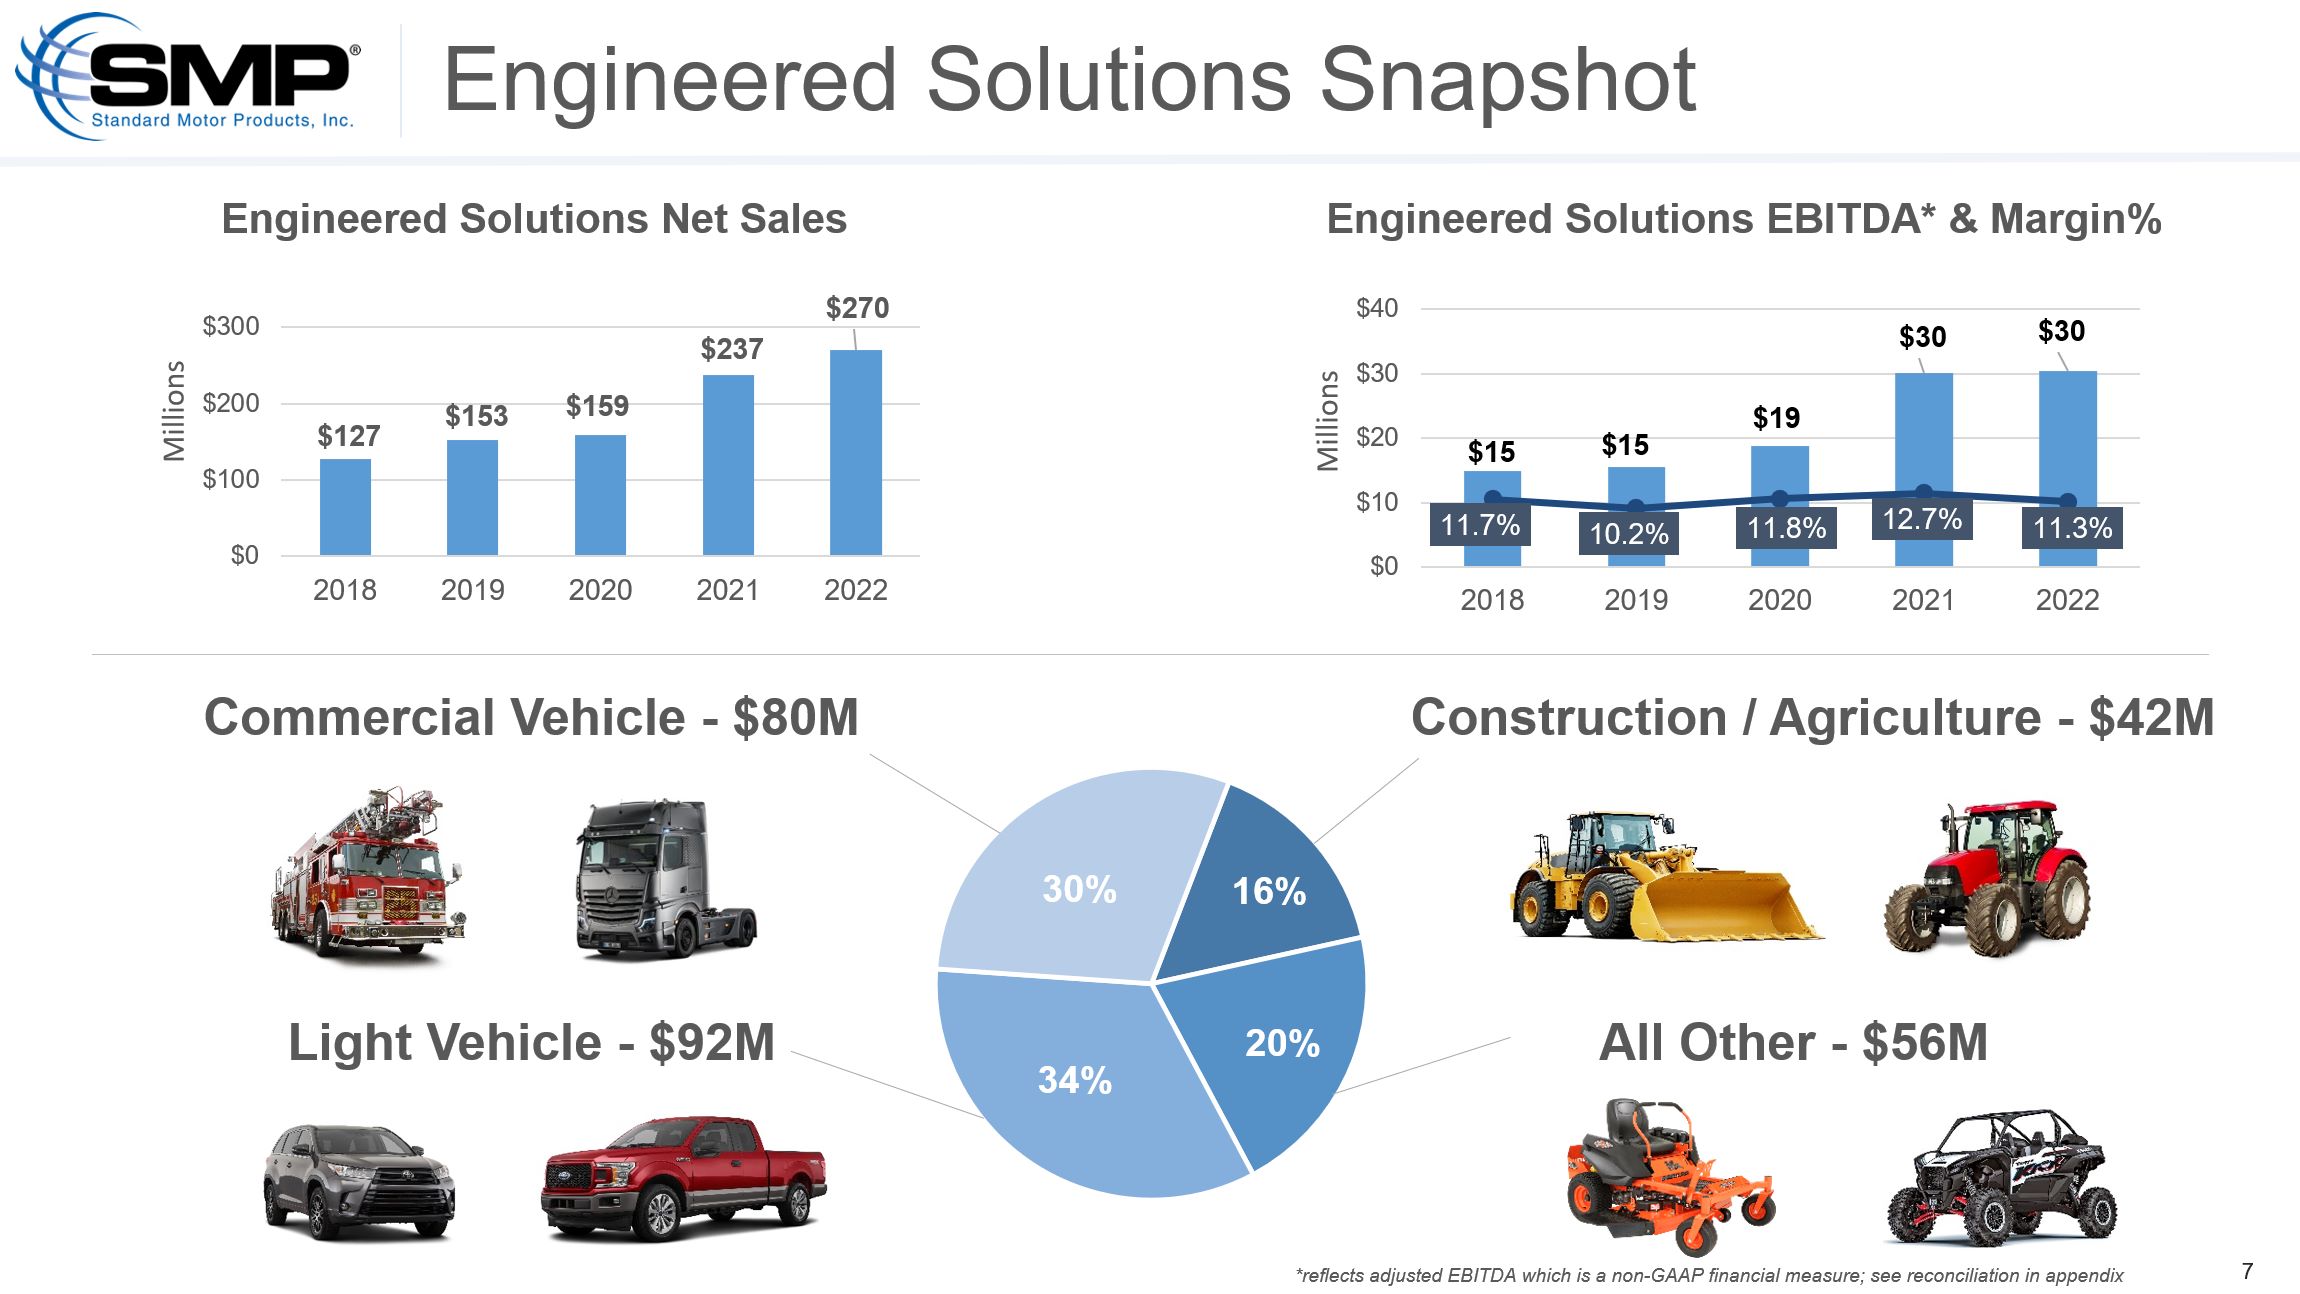
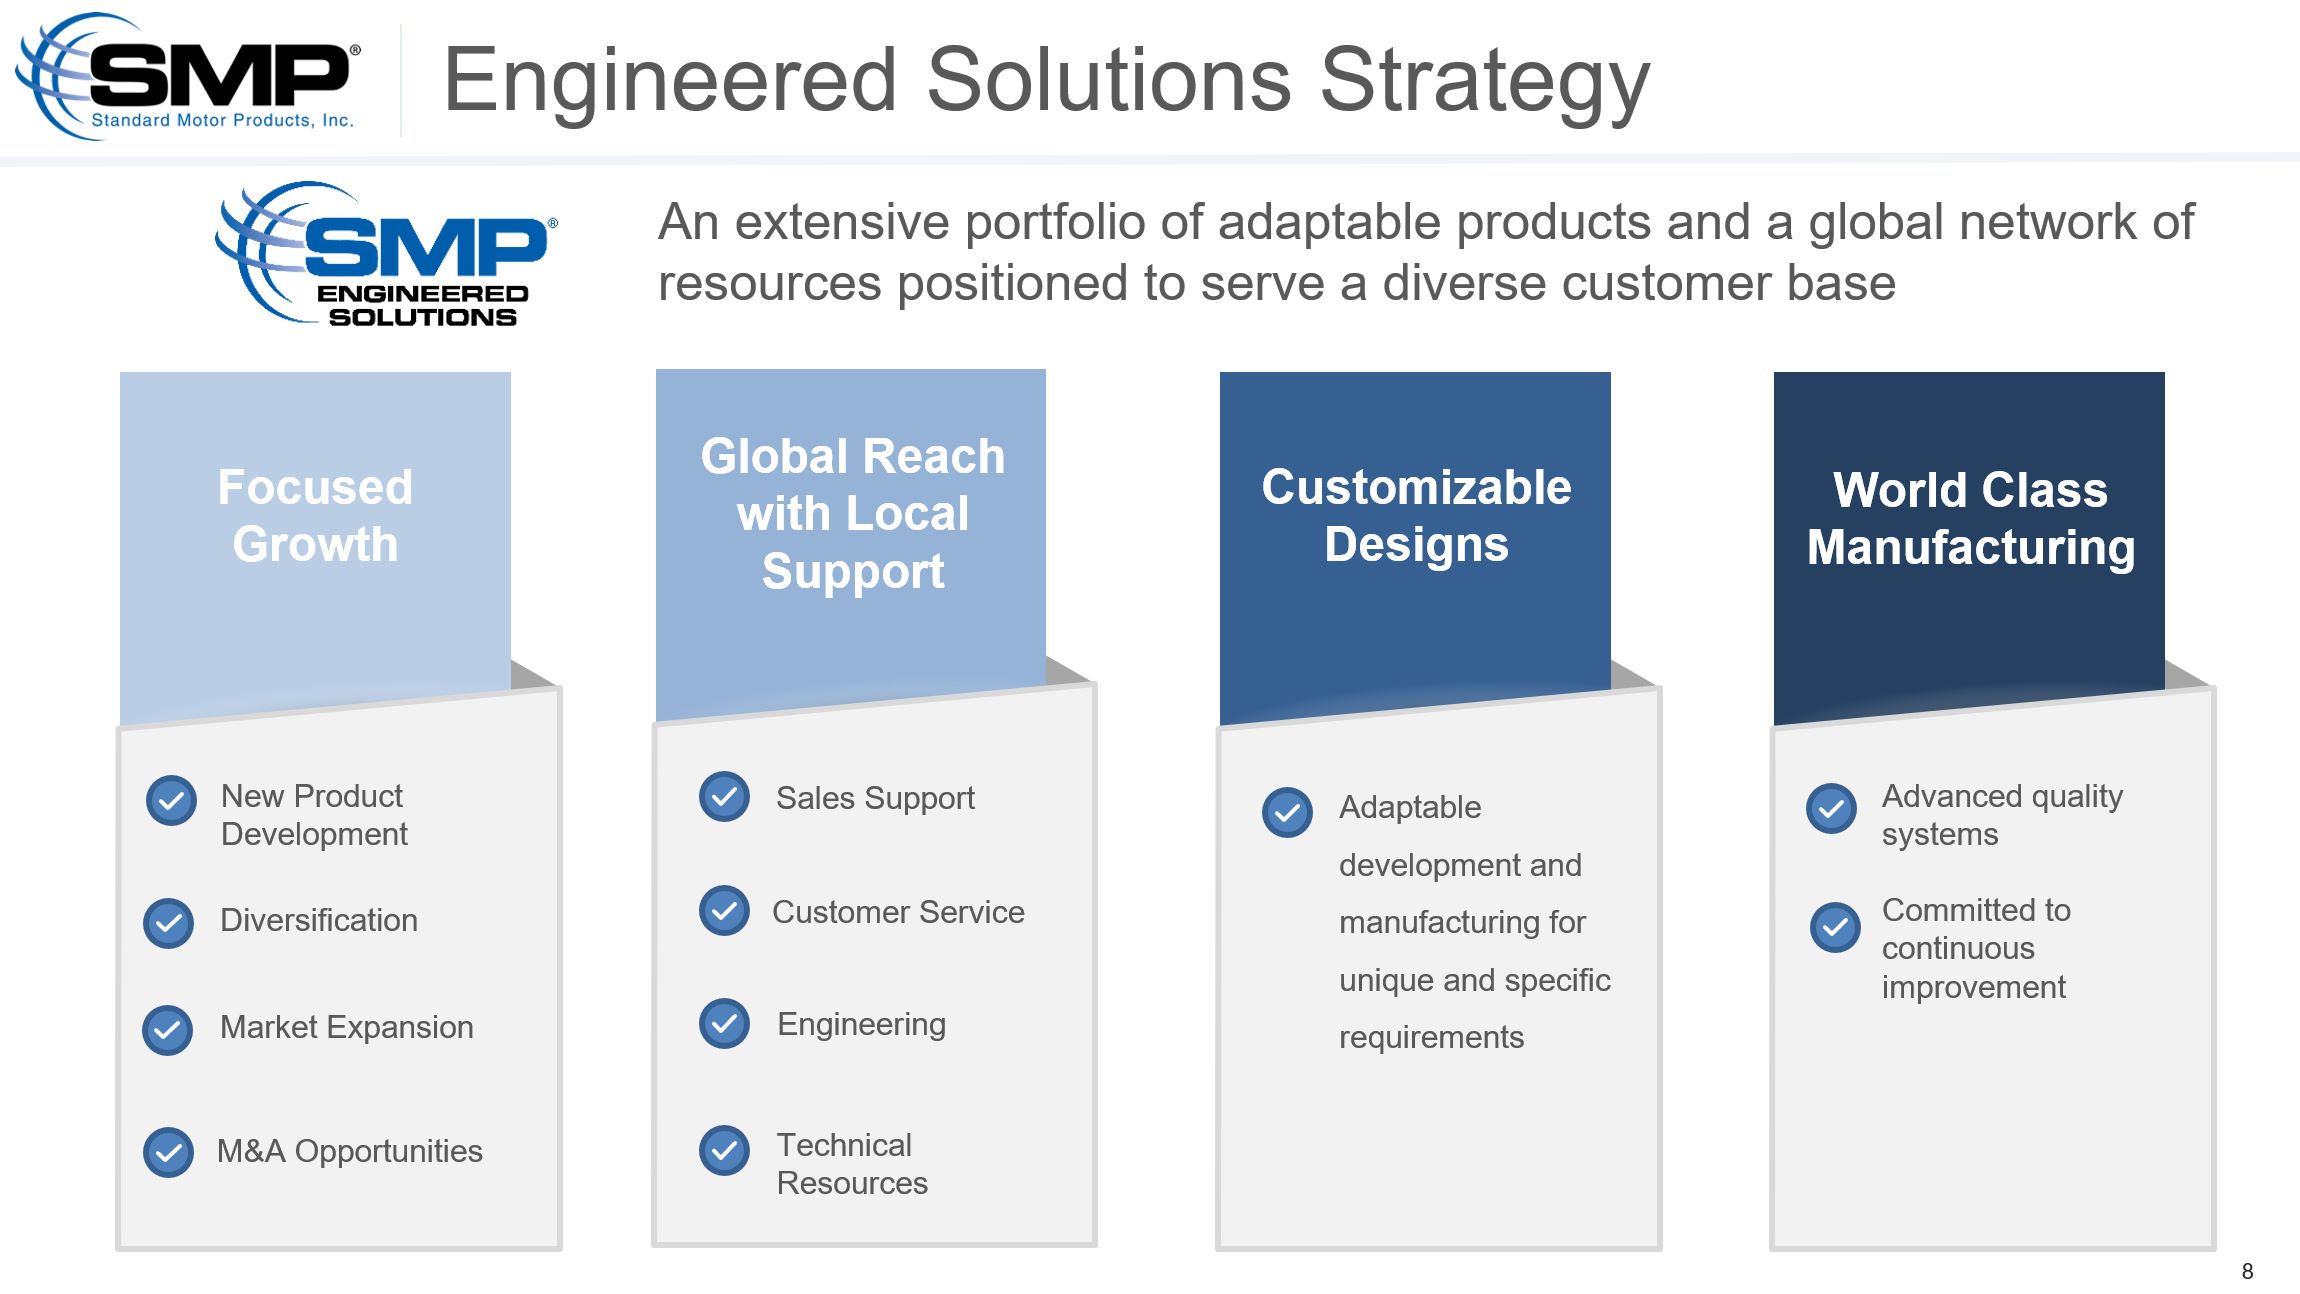
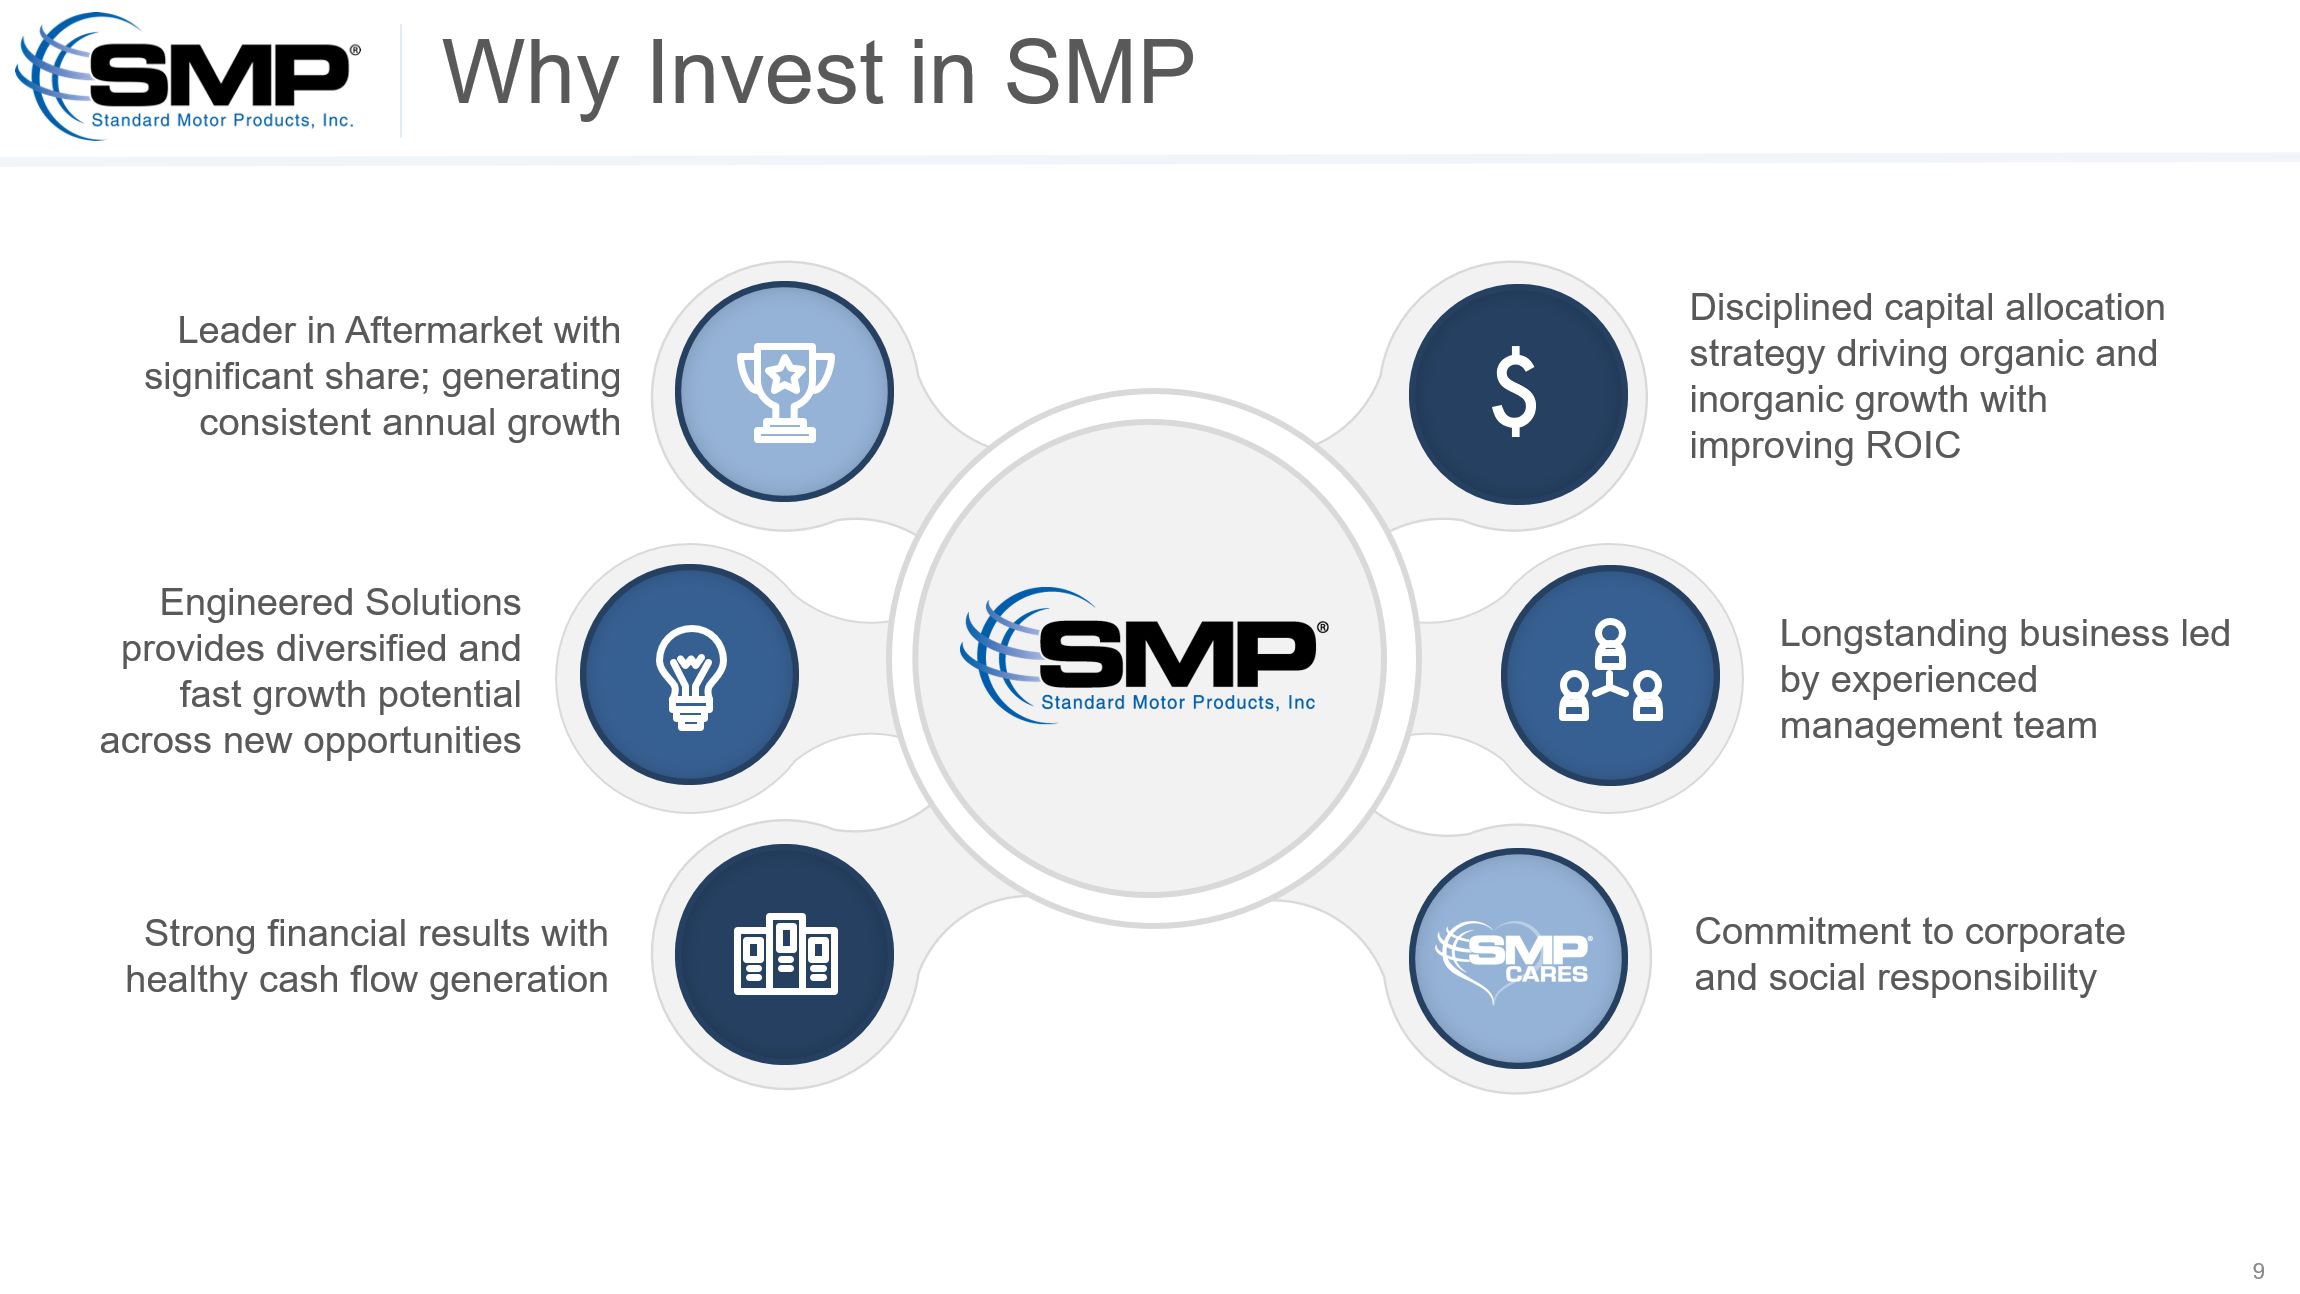
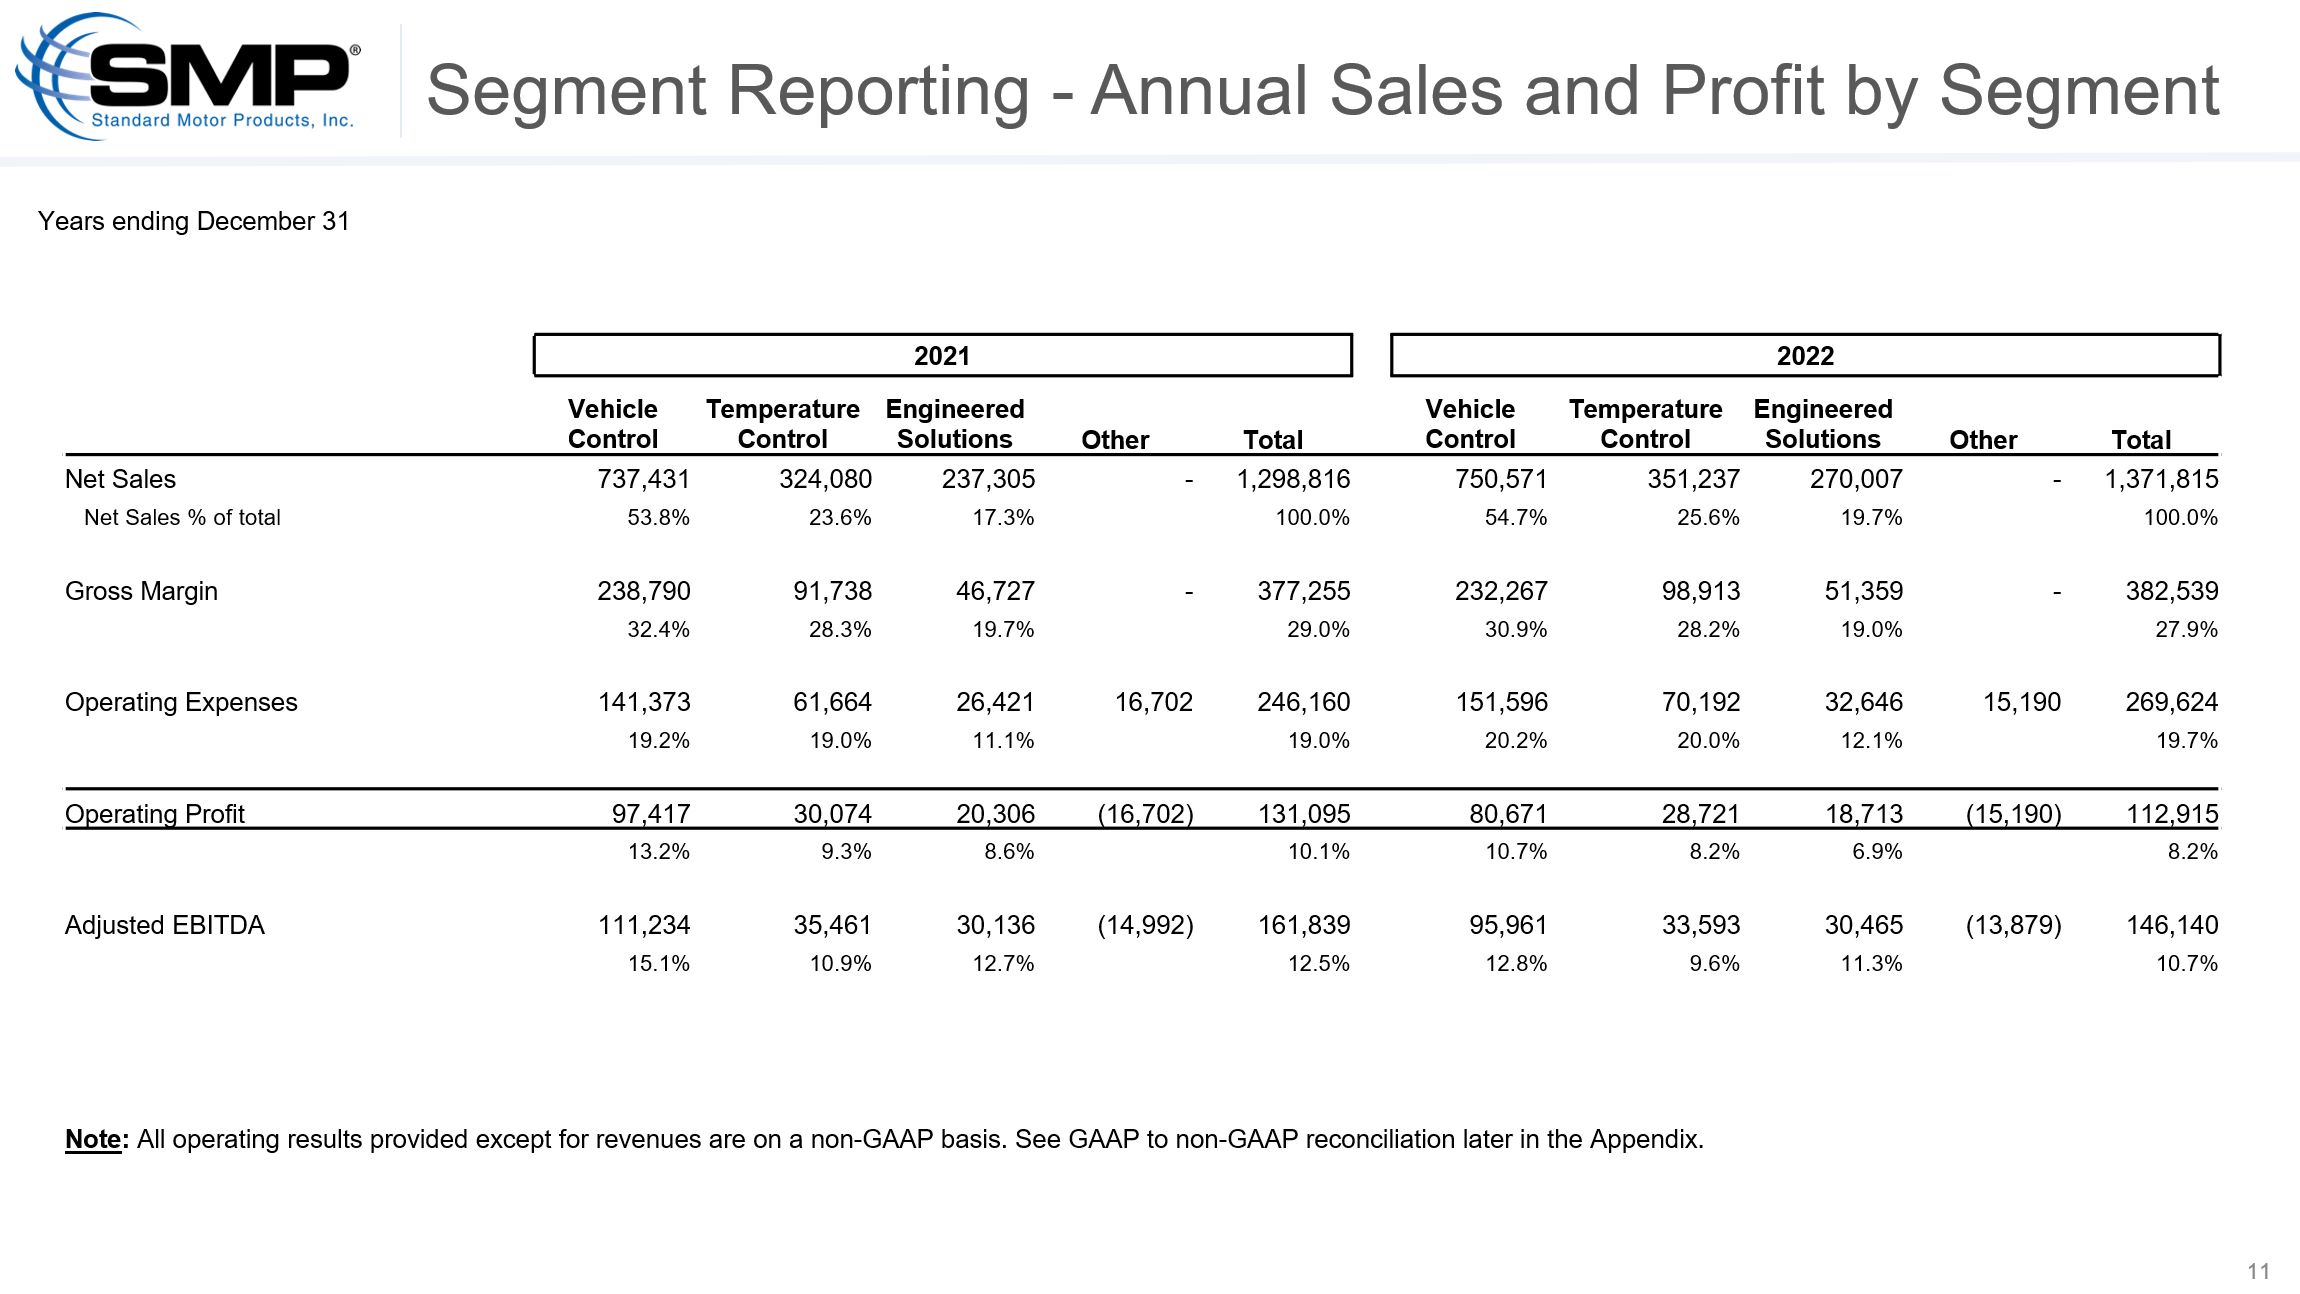
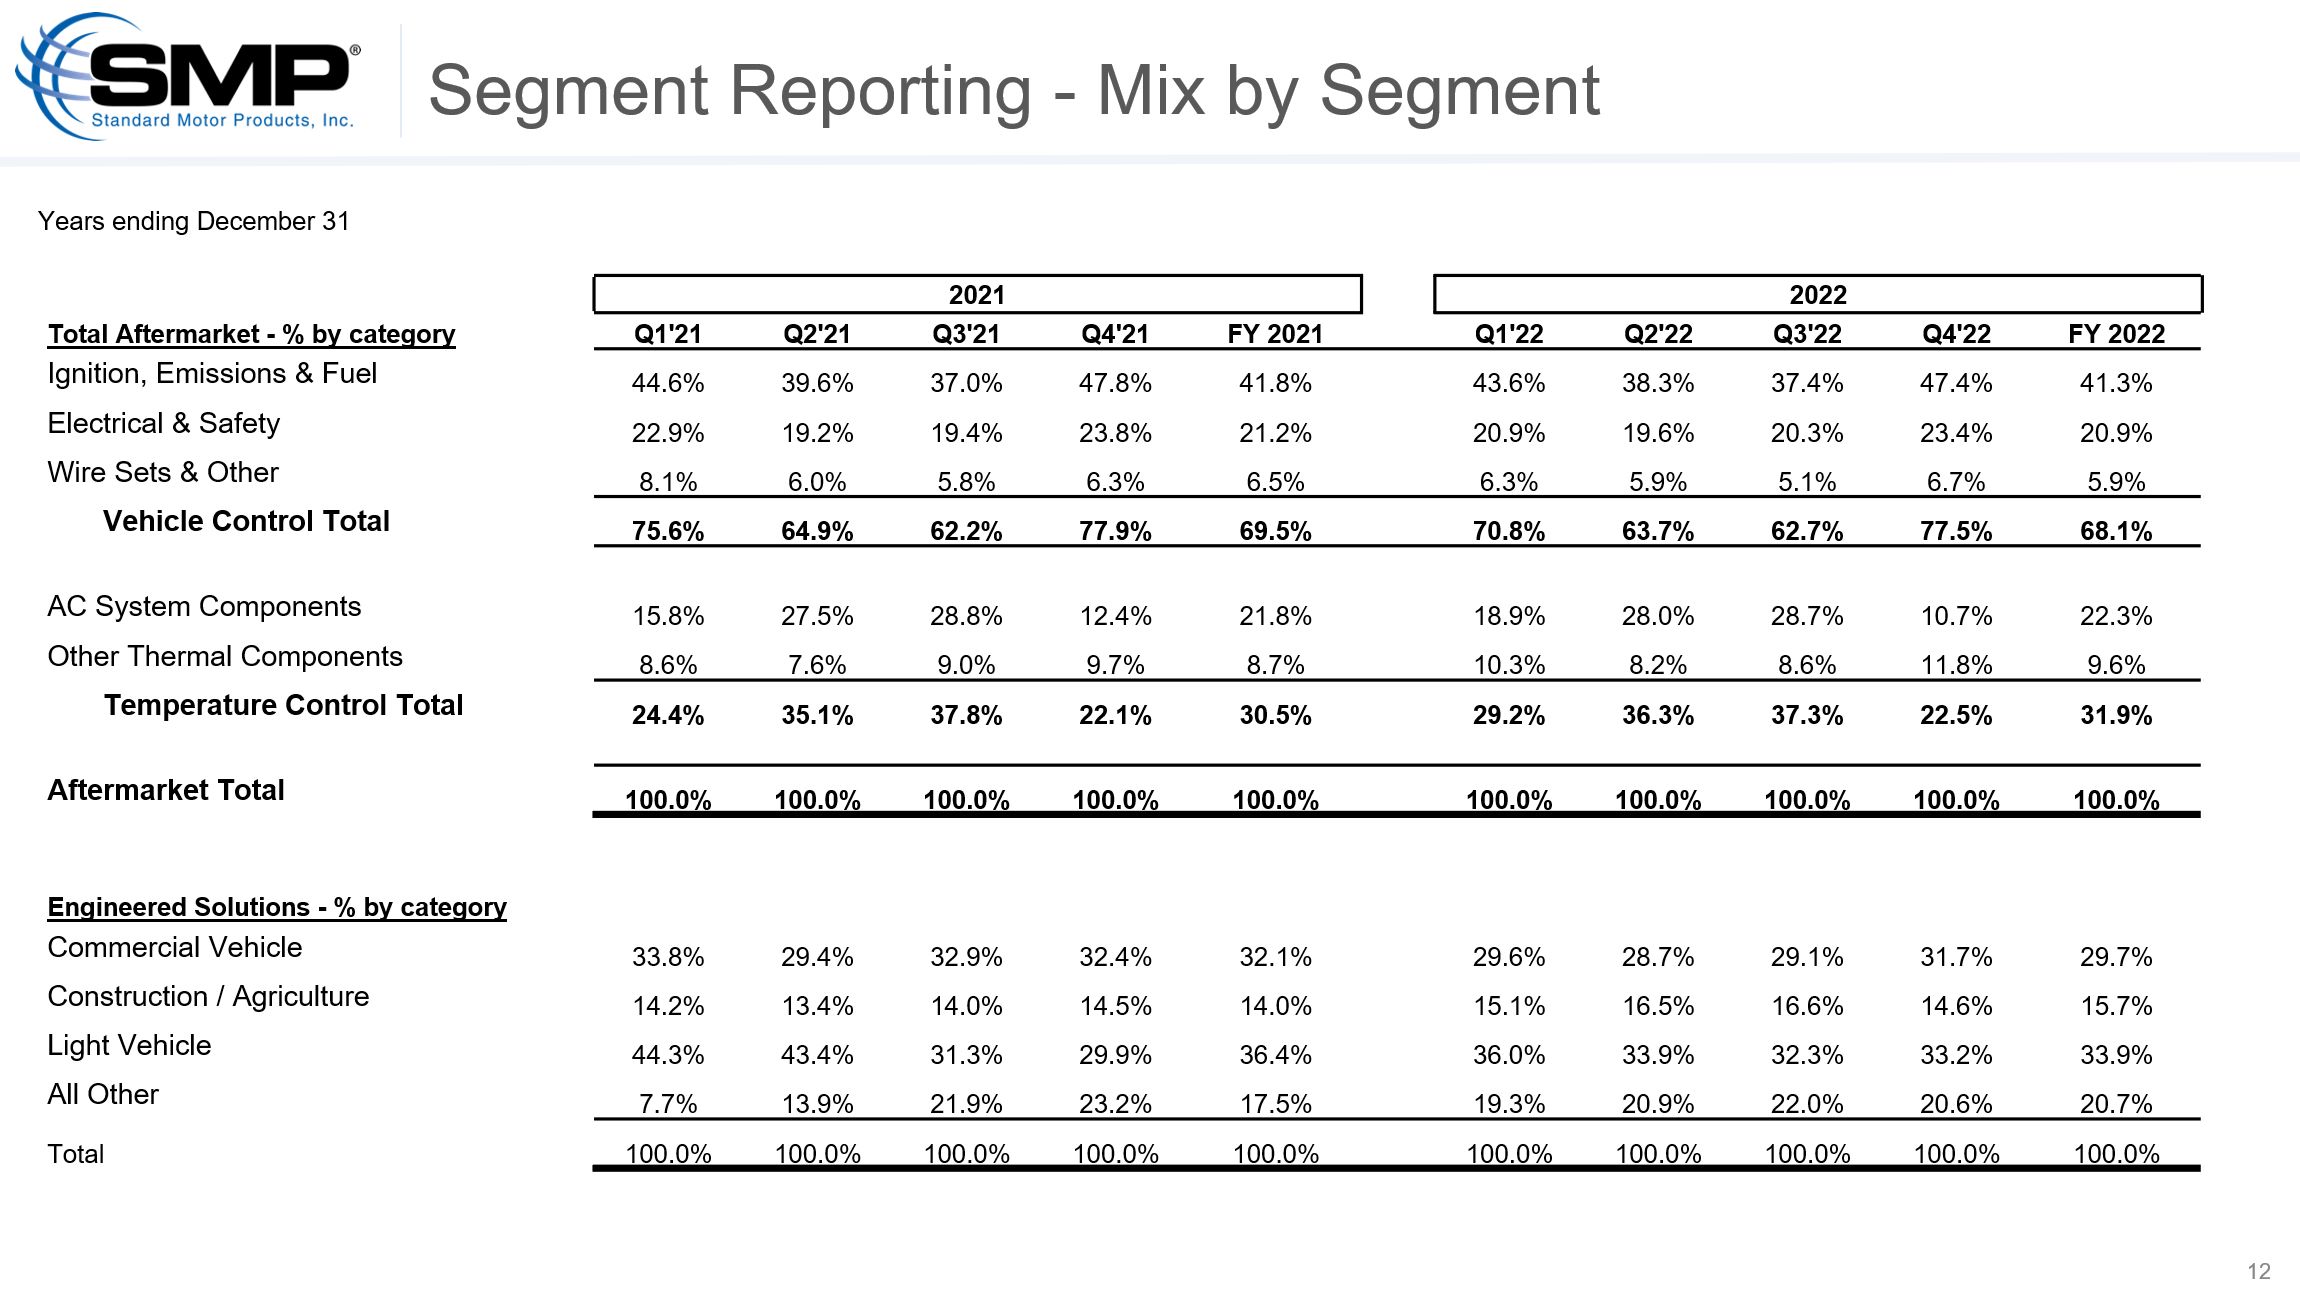
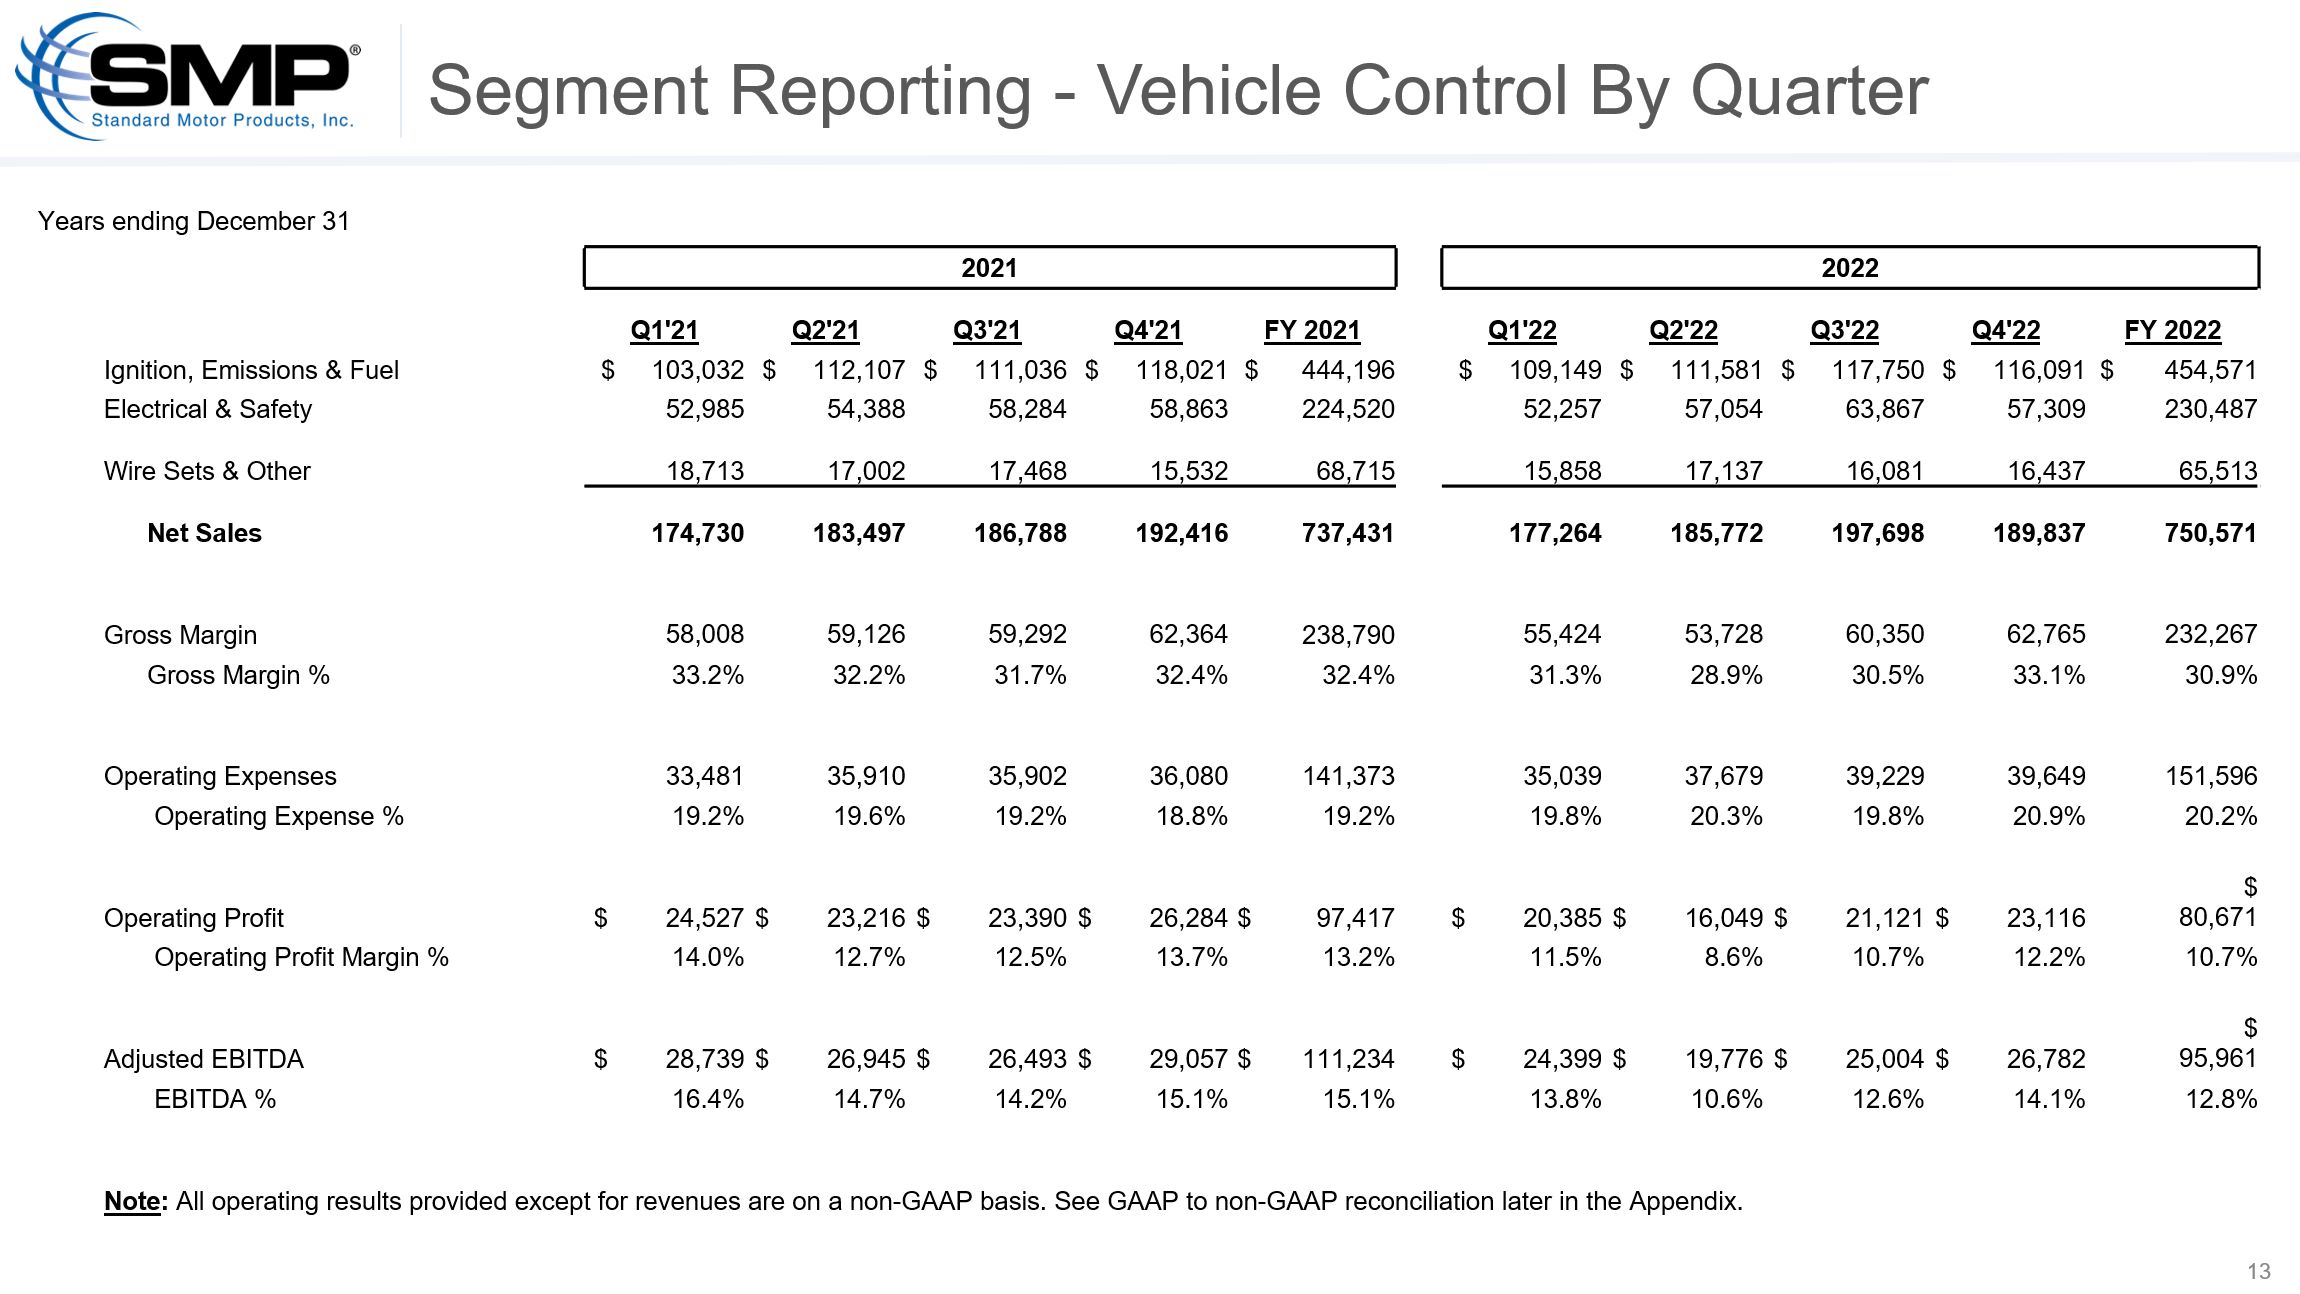
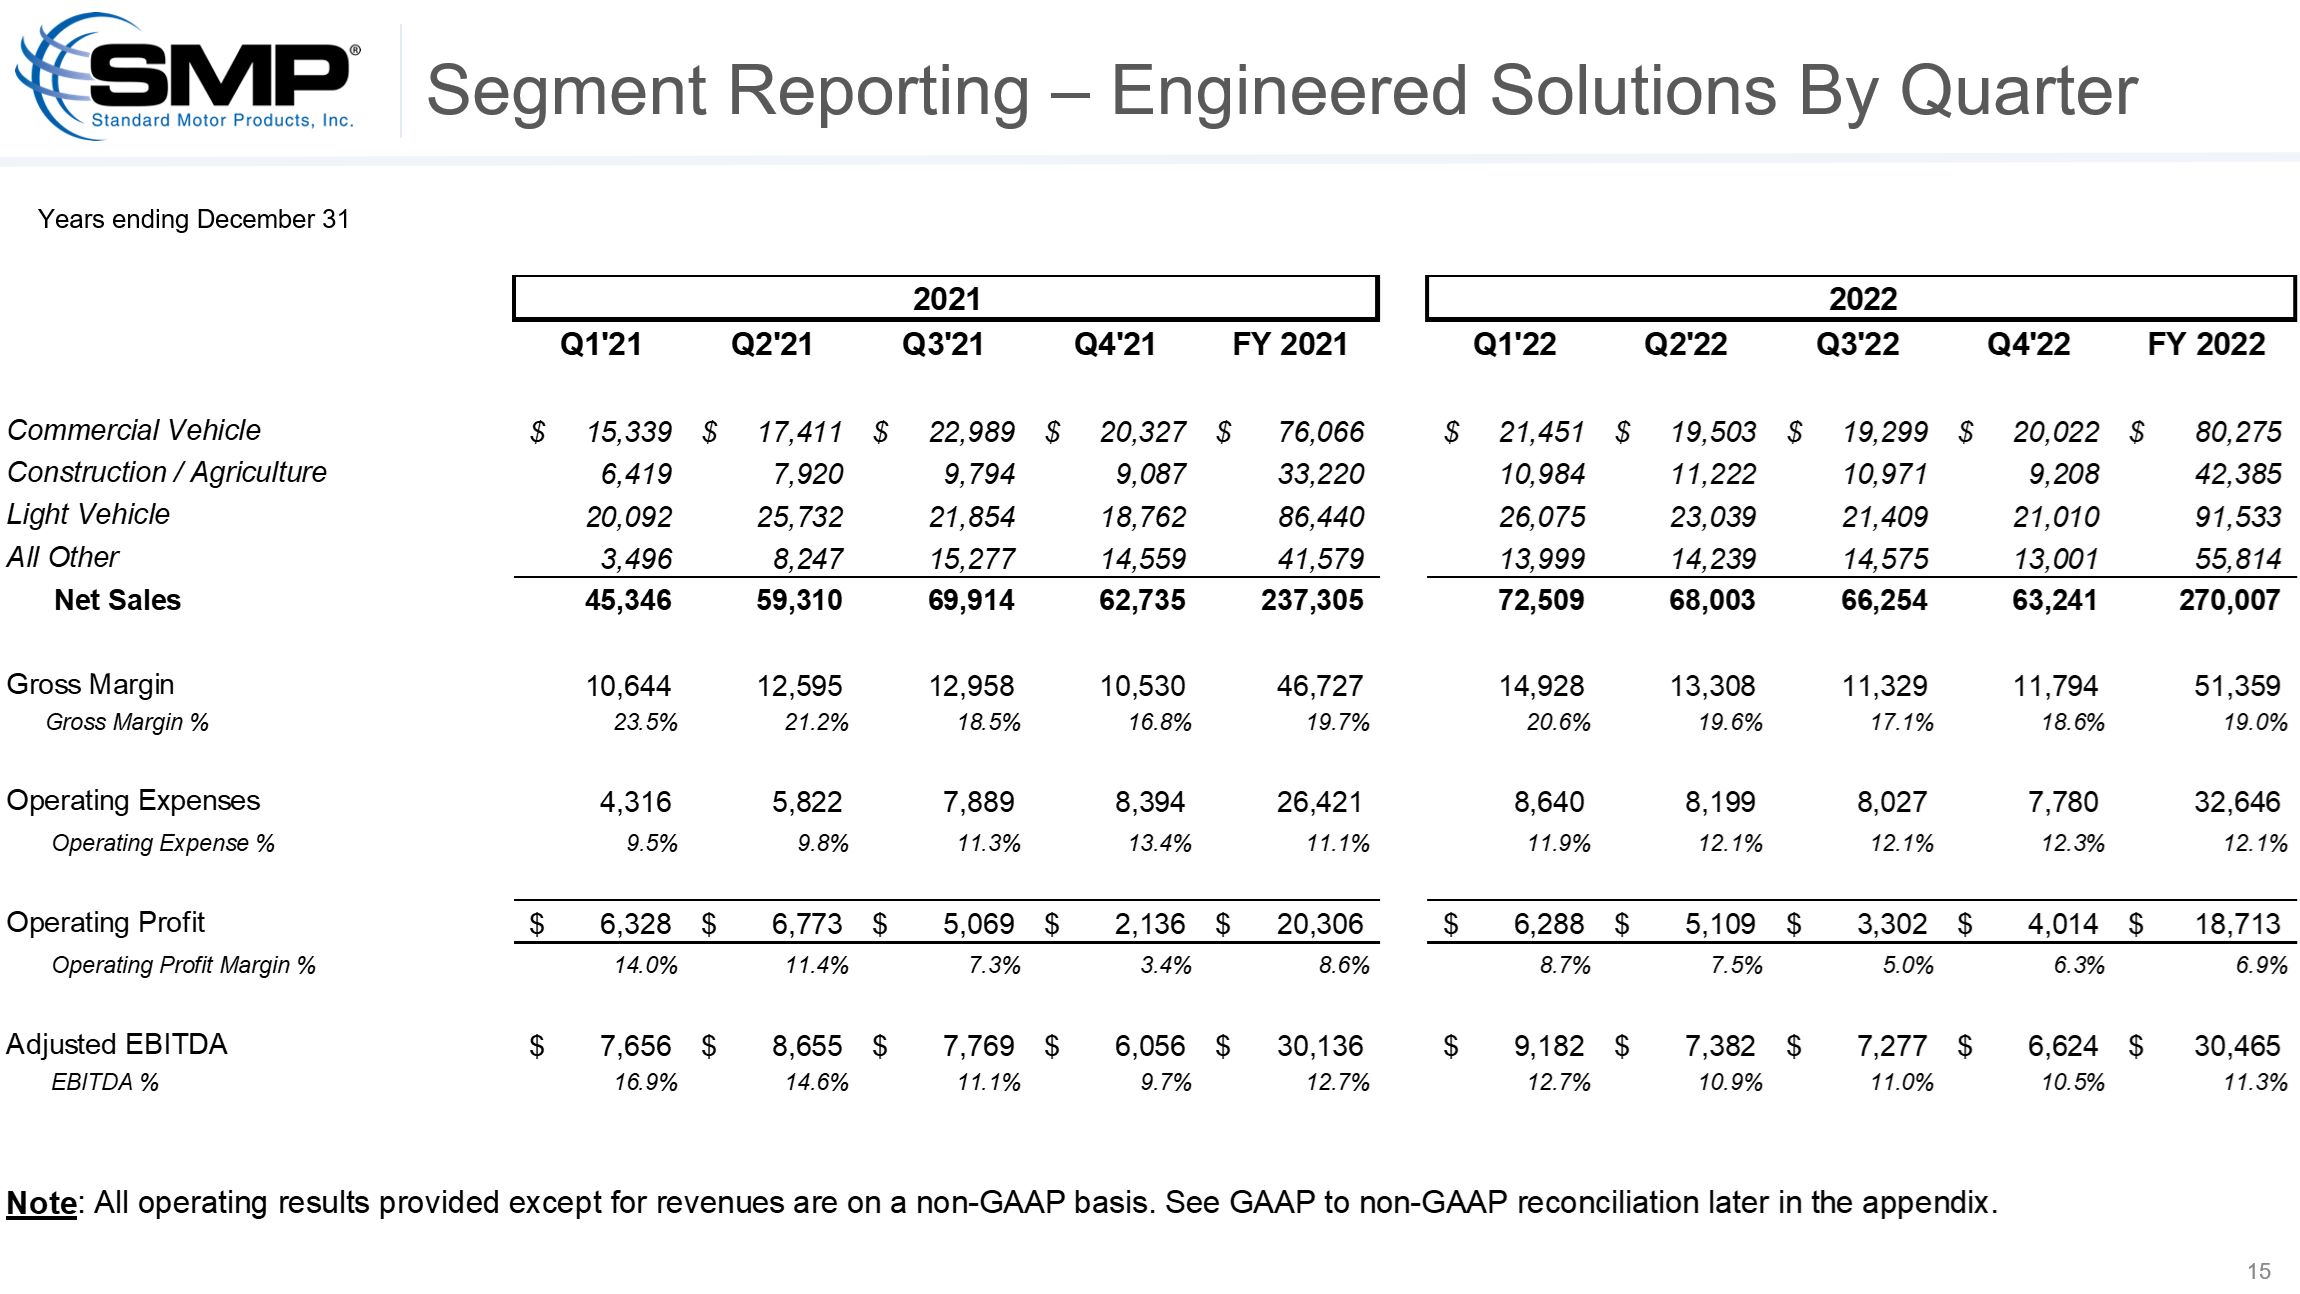
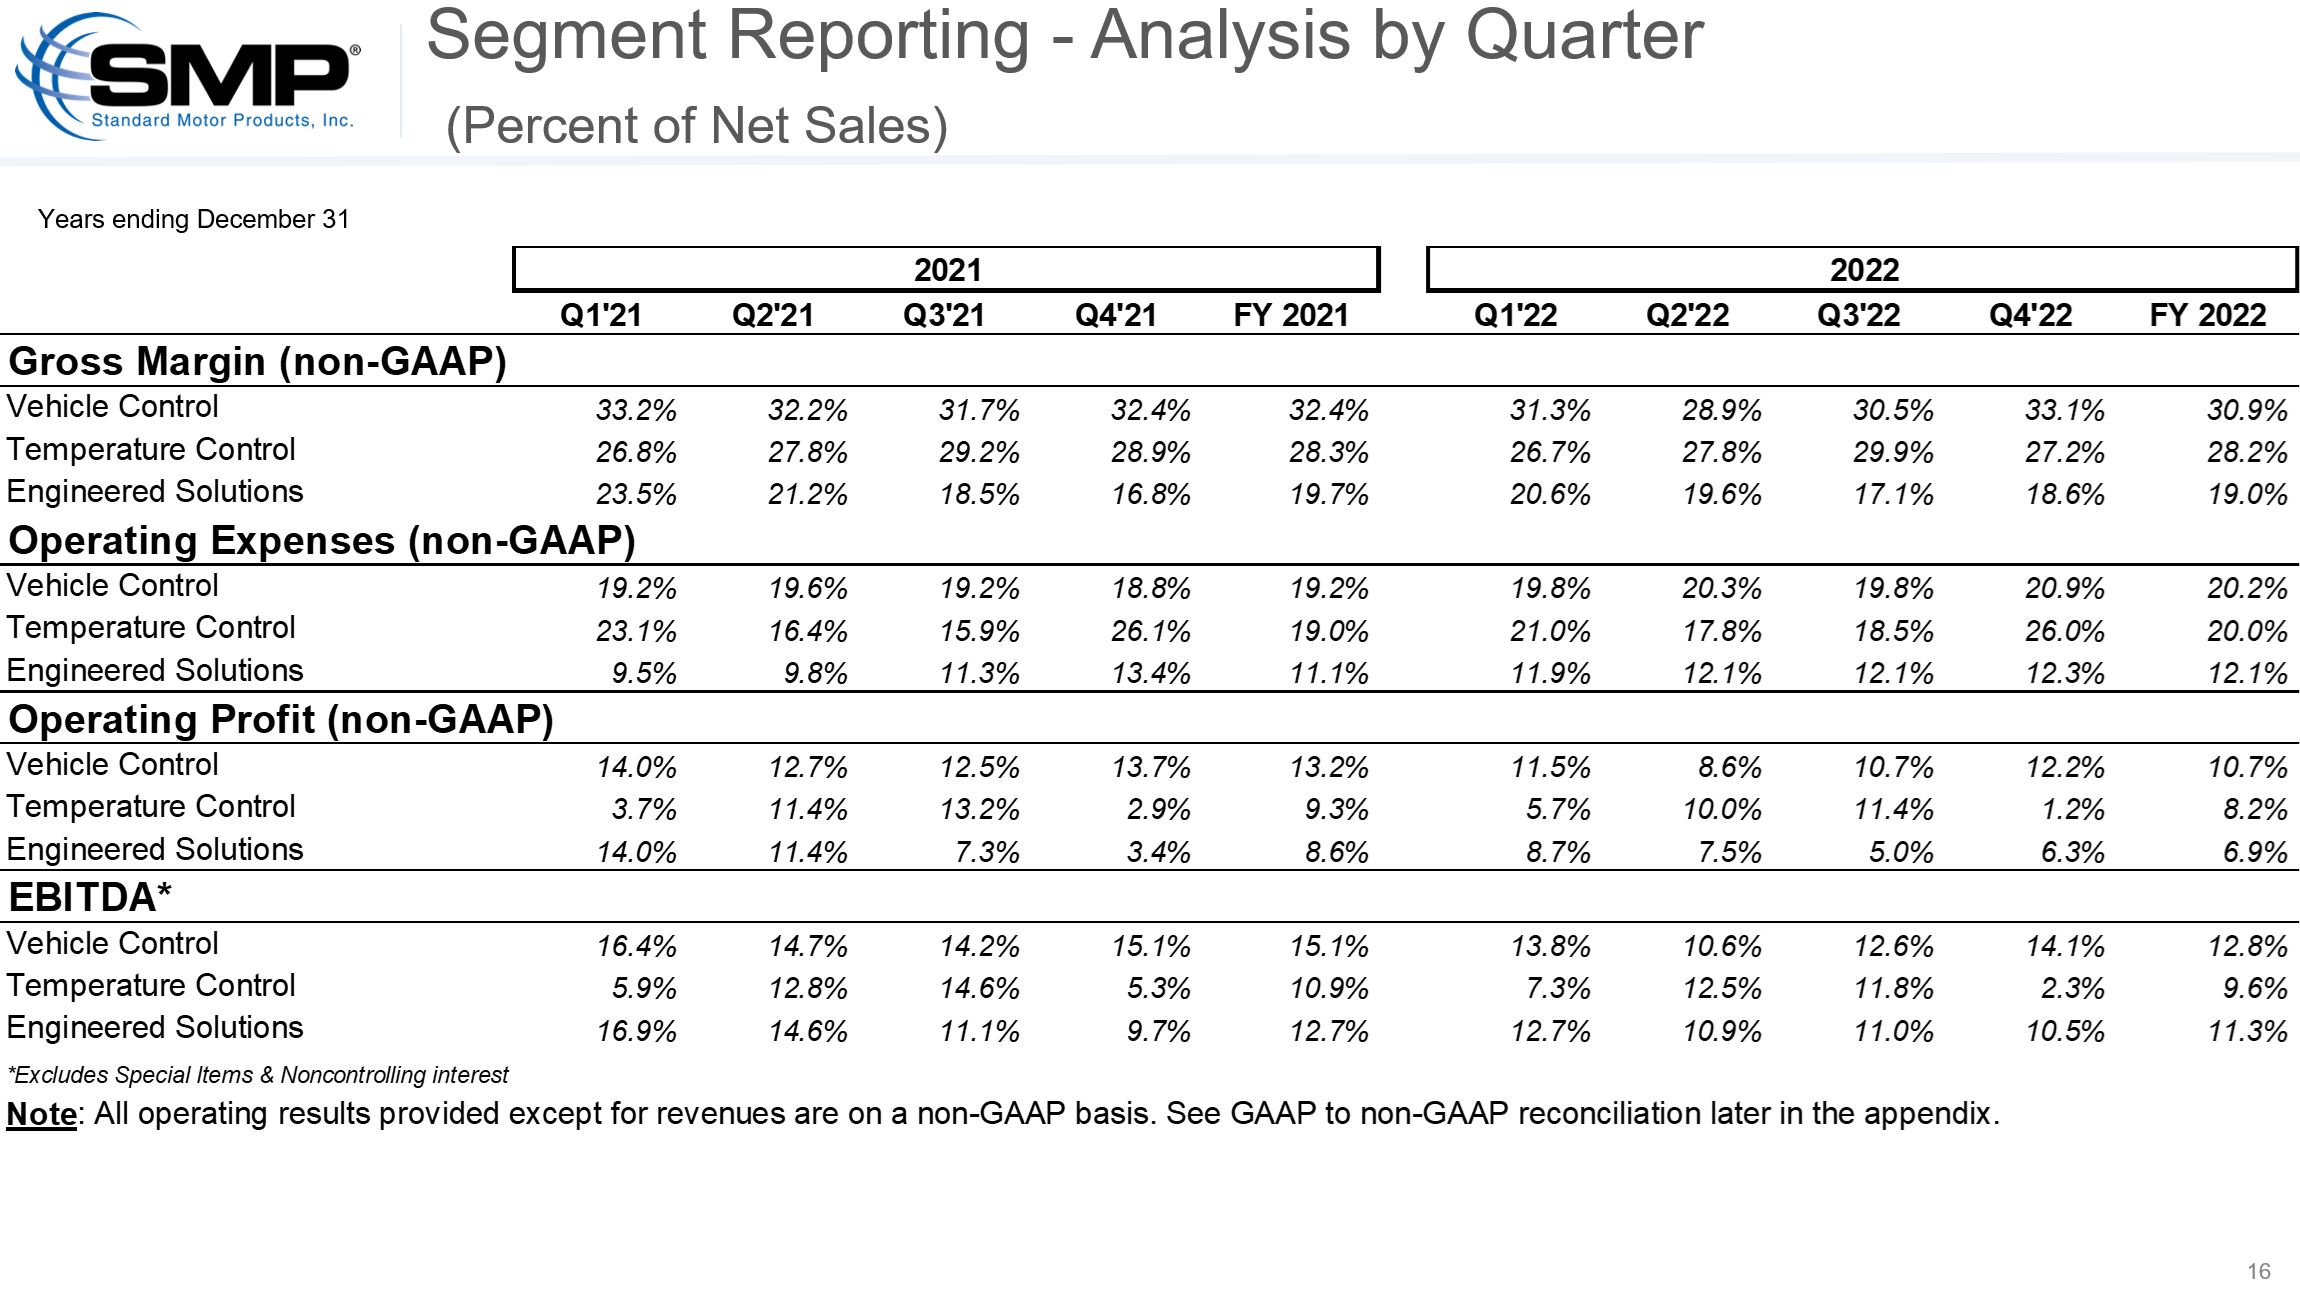
Mr. Sills added, “Today we are announcing our new operating segment, ‘Engineered Solutions’, along with the intent to rename the Engine Management segment to ‘Vehicle
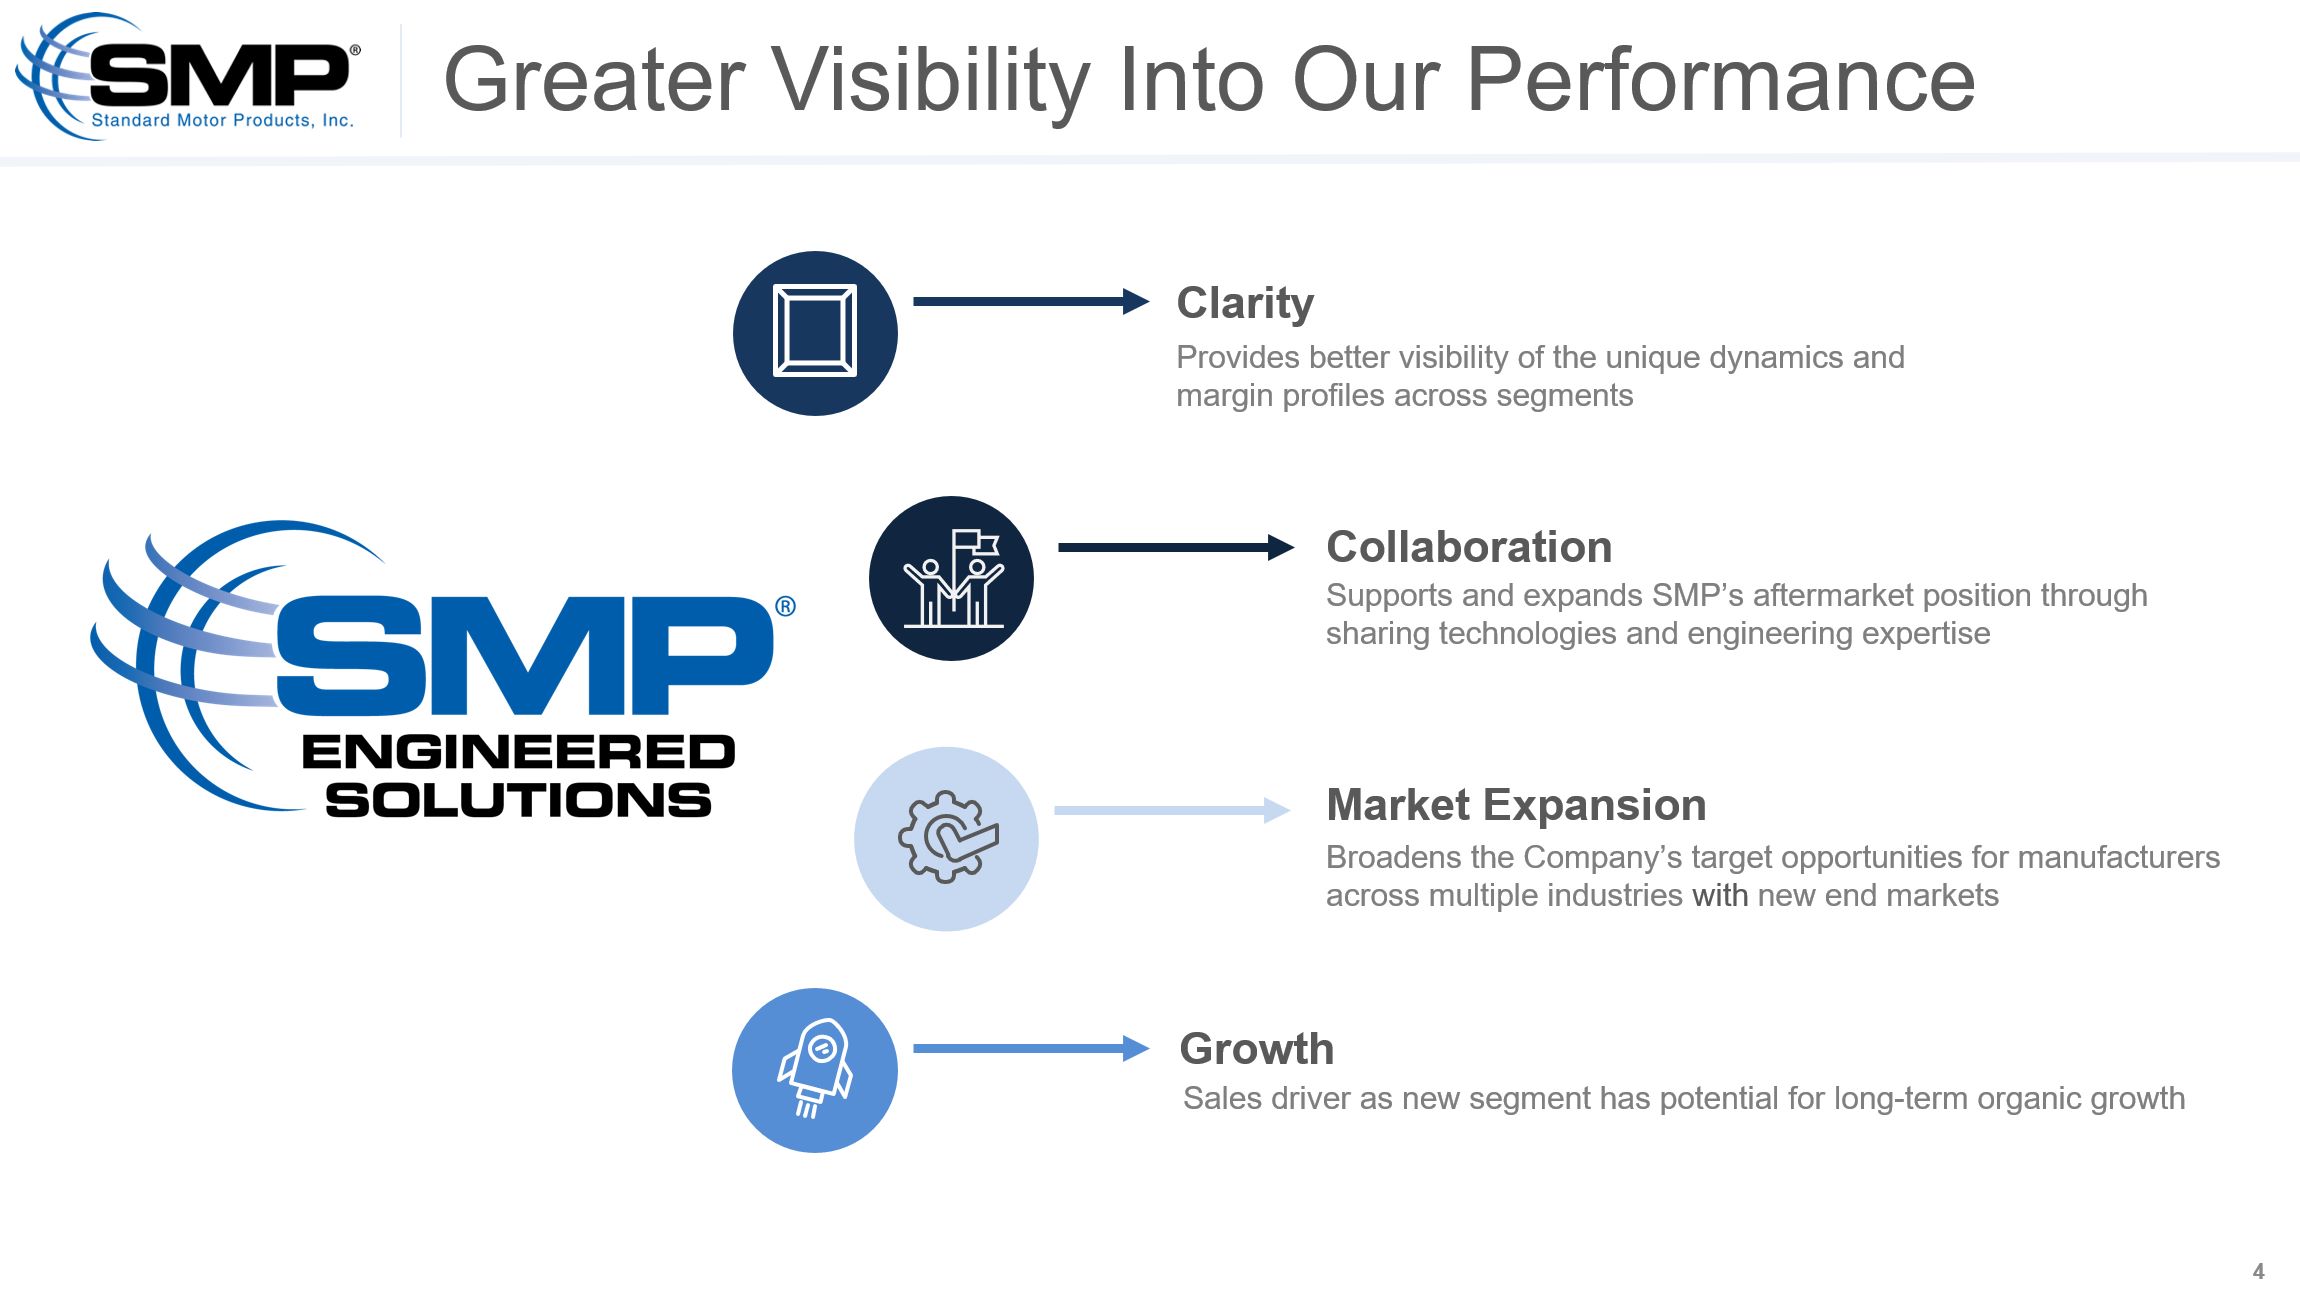
Control’. These segment changes, beginning in 2023, will better align the Company’s operating businesses with its strategic focus as well as provide greater clarity into how the Company is positioned to capture growth opportunities of the future.
Please see our separate press release on these changes, also distributed today, along with a supplementary presentation available on the Company’s Investor Relations website. We will discuss in more detail on today’s call.”
As we head into 2023, our outlook for the full year includes an expectation that sales will grow in the low single digits and Adjusted EBITDA will be approximately 10%.
In closing, Mr. Sills commented, “While there still remains uncertainty as it relates to the economy and various global dynamics, we believe our end markets’ resiliency
and diversification should continue to afford opportunities for new wins and stable levels of growth throughout 2023 and into the future.”
Conference Call
Standard Motor Products, Inc. will hold a conference call at 11:00 AM, Eastern Time, on Wednesday, February 22, 2023. This call will be web cast and can be accessed on
the Investor Relations page of our website at www.smpcorp.com and clicking on the SMP Q4'22 Earnings Call Earnings Webcast link. Investors may also listen
to the call by dialing 800-343-1703 (domestic) or 785-424-1226 (international). Our playback will be made available for dial in immediately following the call. For those choosing to listen to the replay by webcast, the link should be
active on our website within 24 hours after the call. The playback number is 800-723-1517 (domestic) or 402-220-2659 (international). The participant passcode is 73005.
Under the safe harbor provisions of the Private Securities Litigation Reform Act of 1995, Standard Motor Products cautions investors that any
forward-looking statements made by the company, including those that may be made in this press release, are based on management’s expectations at the time they are made, but they are subject to risks and uncertainties that may cause actual results,
events or performance to differ materially from those contemplated by such forward looking statements. Among the factors that could cause actual results, events or performance to differ materially from those risks and uncertainties discussed in
this press release are those detailed from time-to-time in prior press releases and in the company’s filings with the Securities and Exchange Commission, including the company’s annual report on Form 10-K and quarterly reports on Form 10-Q. By
making these forward-looking statements, Standard Motor Products undertakes no obligation or intention to update these statements after the date of this release.
STANDARD MOTOR PRODUCTS, INC.
Consolidated Statements of Operations
(In thousands, except per share amounts)
|
THREE MONTHS ENDED
DECEMBER 31,
|
TWELVE MONTHS ENDED
DECEMBER 31,
|
|||||||||||||||
|
2022
|
2021
|
2022
|
2021
|
|||||||||||||
|
(Unaudited)
|
(Unaudited)
|
|||||||||||||||
|
NET SALES
|
$
|
308,199
|
$
|
309,877
|
$
|
1,371,815
|
$
|
1,298,816
|
||||||||
|
COST OF SALES
|
218,635
|
221,207
|
989,276
|
921,885
|
||||||||||||
|
GROSS PROFIT
|
89,564
|
88,670
|
382,539
|
376,931
|
||||||||||||
|
SELLING, GENERAL & ADMINISTRATIVE EXPENSES
|
72,075
|
64,231
|
276,626
|
247,547
|
||||||||||||
|
RESTRUCTURING AND INTEGRATION EXPENSES
|
1,847
|
226
|
1,891
|
392
|
||||||||||||
|
OTHER INCOME (EXPENSE), NET
|
70
|
(1
|
)
|
113
|
7
|
|||||||||||
|
OPERATING INCOME
|
15,712
|
24,212
|
104,135
|
128,999
|
||||||||||||
|
OTHER NON-OPERATING INCOME (EXPENSE), NET
|
(75
|
)
|
1,247
|
4,814
|
3,494
|
|||||||||||
|
INTEREST EXPENSE
|
4,335
|
672
|
10,617
|
2,028
|
||||||||||||
|
EARNINGS FROM CONTINUING OPERATIONS BEFORE TAXES
|
11,302
|
24,787
|
98,332
|
130,465
|
||||||||||||
|
PROVISION FOR INCOME TAXES
|
2,799
|
4,729
|
25,206
|
31,044
|
||||||||||||
|
EARNINGS FROM CONTINUING OPERATIONS
|
8,503
|
20,058
|
73,126
|
99,421
|
||||||||||||
|
LOSS FROM DISCONTINUED OPERATION, NET OF INCOME TAXES
|
(615
|
)
|
(1,328
|
)
|
(17,691
|
)
|
(8,467
|
)
|
||||||||
|
NET EARNINGS
|
7,888
|
18,730
|
55,435
|
90,954
|
||||||||||||
|
NET EARNINGS (LOSS) ATTRIBUTABLE TO NONCONTROLLING INTEREST
|
(45
|
)
|
36
|
84
|
68
|
|||||||||||
|
NET EARNINGS ATTRIBUTABLE TO SMP (a)
|
$
|
7,933
|
$
|
18,694
|
$
|
55,351
|
$
|
90,886
|
||||||||
|
NET EARNINGS ATTRIBUTABLE TO SMP
|
||||||||||||||||
|
EARNINGS FROM CONTINUING OPERATIONS
|
$
|
8,548
|
$
|
20,022
|
$
|
73,042
|
$
|
99,353
|
||||||||
|
LOSS FROM DISCONTINUED OPERATION, NET OF INCOME TAXES
|
(615
|
)
|
(1,328
|
)
|
(17,691
|
)
|
(8,467
|
)
|
||||||||
|
TOTAL
|
$
|
7,933
|
$
|
18,694
|
$
|
55,351
|
$
|
90,886
|
||||||||
|
NET EARNINGS PER COMMON SHARE ATTRIBUTABLE TO SMP
|
||||||||||||||||
|
BASIC EARNINGS FROM CONTINUING OPERATIONS
|
$
|
0.40
|
$
|
0.91
|
$
|
3.37
|
$
|
4.49
|
||||||||
|
DISCONTINUED OPERATION
|
(0.03
|
)
|
(0.06
|
)
|
(0.82
|
)
|
(0.39
|
)
|
||||||||
|
NET EARNINGS PER COMMON SHARE - BASIC
|
$
|
0.37
|
$
|
0.85
|
$
|
2.55
|
$
|
4.10
|
||||||||
|
DILUTED EARNINGS FROM CONTINUING OPERATIONS
|
$
|
0.39
|
$
|
0.89
|
$
|
3.30
|
$
|
4.39
|
||||||||
|
DISCONTINUED OPERATION
|
(0.03
|
)
|
(0.06
|
)
|
(0.80
|
)
|
(0.37
|
)
|
||||||||
|
NET EARNINGS PER COMMON SHARE - DILUTED
|
$
|
0.36
|
$
|
0.83
|
$
|
2.50
|
$
|
4.02
|
||||||||
|
WEIGHTED AVERAGE NUMBER OF COMMON SHARES
|
21,578,194
|
21,987,480
|
21,683,719
|
22,147,479
|
||||||||||||
|
WEIGHTED AVERAGE NUMBER OF COMMON AND DILUTIVE SHARES
|
22,030,263
|
22,485,032
|
22,139,981
|
22,616,456
|
||||||||||||
(a) "SMP" refers to Standard Motor Products, Inc. and subsidiaries.
STANDARD MOTOR PRODUCTS, INC.
Segment Revenues and Operating Profit
(In thousands)
|
THREE MONTHS ENDED
DECEMBER 31,
|
TWELVE MONTHS ENDED
DECEMBER 31,
|
|||||||||||||||||||||||
|
2022
|
2021
|
2022
|
2021
|
|||||||||||||||||||||
|
(unaudited)
|
(unaudited)
|
|||||||||||||||||||||||
|
Revenues
|
||||||||||||||||||||||||
|
Ignition, Emission Control, Fuel & Safety
|
||||||||||||||||||||||||
|
Related System Products
|
$
|
206,479
|
$
|
211,919
|
$
|
824,677
|
$
|
786,514
|
||||||||||||||||
|
Wire and Cable
|
35,893
|
33,632
|
150,566
|
151,422
|
||||||||||||||||||||
|
Engine Management
|
242,372
|
245,551
|
975,243
|
937,936
|
||||||||||||||||||||
|
Compressors
|
28,981
|
28,666
|
222,532
|
206,697
|
||||||||||||||||||||
|
Other Climate Control Parts
|
34,560
|
31,738
|
159,753
|
141,726
|
||||||||||||||||||||
|
Temperature Control
|
63,541
|
60,404
|
382,285
|
348,423
|
||||||||||||||||||||
|
All Other
|
2,286
|
3,922
|
14,287
|
12,457
|
||||||||||||||||||||
|
Revenues
|
$
|
308,199
|
$
|
309,877
|
$
|
1,371,815
|
$
|
1,298,816
|
||||||||||||||||
|
Gross Margin
|
||||||||||||||||||||||||
|
Engine Management
|
$
|
69,099
|
28.5 | % |
|
$
|
67,776
|
27.6
|
%
|
$
|
262,954
|
27.0
|
%
|
$
|
267,285
|
28.5
|
%
|
|||||||
|
Temperature Control
|
16,675
|
26.2 | % |
|
16,670
|
27.6
|
%
|
102,640
|
26.8
|
%
|
95,138
|
27.3
|
%
|
|||||||||||
|
All Other
|
3,790
|
4,270
|
16,945
|
14,832
|
||||||||||||||||||||
|
Subtotal
|
$
|
89,564
|
29.1 | % |
|
$
|
88,716
|
28.6
|
%
|
$
|
382,539
|
27.9
|
%
|
$
|
377,255
|
29.0
|
%
|
|||||||
|
One-Time Acquisition Costs
|
-
|
0.0 | % |
|
(46
|
)
|
0.0
|
%
|
-
|
0.0
|
%
|
(324
|
)
|
0.0
|
%
|
|||||||||
|
Gross Margin
|
$
|
89,564
|
29.1 | % |
|
$
|
88,670
|
28.6
|
%
|
$
|
382,539
|
27.9
|
%
|
$
|
376,931
|
29.0
|
%
|
|||||||
|
Selling, General & Administrative
|
||||||||||||||||||||||||
|
Engine Management
|
$
|
42,644
|
17.6 | % |
|
$
|
39,485
|
16.1
|
%
|
$
|
165,389
|
17.0
|
%
|
$
|
149,206
|
15.9
|
%
|
|||||||
|
Temperature Control
|
14,436
|
22.7 | % |
|
13,192
|
21.8
|
%
|
68,666
|
18.0
|
%
|
58,144
|
16.7
|
%
|
|||||||||||
|
All Other
|
7,993
|
11,495
|
35,569
|
38,810
|
||||||||||||||||||||
|
Subtotal
|
$
|
65,073
|
21.1 | % |
|
$
|
64,172
|
20.7
|
%
|
$
|
269,624
|
19.7
|
%
|
$
|
246,160
|
19.0
|
%
|
|||||||
|
Customer Bankruptcy Charge
|
7,002
|
2.3 | % |
|
-
|
0.0
|
%
|
7,002
|
0.5
|
%
|
-
|
0.0
|
%
|
|||||||||||
|
One-Time Acquisition Costs
|
-
|
0.0 | % |
|
59
|
0.0
|
%
|
-
|
0.0
|
%
|
1,387
|
0.1
|
%
|
|||||||||||
|
Selling, General & Administrative
|
$
|
72,075
|
23.4 | % |
|
$
|
64,231
|
20.7
|
%
|
$
|
276,626
|
20.2
|
%
|
$
|
247,547
|
19.1
|
%
|
|||||||
|
Operating Income
|
||||||||||||||||||||||||
|
Engine Management
|
$
|
26,455
|
10.9 | % |
|
$
|
28,291
|
11.5
|
%
|
$
|
97,565
|
10.0
|
%
|
$
|
118,079
|
12.6
|
%
|
|||||||
|
Temperature Control
|
2,239
|
3.5 | % |
|
3,478
|
5.8
|
%
|
33,974
|
8.9
|
%
|
36,994
|
10.6
|
%
|
|||||||||||
|
All Other
|
(4,203
|
)
|
(7,225
|
)
|
(18,624
|
)
|
(23,978
|
)
|
||||||||||||||||
|
Subtotal
|
$
|
24,491
|
7.9 | % |
|
$
|
24,544
|
7.9
|
%
|
$
|
112,915
|
8.2
|
%
|
$
|
131,095
|
10.1
|
%
|
|||||||
|
Customer Bankruptcy Charge
|
(7,002
|
)
|
-2.3 | % |
|
-
|
0.0
|
%
|
(7,002
|
)
|
-0.5
|
%
|
-
|
0.0
|
%
|
|||||||||
|
One-Time Acquisition Costs
|
-
|
0.0 | % |
|
(105
|
)
|
0.0
|
%
|
-
|
0.0
|
%
|
(1,711
|
)
|
-0.1
|
%
|
|||||||||
|
Restructuring & Integration
|
(1,847
|
)
|
-0.6 | % |
|
(226
|
)
|
-0.1
|
%
|
(1,891
|
)
|
-0.1
|
%
|
(392
|
)
|
0.0
|
%
|
|||||||
|
Other Income (Expense), Net
|
70
|
0.0 | % |
|
(1
|
)
|
0.0
|
%
|
113
|
0.0
|
%
|
7
|
0.0
|
%
|
||||||||||
|
Operating Income
|
$
|
15,712
|
5.1 | % |
|
$
|
24,212
|
7.8
|
%
|
$
|
104,135
|
7.6
|
%
|
$
|
128,999
|
9.9
|
%
|
|||||||
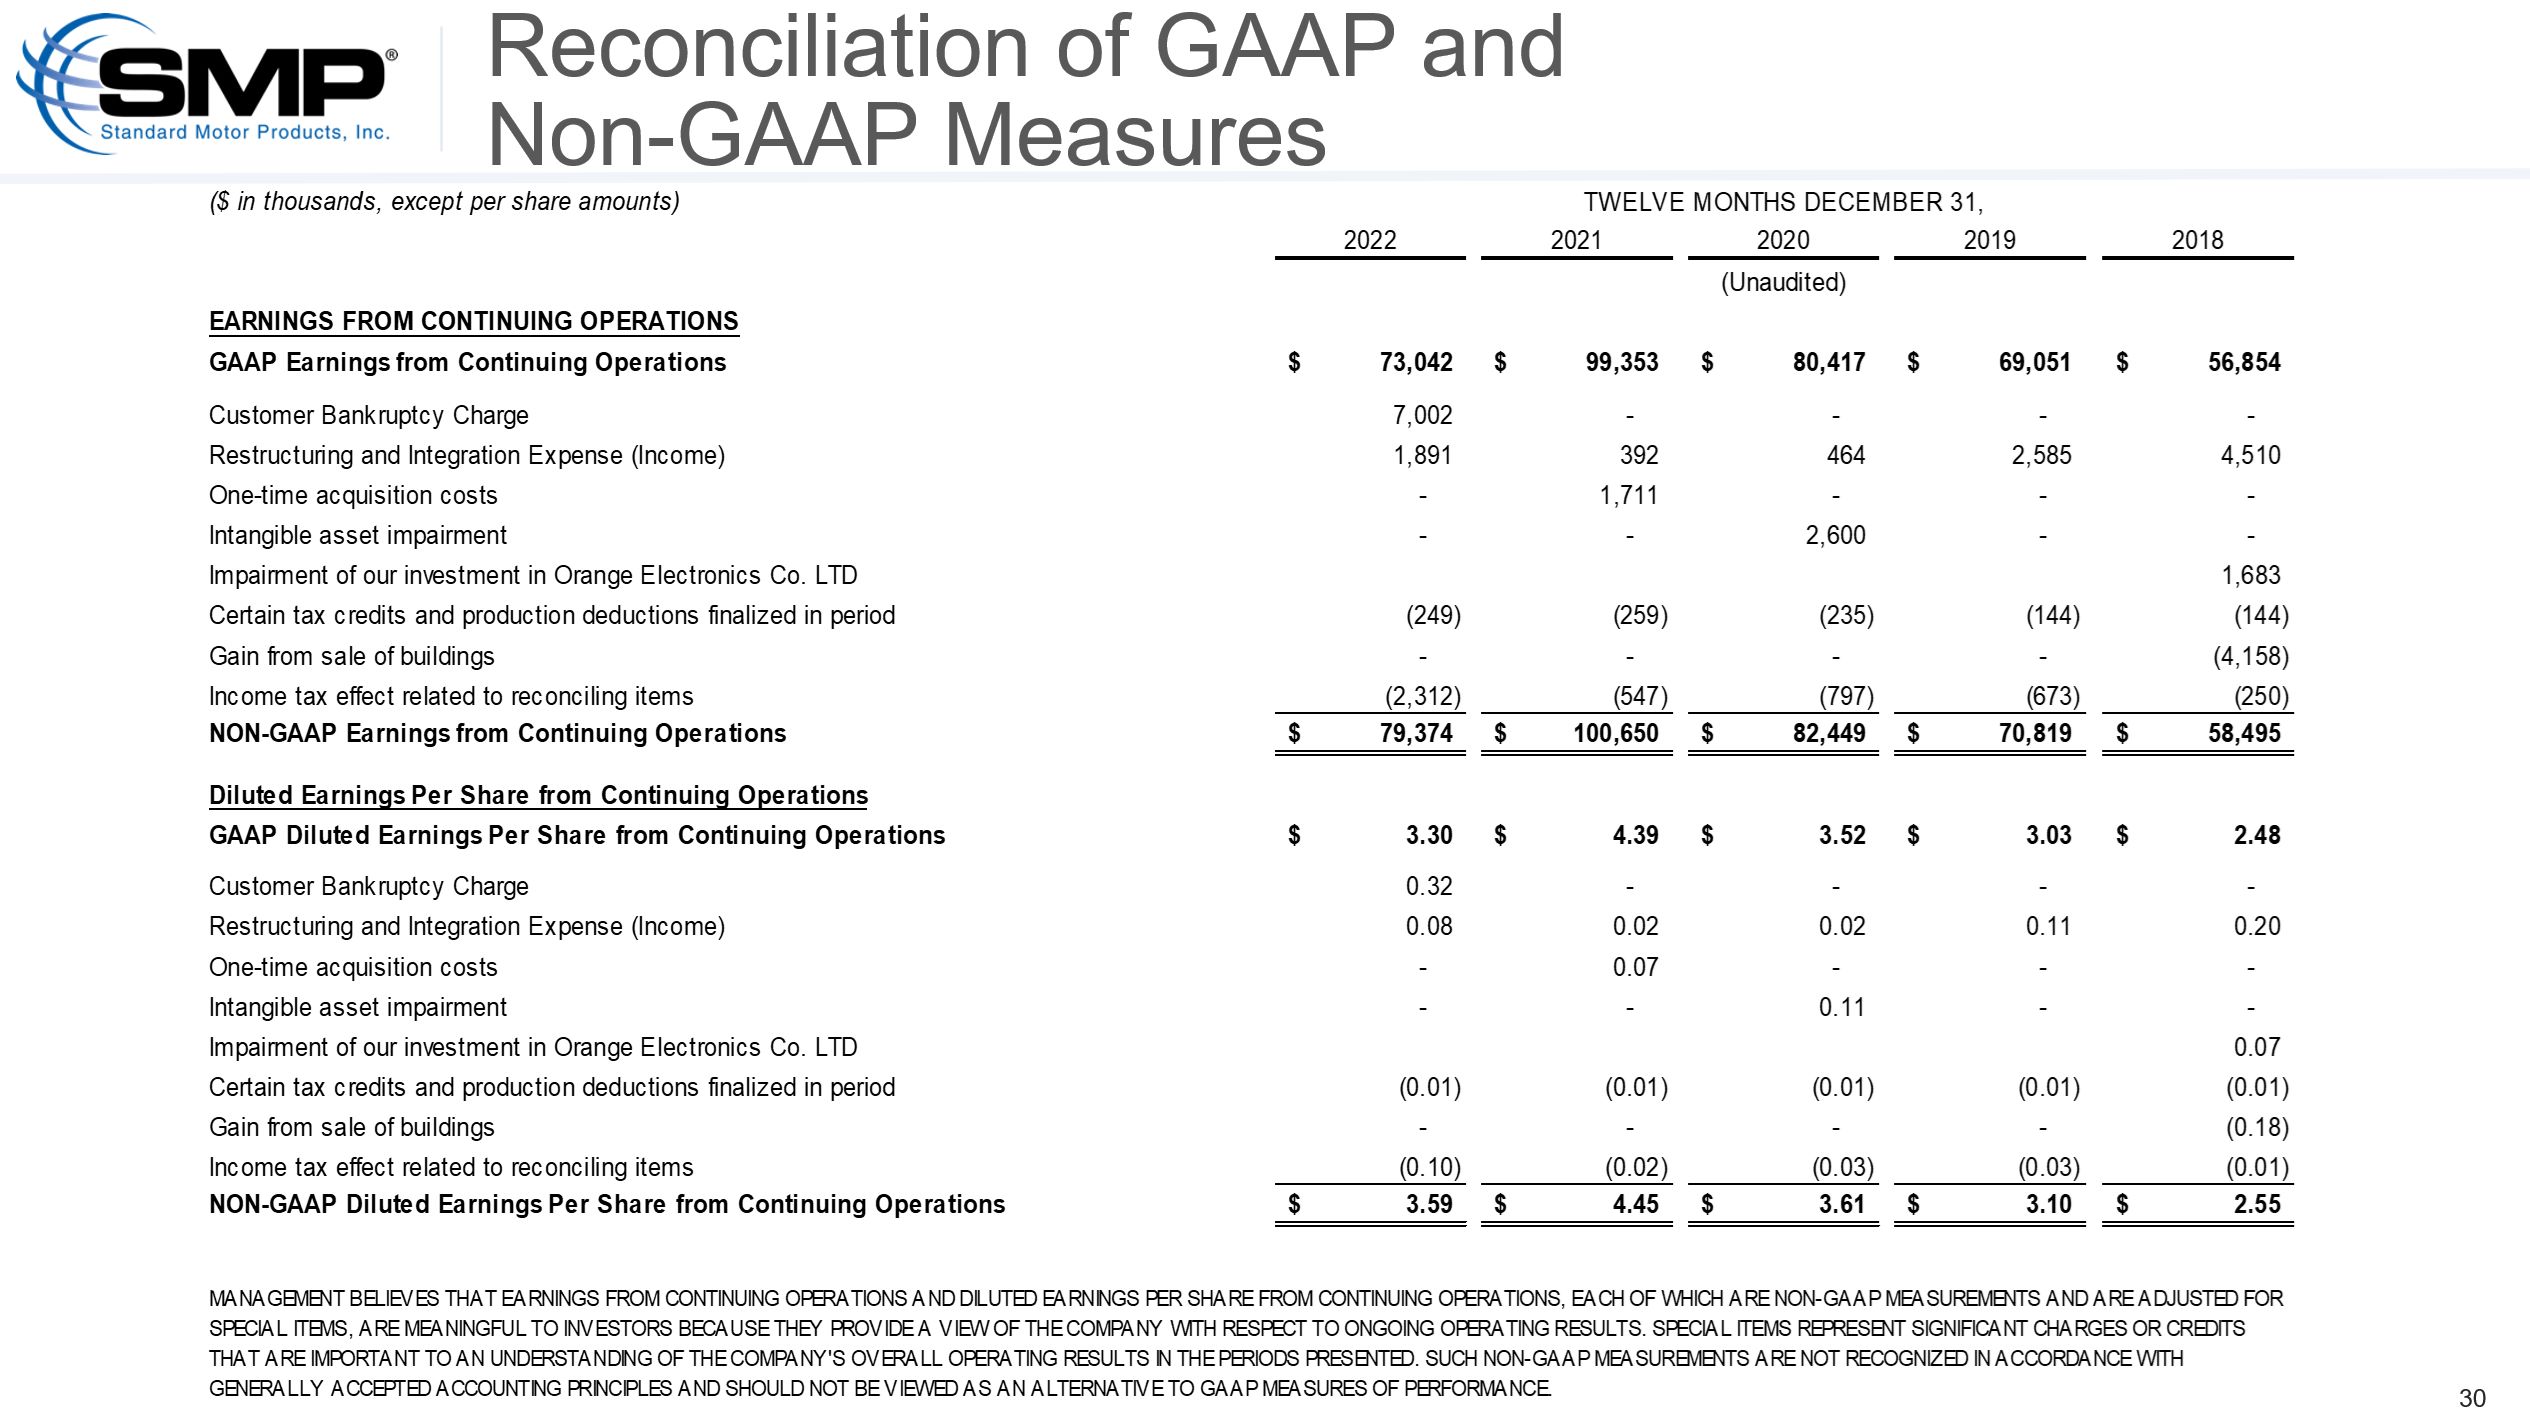
STANDARD MOTOR PRODUCTS, INC.
Reconciliation of GAAP and Non-GAAP Measures
(In thousands, except per share amounts)
|
THREE MONTHS ENDED
DECEMBER 31,
|
TWELVE MONTHS ENDED
DECEMBER 31,
|
|||||||||||||||
|
2022
|
2021
|
2022
|
2021
|
|||||||||||||
|
(Unaudited)
|
(Unaudited)
|
|||||||||||||||
|
EARNINGS FROM CONTINUING OPERATIONS ATTRIBUTABLE TO SMP
|
||||||||||||||||
|
GAAP EARNINGS FROM CONTINUING OPERATIONS
|
$
|
8,548
|
$
|
20,022
|
$
|
73,042
|
$
|
99,353
|
||||||||
|
RESTRUCTURING AND INTEGRATION EXPENSES
|
1,847
|
226
|
1,891
|
392
|
||||||||||||
|
CUSTOMER BANKRUPTCY CHARGE
|
7,002
|
-
|
7,002
|
-
|
||||||||||||
|
ONE-TIME ACQUISITION COSTS
|
-
|
105
|
-
|
1,711
|
||||||||||||
|
CERTAIN TAX CREDITS AND PRODUCTION DEDUCTIONS FINALIZED IN PERIOD
|
-
|
-
|
(249
|
)
|
(259
|
)
|
||||||||||
|
INCOME TAX EFFECT RELATED TO RECONCILING ITEMS
|
(2,301
|
)
|
(86
|
)
|
(2,312
|
)
|
(547
|
)
|
||||||||
|
NON-GAAP EARNINGS FROM CONTINUING OPERATIONS
|
$
|
15,096
|
$
|
20,267
|
$
|
79,374
|
$
|
100,650
|
||||||||
|
DILUTED EARNINGS PER SHARE FROM CONTINUING OPERATIONS ATTRIBUTABLE TO SMP
|
||||||||||||||||
|
GAAP DILUTED EARNINGS PER SHARE FROM CONTINUING OPERATIONS
|
$
|
0.39
|
$
|
0.89
|
$
|
3.30
|
$
|
4.39
|
||||||||
|
RESTRUCTURING AND INTEGRATION EXPENSES
|
0.08
|
0.01
|
0.08
|
0.02
|
||||||||||||
|
CUSTOMER BANKRUPTCY CHARGE
|
0.32
|
-
|
0.32
|
-
|
||||||||||||
|
ONE-TIME ACQUISITION COSTS
|
-
|
-
|
-
|
0.07
|
||||||||||||
|
CERTAIN TAX CREDITS AND PRODUCTION DEDUCTIONS FINALIZED IN PERIOD
|
-
|
-
|
(0.01
|
)
|
(0.01
|
)
|
||||||||||
|
INCOME TAX EFFECT RELATED TO RECONCILING ITEMS
|
(0.10
|
)
|
-
|
(0.10
|
)
|
(0.02
|
)
|
|||||||||
|
NON-GAAP DILUTED EARNINGS PER SHARE FROM CONTINUING OPERATIONS
|
$
|
0.69
|
$
|
0.90
|
$
|
3.59
|
$
|
4.45
|
||||||||
|
OPERATING INCOME
|
||||||||||||||||
|
GAAP OPERATING INCOME
|
$
|
15,712
|
$
|
24,212
|
$
|
104,135
|
$
|
128,999
|
||||||||
|
RESTRUCTURING AND INTEGRATION EXPENSES
|
1,847
|
226
|
1,891
|
392
|
||||||||||||
|
CUSTOMER BANKRUPTCY CHARGE
|
7,002
|
-
|
7,002
|
-
|
||||||||||||
|
ONE-TIME ACQUISITION COSTS
|
-
|
105
|
-
|
1,711
|
||||||||||||
|
OTHER (INCOME) EXPENSE, NET
|
(70
|
)
|
1
|
(113
|
)
|
(7
|
)
|
|||||||||
|
NON-GAAP OPERATING INCOME
|
$
|
24,491
|
$
|
24,544
|
$
|
112,915
|
$
|
131,095
|
||||||||
|
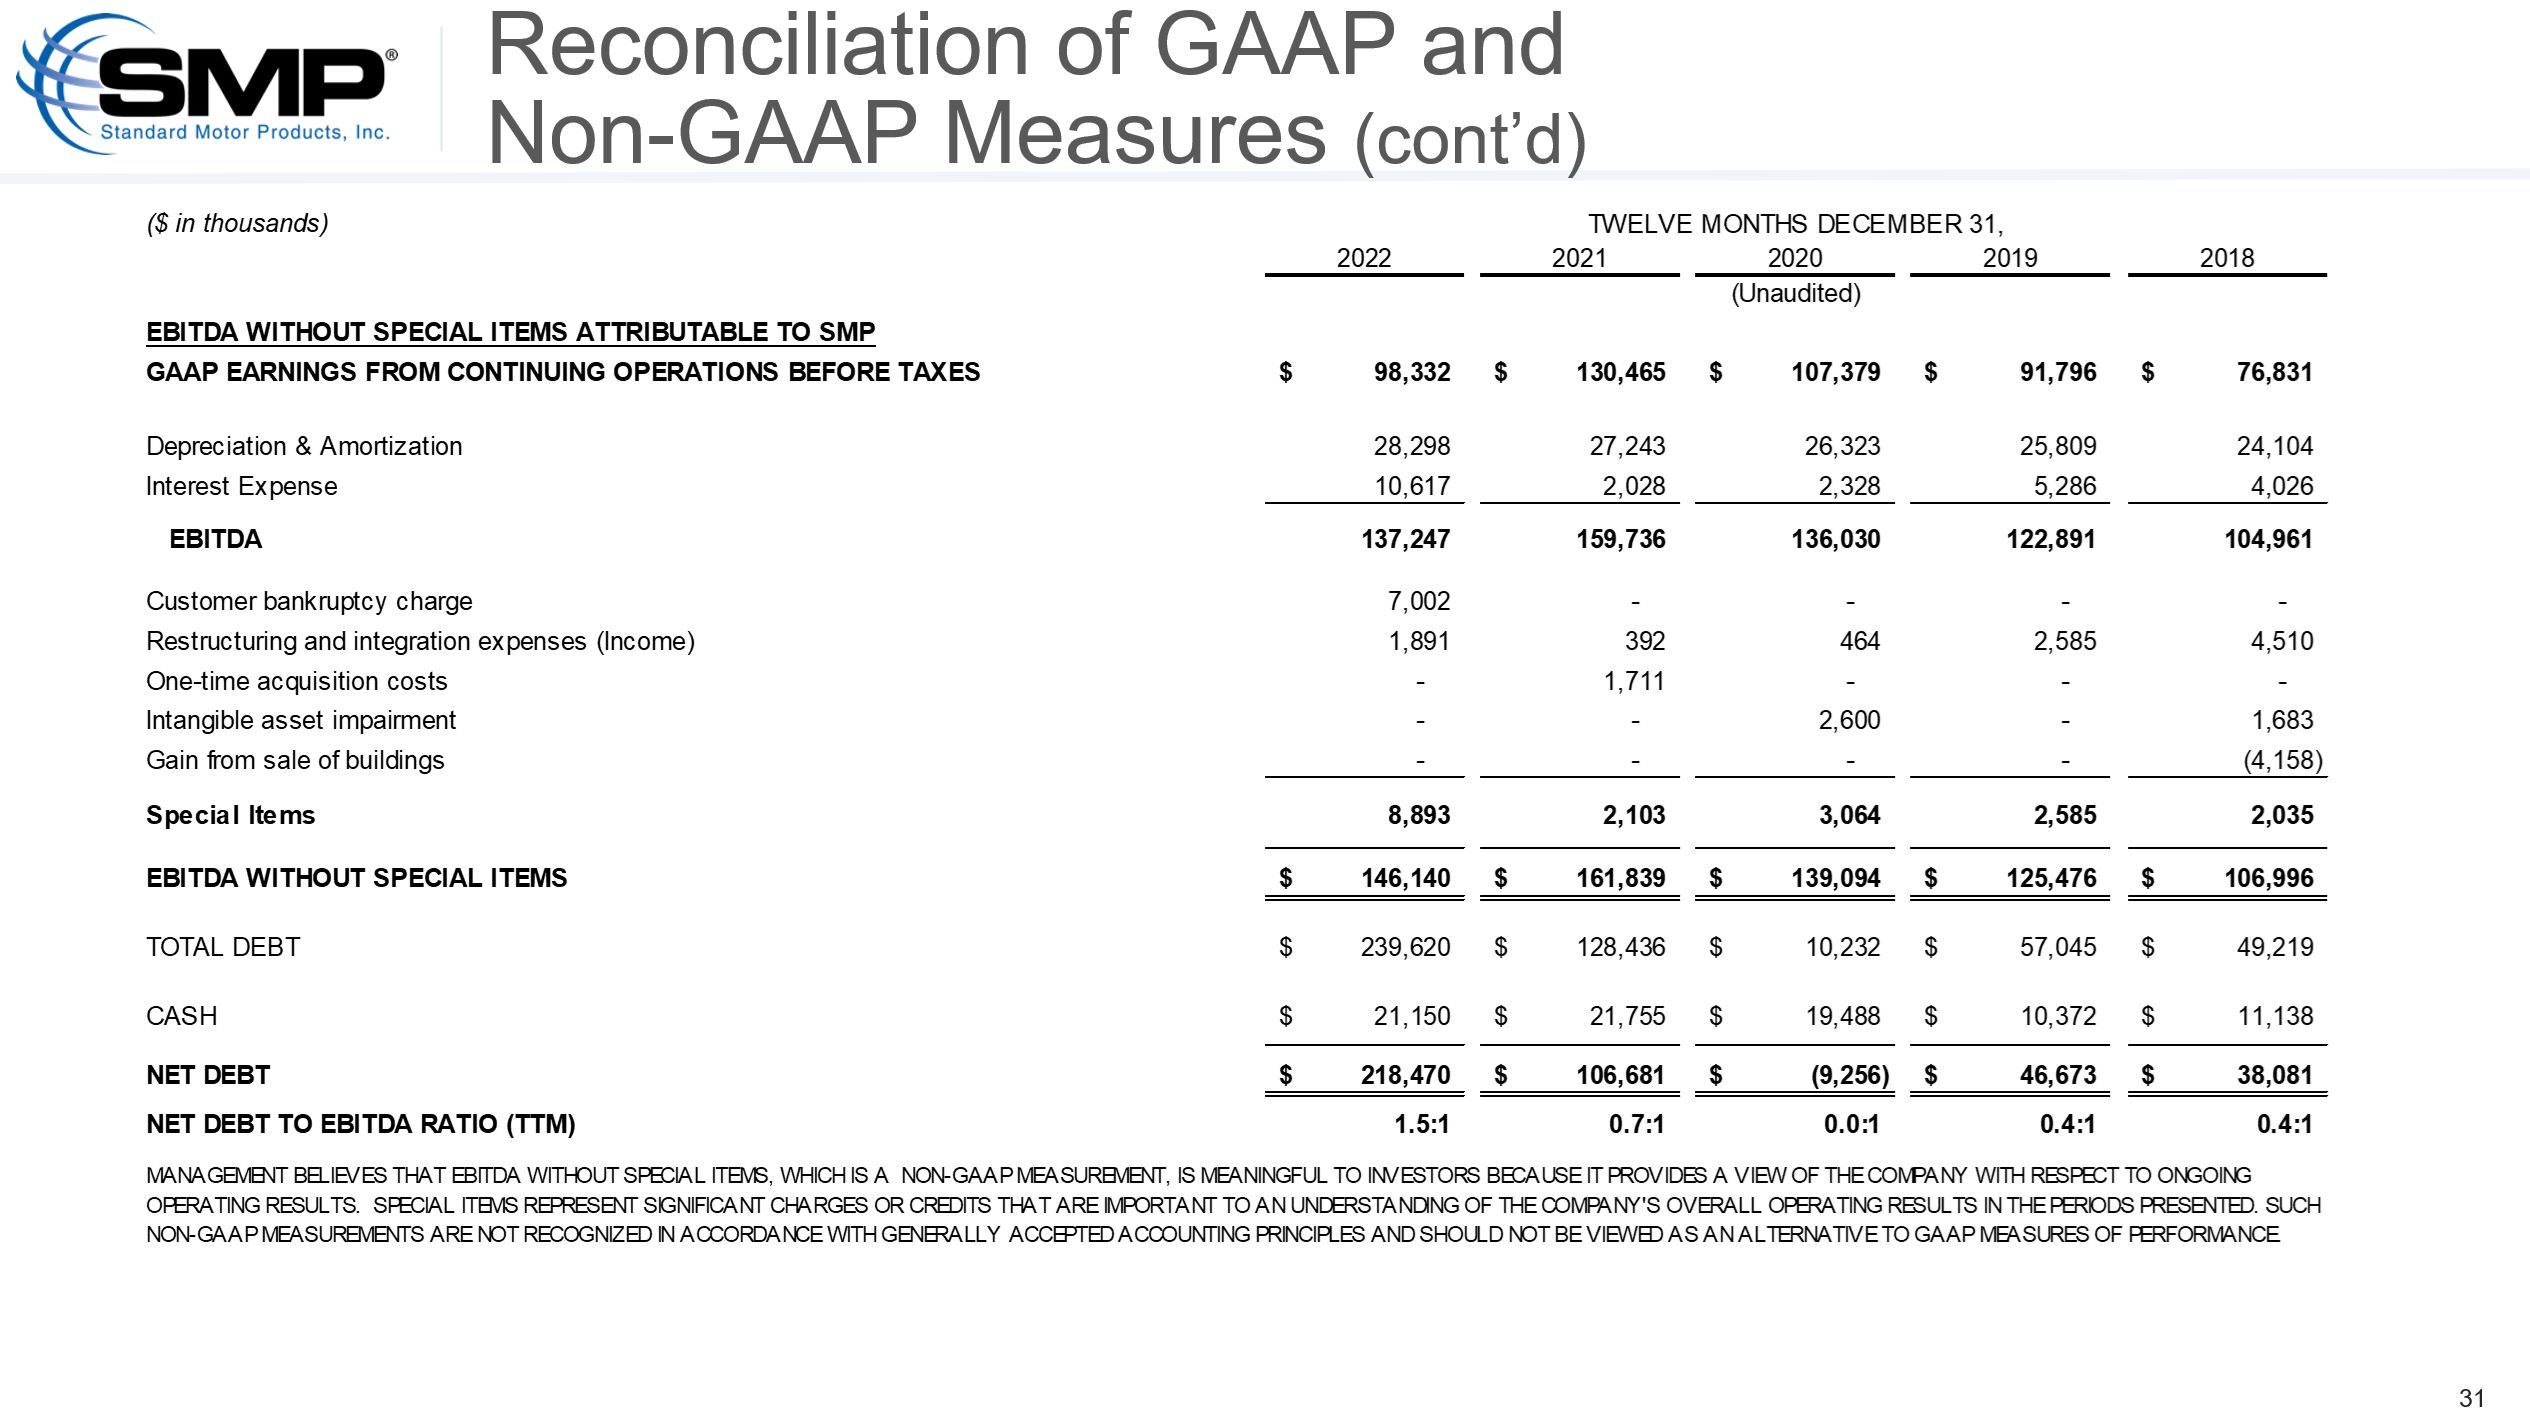
EBITDA WITHOUT SPECIAL ITEMS
|
||||||||||||||||
|
GAAP EARNINGS FROM CONTINUING OPERATIONS BEFORE TAXES
|
$
|
11,302
|
$
|
24,787
|
$
|
98,332
|
$
|
130,465
|
||||||||
|
DEPRECIATION AND AMORTIZATION
|
7,403
|
7,083
|
28,298
|
27,243
|
||||||||||||
|
INTEREST EXPENSE
|
4,335
|
672
|
10,617
|
2,028
|
||||||||||||
|
EBITDA
|
23,040
|
32,542
|
137,247
|
159,736
|
||||||||||||
|
RESTRUCTURING AND INTEGRATION EXPENSES
|
1,847
|
226
|
1,891
|
392
|
||||||||||||
|
CUSTOMER BANKRUPTCY CHARGE
|
7,002
|
-
|
7,002
|
-
|
||||||||||||
|
ONE-TIME ACQUISITION COSTS
|
-
|
105
|
-
|
1,711
|
||||||||||||
|
SPECIAL ITEMS
|
8,849
|
331
|
8,893
|
2,103
|
||||||||||||
|
EBITDA WITHOUT SPECIAL ITEMS
|
$
|
31,889
|
$
|
32,873
|
$
|
146,140
|
$
|
161,839
|
||||||||
MANAGEMENT BELIEVES THAT NON-GAAP EARNINGS FROM CONTINUING OPERATIONS AND NON-GAAP DILUTED EARNINGS PER SHARE FROM CONTINUING OPERATIONS WHICH ARE ATTRIBUTABLE TO SMP,
AND NON-GAAP OPERATING INCOME AND EBITDA WITHOUT SPECIAL ITEMS, EACH OF WHICH ARE NON-GAAP MEASUREMENTS AND ARE ADJUSTED FOR SPECIAL ITEMS, ARE MEANINGFUL TO INVESTORS BECAUSE THEY PROVIDE A VIEW OF THE COMPANY WITH RESPECT TO ONGOING OPERATING
RESULTS. SPECIAL ITEMS REPRESENT SIGNIFICANT CHARGES OR CREDITS THAT ARE IMPORTANT TO AN UNDERSTANDING OF THE COMPANY'S OVERALL OPERATING RESULTS IN THE PERIODS PRESENTED. SUCH NON-GAAP MEASUREMENTS ARE NOT RECOGNIZED IN ACCORDANCE WITH GENERALLY
ACCEPTED ACCOUNTING PRINCIPLES AND SHOULD NOT BE VIEWED AS AN ALTERNATIVE TO GAAP MEASURES OF PERFORMANCE.
STANDARD MOTOR PRODUCTS, INC.
Condensed Consolidated Balance Sheets
(In thousands)
|
December 31,
2022
|
December 31,
2021
|
|||||||
|
(Unaudited)
|
||||||||
|
ASSETS
|
||||||||
|
CASH
|
$
|
21,150
|
$
|
21,755
|
||||
|
ACCOUNTS RECEIVABLE, GROSS
|
173,013
|
186,774
|
||||||
|
ALLOWANCE FOR EXPECTED CREDIT LOSSES
|
5,375
|
6,170
|
||||||
|
ACCOUNTS RECEIVABLE, NET
|
167,638
|
180,604
|
||||||
|
INVENTORIES
|
528,715
|
468,755
|
||||||
|
UNRETURNED CUSTOMER INVENTORY
|
19,695
|
22,268
|
||||||
|
OTHER CURRENT ASSETS
|
25,241
|
17,823
|
||||||
|
TOTAL CURRENT ASSETS
|
762,439
|
711,205
|
||||||
|
PROPERTY, PLANT AND EQUIPMENT, NET
|
107,148
|
102,786
|
||||||
|
OPERATING LEASE RIGHT-OF-USE ASSETS
|
49,838
|
40,469
|
||||||
|
GOODWILL
|
132,087
|
131,652
|
||||||
|
OTHER INTANGIBLES, NET
|
100,504
|
106,234
|
||||||
|
DEFERRED INCOME TAXES
|
33,658
|
36,126
|
||||||
|
INVESTMENT IN UNCONSOLIDATED AFFILIATES
|
41,745
|
44,087
|
||||||
|
OTHER ASSETS
|
27,510
|
25,402
|
||||||
|
TOTAL ASSETS
|
$
|
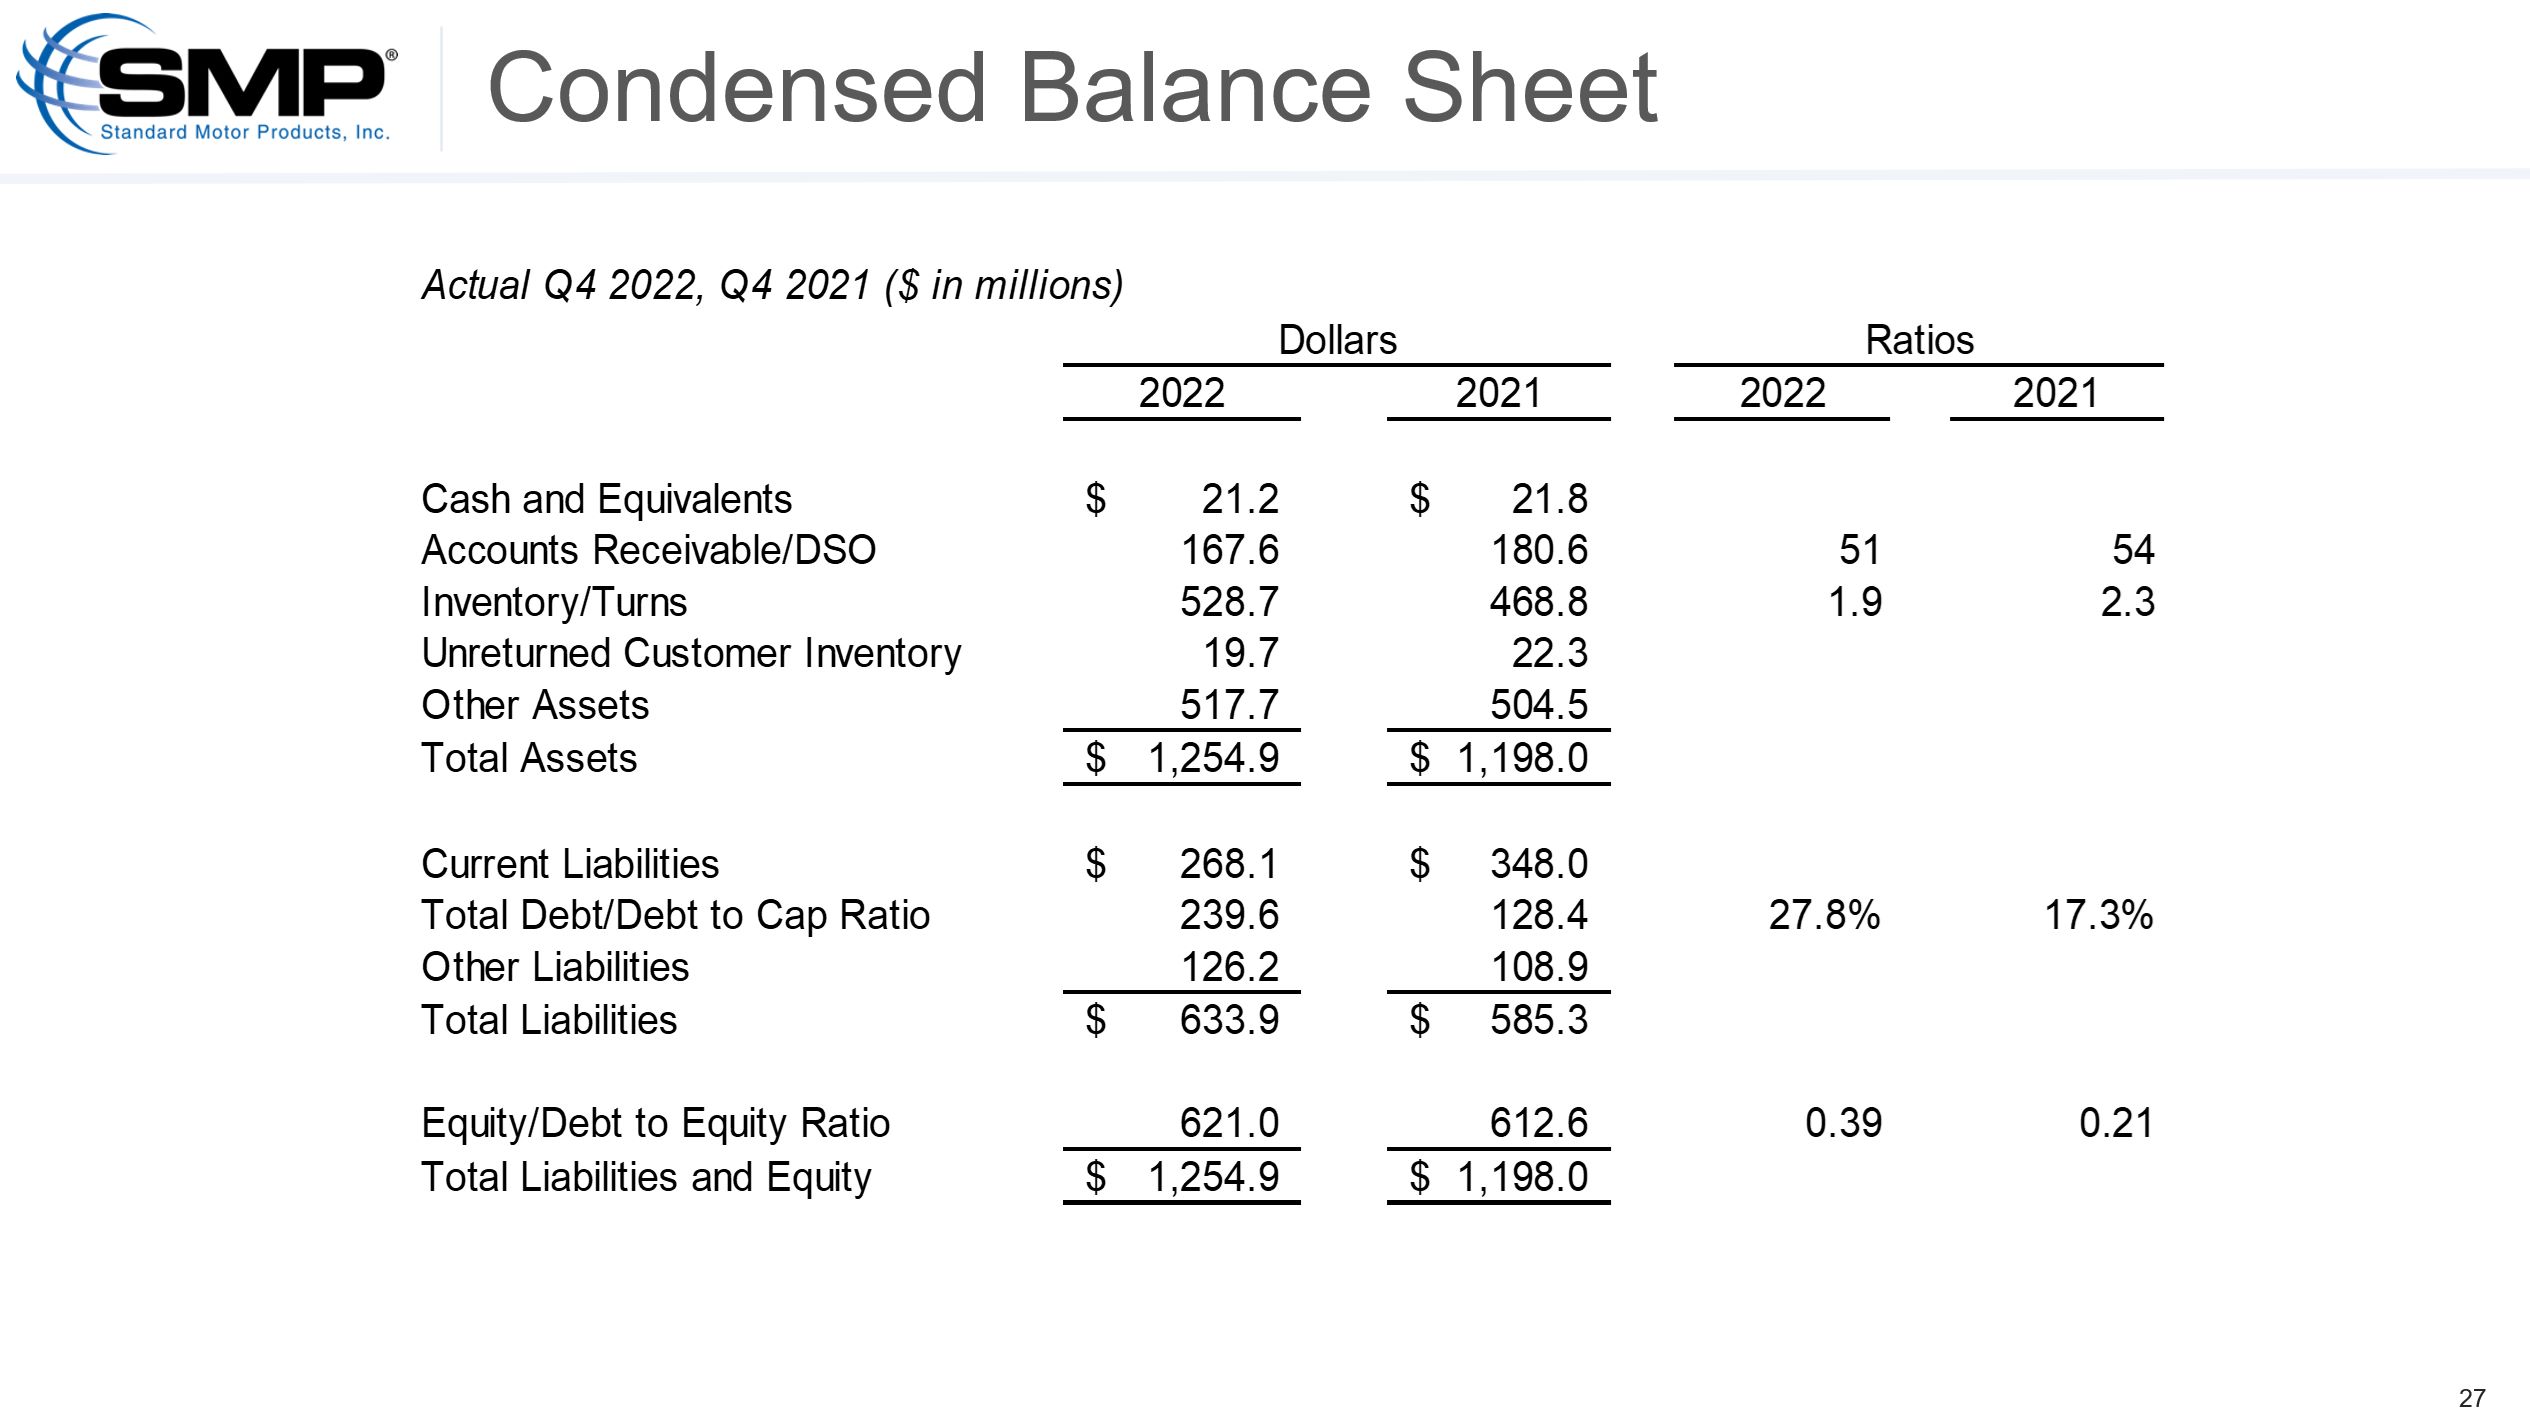
1,254,929
|
$
|
1,197,961
|
||||
|
LIABILITIES AND STOCKHOLDERS' EQUITY
|
||||||||
|
CURRENT PORTION OF REVOLVING CREDIT FACILITY
|
$
|
50,000
|
$
|
125,298
|
||||
|
CURRENT PORTION OF TERM LOAN AND OTHER DEBT
|
5,031
|
3,117
|
||||||
|
ACCOUNTS PAYABLE
|
89,247
|
137,167
|
||||||
|
ACCRUED CUSTOMER RETURNS
|
37,169
|
42,412
|
||||||
|
ACCRUED CORE LIABILITY
|
22,952
|
23,663
|
||||||
|
ACCRUED REBATES
|
37,381
|
42,472
|
||||||
|
PAYROLL AND COMMISSIONS
|
31,361
|
45,058
|
||||||
|
SUNDRY PAYABLES AND ACCRUED EXPENSES
|
49,990
|
57,182
|
||||||
|
TOTAL CURRENT LIABILITIES
|
323,131
|
476,369
|
||||||
|
OTHER LONG-TERM DEBT
|
184,589
|
21
|
||||||
|
NONCURRENT OPERATING LEASE LIABILITY
|
40,709
|
31,206
|
||||||
|
ACCRUED ASBESTOS LIABILITIES
|
63,305
|
52,698
|
||||||
|
OTHER LIABILITIES
|
22,157
|
25,040
|
||||||
|
TOTAL LIABILITIES
|
633,891
|
585,334
|
||||||
|
TOTAL SMP STOCKHOLDERS' EQUITY
|
610,020
|
601,580
|
||||||
|
NONCONTROLLING INTEREST
|
11,018
|
11,047
|
||||||
|
TOTAL STOCKHOLDERS' EQUITY
|
621,038
|
612,627
|
||||||
|
TOTAL LIABILITIES AND STOCKHOLDERS' EQUITY
|
$
|
1,254,929
|
$
|
1,197,961
|
||||
STANDARD MOTOR PRODUCTS, INC.
Condensed Consolidated Statements of Cash Flows
(In thousands)
|
TWELVE MONTHS ENDED
DECEMBER 31,
|
||||||||
|
2022
|
2021
|
|||||||
|
(Unaudited)
|
||||||||
|
CASH FLOWS FROM OPERATING ACTIVITIES
|
||||||||
|
NET EARNINGS
|
$
|
55,435
|
$
|
90,954
|
||||
|
ADJUSTMENTS TO RECONCILE NET EARNINGS TO NET CASH
|
||||||||
|
PROVIDED BY (USED IN) OPERATING ACTIVITIES:
|
||||||||
|
DEPRECIATION AND AMORTIZATION
|
28,298
|
27,243
|
||||||
|
LOSS FROM DISCONTINUED OPERATIONS, NET OF TAXES
|
17,691
|
8,467
|
||||||
|
CUSTOMER BANKRUPTCY CHARGE
|
7,002
|
-
|
||||||
|
OTHER
|
13,064
|
7,456
|
||||||
|
CHANGE IN ASSETS AND LIABILITIES:
|
||||||||
|
ACCOUNTS RECEIVABLE
|
6,916
|
28,464
|
||||||
|
INVENTORY
|
(67,495
|
)
|
(107,609
|
)
|
||||
|
ACCOUNTS PAYABLE
|
(48,604
|
)
|
33,046
|
|||||
|
PREPAID EXPENSES AND OTHER CURRENT ASSETS
|
(5,509
|
)
|
(843
|
)
|
||||
|
SUNDRY PAYABLES AND ACCRUED EXPENSES
|
(29,089
|
)
|
13,430
|
|||||
|
OTHER
|
(5,242
|
)
|
(15,044
|
)
|
||||
|
NET CASH PROVIDED BY (USED IN) OPERATING ACTIVITIES
|
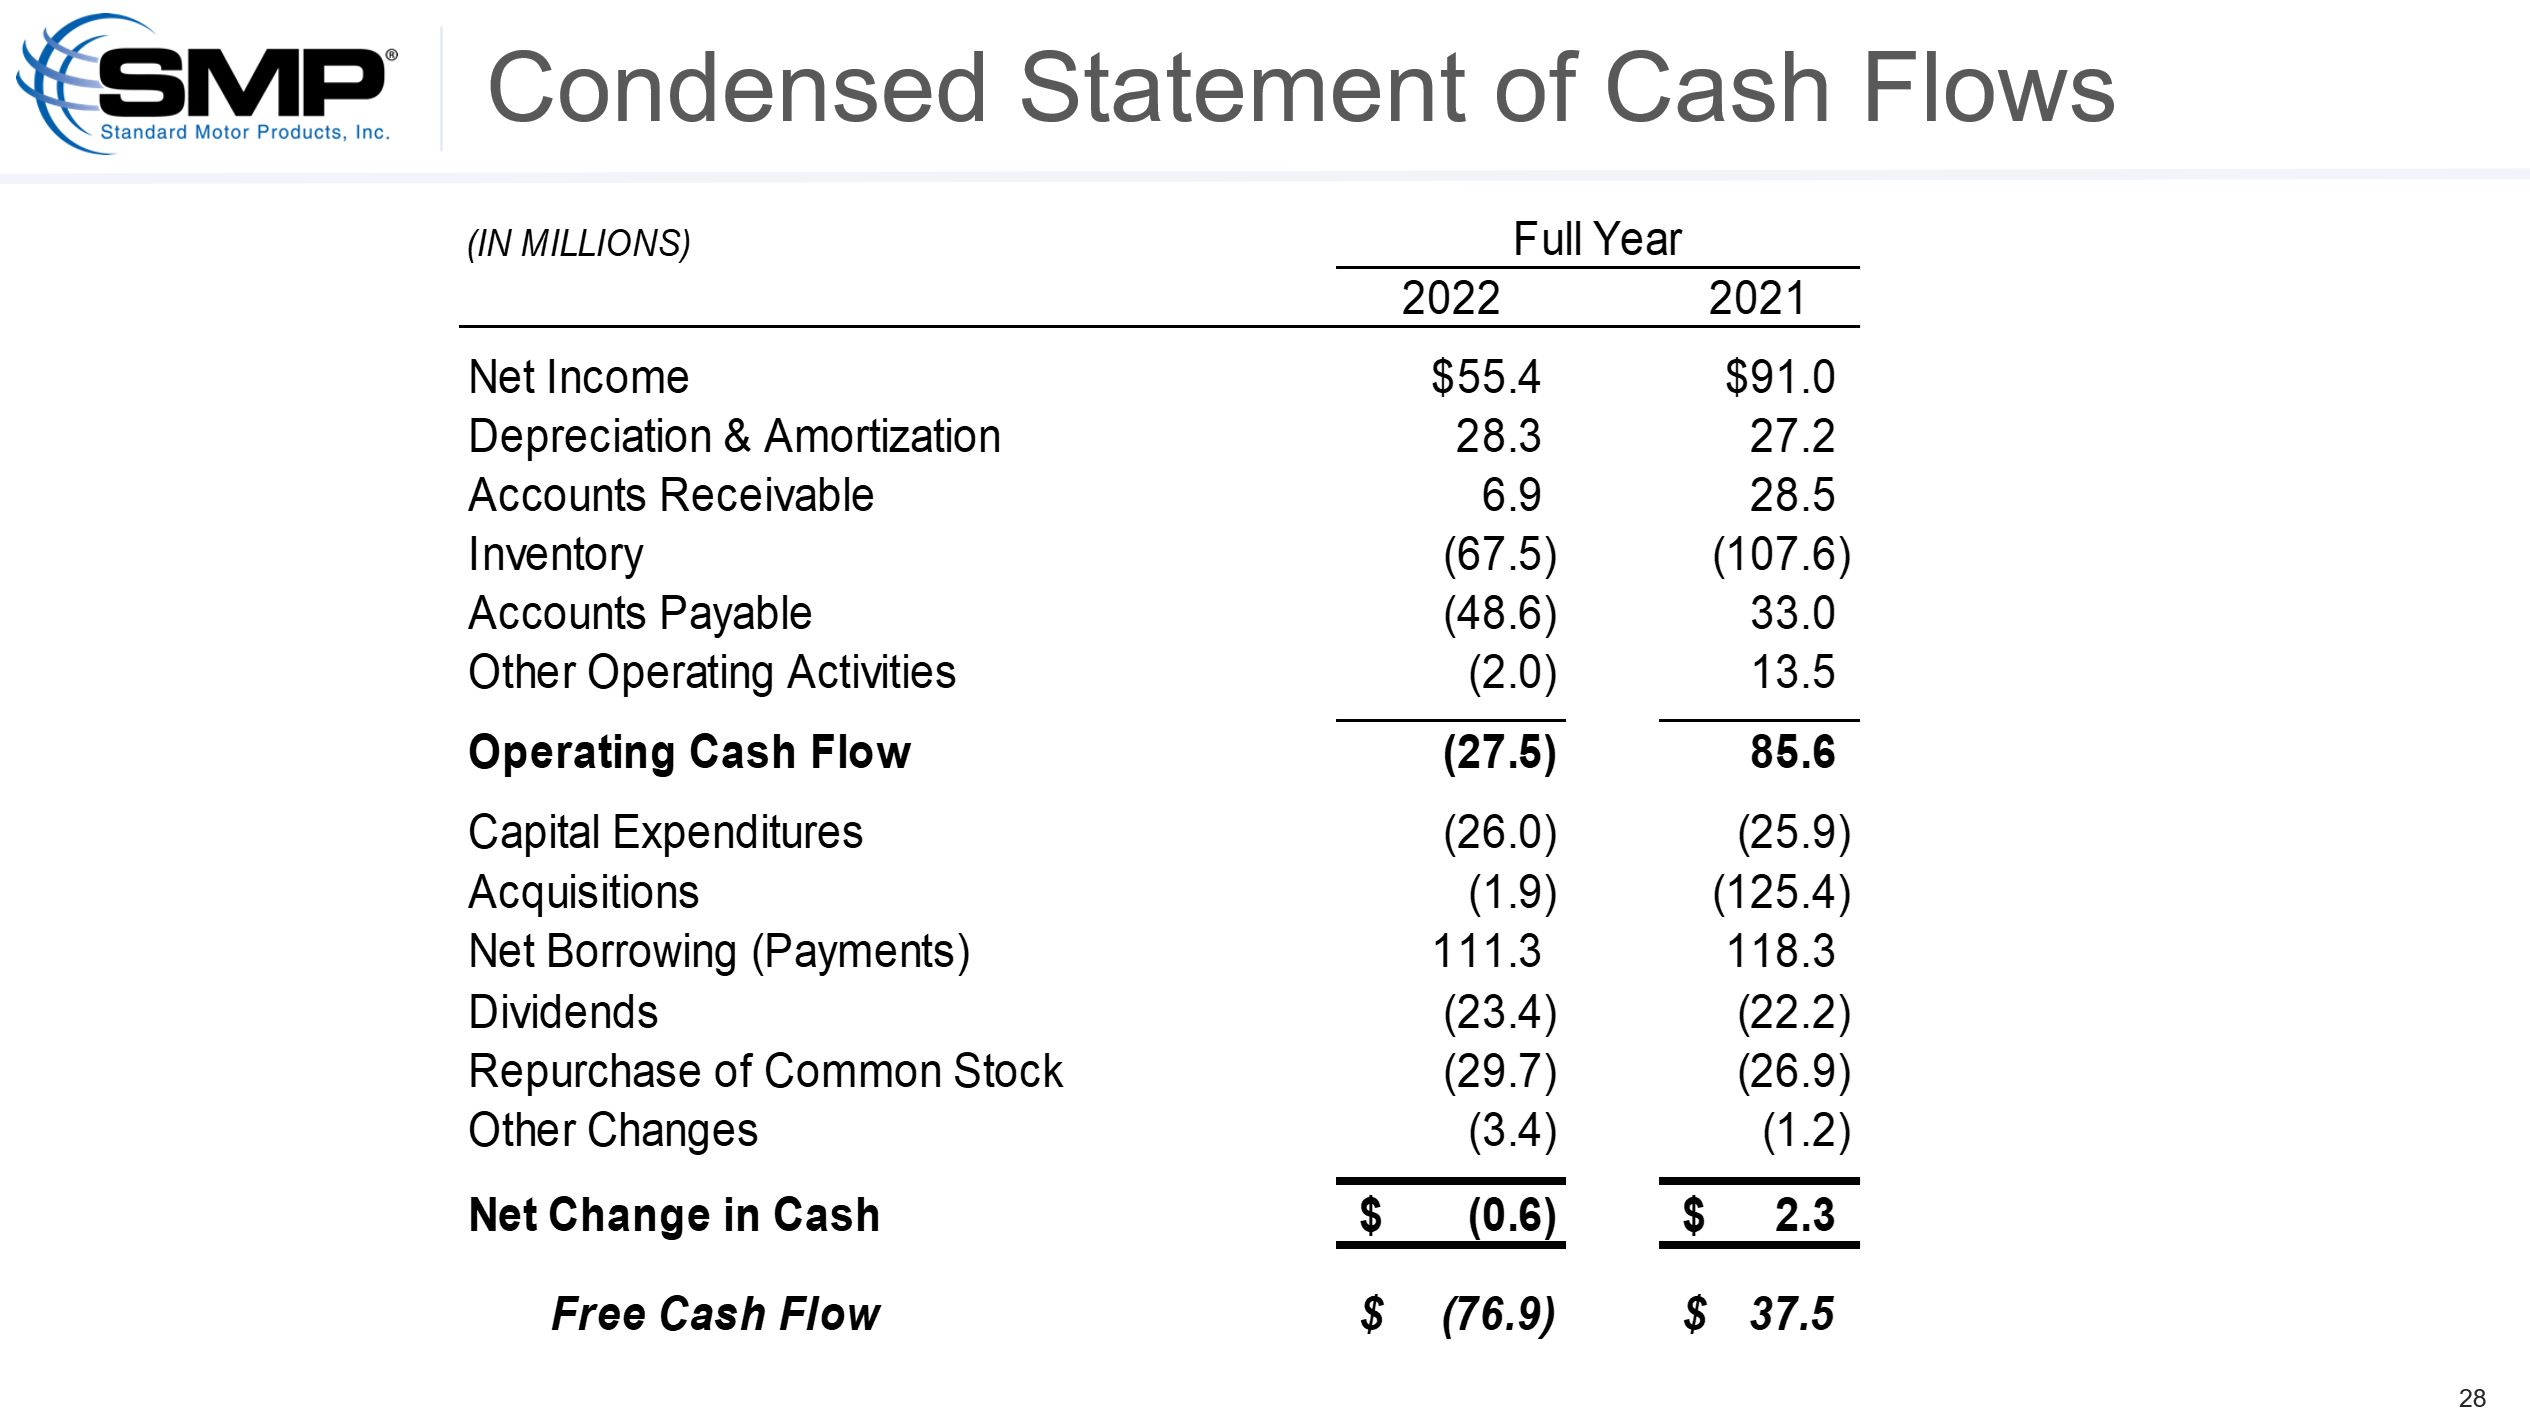
(27,533
|
)
|
85,564
|
|||||
|
CASH FLOWS FROM INVESTING ACTIVITIES
|
||||||||
|
ACQUISITIONS OF AND INVESTMENTS IN BUSINESSES
|
(1,934
|
)
|
(125,419
|
)
|
||||
|
CAPITAL EXPENDITURES
|
(25,956
|
)
|
(25,875
|
)
|
||||
|
OTHER INVESTING ACTIVITIES
|
73
|
45
|
||||||
|
NET CASH USED IN INVESTING ACTIVITIES
|
(27,817
|
)
|
(151,249
|
)
|
||||
|
CASH FLOWS FROM FINANCING ACTIVITIES
|
||||||||
|
NET CHANGE IN DEBT
|
111,307
|
118,346
|
||||||
|
PURCHASE OF TREASURY STOCK
|
(29,656
|
)
|
(26,862
|
)
|
||||
|
DIVIDENDS PAID
|
(23,428
|
)
|
(22,179
|
)
|
||||
|
DIVIDENDS PAID TO NONCONTROLLING INTEREST
|
-
|
(540
|
)
|
|||||
|
PAYMENTS OF DEBT ISSUANCE COSTS
|
(2,128
|
)
|
-
|
|||||
|
OTHER FINANCING ACTIVITIES
|
(595
|
)
|
247
|
|||||
|
NET CASH PROVIDED BY FINANCING ACTIVITIES
|
55,500
|
69,012
|
||||||
|
EFFECT OF EXCHANGE RATE CHANGES ON CASH
|
(755
|
)
|
(1,060
|
)
|
||||
|
NET INCREASE (DECREASE) IN CASH AND CASH EQUIVALENTS
|
(605
|
)
|
2,267
|
|||||
|
CASH AND CASH EQUIVALENTS at beginning of period
|
21,755
|
19,488
|
||||||
|
CASH AND CASH EQUIVALENTS at end of period
|
$
|
21,150
|
$
|
21,755
|
||||