8-K
CAPITAL SENIOR LIVING CORP false 0001043000 0001043000 2020-11-05 2020-11-05


UNITED STATES

SECURITIES AND EXCHANGE COMMISSION

WASHINGTON, DC 20549


FORM 8-K


CURRENT REPORT

PURSUANT TO SECTION 13 OR 15(d)

OF THE SECURITIES EXCHANGE ACT OF 1934

Date of Report (Date of earliest event reported) November 5, 2020


Capital Senior Living Corporation

(Exact name of registrant as specified in its charter)


Delaware

(State or other jurisdiction of incorporation)


1-13445   75-2678809
(Commission File Number)   (IRS Employer Identification No.)


14160 Dallas Parkway

Suite 300

Dallas, Texas

  75254
(Address of principal executive offices)   (Zip Code)

(972) 770-5600

(Registrant’s telephone number, including area code)

Not applicable

(Former name or former address, if changed since last report)


Check the appropriate box below if the Form 8-K filing is intended to simultaneously satisfy the filing obligation of the registrant under any of the following provisions (see General Instruction A.2. below):


☐

Written communications pursuant to Rule 425 under the Securities Act (17 CFR 230.425)


☐

Soliciting material pursuant to Rule 14a-12 under the Exchange Act (17 CFR 240.14a-12)


☐

Pre-commencement communications pursuant to Rule 14d-2(b) under the Exchange Act (17 CFR 240.14d-2(b))


☐

Pre-commencement communications pursuant to Rule 13e-4(c) under the Exchange Act (17 CFR 240.13e-4(c))

Indicate by check mark whether the registrant is an emerging growth company as defined in Rule 405 of the Securities Act of 1933 (§230.405 of this chapter) or Rule 12b-2 of the Securities Exchange Act of 1934 (§240.12b-2 of this chapter).

Emerging growth company  ☐            

If an emerging growth company, indicate by check mark if the registrant has elected not to use the extended transition period for complying with any new or revised financial accounting standards provided pursuant to Section 13(a) of the Exchange Act.  ☐

Securities registered pursuant to Section 12(b) of the Act:


Title of each class


Trading

symbol(s)


Name of each exchange

on which registered

Common Stock, par value $0.01 per share    CSU    New York Stock Exchange


Item 2.02

Results of Operations and Financial Condition.

On November 5, 2020, Capital Senior Living Corporation (the “Company”) announced its financial results for the third quarter ended September 30, 2020, by issuing a press release. The full text of the press release issued in connection with the announcement is attached hereto as Exhibit 99.1.

The information being furnished under Item 2.02, Item 7.01, Exhibit 99.1 and Exhibit 99.2 shall not be deemed “filed” for purposes of the Securities Exchange Act of 1934, as amended (the “Exchange Act”), or incorporated by reference in any filing under the Securities Act of 1933, as amended, or the Exchange Act, except as may be expressly set forth by specific reference in such a filing. The press release and the presentation referenced below contain, and may implicate, forward-looking statements regarding the Company and include cautionary statements identifying important factors that could cause actual results to differ materially from those anticipated.

In the press release and the presentation referenced below, the Company’s management utilizes Adjusted EBITDAR and Adjusted EBITDAR excluding COVID-19 impact as financial valuation measures and Adjusted Net Income (Loss), Adjusted Net Income (Loss) excluding COVID-19 impact, Adjusted CFFO and Adjusted CFFO excluding COVID-19 impact as financial performance measures that are not calculated in accordance with U.S. generally accepted accounting principles (“GAAP”). Non-GAAP financial measures may have material limitations in that they do not reflect all of the costs associated with the Company’s results of operations as determined in accordance with GAAP. As a result, these non-GAAP financial measures should not be considered a substitute for, nor superior to, financial results and measures determined or calculated in accordance with GAAP.

The Company believes that presenting Adjusted EBITDAR excluding COVID-19 impact, Adjusted Net Income/(Loss) excluding COVID-19 impact, and Adjusted CFFO excluding COVID-19 impact is useful to investors to assess certain recent impacts of the COVID-19 pandemic on the Company’s financial position, results of operations and the non-GAAP financial valuation and performance measures that the Company has historically presented to investors.

Adjusted EBITDAR is a valuation measure commonly used by the Company’s management, research analysts and investors to value companies in the senior living industry. Since Adjusted EBITDAR excludes interest expense and rent expense, it allows the Company’s management, research analysts and investors to compare the enterprise values of different companies without regard to differences in capital structures and leasing arrangements. The Company believes Adjusted EBITDAR excluding COVID-19 impact is a valuable measure as it normalizes the impact of COVID-19 for valuation purposes.

The Company believes that Adjusted Net Income (Loss), Adjusted Net Income (Loss) excluding COVID-19 impact, Adjusted CFFO and Adjusted CFFO excluding COVID-19 impact are useful as performance measures in identifying trends in day-to-day operations because they exclude the costs associated with acquisitions and conversions and other items that do not ordinarily reflect the ongoing operating results of the Company’s primary business. Adjusted Net Income (Loss), Adjusted Net Income (Loss) excluding COVID-19 impact, Adjusted CFFO and Adjusted CFFO excluding COVID-19 impact provide indicators to management of progress in achieving both consolidated and individual business unit operating performance and are used by research analysts and investors to evaluate the performance of companies in the senior living industry.

The Company strongly urges investors to review on the last page of the press release the reconciliation of Net Loss to Adjusted EBITDAR and Adjusted EBITDAR excluding COVID-19 impact and the reconciliation of Net Income (Loss) to Adjusted Net Income (Loss), Adjusted Net Income (Loss) excluding COVID-19 impact, Adjusted CFFO and Adjusted CFFO excluding COVID-19 impact, along with the Company’s consolidated balance sheets, statements of operations, and statements of cash flows.


Item 7.01

Regulation FD Disclosure.

Attached hereto as Exhibit 99.2 is an updated slideshow presentation of the Company.

By filing this Current Report on Form 8-K, the Company does not acknowledge that disclosure of this information is required by Regulation FD or that the information was material or non-public before the disclosure. The Company assumes no obligation to update or supplement forward-looking statements in this presentation that become untrue because of new information, subsequent events or otherwise.


Item 9.01

Financial Statements and Exhibits.

(a) Not applicable.

(b) Not applicable.

(c) Not applicable.

(d) Exhibits.


*99.1    Press Release dated November 5, 2020.
*99.2    Capital Senior Living Corporation Updated Slideshow Presentation.
104    Cover Page Interactive Data File-formatted as Inline XBRL.


*

These exhibits to this Current Report on Form 8-K are not being filed but are being furnished pursuant to Item 9.01.


SIGNATURES

Pursuant to the requirements of the Securities Exchange Act of 1934, the registrant has duly caused this report to be signed on its behalf by the undersigned hereunto duly authorized.


Date: November 5, 2020     Capital Senior Living Corporation
    By:  

/s/ Carey P. Hendrickson

    Name:   Carey P. Hendrickson
    Title:   Executive Vice President and
      Chief Financial Officer

Exhibit 99.1


LOGO   

Investor Contact:

Carey Hendrickson, Chief Financial Officer

Phone: 1-972-770-5600

[email protected]

FOR IMMEDIATE RELEASE

CAPITAL SENIOR LIVING CORPORATION

REPORTS THIRD QUARTER 2020 RESULTS

Provides Update Related to COVID-19

DALLAS – November 5, 2020 – Capital Senior Living Corporation (the “Company”) (NYSE: CSU), one of the nation’s largest operators of senior housing communities, announced today operating and financial results for the third quarter ended September 30, 2020.

Recent Highlights


  •  

Move-ins for the third quarter of 2020 improved to approximately 88% of third quarter 2019 move-ins, up from 75% for second quarter 2020 move-ins as compared to the second quarter of 2019.


  •  

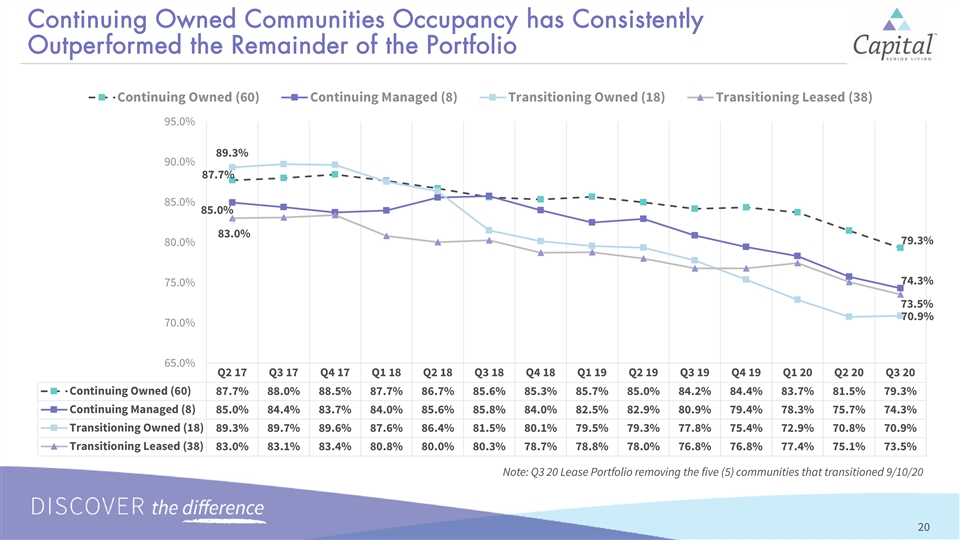
Consolidated occupancy declined 150 bps in the third quarter of 2020 as compared to the second quarter of 2020 due primarily to the impacts of COVID- 19.


  •  

The Company initiated the transfer of 18 communities that were either underperforming or were in underperforming loan pools to Fannie Mae, the holder of non-recourse debt on such communities, effective August 1, 2020. The transfer will reduce the Company’s debt by $216.3 million and improve annual cash flow by approximately $10 million. For GAAP purposes, a loss of $191.0 million related to the transfer was recorded in the third quarter, with a subsequent substantial gain to be recorded when the transfer is complete and the debt relieved, which is currently expected to occur in the fourth quarter of 2020.


  •  

The Company enhanced and extended a short-term forbearance agreement related to 10 loans with one of its lenders, providing $2.8 million of additional debt service relief from October 2020 through September 2021.


  •  

In connection with the successful restructuring of the Company’s leased portfolio, 20 formerly-leased communities were transitioned to other operators in mid- September through early November, with additional transitions expected to occur before year-end.


  •  

The Company and Ventas have agreed in principle that, commencing January 2021, the Company will manage all seven communities currently subject to a modified master lease between the companies, under a management agreement. This arrangement is consistent with the Company’s March 10, 2020 agreement regarding those seven communities and remains subject to completion of documentation and other conditions.

“During the third quarter, resident wellness and safety remained our highest priority. We continued to operate with enhanced infection control protocols to limit and manage incidents of COVID-19. I’m pleased that all of our communities are accepting new residents and have returned to more normalized operations while also diligently following state and federal guidelines,” said Kimberly S. Lody, President and Chief Executive Officer. “Our community teams have done an excellent job responding to changes in the operating model while keeping resident care as our highest priority throughout the pandemic. I am extremely proud of their dedication and diligence.”


Ms. Lody continued, “We have also continued to make significant progress on important elements of our strategic plan to improve our operating performance and reduce our long- term debt and lease obligations. We initiated the transfer of 18 Fannie communities in August which will substantially reduce our debt and has already improved monthly cash flow. Also, the transfer of our leased communities to other operators is on schedule, with 20 formerly-leased communities now transferred and most of the remaining communities scheduled for transfer during the remainder of 2020. This successful restructuring of our leased portfolio will result in the termination of all of our lease obligations by year-end and significantly improve our operating performance and cash flow.”

Financial Results - Third Quarter

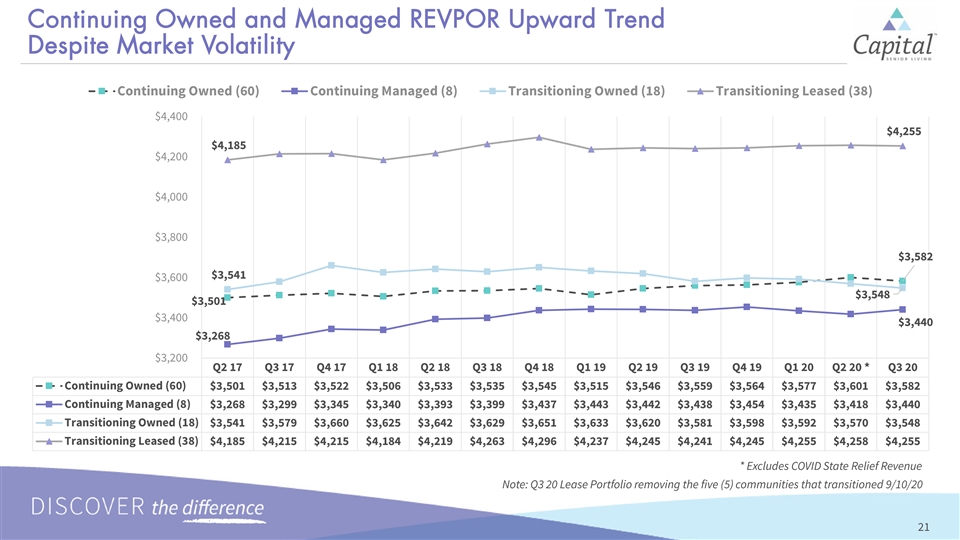
For the third quarter of 2020, the Company reported revenue of $96.3 million, compared with revenue of $111.1 million in the third quarter of 2019. The majority of the decrease is related to the transfer of 18 communities to Fannie Mae effective August 1, 2020 ($9.8 million), dispositions of three communities since the third quarter of 2019 ($4.1 million), transfers of six formerly-leased communities to new operators ($2.9 million) and the conversion of six formerly-leased communities to management agreements in February 2020 ($3.2 million), partially offset by $9.6 million of community reimbursement revenue associated with the management of certain communities in the third quarter. Total occupancy in the third quarter of 2020 was 76.1%, a decrease of 520 basis points as compared to the third quarter of 2019, largely due to the impacts of COVID-19. Monthly average rent was $3,727 as compared to $3,628 in the third quarter of 2019. As compared to the second quarter of 2020, total occupancy declined 150 basis points in the third quarter.

Operating expenses for the third quarter of 2020 were $65.2 million, a decrease of $15.2 million as compared to the third quarter of 2019. The majority of the decrease is related to the transfer of 18 communities to Fannie Mae effective August 1, 2020 ($7.8 million), dispositions of three communities since the third quarter of 2019 ($2.4 million), transfers of six formerly-leased communities to new operators ($2.0 million) and the conversion of six formerly-leased communities to management agreements in February 2020 ($2.1 million). Operating expenses for the third quarter of 2020 included $1.4 million of costs directly related to COVID-19, primarily for employee hero pay, specialized sterilization services and personal protective equipment.

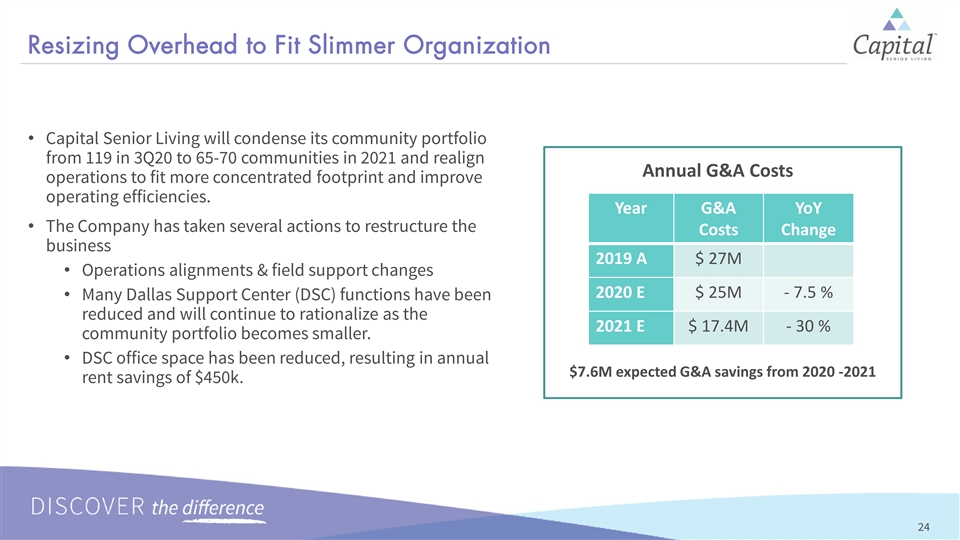
General and administrative expenses for the third quarter of 2020 were $8.1 million versus $7.6 million in the third quarter of 2019. Excluding transaction and conversion costs in both periods, general and administrative expenses decreased $0.3 million in the third quarter of 2020 versus the third quarter of 2019 due to lower healthcare claims under the Company’s self-insured healthcare plan. As a percentage of revenues under management, general and administrative expenses, excluding transaction and conversion costs, were 6.2% in the third quarter of 2020.

Net loss for the third quarter of 2020 was $215.0 million, largely due to a GAAP loss of $191.0 million associated with the transfer of the 18 communities to Fannie Mae in August 2020, as compared to $20.7 million for the third quarter of 2019.


2


Adjusted EBITDAR for the third quarter of 2020 was $15.7 million. Adjusted EBITDAR excluding COVID-19 expenses was $17.2 million. Adjusted CFFO for the third quarter of 2020 was $(5.2) million. Adjusted CFFO excluding COVID-19 relief and expenses was $(3.8) million. (See “Non-GAAP Financial Measures” below).

Same Community Results

Same community results exclude three non-core communities the Company has disposed of since the third quarter of 2019, six communities converted to management agreements effective March 1, 2020, six formerly-leased communities transitioned to other operators, and 18 communities to be transferred to Fannie Mae that are no longer included in the Company’s consolidated operating results effective August 1, 2020. Same-community results also exclude COVID-19 expenses of $1.3 million in the third quarter of 2020.

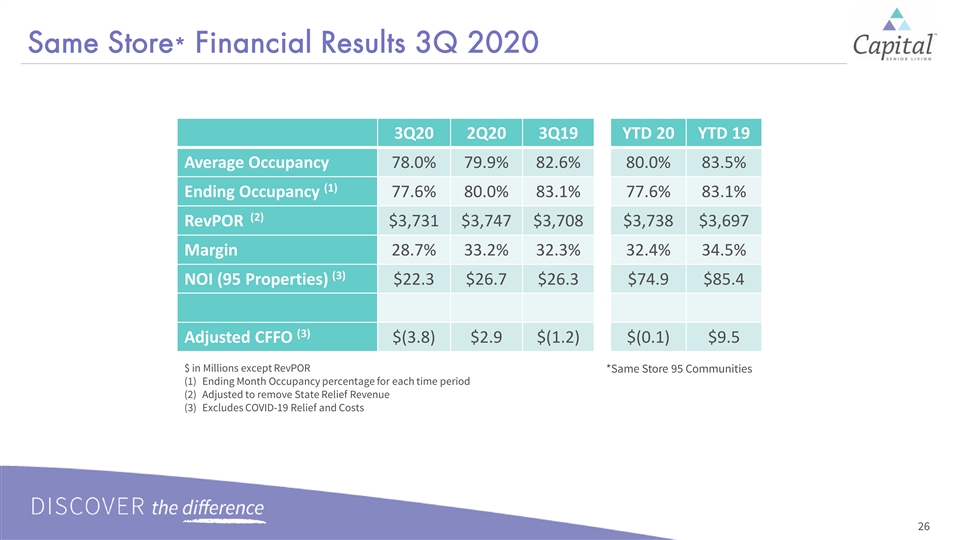
Same-community revenue in the third quarter of 2020 was $77.8 million, a decrease of 4.8% versus the third quarter of 2019, primarily due to the impact of COVID-19 on the Company’s occupancy since March 2020. Same-community occupancy in the third quarter was 78.0%, a decrease of 460 basis points as compared to the third quarter of 2019 and average monthly rent was $3,731, an increase of 0.6% as compared to the third quarter of 2019. As compared to the second quarter of 2020, same-community occupancy declined 190 basis points in the third quarter.

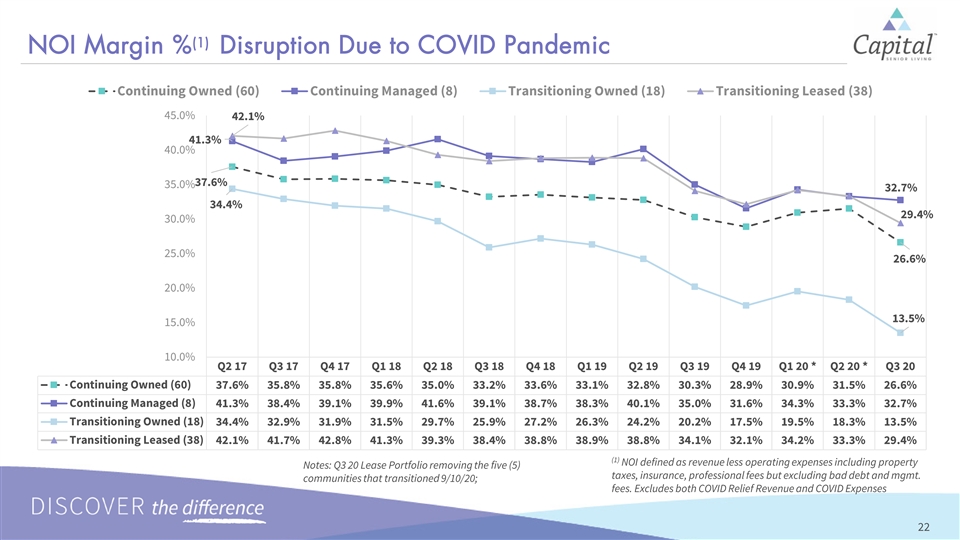
Same-community operating expenses increased $0.1 million, or 0.1%, in the third quarter of 2020 versus the third quarter of 2019. Same store labor costs, including benefits, increased $0.5 million, or 1.4%, while all other expense categories declined $0.4 million on a combined basis, or 1.9%, with decreases in food costs of $0.3 million, or 6.5%, and utilities of $0.1 million, or 1.5%. Same-community net operating income decreased 15.2% in the third quarter of 2020 when compared with the third quarter of 2019.

Community Transitions Update

On July 31, 2020, the Company initiated the process to transfer the operations and ownership of 18 communities that were either underperforming or were in underperforming loan pools to Fannie Mae. The Company currently expects most if not all of these communities to transition by December 31, 2020. In accordance with GAAP, revenues and operating expenses of these communities were no longer included in the Company’s operating results beginning August 1, 2020; however, the debt and certain other obligations associated with these communities will remain on the Company’s balance sheet until the transfers are completed. The Company recorded a GAAP loss of $191.0 million from the write-off of assets associated with these communities in the third quarter of 2020. A substantial gain will be recorded when the debt and other remaining obligations are relieved, most likely in the fourth quarter of 2020.

In connection with the successful restructuring of the Company’s lease agreements with its three REIT partners in October 2019 and March 2020, the Company transitioned 5 formerly-leased communities to new operators in September and 15 additional formerly- leased communities in October and early November. The Company currently expects to transition an additional 18 communities to new operators in the fourth quarter of 2020 or the first quarter of 2021.


3


The Company and Ventas have agreed in principle that, commencing January 2021, the Company will manage all seven communities currently subject to a modified master lease between the companies, under a management agreement. This arrangement is consistent with the Company’s March 10, 2020 agreement regarding those seven communities and remains subject to completion of documentation and other conditions.

COVID-19 Update

Since the onset of COVID-19, the Company has responded swiftly, thoughtfully and aggressively to the unprecedented challenges raised by the pandemic. The Company continues to be relentlessly focused on the safety and wellbeing of its residents, employees and caregivers. In an effort to protect its residents and employees and slow the spread of COVID-19, and in response to quarantines, shelter-in-place orders and other limitations imposed by federal, state and local governments, the Company has restricted or limited access to its communities, including limitations on in-person prospective resident tours and, in certain cases, new resident admissions.

Access restrictions have resulted in declines in the occupancy levels at the Company’s communities, which has, and will continue to, negatively impact revenues and operating results in the near- to mid-term. The number of move-ins in the third quarter of 2020 as compared to the third quarter of 2019 improved to 88%, up from second quarter 2020 move- ins of 75% as compared to the second quarter of 2019.

During the COVID crisis, the Company has incurred significant additional operating costs and expenses in order to implement enhanced infection control protocols and otherwise care for its residents. In the third quarter of 2020, the Company incurred substantial costs for procurement of additional PPE, cleaning and disposable food service supplies, enhanced cleaning, infection control, environmental sanitation costs, and increased labor expenses for hazard pay at certain communities with COVID-19 positive residents. CSL has also incurred costs for COVID-19 testing of residents and employees. In total, the Company incurred approximately $1.4 million in incremental COVID costs in the third quarter and has incurred $4.6 million in incremental COVID costs through the first nine months of 2020. The Company expects to continue to incur such incremental costs until the pandemic subsides. To mitigate these new expenses, the Company has reduced spending on non-essential supplies, travel, and other discretionary items.

The Company received $0.1 million of COVID-19 relief funds from state relief programs in Wisconsin and Ohio in the third quarter of 2020 to offset COVID-19 costs incurred by communities in those states. The Company has also been approved for relief from a CARES Act provider relief fund for eligible Medicaid providers, and expects to receive approximately $8 million in such relief in the fourth quarter. The Company is utilizing the payroll tax deferral program under the Coronavirus Aid, Relief, and Economic Security Act of 2020 (CARES Act) to defer the employer portion of payroll taxes from April 2020 through December 2020. One- half of the deferred payroll taxes will be due by December 2021, with the other half due by December 2022. In the third quarter of 2020, the Company deferred $2.3 million of payroll taxes under such program and has deferred $5.0 million through the first nine months of 2020.


4


Balance Sheet and Liquidity

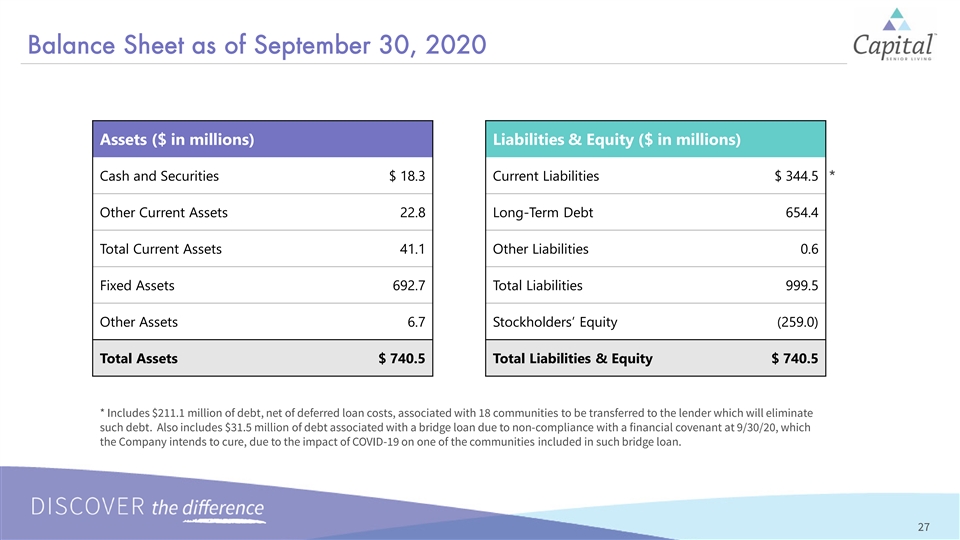
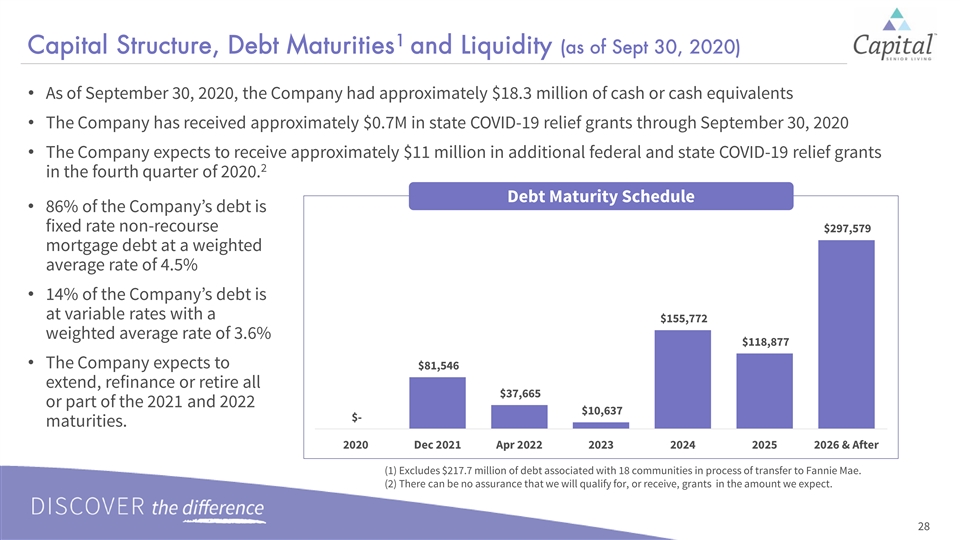
The Company ended the third quarter with $18.3 million of cash and cash equivalents, including restricted cash. As of September 30, 2020, the Company financed its owned communities with mortgages totaling $919.7 million, of which $216.3 million was associated with the 18 communities effectively transferred to Fannie on August 1, 2020 and included in current liabilities, at interest rates averaging 4.5%. The majority of the Company’s debt is at fixed interest rates excluding three bridge loans totaling approximately $81.5 million, all with maturities in the fourth quarter of 2021, and approximately $50 million of long-term variable rate debt under the Company’s Master Credit Facility. The earliest maturity date for the Company’s fixed-rate debt is in 2022. The debt associated with the 18 communities to be transferred to Fannie Mae is classified as current. Also, $31.5 million of debt associated with one of the Company’s bridge loans is classified as current due to non-compliance with a financial covenant, which the Company intends to cure, due to the impact of COVID-19 on one of the communities included in such bridge loan.

Q3 2020 Conference Call Information

The Company will host a conference call with senior management to discuss the Company’s third quarter 2020 financial results on Thursday, November 5, 2020, at 2:30 p.m. Eastern Time. To participate, dial 877-407-0989 (no passcode is required). A link to a simultaneous webcast of the teleconference will be available at www.capitalsenior.com.

For the convenience of the Company’s shareholders and the public, the conference call will be recorded and available for replay starting November 5, 2020, through November 19, 2020. To access the conference call replay, call 877-660-6853, passcode 13711946. The conference call will also be available for playback via the Company’s corporate website, https://www.capitalsenior.com/investor-relations/conference-calls/.

Non-GAAP Financial Measures of Operating Performance

Adjusted EBITDAR and Adjusted EBITDAR excluding COVID-19 impact are financial valuation measures and Adjusted Net Income/(Loss), Adjusted Net Income/(Loss) excluding COVID-19 impact, Adjusted CFFO and Adjusted CFFO excluding COVID-19 impact are financial performance measures that are not calculated in accordance with U.S. generally accepted accounting principles (“GAAP”). Non-GAAP financial measures may have material limitations in that they do not reflect all of the costs associated with our results of operations as determined in accordance with GAAP. As a result, these non-GAAP financial measures should not be considered a substitute for, nor superior to, financial results and measures determined or calculated in accordance with GAAP.

The Company believes that presenting Adjusted EBITDAR excluding COVID-19 impact, Adjusted Net Income/(Loss) excluding COVID-19 impact, and Adjusted CFFO excluding COVID-19 impact is useful to investors to assess certain recent impacts of the COVID- 19 pandemic on the Company’s financial position, results of operations and the non- GAAP financial valuation and performance measures that the Company has historically presented to investors.

Adjusted EBITDAR is a valuation measure commonly used by Company management, research analysts and investors to value companies in the senior living industry. Since Adjusted EBITDAR excludes interest expense and rent expense, it allows Company management, research analysts and investors to compare the enterprise values of different companies without regard to differences in capital structures and leasing arrangements.


5


The Company believes Adjusted EBITDAR excluding COVID-19 impact is a valuable measure as it normalizes the impact of COVID-19 for valuation purposes.

The Company believes that Adjusted Net Income/(Loss), Adjusted Net Income/(Loss) excluding COVID-19 impact, Adjusted CFFO and Adjusted CFFO excluding COVID-19 impact are useful as performance measures in identifying trends in day-to-day operations because they exclude the costs associated with acquisitions and conversions and other items that do not ordinarily reflect the ongoing operating results of our primary business. Adjusted Net Income/(Loss), Adjusted Net Income/(Loss) excluding COVID-19 impact, Adjusted CFFO and Adjusted CFFO excluding COVID-19 impact provide indicators to management of progress in achieving both consolidated and individual business unit operating performance and are used by research analysts and investors to evaluate the performance of companies in the senior living industry.

The Company strongly urges you to review the reconciliation of net loss to Adjusted EBITDAR and Adjusted EBITDAR excluding COVID-19 impact and the reconciliation of net income/(loss) to Adjusted Net Income/(Loss), Adjusted Net Income/(Loss) excluding COVID-19 impact, Adjusted CFFO and Adjusted CFFO excluding COVID-19 impact, along with the Company’s consolidated balance sheets, statements of operations, and statements of cash flows. This is included on the last page of this press release.

About the Company

Dallas-based Capital Senior Living Corporation is one of the nation’s largest operators of independent living, assisted living and memory care communities for senior adults. The Company operates 119 communities that are home to more than 9,000 residents across 22 states and provide compassionate, resident-centric service and care as well as engaging programming. Capital Senior Living offers seniors the freedom and opportunity to successfully, comfortably and happily age in place. For more information, visit www.capitalsenior.com or connect with the Company on Facebook.


6


Safe Harbor

The forward-looking statements in this release are subject to certain risks and uncertainties that could cause the Company’s actual results and financial condition to differ materially, including, but not limited to, the continued spread of COVID-19, including the speed, depth, geographic reach and duration of such spread, new information that may emerge concerning the severity of COVID-19, the actions taken to prevent or contain the spread of COVID-19 or treat its impact, the legal, regulatory and administrative developments that occur at the federal, state and local levels in response to the COVID-19 pandemic, and the frequency and magnitude of legal actions and liability claims that may arise due to COVID-19 or the Company’s response efforts; the impact of COVID-19 on the Company’s ability to continue as a going concern, the Company’s ability to generate sufficient cash flows from operations, additional proceeds from debt refinancings, and proceeds from the sale of assets to satisfy its short and long-term debt and lease obligations and to fund the Company’s capital improvement projects to expand, redevelop, and/or reposition its senior living communities; the Company’s ability to obtain additional capital on terms acceptable to it; the Company’s ability to extend or refinance its existing debt as such debt matures; the Company’s compliance with its debt and lease agreements, including certain financial covenants, and the risk of cross-default in the event such non-compliance occurs; the Company’s ability to complete acquisitions and dispositions upon favorable terms or at all; the risk of oversupply and increased competition in the markets which the Company operates; the risk of increased competition for skilled workers due to wage pressure and changes in regulatory requirements; the departure of the Company’s key officers and personnel; the cost and difficulty of complying with applicable licensure, legislative oversight, or regulatory changes; the risks associated with a decline in economic conditions generally; the adequacy and continued availability of the Company’s insurance policies and the Company’s ability to recover any losses it sustains under such policies; changes in accounting principles and interpretations; and the other risks and factors identified from time to time in the Company’s reports filed with the Securities and Exchange Commission.

For information about Capital Senior Living, visit www.capitalsenior.com.

Investor Contact Carey P. Hendrickson, Chief Financial Officer, at 972-770-5600 or [email protected].

Press Contact Susan J. Turkell at 303-766-4343 or [email protected].


7


CAPITAL SENIOR LIVING CORPORATION

CONSOLIDATED BALANCE SHEETS

(in thousands)


     September 30,
2020
    December 31,
2019
 
     (Unaudited)        
ASSETS             

Current assets:


Cash and cash equivalents

   $ 14,293     $ 23,975  

Restricted cash

     3,982       13,088  

Accounts receivable, net

     9,107       8,143  

Federal and state income taxes receivable

     76       72  

Property tax and insurance deposits

     8,863       12,627  

Prepaid expenses and other

     4,764       5,308  


Total current assets

     41,085       63,213  

Property and equipment, net

     692,746       969,211  

Operating lease right-of-use assets, net

     3,691       224,523  

Deferred taxes, net

     76       76  

Other assets, net

     2,863       10,673  


Total assets

   $ 740,461     $ 1,267,696  


LIABILITIES AND SHAREHOLDERS’ EQUITY (DEFICIT)             

Current liabilities:


Accounts payable

   $ 10,398     $ 10,382  

Accrued expenses

     56,474       46,227  

Current portion of notes payable, net of deferred loan costs

     261,472       15,819  

Deferred income

     5,885       7,201  

Current portion of financing obligations

     —         1,741  

Current portion of lease liabilities

     8,971       45,988  

Federal and state income taxes payable

     307       420  

Customer deposits

     991       1,247  


Total current liabilities

     344,498       129,025  

Financing obligations, net of current portion

     —         9,688  

Lease liabilities, net of current portion

     590       208,967  

Notes payable, net of deferred loan costs and current portion

     654,396       905,637  

Commitments and contingencies


Shareholders’ equity (deficit):


Preferred stock, $.01 par value:

     —         —    

Authorized shares — 15,000; no shares issued or outstanding


Common stock, $.01 par value:


Authorized shares — 65,000; issued and outstanding shares 31,432 and 31,469 in 2020 and 2019, respectively

     319       319  

Additional paid-in capital

     191,882       190,386  

Retained deficit

     (447,794 )      (172,896 ) 

Treasury stock, at cost — 494 shares in 2020 and 2019

     (3,430 )      (3,430 ) 


Total shareholders’ equity (deficit)

     (259,023 )      14,379  


Total liabilities and shareholders’ equity (deficit)

   $ 740,461     $ 1,267,696  


CAPITAL SENIOR LIVING CORPORATION

CONSOLIDATED STATEMENTS OF OPERATIONS AND COMPREHENSIVE LOSS

(unaudited, in thousands, except per share data)


     Three Months Ended
September 30,
     Nine Months Ended
September 30,
 
     2020      2019      2020      2019  

Revenues:


Resident revenue

   $ 86,091      $ 111,110      $ 290,952      $ 338,412  

Management fees

     604        —          819        —    

Community reimbursement revenue

     9,555        —          11,888        —    


Total revenues

     96,250        111,110        303,659        338,412  


Expenses:


Operating expenses (exclusive of facility lease expense and depreciation and amortization expense shown below)

     65,162        80,394        211,874        230,229  

General and administrative expenses

     8,128        7,554        21,036        21,766  

Facility lease expense

     6,124        14,233        23,234        42,706  

Stock-based compensation expense

     421        898        1,494        1,558  

Depreciation and amortization expense

     15,547        16,136        47,584        48,085  

Long-lived asset impairment

     3,239        —          39,194        —    

Community reimbursement expense

     9,555        —          11,888        —    


Total expenses

     108,176        119,215        356,304        344,344  


Other income (expense):


Interest income

     14        59        83        173  

Interest expense

     (11,141)        (12,562)        (34,044)        (37,728)  

Write down of assets held for sale

     —          —          —          (2,340)  

Gain on facility lease modification and termination, net

     (746)        —          10,487        (97)  

Loss on disposition of assets, net

     (191,031)        0        (198,388)        38  

Other income

     (1)        1        2        8  


Loss from continuing operations before provision for income taxes

     (214,831)        (20,607)        (274,505)        (45,878)  

Provision for income taxes

     (133)        (124)        (393)        (371)  


Net loss from operations

   $  (214,964)      $  (20,731)      $  (274,898)      $  (46,249)  


Per share data:

           0     

Basic net loss per share

   $ (7.00)      $ (0.68)      $ (8.99)      $ (1.53)  


Diluted net loss per share

   $ (7.00)      $ (0.68)      $ (8.99)      $ (1.53)  


Weighted average shares outstanding — basic

     30,730        30,324        30,578        30,236  


Weighted average shares outstanding — diluted

     30,730        30,324        30,578        30,236  


Comprehensive loss

   $ (214,964)      $ (20,731)      $ (274,898)      $ (46,249)  


CAPITAL SENIOR LIVING CORPORATION

CONSOLIDATED STATEMENTS OF SHAREHOLDERS’ EQUITY

(unaudited, in thousands)


     Common Stock     Additional
Paid-In
Capital
    Retained
Deficit
    Treasury
Stock
    Total  
     Shares     Amount  

Balance at December 31, 2018

     31,273     $ 318     $ 187,879     $ (149,502 )    $ (3,430 )    $ 35,265  

Adoption of ASC 842

     —         —         —         12,636       —         12,636  

Restricted stock awards (cancellations), net

     (150 )      (2 )      2       —         —         —    

Stock-based compensation

     —         —         898       —         —         898  

Net loss

     —         —         —         (12,984 )      —         (12,984 ) 


Balance at March 31, 2019

     31,123     $ 316     $ 188,779     $ (149,850 )    $ (3,430 )    $ 35,815  


Restricted stock awards (cancellations), net

     346       4       (4 )      —         —         —    

Stock-based compensation

     —         —         1,638       —         —         1,638  

Net loss

     —         —         —         (12,534 )      —         (12,534 ) 


Balance at June 30, 2019

     31,469       320       190,413       (162,384 )      (3,430 )      24,919  


Restricted stock awards (cancellations), net

     346       4       (4 )      —         —         —    

Stock-based compensation

     —         —         1,638       —         —         1,638  

Net loss

     —         —         —         (12,534 )      —         (12,534 ) 


Balance at September 30, 2019

     31,815       324       192,047       (174,918 )      (3,430 )      14,023  


Balance at December 31, 2019

     31,441     $ 319     $ 190,386     $ (172,896 )    $ (3,430 )    $ 14,379  

Restricted stock awards (cancellations), net

     (52 )      —         —         —         —         —    

Stock-based compensation

     —         —         597       —         —         597  

Net loss

     —         —         —         (47,181 )      —         (47,181 ) 


Balance at March 31, 2020

     31,389     $ 319     $ 190,983     $ (220,077 )    $ (3,430 )    $ (32,205 ) 


Restricted stock awards (cancellations), net

     43       —         —         —         —         —    

Stock-based compensation

     —         —         478       —         —         478  

Net loss

     —         —         —         (12,753 )      —         (12,753 ) 


Balance at June 30, 2020

     31,432       319       191,461       (232,830 )      (3,430 )      (44,480 ) 


Restricted stock awards (cancellations), net

     (11 )      —         —         —         —         —    

Stock-based compensation

     —         —         421       —         —         421  

Net loss

     —         —         —         (214,964 )      —         (214,964 ) 


Balance at September 30, 2020

     31,421       319       191,882       (447,794 )      (3,430 )      (259,023 ) 


Capital Senior Living Corporation

Supplemental Information


     Communities     Average Resident Capacity     Average Units  
     Q3 20     Q3 19     Q3 20     Q3 19     Q3 20     Q3 19  

Portfolio Data


I. Community Ownership / Management


Consolidated communities


Owned

     79       82       10,055       10,629       7,634       8,167  

Leased

     39       46       4,981       5,756       3,591       4,389  

Third party communities managed

     6       —         549       —         476       —    


Total

     124       128       15,585       16,385       11,701       12,557  

Independent living

         6,251       6,879       4,213       4,725  

Assisted living

         9,334       9,506       7,488       7,831  


Total

         15,585       16,385       11,701       12,557  

II. Percentage of Operating Portfolio


Consolidated communities


Owned

     63.7 %      64.1 %      64.5 %      64.9 %      65.2 %      65.0 % 

Leased

     31.5 %      35.9 %      32.0 %      35.1 %      30.7 %      35.0 % 

Third party communities managed

     4.8 %      0.0 %      3.5 %      0.0 %      4.1 %      0.0 % 


Total

     100.0 %      100.0 %      100.0 %      100.0 %      100.0 %      100.0 % 

Independent living

         40.1 %      42.0 %      36.0 %      37.6 % 

Assisted living

         59.9 %      58.0 %      64.0 %      62.4 % 


Total

         100.0 %      100.0 %      100.0 %      100.0 % 


Capital Senior Living Corporation

Supplemental Information     


     Q3 20     Q3 19     YTD through
9/30/20
    YTD through
9/30/19
 

Selected Operating Results


I. Owned communities *


Number of communities

     79       82       79       82  

Resident capacity

     10,055       10,629       10,055       10,629  

Unit capacity

     7,634       8,167       7,634       8,167  

Financial occupancy (1)

     76.9 %      82.6 %      78.7 %      83.4 % 

Revenue (in millions)

     54.2       71.5       186.9       217.2  

Operating expenses (in millions) (2)

     40.4       51.3       135.8       151.3  

Operating margin

     25 %      28 %      27 %      30 % 

Average monthly rent

     3,588       3,531       3,590       3,527  

II. Leased communities


Number of communities

     39       46       39       46  

Resident capacity

     4,981       5,756       4,981       5,756  

Unit capacity

     3,591       4,389       3,591       4,389  

Financial occupancy (1)

     74.5 %      78.8 %      76.5 %      80.2 % 

Revenue (in millions)

     32.0       39.6       103.8       121.2  

Operating expenses (in millions) (2)

     22.2       26.0       69.0       75.7  

Operating margin

     31 %      34 %      34 %      38 % 

Average monthly rent

     3,988       3,818       3,944       3,812  

III. Consolidated communities


Number of communities

     118       128       118       128  

Resident capacity

     15,036       16,385       15,036       16,385  

Unit capacity

     11,225       12,557       11,225       12,557  

Financial occupancy (1)

     76.1 %      81.3 %      78.0 %      82.3 % 

Revenue (in millions)

     86.2       111.1       290.8       338.4  

Operating expenses (in millions) (2)

     62.6       77.3       204.7       227.0  

Operating margin

     27 %      30 %      30 %      33 % 

Average monthly rent

     3,727       3,628       3,709       3,624  

IV. Communities under management *


Number of communities

     124       128       124       128  

Resident capacity

     15,585       16,385       15,585       16,385  

Unit capacity

     11,701       12,557       11,701       12,557  

Financial occupancy (1)

     76.4 %      81.3 %      78.2 %      82.3 % 

Revenue (in millions)

     98.2       111.1       307.0       338.4  

Operating expenses (in millions) (2)

     72.1       77.3       217.1       227.0  

Operating margin

     27 %      30 %      29 %      33 % 

Average monthly rent

     3,663       3,628       3,666       3,624  

V. Same Store Consolidated communities


Number of communities

     95       95       95       95  

Resident capacity

     11,845       11,845       11,845       11,845  

Unit capacity

     8,920       8,901       8,920       8,901  

Financial occupancy (1)

     78.0 %      82.6 %      80.0 %      83.5 % 

Revenue (in millions)

     77.8       81.8       231.2       247.7  

Operating expenses (in millions) (2)

     55.5       55.4       156.3       162.3  

Operating margin

     29 %      32 %      32 %      34 % 

Average monthly rent

     3,731       3,708       3,738       3,697  

VI. General and Administrative expenses as a percent of Total Revenues under Management (3)

     6.2 %      5.7 %      4.8 %      5.5 % 

VII. Consolidated Debt Information (in thousands, except for interest rates)


(Excludes insurance premium financing)


Total fixed rate mortgage debt

     787,921       841,047      

Total variable rate debt

     131,806       126,322      

Weighted average interest rate

     4.51 %      4.84 %     

(1) - Financial occupancy represents actual days occupied divided by total number of available days during the quarter.

(2) - Excludes management fees, provision for bad debts, and transaction and conversion costs.

(3) - Excludes transaction and conversion costs.

* - “Owned communities” for Q3 20 and YTD through 9/30/20 include one month and seven months of data, respectively, for the 18 communities transferred to Fannie Mae effective August 1, 2020. Data for all months for these communities is included in “Communities under management”.

NOTE: Supplemental information for Q3 20 and YTD through 9/30/20 exclude COVID-19 revenue relief and COVID-19 costs. COVID-19 revenue relief was $0.0 million and $0.5 million for Q3 20 and YTD through 9/30/20, respectively; COVID-19 costs were $1.4 million and $4.6 million for Q3 20 and YTD through 9/30/20, respectively. COVID-19 revenue relief consists of relief funds received from a North Carolina state Medicaid program. COVID-19 costs consist of additional costs and expenses the Company incurred for the procurement of additional PPE, enhanced cleaning and sterilization services, cleaning and disposable food service supplies, and increased labor expense for hazard pay, net of relief dollars from North Carolina, Wisconsin and Ohio to offset COVID-19 costs in such states.

CAPITAL SENIOR LIVING CORPORATION

NON-GAAP RECONCILIATIONS

(In thousands, except per share data)


     Three months ended
September 30,
    Nine months ended
September 30,
 
     2020     2019     2020     2019  

Adjusted EBITDAR


Net loss

     (214,964 )      (20,731 )      (274,898 )      (46,249 ) 

Depreciation and amortization expense

     15,547       16,136       47,584       48,085  

Stock-based compensation expense

     421       898       1,494       1,558  

Facility lease expense

     6,124       14,233       23,234       42,706  

Provision for bad debts

     781       569       2,190       2,182  

Interest income

     (14 )      (59 )      (83 )      (173 ) 

Interest expense

     11,141       12,562       34,044       37,728  

Write-off of deferred loan costs and prepayment premiums

     —         —         —         97  

Long-lived asset impairment

     3,239       —         39,194       —    

Loss (gain) on lease related transactions, net

     746       —         (10,487 )   

Loss (gain) on disposition of assets, net

     191,031       —         198,388       (38 ) 

Write down of assets held for sale

           2,340  

Other expense (income)

     1       (1 )      (2 )      (8 ) 

Provision for income taxes

     133       124       393       371  

Casualty losses

     294       1,460       958       1,985  

Transaction and conversion costs

     866       1,386       3,082       2,346  

Employee placement and separation costs

     401       690       603       2,586  

Communities excluded due to repositioning/lease-up

     —         78       —         115  


Adjusted EBITDAR

   $ 15,747     $ 27,345     $ 65,694     $ 95,631  


COVID-19 relief revenue

     —         —         (502 )      —    

COVID-19 expenses

     1,433       —         4,626       —    


Adjusted EBITDAR excluding COVID-19 impact

   $ 17,180     $ 27,345     $ 69,818     $ 95,631  


Adjusted revenues


Total revenues

   $ 96,250     $ 111,110     $ 303,659     $ 338,412  

COVID-19 relief revenue

     —         —         (502 )      —    

Communities excluded due to repositioning/lease-up

     —         (1,353 )      —         (3,903 ) 


Adjusted revenues

   $ 96,250     $ 109,757     $ 303,157     $ 334,509  


Adjusted net loss and Adjusted net loss per share


Net loss

     (214,964 )      (20,731 )      (274,898 )      (46,249 ) 

Casualty losses

     294       1,460       958       1,985  

Transaction and conversion costs

     866       1,386       3,082       2,363  

Employee placement and separation costs

     401       690       603       2,586  

Write-off of deferred loan costs and prepayment premiums

     —         —         —         97  

Write down of asset held for sale

     —         —         —         2,340  

Long-lived asset impairment

     3,239       —         39,194       —    

Loss (gain) on lease related transactions, net

     746       —         (10,487 )      —    

Loss (gain) on disposition of assets, net

     191,031       —         198,388       (38 ) 

Tax impact of Non-GAAP adjustments (25%)

     (49,144 )      (884 )      (57,935 )      (2,333 ) 

Deferred tax asset valuation allowance

     —         5,113       —         10,776  

Communities excluded due to repositioning/lease-up

     —         693       —         1,970  


Adjusted net loss

   $ (67,531 )    $ (12,273 )    $ (101,095 )    $ (26,503 ) 


Diluted shares outstanding

     30,730       30,324       30,578       30,236  

Adjusted net income (loss) per share

   $ (2.20 )    $ (0.40 )    $ (3.31 )    $ (0.88 ) 

COVID-19 relief revenue

     —         —         (502 )      —    

COVID-19 expenses

     1,433       —         4,626       —    


Adjusted net loss excluding COVID-19 impact

   $ (66,098 )    $ (12,273 )    $ (96,971 )    $ (26,503 ) 


Adjusted net income (loss) per share excluding COVID-19 impact

   $ (2.15 )    $ (0.40 )    $ (3.17 )    $ (0.88 ) 

Adjusted CFFO


Net loss

     (214,964 )      (20,731 )      (274,898 )      (46,249 ) 

Non-cash charges, net

     209,318       16,736       269,476       51,966  

Operating lease payment adjustment to normalize lease commitments

     —         —         —         (910 ) 

Recurring capital expenditures

     (1,136 )      (1,148 )      (3,407 )      (3,445 ) 

Casualty losses

     294       1,460       958       1,985  

Transaction and conversion costs

     866       1,386       3,082       2,363  

Employee placement and separation costs

     401       690       603       2,586  

Communities excluded due to repositioning/lease-up

     —         416       —         1,211  


Adjusted CFFO

   $ (5,221 )    $ (1,191 )    $ (4,186 )    $ 9,507  


COVID-19 relief revenue

     —         —         (502 )      —    

COVID-19 expenses

     1,433       —         4,626       —    


Adjusted CFFO excluding COVID-19 impact

   $ (3,788 )    $ (1,191 )    $ (62 )    $ 9,507  


*

Non-cash charges, net, for the nine months ended September 30, 2020, are exclusive of a one-time $6.5 million forfeiture of letters of credit associated with the Welltower Forbearance Agreement that was executed in the first quarter of 2020.

NOTE: COVID-19 relief revenue consists of relief funds the Company received from a North Carolina state Medicaid program in the second quarter. COVID-19 costs consist of addiitional costs and expenses the Company incurred for the procurement of additional PPE, enhanced cleaning and sterilization services, cleaning and disposable food service supplies, and increased labor expense for hazard pay, net of relief dollars from North Carolina, Wisconsin and Ohio to offset COVID-19 costs in such states.
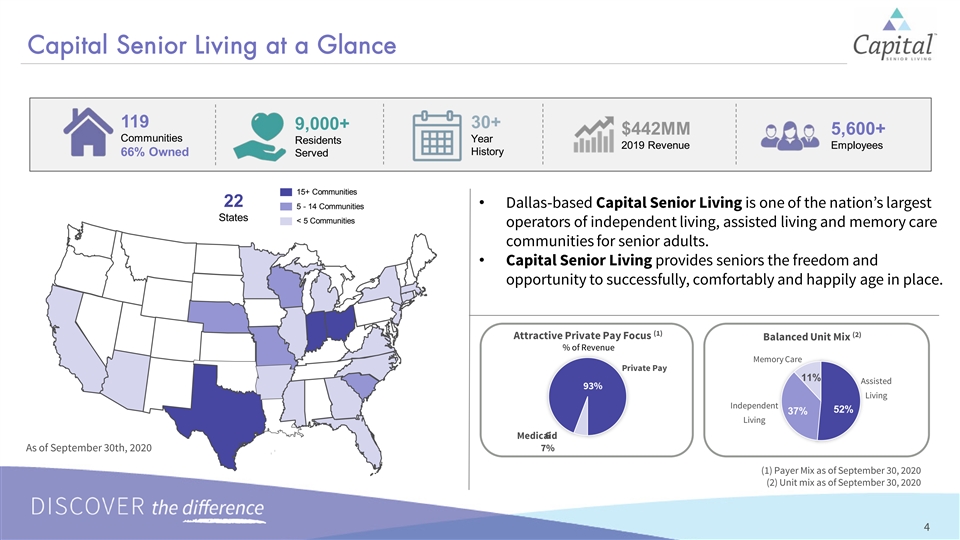
Exhibit 99.2 Capital Senior Living A Leading Owner-Operator of Senior Living Communities and ServicesExhibit 99.2 Capital Senior Living A Leading Owner-Operator of Senior Living Communities and Services


Forward-Looking Statements & Non-GAAP Financial Measures Forward Looking Statements: The forward-looking statements in this presentation The forward-looking statements in this release are subject to certain risks and uncertainties that could cause the Company’s actual results and financial condition to differ materially, including, but not limited to, the continued spread of COVID-19, including the speed, depth, geographic reach and duration of such spread, new information that may emerge concerning the severity of COVID-19, the actions taken to prevent or contain the spread of COVID-19 or treat its impact, the legal, regulatory and administrative developments that occur at the federal, state and local levels in response to the COVID-19 pandemic, and the frequency and magnitude of legal actions and liability claims that may arise due to COVID-19 or the Company’s response efforts; the impact of COVID-19 on the Company’s ability to continue as a going concern, the Company’s ability to generate sufficient cash flows from operations, additional proceeds from debt refinancings, and proceeds from the sale of assets to satisfy its short and long-term debt and lease obligations and to fund the Company’s capital improvement projects to expand, redevelop, and/or reposition its senior living communities; the Company’s ability to obtain additional capital on terms acceptable to it; the Company’s ability to extend or refinance its existing debt as such debt matures; the Company’s compliance with its debt and lease agreements, including certain financial covenants, and the risk of cross-default in the event such non-compliance occurs; the Company’s ability to complete acquisitions and dispositions upon favorable terms or at all; the risk of oversupply and increased competition in the markets which the Company operates; the risk of increased competition for skilled workers due to wage pressure and changes in regulatory requirements; the departure of the Company’s key officers and personnel; the cost and difficulty of complying with applicable licensure, legislative oversight, or regulatory changes; the risks associated with a decline in economic conditions generally; the adequacy and continued availability of the Company’s insurance policies and the Company’s ability to recover any losses it sustains under such policies; changes in accounting principles and interpretations; and the other risks and factors identified from time to time in the Company’s reports filed with the Securities and Exchange Commission. For information about Capital Senior Living, visit www.capitalsenior.com. The Company assumes no obligation to update or supplement forward-looking statements in this presentation that become untrue because of new information, subsequent events or otherwise. Non-GAAP Financial Measures: Adjusted EBITDAR is a financial valuation measure and Adjusted Net Income/(Loss) and Adjusted CFFO are financial performance measures that are not calculated in accordance with U.S. generally accepted accounting principles (“GAAP”). Non-GAAP financial measures may have material limitations in that they do not reflect all of the costs associated with our results of operations as determined in accordance with GAAP. As a result, these non-GAAP financial measures should not be considered a substitute for, nor superior to, financial results and measures determined or calculated in accordance with GAAP. Adjusted EBITDAR is a valuation measure commonly used by Company management, research analysts and investors to value companies in the senior living industry. Since Adjusted EBITDAR excludes interest expense and rent expense, it allows Company management, research analysts and investors to compare the enterprise values of different companies without regard to differences in capital structures and leasing arrangements. The Company believes that Adjusted Net Income/(Loss) and Adjusted CFFO are useful as performance measures in identifying trends in day-to-day operations because they exclude the costs associated with acquisitions and conversions and other items that do not ordinarily reflect the ongoing operating results of our primary business. Adjusted Net Income/(Loss) and Adjusted CFFO provide indicators to management of progress in achieving both consolidated and individual business unit operating performance and are used by research analysts and investors to evaluate the performance of companies in the senior living industry. The Company strongly urges you to review the reconciliation of net loss to Adjusted EBITDAR and the reconciliation of net income/(loss) to Adjusted Net Income/(Loss) and Adjusted CFFO, along with the Company’s consolidated balance sheets, statements of operations, and statements of cash flows in the Company’s most recent earnings release which can be found on the Company’s website at www.capitalsenior.com/investor-relations/press-releases/. 2Forward-Looking Statements & Non-GAAP Financial Measures Forward Looking Statements: The forward-looking statements in this presentation The forward-looking statements in this release are subject to certain risks and uncertainties that could cause the Company’s actual results and financial condition to differ materially, including, but not limited to, the continued spread of COVID-19, including the speed, depth, geographic reach and duration of such spread, new information that may emerge concerning the severity of COVID-19, the actions taken to prevent or contain the spread of COVID-19 or treat its impact, the legal, regulatory and administrative developments that occur at the federal, state and local levels in response to the COVID-19 pandemic, and the frequency and magnitude of legal actions and liability claims that may arise due to COVID-19 or the Company’s response efforts; the impact of COVID-19 on the Company’s ability to continue as a going concern, the Company’s ability to generate sufficient cash flows from operations, additional proceeds from debt refinancings, and proceeds from the sale of assets to satisfy its short and long-term debt and lease obligations and to fund the Company’s capital improvement projects to expand, redevelop, and/or reposition its senior living communities; the Company’s ability to obtain additional capital on terms acceptable to it; the Company’s ability to extend or refinance its existing debt as such debt matures; the Company’s compliance with its debt and lease agreements, including certain financial covenants, and the risk of cross-default in the event such non-compliance occurs; the Company’s ability to complete acquisitions and dispositions upon favorable terms or at all; the risk of oversupply and increased competition in the markets which the Company operates; the risk of increased competition for skilled workers due to wage pressure and changes in regulatory requirements; the departure of the Company’s key officers and personnel; the cost and difficulty of complying with applicable licensure, legislative oversight, or regulatory changes; the risks associated with a decline in economic conditions generally; the adequacy and continued availability of the Company’s insurance policies and the Company’s ability to recover any losses it sustains under such policies; changes in accounting principles and interpretations; and the other risks and factors identified from time to time in the Company’s reports filed with the Securities and Exchange Commission. For information about Capital Senior Living, visit www.capitalsenior.com. The Company assumes no obligation to update or supplement forward-looking statements in this presentation that become untrue because of new information, subsequent events or otherwise. Non-GAAP Financial Measures: Adjusted EBITDAR is a financial valuation measure and Adjusted Net Income/(Loss) and Adjusted CFFO are financial performance measures that are not calculated in accordance with U.S. generally accepted accounting principles (“GAAP”). Non-GAAP financial measures may have material limitations in that they do not reflect all of the costs associated with our results of operations as determined in accordance with GAAP. As a result, these non-GAAP financial measures should not be considered a substitute for, nor superior to, financial results and measures determined or calculated in accordance with GAAP. Adjusted EBITDAR is a valuation measure commonly used by Company management, research analysts and investors to value companies in the senior living industry. Since Adjusted EBITDAR excludes interest expense and rent expense, it allows Company management, research analysts and investors to compare the enterprise values of different companies without regard to differences in capital structures and leasing arrangements. The Company believes that Adjusted Net Income/(Loss) and Adjusted CFFO are useful as performance measures in identifying trends in day-to-day operations because they exclude the costs associated with acquisitions and conversions and other items that do not ordinarily reflect the ongoing operating results of our primary business. Adjusted Net Income/(Loss) and Adjusted CFFO provide indicators to management of progress in achieving both consolidated and individual business unit operating performance and are used by research analysts and investors to evaluate the performance of companies in the senior living industry. The Company strongly urges you to review the reconciliation of net loss to Adjusted EBITDAR and the reconciliation of net income/(loss) to Adjusted Net Income/(Loss) and Adjusted CFFO, along with the Company’s consolidated balance sheets, statements of operations, and statements of cash flows in the Company’s most recent earnings release which can be found on the Company’s website at www.capitalsenior.com/investor-relations/press-releases/. 2


Table of Contents Sections Pages I. Company Overview 4 II. 3Q 2020 Highlights 5 III. COVID-19 Update 10 IV. Strategy Update 14 V. 3Q Financials 25 3Table of Contents Sections Pages I. Company Overview 4 II. 3Q 2020 Highlights 5 III. COVID-19 Update 10 IV. Strategy Update 14 V. 3Q Financials 25 3


Capital Senior Living at a Glance 119 30+ 9,000+ $442MM 5,600+ Communities Year Residents 2019 Revenue Employees History 66% Owned Served 15+ Communities 22 • Dallas-based Capital Senior Living is one of the nation’s largest 5 - 14 Communities States < 5 Communities operators of independent living, assisted living and memory care communities for senior adults. • Capital Senior Living provides seniors the freedom and opportunity to successfully, comfortably and happily age in place. (1) (2) Attractive Private Pay Focus Balanced Unit Mix % of Revenue Memory Care Private Pay 11% Assisted 93% Living Independent 52% 37% Living Medica 6id As of September 30th, 2020 7% (1) Payer Mix as of September 30, 2020 (2) Unit mix as of September 30, 2020 4Capital Senior Living at a Glance 119 30+ 9,000+ $442MM 5,600+ Communities Year Residents 2019 Revenue Employees History 66% Owned Served 15+ Communities 22 • Dallas-based Capital Senior Living is one of the nation’s largest 5 - 14 Communities States < 5 Communities operators of independent living, assisted living and memory care communities for senior adults. • Capital Senior Living provides seniors the freedom and opportunity to successfully, comfortably and happily age in place. (1) (2) Attractive Private Pay Focus Balanced Unit Mix % of Revenue Memory Care Private Pay 11% Assisted 93% Living Independent 52% 37% Living Medica 6id As of September 30th, 2020 7% (1) Payer Mix as of September 30, 2020 (2) Unit mix as of September 30, 2020 4


3Q 2020 Highlights 53Q 2020 Highlights 5


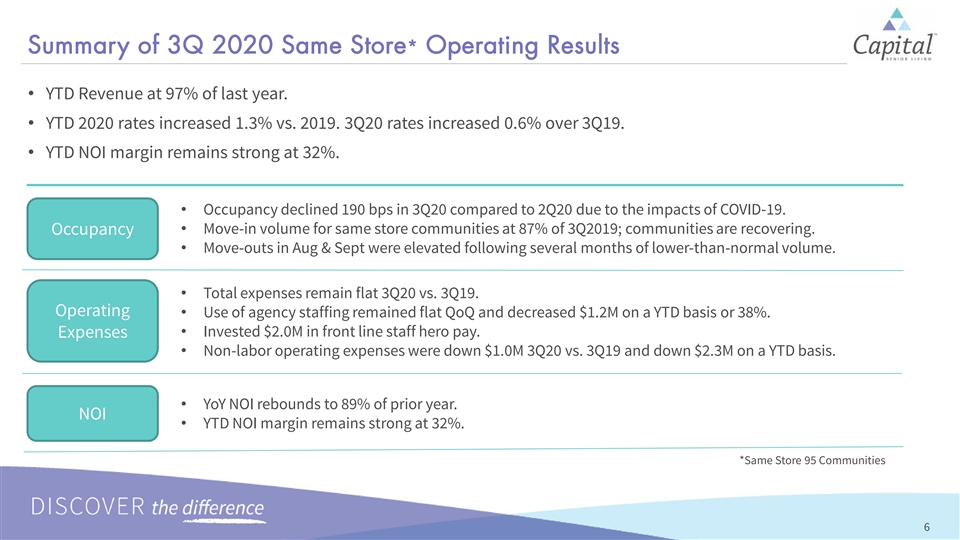
Summary of 3Q 2020 Same Store* Operating Results • YTD Revenue at 97% of last year. • YTD 2020 rates increased 1.3% vs. 2019. 3Q20 rates increased 0.6% over 3Q19. • YTD NOI margin remains strong at 32%. • Occupancy declined 190 bps in 3Q20 compared to 2Q20 due to the impacts of COVID-19. • Move-in volume for same store communities at 87% of 3Q2019; communities are recovering. Occupancy • Move-outs in Aug & Sept were elevated following several months of lower-than-normal volume. • Total expenses remain flat 3Q20 vs. 3Q19. Operating • Use of agency staffing remained flat QoQ and decreased $1.2M on a YTD basis or 38%. • Invested $2.0M in front line staff hero pay. Expenses • Non-labor operating expenses were down $1.0M 3Q20 vs. 3Q19 and down $2.3M on a YTD basis. • YoY NOI rebounds to 89% of prior year. NOI • YTD NOI margin remains strong at 32%. *Same Store 95 Communities 6Summary of 3Q 2020 Same Store* Operating Results • YTD Revenue at 97% of last year. • YTD 2020 rates increased 1.3% vs. 2019. 3Q20 rates increased 0.6% over 3Q19. • YTD NOI margin remains strong at 32%. • Occupancy declined 190 bps in 3Q20 compared to 2Q20 due to the impacts of COVID-19. • Move-in volume for same store communities at 87% of 3Q2019; communities are recovering. Occupancy • Move-outs in Aug & Sept were elevated following several months of lower-than-normal volume. • Total expenses remain flat 3Q20 vs. 3Q19. Operating • Use of agency staffing remained flat QoQ and decreased $1.2M on a YTD basis or 38%. • Invested $2.0M in front line staff hero pay. Expenses • Non-labor operating expenses were down $1.0M 3Q20 vs. 3Q19 and down $2.3M on a YTD basis. • YoY NOI rebounds to 89% of prior year. NOI • YTD NOI margin remains strong at 32%. *Same Store 95 Communities 6


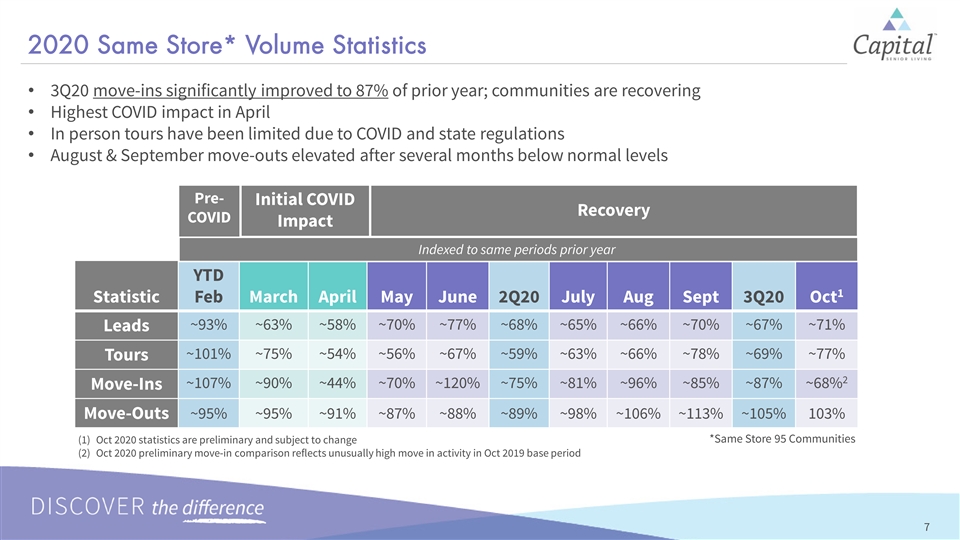
2020 Same Store* Volume Statistics • 3Q20 move-ins significantly improved to 87% of prior year; communities are recovering • Highest COVID impact in April • In person tours have been limited due to COVID and state regulations • August & September move-outs elevated after several months below normal levels Pre- Initial COVID Recovery COVID Impact Indexed to same periods prior year YTD 1 Statistic Feb March April May June 2Q20 July Aug Sept 3Q20 Oct ~93% ~63% ~58% ~70% ~77% ~68% ~65% ~66% ~70% ~67% ~71% Leads ~101% ~75% ~54% ~56% ~67% ~59% ~63% ~66% ~78% ~69% ~77% Tours 2 ~107% ~90% ~44% ~70% ~120% ~75% ~81% ~96% ~85% ~87% ~68% Move-Ins Move-Outs ~95% ~95% ~91% ~87% ~88% ~89% ~98% ~106% ~113% ~105% 103% *Same Store 95 Communities (1) Oct 2020 statistics are preliminary and subject to change (2) Oct 2020 preliminary move-in comparison reflects unusually high move in activity in Oct 2019 base period 72020 Same Store* Volume Statistics • 3Q20 move-ins significantly improved to 87% of prior year; communities are recovering • Highest COVID impact in April • In person tours have been limited due to COVID and state regulations • August & September move-outs elevated after several months below normal levels Pre- Initial COVID Recovery COVID Impact Indexed to same periods prior year YTD 1 Statistic Feb March April May June 2Q20 July Aug Sept 3Q20 Oct ~93% ~63% ~58% ~70% ~77% ~68% ~65% ~66% ~70% ~67% ~71% Leads ~101% ~75% ~54% ~56% ~67% ~59% ~63% ~66% ~78% ~69% ~77% Tours 2 ~107% ~90% ~44% ~70% ~120% ~75% ~81% ~96% ~85% ~87% ~68% Move-Ins Move-Outs ~95% ~95% ~91% ~87% ~88% ~89% ~98% ~106% ~113% ~105% 103% *Same Store 95 Communities (1) Oct 2020 statistics are preliminary and subject to change (2) Oct 2020 preliminary move-in comparison reflects unusually high move in activity in Oct 2019 base period 7


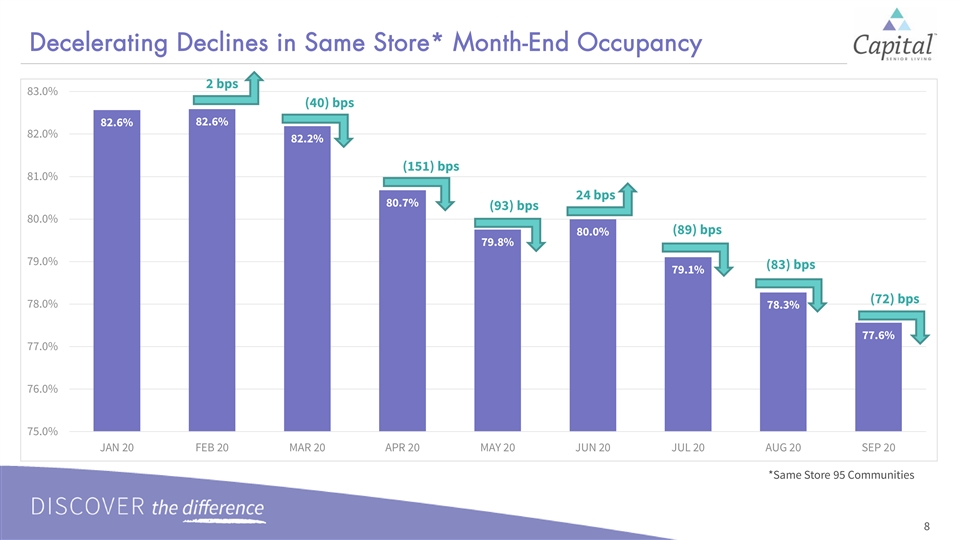
Decelerating Declines in Same Store* Month-End Occupancy 2 bps 83.0% (40) bps 82.6% 82.6% 82.0% 82.2% (151) bps 81.0% 24 bps 80.7% (93) bps 80.0% (89) bps 80.0% 79.8% 79.0% (83) bps 79.1% (72) bps 78.0% 78.3% 77.6% 77.0% 76.0% 75.0% JAN 20 FEB 20 MAR 20 APR 20 MAY 20 JUN 20 JUL 20 AUG 20 SEP 20 *Same Store 95 Communities 8Decelerating Declines in Same Store* Month-End Occupancy 2 bps 83.0% (40) bps 82.6% 82.6% 82.0% 82.2% (151) bps 81.0% 24 bps 80.7% (93) bps 80.0% (89) bps 80.0% 79.8% 79.0% (83) bps 79.1% (72) bps 78.0% 78.3% 77.6% 77.0% 76.0% 75.0% JAN 20 FEB 20 MAR 20 APR 20 MAY 20 JUN 20 JUL 20 AUG 20 SEP 20 *Same Store 95 Communities 8


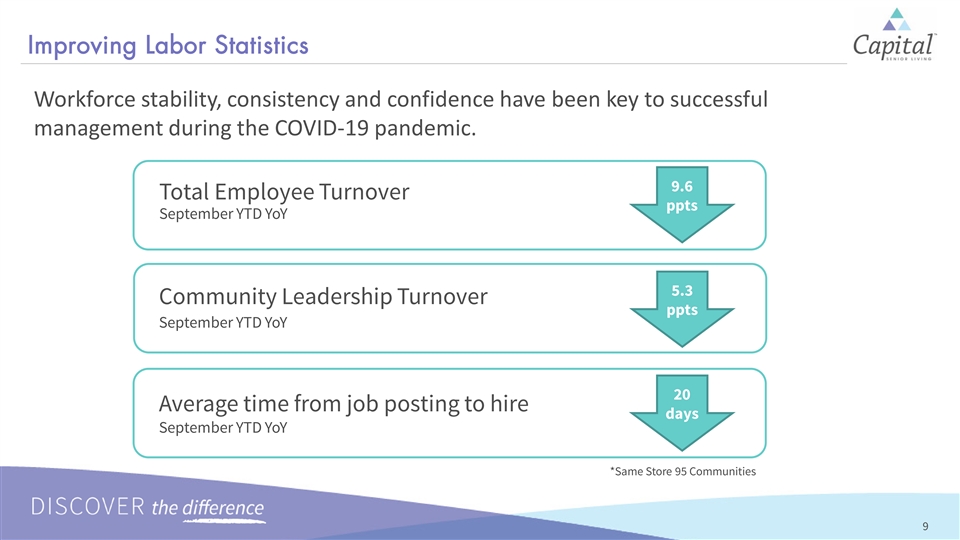
Improving Labor Statistics Workforce stability, consistency and confidence have been key to successful management during the COVID-19 pandemic. 9.6 Total Employee Turnover ppts September YTD YoY 5.3 Community Leadership Turnover ppts September YTD YoY 20 Average time from job posting to hire days September YTD YoY *Same Store 95 Communities 9Improving Labor Statistics Workforce stability, consistency and confidence have been key to successful management during the COVID-19 pandemic. 9.6 Total Employee Turnover ppts September YTD YoY 5.3 Community Leadership Turnover ppts September YTD YoY 20 Average time from job posting to hire days September YTD YoY *Same Store 95 Communities 9


COVID-19 Update 10COVID-19 Update 10


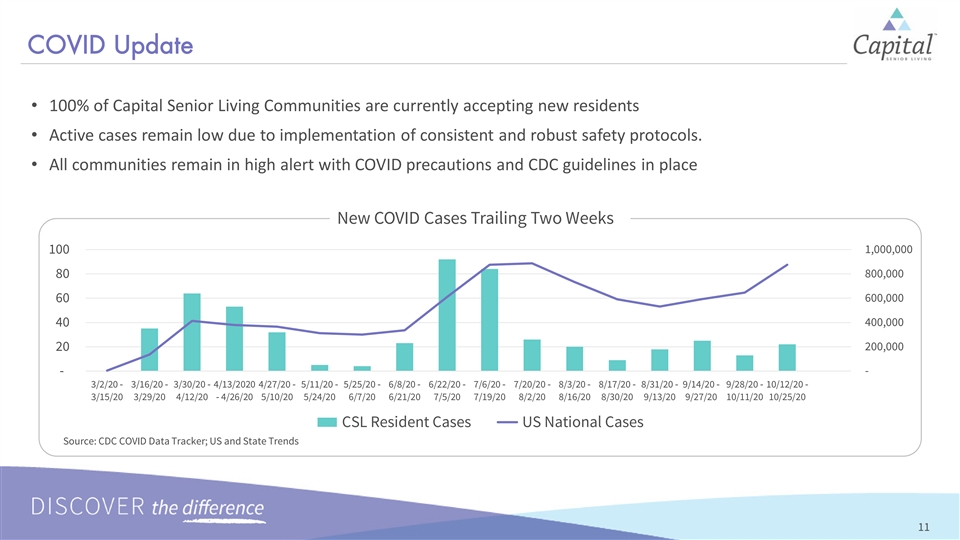
COVID Update • 100% of Capital Senior Living Communities are currently accepting new residents • Active cases remain low due to implementation of consistent and robust safety protocols. • All communities remain in high alert with COVID precautions and CDC guidelines in place New COVID Cases Trailing Two Weeks 1,000,000 100 800,000 80 60 600,000 400,000 40 200,000 20 - - 3/2/20 - 3/16/20 - 3/30/20 - 4/13/2020 4/27/20 - 5/11/20 - 5/25/20 - 6/8/20 - 6/22/20 - 7/6/20 - 7/20/20 - 8/3/20 - 8/17/20 - 8/31/20 - 9/14/20 - 9/28/20 - 10/12/20 - 3/15/20 3/29/20 4/12/20 - 4/26/20 5/10/20 5/24/20 6/7/20 6/21/20 7/5/20 7/19/20 8/2/20 8/16/20 8/30/20 9/13/20 9/27/20 10/11/20 10/25/20 CSL Resident Cases US National Cases Source: CDC COVID Data Tracker; US and State Trends 11COVID Update • 100% of Capital Senior Living Communities are currently accepting new residents • Active cases remain low due to implementation of consistent and robust safety protocols. • All communities remain in high alert with COVID precautions and CDC guidelines in place New COVID Cases Trailing Two Weeks 1,000,000 100 800,000 80 60 600,000 400,000 40 200,000 20 - - 3/2/20 - 3/16/20 - 3/30/20 - 4/13/2020 4/27/20 - 5/11/20 - 5/25/20 - 6/8/20 - 6/22/20 - 7/6/20 - 7/20/20 - 8/3/20 - 8/17/20 - 8/31/20 - 9/14/20 - 9/28/20 - 10/12/20 - 3/15/20 3/29/20 4/12/20 - 4/26/20 5/10/20 5/24/20 6/7/20 6/21/20 7/5/20 7/19/20 8/2/20 8/16/20 8/30/20 9/13/20 9/27/20 10/11/20 10/25/20 CSL Resident Cases US National Cases Source: CDC COVID Data Tracker; US and State Trends 11


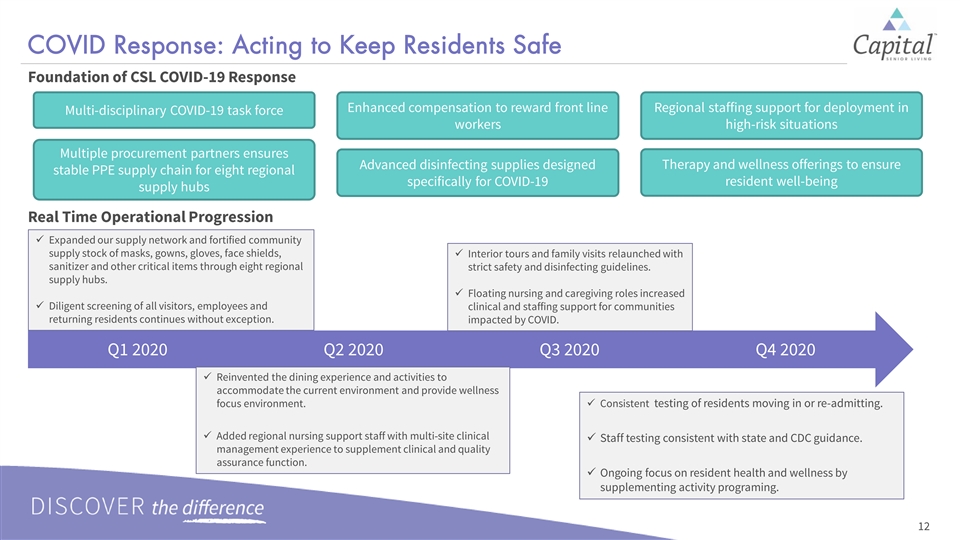
COVID Response: Acting to Keep Residents Safe Foundation of CSL COVID-19 Response Enhanced compensation to reward front line Regional staffing support for deployment in Multi-disciplinary COVID-19 task force workers high-risk situations Multiple procurement partners ensures Advanced disinfecting supplies designed Therapy and wellness offerings to ensure stable PPE supply chain for eight regional specifically for COVID-19 resident well-being supply hubs Real Time Operational Progression ü Expanded our supply network and fortified community supply stock of masks, gowns, gloves, face shields, ü Interior tours and family visits relaunched with sanitizer and other critical items through eight regional strict safety and disinfecting guidelines. supply hubs. ü Floating nursing and caregiving roles increased ü Diligent screening of all visitors, employees and clinical and staffing support for communities returning residents continues without exception. impacted by COVID. Q1 2020 Q2 2020 Q3 2020 Q4 2020 ü Reinvented the dining experience and activities to accommodate the current environment and provide wellness focus environment.ü Consistent testing of residents moving in or re-admitting. ü Added regional nursing support staff with multi-site clinical ü Staff testing consistent with state and CDC guidance. management experience to supplement clinical and quality assurance function. ü Ongoing focus on resident health and wellness by supplementing activity programing. 12COVID Response: Acting to Keep Residents Safe Foundation of CSL COVID-19 Response Enhanced compensation to reward front line Regional staffing support for deployment in Multi-disciplinary COVID-19 task force workers high-risk situations Multiple procurement partners ensures Advanced disinfecting supplies designed Therapy and wellness offerings to ensure stable PPE supply chain for eight regional specifically for COVID-19 resident well-being supply hubs Real Time Operational Progression ü Expanded our supply network and fortified community supply stock of masks, gowns, gloves, face shields, ü Interior tours and family visits relaunched with sanitizer and other critical items through eight regional strict safety and disinfecting guidelines. supply hubs. ü Floating nursing and caregiving roles increased ü Diligent screening of all visitors, employees and clinical and staffing support for communities returning residents continues without exception. impacted by COVID. Q1 2020 Q2 2020 Q3 2020 Q4 2020 ü Reinvented the dining experience and activities to accommodate the current environment and provide wellness focus environment.ü Consistent testing of residents moving in or re-admitting. ü Added regional nursing support staff with multi-site clinical ü Staff testing consistent with state and CDC guidance. management experience to supplement clinical and quality assurance function. ü Ongoing focus on resident health and wellness by supplementing activity programing. 12


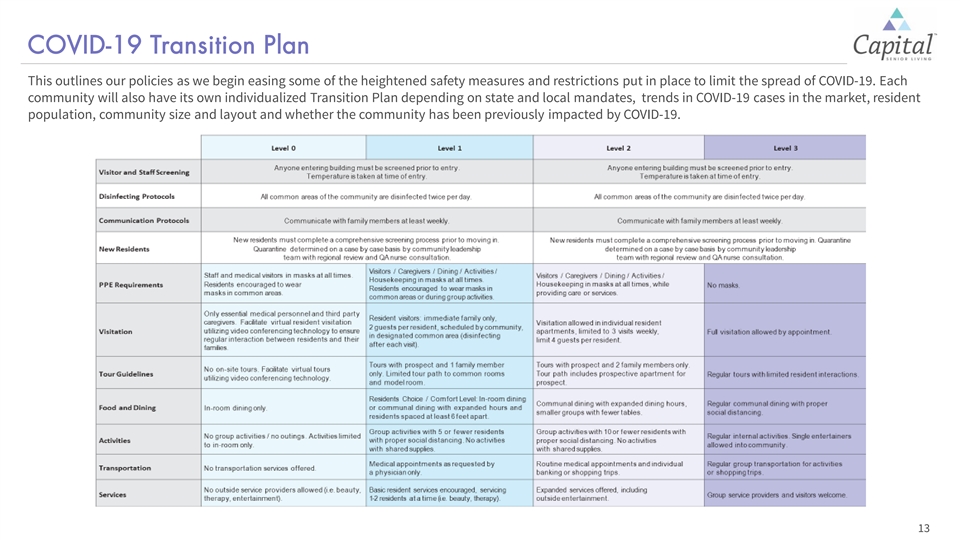
COVID-19 Transition Plan This outlines our policies as we begin easing some of the heightened safety measures and restrictions put in place to limit the spread of COVID-19. Each community will also have its own individualized Transition Plan depending on state and local mandates, trends in COVID-19 cases in the market, resident population, community size and layout and whether the community has been previously impacted by COVID-19. 13COVID-19 Transition Plan This outlines our policies as we begin easing some of the heightened safety measures and restrictions put in place to limit the spread of COVID-19. Each community will also have its own individualized Transition Plan depending on state and local mandates, trends in COVID-19 cases in the market, resident population, community size and layout and whether the community has been previously impacted by COVID-19. 13


Strategy Update 14Strategy Update 14


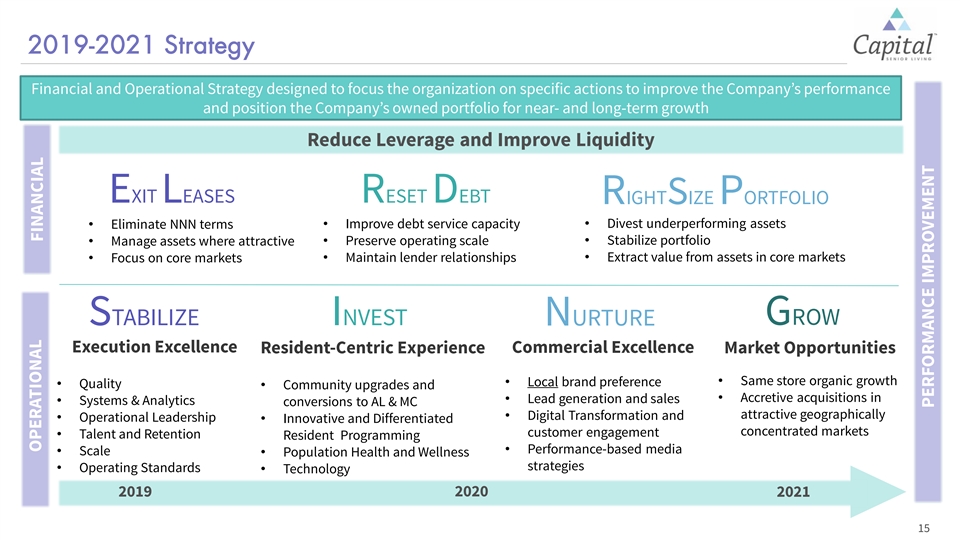
2019-2021 Strategy Financial and Operational Strategy designed to focus the organization on specific actions to improve the Company’s performance and position the Company’s owned portfolio for near- and long-term growth Reduce Leverage and Improve Liquidity EXIT LEASES RESET DEBT RIGHTSIZE PORTFOLIO • Improve debt service capacity • Divest underperforming assets • Eliminate NNN terms • Preserve operating scale • Stabilize portfolio • Manage assets where attractive • Focus on core markets • Maintain lender relationships • Extract value from assets in core markets STABILIZE INVEST GROW NURTURE Execution Excellence Resident-Centric Experience Commercial Excellence Market Opportunities • Same store organic growth • Local brand preference • Quality • Community upgrades and • Accretive acquisitions in • Lead generation and sales • Systems & Analytics conversions to AL & MC attractive geographically • Digital Transformation and • Operational Leadership • Innovative and Differentiated concentrated markets customer engagement • Talent and Retention Resident Programming • Performance-based media • Scale • Population Health and Wellness strategies • Operating Standards • Technology 2020 2019 2021 9 Strictly confidential 15 OPERATIONAL FINANCIAL PERFORMANCE IMPROVEMENT 2019-2021 Strategy Financial and Operational Strategy designed to focus the organization on specific actions to improve the Company’s performance and position the Company’s owned portfolio for near- and long-term growth Reduce Leverage and Improve Liquidity EXIT LEASES RESET DEBT RIGHTSIZE PORTFOLIO • Improve debt service capacity • Divest underperforming assets • Eliminate NNN terms • Preserve operating scale • Stabilize portfolio • Manage assets where attractive • Focus on core markets • Maintain lender relationships • Extract value from assets in core markets STABILIZE INVEST GROW NURTURE Execution Excellence Resident-Centric Experience Commercial Excellence Market Opportunities • Same store organic growth • Local brand preference • Quality • Community upgrades and • Accretive acquisitions in • Lead generation and sales • Systems & Analytics conversions to AL & MC attractive geographically • Digital Transformation and • Operational Leadership • Innovative and Differentiated concentrated markets customer engagement • Talent and Retention Resident Programming • Performance-based media • Scale • Population Health and Wellness strategies • Operating Standards • Technology 2020 2019 2021 9 Strictly confidential 15 OPERATIONAL FINANCIAL PERFORMANCE IMPROVEMENT


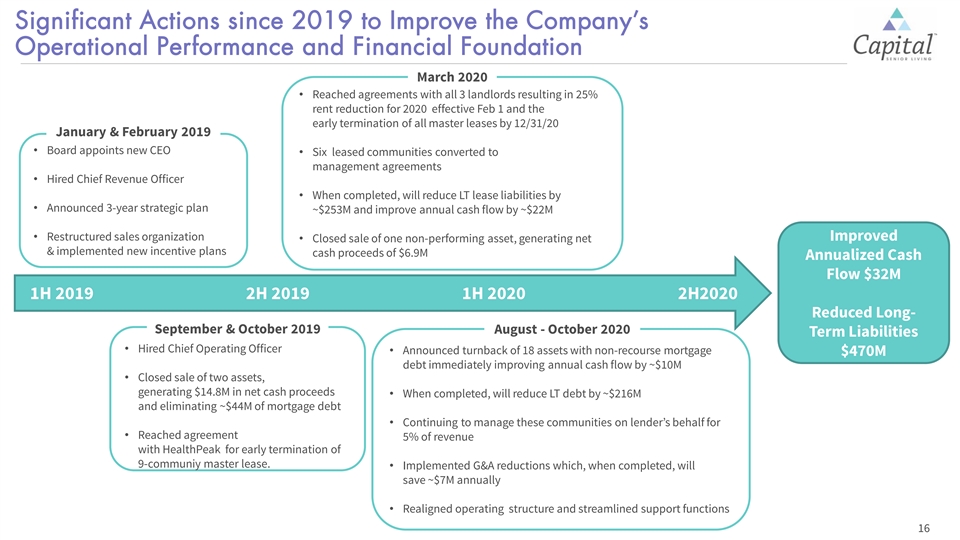
Significant Actions since 2019 to Improve the Company’s Operational Performance and Financial Foundation March 2020 • Reached agreements with all 3 landlords resulting in 25% rent reduction for 2020 effective Feb 1 and the early termination of all master leases by 12/31/20 January & February 2019 • Board appoints new CEO • Six leased communities converted to management agreements • Hired Chief Revenue Officer • When completed, will reduce LT lease liabilities by • Announced 3-year strategic plan ~$253M and improve annual cash flow by ~$22M • Restructured sales organization Improved • Closed sale of one non-performing asset, generating net & implemented new incentive plans cash proceeds of $6.9M Annualized Cash Flow $32M 1H 2019 2H 2019 1H 2020 2H2020 Reduced Long- September & October 2019 August - October 2020 Term Liabilities • Hired Chief Operating Officer • Announced turnback of 18 assets with non-recourse mortgage $470M debt immediately improving annual cash flow by ~$10M • Closed sale of two assets, generating $14.8M in net cash proceeds • When completed, will reduce LT debt by ~$216M and eliminating ~$44M of mortgage debt • Continuing to manage these communities on lender’s behalf for • Reached agreement 5% of revenue with HealthPeak for early termination of 9-communiy master lease. • Implemented G&A reductions which, when completed, will save ~$7M annually • Realigned operating structure and streamlined support functions 16Significant Actions since 2019 to Improve the Company’s Operational Performance and Financial Foundation March 2020 • Reached agreements with all 3 landlords resulting in 25% rent reduction for 2020 effective Feb 1 and the early termination of all master leases by 12/31/20 January & February 2019 • Board appoints new CEO • Six leased communities converted to management agreements • Hired Chief Revenue Officer • When completed, will reduce LT lease liabilities by • Announced 3-year strategic plan ~$253M and improve annual cash flow by ~$22M • Restructured sales organization Improved • Closed sale of one non-performing asset, generating net & implemented new incentive plans cash proceeds of $6.9M Annualized Cash Flow $32M 1H 2019 2H 2019 1H 2020 2H2020 Reduced Long- September & October 2019 August - October 2020 Term Liabilities • Hired Chief Operating Officer • Announced turnback of 18 assets with non-recourse mortgage $470M debt immediately improving annual cash flow by ~$10M • Closed sale of two assets, generating $14.8M in net cash proceeds • When completed, will reduce LT debt by ~$216M and eliminating ~$44M of mortgage debt • Continuing to manage these communities on lender’s behalf for • Reached agreement 5% of revenue with HealthPeak for early termination of 9-communiy master lease. • Implemented G&A reductions which, when completed, will save ~$7M annually • Realigned operating structure and streamlined support functions 16


Exiting Underperforming NNN Leases to Focus on Core Owned Portfolio • Master leases terminate on 12/31/20 • Master lease with 10/31/20 maturity • Master lease terminates on 12/31/20 date terminates on or before such date (one community transitioned on • Rent reduced to 75% of contractual • Rent reduced to 75% of contractual rate, net of reimbursed expenses, 1/15/20, others being marketed for rate effective 2/1/20 effective 2/1/20 sale by HP) • Ventas to reimburse Company for up • Welltower to reimburse Company for • Master lease with 4/30/26 maturity to $1000/unit of capex until terminated and communities communities transition up to $1000/unit of capex until communities transition converted to interim management agreements effective 2/1/20 • Communities will convert to • Communities will convert to (communities being marketed for sale management agreements if not management agreements if not by HP) transitioned by 12/31/20 transitioned by 12/31/20 • Company paid transition fee of $250k • Company releases security deposits • Company releases security deposits and releases security deposits held by held by Ventas held by Welltower Healthpeak When all transitions are complete, the Company’s cash flow will improve ~ $22.0M annually, and all related lease liabilities, which were ~ $253M at 12/31/19, will be eliminated. 17Exiting Underperforming NNN Leases to Focus on Core Owned Portfolio • Master leases terminate on 12/31/20 • Master lease with 10/31/20 maturity • Master lease terminates on 12/31/20 date terminates on or before such date (one community transitioned on • Rent reduced to 75% of contractual • Rent reduced to 75% of contractual rate, net of reimbursed expenses, 1/15/20, others being marketed for rate effective 2/1/20 effective 2/1/20 sale by HP) • Ventas to reimburse Company for up • Welltower to reimburse Company for • Master lease with 4/30/26 maturity to $1000/unit of capex until terminated and communities communities transition up to $1000/unit of capex until communities transition converted to interim management agreements effective 2/1/20 • Communities will convert to • Communities will convert to (communities being marketed for sale management agreements if not management agreements if not by HP) transitioned by 12/31/20 transitioned by 12/31/20 • Company paid transition fee of $250k • Company releases security deposits • Company releases security deposits and releases security deposits held by held by Ventas held by Welltower Healthpeak When all transitions are complete, the Company’s cash flow will improve ~ $22.0M annually, and all related lease liabilities, which were ~ $253M at 12/31/19, will be eliminated. 17


Reduced Financial Obligations, Stabilized Balance Sheet In 2Q20, the Company entered into short-term debt forbearance agreements with several of its lenders to help mitigate the impact of the COVID-19 pandemic. • Fannie Mae: • The Company made reduced “net cash flow” payments April through July 2020 on 23 communities • Turned 18 communities back to Fannie Mae effective August 1, 2020 • The Company has 43 loans with Fannie Mae that are current and in good standing • Protective Life: • The Company will receive six months of full P&I relief (April 2020 through June 2020, and October 2020 - December 2020) on all 10 communities • The Company will make interest-only payments on these 10 communities for 12 months (July 2020 through September 2020, and January 2021 through September 2021) • BBVA: The Company made reduced “net cash flow” payments in April through June on its three communities with BBVA • HUD: The Company made reduced “net cash flow” payments in April through June on its one HUD community 18Reduced Financial Obligations, Stabilized Balance Sheet In 2Q20, the Company entered into short-term debt forbearance agreements with several of its lenders to help mitigate the impact of the COVID-19 pandemic. • Fannie Mae: • The Company made reduced “net cash flow” payments April through July 2020 on 23 communities • Turned 18 communities back to Fannie Mae effective August 1, 2020 • The Company has 43 loans with Fannie Mae that are current and in good standing • Protective Life: • The Company will receive six months of full P&I relief (April 2020 through June 2020, and October 2020 - December 2020) on all 10 communities • The Company will make interest-only payments on these 10 communities for 12 months (July 2020 through September 2020, and January 2021 through September 2021) • BBVA: The Company made reduced “net cash flow” payments in April through June on its three communities with BBVA • HUD: The Company made reduced “net cash flow” payments in April through June on its one HUD community 18


Transitioning to a More Focused Platform Resident Revenue by State Post Transitions 1 2 Today Post Transitions Texas, 23% Remaining, Communities 95 68 29% 61 Owned 60 Owned 34 Leased 0 Leased 0 Managed 8 Managed States 20 16 Ohio, 22% Units 8,920 5,634 Indiana, 16% 3Q 20Occupancy 77.6% 79.3% Wisconsin, 10% 3Q20 Avg Rent $3,731 ~$3,582 Unit Mix 3 3Q20 NOI Margin 29% ~27% 12% 12% Debt $915.9M $688.7M 38% 38% Memory Care CapEx / Unit $1,200 $1,200 Independent Living Employees ~4,470 ~2,880 Assisted Living 50% 50% (1) Based on 3Q20 actuals for 95 same store communities. (2) Based on 3Q20 actuals and pre-COVID historical trends for 60 owned communities. (3) NOI defined as revenue less operating expenses including property taxes, insurance, professional fees but excluding bad debt and mgmt. fees. Excludes both COVID Relief Revenue and COVID Expenses. Post transition NOI margin is owned communities only. Today Post Transitions 19 Transition ~6 MonthsTransitioning to a More Focused Platform Resident Revenue by State Post Transitions 1 2 Today Post Transitions Texas, 23% Remaining, Communities 95 68 29% 61 Owned 60 Owned 34 Leased 0 Leased 0 Managed 8 Managed States 20 16 Ohio, 22% Units 8,920 5,634 Indiana, 16% 3Q 20Occupancy 77.6% 79.3% Wisconsin, 10% 3Q20 Avg Rent $3,731 ~$3,582 Unit Mix 3 3Q20 NOI Margin 29% ~27% 12% 12% Debt $915.9M $688.7M 38% 38% Memory Care CapEx / Unit $1,200 $1,200 Independent Living Employees ~4,470 ~2,880 Assisted Living 50% 50% (1) Based on 3Q20 actuals for 95 same store communities. (2) Based on 3Q20 actuals and pre-COVID historical trends for 60 owned communities. (3) NOI defined as revenue less operating expenses including property taxes, insurance, professional fees but excluding bad debt and mgmt. fees. Excludes both COVID Relief Revenue and COVID Expenses. Post transition NOI margin is owned communities only. Today Post Transitions 19 Transition ~6 Months


Continuing Owned Communities Occupancy has Consistently Outperformed the Remainder of the Portfolio Continuing Owned (60) Continuing Managed (8) Transitioning Owned (18) Transitioning Leased (38) 95.0% 89.3% 90.0% 87.7% 85.0% 85.0% 83.0% 79.3% 80.0% 74.3% 75.0% 73.5% 70.9% 70.0% 65.0% Q2 17 Q3 17 Q4 17 Q1 18 Q2 18 Q3 18 Q4 18 Q1 19 Q2 19 Q3 19 Q4 19 Q1 20 Q2 20 Q3 20 Continuing Owned (60) 87.7% 88.0% 88.5% 87.7% 86.7% 85.6% 85.3% 85.7% 85.0% 84.2% 84.4% 83.7% 81.5% 79.3% Continuing Managed (8) 85.0% 84.4% 83.7% 84.0% 85.6% 85.8% 84.0% 82.5% 82.9% 80.9% 79.4% 78.3% 75.7% 74.3% Transitioning Owned (18) 89.3% 89.7% 89.6% 87.6% 86.4% 81.5% 80.1% 79.5% 79.3% 77.8% 75.4% 72.9% 70.8% 70.9% Transitioning Leased (38) 83.0% 83.1% 83.4% 80.8% 80.0% 80.3% 78.7% 78.8% 78.0% 76.8% 76.8% 77.4% 75.1% 73.5% Note: Q3 20 Lease Portfolio removing the five (5) communities that transitioned 9/10/20 20Continuing Owned Communities Occupancy has Consistently Outperformed the Remainder of the Portfolio Continuing Owned (60) Continuing Managed (8) Transitioning Owned (18) Transitioning Leased (38) 95.0% 89.3% 90.0% 87.7% 85.0% 85.0% 83.0% 79.3% 80.0% 74.3% 75.0% 73.5% 70.9% 70.0% 65.0% Q2 17 Q3 17 Q4 17 Q1 18 Q2 18 Q3 18 Q4 18 Q1 19 Q2 19 Q3 19 Q4 19 Q1 20 Q2 20 Q3 20 Continuing Owned (60) 87.7% 88.0% 88.5% 87.7% 86.7% 85.6% 85.3% 85.7% 85.0% 84.2% 84.4% 83.7% 81.5% 79.3% Continuing Managed (8) 85.0% 84.4% 83.7% 84.0% 85.6% 85.8% 84.0% 82.5% 82.9% 80.9% 79.4% 78.3% 75.7% 74.3% Transitioning Owned (18) 89.3% 89.7% 89.6% 87.6% 86.4% 81.5% 80.1% 79.5% 79.3% 77.8% 75.4% 72.9% 70.8% 70.9% Transitioning Leased (38) 83.0% 83.1% 83.4% 80.8% 80.0% 80.3% 78.7% 78.8% 78.0% 76.8% 76.8% 77.4% 75.1% 73.5% Note: Q3 20 Lease Portfolio removing the five (5) communities that transitioned 9/10/20 20


Continuing Owned and Managed REVPOR Upward Trend Despite Market Volatility Continuing Owned (60) Continuing Managed (8) Transitioning Owned (18) Transitioning Leased (38) $4,400 $4,255 $4,185 $4,200 $4,000 $3,800 $3,582 $3,541 $3,600 $3,548 $3,501 $3,400 $3,440 $3,268 $3,200 Q2 17 Q3 17 Q4 17 Q1 18 Q2 18 Q3 18 Q4 18 Q1 19 Q2 19 Q3 19 Q4 19 Q1 20 Q2 20 * Q3 20 Continuing Owned (60) $3,501 $3,513 $3,522 $3,506 $3,533 $3,535 $3,545 $3,515 $3,546 $3,559 $3,564 $3,577 $3,601 $3,582 Continuing Managed (8) $3,268 $3,299 $3,345 $3,340 $3,393 $3,399 $3,437 $3,443 $3,442 $3,438 $3,454 $3,435 $3,418 $3,440 Transitioning Owned (18) $3,541 $3,579 $3,660 $3,625 $3,642 $3,629 $3,651 $3,633 $3,620 $3,581 $3,598 $3,592 $3,570 $3,548 Transitioning Leased (38) $4,185 $4,215 $4,215 $4,184 $4,219 $4,263 $4,296 $4,237 $4,245 $4,241 $4,245 $4,255 $4,258 $4,255 * Excludes COVID State Relief Revenue Note: Q3 20 Lease Portfolio removing the five (5) communities that transitioned 9/10/20 21Continuing Owned and Managed REVPOR Upward Trend Despite Market Volatility Continuing Owned (60) Continuing Managed (8) Transitioning Owned (18) Transitioning Leased (38) $4,400 $4,255 $4,185 $4,200 $4,000 $3,800 $3,582 $3,541 $3,600 $3,548 $3,501 $3,400 $3,440 $3,268 $3,200 Q2 17 Q3 17 Q4 17 Q1 18 Q2 18 Q3 18 Q4 18 Q1 19 Q2 19 Q3 19 Q4 19 Q1 20 Q2 20 * Q3 20 Continuing Owned (60) $3,501 $3,513 $3,522 $3,506 $3,533 $3,535 $3,545 $3,515 $3,546 $3,559 $3,564 $3,577 $3,601 $3,582 Continuing Managed (8) $3,268 $3,299 $3,345 $3,340 $3,393 $3,399 $3,437 $3,443 $3,442 $3,438 $3,454 $3,435 $3,418 $3,440 Transitioning Owned (18) $3,541 $3,579 $3,660 $3,625 $3,642 $3,629 $3,651 $3,633 $3,620 $3,581 $3,598 $3,592 $3,570 $3,548 Transitioning Leased (38) $4,185 $4,215 $4,215 $4,184 $4,219 $4,263 $4,296 $4,237 $4,245 $4,241 $4,245 $4,255 $4,258 $4,255 * Excludes COVID State Relief Revenue Note: Q3 20 Lease Portfolio removing the five (5) communities that transitioned 9/10/20 21


(1) NOI Margin % Disruption Due to COVID Pandemic Continuing Owned (60) Continuing Managed (8) Transitioning Owned (18) Transitioning Leased (38) 45.0% 42.1% 41.3% 40.0% 37.6% 35.0% 32.7% 34.4% 29.4% 30.0% 25.0% 26.6% 20.0% 13.5% 15.0% 10.0% Q2 17 Q3 17 Q4 17 Q1 18 Q2 18 Q3 18 Q4 18 Q1 19 Q2 19 Q3 19 Q4 19 Q1 20 * Q2 20 * Q3 20 Continuing Owned (60) 37.6% 35.8% 35.8% 35.6% 35.0% 33.2% 33.6% 33.1% 32.8% 30.3% 28.9% 30.9% 31.5% 26.6% Continuing Managed (8) 41.3% 38.4% 39.1% 39.9% 41.6% 39.1% 38.7% 38.3% 40.1% 35.0% 31.6% 34.3% 33.3% 32.7% Transitioning Owned (18) 34.4% 32.9% 31.9% 31.5% 29.7% 25.9% 27.2% 26.3% 24.2% 20.2% 17.5% 19.5% 18.3% 13.5% Transitioning Leased (38) 42.1% 41.7% 42.8% 41.3% 39.3% 38.4% 38.8% 38.9% 38.8% 34.1% 32.1% 34.2% 33.3% 29.4% (1) NOI defined as revenue less operating expenses including property Notes: Q3 20 Lease Portfolio removing the five (5) taxes, insurance, professional fees but excluding bad debt and mgmt. communities that transitioned 9/10/20; fees. Excludes both COVID Relief Revenue and COVID Expenses 22(1) NOI Margin % Disruption Due to COVID Pandemic Continuing Owned (60) Continuing Managed (8) Transitioning Owned (18) Transitioning Leased (38) 45.0% 42.1% 41.3% 40.0% 37.6% 35.0% 32.7% 34.4% 29.4% 30.0% 25.0% 26.6% 20.0% 13.5% 15.0% 10.0% Q2 17 Q3 17 Q4 17 Q1 18 Q2 18 Q3 18 Q4 18 Q1 19 Q2 19 Q3 19 Q4 19 Q1 20 * Q2 20 * Q3 20 Continuing Owned (60) 37.6% 35.8% 35.8% 35.6% 35.0% 33.2% 33.6% 33.1% 32.8% 30.3% 28.9% 30.9% 31.5% 26.6% Continuing Managed (8) 41.3% 38.4% 39.1% 39.9% 41.6% 39.1% 38.7% 38.3% 40.1% 35.0% 31.6% 34.3% 33.3% 32.7% Transitioning Owned (18) 34.4% 32.9% 31.9% 31.5% 29.7% 25.9% 27.2% 26.3% 24.2% 20.2% 17.5% 19.5% 18.3% 13.5% Transitioning Leased (38) 42.1% 41.7% 42.8% 41.3% 39.3% 38.4% 38.8% 38.9% 38.8% 34.1% 32.1% 34.2% 33.3% 29.4% (1) NOI defined as revenue less operating expenses including property Notes: Q3 20 Lease Portfolio removing the five (5) taxes, insurance, professional fees but excluding bad debt and mgmt. communities that transitioned 9/10/20; fees. Excludes both COVID Relief Revenue and COVID Expenses 22


Continuing Owned & Managed Communities Year Built / Year Built / City Expanded IL AL MC Total Community State City Expanded IL AL MC Total Community State West Shores Hot Springs AR 1987 43 90 0 133 Dayton Dayton OH 2008 101 31 18 150 Cottonwood Village Cottonwood AZ 1986 88 51 21 160 Levis Commons Perrysburg OH 2008 44 102 0 146 Villa Santa Barbara Santa Barbara CA 1979 0 121 0 121 Whispering Pines Village Columbiana OH 2001 12 57 0 69 Carpenter's Creek Pensacola FL 1987 0 93 0 93 North Bend Crossing Cincinnati OH 2008 45 62 15 122 Creekside Fairfield Pensacola FL 1997/2005* 0 0 84 84 Fairfield OH 2000 120 0 0 120 Keystone Woods Anderson IN 1997 0 58 0 58 Mansfield Mansfield OH 1999 0 117 0 117 Wynnfield Crossing North Pointe Rochester IN 1998 0 50 0 50 Anderson SC 1991 & 2008 0 28 12 40 Riverbend Jeffersonville IN 2000 0 63 34 97 Summit Place Anderson SC 2000 & 2008 15 36 24 75 Batesville Batesville IN 2003 0 41 0 41 Courtyards at Lake Granbury Granbury TX 2005 0 72 10 82 Southport Indianapolis IN 1999 0 50 14 64 Cooper Arlington TX 1994 0 72 18 90 Country Charm Greenwood IN 1993/2007 0 89 0 89 College Station College Station TX 1996 0 36 17 53 Autumn Glen Conroe Greencastle IN 1999 0 47 0 47 Conroe TX AL-1997 / IL 2001 23 20 0 43 Georgetowne Place Fort Wayne IN 1987 63 75 14 152 Corpus Christi Corpus Christi TX 1996 0 51 0 51 Harrison Good Tree Indianapolis IN 1985 0 103 14 117 Stephenville TX 1998 20 31 8 59 Greenbriar Village Indianapolis IN 1999 0 82 22 104 Remington at Valley Ranch Irving TX 2000 126 0 0 126 Springfield Springfield MA 2005 97 71 18 186 Baytown Baytown TX 1997/2008 9 88 30 127 Aspen Grove Lambertville MI 2003 0 53 25 78 Rosemont Humble TX 1999 0 72 24 96 IV East Lansing East Lansing MI 1989 146 0 0 146 Whitley Place Keller TX 1998 0 27 20 47 Rose Arbor & Wildflower Lodge Fort Worth Maple Grove MN 2001 25 66 39 130 Ft. Worth TX 2000 154 0 0 154 Vintage Oaks Saint Joseph MO 2004 22 67 10 99 Huebner San Antonio TX 1999 119 0 0 119 Ironbridge Mesquite Springfield MO 2001 120 0 0 120 Mesquite TX 1999 152 0 0 152 Highland Colony Ridgeland MS 2000 116 0 0 116 Thousand Oaks San Antonio TX 1999 119 0 0 119 LaurelHurst Columbus NC 2002 40 24 16 80 Plano Plano TX 2000 91 45 0 136 IV Raleigh Raleigh NC 1991 167 0 0 167 Arapaho Richardson TX 2002 95 45 0 140 Marquis Place Elkhorn NE 2002/2005 0 43 20 63 North Richland Hills North Richland Hills TX 2001 118 0 0 118 Crown Pointe Virginia Beach Omaha NE 1984 63 53 20 136 Virginia Beach VA 1999 0 85 25 110 Heritage at The Plains Oneota NY 2009 64 28 16 108 Fitchburg Fitchburg WI 2004 36 46 0 82 Amberleigh Williamsville NY 1989 201 49 17 267 Plymouth Plymouth WI 2007/2008/2010 0 69 0 69 Canton Regency Canton OH 1987-1999 92 102 36 230 Brookview Meadows Green Bay WI 2005 41 37 0 78 Summit Point Macedonia OH 2007 70 68 12 150 Hartford Hartford WI 2004 0 28 11 39 Woodlands of Columbus West Bend Columbus OH 2002/2011 0 94 17 111 West Bend WI 1992 0 20 20 40 Chardon Chardon OH 2000 0 42 0 42 Colby Colby WI 2008 0 44 0 44 Hamilton Park Falls Hamilton OH 1999/2012 0 52 24 76 Park Falls WI 2013 0 24 12 36 Shaker Heights Shaker Heights OH 1992 0 37 22 59 Wisconsin Rapids Wisconsin Rapids WI 2007* 0 40 18 58 23Continuing Owned & Managed Communities Year Built / Year Built / City Expanded IL AL MC Total Community State City Expanded IL AL MC Total Community State West Shores Hot Springs AR 1987 43 90 0 133 Dayton Dayton OH 2008 101 31 18 150 Cottonwood Village Cottonwood AZ 1986 88 51 21 160 Levis Commons Perrysburg OH 2008 44 102 0 146 Villa Santa Barbara Santa Barbara CA 1979 0 121 0 121 Whispering Pines Village Columbiana OH 2001 12 57 0 69 Carpenter's Creek Pensacola FL 1987 0 93 0 93 North Bend Crossing Cincinnati OH 2008 45 62 15 122 Creekside Fairfield Pensacola FL 1997/2005* 0 0 84 84 Fairfield OH 2000 120 0 0 120 Keystone Woods Anderson IN 1997 0 58 0 58 Mansfield Mansfield OH 1999 0 117 0 117 Wynnfield Crossing North Pointe Rochester IN 1998 0 50 0 50 Anderson SC 1991 & 2008 0 28 12 40 Riverbend Jeffersonville IN 2000 0 63 34 97 Summit Place Anderson SC 2000 & 2008 15 36 24 75 Batesville Batesville IN 2003 0 41 0 41 Courtyards at Lake Granbury Granbury TX 2005 0 72 10 82 Southport Indianapolis IN 1999 0 50 14 64 Cooper Arlington TX 1994 0 72 18 90 Country Charm Greenwood IN 1993/2007 0 89 0 89 College Station College Station TX 1996 0 36 17 53 Autumn Glen Conroe Greencastle IN 1999 0 47 0 47 Conroe TX AL-1997 / IL 2001 23 20 0 43 Georgetowne Place Fort Wayne IN 1987 63 75 14 152 Corpus Christi Corpus Christi TX 1996 0 51 0 51 Harrison Good Tree Indianapolis IN 1985 0 103 14 117 Stephenville TX 1998 20 31 8 59 Greenbriar Village Indianapolis IN 1999 0 82 22 104 Remington at Valley Ranch Irving TX 2000 126 0 0 126 Springfield Springfield MA 2005 97 71 18 186 Baytown Baytown TX 1997/2008 9 88 30 127 Aspen Grove Lambertville MI 2003 0 53 25 78 Rosemont Humble TX 1999 0 72 24 96 IV East Lansing East Lansing MI 1989 146 0 0 146 Whitley Place Keller TX 1998 0 27 20 47 Rose Arbor & Wildflower Lodge Fort Worth Maple Grove MN 2001 25 66 39 130 Ft. Worth TX 2000 154 0 0 154 Vintage Oaks Saint Joseph MO 2004 22 67 10 99 Huebner San Antonio TX 1999 119 0 0 119 Ironbridge Mesquite Springfield MO 2001 120 0 0 120 Mesquite TX 1999 152 0 0 152 Highland Colony Ridgeland MS 2000 116 0 0 116 Thousand Oaks San Antonio TX 1999 119 0 0 119 LaurelHurst Columbus NC 2002 40 24 16 80 Plano Plano TX 2000 91 45 0 136 IV Raleigh Raleigh NC 1991 167 0 0 167 Arapaho Richardson TX 2002 95 45 0 140 Marquis Place Elkhorn NE 2002/2005 0 43 20 63 North Richland Hills North Richland Hills TX 2001 118 0 0 118 Crown Pointe Virginia Beach Omaha NE 1984 63 53 20 136 Virginia Beach VA 1999 0 85 25 110 Heritage at The Plains Oneota NY 2009 64 28 16 108 Fitchburg Fitchburg WI 2004 36 46 0 82 Amberleigh Williamsville NY 1989 201 49 17 267 Plymouth Plymouth WI 2007/2008/2010 0 69 0 69 Canton Regency Canton OH 1987-1999 92 102 36 230 Brookview Meadows Green Bay WI 2005 41 37 0 78 Summit Point Macedonia OH 2007 70 68 12 150 Hartford Hartford WI 2004 0 28 11 39 Woodlands of Columbus West Bend Columbus OH 2002/2011 0 94 17 111 West Bend WI 1992 0 20 20 40 Chardon Chardon OH 2000 0 42 0 42 Colby Colby WI 2008 0 44 0 44 Hamilton Park Falls Hamilton OH 1999/2012 0 52 24 76 Park Falls WI 2013 0 24 12 36 Shaker Heights Shaker Heights OH 1992 0 37 22 59 Wisconsin Rapids Wisconsin Rapids WI 2007* 0 40 18 58 23


Resizing Overhead to Fit Slimmer Organization • Capital Senior Living will condense its community portfolio from 119 in 3Q20 to 65-70 communities in 2021 and realign Annual G&A Costs operations to fit more concentrated footprint and improve operating efficiencies. Year G&A YoY • The Company has taken several actions to restructure the Costs Change business 2019 A $ 27M • Operations alignments & field support changes 2020 E $ 25M - 7.5 % • Many Dallas Support Center (DSC) functions have been reduced and will continue to rationalize as the 2021 E $ 17.4M - 30 % community portfolio becomes smaller. • DSC office space has been reduced, resulting in annual $7.6M expected G&A savings from 2020 -2021 rent savings of $450k. 24Resizing Overhead to Fit Slimmer Organization • Capital Senior Living will condense its community portfolio from 119 in 3Q20 to 65-70 communities in 2021 and realign Annual G&A Costs operations to fit more concentrated footprint and improve operating efficiencies. Year G&A YoY • The Company has taken several actions to restructure the Costs Change business 2019 A $ 27M • Operations alignments & field support changes 2020 E $ 25M - 7.5 % • Many Dallas Support Center (DSC) functions have been reduced and will continue to rationalize as the 2021 E $ 17.4M - 30 % community portfolio becomes smaller. • DSC office space has been reduced, resulting in annual $7.6M expected G&A savings from 2020 -2021 rent savings of $450k. 24


3Q 2020 Financials 253Q 2020 Financials 25


Same Store* Financial Results 3Q 2020 3Q20 2Q20 3Q19 YTD 20 YTD 19 Average Occupancy 78.0% 79.9% 82.6% 80.0% 83.5% (1) Ending Occupancy 77.6% 80.0% 83.1% 77.6% 83.1% (2) RevPOR $3,731 $3,747 $3,708 $3,738 $3,697 Margin 28.7% 33.2% 32.3% 32.4% 34.5% (3) NOI (95 Properties) $22.3 $26.7 $26.3 $74.9 $85.4 (3) Adjusted CFFO $(3.8) $2.9 $(1.2) $(0.1) $9.5 $ in Millions except RevPOR *Same Store 95 Communities (1) Ending Month Occupancy percentage for each time period (2) Adjusted to remove State Relief Revenue (3) Excludes COVID-19 Relief and Costs 26Same Store* Financial Results 3Q 2020 3Q20 2Q20 3Q19 YTD 20 YTD 19 Average Occupancy 78.0% 79.9% 82.6% 80.0% 83.5% (1) Ending Occupancy 77.6% 80.0% 83.1% 77.6% 83.1% (2) RevPOR $3,731 $3,747 $3,708 $3,738 $3,697 Margin 28.7% 33.2% 32.3% 32.4% 34.5% (3) NOI (95 Properties) $22.3 $26.7 $26.3 $74.9 $85.4 (3) Adjusted CFFO $(3.8) $2.9 $(1.2) $(0.1) $9.5 $ in Millions except RevPOR *Same Store 95 Communities (1) Ending Month Occupancy percentage for each time period (2) Adjusted to remove State Relief Revenue (3) Excludes COVID-19 Relief and Costs 26


Balance Sheet as of September 30, 2020 Assets ($ in millions) Liabilities & Equity ($ in millions) Cash and Securities $ 18.3 Current Liabilities $ 344.5 * Other Current Assets 22.8 Long-Term Debt 654.4 Total Current Assets 41.1 Other Liabilities 0.6 Fixed Assets 692.7 Total Liabilities 999.5 Other Assets 6.7 Stockholders’ Equity (259.0) Total Assets $ 740.5 Total Liabilities & Equity $ 740.5 * Includes $211.1 million of debt, net of deferred loan costs, associated with 18 communities to be transferred to the lender which will eliminate such debt. Also includes $31.5 million of debt associated with a bridge loan due to non-compliance with a financial covenant at 9/30/20, which the Company intends to cure, due to the impact of COVID-19 on one of the communities included in such bridge loan. 27Balance Sheet as of September 30, 2020 Assets ($ in millions) Liabilities & Equity ($ in millions) Cash and Securities $ 18.3 Current Liabilities $ 344.5 * Other Current Assets 22.8 Long-Term Debt 654.4 Total Current Assets 41.1 Other Liabilities 0.6 Fixed Assets 692.7 Total Liabilities 999.5 Other Assets 6.7 Stockholders’ Equity (259.0) Total Assets $ 740.5 Total Liabilities & Equity $ 740.5 * Includes $211.1 million of debt, net of deferred loan costs, associated with 18 communities to be transferred to the lender which will eliminate such debt. Also includes $31.5 million of debt associated with a bridge loan due to non-compliance with a financial covenant at 9/30/20, which the Company intends to cure, due to the impact of COVID-19 on one of the communities included in such bridge loan. 27


1 Capital Structure, Debt Maturities and Liquidity (as of Sept 30, 2020) • As of September 30, 2020, the Company had approximately $18.3 million of cash or cash equivalents • The Company has received approximately $0.7M in state COVID-19 relief grants through September 30, 2020 • The Company expects to receive approximately $11 million in additional federal and state COVID-19 relief grants 2 in the fourth quarter of 2020. Debt Maturity Schedule • 86% of the Company’s debt is fixed rate non-recourse $297,579 mortgage debt at a weighted average rate of 4.5% • 14% of the Company’s debt is at variable rates with a $155,772 weighted average rate of 3.6% $118,877 • The Company expects to $81,546 extend, refinance or retire all $37,665 or part of the 2021 and 2022 $10,637 $- maturities. 2020 Dec 2021 Apr 2022 2023 2024 2025 2026 & After (1) Excludes $217.7 million of debt associated with 18 communities in process of transfer to Fannie Mae. (2) There can be no assurance that we will qualify for, or receive, grants in the amount we expect. 281 Capital Structure, Debt Maturities and Liquidity (as of Sept 30, 2020) • As of September 30, 2020, the Company had approximately $18.3 million of cash or cash equivalents • The Company has received approximately $0.7M in state COVID-19 relief grants through September 30, 2020 • The Company expects to receive approximately $11 million in additional federal and state COVID-19 relief grants 2 in the fourth quarter of 2020. Debt Maturity Schedule • 86% of the Company’s debt is fixed rate non-recourse $297,579 mortgage debt at a weighted average rate of 4.5% • 14% of the Company’s debt is at variable rates with a $155,772 weighted average rate of 3.6% $118,877 • The Company expects to $81,546 extend, refinance or retire all $37,665 or part of the 2021 and 2022 $10,637 $- maturities. 2020 Dec 2021 Apr 2022 2023 2024 2025 2026 & After (1) Excludes $217.7 million of debt associated with 18 communities in process of transfer to Fannie Mae. (2) There can be no assurance that we will qualify for, or receive, grants in the amount we expect. 28