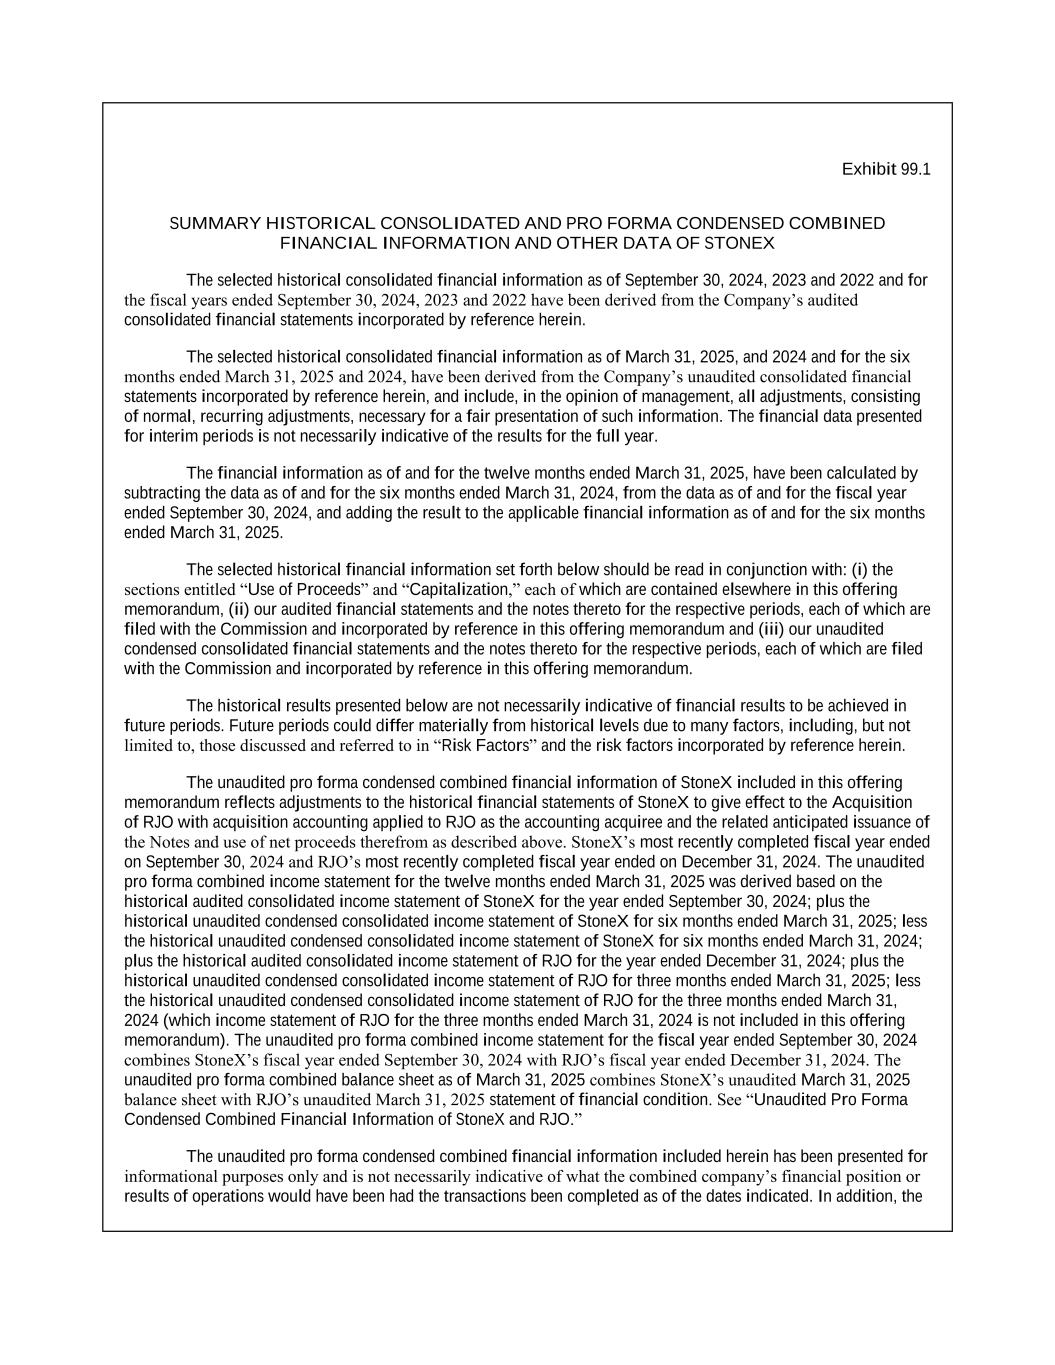
Exhibit 99.1 SUMMARY HISTORICAL CONSOLIDATED AND PRO FORMA CONDENSED COMBINED FINANCIAL INFORMATION AND OTHER DATA OF STONEX The selected historical consolidated financial information as of September 30, 2024, 2023 and 2022 and for the fiscal years ended September 30, 2024, 2023 and 2022 have been derived from the Company’s audited consolidated financial statements incorporated by reference herein. The selected historical consolidated financial information as of March 31, 2025, and 2024 and for the six months ended March 31, 2025 and 2024, have been derived from the Company’s unaudited consolidated financial statements incorporated by reference herein, and include, in the opinion of management, all adjustments, consisting of normal, recurring adjustments, necessary for a fair presentation of such information. The financial data presented for interim periods is not necessarily indicative of the results for the full year. The financial information as of and for the twelve months ended March 31, 2025, have been calculated by subtracting the data as of and for the six months ended March 31, 2024, from the data as of and for the fiscal year ended September 30, 2024, and adding the result to the applicable financial information as of and for the six months ended March 31, 2025. The selected historical financial information set forth below should be read in conjunction with: (i) the sections entitled “Use of Proceeds” and “Capitalization,” each of which are contained elsewhere in this offering memorandum, (ii) our audited financial statements and the notes thereto for the respective periods, each of which are filed with the Commission and incorporated by reference in this offering memorandum and (iii) our unaudited condensed consolidated financial statements and the notes thereto for the respective periods, each of which are filed with the Commission and incorporated by reference in this offering memorandum. The historical results presented below are not necessarily indicative of financial results to be achieved in future periods. Future periods could differ materially from historical levels due to many factors, including, but not limited to, those discussed and referred to in “Risk Factors” and the risk factors incorporated by reference herein. The unaudited pro forma condensed combined financial information of StoneX included in this offering memorandum reflects adjustments to the historical financial statements of StoneX to give effect to the Acquisition of RJO with acquisition accounting applied to RJO as the accounting acquiree and the related anticipated issuance of the Notes and use of net proceeds therefrom as described above. StoneX’s most recently completed fiscal year ended on September 30, 2024 and RJO’s most recently completed fiscal year ended on December 31, 2024. The unaudited pro forma combined income statement for the twelve months ended March 31, 2025 was derived based on the historical audited consolidated income statement of StoneX for the year ended September 30, 2024; plus the historical unaudited condensed consolidated income statement of StoneX for six months ended March 31, 2025; less the historical unaudited condensed consolidated income statement of StoneX for six months ended March 31, 2024; plus the historical audited consolidated income statement of RJO for the year ended December 31, 2024; plus the historical unaudited condensed consolidated income statement of RJO for three months ended March 31, 2025; less the historical unaudited condensed consolidated income statement of RJO for the three months ended March 31, 2024 (which income statement of RJO for the three months ended March 31, 2024 is not included in this offering memorandum). The unaudited pro forma combined income statement for the fiscal year ended September 30, 2024 combines StoneX’s fiscal year ended September 30, 2024 with RJO’s fiscal year ended December 31, 2024. The unaudited pro forma combined balance sheet as of March 31, 2025 combines StoneX’s unaudited March 31, 2025 balance sheet with RJO’s unaudited March 31, 2025 statement of financial condition. See “Unaudited Pro Forma Condensed Combined Financial Information of StoneX and RJO.” The unaudited pro forma condensed combined financial information included herein has been presented for informational purposes only and is not necessarily indicative of what the combined company’s financial position or results of operations would have been had the transactions been completed as of the dates indicated. In addition, the
unaudited pro forma condensed combined financial information does not purport to project the future financial position or operating results of the combined company. The unaudited pro forma condensed combined financial information contains estimated adjustments, based upon available information and certain assumptions that the Company believes are reasonable under the circumstances. The assumptions underlying the pro forma adjustments are described in greater detail in the accompanying notes to the unaudited pro forma condensed combined financial information. In many cases, these assumptions are based upon preliminary information and estimates. Differences between these preliminary estimates and the final acquisition accounting will occur, and these differences could have a material impact on the accompanying unaudited pro forma condensed combined financial information and the combined company’s future results of operations and financial position. The unaudited pro forma combined financial information should be read in conjunction with the consolidated financial statements and notes thereto included and incorporated by reference in this offering memorandum, in addition to the sections “Summary—The Transactions” and “Capitalization.”
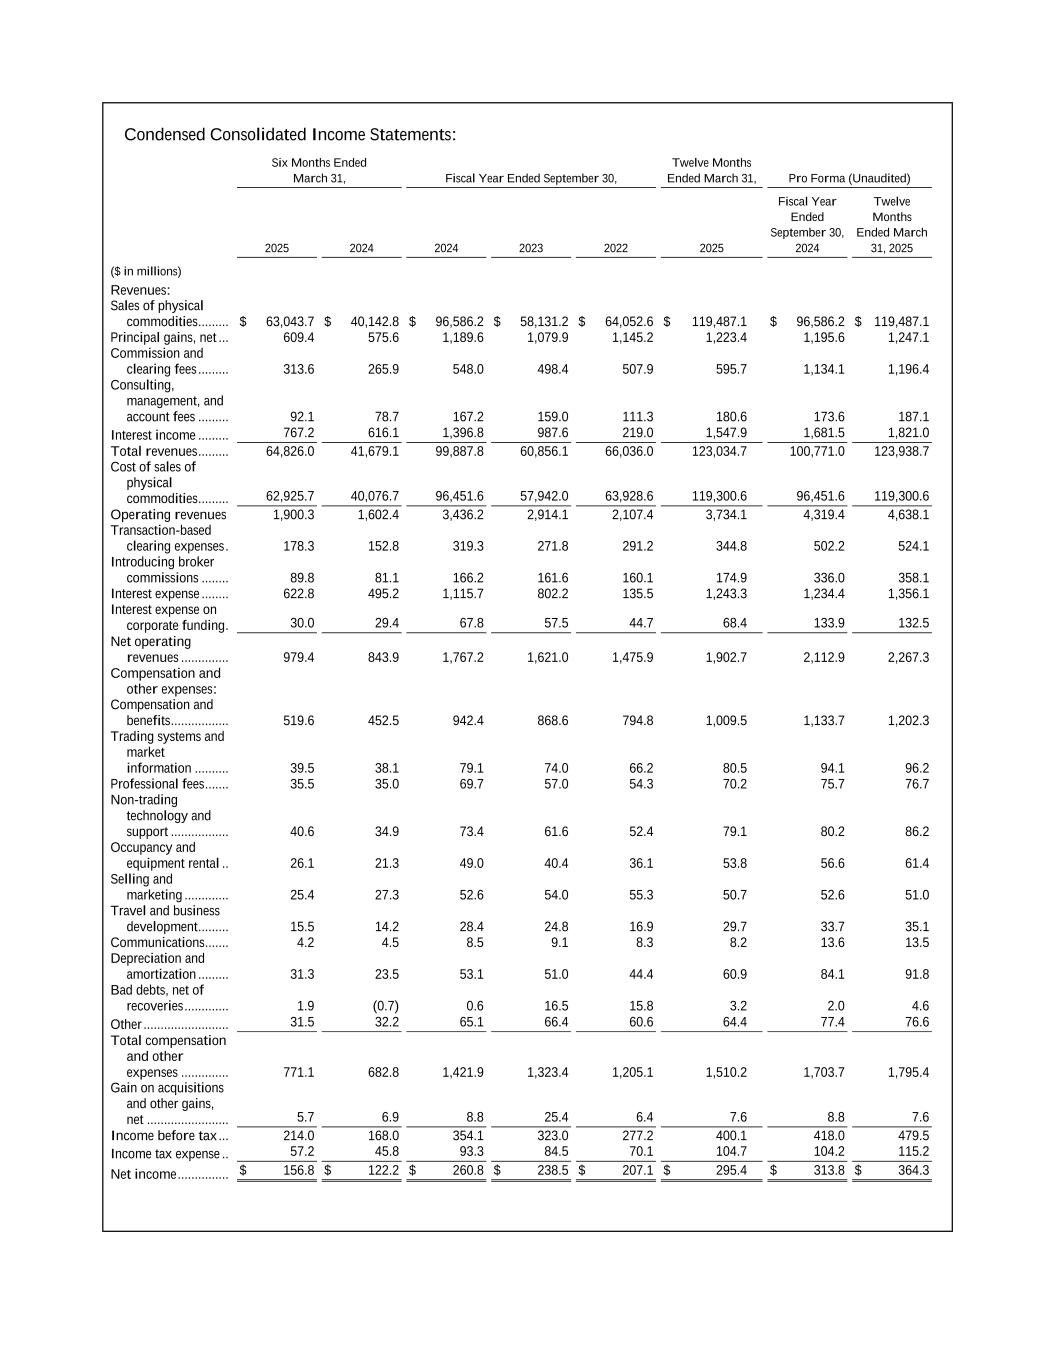
Condensed Consolidated Income Statements: Six Months Ended March 31, Fiscal Year Ended September 30, Twelve Months Ended March 31, Pro Forma (Unaudited) 2025 2024 2024 2023 2022 2025 Fiscal Year Ended September 30, 2024 Twelve Months Ended March 31, 2025 ($ in millions) Revenues: Sales of physical commodities ......... $ 63,043.7 $ 40,142.8 $ 96,586.2 $ 58,131.2 $ 64,052.6 $ 119,487.1 $ 96,586.2 $ 119,487.1 Principal gains, net ... 609.4 575.6 1,189.6 1,079.9 1,145.2 1,223.4 1,195.6 1,247.1 Commission and clearing fees ......... 313.6 265.9 548.0 498.4 507.9 595.7 1,134.1 1,196.4 Consulting, management, and account fees ......... 92.1 78.7 167.2 159.0 111.3 180.6 173.6 187.1 Interest income ......... 767.2 616.1 1,396.8 987.6 219.0 1,547.9 1,681.5 1,821.0 Total revenues ......... 64,826.0 41,679.1 99,887.8 60,856.1 66,036.0 123,034.7 100,771.0 123,938.7 Cost of sales of physical commodities ......... 62,925.7 40,076.7 96,451.6 57,942.0 63,928.6 119,300.6 96,451.6 119,300.6 Operating revenues 1,900.3 1,602.4 3,436.2 2,914.1 2,107.4 3,734.1 4,319.4 4,638.1 Transaction-based clearing expenses . 178.3 152.8 319.3 271.8 291.2 344.8 502.2 524.1 Introducing broker commissions ........ 89.8 81.1 166.2 161.6 160.1 174.9 336.0 358.1 Interest expense ........ 622.8 495.2 1,115.7 802.2 135.5 1,243.3 1,234.4 1,356.1 Interest expense on corporate funding . 30.0 29.4 67.8 57.5 44.7 68.4 133.9 132.5 Net operating revenues .............. 979.4 843.9 1,767.2 1,621.0 1,475.9 1,902.7 2,112.9 2,267.3 Compensation and other expenses: Compensation and benefits ................. 519.6 452.5 942.4 868.6 794.8 1,009.5 1,133.7 1,202.3 Trading systems and market information .......... 39.5 38.1 79.1 74.0 66.2 80.5 94.1 96.2 Professional fees ....... 35.5 35.0 69.7 57.0 54.3 70.2 75.7 76.7 Non-trading technology and support ................. 40.6 34.9 73.4 61.6 52.4 79.1 80.2 86.2 Occupancy and equipment rental .. 26.1 21.3 49.0 40.4 36.1 53.8 56.6 61.4 Selling and marketing ............. 25.4 27.3 52.6 54.0 55.3 50.7 52.6 51.0 Travel and business development ......... 15.5 14.2 28.4 24.8 16.9 29.7 33.7 35.1 Communications ....... 4.2 4.5 8.5 9.1 8.3 8.2 13.6 13.5 Depreciation and amortization ......... 31.3 23.5 53.1 51.0 44.4 60.9 84.1 91.8 Bad debts, net of recoveries ............. 1.9 (0.7) 0.6 16.5 15.8 3.2 2.0 4.6 Other ......................... 31.5 32.2 65.1 66.4 60.6 64.4 77.4 76.6 Total compensation and other expenses .............. 771.1 682.8 1,421.9 1,323.4 1,205.1 1,510.2 1,703.7 1,795.4 Gain on acquisitions and other gains, net ........................ 5.7 6.9 8.8 25.4 6.4 7.6 8.8 7.6 Income before tax ... 214.0 168.0 354.1 323.0 277.2 400.1 418.0 479.5 Income tax expense .. 57.2 45.8 93.3 84.5 70.1 104.7 104.2 115.2 Net income ............... $ 156.8 $ 122.2 $ 260.8 $ 238.5 $ 207.1 $ 295.4 $ 313.8 $ 364.3
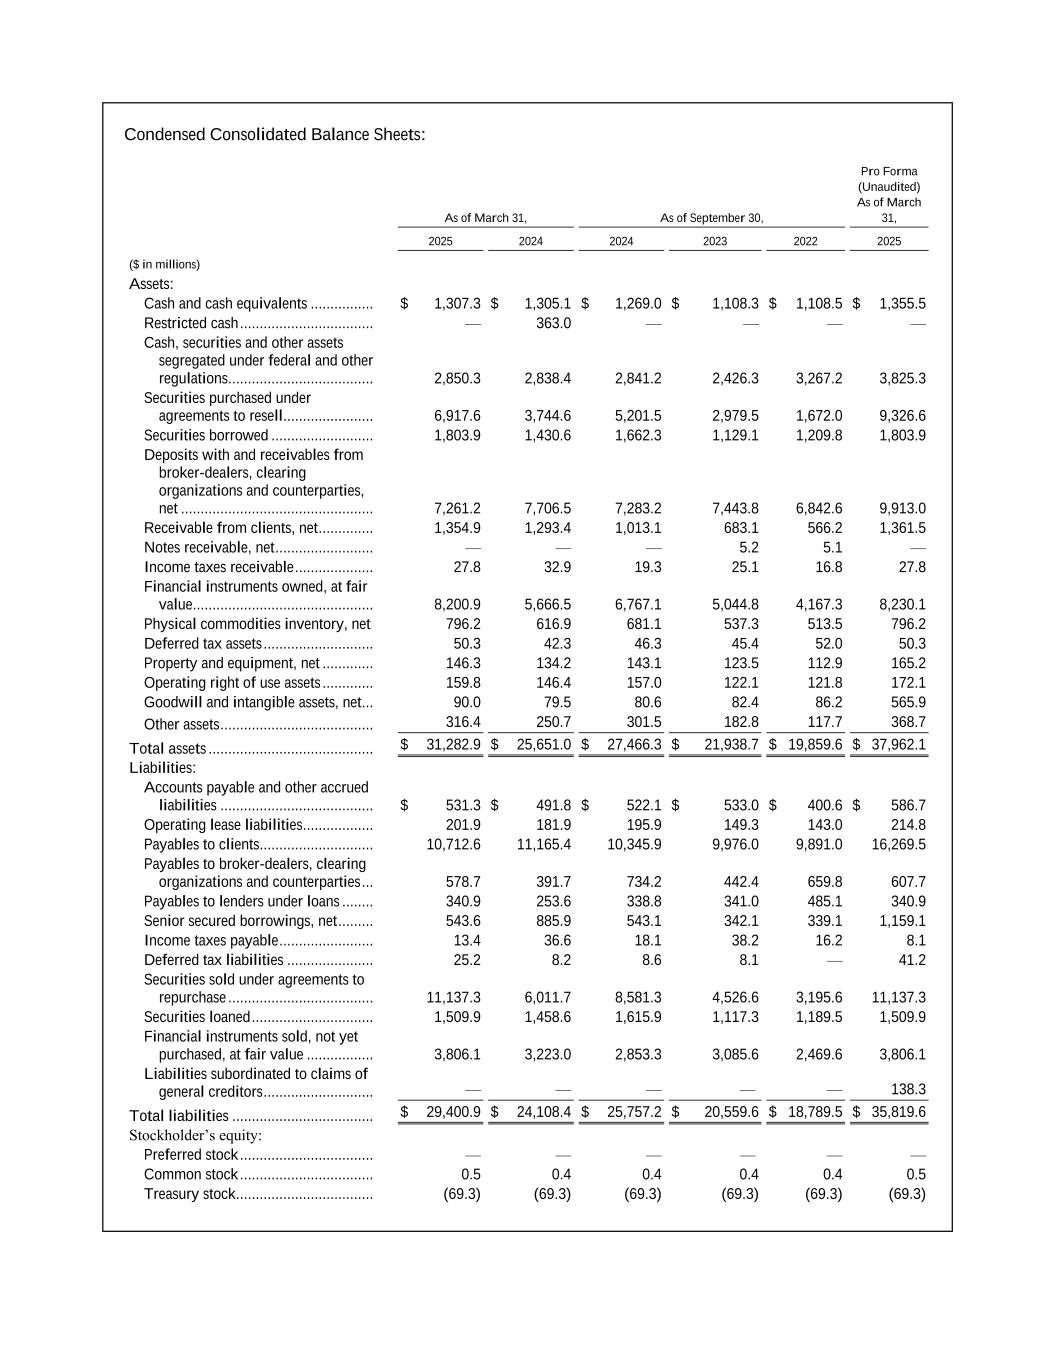
Condensed Consolidated Balance Sheets: As of March 31, As of September 30, Pro Forma (Unaudited) As of March 31, 2025 2024 2024 2023 2022 2025 ($ in millions) Assets: Cash and cash equivalents ................ $ 1,307.3 $ 1,305.1 $ 1,269.0 $ 1,108.3 $ 1,108.5 $ 1,355.5 Restricted cash .................................. — 363.0 — — — — Cash, securities and other assets segregated under federal and other regulations ..................................... 2,850.3 2,838.4 2,841.2 2,426.3 3,267.2 3,825.3 Securities purchased under agreements to resell ....................... 6,917.6 3,744.6 5,201.5 2,979.5 1,672.0 9,326.6 Securities borrowed .......................... 1,803.9 1,430.6 1,662.3 1,129.1 1,209.8 1,803.9 Deposits with and receivables from broker-dealers, clearing organizations and counterparties, net ................................................. 7,261.2 7,706.5 7,283.2 7,443.8 6,842.6 9,913.0 Receivable from clients, net .............. 1,354.9 1,293.4 1,013.1 683.1 566.2 1,361.5 Notes receivable, net ......................... — — — 5.2 5.1 — Income taxes receivable .................... 27.8 32.9 19.3 25.1 16.8 27.8 Financial instruments owned, at fair value .............................................. 8,200.9 5,666.5 6,767.1 5,044.8 4,167.3 8,230.1 Physical commodities inventory, net 796.2 616.9 681.1 537.3 513.5 796.2 Deferred tax assets ............................ 50.3 42.3 46.3 45.4 52.0 50.3 Property and equipment, net ............. 146.3 134.2 143.1 123.5 112.9 165.2 Operating right of use assets ............. 159.8 146.4 157.0 122.1 121.8 172.1 Goodwill and intangible assets, net... 90.0 79.5 80.6 82.4 86.2 565.9 Other assets ....................................... 316.4 250.7 301.5 182.8 117.7 368.7 Total assets .......................................... $ 31,282.9 $ 25,651.0 $ 27,466.3 $ 21,938.7 $ 19,859.6 $ 37,962.1 Liabilities: Accounts payable and other accrued liabilities ....................................... $ 531.3 $ 491.8 $ 522.1 $ 533.0 $ 400.6 $ 586.7 Operating lease liabilities .................. 201.9 181.9 195.9 149.3 143.0 214.8 Payables to clients............................. 10,712.6 11,165.4 10,345.9 9,976.0 9,891.0 16,269.5 Payables to broker-dealers, clearing organizations and counterparties ... 578.7 391.7 734.2 442.4 659.8 607.7 Payables to lenders under loans ........ 340.9 253.6 338.8 341.0 485.1 340.9 Senior secured borrowings, net ......... 543.6 885.9 543.1 342.1 339.1 1,159.1 Income taxes payable ........................ 13.4 36.6 18.1 38.2 16.2 8.1 Deferred tax liabilities ...................... 25.2 8.2 8.6 8.1 — 41.2 Securities sold under agreements to repurchase ..................................... 11,137.3 6,011.7 8,581.3 4,526.6 3,195.6 11,137.3 Securities loaned ............................... 1,509.9 1,458.6 1,615.9 1,117.3 1,189.5 1,509.9 Financial instruments sold, not yet purchased, at fair value ................. 3,806.1 3,223.0 2,853.3 3,085.6 2,469.6 3,806.1 Liabilities subordinated to claims of general creditors ............................ — — — — — 138.3 Total liabilities .................................... $ 29,400.9 $ 24,108.4 $ 25,757.2 $ 20,559.6 $ 18,789.5 $ 35,819.6 Stockholder’s equity: Preferred stock .................................. — — — — — — Common stock .................................. 0.5 0.4 0.4 0.4 0.4 0.5 Treasury stock ................................... (69.3) (69.3) (69.3) (69.3) (69.3) (69.3)
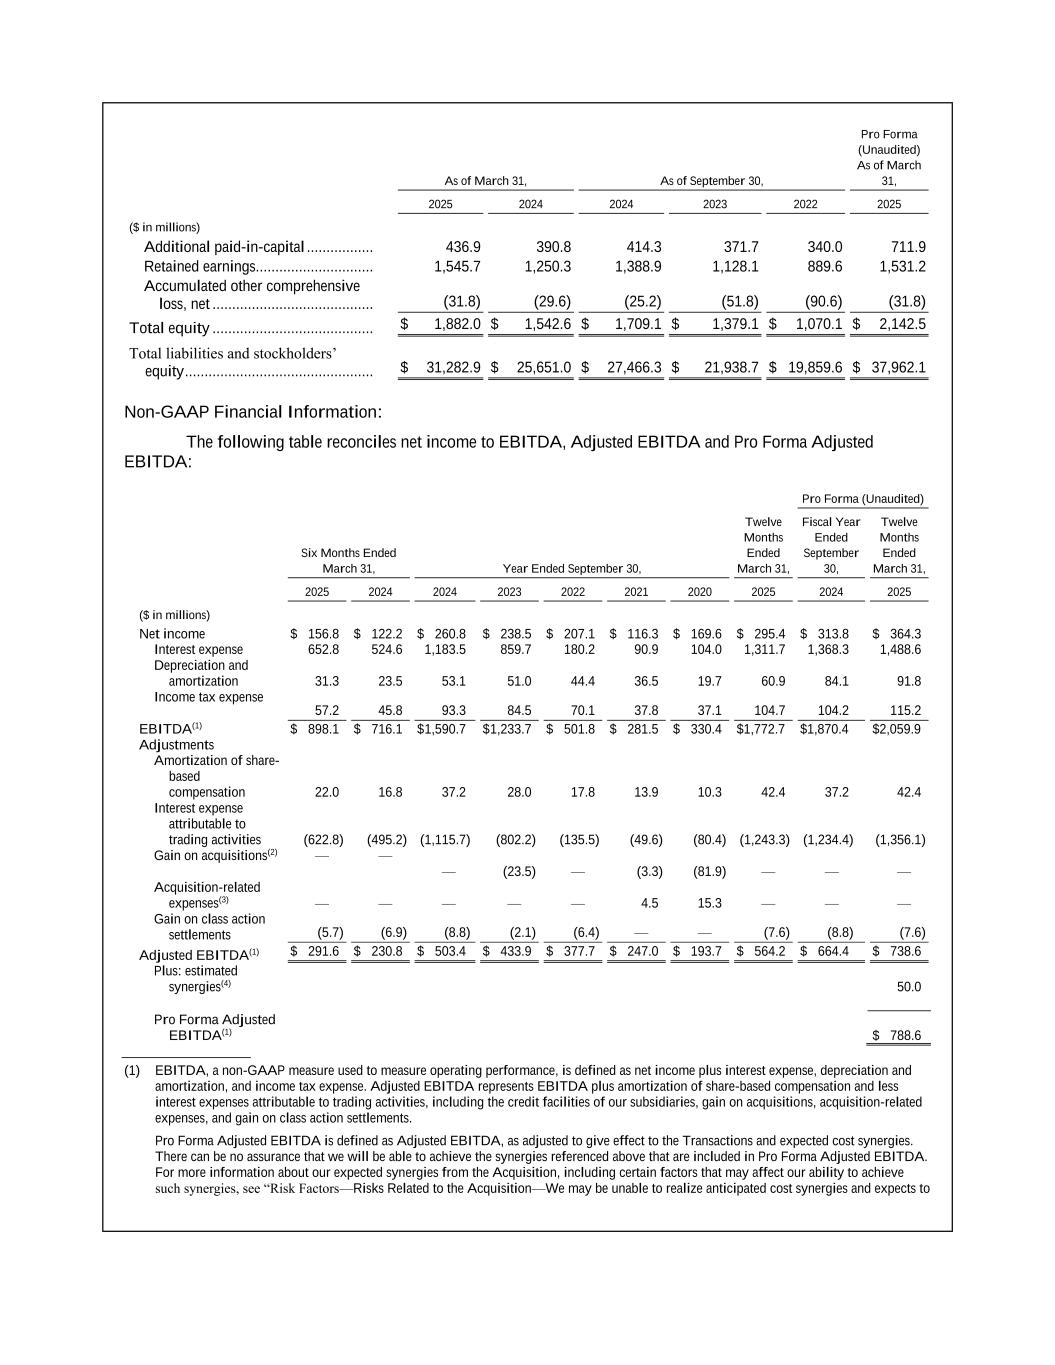
As of March 31, As of September 30, Pro Forma (Unaudited) As of March 31, 2025 2024 2024 2023 2022 2025 ($ in millions) Additional paid-in-capital ................. 436.9 390.8 414.3 371.7 340.0 711.9 Retained earnings.............................. 1,545.7 1,250.3 1,388.9 1,128.1 889.6 1,531.2 Accumulated other comprehensive loss, net ......................................... (31.8) (29.6) (25.2) (51.8) (90.6) (31.8) Total equity ......................................... $ 1,882.0 $ 1,542.6 $ 1,709.1 $ 1,379.1 $ 1,070.1 $ 2,142.5 Total liabilities and stockholders’ equity ................................................ $ 31,282.9 $ 25,651.0 $ 27,466.3 $ 21,938.7 $ 19,859.6 $ 37,962.1 Non-GAAP Financial Information: The following table reconciles net income to EBITDA, Adjusted EBITDA and Pro Forma Adjusted EBITDA: Pro Forma (Unaudited) Six Months Ended March 31, Year Ended September 30, Twelve Months Ended March 31, Fiscal Year Ended September 30, Twelve Months Ended March 31, 2025 2024 2024 2023 2022 2021 2020 2025 2024 2025 ($ in millions) Net income $ 156.8 $ 122.2 $ 260.8 $ 238.5 $ 207.1 $ 116.3 $ 169.6 $ 295.4 $ 313.8 $ 364.3 Interest expense 652.8 524.6 1,183.5 859.7 180.2 90.9 104.0 1,311.7 1,368.3 1,488.6 Depreciation and amortization 31.3 23.5 53.1 51.0 44.4 36.5 19.7 60.9 84.1 91.8 Income tax expense 57.2 45.8 93.3 84.5 70.1 37.8 37.1 104.7 104.2 115.2 EBITDA(1) $ 898.1 $ 716.1 $ 1,590.7 $ 1,233.7 $ 501.8 $ 281.5 $ 330.4 $1,772.7 $1,870.4 $2,059.9 Adjustments Amortization of share- based compensation 22.0 16.8 37.2 28.0 17.8 13.9 10.3 42.4 37.2 42.4 Interest expense attributable to trading activities (622.8) (495.2) (1,115.7) (802.2) (135.5) (49.6) (80.4) (1,243.3) (1,234.4) (1,356.1) Gain on acquisitions(2) — — — (23.5) — (3.3) (81.9) — — — Acquisition-related expenses(3) — — — — — 4.5 15.3 — — — Gain on class action settlements (5.7) (6.9) (8.8) (2.1) (6.4) — — (7.6) (8.8) (7.6) Adjusted EBITDA(1) $ 291.6 $ 230.8 $ 503.4 $ 433.9 $ 377.7 $ 247.0 $ 193.7 $ 564.2 $ 664.4 $ 738.6 Plus: estimated synergies(4) 50.0 Pro Forma Adjusted EBITDA(1) $ 788.6 (1) EBITDA, a non-GAAP measure used to measure operating performance, is defined as net income plus interest expense, depreciation and amortization, and income tax expense. Adjusted EBITDA represents EBITDA plus amortization of share-based compensation and less interest expenses attributable to trading activities, including the credit facilities of our subsidiaries, gain on acquisitions, acquisition-related expenses, and gain on class action settlements. Pro Forma Adjusted EBITDA is defined as Adjusted EBITDA, as adjusted to give effect to the Transactions and expected cost synergies. There can be no assurance that we will be able to achieve the synergies referenced above that are included in Pro Forma Adjusted EBITDA. For more information about our expected synergies from the Acquisition, including certain factors that may affect our ability to achieve such synergies, see “Risk Factors—Risks Related to the Acquisition—We may be unable to realize anticipated cost synergies and expects to
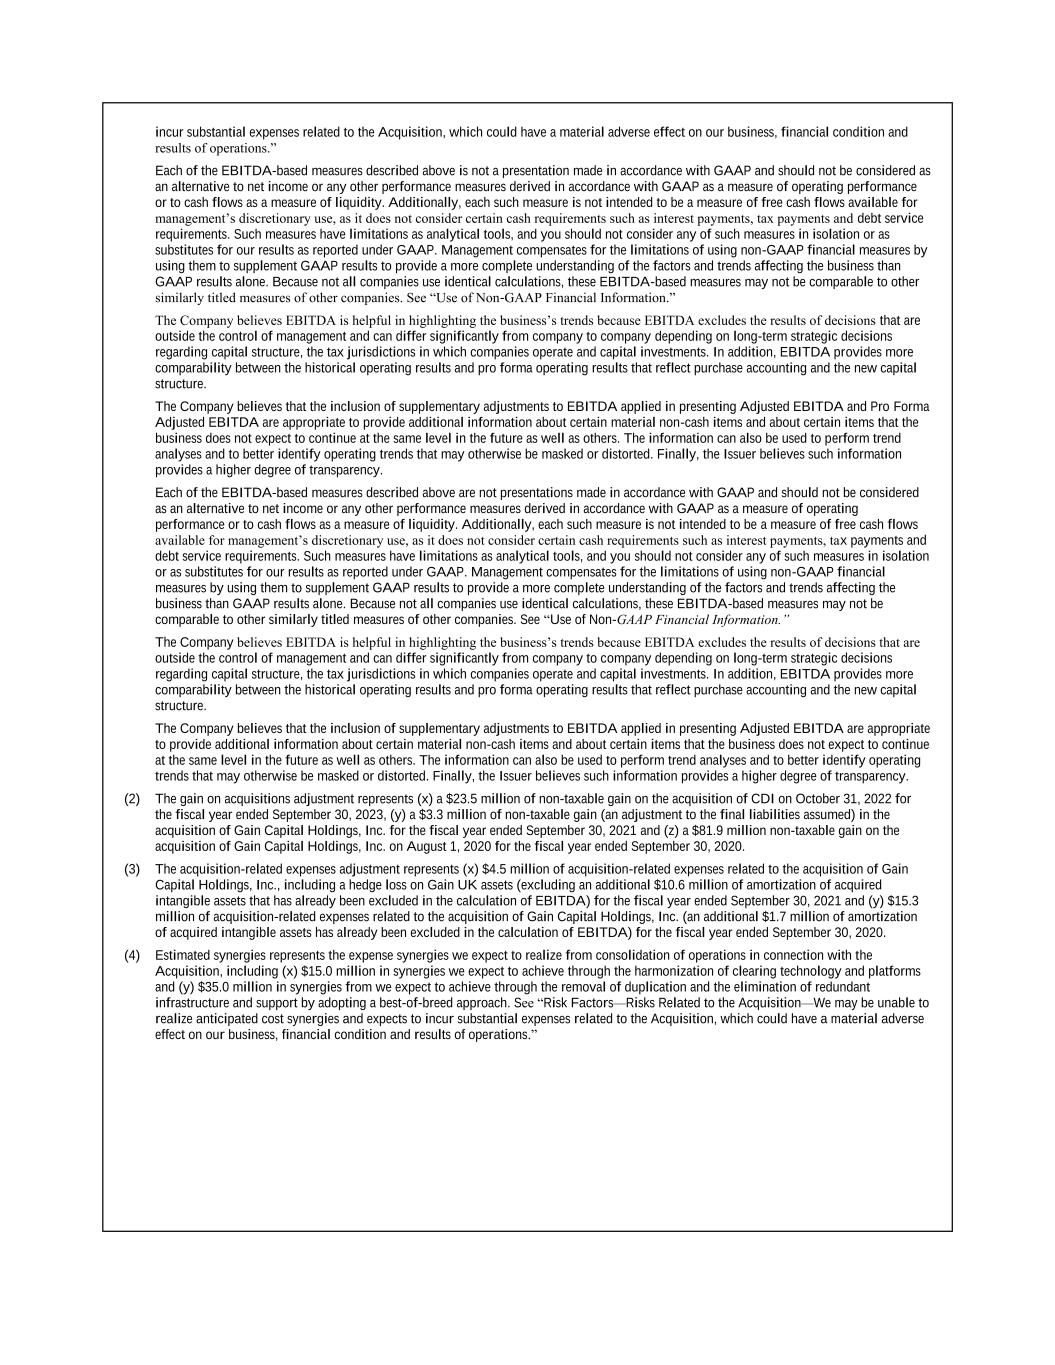
incur substantial expenses related to the Acquisition, which could have a material adverse effect on our business, financial condition and results of operations.” Each of the EBITDA-based measures described above is not a presentation made in accordance with GAAP and should not be considered as an alternative to net income or any other performance measures derived in accordance with GAAP as a measure of operating performance or to cash flows as a measure of liquidity. Additionally, each such measure is not intended to be a measure of free cash flows available for management’s discretionary use, as it does not consider certain cash requirements such as interest payments, tax payments and debt service requirements. Such measures have limitations as analytical tools, and you should not consider any of such measures in isolation or as substitutes for our results as reported under GAAP. Management compensates for the limitations of using non-GAAP financial measures by using them to supplement GAAP results to provide a more complete understanding of the factors and trends affecting the business than GAAP results alone. Because not all companies use identical calculations, these EBITDA-based measures may not be comparable to other similarly titled measures of other companies. See “Use of Non-GAAP Financial Information.” The Company believes EBITDA is helpful in highlighting the business’s trends because EBITDA excludes the results of decisions that are outside the control of management and can differ significantly from company to company depending on long-term strategic decisions regarding capital structure, the tax jurisdictions in which companies operate and capital investments. In addition, EBITDA provides more comparability between the historical operating results and pro forma operating results that reflect purchase accounting and the new capital structure. The Company believes that the inclusion of supplementary adjustments to EBITDA applied in presenting Adjusted EBITDA and Pro Forma Adjusted EBITDA are appropriate to provide additional information about certain material non-cash items and about certain items that the business does not expect to continue at the same level in the future as well as others. The information can also be used to perform trend analyses and to better identify operating trends that may otherwise be masked or distorted. Finally, the Issuer believes such information provides a higher degree of transparency. Each of the EBITDA-based measures described above are not presentations made in accordance with GAAP and should not be considered as an alternative to net income or any other performance measures derived in accordance with GAAP as a measure of operating performance or to cash flows as a measure of liquidity. Additionally, each such measure is not intended to be a measure of free cash flows available for management’s discretionary use, as it does not consider certain cash requirements such as interest payments, tax payments and debt service requirements. Such measures have limitations as analytical tools, and you should not consider any of such measures in isolation or as substitutes for our results as reported under GAAP. Management compensates for the limitations of using non-GAAP financial measures by using them to supplement GAAP results to provide a more complete understanding of the factors and trends affecting the business than GAAP results alone. Because not all companies use identical calculations, these EBITDA-based measures may not be comparable to other similarly titled measures of other companies. See “Use of Non-GAAP Financial Information.” The Company believes EBITDA is helpful in highlighting the business’s trends because EBITDA excludes the results of decisions that are outside the control of management and can differ significantly from company to company depending on long-term strategic decisions regarding capital structure, the tax jurisdictions in which companies operate and capital investments. In addition, EBITDA provides more comparability between the historical operating results and pro forma operating results that reflect purchase accounting and the new capital structure. The Company believes that the inclusion of supplementary adjustments to EBITDA applied in presenting Adjusted EBITDA are appropriate to provide additional information about certain material non-cash items and about certain items that the business does not expect to continue at the same level in the future as well as others. The information can also be used to perform trend analyses and to better identify operating trends that may otherwise be masked or distorted. Finally, the Issuer believes such information provides a higher degree of transparency. (2) The gain on acquisitions adjustment represents (x) a $23.5 million of non-taxable gain on the acquisition of CDI on October 31, 2022 for the fiscal year ended September 30, 2023, (y) a $3.3 million of non-taxable gain (an adjustment to the final liabilities assumed) in the acquisition of Gain Capital Holdings, Inc. for the fiscal year ended September 30, 2021 and (z) a $81.9 million non-taxable gain on the acquisition of Gain Capital Holdings, Inc. on August 1, 2020 for the fiscal year ended September 30, 2020. (3) The acquisition-related expenses adjustment represents (x) $4.5 million of acquisition-related expenses related to the acquisition of Gain Capital Holdings, Inc., including a hedge loss on Gain UK assets (excluding an additional $10.6 million of amortization of acquired intangible assets that has already been excluded in the calculation of EBITDA) for the fiscal year ended September 30, 2021 and (y) $15.3 million of acquisition-related expenses related to the acquisition of Gain Capital Holdings, Inc. (an additional $1.7 million of amortization of acquired intangible assets has already been excluded in the calculation of EBITDA) for the fiscal year ended September 30, 2020. (4) Estimated synergies represents the expense synergies we expect to realize from consolidation of operations in connection with the Acquisition, including (x) $15.0 million in synergies we expect to achieve through the harmonization of clearing technology and platforms and (y) $35.0 million in synergies from we expect to achieve through the removal of duplication and the elimination of redundant infrastructure and support by adopting a best-of-breed approach. See “Risk Factors—Risks Related to the Acquisition—We may be unable to realize anticipated cost synergies and expects to incur substantial expenses related to the Acquisition, which could have a material adverse effect on our business, financial condition and results of operations.”
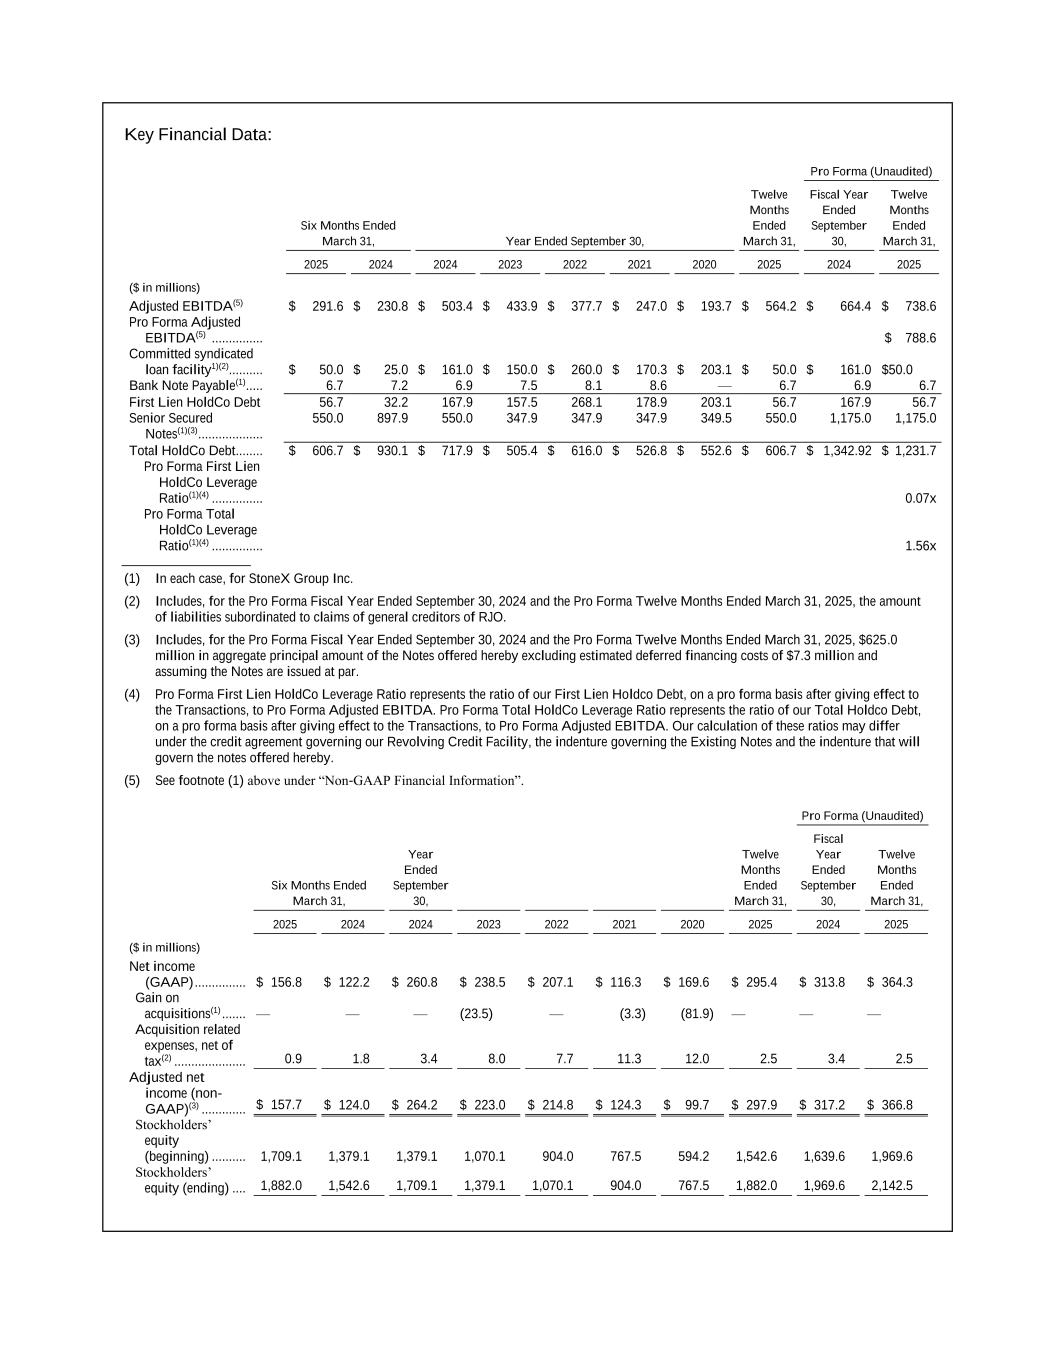
Key Financial Data: Pro Forma (Unaudited) Six Months Ended March 31, Year Ended September 30, Twelve Months Ended March 31, Fiscal Year Ended September 30, Twelve Months Ended March 31, 2025 2024 2024 2023 2022 2021 2020 2025 2024 2025 ($ in millions) Adjusted EBITDA(5) $ 291.6 $ 230.8 $ 503.4 $ 433.9 $ 377.7 $ 247.0 $ 193.7 $ 564.2 $ 664.4 $ 738.6 Pro Forma Adjusted EBITDA(5) ............... $ 788.6 Committed syndicated loan facility1)(2).......... $ 50.0 $ 25.0 $ 161.0 $ 150.0 $ 260.0 $ 170.3 $ 203.1 $ 50.0 $ 161.0 $50.0 Bank Note Payable(1) ..... 6.7 7.2 6.9 7.5 8.1 8.6 — 6.7 6.9 6.7 First Lien HoldCo Debt 56.7 32.2 167.9 157.5 268.1 178.9 203.1 56.7 167.9 56.7 Senior Secured Notes(1)(3) ................... 550.0 897.9 550.0 347.9 347.9 347.9 349.5 550.0 1,175.0 1,175.0 Total HoldCo Debt........ $ 606.7 $ 930.1 $ 717.9 $ 505.4 $ 616.0 $ 526.8 $ 552.6 $ 606.7 $ 1,342.92 $ 1,231.7 Pro Forma First Lien HoldCo Leverage Ratio(1)(4) ............... 0.07x Pro Forma Total HoldCo Leverage Ratio(1)(4) ............... 1.56x (1) In each case, for StoneX Group Inc. (2) Includes, for the Pro Forma Fiscal Year Ended September 30, 2024 and the Pro Forma Twelve Months Ended March 31, 2025, the amount of liabilities subordinated to claims of general creditors of RJO. (3) Includes, for the Pro Forma Fiscal Year Ended September 30, 2024 and the Pro Forma Twelve Months Ended March 31, 2025, $625.0 million in aggregate principal amount of the Notes offered hereby excluding estimated deferred financing costs of $7.3 million and assuming the Notes are issued at par. (4) Pro Forma First Lien HoldCo Leverage Ratio represents the ratio of our First Lien Holdco Debt, on a pro forma basis after giving effect to the Transactions, to Pro Forma Adjusted EBITDA. Pro Forma Total HoldCo Leverage Ratio represents the ratio of our Total Holdco Debt, on a pro forma basis after giving effect to the Transactions, to Pro Forma Adjusted EBITDA. Our calculation of these ratios may differ under the credit agreement governing our Revolving Credit Facility, the indenture governing the Existing Notes and the indenture that will govern the notes offered hereby. (5) See footnote (1) above under “Non-GAAP Financial Information”. Pro Forma (Unaudited) Six Months Ended March 31, Year Ended September 30, Twelve Months Ended March 31, Fiscal Year Ended September 30, Twelve Months Ended March 31, 2025 2024 2024 2023 2022 2021 2020 2025 2024 2025 ($ in millions) Net income (GAAP) ............... $ 156.8 $ 122.2 $ 260.8 $ 238.5 $ 207.1 $ 116.3 $ 169.6 $ 295.4 $ 313.8 $ 364.3 Gain on acquisitions(1) ....... — — — (23.5) — (3.3) (81.9) — — — Acquisition related expenses, net of tax(2) ..................... 0.9 1.8 3.4 8.0 7.7 11.3 12.0 2.5 3.4 2.5 Adjusted net income (non- GAAP)(3) ............. $ 157.7 $ 124.0 $ 264.2 $ 223.0 $ 214.8 $ 124.3 $ 99.7 $ 297.9 $ 317.2 $ 366.8 Stockholders’ equity (beginning) .......... 1,709.1 1,379.1 1,379.1 1,070.1 904.0 767.5 594.2 1,542.6 1,639.6 1,969.6 Stockholders’ equity (ending) .... 1,882.0 1,542.6 1,709.1 1,379.1 1,070.1 904.0 767.5 1,882.0 1,969.6 2,142.5
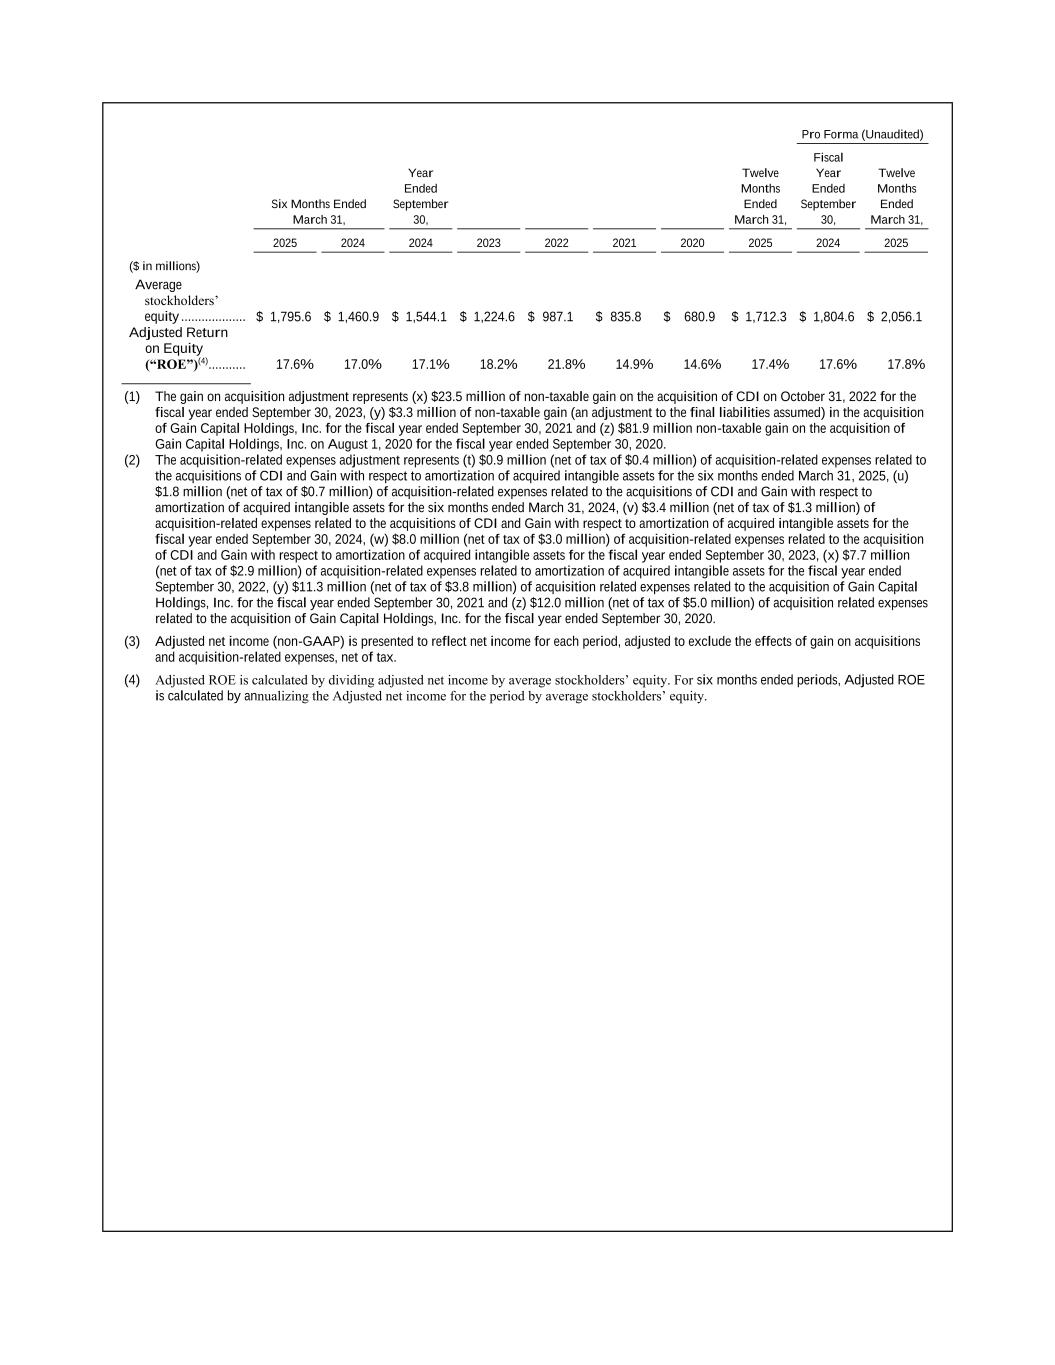
Pro Forma (Unaudited) Six Months Ended March 31, Year Ended September 30, Twelve Months Ended March 31, Fiscal Year Ended September 30, Twelve Months Ended March 31, 2025 2024 2024 2023 2022 2021 2020 2025 2024 2025 ($ in millions) Average stockholders’ equity ................... $ 1,795.6 $ 1,460.9 $ 1,544.1 $ 1,224.6 $ 987.1 $ 835.8 $ 680.9 $ 1,712.3 $ 1,804.6 $ 2,056.1 Adjusted Return on Equity (“ROE”)(4) ........... 17.6% 17.0% 17.1% 18.2% 21.8% 14.9% 14.6% 17.4% 17.6% 17.8% (1) The gain on acquisition adjustment represents (x) $23.5 million of non-taxable gain on the acquisition of CDI on October 31, 2022 for the fiscal year ended September 30, 2023, (y) $3.3 million of non-taxable gain (an adjustment to the final liabilities assumed) in the acquisition of Gain Capital Holdings, Inc. for the fiscal year ended September 30, 2021 and (z) $81.9 million non-taxable gain on the acquisition of Gain Capital Holdings, Inc. on August 1, 2020 for the fiscal year ended September 30, 2020. (2) The acquisition-related expenses adjustment represents (t) $0.9 million (net of tax of $0.4 million) of acquisition-related expenses related to the acquisitions of CDI and Gain with respect to amortization of acquired intangible assets for the six months ended March 31, 2025, (u) $1.8 million (net of tax of $0.7 million) of acquisition-related expenses related to the acquisitions of CDI and Gain with respect to amortization of acquired intangible assets for the six months ended March 31, 2024, (v) $3.4 million (net of tax of $1.3 million) of acquisition-related expenses related to the acquisitions of CDI and Gain with respect to amortization of acquired intangible assets for the fiscal year ended September 30, 2024, (w) $8.0 million (net of tax of $3.0 million) of acquisition-related expenses related to the acquisition of CDI and Gain with respect to amortization of acquired intangible assets for the fiscal year ended September 30, 2023, (x) $7.7 million (net of tax of $2.9 million) of acquisition-related expenses related to amortization of acquired intangible assets for the fiscal year ended September 30, 2022, (y) $11.3 million (net of tax of $3.8 million) of acquisition related expenses related to the acquisition of Gain Capital Holdings, Inc. for the fiscal year ended September 30, 2021 and (z) $12.0 million (net of tax of $5.0 million) of acquisition related expenses related to the acquisition of Gain Capital Holdings, Inc. for the fiscal year ended September 30, 2020. (3) Adjusted net income (non-GAAP) is presented to reflect net income for each period, adjusted to exclude the effects of gain on acquisitions and acquisition-related expenses, net of tax. (4) Adjusted ROE is calculated by dividing adjusted net income by average stockholders’ equity. For six months ended periods, Adjusted ROE is calculated by annualizing the Adjusted net income for the period by average stockholders’ equity.
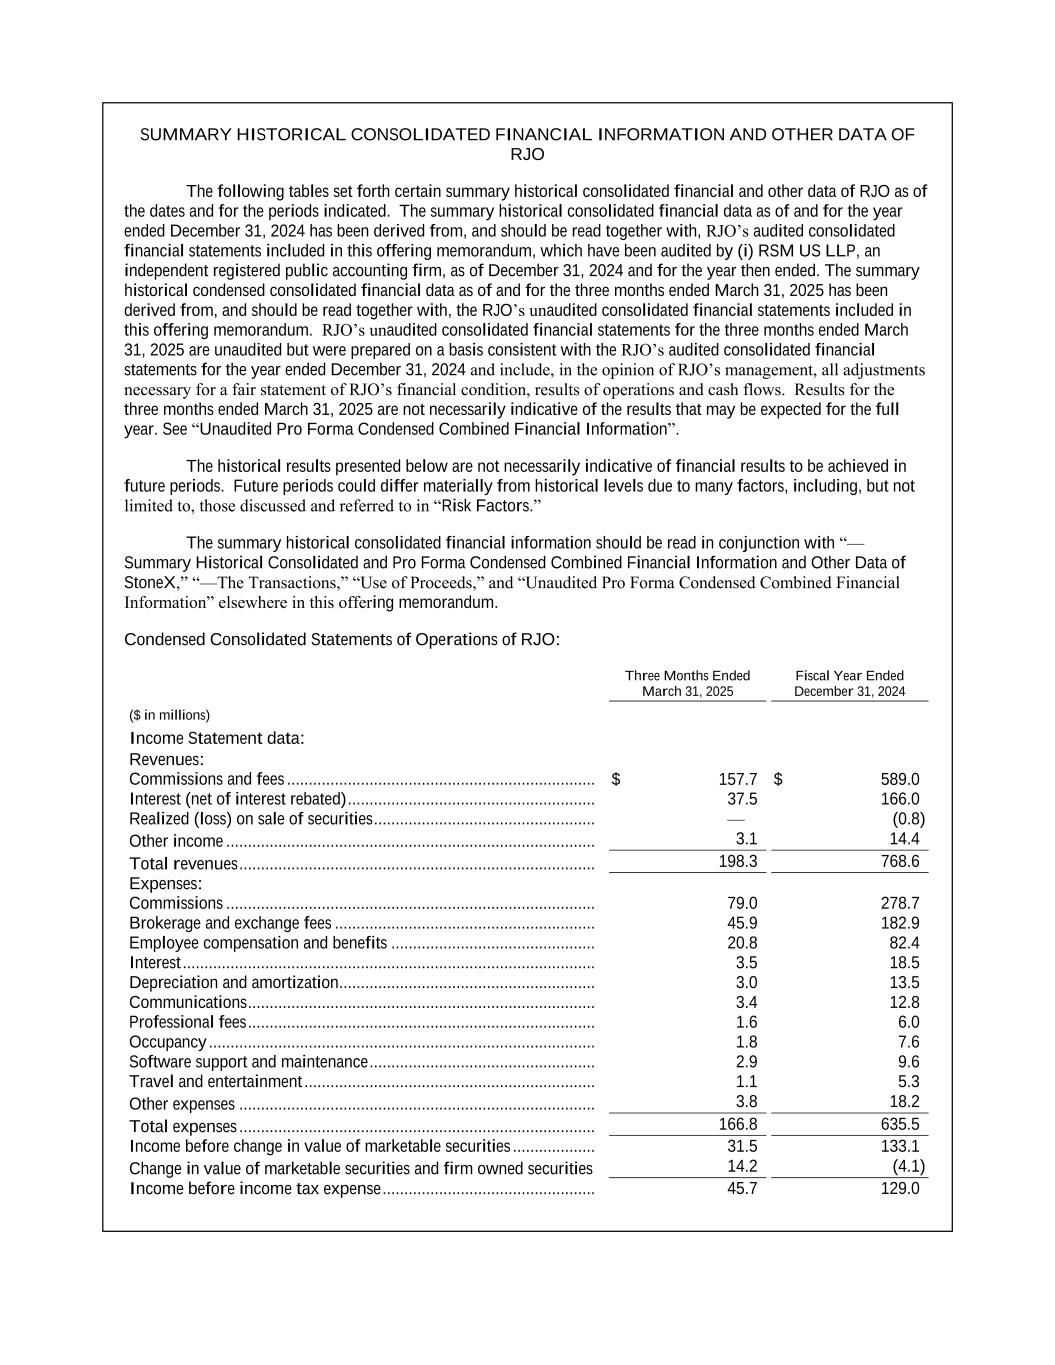
SUMMARY HISTORICAL CONSOLIDATED FINANCIAL INFORMATION AND OTHER DATA OF RJO The following tables set forth certain summary historical consolidated financial and other data of RJO as of the dates and for the periods indicated. The summary historical consolidated financial data as of and for the year ended December 31, 2024 has been derived from, and should be read together with, RJO’s audited consolidated financial statements included in this offering memorandum, which have been audited by (i) RSM US LLP, an independent registered public accounting firm, as of December 31, 2024 and for the year then ended. The summary historical condensed consolidated financial data as of and for the three months ended March 31, 2025 has been derived from, and should be read together with, the RJO’s unaudited consolidated financial statements included in this offering memorandum. RJO’s unaudited consolidated financial statements for the three months ended March 31, 2025 are unaudited but were prepared on a basis consistent with the RJO’s audited consolidated financial statements for the year ended December 31, 2024 and include, in the opinion of RJO’s management, all adjustments necessary for a fair statement of RJO’s financial condition, results of operations and cash flows. Results for the three months ended March 31, 2025 are not necessarily indicative of the results that may be expected for the full year. See “Unaudited Pro Forma Condensed Combined Financial Information”. The historical results presented below are not necessarily indicative of financial results to be achieved in future periods. Future periods could differ materially from historical levels due to many factors, including, but not limited to, those discussed and referred to in “Risk Factors.” The summary historical consolidated financial information should be read in conjunction with “— Summary Historical Consolidated and Pro Forma Condensed Combined Financial Information and Other Data of StoneX,” “—The Transactions,” “Use of Proceeds,” and “Unaudited Pro Forma Condensed Combined Financial Information” elsewhere in this offering memorandum. Condensed Consolidated Statements of Operations of RJO: Three Months Ended March 31, 2025 Fiscal Year Ended December 31, 2024 ($ in millions) Income Statement data: Revenues: Commissions and fees ....................................................................... $ 157.7 $ 589.0 Interest (net of interest rebated) ......................................................... 37.5 166.0 Realized (loss) on sale of securities ................................................... — (0.8) Other income ..................................................................................... 3.1 14.4 Total revenues .................................................................................. 198.3 768.6 Expenses: Commissions ..................................................................................... 79.0 278.7 Brokerage and exchange fees ............................................................ 45.9 182.9 Employee compensation and benefits ............................................... 20.8 82.4 Interest ............................................................................................... 3.5 18.5 Depreciation and amortization ........................................................... 3.0 13.5 Communications ................................................................................ 3.4 12.8 Professional fees ................................................................................ 1.6 6.0 Occupancy ......................................................................................... 1.8 7.6 Software support and maintenance .................................................... 2.9 9.6 Travel and entertainment ................................................................... 1.1 5.3 Other expenses .................................................................................. 3.8 18.2 Total expenses .................................................................................. 166.8 635.5 Income before change in value of marketable securities ................... 31.5 133.1 Change in value of marketable securities and firm owned securities 14.2 (4.1) Income before income tax expense ................................................. 45.7 129.0

Three Months Ended March 31, 2025 Fiscal Year Ended December 31, 2024 ($ in millions) Income tax expense ........................................................................... 9.9 28.3 Net income ........................................................................................ $ 35.8 $ 100.7