SiriusPoint Ltd.
Financial Supplement
March 31, 2023
(UNAUDITED)
This financial supplement is for informational purposes only. It should be read in conjunction with documents filed with the Securities and Exchange Commission by SiriusPoint Ltd., including the Company’s Quarterly Report on Form 10-Q.
| Point Building | Dhruv Gahlaut - Head of Investor Relations and Chief Strategy Officer | |||||||
| 3 Waterloo Lane | Tel: (044) 20 3772 3111 | |||||||
| Pembroke HM 08 | Email: [email protected] | |||||||
| Bermuda | Website: www.siriuspt.com | |||||||
SiriusPoint Ltd.
Basis of Presentation and Non-GAAP Financial Measures:
Unless the context otherwise indicates or requires, as used in this financial supplement references to “we,” “our,” “us,” the “Company,” and "SiriusPoint" refer to SiriusPoint Ltd. and its directly and indirectly owned subsidiaries, as a combined entity, except where otherwise stated or where it is clear that the terms mean only SiriusPoint Ltd. exclusive of its subsidiaries. We have made rounding adjustments to reach some of the figures included in this financial supplement and, unless otherwise indicated, percentages presented in this financial supplement are approximate.
In presenting SiriusPoint’s results, management has included financial measures that are not calculated under standards or rules that comprise accounting principles generally accepted in the United States (“GAAP”). SiriusPoint’s management uses this information in its internal analysis of results and believes that this information may be informative to investors in gauging the quality of SiriusPoint’s financial performance, identifying trends in our results and providing meaningful period-to-period comparisons. Core underwriting income, Core net services income, Core income, Core combined ratio, accident year loss ratio, accident year combined ratio and attritional loss ratio are non-GAAP financial measures. Management believes it is useful to review Core results as it better reflects how management views the business and reflects the Company’s decision to exit the runoff business. Tangible book value per diluted common share is also a non-GAAP financial measure. SiriusPoint's management believes that effects of intangible assets are not indicative of underlying underwriting results or trends and make book value comparisons to less acquisitive peer companies less meaningful. The tangible book value per diluted common share is also useful because it provides a more accurate measure of the realizable value of shareholder returns, excluding intangible assets. Reconciliations and definitions of such measures to the most comparable GAAP figures are included in the attached financial information in accordance with Regulation G.
Safe Harbor Statement Regarding Forward-Looking Statements:
This financial supplement includes “forward-looking statements” within the meaning of the Private Securities Litigation Reform Act of 1995. Forward-looking statements are subject to known and unknown risks and uncertainties, many of which may be beyond the Company’s control. The Company cautions you that the forward-looking information presented in this financial supplement is not a guarantee of future events, and that actual events may differ materially from those made in or suggested by the forward-looking information contained in this financial supplement. In addition, forward-looking statements generally can be identified by the use of forward-looking terminology such as “believes,” “intends,” “seeks,” “anticipates,” “aims,” “plans,” “estimates,” “expects,” “assumes,” “continues,” “should,” “could,” “will,” “may” and the negative of these or similar terms and phrases. Actual events, results and outcomes may differ materially from the Company’s expectations due to a variety of known and unknown risks, uncertainties and other factors. Among the risks and uncertainties that could cause actual results to differ from those described in the forward-looking statements are the following: our ability to execute on our strategic transformation, including re-underwriting to reduce volatility and improving underwriting performance, de-risking our investment portfolio, and transforming our business, including re-balancing our portfolio and growing the Insurance & Services segment; the impact of unpredictable catastrophic events including uncertainties with respect to current and future COVID-19 losses across many classes of insurance business and the amount of insurance losses that may ultimately be ceded to the reinsurance market, supply chain issues, labor shortages and related increased costs, changing interest rates and equity market volatility; inadequacy of loss and loss adjustment expense reserves, the lack of available capital, and periods characterized by excess underwriting capacity and unfavorable premium rates; the performance of financial markets, impact of inflation, and foreign currency fluctuations; our ability to compete successfully in the (re)insurance market and the effect of consolidation in the (re)insurance industry; technology breaches or failures, including those resulting from a malicious cyber-attack on us, our business partners or service providers; the effects of global climate change, including increased severity and frequency of weather-related natural disasters and catastrophes and increased coastal flooding in many geographic areas; our ability to retain key senior management and key employees; a downgrade or withdrawal of our financial ratings; fluctuations in our results of operations; legal restrictions on certain of SiriusPoint’s insurance and reinsurance subsidiaries’ ability to pay dividends and other distributions to SiriusPoint; the outcome of legal and regulatory proceedings and regulatory constraints on our business; reduced returns or losses in SiriusPoint’s investment portfolio; our potential exposure to U.S. federal income and withholding taxes and our significant deferred tax assets, which could become devalued if we do not generate future taxable income or applicable corporate tax rates are reduced; risks associated with delegating authority to third party managing general agents; future strategic transactions such as acquisitions, dispositions, investments, mergers or joint ventures; SiriusPoint’s response to any acquisition proposal that may be received from Daniel Loeb or any other party, including any actions that may be considered by the Company’s board of directors or any committee thereof; and other risks and factors listed under "Risk Factors" in the Company's most recent Annual Report on Form 10-K and other subsequent periodic reports filed with the Securities and Exchange Commission. All forward-looking statements speak only as of the date made and the Company undertakes no obligation to update or revise publicly any forward-looking statements, whether as a result of new information, future events or otherwise.
Page 2 of 17
SiriusPoint Ltd.
Table of Contents
| Key Performance Indicators | ||||||||
| Consolidated Financial Statements | ||||||||
| Consolidated Statements of Income (Loss) | ||||||||
| Consolidated Statements of Income (Loss) - by Quarter | ||||||||
| Operating Segment Information | ||||||||
| Segment Reporting - Three months ended March 31, 2023 | ||||||||
| Segment Reporting - Three months ended March 31, 2022 | ||||||||
Consolidated Results - by Quarter | ||||||||
Core Results - by Quarter | ||||||||
Reinsurance Segment - by Quarter | ||||||||
Insurance & Services Segment - by Quarter | ||||||||
| Investments | ||||||||
| Other | ||||||||
| Earnings (loss) per Share - by Quarter | ||||||||
| Annualized Return on Average Common Shareholders’ Equity - by Quarter | ||||||||
| Book Value per Share - by Quarter | ||||||||
Page 3 of 17
SiriusPoint Ltd.
Key Performance Indicators
March 31, 2023 and 2022
(expressed in millions of U.S. dollars, except per share data and ratios)
| 2023 | 2022 | ||||||||||
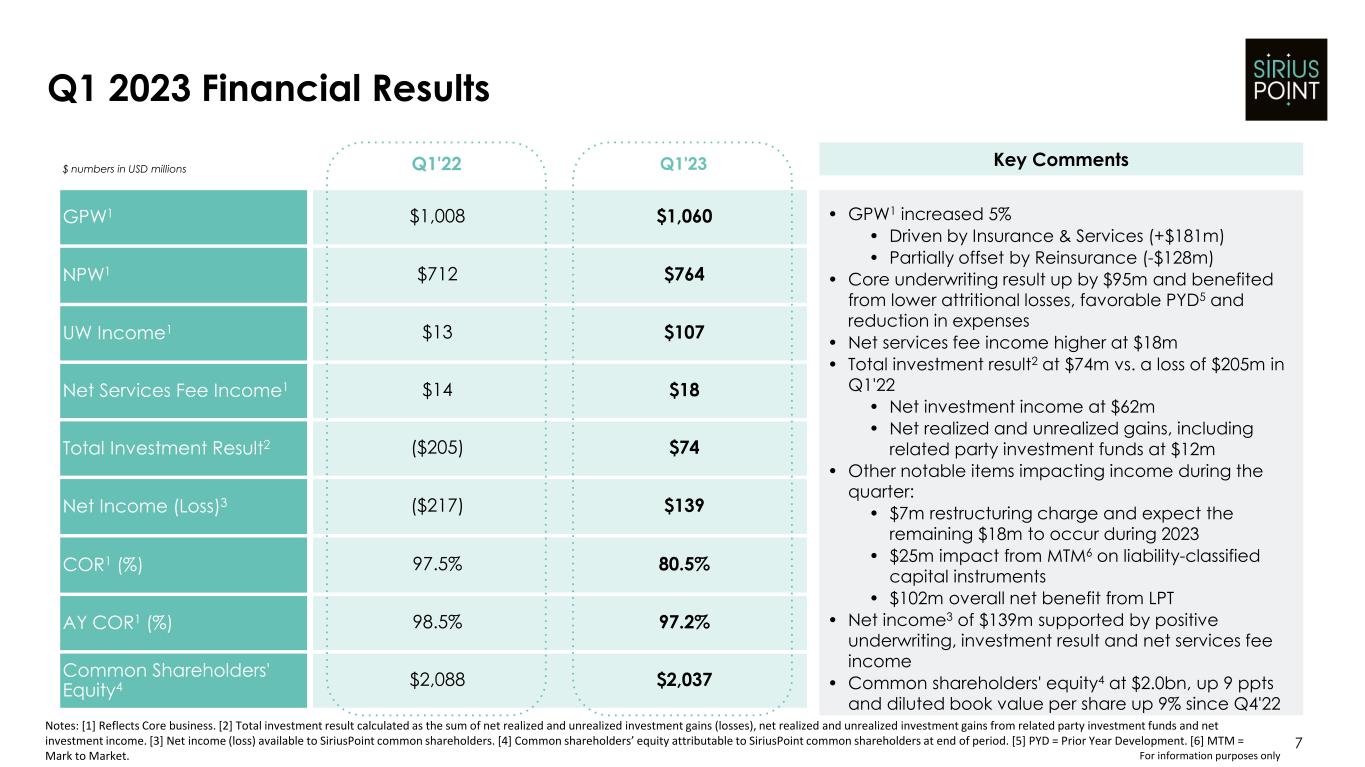
| Combined ratio | 73.8 | % | 93.7 | % | |||||||
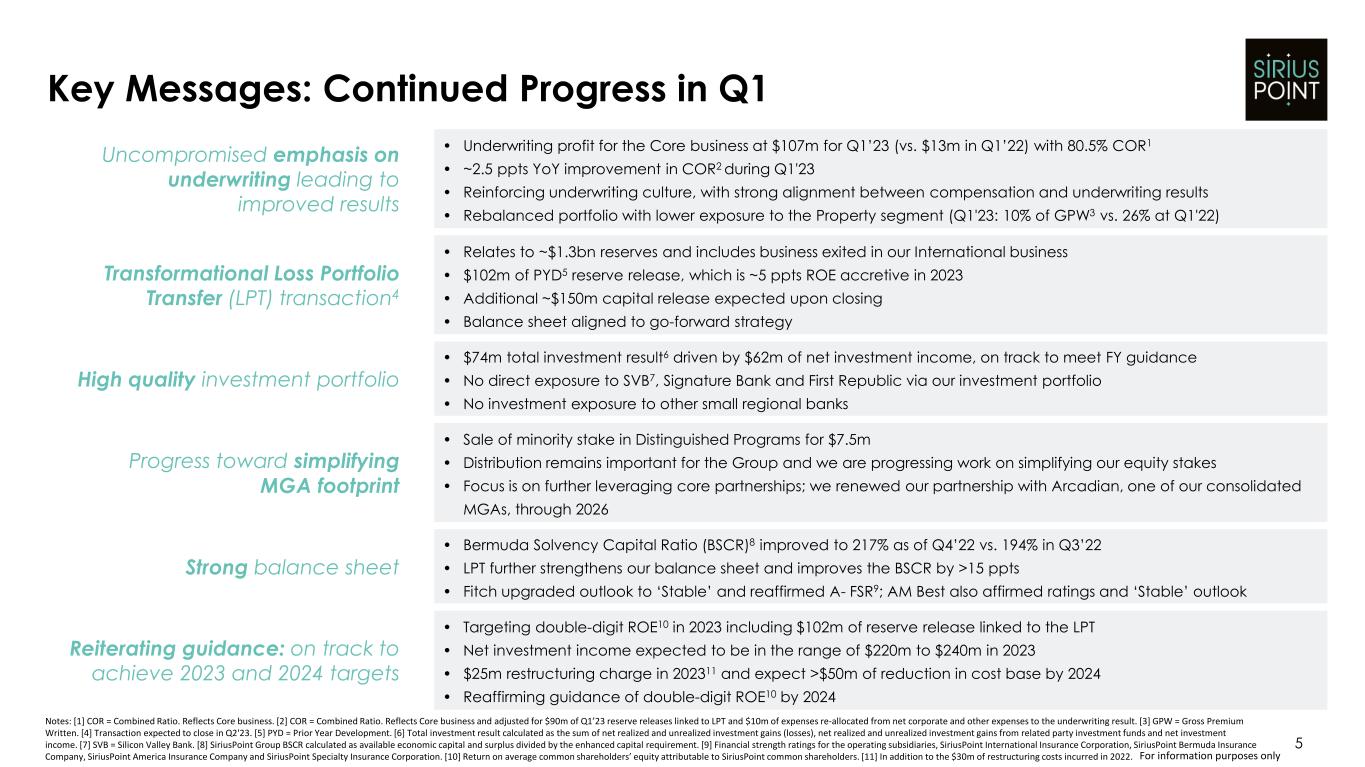
| Core underwriting income (1) | $ | 107.4 | $ | 12.7 | |||||||
| Core net services income (1) | $ | 12.8 | $ | 14.0 | |||||||
| Core income (1) | $ | 120.2 | $ | 26.7 | |||||||
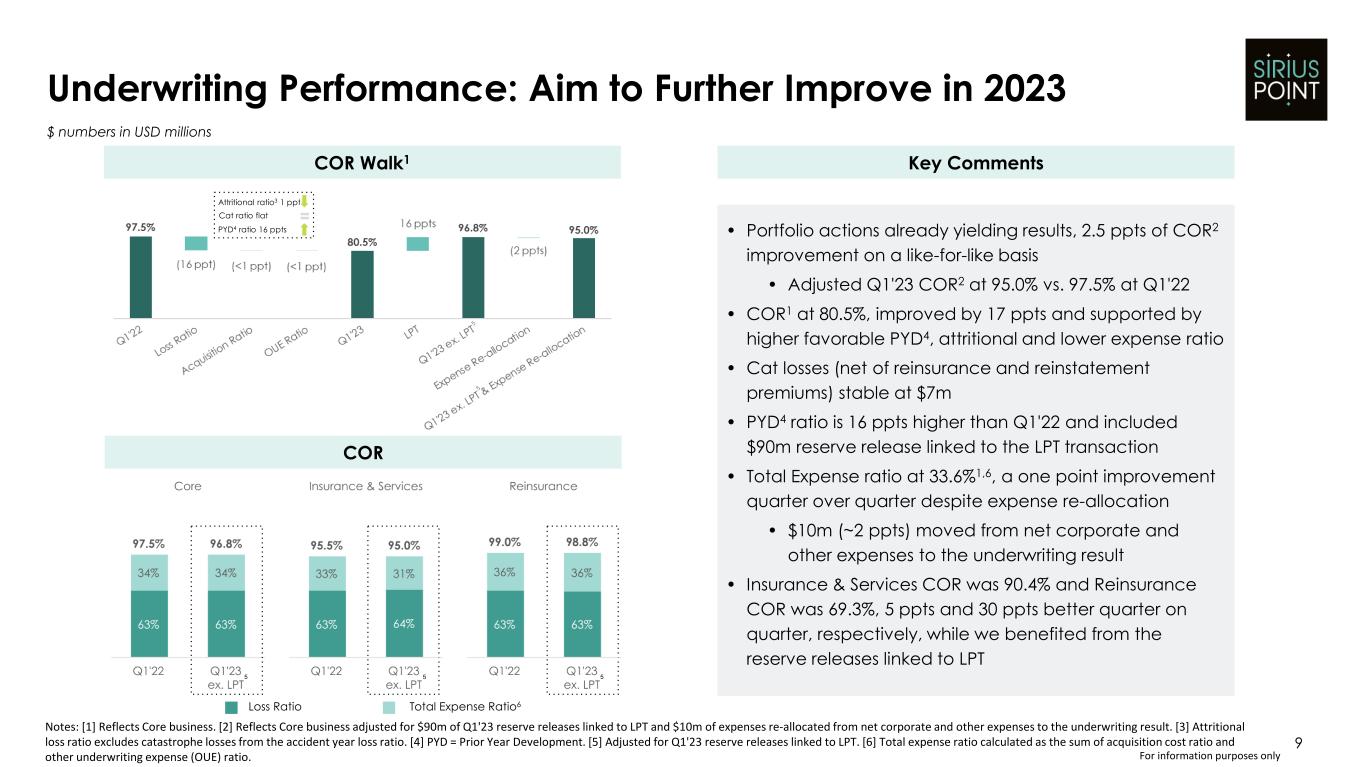
Core combined ratio (1) | 80.5 | % | 97.5 | % | |||||||
| Accident year loss ratio (1) | 63.6 | % | 64.1 | % | |||||||
| Accident year combined ratio (1) | 97.2 | % | 98.5 | % | |||||||
| Attritional loss ratio (1) | 62.3 | % | 62.8 | % | |||||||
| Annualized return on average common shareholders’ equity attributable to SiriusPoint common shareholders | 28.3 | % | (39.5) | % | |||||||
| Book value per common share (2) | $ | 12.54 | $ | 11.56 | |||||||
| Book value per diluted common share (2) | $ | 12.31 | $ | 11.32 | |||||||
| Tangible book value per diluted common share (1) (2) | $ | 11.41 | $ | 10.43 | |||||||
(1)Core underwriting income, Core net services income, Core income and Core combined ratio are non-GAAP financial measures. See reconciliations in “Segment Reporting.” Accident year combined ratio, accident year loss ratio and attritional loss ratio are non-GAAP financial measures. See definitions in “Core Results by Quarter.” Tangible book value per diluted common share is a non-GAAP financial measure. See reconciliation in “Book Value per Share - by Quarter.”
(2)Prior year comparatives represent amounts as of December 31, 2022.
Page 4 of 17
SiriusPoint Ltd.
Consolidated Balance Sheets - by Quarter
(expressed in millions of U.S. dollars)
| March 31, 2023 | December 31, 2022 | September 30, 2022 | June 30, 2022 | March 31, 2022 | ||||||||||||||||||||||||||||
| Assets | ||||||||||||||||||||||||||||||||
| Debt securities, available for sale, at fair value, net of allowance for credit losses | $ | 3,565.9 | $ | 2,635.5 | $ | 1,324.0 | $ | 715.5 | $ | — | ||||||||||||||||||||||
| Debt securities, trading, at fair value | 1,120.2 | 1,526.0 | 1,697.1 | 2,210.5 | 2,622.8 | |||||||||||||||||||||||||||
| Short-term investments, at fair value | 594.0 | 984.6 | 1,991.6 | 1,378.0 | 989.0 | |||||||||||||||||||||||||||
| Investments in related party investment funds, at fair value | 117.9 | 128.8 | 309.0 | 318.1 | 678.6 | |||||||||||||||||||||||||||
| Other long-term investments, at fair value | 361.9 | 377.2 | 414.9 | 436.4 | 438.2 | |||||||||||||||||||||||||||
| Equity securities, trading, at fair value | 1.6 | 1.6 | 1.4 | 1.6 | 2.7 | |||||||||||||||||||||||||||
| Total investments | 5,761.5 | 5,653.7 | 5,738.0 | 5,060.1 | 4,731.3 | |||||||||||||||||||||||||||
| Cash and cash equivalents | 763.6 | 705.3 | 647.3 | 746.6 | 826.1 | |||||||||||||||||||||||||||
| Restricted cash and cash equivalents | 211.0 | 208.4 | 144.2 | 630.6 | 972.8 | |||||||||||||||||||||||||||
| Redemption receivable from related party investment fund | 11.6 | 18.5 | — | — | — | |||||||||||||||||||||||||||
| Due from brokers | 6.5 | 4.9 | 20.2 | 72.8 | 70.1 | |||||||||||||||||||||||||||
| Interest and dividends receivable | 33.5 | 26.7 | 17.0 | 14.6 | 10.7 | |||||||||||||||||||||||||||
| Insurance and reinsurance balances receivable, net | 2,261.0 | 1,876.9 | 1,952.7 | 1,934.8 | 1,936.8 | |||||||||||||||||||||||||||
| Deferred acquisition costs, net | 357.1 | 294.9 | 278.6 | 271.3 | 271.0 | |||||||||||||||||||||||||||
| Unearned premiums ceded | 462.3 | 348.8 | 379.1 | 375.6 | 365.7 | |||||||||||||||||||||||||||
| Loss and loss adjustment expenses recoverable, net | 1,392.0 | 1,376.2 | 1,309.2 | 1,257.5 | 1,278.6 | |||||||||||||||||||||||||||
| Deferred tax asset | 175.7 | 200.3 | 197.6 | 180.1 | 180.6 | |||||||||||||||||||||||||||
| Intangible assets | 161.9 | 163.8 | 165.9 | 168.0 | 170.0 | |||||||||||||||||||||||||||
| Assets held for sale | — | — | 20.9 | — | — | |||||||||||||||||||||||||||
| Other assets | 209.5 | 157.9 | 127.4 | 129.2 | 102.6 | |||||||||||||||||||||||||||
| Total assets | $ | 11,807.2 | $ | 11,036.3 | $ | 10,998.1 | $ | 10,841.2 | $ | 10,916.3 | ||||||||||||||||||||||
| Liabilities | ||||||||||||||||||||||||||||||||
| Loss and loss adjustment expense reserves | $ | 5,318.9 | $ | 5,268.7 | $ | 5,200.5 | $ | 4,940.8 | $ | 4,936.0 | ||||||||||||||||||||||
| Unearned premium reserves | 1,833.1 | 1,521.1 | 1,572.8 | 1,557.2 | 1,504.9 | |||||||||||||||||||||||||||
| Reinsurance balances payable | 1,004.9 | 813.6 | 793.9 | 759.0 | 773.5 | |||||||||||||||||||||||||||
| Deposit liabilities | 141.2 | 140.5 | 138.9 | 143.5 | 147.2 | |||||||||||||||||||||||||||
| Securities sold, not yet purchased, at fair value | 19.4 | 27.0 | 41.7 | 83.4 | 64.0 | |||||||||||||||||||||||||||
| Securities sold under an agreement to repurchase | 20.3 | 18.0 | 17.3 | 17.5 | — | |||||||||||||||||||||||||||
| Due to brokers | 60.1 | — | 16.6 | 18.0 | 32.1 | |||||||||||||||||||||||||||
| Accounts payable, accrued expenses and other liabilities | 275.7 | 266.6 | 245.8 | 206.5 | 188.7 | |||||||||||||||||||||||||||
| Deferred tax liability | 59.4 | 59.8 | 66.9 | 59.2 | 98.0 | |||||||||||||||||||||||||||
| Liability-classified capital instruments | 47.0 | 60.4 | 48.9 | 50.7 | 76.0 | |||||||||||||||||||||||||||
| Debt | 779.2 | 778.0 | 762.0 | 781.3 | 808.4 | |||||||||||||||||||||||||||
| Total liabilities | 9,559.2 | 8,953.7 | 8,905.3 | 8,617.1 | 8,628.8 | |||||||||||||||||||||||||||
| Shareholders’ equity | ||||||||||||||||||||||||||||||||
| Series B preference shares | 200.0 | 200.0 | 200.0 | 200.0 | 200.0 | |||||||||||||||||||||||||||
| Common shares | 16.2 | 16.2 | 16.2 | 16.2 | 16.2 | |||||||||||||||||||||||||||
| Additional paid-in capital | 1,642.6 | 1,641.3 | 1,633.2 | 1,630.3 | 1,623.4 | |||||||||||||||||||||||||||
| Retained earnings | 400.8 | 262.2 | 288.8 | 387.2 | 448.0 | |||||||||||||||||||||||||||
| Accumulated other comprehensive income (loss) | (23.0) | (45.0) | (53.7) | (10.4) | 0.6 | |||||||||||||||||||||||||||
| Shareholders’ equity attributable to SiriusPoint shareholders | 2,236.6 | 2,074.7 | 2,084.5 | 2,223.3 | 2,288.2 | |||||||||||||||||||||||||||
| Noncontrolling interests | 11.4 | 7.9 | 8.3 | 0.8 | (0.7) | |||||||||||||||||||||||||||
| Total shareholders’ equity | 2,248.0 | 2,082.6 | 2,092.8 | 2,224.1 | 2,287.5 | |||||||||||||||||||||||||||
| Total liabilities, noncontrolling interests and shareholders’ equity | $ | 11,807.2 | $ | 11,036.3 | $ | 10,998.1 | $ | 10,841.2 | $ | 10,916.3 | ||||||||||||||||||||||
Page 5 of 17
SiriusPoint Ltd.
Consolidated Statements of Income (Loss)
(expressed in millions of U.S. dollars, except share and per share data)
| Three months ended | |||||||||||
| March 31, 2023 | March 31, 2022 | ||||||||||
| Revenues | |||||||||||
| Net premiums earned | $ | 595.5 | $ | 529.3 | |||||||
| Net realized and unrealized investment gains (losses) | 11.3 | (81.9) | |||||||||
| Net realized and unrealized investment gains (losses) from related party investment funds | 0.8 | (131.0) | |||||||||
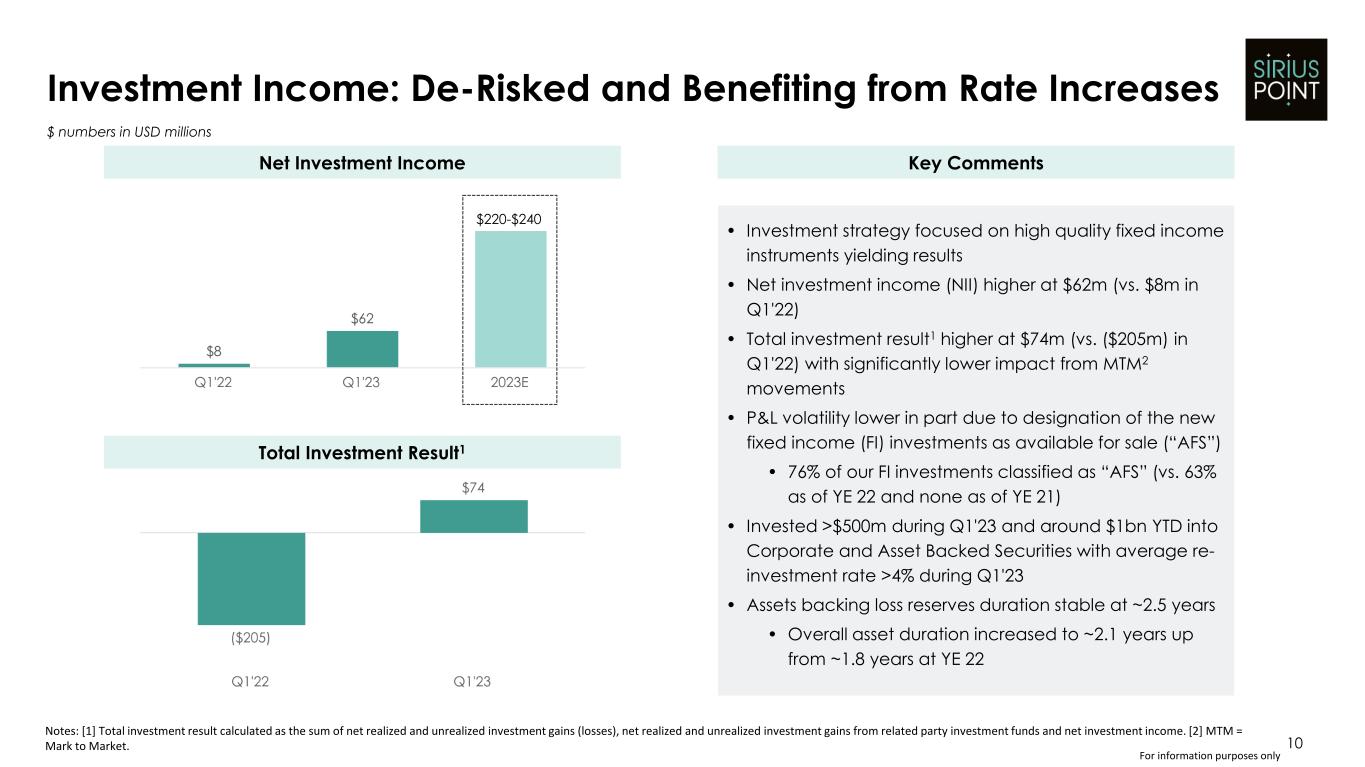
| Net investment income | 61.5 | 7.8 | |||||||||
| Net realized and unrealized investment gains (losses) and net investment income | 73.6 | (205.1) | |||||||||
| Other revenues | 15.8 | 37.2 | |||||||||
| Total revenues | 684.9 | 361.4 | |||||||||
| Expenses | |||||||||||
| Loss and loss adjustment expenses incurred, net | 267.1 | 340.1 | |||||||||
| Acquisition costs, net | 119.7 | 108.5 | |||||||||
| Other underwriting expenses | 52.2 | 47.2 | |||||||||
| Net corporate and other expenses | 61.8 | 77.4 | |||||||||
| Intangible asset amortization | 2.4 | 1.9 | |||||||||
| Interest expense | 10.8 | 9.3 | |||||||||
| Foreign exchange (gains) losses | 0.1 | (19.4) | |||||||||
| Total expenses | 514.1 | 565.0 | |||||||||
| Income (loss) before income tax expense | 170.8 | (203.6) | |||||||||
| Income tax expense | (25.8) | (9.7) | |||||||||
| Net income (loss) | 145.0 | (213.3) | |||||||||
| Net (income) loss attributable to noncontrolling interests | (2.4) | 0.3 | |||||||||
| Net income (loss) available to SiriusPoint | 142.6 | (213.0) | |||||||||
| Dividends on Series B preference shares | (4.0) | (4.0) | |||||||||
| Net income (loss) available to SiriusPoint common shareholders | $ | 138.6 | $ | (217.0) | |||||||
| Earnings (loss) per share available to SiriusPoint common shareholders | |||||||||||
| Basic earnings (loss) per share available to SiriusPoint common shareholders (1) | $ | 0.80 | $ | (1.36) | |||||||
| Diluted earnings (loss) per share available to SiriusPoint common shareholders (1) | $ | 0.78 | $ | (1.36) | |||||||
| Weighted average number of common shares used in the determination of earnings (loss) per share | |||||||||||
| Basic | 160,905,860 | 159,867,593 | |||||||||
| Diluted | 164,130,946 | 159,867,593 | |||||||||
(1) Basic earnings (loss) per share is based on the weighted average number of common shares and participating securities outstanding during the period. The weighted average number of common shares excludes any dilutive effect of outstanding warrants, options and unvested restricted shares. Diluted earnings (loss) per share is based on the weighted average number of common shares and participating securities outstanding and includes any dilutive effects of warrants, options and unvested restricted shares under share plans and are determined using the treasury stock method. U.S. GAAP requires that participating securities be treated in the same manner as outstanding shares for earnings per share calculations. The Company treats certain of its unvested restricted shares as participating securities. In the event of a net loss, all participating securities, outstanding warrants, options and restricted shares are excluded from both basic and diluted loss per share since their inclusion would be anti-dilutive.
Page 6 of 17
SiriusPoint Ltd.
Consolidated Statements of Income (Loss) - by Quarter
(expressed in millions of U.S. dollars, except share and per share data)
| March 31, 2023 | December 31, 2022 | September 30, 2022 | June 30, 2022 | March 31, 2022 | ||||||||||||||||||||||||||||
| Revenues | ||||||||||||||||||||||||||||||||
| Net premiums earned | $ | 595.5 | $ | 607.4 | $ | 612.6 | $ | 568.8 | $ | 529.3 | ||||||||||||||||||||||
| Net realized and unrealized investment gains (losses) | 11.3 | 10.9 | (56.1) | (98.4) | (81.9) | |||||||||||||||||||||||||||
| Net realized and unrealized investment gains (losses) from related party investment funds | 0.8 | (10.7) | (8.3) | (60.5) | (131.0) | |||||||||||||||||||||||||||
| Net investment income | 61.5 | 51.9 | 36.2 | 17.4 | 7.8 | |||||||||||||||||||||||||||
| Total realized and unrealized investment gains (losses) and net investment income | 73.6 | 52.1 | (28.2) | (141.5) | (205.1) | |||||||||||||||||||||||||||
| Other revenues | 15.8 | 14.1 | 13.1 | 45.8 | 37.2 | |||||||||||||||||||||||||||
| Total revenues | 684.9 | 673.6 | 597.5 | 473.1 | 361.4 | |||||||||||||||||||||||||||
| Expenses | ||||||||||||||||||||||||||||||||
| Loss and loss adjustment expenses incurred, net | 267.1 | 390.1 | 497.9 | 360.3 | 340.1 | |||||||||||||||||||||||||||
| Acquisition costs, net | 119.7 | 113.0 | 116.8 | 123.6 | 108.5 | |||||||||||||||||||||||||||
| Other underwriting expenses | 52.2 | 46.4 | 44.8 | 46.1 | 47.2 | |||||||||||||||||||||||||||
| Net corporate and other expenses | 61.8 | 92.6 | 70.8 | 72.0 | 77.4 | |||||||||||||||||||||||||||
| Intangible asset amortization | 2.4 | 2.1 | 2.1 | 2.0 | 1.9 | |||||||||||||||||||||||||||
| Interest expense | 10.8 | 10.5 | 9.4 | 9.4 | 9.3 | |||||||||||||||||||||||||||
| Foreign exchange (gains) losses | 0.1 | 61.5 | (51.6) | (56.5) | (19.4) | |||||||||||||||||||||||||||
| Total expenses | 514.1 | 716.2 | 690.2 | 556.9 | 565.0 | |||||||||||||||||||||||||||
| Income (loss) before income tax (expense) benefit | 170.8 | (42.6) | (92.7) | (83.8) | (203.6) | |||||||||||||||||||||||||||
| Income tax (expense) benefit | (25.8) | 19.6 | (0.9) | 27.7 | (9.7) | |||||||||||||||||||||||||||
| Net income (loss) | 145.0 | (23.0) | (93.6) | (56.1) | (213.3) | |||||||||||||||||||||||||||
| Net (income) loss attributable to noncontrolling interests | (2.4) | 0.4 | (0.8) | (0.7) | 0.3 | |||||||||||||||||||||||||||
| Net income (loss) available to SiriusPoint | 142.6 | (22.6) | (94.4) | (56.8) | (213.0) | |||||||||||||||||||||||||||
| Dividends on Series B preference shares | (4.0) | (4.0) | (4.0) | (4.0) | (4.0) | |||||||||||||||||||||||||||
| Net income (loss) available to SiriusPoint common shareholders | $ | 138.6 | $ | (26.6) | $ | (98.4) | $ | (60.8) | $ | (217.0) | ||||||||||||||||||||||
| Earnings (loss) per share available to SiriusPoint common shareholders | ||||||||||||||||||||||||||||||||
| Basic earnings (loss) per share available to SiriusPoint common shareholders (1) | $ | 0.80 | $ | (0.17) | $ | (0.61) | $ | (0.38) | $ | (1.36) | ||||||||||||||||||||||
| Diluted earnings (loss) per share available to SiriusPoint common shareholders (1) | $ | 0.78 | $ | (0.17) | $ | (0.61) | $ | (0.38) | $ | (1.36) | ||||||||||||||||||||||
| Weighted average number of common shares used in the determination of earnings (loss) per share | ||||||||||||||||||||||||||||||||
| Basic | 160,905,860 | 160,459,088 | 160,321,270 | 160,258,883 | 159,867,593 | |||||||||||||||||||||||||||
| Diluted | 164,130,946 | 160,459,088 | 160,321,270 | 160,258,883 | 159,867,593 | |||||||||||||||||||||||||||
(1) Basic income (loss) per share is based on the weighted average number of common shares and participating securities outstanding during the period. The Company treats certain of its unvested restricted shares and preference shares as participating securities. The weighted average number of common shares excludes any dilutive effect of outstanding warrants, options or restricted share awards and units. Diluted earnings (loss) per share is based on the weighted average number of common shares outstanding and includes any dilutive effects of warrants, options, restricted share awards and units, and is determined using the treasury stock method. In the event of a net loss, all participating securities, outstanding warrants, options and restricted shares and units are excluded from both basic and diluted loss per share since their inclusion would be anti-dilutive.
Page 7 of 17
SiriusPoint Ltd.
Segment Reporting - Three months ended March 31, 2023
(expressed in millions of U.S. dollars, except ratios)
| Reinsurance | Insurance & Services | Core | Eliminations (2) | Corporate | Segment Measure Reclass | Total | |||||||||||||||||||||||||||||||||||
Gross premiums written | $ | 396.2 | $ | 664.0 | $ | 1,060.2 | $ | — | $ | 50.3 | $ | — | $ | 1,110.5 | |||||||||||||||||||||||||||
| Net premiums written | 311.0 | 452.6 | 763.6 | — | 28.1 | — | 791.7 | ||||||||||||||||||||||||||||||||||
| Net premiums earned | 259.5 | 291.2 | 550.7 | — | 44.8 | — | 595.5 | ||||||||||||||||||||||||||||||||||
| Loss and loss adjustment expenses incurred, net | 85.6 | 172.5 | 258.1 | (1.3) | 10.3 | — | 267.1 | ||||||||||||||||||||||||||||||||||
| Acquisition costs, net | 66.0 | 71.7 | 137.7 | (32.5) | 14.5 | — | 119.7 | ||||||||||||||||||||||||||||||||||
| Other underwriting expenses | 28.2 | 19.3 | 47.5 | — | 4.7 | — | 52.2 | ||||||||||||||||||||||||||||||||||
| Underwriting income | 79.7 | 27.7 | 107.4 | 33.8 | 15.3 | — | 156.5 | ||||||||||||||||||||||||||||||||||
| Services revenue | 0.2 | 63.6 | 63.8 | (34.3) | — | (29.5) | — | ||||||||||||||||||||||||||||||||||
| Services expenses | — | 45.5 | 45.5 | — | — | (45.5) | — | ||||||||||||||||||||||||||||||||||
| Net services fee income | 0.2 | 18.1 | 18.3 | (34.3) | — | 16.0 | — | ||||||||||||||||||||||||||||||||||
| Services noncontrolling income | — | (1.6) | (1.6) | — | — | 1.6 | — | ||||||||||||||||||||||||||||||||||
| Net investment losses from Strategic Investments | — | (3.9) | (3.9) | — | — | 3.9 | — | ||||||||||||||||||||||||||||||||||
| Net services income | 0.2 | 12.6 | 12.8 | (34.3) | — | 21.5 | — | ||||||||||||||||||||||||||||||||||
| Segment income | 79.9 | 40.3 | 120.2 | (0.5) | 15.3 | 21.5 | 156.5 | ||||||||||||||||||||||||||||||||||
| Net realized and unrealized investment gains (losses) | 15.2 | (3.9) | 11.3 | ||||||||||||||||||||||||||||||||||||||
| Net realized and unrealized investment gains from related party investment funds | 0.8 | — | 0.8 | ||||||||||||||||||||||||||||||||||||||
| Net investment income | 61.5 | — | 61.5 | ||||||||||||||||||||||||||||||||||||||
| Other revenues | (13.7) | 29.5 | 15.8 | ||||||||||||||||||||||||||||||||||||||
| Net corporate and other expenses | (16.3) | (45.5) | (61.8) | ||||||||||||||||||||||||||||||||||||||
| Intangible asset amortization | (2.4) | — | (2.4) | ||||||||||||||||||||||||||||||||||||||
| Interest expense | (10.8) | — | (10.8) | ||||||||||||||||||||||||||||||||||||||
| Foreign exchange losses | (0.1) | — | (0.1) | ||||||||||||||||||||||||||||||||||||||
| Income before income tax expense | $ | 79.9 | $ | 40.3 | 120.2 | (0.5) | 49.5 | 1.6 | 170.8 | ||||||||||||||||||||||||||||||||
| Income tax expense | — | — | (25.8) | — | (25.8) | ||||||||||||||||||||||||||||||||||||
| Net income | 120.2 | (0.5) | 23.7 | 1.6 | 145.0 | ||||||||||||||||||||||||||||||||||||
| Net income attributable to noncontrolling interest | — | — | (0.8) | (1.6) | (2.4) | ||||||||||||||||||||||||||||||||||||
| Net income available to SiriusPoint | $ | 120.2 | $ | (0.5) | $ | 22.9 | $ | — | $ | 142.6 | |||||||||||||||||||||||||||||||
Underwriting Ratios: (1) | |||||||||||||||||||||||||||||||||||||||||
| Loss ratio | 33.0 | % | 59.2 | % | 46.9 | % | 44.9 | % | |||||||||||||||||||||||||||||||||
| Acquisition cost ratio | 25.4 | % | 24.6 | % | 25.0 | % | 20.1 | % | |||||||||||||||||||||||||||||||||
| Other underwriting expenses ratio | 10.9 | % | 6.6 | % | 8.6 | % | 8.8 | % | |||||||||||||||||||||||||||||||||
Combined ratio | 69.3 | % | 90.4 | % | 80.5 | % | 73.8 | % | |||||||||||||||||||||||||||||||||
(1)Underwriting ratios are calculated by dividing the related expense by net premiums earned.
(2)Insurance & Services MGAs recognize fees for service using revenue from contracts with customers accounting standards, whereas insurance companies recognize acquisition expenses using insurance contract accounting standards. While ultimate revenues and expenses recognized will match, there will be recognition timing differences based on the different accounting standards.
Page 8 of 17
SiriusPoint Ltd.
Segment Reporting - Three months ended March 31, 2022
(expressed in millions of U.S. dollars, except ratios)
| Reinsurance | Insurance & Services | Core | Eliminations (2) | Corporate | Segment Measure Reclass | Total | |||||||||||||||||||||||||||||||||||
Gross premiums written | $ | 524.2 | $ | 483.5 | $ | 1,007.7 | $ | — | $ | 2.0 | $ | — | $ | 1,009.7 | |||||||||||||||||||||||||||
| Net premiums written | 374.9 | 337.5 | 712.4 | — | 1.5 | — | 713.9 | ||||||||||||||||||||||||||||||||||
| Net premiums earned | 307.6 | 212.8 | 520.4 | — | 8.9 | — | 529.3 | ||||||||||||||||||||||||||||||||||
| Loss and loss adjustment expenses incurred, net | 194.5 | 134.0 | 328.5 | (1.2) | 12.8 | — | 340.1 | ||||||||||||||||||||||||||||||||||
| Acquisition costs, net | 79.9 | 53.5 | 133.4 | (25.6) | 0.7 | — | 108.5 | ||||||||||||||||||||||||||||||||||
| Other underwriting expenses | 30.1 | 15.7 | 45.8 | — | 1.4 | — | 47.2 | ||||||||||||||||||||||||||||||||||
| Underwriting income (loss) | 3.1 | 9.6 | 12.7 | 26.8 | (6.0) | — | 33.5 | ||||||||||||||||||||||||||||||||||
| Services revenue | — | 56.8 | 56.8 | (30.8) | — | (26.0) | — | ||||||||||||||||||||||||||||||||||
| Services expenses | — | 43.3 | 43.3 | — | — | (43.3) | — | ||||||||||||||||||||||||||||||||||
| Net services fee income | — | 13.5 | 13.5 | (30.8) | — | 17.3 | — | ||||||||||||||||||||||||||||||||||
| Services noncontrolling loss | — | 0.8 | 0.8 | — | — | (0.8) | — | ||||||||||||||||||||||||||||||||||
| Net investment losses from Strategic Investments | — | (0.3) | (0.3) | — | — | 0.3 | — | ||||||||||||||||||||||||||||||||||
| Net services income | — | 14.0 | 14.0 | (30.8) | — | 16.8 | — | ||||||||||||||||||||||||||||||||||
| Segment income (loss) | 3.1 | 23.6 | 26.7 | (4.0) | (6.0) | 16.8 | 33.5 | ||||||||||||||||||||||||||||||||||
| Net realized and unrealized investment losses | (81.6) | (0.3) | (81.9) | ||||||||||||||||||||||||||||||||||||||
| Net realized and unrealized investment losses from related party investment funds | (131.0) | — | (131.0) | ||||||||||||||||||||||||||||||||||||||
| Net investment income | 7.8 | — | 7.8 | ||||||||||||||||||||||||||||||||||||||
| Other revenues | 11.2 | 26.0 | 37.2 | ||||||||||||||||||||||||||||||||||||||
| Net corporate and other expenses | (34.1) | (43.3) | (77.4) | ||||||||||||||||||||||||||||||||||||||
| Intangible asset amortization | (1.9) | — | (1.9) | ||||||||||||||||||||||||||||||||||||||
| Interest expense | (9.3) | — | (9.3) | ||||||||||||||||||||||||||||||||||||||
| Foreign exchange gains | 19.4 | — | 19.4 | ||||||||||||||||||||||||||||||||||||||
| Income (loss) before income tax expense | $ | 3.1 | $ | 23.6 | 26.7 | (4.0) | (225.5) | (0.8) | (203.6) | ||||||||||||||||||||||||||||||||
| Income tax expense | — | — | (9.7) | — | (9.7) | ||||||||||||||||||||||||||||||||||||
| Net income (loss) | 26.7 | (4.0) | (235.2) | (0.8) | (213.3) | ||||||||||||||||||||||||||||||||||||
| Net loss attributable to noncontrolling interest | — | — | — | 0.3 | 0.3 | ||||||||||||||||||||||||||||||||||||
| Net income (loss) available to SiriusPoint | $ | 26.7 | $ | (4.0) | $ | (235.2) | $ | (0.5) | $ | (213.0) | |||||||||||||||||||||||||||||||
Underwriting Ratios: (1) | |||||||||||||||||||||||||||||||||||||||||
| Loss ratio | 63.2 | % | 63.0 | % | 63.1 | % | 64.3 | % | |||||||||||||||||||||||||||||||||
| Acquisition cost ratio | 26.0 | % | 25.1 | % | 25.6 | % | 20.5 | % | |||||||||||||||||||||||||||||||||
| Other underwriting expenses ratio | 9.8 | % | 7.4 | % | 8.8 | % | 8.9 | % | |||||||||||||||||||||||||||||||||
| Combined ratio | 99.0 | % | 95.5 | % | 97.5 | % | 93.7 | % | |||||||||||||||||||||||||||||||||
(1)Underwriting ratios are calculated by dividing the related expense by net premiums earned.
(2)Insurance & Services MGAs recognize fees for service using revenue from contracts with customers accounting standards, whereas insurance companies recognize acquisition expenses using insurance contract accounting standards. While ultimate revenues and expenses recognized will match, there will be recognition timing differences based on the different accounting standards.
Page 9 of 17
SiriusPoint Ltd.
Consolidated Results - by Quarter
(expressed in millions of U.S. dollars, except ratios)
| March 31, 2023 | December 31, 2022 | September 30, 2022 | June 30, 2022 | March 31, 2022 | ||||||||||||||||||||||||||||
| Revenues | ||||||||||||||||||||||||||||||||
| Gross premiums written | $ | 1,110.5 | $ | 743.7 | $ | 843.8 | $ | 812.6 | $ | 1,009.7 | ||||||||||||||||||||||
| Net premiums written | 791.7 | 577.9 | 634.4 | 623.0 | 713.9 | |||||||||||||||||||||||||||
| Net premiums earned | 595.5 | 607.4 | 612.6 | 568.8 | 529.3 | |||||||||||||||||||||||||||
| Expenses | ||||||||||||||||||||||||||||||||
| Loss and loss adjustment expenses incurred, net | 267.1 | 390.1 | 497.9 | 360.3 | 340.1 | |||||||||||||||||||||||||||
| Acquisition costs, net | 119.7 | 113.0 | 116.8 | 123.6 | 108.5 | |||||||||||||||||||||||||||
| Other underwriting expenses | 52.2 | 46.4 | 44.8 | 46.1 | 47.2 | |||||||||||||||||||||||||||
| Underwriting income (loss) | $ | 156.5 | $ | 57.9 | $ | (46.9) | $ | 38.8 | $ | 33.5 | ||||||||||||||||||||||
| Underwriting Ratios (1): | ||||||||||||||||||||||||||||||||
| Loss ratio | 44.9 | % | 64.2 | % | 81.3 | % | 63.3 | % | 64.3 | % | ||||||||||||||||||||||
| Acquisition cost ratio | 20.1 | % | 18.6 | % | 19.1 | % | 21.7 | % | 20.5 | % | ||||||||||||||||||||||
| Other underwriting expense ratio | 8.8 | % | 7.6 | % | 7.3 | % | 8.1 | % | 8.9 | % | ||||||||||||||||||||||
| Combined ratio | 73.8 | % | 90.4 | % | 107.7 | % | 93.1 | % | 93.7 | % | ||||||||||||||||||||||
Catastrophe losses, net of reinsurance and reinstatement premiums | $ | 12.9 | $ | 0.2 | $ | 114.6 | $ | 16.2 | $ | 6.9 | ||||||||||||||||||||||
| Russia/Ukraine losses | — | (0.7) | (0.3) | (0.1) | 18.6 | |||||||||||||||||||||||||||
Favorable prior year loss reserve development | $ | (105.4) | $ | (4.1) | $ | (5.3) | $ | (6.4) | $ | (5.5) | ||||||||||||||||||||||
(1)Underwriting ratios are calculated by dividing the related expense by net premiums earned.
Page 10 of 17
SiriusPoint Ltd.
Core Results - by Quarter (1)
(expressed in millions of U.S. dollars, except ratios)
| March 31, 2023 | December 31, 2022 | September 30, 2022 | June 30, 2022 | March 31, 2022 | ||||||||||||||||||||||||||||
| Revenues | ||||||||||||||||||||||||||||||||
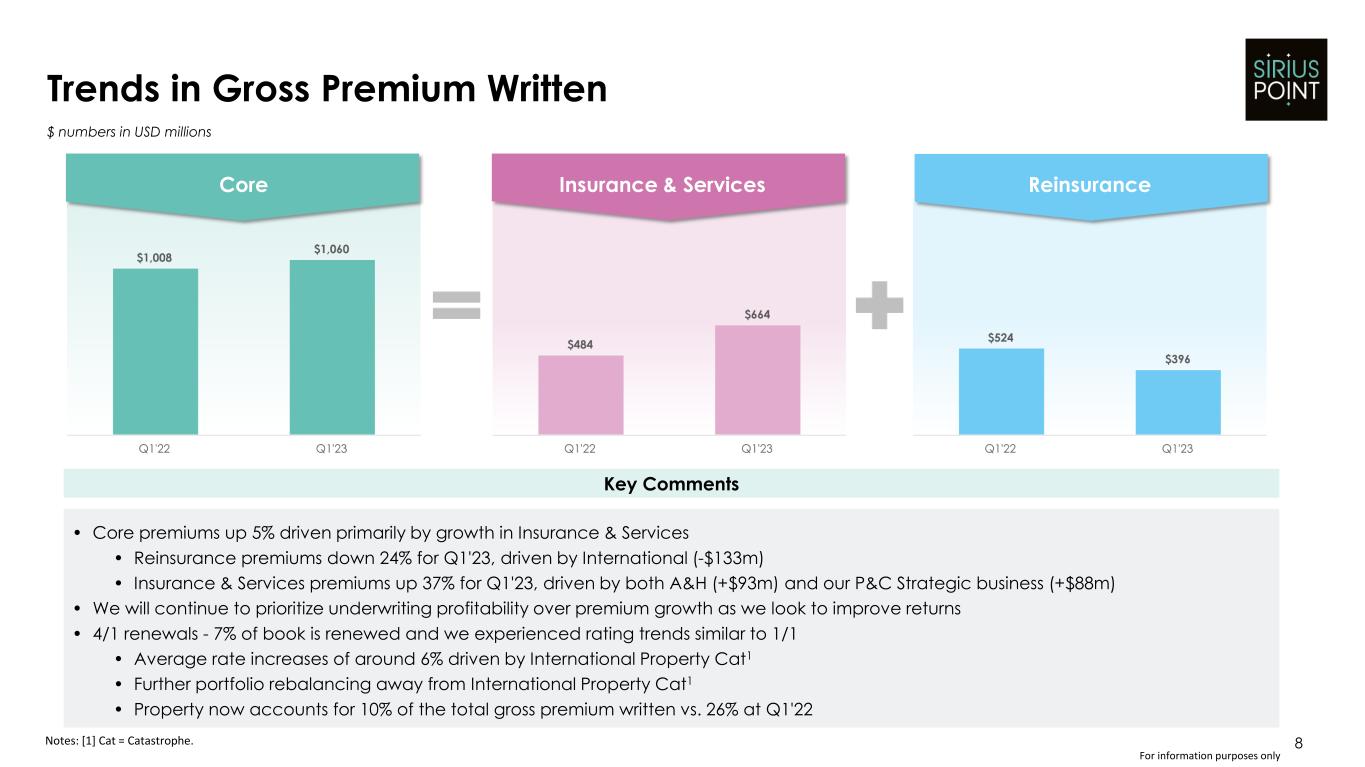
| Gross premiums written | $ | 1,060.2 | $ | 742.4 | $ | 843.3 | $ | 812.2 | $ | 1,007.7 | ||||||||||||||||||||||
| Net premiums written | 763.6 | 576.5 | 633.8 | 622.9 | 712.4 | |||||||||||||||||||||||||||
| Net premiums earned | 550.7 | 605.8 | 609.9 | 563.8 | 520.4 | |||||||||||||||||||||||||||
| Expenses | ||||||||||||||||||||||||||||||||
| Loss and loss adjustment expenses incurred, net | 258.1 | 382.5 | 504.1 | 359.5 | 328.5 | |||||||||||||||||||||||||||
| Acquisition costs, net | 137.7 | 149.1 | 150.8 | 150.2 | 133.4 | |||||||||||||||||||||||||||
| Other underwriting expenses | 47.5 | 43.0 | 43.3 | 44.5 | 45.8 | |||||||||||||||||||||||||||
| Underwriting income (loss) | 107.4 | 31.2 | (88.3) | 9.6 | 12.7 | |||||||||||||||||||||||||||
| Services revenues | 63.8 | 46.2 | 55.9 | 56.6 | 56.8 | |||||||||||||||||||||||||||
| Services expenses | 45.5 | 43.9 | 47.2 | 44.8 | 43.3 | |||||||||||||||||||||||||||
| Net services fee income | 18.3 | 2.3 | 8.7 | 11.8 | 13.5 | |||||||||||||||||||||||||||
| Services noncontrolling (income) loss | (1.6) | 0.5 | 0.5 | (0.7) | 0.8 | |||||||||||||||||||||||||||
| Net investment gains (losses) from Strategic Investments | (3.9) | (9.0) | 3.7 | (0.5) | (0.3) | |||||||||||||||||||||||||||
| Net services income (loss) | 12.8 | (6.2) | 12.9 | 10.6 | 14.0 | |||||||||||||||||||||||||||
| Segment income (loss) | $ | 120.2 | $ | 25.0 | $ | (75.4) | $ | 20.2 | $ | 26.7 | ||||||||||||||||||||||
| Underwriting Ratios (2): | ||||||||||||||||||||||||||||||||
| Loss ratio | 46.9 | % | 63.1 | % | 82.7 | % | 63.8 | % | 63.1 | % | ||||||||||||||||||||||
| Acquisition cost ratio | 25.0 | % | 24.6 | % | 24.7 | % | 26.6 | % | 25.6 | % | ||||||||||||||||||||||
| Other underwriting expense ratio | 8.6 | % | 7.1 | % | 7.1 | % | 7.9 | % | 8.8 | % | ||||||||||||||||||||||
| Combined ratio | 80.5 | % | 94.8 | % | 114.5 | % | 98.3 | % | 97.5 | % | ||||||||||||||||||||||
| Accident year loss ratio | 63.6 | % | 64.7 | % | 82.2 | % | 64.0 | % | 64.1 | % | ||||||||||||||||||||||
| Accident year combined ratio | 97.2 | % | 96.4 | % | 114.1 | % | 98.6 | % | 98.5 | % | ||||||||||||||||||||||
| Attritional loss ratio | 62.3 | % | 64.7 | % | 63.4 | % | 61.2 | % | 62.8 | % | ||||||||||||||||||||||
Catastrophe losses, net of reinsurance and reinstatement premiums | $ | 7.0 | $ | 0.2 | $ | 114.6 | $ | 16.2 | $ | 6.9 | ||||||||||||||||||||||
| Russia/Ukraine losses | — | (0.7) | (0.3) | (0.1) | 13.3 | |||||||||||||||||||||||||||
(Favorable) adverse prior year loss reserve development | $ | (91.9) | $ | (9.6) | $ | 2.6 | $ | (1.5) | $ | (5.0) | ||||||||||||||||||||||
(1)Collectively, the sum of our two segments, Reinsurance and Insurance & Services, constitute our "Core" results. Core underwriting income, Core net services income, Core income, Core combined ratio, accident year loss ratio, accident year combined ratio and attritional loss ratio are non-GAAP financial measures. We believe it is useful to review Core results as it better reflects how management views the business and reflects our decision to exit the runoff business. The sum of Core results and Corporate results are equal to the consolidated results of operations.
(2)Underwriting ratios are calculated by dividing the related expense by net premiums earned. Accident year loss ratio and accident year combined ratio exclude prior year loss reserve development to present the impact of current accident year net loss and loss adjustment expenses on the loss ratio and combined ratio, respectively. Attritional loss ratio excludes catastrophe losses from the accident year loss ratio as they are not predictable as to timing and amount.
Page 11 of 17
SiriusPoint Ltd.
Reinsurance Segment - by Quarter
(expressed in millions of U.S. dollars, except ratios)
| March 31, 2023 | December 31, 2022 | September 30, 2022 | June 30, 2022 | March 31, 2022 | ||||||||||||||||||||||||||||
| Revenues | ||||||||||||||||||||||||||||||||
| Gross premiums written | $ | 396.2 | $ | 300.5 | $ | 318.4 | $ | 378.3 | $ | 524.2 | ||||||||||||||||||||||
| Net premiums written | 311.0 | 236.1 | 267.1 | 321.5 | 374.9 | |||||||||||||||||||||||||||
| Net premiums earned | 259.5 | 281.5 | 304.5 | 319.5 | 307.6 | |||||||||||||||||||||||||||
| Expenses | ||||||||||||||||||||||||||||||||
| Loss and loss adjustment expenses incurred, net | 85.6 | 170.4 | 286.3 | 204.7 | 194.5 | |||||||||||||||||||||||||||
| Acquisition costs, net | 66.0 | 74.3 | 69.8 | 86.3 | 79.9 | |||||||||||||||||||||||||||
| Other underwriting expenses | 28.2 | 27.0 | 28.0 | 28.7 | 30.1 | |||||||||||||||||||||||||||
| Underwriting income (loss) | 79.7 | 9.8 | (79.6) | (0.2) | 3.1 | |||||||||||||||||||||||||||
| Services revenues | 0.2 | (3.6) | 3.4 | — | — | |||||||||||||||||||||||||||
| Net services fee income (loss) | 0.2 | (3.6) | 3.4 | — | — | |||||||||||||||||||||||||||
| Net investment gains (losses) from Strategic Investments | — | (4.2) | 0.3 | — | — | |||||||||||||||||||||||||||
| Net services income (loss) | 0.2 | (7.8) | 3.7 | — | — | |||||||||||||||||||||||||||
| Segment income (loss) | $ | 79.9 | $ | 2.0 | $ | (75.9) | $ | (0.2) | $ | 3.1 | ||||||||||||||||||||||
| Underwriting Ratios (1): | ||||||||||||||||||||||||||||||||
| Loss ratio | 33.0 | % | 60.5 | % | 94.0 | % | 64.1 | % | 63.2 | % | ||||||||||||||||||||||
| Acquisition cost ratio | 25.4 | % | 26.4 | % | 22.9 | % | 27.0 | % | 26.0 | % | ||||||||||||||||||||||
| Other underwriting expense ratio | 10.9 | % | 9.6 | % | 9.2 | % | 9.0 | % | 9.8 | % | ||||||||||||||||||||||
| Combined ratio | 69.3 | % | 96.5 | % | 126.1 | % | 100.1 | % | 99.0 | % | ||||||||||||||||||||||
| Accident year loss ratio | 61.7 | % | 59.5 | % | 99.4 | % | 62.6 | % | 63.3 | % | ||||||||||||||||||||||
| Accident year combined ratio | 98.0 | % | 95.5 | % | 131.5 | % | 98.6 | % | 99.0 | % | ||||||||||||||||||||||
| Attritional loss ratio | 59.4 | % | 60.0 | % | 61.7 | % | 57.6 | % | 61.0 | % | ||||||||||||||||||||||
Catastrophe losses, net of reinsurance and reinstatement premiums | $ | 6.0 | $ | (1.4) | $ | 114.6 | $ | 16.2 | $ | 6.9 | ||||||||||||||||||||||
| Russia/Ukraine losses | — | (0.7) | (0.3) | (0.1) | 13.3 | |||||||||||||||||||||||||||
(Favorable) adverse prior year loss reserve development | $ | (74.6) | $ | 3.0 | $ | (16.3) | $ | 4.6 | $ | (0.1) | ||||||||||||||||||||||
(1)Underwriting ratios are calculated by dividing the related expense by net premiums earned. Accident year loss ratio, accident year combined ratio and attritional loss ratio are non-GAAP financial measures. Accident year loss ratio and accident year combined ratio exclude prior year loss reserve development to present the impact of current accident year net loss and loss adjustment expenses on the loss ratio and combined ratio, respectively. Attritional loss ratio excludes catastrophe losses from the accident year loss ratio as they are not predictable as to timing and amount.
Page 12 of 17
SiriusPoint Ltd.
Insurance & Services Segment - by Quarter
(expressed in millions of U.S. dollars, except ratios)
| March 31, 2023 | December 31, 2022 | September 30, 2022 | June 30, 2022 | March 31, 2022 | ||||||||||||||||||||||||||||
| Revenues | ||||||||||||||||||||||||||||||||
| Gross premiums written | $ | 664.0 | $ | 441.9 | $ | 524.9 | $ | 433.9 | $ | 483.5 | ||||||||||||||||||||||
| Net premiums written | 452.6 | 340.4 | 366.7 | 301.4 | 337.5 | |||||||||||||||||||||||||||
| Net premiums earned | 291.2 | 324.3 | 305.4 | 244.3 | 212.8 | |||||||||||||||||||||||||||
| Expenses | ||||||||||||||||||||||||||||||||
| Loss and loss adjustment expenses incurred, net | 172.5 | 212.1 | 217.8 | 154.8 | 134.0 | |||||||||||||||||||||||||||
| Acquisition costs, net | 71.7 | 74.8 | 81.0 | 63.9 | 53.5 | |||||||||||||||||||||||||||
| Other underwriting expenses | 19.3 | 16.0 | 15.3 | 15.8 | 15.7 | |||||||||||||||||||||||||||
| Underwriting income (loss) | 27.7 | 21.4 | (8.7) | 9.8 | 9.6 | |||||||||||||||||||||||||||
| Services revenues | 63.6 | 49.8 | 52.5 | 56.6 | 56.8 | |||||||||||||||||||||||||||
| Services expenses | 45.5 | 43.9 | 47.2 | 44.8 | 43.3 | |||||||||||||||||||||||||||
| Net services fee income | 18.1 | 5.9 | 5.3 | 11.8 | 13.5 | |||||||||||||||||||||||||||
| Services noncontrolling (income) loss | (1.6) | 0.5 | 0.5 | (0.7) | 0.8 | |||||||||||||||||||||||||||
| Net investment gains (losses) from Strategic Investments | (3.9) | (4.8) | 3.4 | (0.5) | (0.3) | |||||||||||||||||||||||||||
| Net services income | 12.6 | 1.6 | 9.2 | 10.6 | 14.0 | |||||||||||||||||||||||||||
| Segment income | $ | 40.3 | $ | 23.0 | $ | 0.5 | $ | 20.4 | $ | 23.6 | ||||||||||||||||||||||
| Underwriting Ratios (1): | ||||||||||||||||||||||||||||||||
| Loss ratio | 59.2 | % | 65.4 | % | 71.3 | % | 63.4 | % | 63.0 | % | ||||||||||||||||||||||
| Acquisition cost ratio | 24.6 | % | 23.1 | % | 26.5 | % | 26.2 | % | 25.1 | % | ||||||||||||||||||||||
| Other underwriting expense ratio | 6.6 | % | 4.9 | % | 5.0 | % | 6.5 | % | 7.4 | % | ||||||||||||||||||||||
| Combined ratio | 90.4 | % | 93.4 | % | 102.8 | % | 96.1 | % | 95.5 | % | ||||||||||||||||||||||
| Accident year loss ratio | 65.2 | % | 69.3 | % | 65.1 | % | 65.9 | % | 65.3 | % | ||||||||||||||||||||||
| Accident year combined ratio | 96.4 | % | 97.3 | % | 96.7 | % | 98.5 | % | 97.8 | % | ||||||||||||||||||||||
| Attritional loss ratio | 64.8 | % | 68.8 | % | 65.1 | % | 65.9 | % | 65.3 | % | ||||||||||||||||||||||
Catastrophe losses, net of reinsurance and reinstatement premiums | $ | 1.0 | $ | 1.6 | $ | — | $ | — | $ | — | ||||||||||||||||||||||
(Favorable) adverse prior year loss reserve development | $ | (17.3) | $ | (12.6) | $ | 18.9 | $ | (6.1) | $ | (4.9) | ||||||||||||||||||||||
(1)Underwriting ratios are calculated by dividing the related expense by net premiums earned. Accident year loss ratio, accident year combined ratio and attritional loss ratio are non-GAAP financial measures. Accident year loss ratio and accident year combined ratio exclude prior year loss reserve development to present the impact of current accident year net loss and loss adjustment expenses on the loss ratio and combined ratio, respectively. Attritional loss ratio excludes catastrophe losses from the accident year loss ratio as they are not predictable as to timing and amount.
Page 13 of 17
SiriusPoint Ltd.
Investments - by Quarter
(expressed in millions of U.S. dollars)
| March 31, 2023 | December 31, 2022 | September 30, 2022 | June 30, 2022 | March 31, 2022 | |||||||||||||||||||||||||||||||||||||||||||||||||||||||
| Fair Value | % | Fair Value | % | Fair Value | % | Fair Value | % | Fair Value | % | ||||||||||||||||||||||||||||||||||||||||||||||||||
| Asset-backed securities | $ | 414.4 | 7.2 | % | $ | 230.7 | 4.1 | % | $ | 133.9 | 2.3 | % | $ | 125.1 | 2.5 | % | $ | — | — | % | |||||||||||||||||||||||||||||||||||||||
| Residential mortgage-backed securities | 417.8 | 7.3 | % | 340.7 | 6.0 | % | 212.8 | 3.7 | % | 112.0 | 2.2 | % | — | — | % | ||||||||||||||||||||||||||||||||||||||||||||
| Commercial mortgage-backed securities | 92.8 | 1.6 | % | 61.2 | 1.1 | % | 18.6 | 0.3 | % | 14.3 | 0.3 | % | — | — | % | ||||||||||||||||||||||||||||||||||||||||||||
| Corporate debt securities | 943.4 | 16.4 | % | 415.7 | 7.4 | % | 386.0 | 6.7 | % | 157.7 | 3.1 | % | — | — | % | ||||||||||||||||||||||||||||||||||||||||||||
| U.S. government and government agency | 1,637.1 | 28.4 | % | 1,550.6 | 27.4 | % | 552.3 | 9.6 | % | 291.5 | 5.8 | % | — | — | % | ||||||||||||||||||||||||||||||||||||||||||||
| Non-U.S. government and government agency | 60.4 | 1.0 | % | 36.6 | 0.6 | % | 20.4 | 0.4 | % | 14.9 | 0.3 | % | — | — | % | ||||||||||||||||||||||||||||||||||||||||||||
| Total debt securities, available for sale | 3,565.9 | 61.9 | % | 2,635.5 | 46.6 | % | 1,324.0 | 23.0 | % | 715.5 | 14.2 | % | — | — | % | ||||||||||||||||||||||||||||||||||||||||||||
| Asset-backed securities | 443.5 | 7.7 | % | 553.7 | 9.8 | % | 642.0 | 11.2 | % | 672.5 | 13.3 | % | 718.1 | 15.2 | % | ||||||||||||||||||||||||||||||||||||||||||||
| Residential mortgage-backed securities | 132.4 | 2.3 | % | 133.6 | 2.4 | % | 141.2 | 2.5 | % | 292.5 | 5.8 | % | 393.0 | 8.3 | % | ||||||||||||||||||||||||||||||||||||||||||||
| Commercial mortgage-backed securities | 111.2 | 1.9 | % | 113.4 | 2.0 | % | 117.0 | 2.0 | % | 126.3 | 2.5 | % | 132.7 | 2.8 | % | ||||||||||||||||||||||||||||||||||||||||||||
| Corporate debt securities | 294.4 | 5.1 | % | 363.5 | 6.4 | % | 404.4 | 7.0 | % | 667.2 | 13.2 | % | 752.3 | 15.9 | % | ||||||||||||||||||||||||||||||||||||||||||||
| U.S. government and government agency | 91.2 | 1.6 | % | 270.4 | 4.8 | % | 297.1 | 5.2 | % | 323.9 | 6.4 | % | 489.1 | 10.3 | % | ||||||||||||||||||||||||||||||||||||||||||||
| Non-U.S. government and government agency | 44.3 | 0.9 | % | 88.2 | 1.6 | % | 92.2 | 1.6 | % | 124.9 | 2.4 | % | 134.3 | 2.8 | % | ||||||||||||||||||||||||||||||||||||||||||||
| U.S. states, municipalities and political subdivision | — | — | % | — | — | % | — | — | % | — | — | % | — | — | % | ||||||||||||||||||||||||||||||||||||||||||||
| Preferred stocks | 3.2 | — | % | 3.2 | — | % | 3.2 | 0.1 | % | 3.2 | 0.1 | % | 3.3 | 0.1 | % | ||||||||||||||||||||||||||||||||||||||||||||
| Total debt securities, trading | 1,120.2 | 19.5 | % | 1,526.0 | 27.0 | % | 1,697.1 | 29.6 | % | 2,210.5 | 43.7 | % | 2,622.8 | 55.4 | % | ||||||||||||||||||||||||||||||||||||||||||||
| Total equity securities | 1.6 | — | % | 1.6 | — | % | 1.4 | — | % | 1.6 | — | % | 2.7 | 0.1 | % | ||||||||||||||||||||||||||||||||||||||||||||
| Short-term investments | 594.0 | 10.3 | % | 984.6 | 17.4 | % | 1,991.6 | 34.7 | % | 1,378.0 | 27.2 | % | 989.0 | 20.9 | % | ||||||||||||||||||||||||||||||||||||||||||||
| Other long-term investments | 227.8 | 4.0 | % | 227.3 | 4.0 | % | 196.8 | 3.4 | % | 173.5 | 3.4 | % | 185.0 | 3.9 | % | ||||||||||||||||||||||||||||||||||||||||||||
| Cost and equity method investments | 95.0 | 1.6 | % | 104.8 | 1.9 | % | 128.0 | 2.3 | % | 144.6 | 2.9 | % | 130.2 | 2.8 | % | ||||||||||||||||||||||||||||||||||||||||||||
| Investments in funds valued at net asset value | 157.0 | 2.7 | % | 173.9 | 3.1 | % | 399.1 | 7.0 | % | 436.4 | 8.6 | % | 801.6 | 16.9 | % | ||||||||||||||||||||||||||||||||||||||||||||
| Total investments | $ | 5,761.5 | 100.0 | % | $ | 5,653.7 | 100.0 | % | $ | 5,738.0 | 100.0 | % | $ | 5,060.1 | 100.0 | % | $ | 4,731.3 | 100.0 | % | |||||||||||||||||||||||||||||||||||||||
Page 14 of 17
SiriusPoint Ltd.
Earnings (loss) per Share - by Quarter
(expressed in millions of U.S. dollars, except share and per share data)
| March 31, 2023 | December 31, 2022 | September 30, 2022 | June 30, 2022 | March 31, 2022 | ||||||||||||||||||||||||||||
| Weighted-average number of common shares outstanding: | ||||||||||||||||||||||||||||||||
| Basic number of common shares outstanding | 160,905,860 | 160,459,088 | 160,321,270 | 160,258,883 | 159,867,593 | |||||||||||||||||||||||||||
Dilutive effect of options, warrants, restricted share awards, restricted share units, and Series A preference shares(1) | 3,225,086 | — | — | — | — | |||||||||||||||||||||||||||
| Diluted number of common shares outstanding | 164,130,946 | 160,459,088 | 160,321,270 | 160,258,883 | 159,867,593 | |||||||||||||||||||||||||||
| Basic income (loss) per common share: | ||||||||||||||||||||||||||||||||
| Net income (loss) allocated to SiriusPoint common shareholders | $ | 128.1 | $ | (26.6) | $ | (98.4) | $ | (60.8) | $ | (217.0) | ||||||||||||||||||||||
| Basic earnings (loss) per share available to SiriusPoint common shareholders (2) | $ | 0.80 | $ | (0.17) | $ | (0.61) | $ | (0.38) | $ | (1.36) | ||||||||||||||||||||||
| Diluted earnings (loss) per common share: | ||||||||||||||||||||||||||||||||
| Net income (loss) allocated to SiriusPoint common shareholders | $ | 128.1 | $ | (26.6) | $ | (98.4) | $ | (60.8) | $ | (217.0) | ||||||||||||||||||||||
| Diluted earnings (loss) per share available to SiriusPoint common shareholders (2) | $ | 0.78 | $ | (0.17) | $ | (0.61) | $ | (0.38) | $ | (1.36) | ||||||||||||||||||||||
(1)For the quarters ended December 31, 2022, September 30, 2022, June 30, 2022 and March 31, 2022, there was no dilution as a result of the net loss allocated to SiriusPoint common shareholders in the quarter.
(2)Basic income (loss) per share is based on the weighted average number of common shares and participating securities outstanding during the period. The Company treats certain of its unvested restricted shares and preference shares as participating securities. The weighted average number of common shares excludes any dilutive effect of outstanding warrants, options or restricted share awards and units. Diluted earnings (loss) per share is based on the weighted average number of common shares outstanding and includes any dilutive effects of warrants, options, restricted share awards and units, and is determined using the treasury stock method. In the event of a net loss, all participating securities, outstanding warrants, options and restricted shares and units are excluded from both basic and diluted loss per share since their inclusion would be anti-dilutive.
Page 15 of 17
SiriusPoint Ltd.
Annualized Return on Average Common Shareholders’ Equity - by Quarter
(expressed in millions of U.S. dollars, except share and per share data and ratios)
| March 31, 2023 | December 31, 2022 | September 30, 2022 | June 30, 2022 | March 31, 2022 | ||||||||||||||||||||||||||||
| Net income (loss) available to SiriusPoint common shareholders | $ | 138.6 | $ | (26.6) | $ | (98.4) | $ | (60.8) | $ | (217.0) | ||||||||||||||||||||||
| Shareholders’ equity attributable to SiriusPoint common shareholders - beginning of period | 1,874.7 | 1,884.5 | 2,023.3 | 2,088.2 | 2,303.7 | |||||||||||||||||||||||||||
| Shareholders’ equity attributable to SiriusPoint common shareholders - end of period | 2,036.6 | 1,874.7 | 1,884.5 | 2,023.3 | 2,088.2 | |||||||||||||||||||||||||||
| Average shareholders’ equity attributable to SiriusPoint common shareholders | $ | 1,955.7 | $ | 1,879.6 | $ | 1,953.9 | $ | 2,055.8 | $ | 2,196.0 | ||||||||||||||||||||||
Annualized return on average common shareholders’ equity attributable to SiriusPoint common shareholders (1) | 28.3 | % | (5.7) | % | (20.1) | % | (11.8) | % | (39.5) | % | ||||||||||||||||||||||
(1)Annualized return on average common shareholders’ equity attributable to SiriusPoint common shareholders is calculated by dividing annualized net income (loss) available to SiriusPoint common shareholders for the period by the average common shareholders’ equity determined using the common shareholders’ equity balances at the beginning and end of the period.
Page 16 of 17
SiriusPoint Ltd.
Book Value per Share - by Quarter
(expressed in millions of U.S. dollars, except share and per share data)
| March 31, 2023 | December 31, 2022 | September 30, 2022 | June 30, 2022 | March 31, 2022 | |||||||||||||||||||||||||
| Common shareholders’ equity attributable to SiriusPoint common shareholders | $ | 2,036.6 | $ | 1,874.7 | $ | 1,884.5 | $ | 2,023.3 | $ | 2,088.2 | |||||||||||||||||||
| Intangible assets | (161.9) | (163.8) | (165.9) | (168.0) | (170.0) | ||||||||||||||||||||||||
| Tangible diluted common shareholders' equity attributable to SiriusPoint common shareholders | $ | 1,874.7 | $ | 1,710.9 | $ | 1,718.6 | $ | 1,855.3 | $ | 1,918.2 | |||||||||||||||||||
| Common shares outstanding | 162,367,173 | 162,177,653 | 162,312,938 | 162,328,831 | 161,941,552 | ||||||||||||||||||||||||
| Effect of dilutive stock options, restricted share units, warrants and Series A preference shares | 3,023,030 | 3,492,795 | 1,963,861 | 1,790,110 | 1,469,274 | ||||||||||||||||||||||||
| Book value per diluted common share denominator | 165,390,203 | 165,670,448 | 164,276,799 | 164,118,941 | 163,410,826 | ||||||||||||||||||||||||
| Unvested restricted shares | (1,134,473) | (1,708,608) | (1,890,932) | (2,051,368) | (1,981,408) | ||||||||||||||||||||||||
| Tangible book value per diluted common share denominator | 164,255,730 | 163,961,840 | 162,385,867 | 162,067,573 | 161,429,418 | ||||||||||||||||||||||||
| Book value per common share | $ | 12.54 | $ | 11.56 | $ | 11.61 | $ | 12.46 | $ | 12.89 | |||||||||||||||||||
| Book value per diluted common share | $ | 12.31 | $ | 11.32 | $ | 11.47 | $ | 12.33 | $ | 12.78 | |||||||||||||||||||
Tangible book value per diluted common share (1) | $ | 11.41 | $ | 10.43 | $ | 10.58 | $ | 11.45 | $ | 11.88 | |||||||||||||||||||
(1)Tangible book value per diluted common share, as presented, is a non-GAAP financial measure and the most comparable U.S. GAAP measure is book value per common share. Tangible book value per diluted common share excludes the total number of unvested restricted shares, at period end, and intangible assets. While restricted shares are outstanding, they are excluded because they are unvested. Further, management believes that effects of intangible assets are not indicative of underlying underwriting results or trends and make book value comparisons to less acquisitive peer companies less meaningful. The tangible book value per diluted common share is also useful because it provides a more accurate measure of the realizable value of shareholder returns, excluding intangible assets.
Page 17 of 17