Sprout Social Announces Fourth Quarter 2020 Financial Results Above Guidance Range
Expects 2021 Revenue Growth of 30%
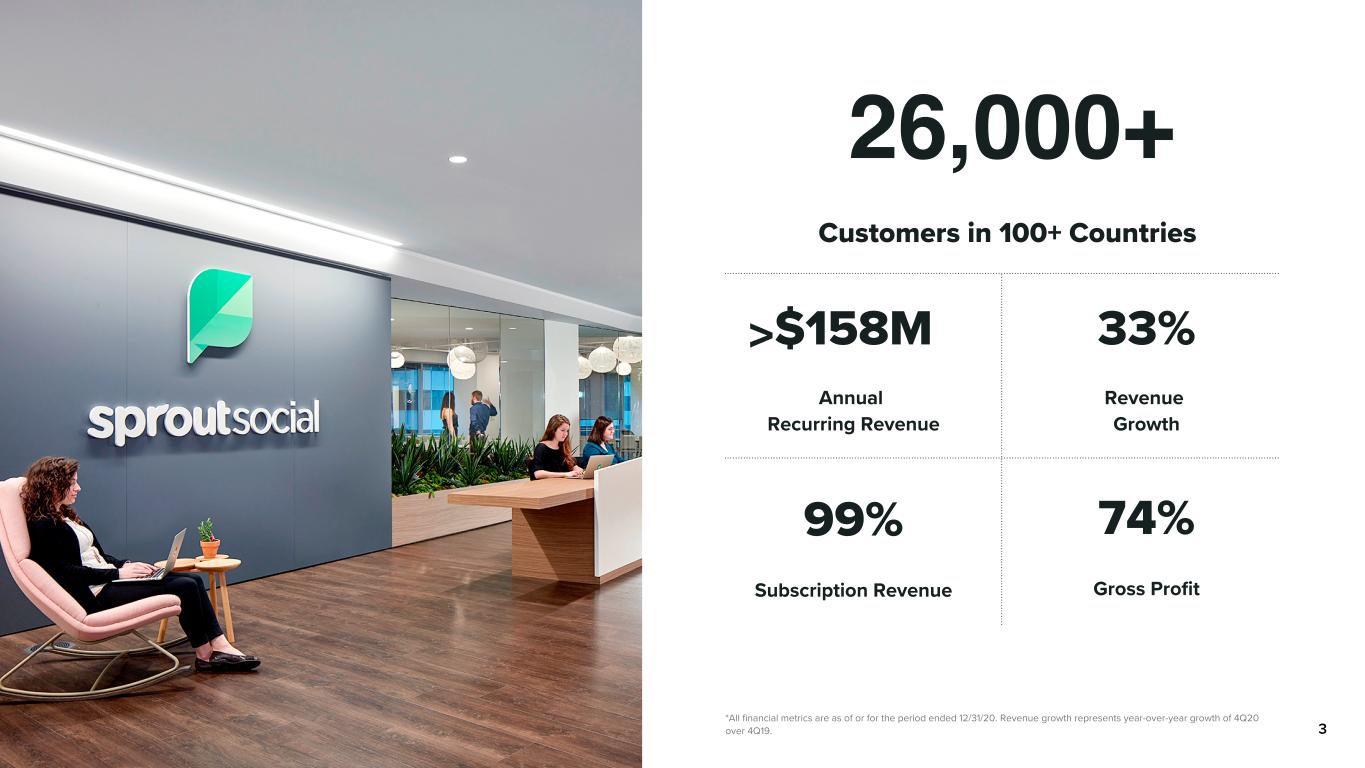
Fourth Quarter Total Revenue of $37.3 Million
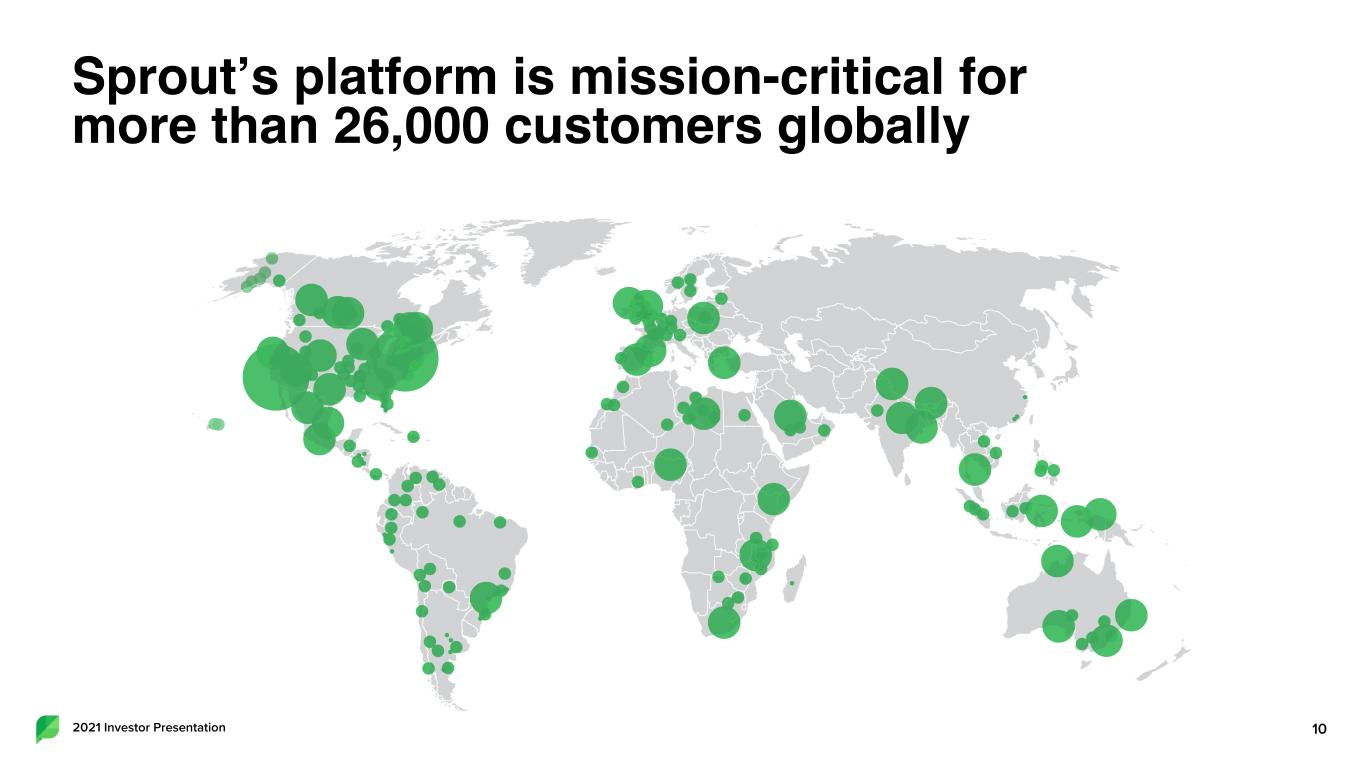
26,718 Customers as of December 31, 2020
CHICAGO, February 23, 2021 – Sprout Social, Inc. (“Sprout Social”, the “Company”) (Nasdaq: SPT), an industry-leading provider of cloud-based social media management software, today announced financial results for its fourth quarter ended December 31, 2020.
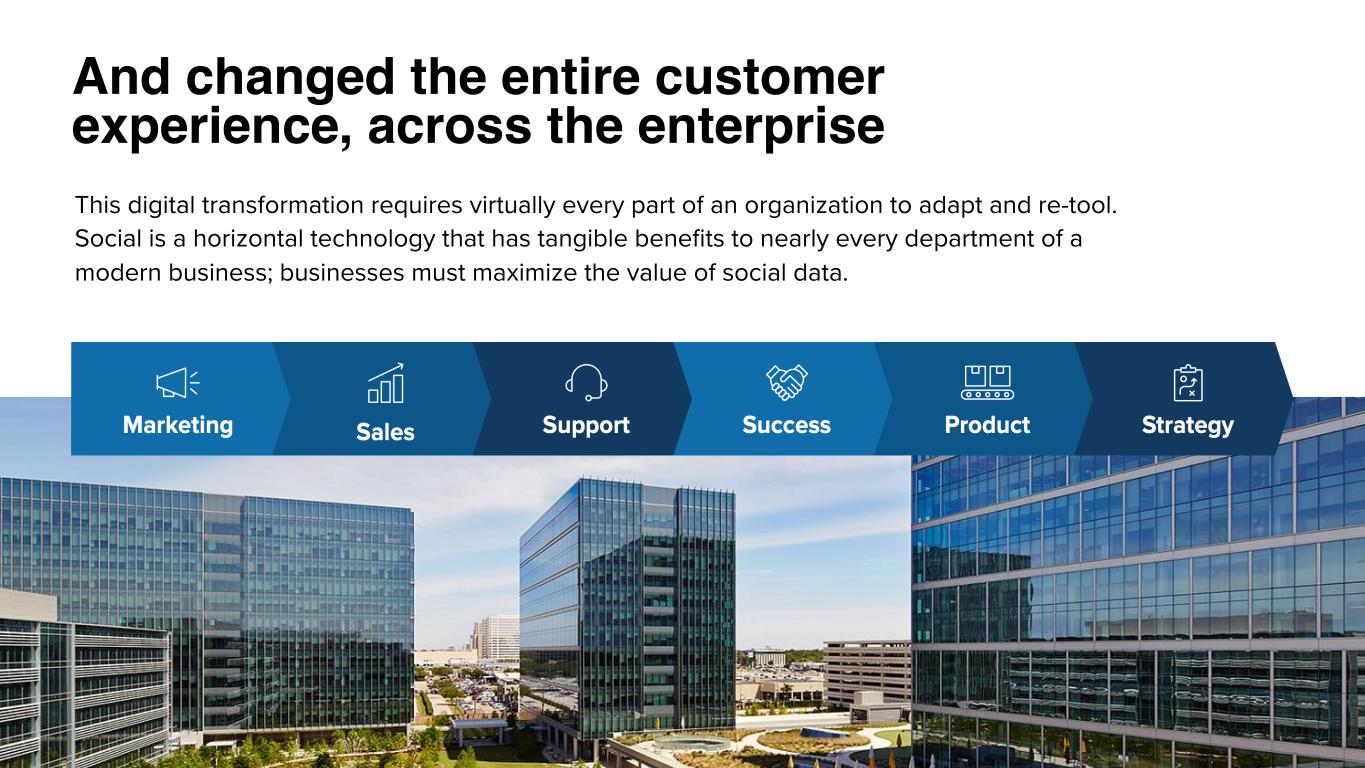
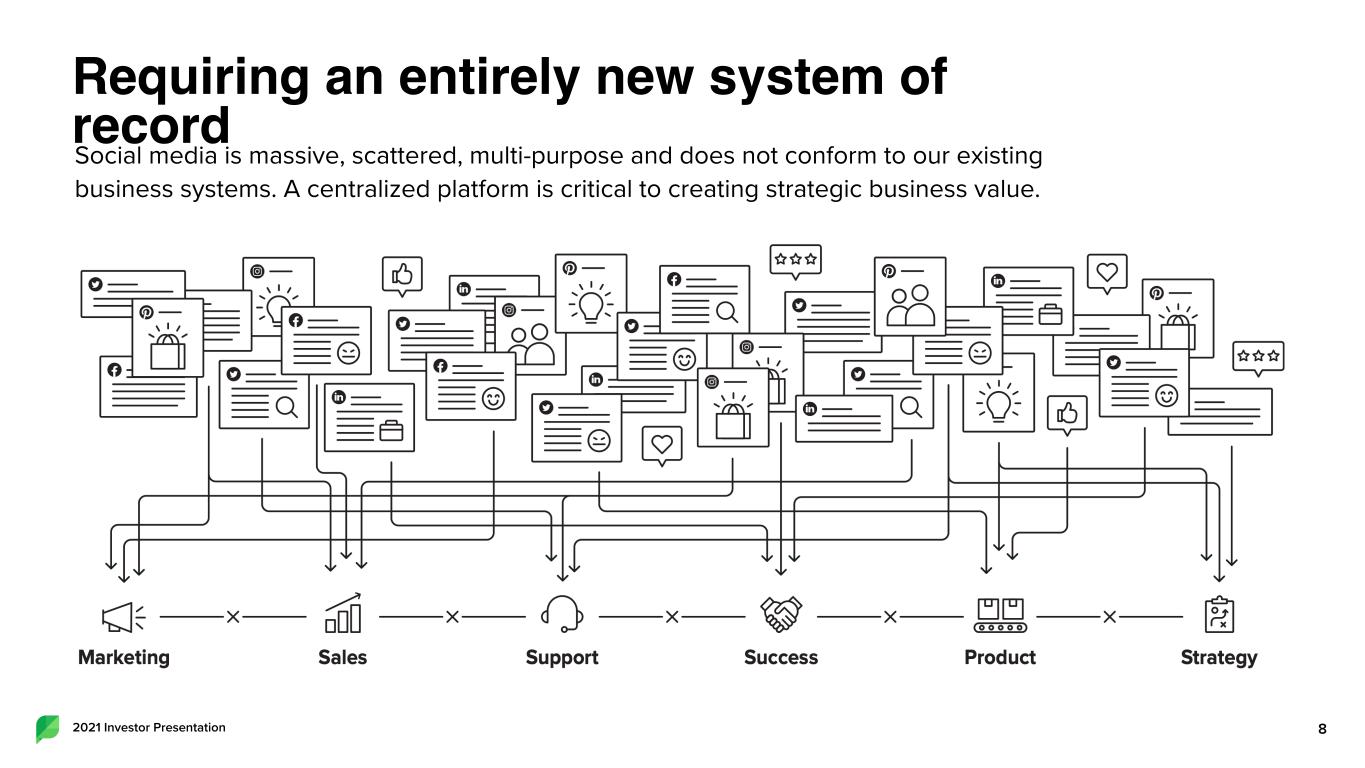
“We delivered an emphatic close to the year and are prepared for a fantastic 2021,” said Justyn Howard, Sprout Social’s CEO and co-founder. “Social has taken center stage in the digital strategy for millions of businesses around the globe. Social is not simply a way to market a brand, it is increasingly becoming the brand; it’s helping companies evolve what they make, who they make it for, how they sell it, how they compete, and how they deliver world-class experience. We are perfectly aligned to help our customers thrive into this period of transformation.”
“Our employees, our partners and our customers proved their resiliency, loyalty and trust many times over throughout 2020. We are humbled by this ongoing validation and excited by what lies ahead.”
Fourth Quarter 2020 Financial Highlights
Revenue
•Total revenue was $37.3 million, up 33% compared to the fourth quarter of 2019.
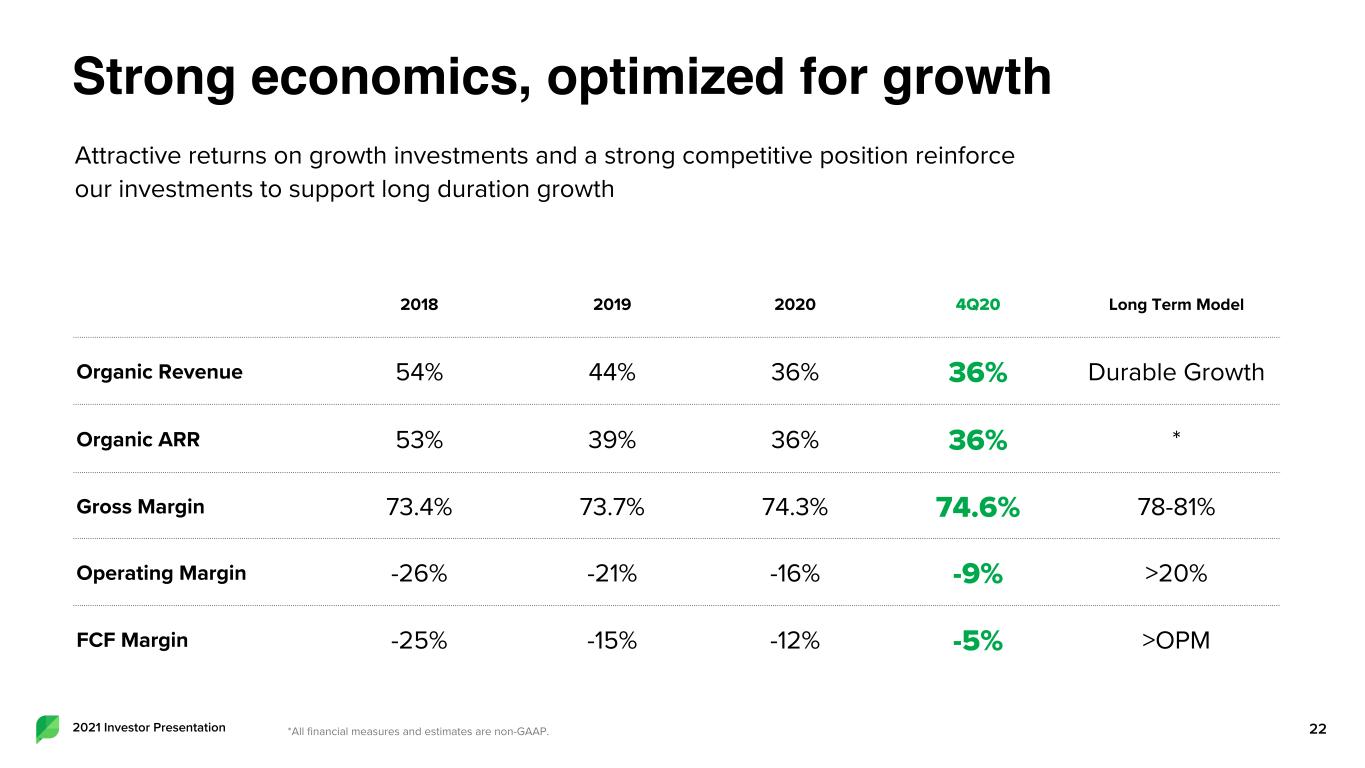
•Organic revenue (excluding the impact of legacy Simply Measured revenue) was up 36% compared to the fourth quarter of 2019.
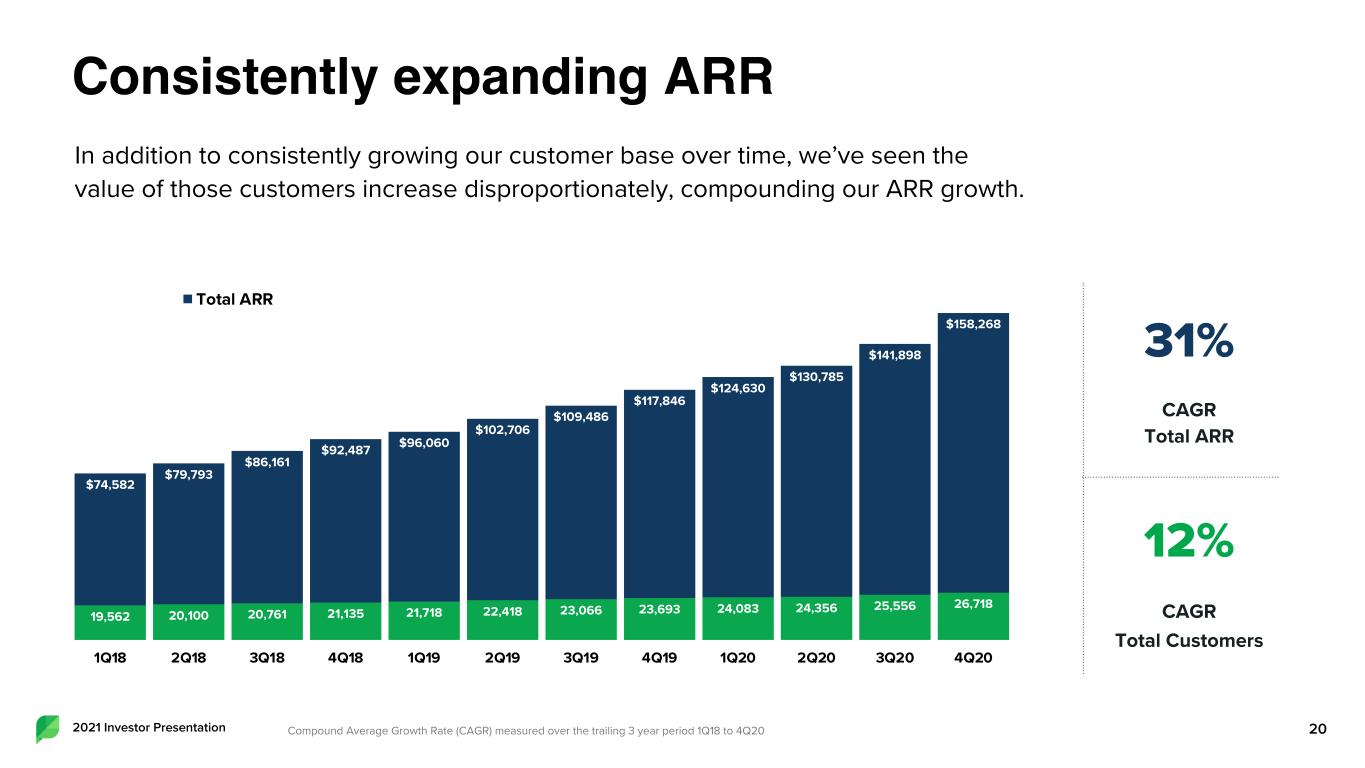
•Total ARR was $158.3 million, up 34% compared to the fourth quarter of 2019.
•Organic ARR was $157.2 million, up 36% compared to the fourth quarter of 2019.
Operating Loss
•GAAP operating loss was ($5.8) million, compared to ($25.9) million in the fourth quarter of 2019. Expenses during the fourth quarter of 2019 included one-time costs associated with the Company’s IPO.
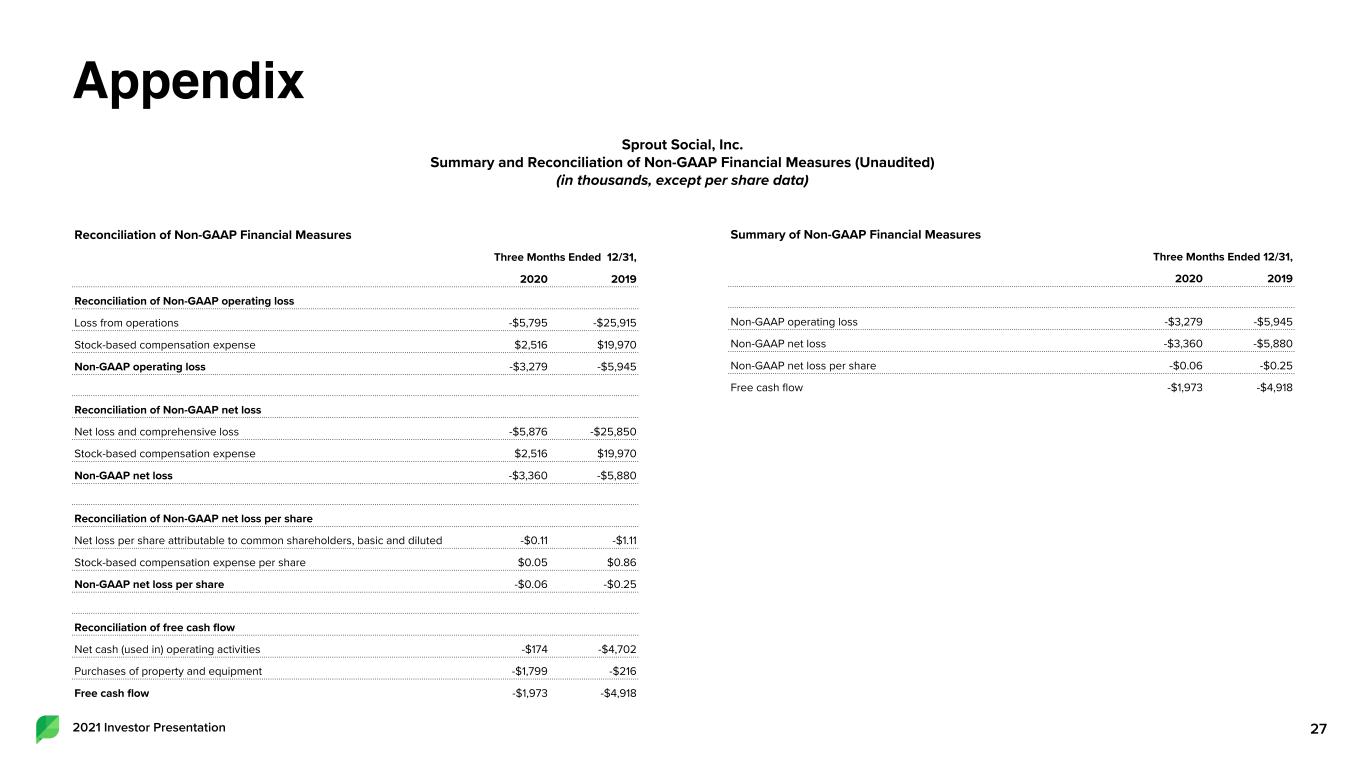
•Non-GAAP operating loss was ($3.3) million, compared to ($5.9) million in the fourth quarter of 2019.
Net Loss
•GAAP net loss was ($5.9) million, compared to ($25.9) million in the fourth quarter of 2019.
•Non-GAAP net loss was ($3.4) million, compared to ($5.9) million in the fourth quarter of 2019.
•GAAP net loss per share was ($0.11) based on 53.1 million weighted-average shares of common stock outstanding, compared to ($1.11) based on 23.2 million weighted-average shares of common stock outstanding in the fourth quarter of 2019.
•Non-GAAP net loss per share was ($0.06) based on 53.1 million weighted-average shares of common stock outstanding, compared to ($0.25) based on 23.2 million weighted-average shares of common stock outstanding in the fourth quarter of 2019.
Cash
•Cash and equivalents and marketable securities totaled $163.9 million as of December 31, 2020, down from $167.3 million as of September 30, 2020.
•Net cash used by operating activities was ($0.2) million, compared to ($4.7) million in the fourth quarter of 2019.
•Free cash flow was ($2.0) million, compared to ($4.9) million in the fourth quarter of 2019.
See “Customer Metrics” and “Use of Non-GAAP Financial Measures” below for how Sprout Social defines total ARR, organic ARR, non-GAAP operating loss, non-GAAP net loss, non-GAAP net loss per share and free cash flow and the financial tables that accompany this release for reconciliations of these measures to their closest comparable GAAP measures.
Fiscal Year 2020 Financial Highlights
Revenue
•Total revenue was $132.9 million, up 29% compared to fiscal 2019.
•Organic revenue (excluding the impact of legacy Simply Measured revenue) was up 36% compared to fiscal 2019.
Operating Loss
•GAAP operating loss was ($32.0) million, compared to ($47.3) million in fiscal 2019.
•Non-GAAP operating loss was ($20.9) million, compared to ($21.9) million in fiscal 2019.
Customer Metrics
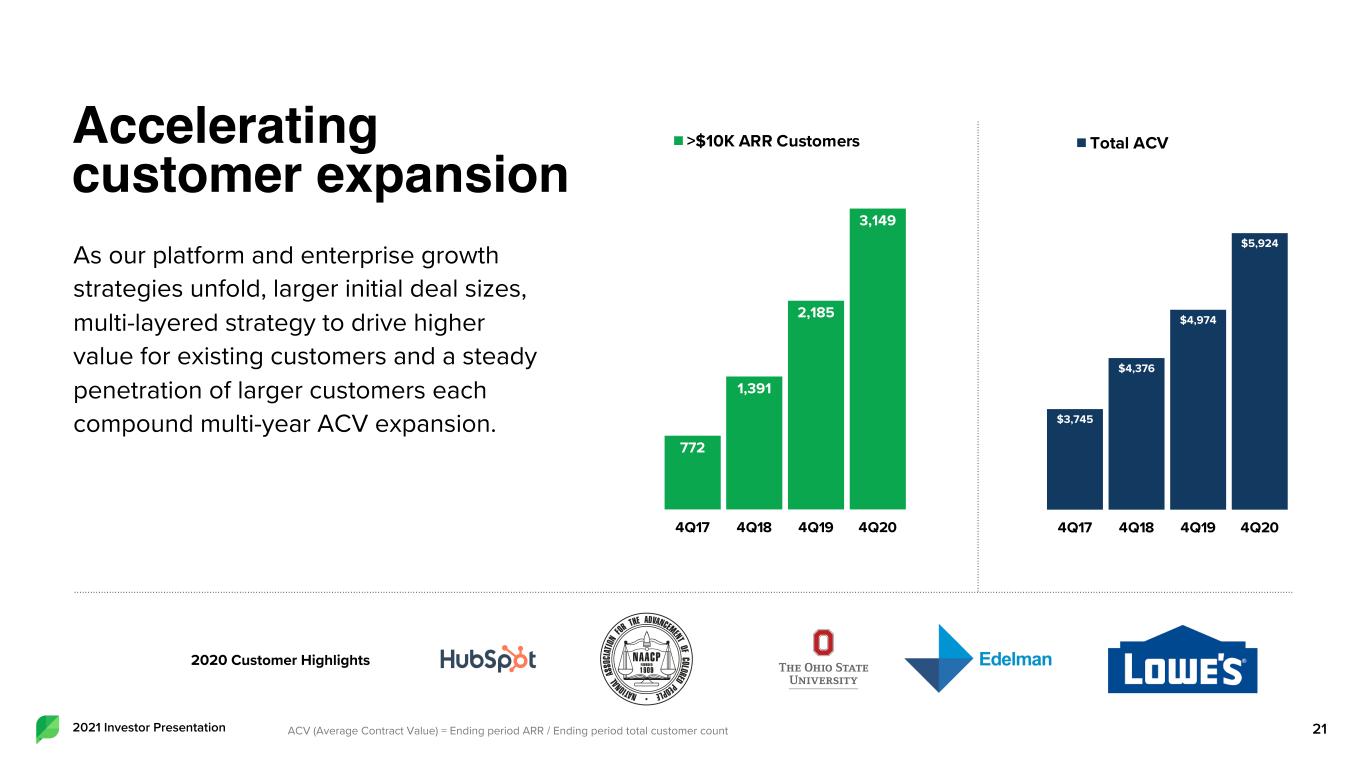
•Grew number of customers to 26,718 as of December 31, 2020, up from 25,556 customers as of September 30, 2020, and up from 23,693 customers as of December 31, 2019.
•Grew number of customers contributing over $10,000 in ARR to 3,149 customers as of December 31, 2020, up 44% compared to December 31, 2019.
•Dollar-based net retention rate was 110% in 2020, consistent with 110% in 2019.
•Dollar-based net retention rate excluding small-and-medium-sized business (SMB) customers was 117% in 2020, compared with 120% in 2019.
•We estimate the impact from COVID-19 on our business was largely isolated to Q2 of 2020 and adversely impacted our dollar-based net retention rate and our dollar-based net retention rate excluding SMB customers. This impact was transitory and resulted in elevated SMB churn and slower expansion activity in our agency & mid-market segments.
•Dollar-based net retention rate in Q4 of 2020 was greater than 110% and our dollar-based net retention rate excluding SMB customers in Q4 of 2020 was greater than 120%.
Recent Customer Highlights
•During the fourth quarter, we had the opportunity to help new customers like Panera Bread, WW USA, PagerDuty and the University of Mississippi. We executed growth deals with great brands like RingCentral, Wipro, Radisson Hotel Group, Eddie Bauer, Udemy and Pure Gyms.
Business Awards
Sprout Social was recently:
•Recognized as one of Glassdoor’s Best Places to Work in 2021.
•Recognized by G2 as one of the 2021 Best Software Companies].
•Recognized as #2 on Battery Venture’s 25 Highest Rated Public Cloud Computing Companies to Work for During the COVID Crisis.
First Quarter and 2021 Financial Outlook
For the first quarter of 2021, the Company currently expects:
•Total revenue between $39.6 and $39.7 million, or overall growth of 30%.
•We estimate that our organic growth rate will be 100-300bps faster than our overall growth rate in the first quarter. This will be the final quarter in which our organic growth rate and reported growth rate will be materially different and we do not expect to disclose this difference in future periods.
•Non-GAAP operating loss between ($5.4) million and ($5.0) million.
•Non-GAAP net loss per share of between ($0.11) and ($0.10) based on approximately 53.4 million weighted average basic shares of common stock outstanding.
“We are pleased with our Q4 performance,” said Joe Del Preto, CFO. “Our operating budget for 2021 is fully funded with strong investment plans across the company, which we believe will enable us to capitalize on multiple rapidly emerging trends in our market. That said, our investments are paying off and the leverage in our business is compelling. We expect to deliver healthy year-over-year operating margin expansion, even as we continue to optimize for growth in 2021 and beyond.”
For the full year 2021, the Company is issuing guidance to reflect the following:
•Total revenue between $172 to $173 million, or overall growth of 30%.
•Non-GAAP operating loss between ($22.0) and ($19.0) million.
•At the midpoint of these ranges, this implies an (11.9%) operating margin and roughly 400bps of year-over-year operating margin improvement.
•Non-GAAP net loss per share of between ($0.40) and ($0.37) based on approximately 53.6 million weighted average basic shares of common stock outstanding.
The Company’s first quarter and 2021 financial outlook is based on a number of assumptions that are subject to change and many of which are outside the Company’s control, including the impact of COVID-19 on our financial performance and customer demand. If actual results vary from these assumptions, the Company’s expectations may change. There can be no assurance that the Company will achieve these results.
The Company does not provide guidance for operating loss, the most directly comparable GAAP measure to non-GAAP operating loss, or net loss per share, the most directly comparable GAAP measure to non-GAAP net loss per share, and similarly cannot provide a reconciliation between its forecasted non-GAAP operating loss and non-GAAP net loss per share and these comparable GAAP measures without unreasonable effort due to the unavailability of reliable estimates for certain items. These items are not within the Company’s control and may vary greatly between periods and could significantly impact future financial results.
Conference Call Information
The financial results and business highlights will be discussed on a conference call and webcast scheduled at 4:00 p.m. Central Time (5:00 p.m. Eastern Time) today, February 23, 2021. Online registration for this event conference call can be found at http://www.directeventreg.com/registration/event/1775795. The live webcast of the conference call can be accessed from Sprout Social’s investor relations website at http://investors.sproutsocial.com.
Following completion of the events, a webcast replay will also be available at http://investors.sproutsocial.com for 12 months.
About Sprout Social
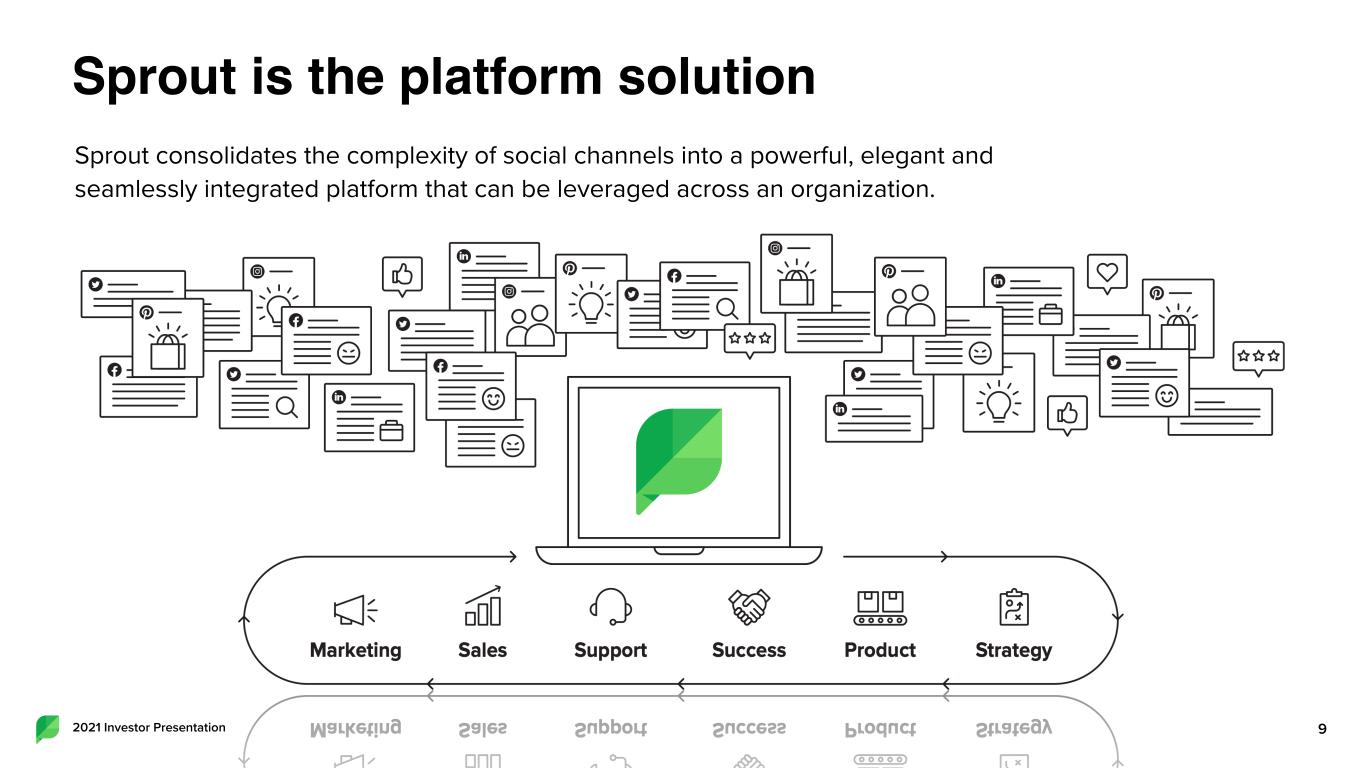
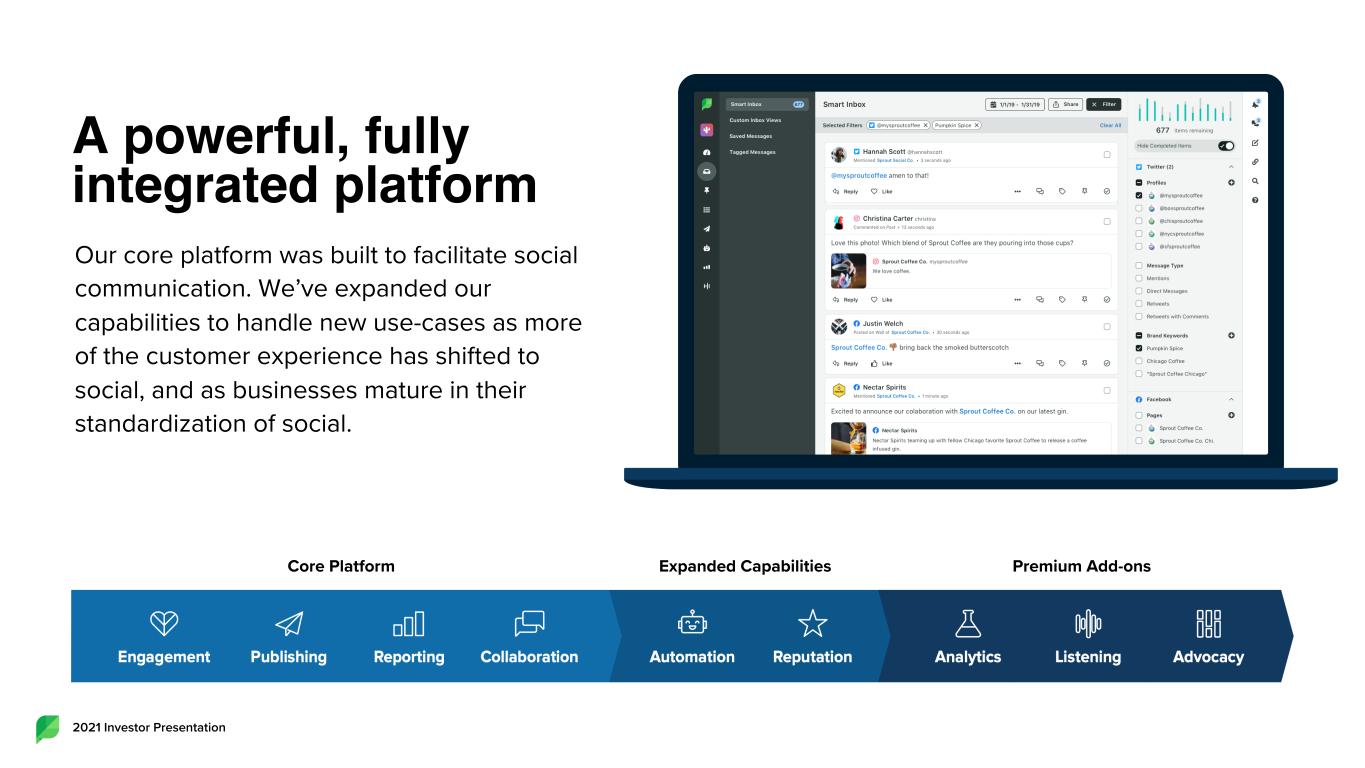
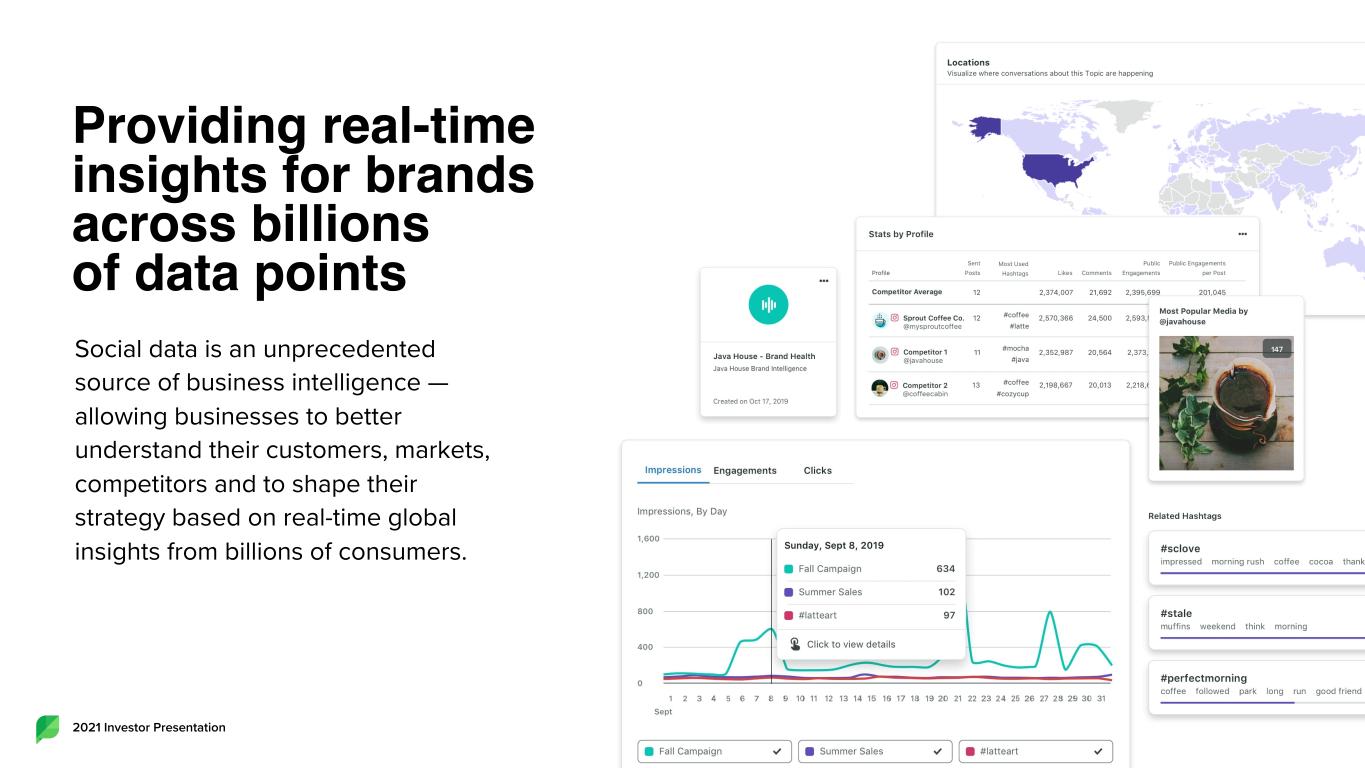
Sprout Social offers deep social media listening and analytics, social management, customer care and advocacy solutions to more than 26,000 brands and agencies worldwide. Sprout’s unified platform integrates the power of social throughout every aspect of a business and enables social leaders at every level to extract valuable data and insights that drive their business forward. Headquartered in Chicago, Sprout operates across major social media networks, including Twitter, Facebook, Instagram, Pinterest, YouTube and LinkedIn.
Forward-Looking Statements
This press release contains “forward-looking statements” within the meaning of Section 27A of the Securities Act of 1933, as amended, and Section 21E of the Securities Exchange Act of 1934, as amended. In some cases, you can identify forward-looking statements by terms such as “anticipate,” “believe,” “estimate,” “expect,” “intend,” “outlook,”
“may,” “might,” “plan,” “project,” “will,” “would,” “should,” “could,” “can,” “predict,” “potential,” “strategy, “target,” “explore,” “continue,” or the negative of these terms, and similar expressions intended to identify forward-looking statements. However, not all forward-looking statements contain these identifying words. These statements may relate to the impact on our business and the businesses of our prospective and existing customers of the COVID-19 pandemic, our market size and growth strategy, our estimated and projected costs, margins, revenue, expenditures and customer and financial growth rates, our Q1 and 2021 financial outlook, our plans and objectives for future operations, growth, initiatives or strategies. By their nature, these statements are subject to numerous uncertainties and risks, including factors beyond our control, that could cause actual results, performance or achievement to differ materially and adversely from those anticipated or implied in the forward-looking statements. These assumptions, uncertainties and risks include that, among others, the effects of the COVID-19 pandemic and the governmental actions taken to combat the pandemic may materially affect how we and our customers operate our businesses, and the duration and extent to which this threatens our future results of operations and overall financial performance remains uncertain, any decline in new customers, renewals or upgrades, our limited operating history makes it difficult to evaluate our prospects and future results of operations, we operate in competitive markets, we may not be able to sustain our revenue growth rate in the future, our business would be harmed by any significant interruptions, delays or outages in services from our platform or certain social media platforms, changing regulations relating to privacy, information security and data protection could increase our costs, affect or limit how we collect and use personal information and harm our brand, and a cybersecurity-related attack, significant data breach or disruption of the information technology systems or networks could negatively affect our business. Additional risks and uncertainties that could cause actual outcomes and results to differ materially from those contemplated by the forward-looking statements are included under the caption “Risk Factors” and elsewhere in our filings with the Securities and Exchange Commission (the “SEC”), including our Annual Report on Form 10-K for the year ended December 31, 2019 filed with the SEC on February 28, 2020, our Quarterly Report on Form 10-Q for the quarter ended March 31, 2020 filed with the SEC on May 7, 2020, our Quarterly Report on Form 10-Q for the quarter ended June 30, 2020 filed with the SEC on August 6, 2020, our Quarterly Report on Form 10-Q for the quarter ended September 30, 2020 filed with the SEC on November 10, 2020, and our Annual Report on Form 10-K for the year ended December 31, 2020 to be filed with the SEC, as well as any other future quarterly and current reports that we file with the SEC. Moreover, you should interpret many of the risks identified in those reports as being heightened as a result of the ongoing and numerous adverse impacts of the COVID-19 pandemic. Forward-looking statements speak only as of the date the statements are made and are based on information available to Sprout Social at the time those statements are made and/or management's good faith belief as of that time with respect to future events. Sprout Social assumes no obligation to update forward-looking statements to reflect events or circumstances after the date they were made, except as required by law.
Use of Non-GAAP Financial Measures
We have provided in this press release certain financial information that has not been prepared in accordance with generally accepted accounting principles in the United States (“GAAP”). Our management uses these non-GAAP financial measures internally in analyzing our financial results and believes that use of these non-GAAP financial measures is useful to investors as an additional tool to evaluate ongoing operating results and trends and in comparing our financial results with other companies in our industry, many of which present similar non-GAAP financial measures. Non-GAAP financial measures are not meant to be considered in isolation or as a substitute for comparable financial measures prepared in accordance with GAAP and should be read only in conjunction with our consolidated financial statements prepared in accordance with GAAP. A reconciliation of our historical non-GAAP financial measures to the most directly comparable GAAP measures has been provided in the financial statement tables included in this press release, and investors are encouraged to review these reconciliations.
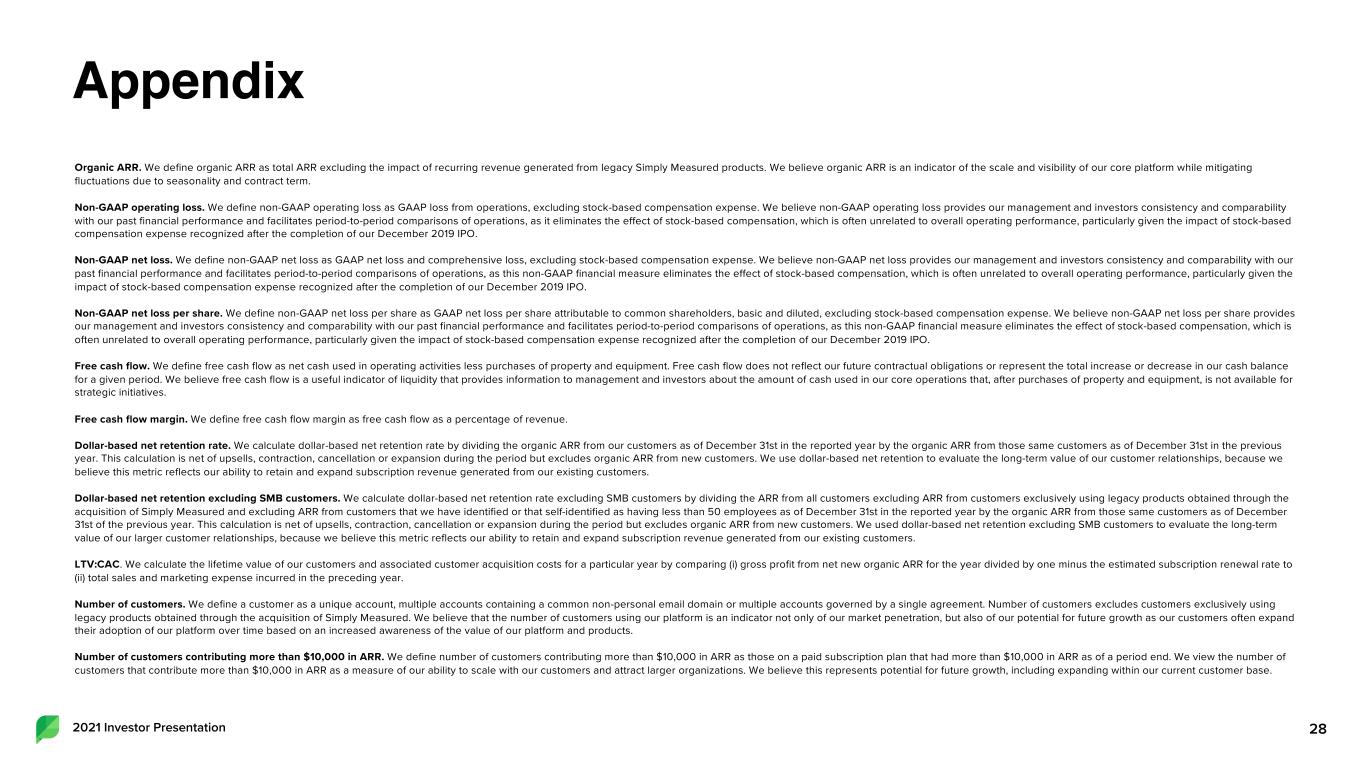
Non-GAAP operating loss. We define non-GAAP operating loss as GAAP loss from operations, excluding stock-based compensation expense. We believe non-GAAP operating loss provides our management and investors consistency and comparability with our past financial performance and facilitates period-to-period comparisons of operations, as it eliminates the effect of stock-based compensation, which is often unrelated to overall operating performance, particularly given the impact of stock-based compensation expense recognized after the completion of our December 2019 IPO.
Non-GAAP net loss. We define non-GAAP net loss as GAAP net loss and comprehensive loss, excluding stock-based compensation expense. We believe non-GAAP net loss provides our management and investors consistency and comparability with our past financial performance and facilitates period-to-period comparisons of operations, as this non-GAAP financial measure eliminates the effect of stock-based compensation, which is often unrelated to overall operating performance, particularly given the impact of stock-based compensation expense recognized after the completion of our December 2019 IPO.
Non-GAAP net loss per share. We define non-GAAP net loss per share as GAAP net loss per share attributable to common shareholders, basic and diluted, excluding stock-based compensation expense. We believe non-GAAP net loss per share provides our management and investors consistency and comparability with our past financial performance and facilitates period-to-period comparisons of operations, as this non-GAAP financial measure eliminates the effect of stock-based compensation, which is often unrelated to overall operating performance, particularly given the impact of stock-based compensation expense recognized after the completion of our December 2019 IPO.
Free cash flow. We define free cash flow as net cash used in operating activities less purchases of property and equipment. Free cash flow does not reflect our future contractual obligations or represent the total increase or decrease in our cash balance for a given period. We believe free cash flow is a useful indicator of liquidity that provides information to management and investors about the amount of cash used in our core operations that, after purchases of property and equipment, is not available for strategic initiatives.
Free cash flow margin. We define free cash flow margin as free cash flow as a percentage of revenue.
Customer Metrics
Dollar-based net retention rate. We calculate dollar-based net retention rate by dividing the organic ARR from our customers as of December 31st in the reported year by the organic ARR from those same customers as of December 31st in the previous year. This calculation is net of upsells, contraction, cancellation or expansion during the period but excludes organic ARR from new customers. We use dollar-based net retention to evaluate the long-term value of our customer relationships, because we believe this metric reflects our ability to retain and expand subscription revenue generated from our existing customers.
Dollar-based net retention rate excluding SMB customers. We calculate dollar-based net retention rate excluding SMB customers by dividing the ARR from all customers excluding ARR from customers exclusively using legacy products obtained through the acquisition of Simply Measured and excluding ARR from customers that we have identified or that self-identified as having less than 50 employees as of December 31st in the reported year by the organic ARR from those same customers as of December 31st of the previous year. This calculation is net of upsells, contraction, cancellation or expansion during the period but excludes organic ARR from new customers. We used dollar-based net retention excluding SMB customers to evaluate the long-term value of our larger customer relationships, because we believe this metric reflects our ability to retain and expand subscription revenue generated from our existing customers.
Number of customers. We define a customer as a unique account, multiple accounts containing a common non-personal email domain or multiple accounts governed by a single agreement. Number of customers excludes customers exclusively using legacy products obtained through the acquisition of Simply Measured. We believe that the number of customers using our platform is an indicator not only of our market penetration, but also of our potential for future growth as our customers often expand their adoption of our platform over time based on an increased awareness of the value of our platform and products.
Number of customers contributing more than $10,000 in ARR. We define number of customers contributing more than $10,000 in ARR as those on a paid subscription plan that had more than $10,000 in ARR as of a period end. We view the number of customers that contribute more than $10,000 in ARR as a measure of our ability to scale with our customers and attract larger organizations. We believe this represents potential for future growth, including expanding within our current customer base.
Total annual recurring revenue (“total ARR”). We define total ARR as the annualized revenue run-rate of subscription agreements from all customers as of the last date of the specified period. We believe total ARR is an indicator of the scale of our entire platform while mitigating fluctuations due to seasonality and contract term.
Organic ARR. We define organic ARR as total ARR excluding the impact of recurring revenue generated from legacy Simply Measured products. We believe organic ARR is an indicator of the scale and visibility of our core platform while mitigating fluctuations due to seasonality and contract term.
Availability of Information on Sprout Social’s Website and Social Media Profiles
Investors and others should note that Sprout Social routinely announces material information to investors and the marketplace using SEC filings, press releases, public conference calls, webcasts and the Sprout Social Investors website. We also intend to use the social media profiles listed below as a means of disclosing information about us to our customers, investors and the public. While not all of the information that the Company posts to the Sprout Social Investors website or to social media profiles is of a material nature, some information could be deemed to be material. Accordingly, the Company encourages investors, the media, and others interested in Sprout Social to review the information that it shares at the Investors link located at the bottom of the page on www.sproutsocial.com and to regularly follow our social media profiles. Users may automatically receive email alerts and other information about Sprout Social when enrolling an email address by visiting "Email Alerts" in the "Shareholder Services" section of Sprout Social's Investor website at https://investors.sproutsocial.com/.
Social Media Profiles:
www.twitter.com/SproutSocial
www.facebook.com/SproutSocialInc
www.linkedin.com/company/sprout-social-inc-/
www.instagram.com/sproutsocial
Contact
Media:
Kaitlyn Gronek
Email: [email protected]
Phone: (773) 904-9674
Investors:
Jason Rechel
Email: [email protected]
Phone: (312) 528-9166
Sprout Social, Inc. | |||||||||||
Consolidated Statements of Operations and Comprehensive Loss (Unaudited) | |||||||||||
(in thousands, except share and per share data) | |||||||||||
Three Months Ended December 31, | |||||||||||
2020 | 2019 | ||||||||||
Revenue | |||||||||||
Subscription | $ 36,915 | $ 27,958 | |||||||||
Professional services and other | 431 | 186 | |||||||||
Total revenue | 37,346 | 28,144 | |||||||||
Cost of revenue(1) | |||||||||||
Subscription | 9,344 | 8,749 | |||||||||
Professional services and other | 271 | 117 | |||||||||
Total cost of revenue | 9,615 | 8,866 | |||||||||
Gross profit | 27,731 | 19,278 | |||||||||
Operating expenses | |||||||||||
Research and development(1) | 7,805 | 8,922 | |||||||||
Sales and marketing(1) | 16,285 | 21,510 | |||||||||
General and administrative(1) | 9,436 | 14,761 | |||||||||
Total operating expenses | 33,526 | 45,193 | |||||||||
Loss from operations | (5,795) | (25,915) | |||||||||
Interest expense | (81) | (71) | |||||||||
Interest income | 54 | 51 | |||||||||
Other income | 1 | 102 | |||||||||
Loss before income taxes | (5,821) | (25,833) | |||||||||
Income tax expense | 55 | 17 | |||||||||
Net loss and comprehensive loss | $ (5,876) | $ (25,850) | |||||||||
Net loss per share attributable to common shareholders, basic and diluted | $ (0.11) | $ (1.11) | |||||||||
Weighted-average shares outstanding used to compute net loss per share, basic and diluted | 53,145,198 | 23,213,019 | |||||||||
(1) Includes stock-based compensation expense as follows: | |||||||||||
Three Months Ended December 31, | |||||||||||
2020 | 2019 | ||||||||||
Cost of revenue | $ 132 | $1,126 | |||||||||
Research and development | 492 | 2,290 | |||||||||
Sales and marketing | 631 | 8,697 | |||||||||
General and administrative | 1,261 | 7,857 | |||||||||
Total stock-based compensation expense | $ 2,516 | $ 19,970 | |||||||||
Sprout Social, Inc. | |||||||||||
Consolidated Statements of Operations and Comprehensive Loss (Unaudited) | |||||||||||
(in thousands, except share and per share data) | |||||||||||
Twelve Months Ended December 31, | |||||||||||
2020 | 2019 | ||||||||||
Revenue | |||||||||||
Subscription | $ 131,804 | $ 102,243 | |||||||||
Professional services and other | 1,145 | 464 | |||||||||
Total revenue | 132,949 | 102,707 | |||||||||
Cost of revenue(1) | |||||||||||
Subscription | 34,196 | 27,862 | |||||||||
Professional services and other | 721 | 292 | |||||||||
Total cost of revenue | 34,917 | 28,154 | |||||||||
Gross profit | 98,032 | 74,553 | |||||||||
Operating expenses | |||||||||||
Research and development(1) | 30,491 | 28,059 | |||||||||
Sales and marketing(1) | 59,137 | 55,584 | |||||||||
General and administrative(1) | 40,406 | 38,178 | |||||||||
Total operating expenses | 130,034 | 121,821 | |||||||||
Loss from operations | (32,002) | (47,268) | |||||||||
Interest expense | (366) | (270) | |||||||||
Interest income | 617 | 307 | |||||||||
Other income | 223 | 490 | |||||||||
Loss before income taxes | (31,528) | (46,741) | |||||||||
Income tax expense | 127 | 66 | |||||||||
Net loss and comprehensive loss | $ (31,655) | $ (46,807) | |||||||||
Net loss per share attributable to common shareholders, basic and diluted | $ (0.62) | $ (2.54) | |||||||||
Weighted-average shares outstanding used to compute net loss per share, basic and diluted | 51,368,737 | 18,438,695 | |||||||||
(1) Includes stock-based compensation expense as follows: | |||||||||||
Twelve Months Ended December 31, | |||||||||||
2020 | 2019 | ||||||||||
Cost of revenue | $ 749 | $ 1,126 | |||||||||
Research and development | 1,935 | 2,290 | |||||||||
Sales and marketing | 2,464 | 8,697 | |||||||||
General and administrative | 5,931 | 13,220 | |||||||||
Total stock-based compensation expense | $ 11,079 | $25,333 | |||||||||
Sprout Social, Inc. | |||||||||||
Consolidated Balance Sheets (Unaudited) | |||||||||||
(in thousands, except share and per share data) | |||||||||||
December 31, 2020 | December 31, 2019 | ||||||||||
Assets | |||||||||||
Current assets | |||||||||||
Cash and cash equivalents | $ 114,515 | $ 135,310 | |||||||||
Marketable securities | 49,364 | - | |||||||||
Accounts receivable, net of allowances of $1,428 and $706 at December 31, 2020 and December 31, 2019, respectively | 17,178 | 11,099 | |||||||||
Deferred Commissions | 8,622 | 5,574 | |||||||||
Prepaid expenses and other assets | 9,651 | 5,050 | |||||||||
Total current assets | 199,330 | 157,033 | |||||||||
Property and equipment, net | 14,925 | 13,529 | |||||||||
Deferred commissions, net of current portion | 8,757 | 5,505 | |||||||||
Operating lease, right-of-use asset | 10,132 | 5,618 | |||||||||
Goodwill | 2,299 | 2,299 | |||||||||
Intangible assets, net | 4,088 | 5,482 | |||||||||
Other assets, net | 138 | 125 | |||||||||
Total assets | $ 239,669 | $ 189,591 | |||||||||
Liabilities and Stockholders' Equity | |||||||||||
Current liabilities | |||||||||||
Accounts payable | $ 1,543 | $ 2,049 | |||||||||
Deferred revenue | 43,407 | 29,566 | |||||||||
Operating lease liability | 2,155 | 2,331 | |||||||||
Accrued wages and payroll related benefits | 9,885 | 4,053 | |||||||||
Accrued expenses and other | 6,587 | 5,057 | |||||||||
Total current liabilities | 63,577 | 43,056 | |||||||||
Deferred revenue, net of current portion | 355 | 209 | |||||||||
Operating lease liability, net of current portion | 23,638 | 18,196 | |||||||||
Total liabilities | 87,570 | 61,461 | |||||||||
Stockholders' equity | |||||||||||
Class A common stock, par value $0.0001 per share; 1,000,000,000 shares authorized; 46,698,354 and 43,898,850 shares issued and outstanding at December 31, 2020, respectively; 41,714,870 and 39,041,065 shares issued and outstanding at December 31, 2019, respectively | 4 | 4 | |||||||||
Class B common stock, par value $0.0001 per share; 25,000,000 shares authorized; 9,574,566 and 9,367,622 shares issued and outstanding at December 31, 2020, respectively; 9,803,933 shares issued and outstanding at December 31, 2019 | 1 | 1 | |||||||||
Additional paid-in capital | 328,343 | 263,943 | |||||||||
Treasury stock, at cost | (29,206) | (20,430) | |||||||||
Accumulated deficit | (147,043) | (115,388) | |||||||||
Total stockholders’ equity | 152,099 | 128,130 | |||||||||
Total liabilities and stockholders’ equity | $ 239,669 | $ 189,591 | |||||||||
Sprout Social, Inc. | |||||||||||
Consolidated Statements of Cash Flows (Unaudited) | |||||||||||
(in thousands) | |||||||||||
Three Months Ended December 31, | |||||||||||
2020 | 2019 | ||||||||||
Cash flows from operating activities | |||||||||||
Net loss | $ (5,876) | $ (25,850) | |||||||||
Adjustments to reconcile net loss to net cash (used in) operating activities | |||||||||||
Depreciation of property and equipment | 718 | 705 | |||||||||
Amortization of line of credit issuance costs | 44 | 45 | |||||||||
Amortization of premium on investments | 195 | - | |||||||||
Amortization of acquired intangible assets | 324 | 376 | |||||||||
Amortization of deferred commissions | 2,290 | 1,432 | |||||||||
Amortization of right-of-use operating lease asset | 142 | 245 | |||||||||
Stock-based compensation expense | 2,516 | 19,970 | |||||||||
Provision for accounts receivable allowances | 123 | 1,033 | |||||||||
Changes in operating assets and liabilities | |||||||||||
Accounts receivable | (2,893) | (1,844) | |||||||||
Prepaid expenses and other current assets | (5,076) | (1,817) | |||||||||
Deferred commissions | (5,014) | (3,248) | |||||||||
Accounts payable and accrued expenses | 5,922 | 1,763 | |||||||||
Deferred revenue | 6,266 | 3,138 | |||||||||
Lease liabilities | 145 | (650) | |||||||||
Net cash (used in) operating activities | (174) | (4,702) | |||||||||
Cash flows from investing activities | |||||||||||
Purchases of property and equipment | (1,799) | (216) | |||||||||
Purchases of short-term investments | (3,421) | - | |||||||||
Proceeds from maturity of investments | 3,356 | - | |||||||||
Net cash (used in) investing activities | (1,864) | (216) | |||||||||
Cash flows from financing activities | |||||||||||
Proceeds from initial public offering, net of underwriters' discounts and commissions | - | 139,500 | |||||||||
Payments for line of credit issuance costs | (69) | (101) | |||||||||
Proceeds from exercise of stock options | 8 | 30 | |||||||||
Proceeds from disgorgement of stockholders short-swing profits | 1,137 | - | |||||||||
Employee taxes paid related to the net share settlement of stock-based awards | (2,301) | (8,125) | |||||||||
Payments of deferred offering costs | - | (3,676) | |||||||||
Net cash provided by (used in) financing activities | (1,225) | 127,628 | |||||||||
Net increase (decrease) in cash and cash equivalents | (3,263) | 122,710 | |||||||||
Cash and cash equivalents | |||||||||||
Beginning of period | 117,778 | 12,600 | |||||||||
End of period | $ 114,515 | $ 135,310 | |||||||||
Sprout Social, Inc. | |||||||||||
Consolidated Statements of Cash Flows (Unaudited) | |||||||||||
(in thousands) | |||||||||||
Twelve Months Ended December 31, | |||||||||||
2020 | 2019 | ||||||||||
Cash flows from operating activities | |||||||||||
Net loss | $ (31,655) | $ (46,807) | |||||||||
Adjustments to reconcile net loss to net cash (used in) operating activities | |||||||||||
Depreciation of property and equipment | 2,838 | 2,736 | |||||||||
Amortization of line of credit issuance costs | 215 | 194 | |||||||||
Amortization of premium on investments | 423 | - | |||||||||
Amortization of acquired intangible assets | 1,394 | 1,532 | |||||||||
Amortization of deferred commissions | 7,702 | 4,812 | |||||||||
Amortization of right-of-use operating lease asset | 1,053 | 1,056 | |||||||||
Stock-based compensation expense | 11,079 | 25,333 | |||||||||
Provision for accounts receivable allowances | 2,005 | 2,208 | |||||||||
Changes in operating assets and liabilities | |||||||||||
Accounts receivable | (8,083) | (2,756) | |||||||||
Prepaid expenses and other current assets | (4,737) | (2,657) | |||||||||
Deferred commissions | (14,002) | (8,170) | |||||||||
Accounts payable and accrued expenses | 6,635 | 1,430 | |||||||||
Deferred revenue | 13,987 | 8,235 | |||||||||
Lease liabilities | (206) | (1,560) | |||||||||
Net cash (used in) operating activities | (11,352) | (14,414) | |||||||||
Cash flows from investing activities | |||||||||||
Purchases of property and equipment | (4,015) | (760) | |||||||||
Purchases of short-term investments | (53,143) | - | |||||||||
Proceeds from maturity of investments | 3,356 | - | |||||||||
Net cash (used in) investing activities | (53,802) | (760) | |||||||||
Cash flows from financing activities | |||||||||||
Proceeds from initial public offering, net of underwriters' discounts and commissions | - | 139,500 | |||||||||
Proceeds from underwriters' purchase of over-allotment shares, related to the Company's initial public offering, net of underwriters' discounts and commissions | 9,954 | - | |||||||||
Proceeds from follow-on offering of common stock, net of underwriters' discounts and commissions | 42,127 | - | |||||||||
Payments for line of credit issuance costs | (187) | (148) | |||||||||
Proceeds from exercise of stock options | 370 | 92 | |||||||||
Proceeds from disgorgement of stockholders short-swing profits | 1,137 | - | |||||||||
Employee taxes paid related to the net share settlement of stock-based awards | (8,636) | (9,923) | |||||||||
Payments of deferred offering costs | (406) | (5,227) | |||||||||
Net cash provided by (used in) financing activities | 44,359 | 124,294 | |||||||||
Net (decrease) in cash and cash equivalents | (20,795) | 109,120 | |||||||||
Cash and cash equivalents | |||||||||||
Beginning of period | 135,310 | 26,190 | |||||||||
End of period | $ 114,515 | $ 135,310 | |||||||||
The following schedule reflects our non-GAAP financial measures and reconciles our non-GAAP financial measures to the related GAAP financial measures (in thousands, except per share data):
Summary of Non-GAAP Financial Measures | |||||||||||||||||||||||
Three Months Ended December 31, | Twelve Months Ended December 31, | ||||||||||||||||||||||
2020 | 2019 | 2020 | 2019 | ||||||||||||||||||||
Non-GAAP operating loss | $ (3,279) | $ (5,945) | $ (20,923) | $ (21,935) | |||||||||||||||||||
Non-GAAP net loss | (3,360) | (5,880) | (20,576) | (21,474) | |||||||||||||||||||
Non-GAAP net loss per share | (0.06) | (0.25) | (0.40) | (1.16) | |||||||||||||||||||
Free cash flow | $ (1,973) | $ (4,918) | $ (15,367) | $ (15,174) | |||||||||||||||||||
Reconciliation of Non-GAAP Financial Measures | |||||||||||||||||||||||
Three Months Ended December 31, | Twelve Months Ended December 31, | ||||||||||||||||||||||
2020 | 2019 | 2020 | 2019 | ||||||||||||||||||||
Reconciliation of Non-GAAP operating loss | |||||||||||||||||||||||
Loss from operations | $ (5,795) | $ (25,915) | $(32,002) | $(47,268) | |||||||||||||||||||
Stock-based compensation expense | 2,516 | 19,970 | 11,079 | 25,333 | |||||||||||||||||||
Non-GAAP operating loss | $ (3,279) | $ (5,945) | $ (20,923) | $ (21,935) | |||||||||||||||||||
Reconciliation of Non-GAAP net loss | |||||||||||||||||||||||
Net loss and comprehensive loss | $ (5,876) | $ (25,850) | $(31,655) | $(46,807) | |||||||||||||||||||
Stock-based compensation expense | 2,516 | 19,970 | 11,079 | 25,333 | |||||||||||||||||||
Non-GAAP net loss | $ (3,360) | $ (5,880) | $ (20,576) | $ (21,474) | |||||||||||||||||||
Reconciliation of Non-GAAP net loss per share | |||||||||||||||||||||||
Net loss per share attributable to common shareholders, basic and diluted | $ (0.11) | $ (1.11) | $ (0.62) | $ (2.54) | |||||||||||||||||||
Stock-based compensation expense per share | 0.05 | 0.86 | 0.22 | 1.38 | |||||||||||||||||||
Non-GAAP net loss per share | $ (0.06) | $ (0.25) | $ (0.40) | $ (1.16) | |||||||||||||||||||
Reconciliation of free cash flow | |||||||||||||||||||||||
Net cash (used in) operating activities | $ (174) | $ (4,702) | $(11,352) | $(14,414) | |||||||||||||||||||
Purchases of property and equipment | (1,799) | (216) | (4,015) | (760) | |||||||||||||||||||
Free cash flow | $ (1,973) | $ (4,918) | $ (15,367) | $ (15,174) | |||||||||||||||||||