spt-20231102
0001517375false00015173752023-11-022023-11-02

UNITED STATES
SECURITIES AND EXCHANGE COMMISSION
Washington, D.C. 20549
FORM 8-K
CURRENT REPORT
PURSUANT TO SECTION 13 OR 15(d) OF THE
SECURITIES EXCHANGE ACT OF 1934
Date of report (Date of earliest event reported): November 2, 2023
Sprout Social, Inc.
(Exact Name of Registrant as Specified in its Charter)
Delaware001-3915627-2404165
(State or Other Jurisdiction
of Incorporation)
(Commission
File Number)
(IRS Employer
Identification No.)
131 South Dearborn St., Suite 70060603
Chicago,Illinois
(Address of Principal Executive Offices)(Zip Code)

(866) 878-3231
(Registrant’s telephone number, including area code)
Not applicable
(Former Name or Former Address, if Changed Since Last Report)
Check the appropriate box below if the Form 8-K filing is intended to simultaneously satisfy the filing obligation of the registrant under any of the following provisions:
Written communications pursuant to Rule 425 under the Securities Act (17 CFR 230.425)
Soliciting material pursuant to Rule 14a-12 under the Exchange Act (17 CFR 240.14a-12)
Pre-commencement communications pursuant to Rule 14d-2(b) under the Exchange Act (17 CFR 240.14d-2(b))
Pre-commencement communications pursuant to Rule 13e-4(c) under the Exchange Act (17 CFR 240.13e-4(c))

Securities registered pursuant to Section 12(b) of the Act:
Title of each classTrading Symbol(s)Name of each exchange on which registered
Class A Common Stock, $0.0001 par value per shareSPTThe Nasdaq Stock Market LLC

Indicate by check mark whether the registrant is an emerging growth company as defined in Rule 405 of the Securities Act of 1933 (§230.405 of this chapter) or Rule 12b-2 of the Securities Exchange Act of 1934 (§240.12b-2 of this chapter).
Emerging growth company  
If an emerging growth company, indicate by check mark if the registrant has elected not to use the extended transition period for complying with any new or revised financial accounting standards provided pursuant to Section 13(a) of the Exchange Act 


Item 2.02. Results of Operations and Financial Condition.
    On November 2, 2023, Sprout Social, Inc. (the “Company”) issued a press release announcing its results for the quarter ended September 30, 2023, and providing its business outlook. A copy of the press release is attached as Exhibit 99.1 to this Current Report on Form 8-K and is incorporated herein by reference.

Item 7.01 Regulation FD Disclosure.

    On November 2, 2023, the Company posted an investor presentation to its website at https://investors.sproutsocial.com (the “Investor Presentation”). A copy of the Investor Presentation is attached as Exhibit 99.2 to this Current Report on Form 8-K and is incorporated herein by reference. The Company expects to use the Investor Presentation, in whole or in part, and possibly with modifications, in connection with presentations to investors, analysts and others.

    The information contained in the Investor Presentation is summary information that is intended to be considered in the context of the Company’s Securities and Exchange Commission (“SEC”) filings and other public announcements that the Company may make, by press release or otherwise, from time to time. The Investor Presentation speaks only as of the date of this Current Report on Form 8-K. The Company undertakes no duty or obligation to publicly update or revise the information contained in the Investor Presentation, although it may do so from time to time. Any such updating may be made through the filing of other reports or documents with the SEC, through press releases or through other public disclosure. In addition, the exhibit furnished herewith contains statements intended as “forward-looking statements” that are subject to the cautionary statements about forward-looking statements set forth in such exhibit. By furnishing the information contained in the Investor Presentation, the Company makes no admission as to the materiality of any information in the Investor Presentation that is required to be disclosed solely by reason of Regulation FD.

    This Current Report on Form 8-K and its contents (including Exhibits 99.1 and 99.2) are furnished and shall not be deemed “filed” for purposes of Section 18 of the Securities Exchange Act of 1934, as amended (the “Exchange Act”), or otherwise subject to the liabilities of that section or Sections 11 and 12(a)(2) of the Securities Act of 1933, as amended (the “Securities Act”), nor shall it be deemed incorporated by reference in any filing under the Securities Act or the Exchange Act, regardless of any general incorporation language in such filing, except as shall be expressly set forth by specific reference in such filing.
Note Regarding Forward-Looking Statements
Certain statements in this Current Report on Form 8-K constitute “forward-looking statements” within the meaning of the federal securities laws. These statements are based on management’s current opinions, expectations, beliefs, plans, objectives, assumptions or projections regarding future events or future results. These forward-looking statements are only predictions, not historical fact, and involve certain risks and uncertainties, as well as assumptions. Actual results, levels of activity, performance, achievements and events could differ materially from those stated, anticipated or implied by such forward-looking statements. While the Company believes that its assumptions are reasonable, it is very difficult to predict the impact of known factors, and, of course, it is impossible to anticipate all factors that could affect actual results. There are many risks and uncertainties that could cause actual results to differ materially from forward-looking statements made herein including the risks discussed under the heading “Risk Factors” in the Company’s Annual Report on Form 10-K for the year ended December 31, 2022 filed with the SEC on February 23, 2023, as supplemented by the Company's Quarterly Report on Form 10-Q for the quarter ended June 30, 2023 filed with the SEC on August 4, 2023, and the Company's Quarterly Report on Form 10-Q for the quarter ended September 30, 2023 to be filed with the SEC, as well as other factors described from time to time in the Company's other filings with the SEC. Such forward-looking statements are made only as of the date of this Current Report on Form 8-K. The Company undertakes no obligation to publicly update or revise any forward-looking statement because of new information, future events or otherwise, except as otherwise required by law. If it does update one or more forward-looking statements, no inference should be made that the Company will make additional updates with respect to those or other forward-looking statements.
Item 9.01. Financial Statements and Exhibits.

(d)Exhibits.


Exhibit No. Description
99.1
99.2
104Cover page interactive data file (embedded within the inline XBRL document).

SIGNATURE
Pursuant to the requirements of the Securities Exchange Act of 1934, the registrant has duly caused this report to be signed on its behalf by the undersigned hereunto duly authorized.
SPROUT SOCIAL, INC.
  
  
By:/s/ Heidi Jonas
Name:Heidi Jonas
Title:General Counsel and Secretary
Date: November 2, 2023


Sprout Social Announces Third Quarter 2023 Financial Results Above Guidance Range Raises 2023 Guidance CHICAGO, November 2, 2023 – Sprout Social, Inc. (“Sprout Social”, the “Company”) (Nasdaq: SPT), an industry-leading provider of cloud-based social media management software, today announced financial results for its third quarter ended September 30, 2023. “We’re pleased to share incredibly strong third quarter results,” said Justyn Howard, Sprout Social’s CEO and co-founder. “We're building an enduring software company centered on amazing products, amazing people and overdelivering for our customers every day. Our fantastic business results and outlook reflect strong execution against these goals.” Third Quarter 2023 Financial Highlights Revenue ● Revenue was $85.5 million, up 31% compared to the third quarter of 2022. ● ARR was $359.5 million, up 33% compared to the third quarter of 2022. ● Total remaining performance obligations (RPO) of $228.7M, up 67% year-over-year. Operating Loss ● GAAP operating loss was ($24.2) million, compared to ($14.4) million in the third quarter of 2022. ● Non-GAAP operating loss was ($0.6) million, compared to a Non-GAAP operating loss of ($1.4) million in the third quarter of 2022. Net Loss ● GAAP net loss was ($23.0) million, compared to ($13.9) million in the third quarter of 2022. ● Non-GAAP net loss was ($0.6) million, compared to a Non-GAAP net loss of ($1.0) million in the third quarter of 2022. ● GAAP net loss per share was ($0.41) based on 55.8 million weighted-average shares of common stock outstanding, compared to ($0.25) based on 54.7 million weighted-average shares of common stock outstanding in the third quarter of 2022. ● Non-GAAP net loss per share was ($0.01) based on 55.8 million weighted-average shares of common stock outstanding, compared to ($0.02) based on 54.7 million weighted-average shares of common stock outstanding in the third quarter of 2022. Cash ● Cash and equivalents and marketable securities totaled $121.4 million as of September 30, 2023, compared to $192.4 million as of June 30, 2023. ● Net cash (used in) provided by operating activities was ($5.5) million, compared to $1.0 million in the third quarter of 2022. ● Free cash flow was ($3.4) million, compared to $0.5 million in the third quarter of 2022. See “Customer Metrics” and “Use of Non-GAAP Financial Measures” below for how Sprout Social defines total number of customers, number of customers contributing over $10,000 in ARR, number of customers contributing over $50,000 in ARR, ARR, Non-GAAP operating income (loss), Non-GAAP net income (loss), Non-GAAP net income (loss) per share, free cash flow and the financial tables that accompany this release for reconciliations of these measures to their closest comparable GAAP measures. Customer Metrics

 
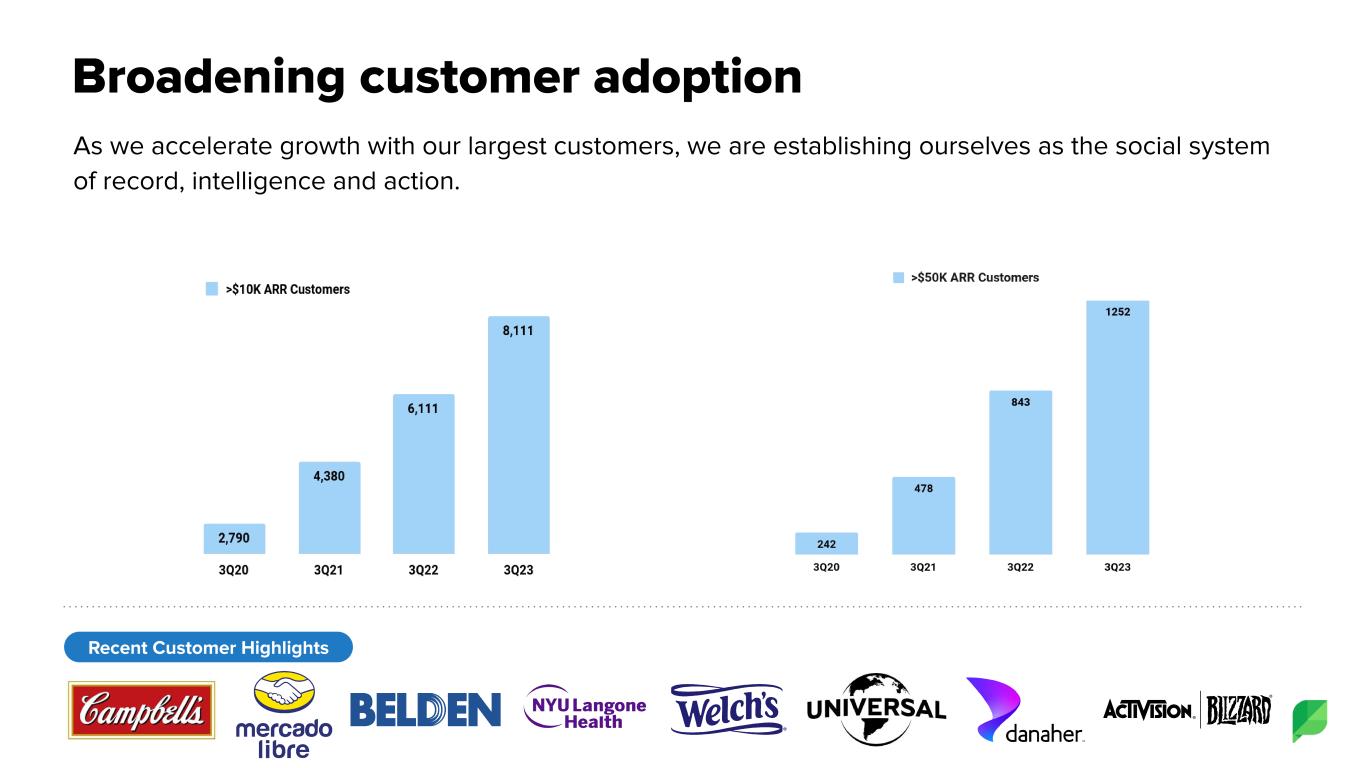
● Grew number of customers contributing over $10,000 in ARR to 8,111 customers as of September 30, 2023, up 33% compared to September 30, 2022. ● Grew number of customers contributing over $50,000 in ARR to 1,252 customers as of September 30, 2023, up 49% compared to September 30, 2022. ● Total number of customers as of September 30, 2023 was 32,383, down 5% compared to September 30, 2022. Recent Customer Highlights ● During the third quarter, we had the opportunity to grow with great new & existing customers like American Honda Motor Company, Harman International, Camping World, Hormel Foods, Danaher, Activision Blizzard, Welch Foods, NYU Langone Health System, Belden and Mercadolibre. Recent Business Highlights Sprout Social recently: ● Published its 2023 Environmental, Social and Governance (ESG) Impact Report (here). ● Named to the 2023 Fortune Best Workplaces in Technology™ List (here). ● Recognized by G2’s 2023 Fall Reports as a leader across 138 categories including Social Customer Service, Social Media Analytics and Best Results for Enterprise Customers (here). ● Released the 2023 Sprout Social Index, Edition XIX: Breakthrough that uncovered the growing and integral role of social media in the customer journey and how brands are evolving to meet increased expectations (here). ● Published a case study outlining how Salesforce saved 12,000 hours in its first year using Sprout Social (here). Fourth Quarter and 2023 Financial Outlook For the fourth quarter of 2023, the Company currently expects: ● Total revenue to be between $90.5 million and $90.6 million. ● Non-GAAP operating income to be between $0.6 million and $0.7 million. ● Non-GAAP net income per share of between $0.00 and $0.01 based on approximately 56.6 million weighted-average shares of common stock outstanding. “Our focused investments are delivering strong returns,” said Joe Del Preto, CFO. “Our current performance and leading indicators performed well during Q3 led by the rapidly changing mix of our business and further acceleration in our enterprise segment. Tagger overperformed our expectations right out of the gate.” For the full year 2023, the Company currently expects: ● Total revenue to be between $330.6 million and $330.7 million. Services revenue will be lower than 2022 levels. ● The implied ARR growth rate exiting 2023 to be approximately 30%, higher than our prior view of 28-29%. This continues to assume that non-core, low end ARR declines to zero exiting the year. ● Non-GAAP operating income between $3.6 million and $3.7 million. ● This implies year-over-year Non-GAAP operating margin improvement of roughly 270bps, compared with our prior range of roughly 200bps year-over-year. ● Non-GAAP net income per share between $0.12 and $0.13 based on approximately 55.9 million weighted-average shares of common stock outstanding. The Company’s fourth quarter and 2023 financial outlook is based on a number of assumptions that are subject to change and many of which are outside the Company’s control. If actual results vary from these assumptions, the Company’s expectations may change. There can be no assurance that the Company will achieve these results. The Company does not provide guidance for operating loss, the most directly comparable GAAP measure to non-GAAP operating income, net loss per share, the most directly comparable GAAP measure to non-GAAP net income per share, or operating margin, the most directly comparable GAAP measure to Non-GAAP operating margin, and similarly cannot provide a reconciliation between its forecasted non-GAAP operating income, non-GAAP net income per share and non-GAAP operating margin and these comparable GAAP measures without unreasonable effort due to the unavailability of reliable estimates for certain items. These items are not within the Company’s control and may vary greatly between periods and could significantly impact future financial results.

 
Conference Call Information The financial results and business highlights will be discussed on a conference call and webcast scheduled at 4:00 p.m. Central Time (5:00 p.m. Eastern Time) today, November 2, 2023. Online registration for this event conference call can be found at https://conferencingportals.com/event/KXqdWaBd. The live webcast of the conference call can be accessed from Sprout Social’s investor relations website at http://investors.sproutsocial.com. Following completion of the events, a webcast replay will also be available at http://investors.sproutsocial.com for 12 months. About Sprout Social Sprout Social is a global leader in social media management and analytics software. Sprout’s unified platform puts powerful social data into the hands of more than 30,000 brands so they can make strategic decisions that drive business growth and innovation. With a full suite of social media management solutions, Sprout offers comprehensive publishing and engagement functionality, customer care, connected workflows and AI-powered business intelligence. Sprout’s award-winning software operates across all major social media networks and digital platforms. For more information about Sprout Social (NASDAQ: SPT), visit sproutsocial.com. Forward-Looking Statements This press release contains “forward-looking statements” within the meaning of Section 27A of the Securities Act of 1933, as amended, and Section 21E of the Securities Exchange Act of 1934, as amended. In some cases, you can identify forward-looking statements by terms such as “anticipate,” “believe,” “can,” “continue,” “could,” “estimate,” “expect,” “explore,” “intend,” “long-term model,” “may,” “might” “outlook,” “plan,” “potential,” “predict,” “project,” “should,” “strategy,” “target,” “will,” “would,” or the negative of these terms, and similar expressions intended to identify forward-looking statements. However, not all forward-looking statements contain these identifying words. These statements may relate to our market size and growth strategy, our estimated and projected costs, margins, revenue, expenditures and customer and financial growth rates, our Q4 and 2023 financial outlook, our plans and objectives for future operations, growth, initiatives or strategies. By their nature, these statements are subject to numerous uncertainties and risks, including factors beyond our control, that could cause actual results, performance or achievement to differ materially and adversely from those anticipated or implied in the forward-looking statements. These assumptions, uncertainties and risks include that, among others: we may not be able to sustain our revenue and customer growth rate in the future; price increases have and may continue to negatively impact demand for our products, customer acquisition and retention and reduce the total number of customers or customer additions; our business would be harmed by any significant interruptions, delays or outages in services from our platform, our API providers, or certain social media platforms; if we are unable to attract potential customers through unpaid channels, convert this traffic to free trials or convert free trials to paid subscriptions, our business and results of operations may be adversely affected; we may be unable to integrate acquired businesses or technologies successfully or achieve the expected benefits of such acquisitions and investments; unstable market and economic conditions, such as recession risks, effects of inflation, labor shortages, supply chain issues, higher interest rates, the impacts of current and potential future bank failures and geopolitical impacts of overseas conflict, could adversely impact our business and that of our existing and prospective customers, which may result in reduced demand for our products; we may not be able to generate sufficient cash to service our indebtedness; covenants in our credit agreement may restrict our operations, and if we do not effectively manage our business to comply with these covenants, our financial condition could be adversely impacted; any cybersecurity-related attack, significant data breach or disruption of the information technology systems or networks on which we rely could negatively affect our business; and changing regulations relating to privacy, information security and data protection could increase our costs, affect or limit how we collect and use personal information and harm our brand. Additional risks and uncertainties that could cause actual outcomes and results to differ materially from those contemplated by the forward-looking statements are included under the caption “Risk Factors” and elsewhere in our filings with the Securities and Exchange Commission (the “SEC”), including our Annual Report on Form 10-K for the year ended December 31, 2022 filed with the SEC on February 22, 2023, as supplemented by our Quarterly Report on Form 10-Q for the quarter ended June 30, 2023 filed with the SEC on August 4, 2023, and our Quarterly Report on Form 10-Q for the quarter ended September 30, 2023 to be filed with the SEC as well as any future reports that we file with the SEC. Moreover, you should interpret many of the risks identified in those reports as being heightened as a result of the current instability in market and economic conditions. Forward-looking statements speak only as of the date the statements are made and are based on information available to Sprout Social at the time those statements are made and/or management's good faith belief as of that time with respect to future events. Sprout Social assumes no obligation to update forward-looking statements to reflect events or circumstances after the date they were made, except as required by law. Use of Non-GAAP Financial Measures We have provided in this press release certain financial information that has not been prepared in accordance with generally accepted accounting principles in the United States (“GAAP”). Our management uses these non-GAAP financial measures internally in analyzing our financial results and believes that use of these non-GAAP financial measures is useful to investors

 
as an additional tool to evaluate ongoing operating results and trends and in comparing our financial results with other companies in our industry, many of which present similar non-GAAP financial measures. Non-GAAP financial measures are not meant to be considered in isolation or as a substitute for comparable financial measures prepared in accordance with GAAP and should be read only in conjunction with our consolidated financial statements prepared in accordance with GAAP. A reconciliation of our historical non-GAAP financial measures to the most directly comparable GAAP measures has been provided in the financial statement tables included in this press release, and investors are encouraged to review these reconciliations. Non-GAAP gross profit.We define non-GAAP gross profit as GAAP gross profit, excluding stock-based compensation expense and amortization expense associated with the acquired developed technology from the Tagger acquisition. We believe non-GAAP gross profit provides our management and investors consistency and comparability with our past financial performance and facilitates period-to-period comparisons of operations, as it eliminates the effect of stock-based compensation and amortization expense, which are often unrelated to overall operating performance. During the third quarter of 2023, we revised our definition of non-GAAP gross profit to exclude amortization expense associated with the acquired developed technology from the Tagger acquisition. Non-GAAP gross margin.We define non-GAAP gross margin as non-GAAP gross profit as a percentage of revenue. Non-GAAP operating income (loss).We define non-GAAP operating income (loss) as GAAP loss from operations, excluding stock-based compensation expense, acquisition-related costs and amortization expense associated with the acquired intangible assets from the Tagger acquisition. We believe non-GAAP operating income (loss) provides our management and investors consistency and comparability with our past financial performance and facilitates period-to-period comparisons of operations, as it eliminates the effect of stock-based compensation, acquisition-related expenses and amortization expense, which are often unrelated to overall operating performance. During the second quarter of 2023, we revised our definition of non-GAAP operating income (loss) to exclude acquisition-related expenses in connection with our acquisition of Tagger, Inc. During the third quarter, we revised our definition of non-GAAP operating income (loss) to exclude amortization expense associated with the acquired intangible assets from the Tagger acquisition. Non-GAAP operating margin.We defined non-GAAP operating margin as non-GAAP operating income (loss) as a percentage of revenue. Non-GAAP net income (loss).We define non-GAAP net income (loss) as GAAP net loss, excluding stock-based compensation expense, acquisition-related expenses, amortization expense associated with the acquired intangible assets from the Tagger acquisition and tax benefits due to changes in valuation allowances from business acquisitions. We believe non-GAAP net income (loss) provides our management and investors consistency and comparability with our past financial performance and facilitates period-to-period comparisons of operations, as this non-GAAP financial measure eliminates the effect of stock-based compensation, acquisition-related expenses, amortization expense and tax benefits due to changes in valuation allowances from business acquisitions, which are often unrelated to overall operating performance. During the second quarter of 2023, we revised our definition of non-GAAP net income (loss) to exclude acquisition-related expenses in connection with our acquisition of Tagger, Inc. During the third quarter of 2023, we revised our definition of non-GAAP net income (loss) to exclude amortization expense associated with the acquired intangible assets from the Tagger acquisition and tax benefits recognized from changes in the valuation allowance associated with our acquisition of Tagger. Non-GAAP net income (loss) per share.We define non-GAAP net income (loss) per share as GAAP net loss per share attributable to common shareholders, basic and diluted, excluding stock-based compensation expense, acquisition-related expenses, amortization expense associated with the acquired intangible assets from the Tagger acquisition and tax benefits due to changes in valuation allowances from business acquisitions. We believe non-GAAP net income (loss) per share provides our management and investors consistency and comparability with our past financial performance and facilitates period-to-period comparisons of operations, as this non-GAAP financial measure eliminates the effect of stock-based compensation, acquisition-related expenses, amortization expense and tax benefits due to changes in valuation allowances from business acquisitions, which are often unrelated to overall operating performance. During the second quarter of 2023, we revised our definition of non-GAAP net income (loss) per share to exclude acquisition-related expenses in connection with our acquisition of Tagger, Inc. During the third quarter of 2023, we revised our definition of non-GAAP net income (loss) per share to exclude amortization expense associated with the acquired intangible assets from the Tagger acquisition and tax benefits recognized from changes in the valuation allowance associated with our acquisition of Tagger. Free cash flow.We define free cash flow as net cash provided by (used in) operating activities less expenditures for property and equipment and acquisition-related costs. Free cash flow does not reflect our future contractual obligations or represent the total increase or decrease in our cash balance for a given period. We believe free cash flow is a useful indicator of liquidity that provides information to management and investors about the amount of cash used in our core operations that, after expenditures for property and equipment, is not available for strategic initiatives.

 
Free cash flow margin.We define free cash flow margin as free cash flow as a percentage of revenue. Non-GAAP sales and marketing expenses, non-GAAP research and development expenses and non-GAAP general and administrative expenses. Non-GAAP sales and marketing expenses, non-GAAP research and development expenses and non-GAAP general and administrative expenses are defined as sales and marketing expenses, research and development expenses and general and administrative expenses, respectively, less stock-based compensation expense and acquisition-related expenses. We believe these non-GAAP measures provide our management and investors with insight into day-to-day operating expenses given that these measures eliminate the effect of stock-based compensation and acquisition-related expenses. During the second quarter of 2023, we revised our definition of non-GAAP general and administrative expenses to exclude acquisition-related expenses in connection with our acquisition of Tagger, Inc. Customer Metrics Annual recurring revenue (“ARR”).We define ARR as the annualized revenue run-rate of subscription agreements from all customers as of the last date of the specified period. We believe ARR is an indicator of the scale of our entire platform while mitigating fluctuations due to seasonality and contract term. Number of customers.We define a customer as a unique account, multiple accounts containing a common non-personal email domain, or multiple accounts governed by a single agreement or entity. We believe that the number of customers using our platform is an indicator of our market penetration. Number of customers contributing more than $10,000 in ARR.We define number of customers contributing more than $10,000 in ARR as those on a paid subscription plan that had more than $10,000 in ARR as of a period end. We view the number of customers that contribute more than $10,000 in ARR as a measure of our ability to scale with our customers and attract larger organizations. We believe this represents potential for future growth, including expanding within our current customer base. Number of customers contributing more than $50,000 in ARR.We define number of customers contributing more than $50,000 in ARR as those on a paid subscription plan that had more than $50,000 in ARR as of a period end. We view the number of customers that contribute more than $50,000 in ARR as a measure of our ability to scale with large customers and attract sophisticated organizations. We believe this represents potential for future growth, including expanding within our current customer base. Availability of Information on Sprout Social’s Website and Social Media Profiles Investors and others should note that Sprout Social routinely announces material information to investors and the marketplace using SEC filings, press releases, public conference calls, webcasts and the Sprout Social Investors website. We also intend to use the social media profiles listed below as a means of disclosing information about us to our customers, investors and the public. While not all of the information that the Company posts to the Sprout Social Investors website or to social media profiles is of a material nature, some information could be deemed to be material. Accordingly, the Company encourages investors, the media, and others interested in Sprout Social to review the information that it shares at the Investors link located at the bottom of the page on www.sproutsocial.com and to regularly follow our social media profiles. Users may automatically receive email alerts and other information about Sprout Social when enrolling an email address by visiting "Email Alerts" in the "Shareholder Services" section of Sprout Social's Investor website at https://investors.sproutsocial.com/. Social Media Profiles: www.twitter.com/SproutSocial www.twitter.com/SproutSocialIR www.facebook.com/SproutSocialInc www.linkedin.com/company/sprout-social-inc-/ www.instagram.com/sproutsocial Contact Media: Kaitlyn Gronek Email: [email protected] Phone: (773) 904-9674 Investors:
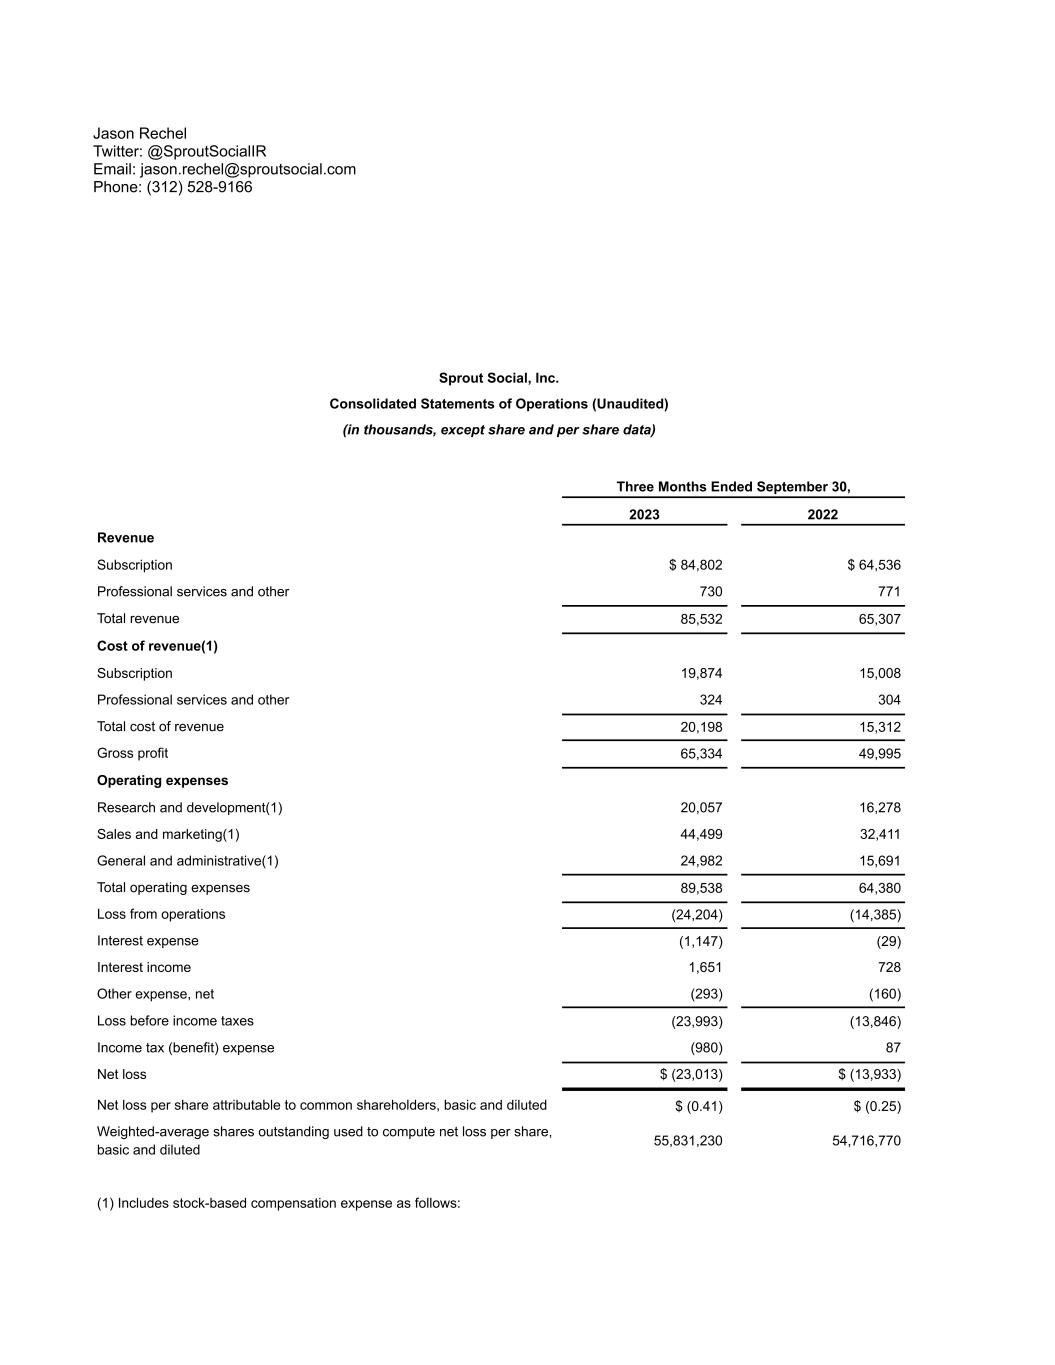

 
Jason Rechel Twitter: @SproutSocialIR Email: [email protected] Phone: (312) 528-9166 Sprout Social, Inc. Consolidated Statements of Operations (Unaudited) (in thousands, except share and per share data) Three Months Ended September 30, 2023 2022 Revenue Subscription $ 84,802 $ 64,536 Professional services and other 730 771 Total revenue 85,532 65,307 Cost of revenue(1) Subscription 19,874 15,008 Professional services and other 324 304 Total cost of revenue 20,198 15,312 Gross profit 65,334 49,995 Operating expenses Research and development(1) 20,057 16,278 Sales and marketing(1) 44,499 32,411 General and administrative(1) 24,982 15,691 Total operating expenses 89,538 64,380 Loss from operations (24,204) (14,385) Interest expense (1,147) (29) Interest income 1,651 728 Other expense, net (293) (160) Loss before income taxes (23,993) (13,846) Income tax (benefit) expense (980) 87 Net loss $ (23,013) $ (13,933) Net loss per share attributable to common shareholders, basic and diluted $ (0.41) $ (0.25) Weighted-average shares outstanding used to compute net loss per share, basic and diluted 55,831,230 54,716,770 (1) Includes stock-based compensation expense as follows:
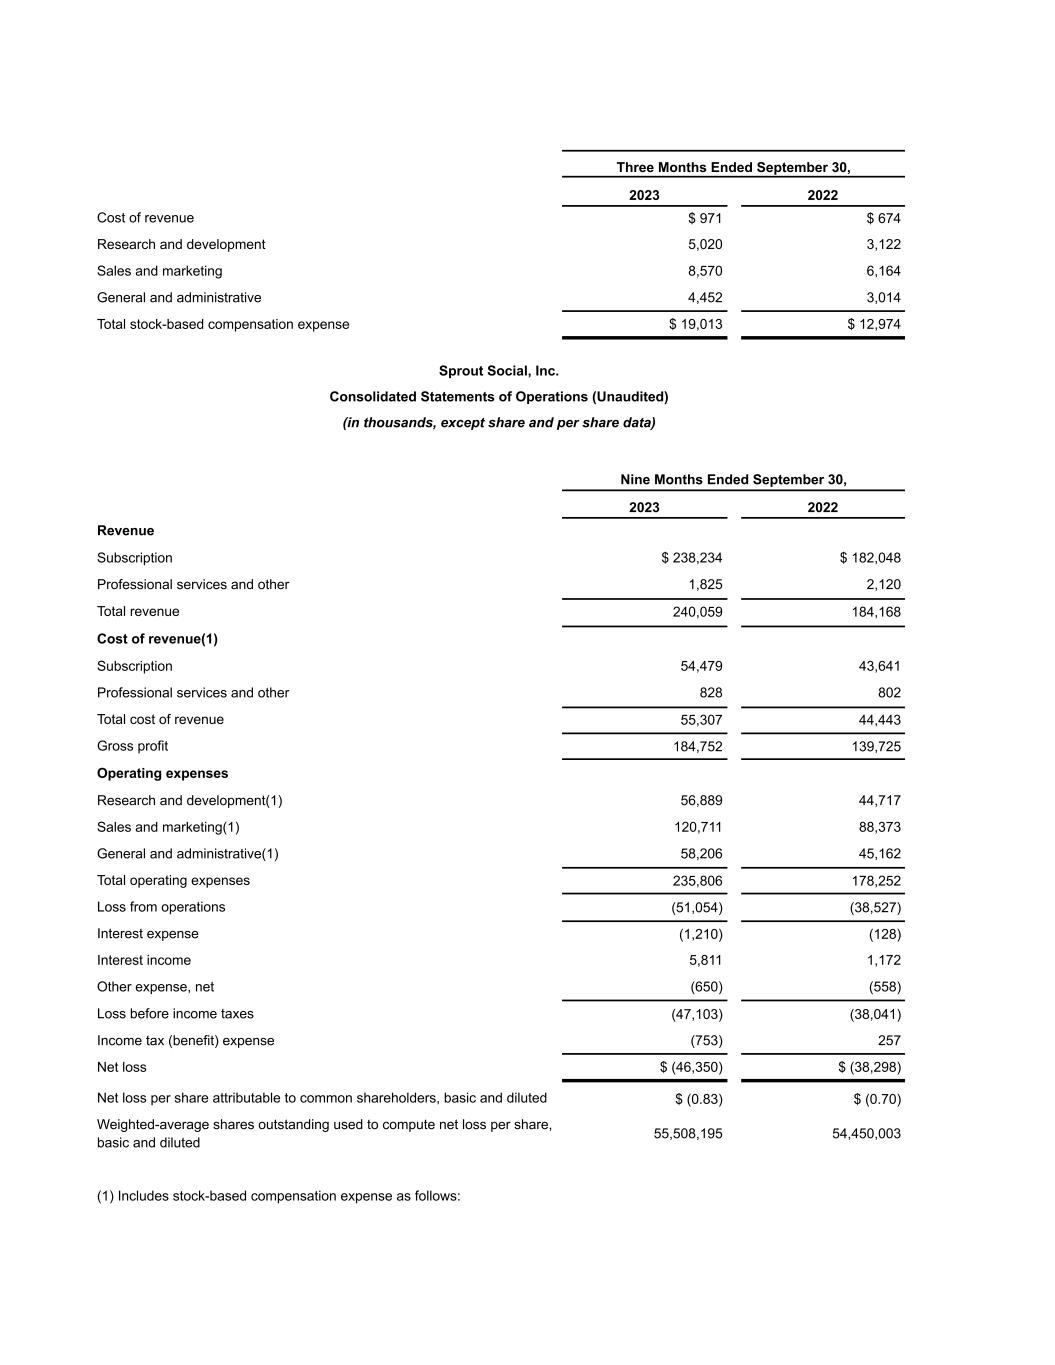

 
Three Months Ended September 30, 2023 2022 Cost of revenue $ 971 $ 674 Research and development 5,020 3,122 Sales and marketing 8,570 6,164 General and administrative 4,452 3,014 Total stock-based compensation expense $ 19,013 $ 12,974 Sprout Social, Inc. Consolidated Statements of Operations (Unaudited) (in thousands, except share and per share data) Nine Months Ended September 30, 2023 2022 Revenue Subscription $ 238,234 $ 182,048 Professional services and other 1,825 2,120 Total revenue 240,059 184,168 Cost of revenue(1) Subscription 54,479 43,641 Professional services and other 828 802 Total cost of revenue 55,307 44,443 Gross profit 184,752 139,725 Operating expenses Research and development(1) 56,889 44,717 Sales and marketing(1) 120,711 88,373 General and administrative(1) 58,206 45,162 Total operating expenses 235,806 178,252 Loss from operations (51,054) (38,527) Interest expense (1,210) (128) Interest income 5,811 1,172 Other expense, net (650) (558) Loss before income taxes (47,103) (38,041) Income tax (benefit) expense (753) 257 Net loss $ (46,350) $ (38,298) Net loss per share attributable to common shareholders, basic and diluted $ (0.83) $ (0.70) Weighted-average shares outstanding used to compute net loss per share, basic and diluted 55,508,195 54,450,003 (1) Includes stock-based compensation expense as follows:
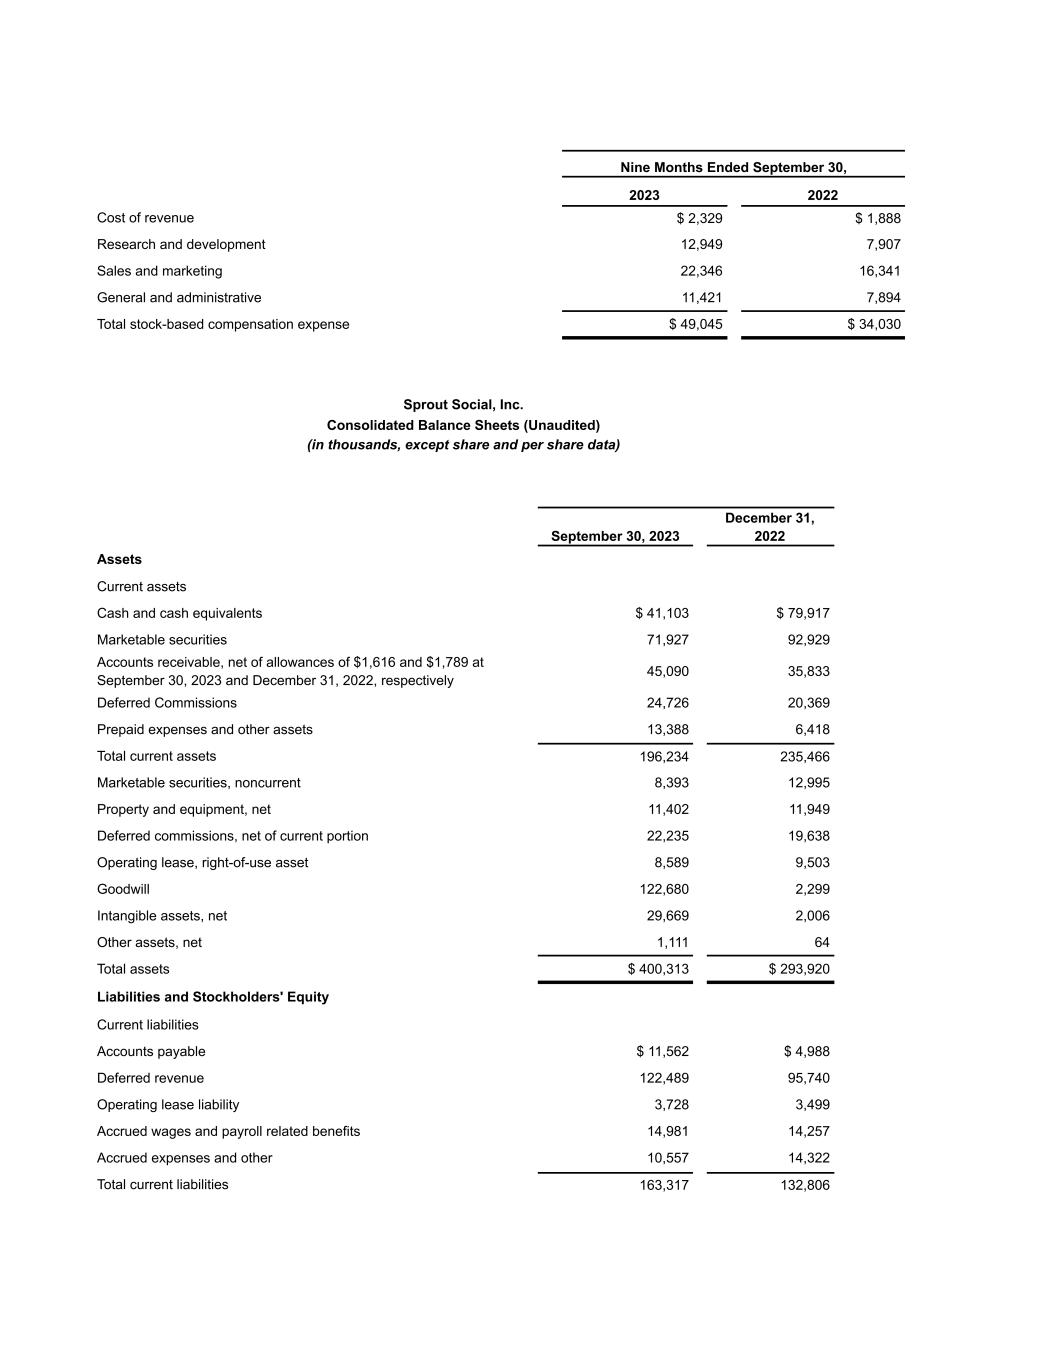

 
Nine Months Ended September 30, 2023 2022 Cost of revenue $ 2,329 $ 1,888 Research and development 12,949 7,907 Sales and marketing 22,346 16,341 General and administrative 11,421 7,894 Total stock-based compensation expense $ 49,045 $ 34,030 Sprout Social, Inc. Consolidated Balance Sheets (Unaudited) (in thousands, except share and per share data) September 30, 2023 December 31, 2022 Assets Current assets Cash and cash equivalents $ 41,103 $ 79,917 Marketable securities 71,927 92,929 Accounts receivable, net of allowances of $1,616 and $1,789 at September 30, 2023 and December 31, 2022, respectively 45,090 35,833 Deferred Commissions 24,726 20,369 Prepaid expenses and other assets 13,388 6,418 Total current assets 196,234 235,466 Marketable securities, noncurrent 8,393 12,995 Property and equipment, net 11,402 11,949 Deferred commissions, net of current portion 22,235 19,638 Operating lease, right-of-use asset 8,589 9,503 Goodwill 122,680 2,299 Intangible assets, net 29,669 2,006 Other assets, net 1,111 64 Total assets $ 400,313 $ 293,920 Liabilities and Stockholders' Equity Current liabilities Accounts payable $ 11,562 $ 4,988 Deferred revenue 122,489 95,740 Operating lease liability 3,728 3,499 Accrued wages and payroll related benefits 14,981 14,257 Accrued expenses and other 10,557 14,322 Total current liabilities 163,317 132,806
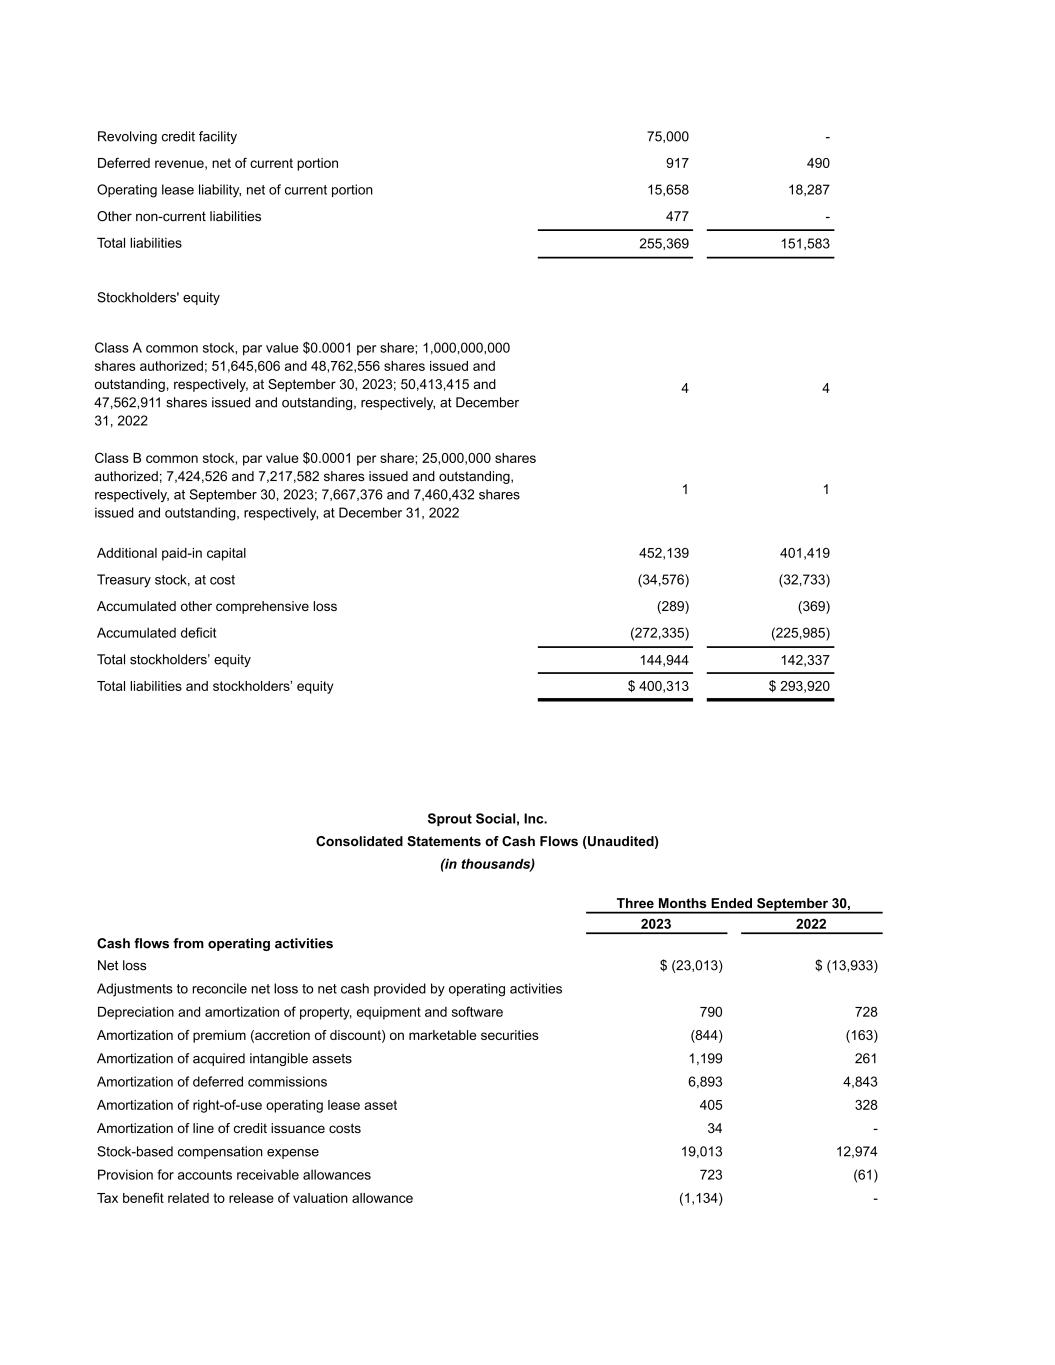

 
Revolving credit facility 75,000 - Deferred revenue, net of current portion 917 490 Operating lease liability, net of current portion 15,658 18,287 Other non-current liabilities 477 - Total liabilities 255,369 151,583 Stockholders' equity Class A common stock, par value $0.0001 per share; 1,000,000,000 shares authorized; 51,645,606 and 48,762,556 shares issued and outstanding, respectively, at September 30, 2023; 50,413,415 and 47,562,911 shares issued and outstanding, respectively, at December 31, 2022 4 4 Class B common stock, par value $0.0001 per share; 25,000,000 shares authorized; 7,424,526 and 7,217,582 shares issued and outstanding, respectively, at September 30, 2023; 7,667,376 and 7,460,432 shares issued and outstanding, respectively, at December 31, 2022 1 1 Additional paid-in capital 452,139 401,419 Treasury stock, at cost (34,576) (32,733) Accumulated other comprehensive loss (289) (369) Accumulated deficit (272,335) (225,985) Total stockholders’ equity 144,944 142,337 Total liabilities and stockholders’ equity $ 400,313 $ 293,920 Sprout Social, Inc. Consolidated Statements of Cash Flows (Unaudited) (in thousands) Three Months Ended September 30, 2023 2022 Cash flows from operating activities Net loss $ (23,013) $ (13,933) Adjustments to reconcile net loss to net cash provided by operating activities Depreciation and amortization of property, equipment and software 790 728 Amortization of premium (accretion of discount) on marketable securities (844) (163) Amortization of acquired intangible assets 1,199 261 Amortization of deferred commissions 6,893 4,843 Amortization of right-of-use operating lease asset 405 328 Amortization of line of credit issuance costs 34 - Stock-based compensation expense 19,013 12,974 Provision for accounts receivable allowances 723 (61) Tax benefit related to release of valuation allowance (1,134) -
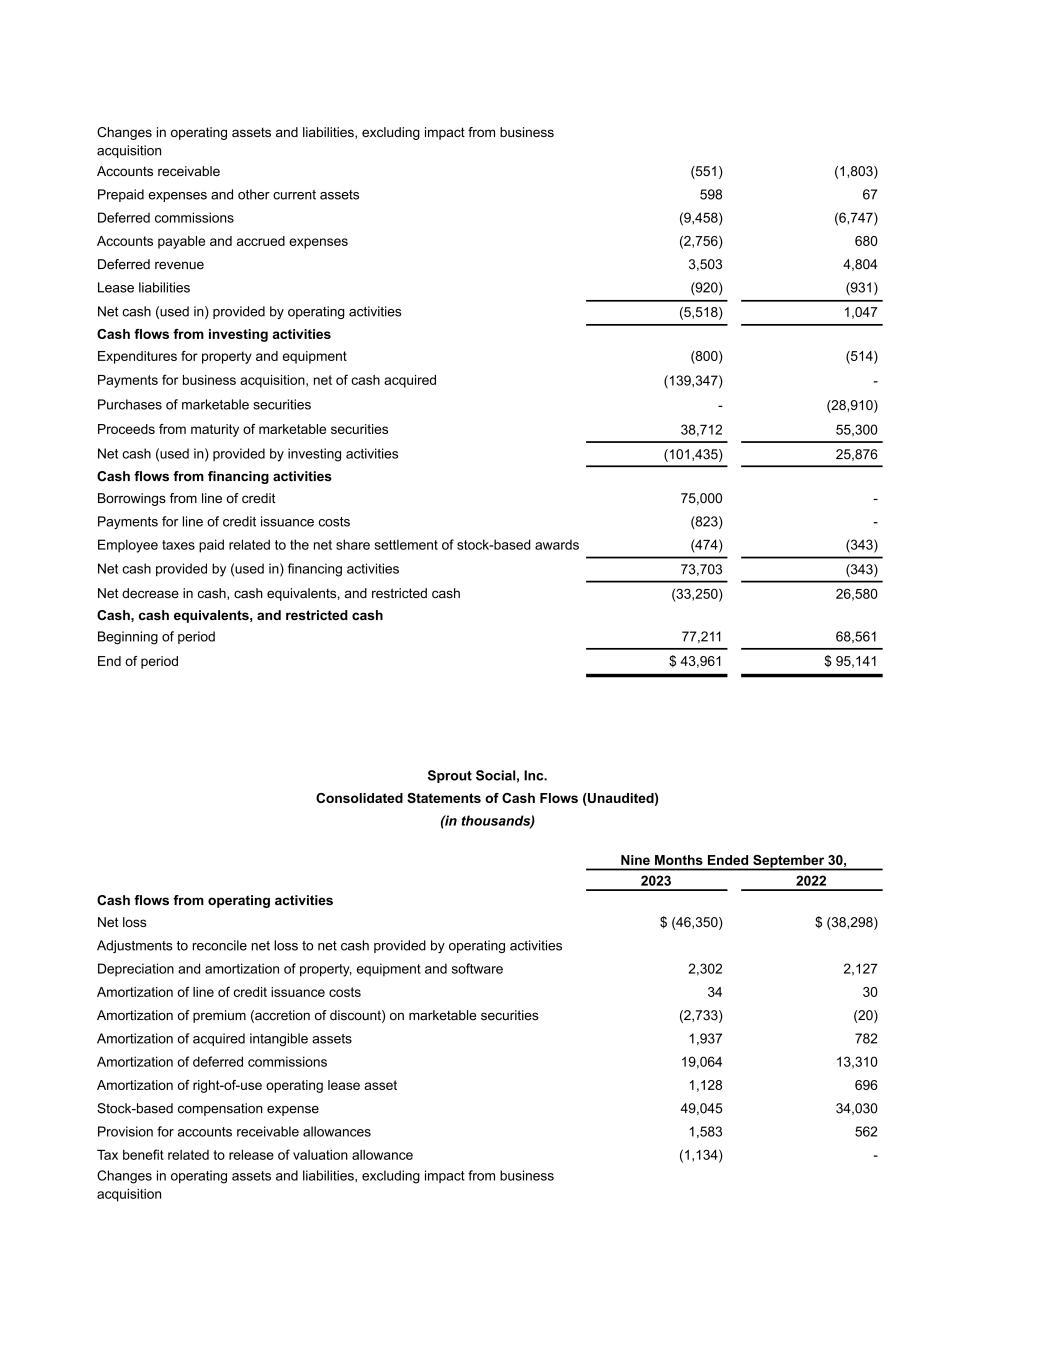

 
Changes in operating assets and liabilities, excluding impact from business acquisition Accounts receivable (551) (1,803) Prepaid expenses and other current assets 598 67 Deferred commissions (9,458) (6,747) Accounts payable and accrued expenses (2,756) 680 Deferred revenue 3,503 4,804 Lease liabilities (920) (931) Net cash (used in) provided by operating activities (5,518) 1,047 Cash flows from investing activities Expenditures for property and equipment (800) (514) Payments for business acquisition, net of cash acquired (139,347) - Purchases of marketable securities - (28,910) Proceeds from maturity of marketable securities 38,712 55,300 Net cash (used in) provided by investing activities (101,435) 25,876 Cash flows from financing activities Borrowings from line of credit 75,000 - Payments for line of credit issuance costs (823) - Employee taxes paid related to the net share settlement of stock-based awards (474) (343) Net cash provided by (used in) financing activities 73,703 (343) Net decrease in cash, cash equivalents, and restricted cash (33,250) 26,580 Cash, cash equivalents, and restricted cash Beginning of period 77,211 68,561 End of period $ 43,961 $ 95,141 Sprout Social, Inc. Consolidated Statements of Cash Flows (Unaudited) (in thousands) Nine Months Ended September 30, 2023 2022 Cash flows from operating activities Net loss $ (46,350) $ (38,298) Adjustments to reconcile net loss to net cash provided by operating activities Depreciation and amortization of property, equipment and software 2,302 2,127 Amortization of line of credit issuance costs 34 30 Amortization of premium (accretion of discount) on marketable securities (2,733) (20) Amortization of acquired intangible assets 1,937 782 Amortization of deferred commissions 19,064 13,310 Amortization of right-of-use operating lease asset 1,128 696 Stock-based compensation expense 49,045 34,030 Provision for accounts receivable allowances 1,583 562 Tax benefit related to release of valuation allowance (1,134) - Changes in operating assets and liabilities, excluding impact from business acquisition
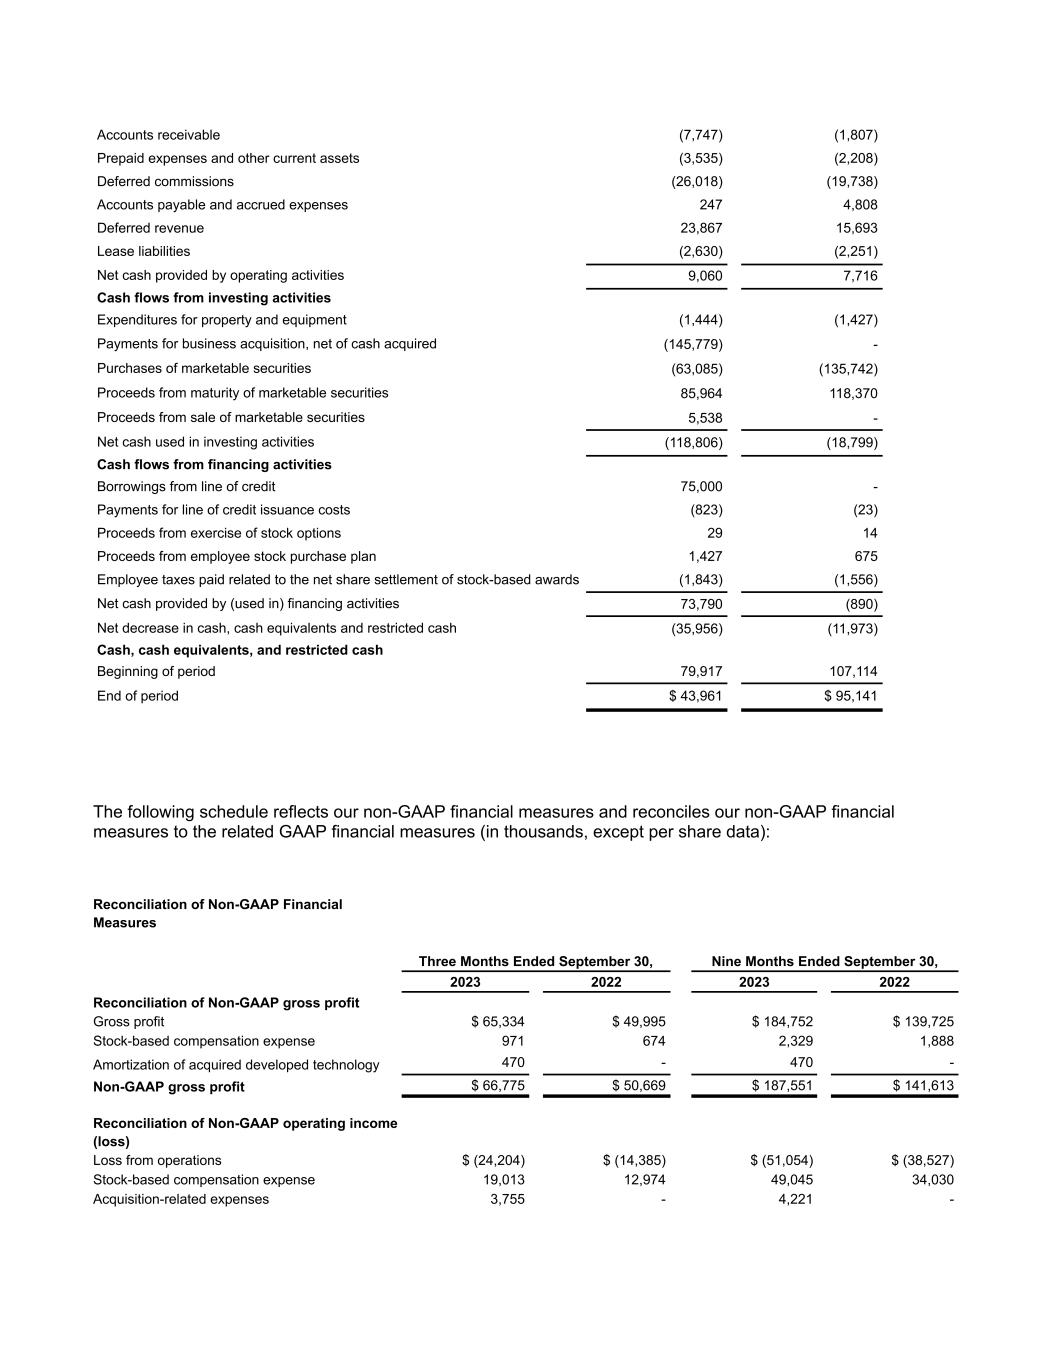

 
Accounts receivable (7,747) (1,807) Prepaid expenses and other current assets (3,535) (2,208) Deferred commissions (26,018) (19,738) Accounts payable and accrued expenses 247 4,808 Deferred revenue 23,867 15,693 Lease liabilities (2,630) (2,251) Net cash provided by operating activities 9,060 7,716 Cash flows from investing activities Expenditures for property and equipment (1,444) (1,427) Payments for business acquisition, net of cash acquired (145,779) - Purchases of marketable securities (63,085) (135,742) Proceeds from maturity of marketable securities 85,964 118,370 Proceeds from sale of marketable securities 5,538 - Net cash used in investing activities (118,806) (18,799) Cash flows from financing activities Borrowings from line of credit 75,000 - Payments for line of credit issuance costs (823) (23) Proceeds from exercise of stock options 29 14 Proceeds from employee stock purchase plan 1,427 675 Employee taxes paid related to the net share settlement of stock-based awards (1,843) (1,556) Net cash provided by (used in) financing activities 73,790 (890) Net decrease in cash, cash equivalents and restricted cash (35,956) (11,973) Cash, cash equivalents, and restricted cash Beginning of period 79,917 107,114 End of period $ 43,961 $ 95,141 The following schedule reflects our non-GAAP financial measures and reconciles our non-GAAP financial measures to the related GAAP financial measures (in thousands, except per share data): Reconciliation of Non-GAAP Financial Measures Three Months Ended September 30, Nine Months Ended September 30, 2023 2022 2023 2022 Reconciliation of Non-GAAP gross profit Gross profit $ 65,334 $ 49,995 $ 184,752 $ 139,725 Stock-based compensation expense 971 674 2,329 1,888 Amortization of acquired developed technology 470 - 470 - Non-GAAP gross profit $ 66,775 $ 50,669 $ 187,551 $ 141,613 Reconciliation of Non-GAAP operating income (loss) Loss from operations $ (24,204) $ (14,385) $ (51,054) $ (38,527) Stock-based compensation expense 19,013 12,974 49,045 34,030 Acquisition-related expenses 3,755 - 4,221 -
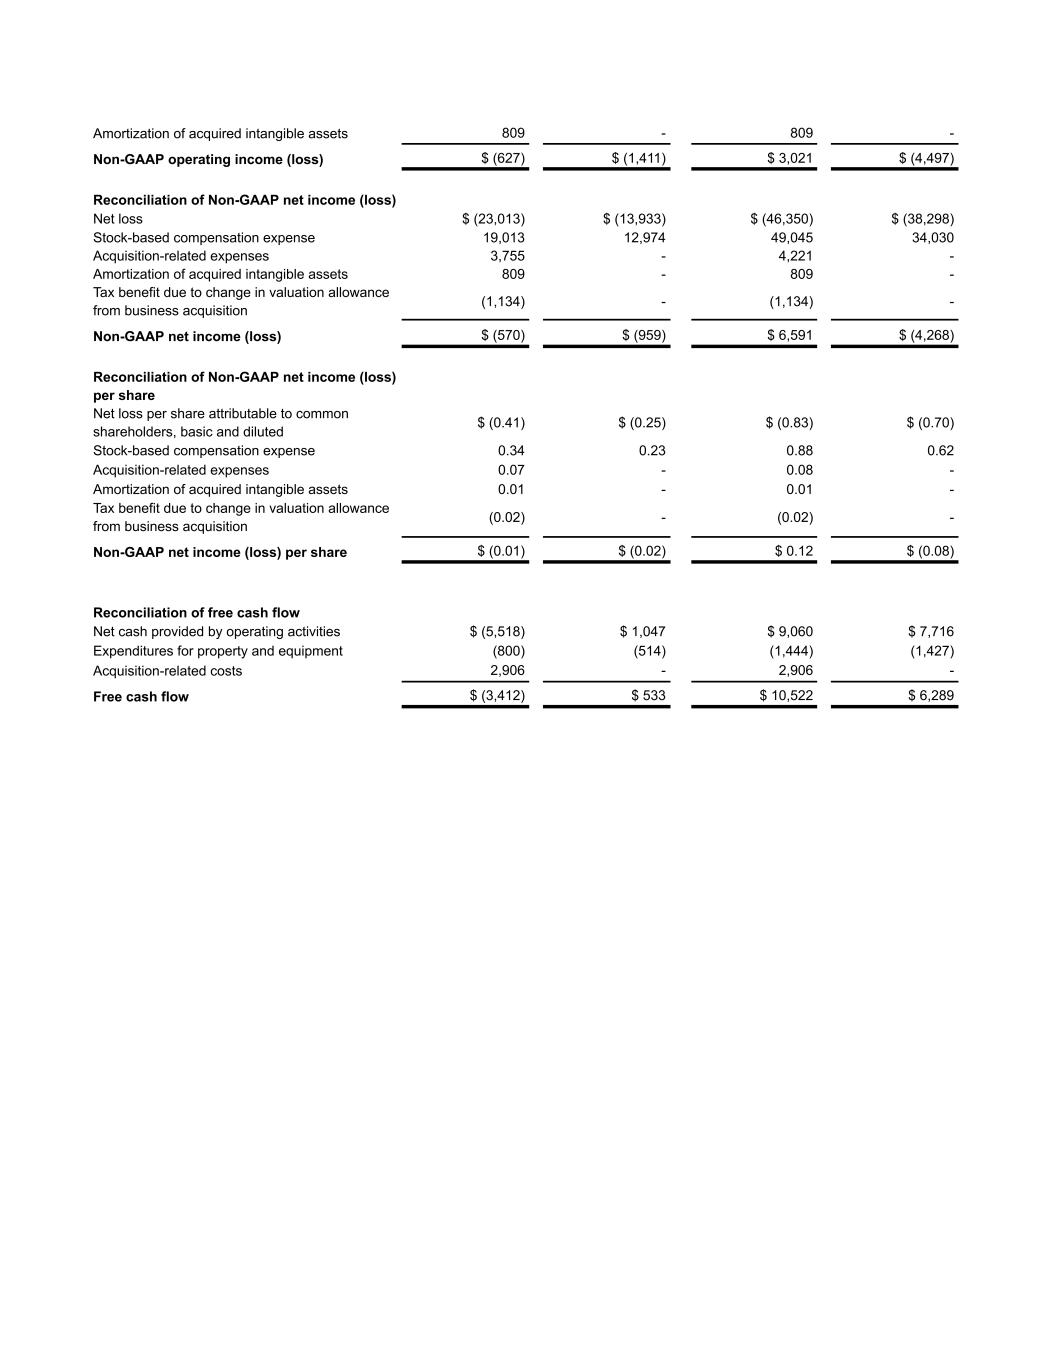

 
Amortization of acquired intangible assets 809 - 809 - Non-GAAP operating income (loss) $ (627) $ (1,411) $ 3,021 $ (4,497) Reconciliation of Non-GAAP net income (loss) Net loss $ (23,013) $ (13,933) $ (46,350) $ (38,298) Stock-based compensation expense 19,013 12,974 49,045 34,030 Acquisition-related expenses 3,755 - 4,221 - Amortization of acquired intangible assets 809 - 809 - Tax benefit due to change in valuation allowance from business acquisition (1,134) - (1,134) - Non-GAAP net income (loss) $ (570) $ (959) $ 6,591 $ (4,268) Reconciliation of Non-GAAP net income (loss) per share Net loss per share attributable to common shareholders, basic and diluted $ (0.41) $ (0.25) $ (0.83) $ (0.70) Stock-based compensation expense 0.34 0.23 0.88 0.62 Acquisition-related expenses 0.07 - 0.08 - Amortization of acquired intangible assets 0.01 - 0.01 - Tax benefit due to change in valuation allowance from business acquisition (0.02) - (0.02) - Non-GAAP net income (loss) per share $ (0.01) $ (0.02) $ 0.12 $ (0.08) Reconciliation of free cash flow Net cash provided by operating activities $ (5,518) $ 1,047 $ 9,060 $ 7,716 Expenditures for property and equipment (800) (514) (1,444) (1,427) Acquisition-related costs 2,906 - 2,906 - Free cash flow $ (3,412) $ 533 $ 10,522 $ 6,289

 
2021 Investor Day 2023 Investor Presentation


Disclaimers Forward-Looking Statements This presentation contains “forward-looking statements” within the meaning of Section 27A of the Securities Act of 1933, as amended, and Section 21E of the Securities Exchange Act of 1934, as amended. In some cases, you can identify forward-looking statements by terms such as “anticipate,” “believe,” “can,” “continue,” “could,” “estimate,” “expect,” “explore,” “intend,” “long-term model,” “may,” “might” “outlook,” “plan,” “potential,” “predict,” “project,” “should,” “strategy,” “target,” “will,” “would,” or the negative of these terms, and similar expressions intended to identify forward-looking statements. However, not all forward-looking statements contain these identifying words. These statements may relate to our market size and growth strategy, our estimated and projected costs, margins, revenue, expenditures and customer and financial growth rates, our Q4 2023, 2023, medium term, and long-term financial outlook and performance against our multi-year financial framework, our plans and objectives for future operations, growth, initiatives or strategies, including our investments in research and development. By their nature, these statements are subject to numerous uncertainties and risks, including factors beyond our control, that could cause actual results, performance or achievement to differ materially and adversely from those anticipated or implied in the forward-looking statements. These assumptions, uncertainties and risks include that, among others: our rapid growth and limited history with our current pricing and platform features makes it difficult to evaluate our prospects and future operating results; we may not be able to sustain our revenue and customer growth rate in the future; price increases have and may continue to negatively impact demand for our products, customer acquisition and retention and reduce the total number of customers or customer additions; our business would be harmed by any significant interruptions, delays or outages in services from our platform, our API providers, or certain social media platforms; if we are unable to attract potential customers through unpaid channels, convert this traffic to free trials or convert free trials to paid subscriptions, our business and results of operations may be adversely affected; we may be unable to integrate acquired businesses or technologies successfully or achieve the expected benefits of such acquisitions and investments; unstable market and economic conditions, such as recession risks, effects of inflation, labor shortages, supply chain issues, higher interest rates, the impacts of current and future potential bank failures, and geopolitical impacts of overseas conflicts, could adversely impact our business and that of our existing and prospective customers, which may result in reduced demand for our products; we may not be able to generate sufficient cash to service our indebtedness; covenants in our credit agreement may restrict our operations, and if we do not effectively manage our business to comply with these covenants, our financial condition could be adversely impacted; any cybersecurity-related attack, significant data breach or disruption of the information technology systems or networks on which we rely could negatively affect our business; and changing regulations relating to privacy, information security and data protection could increase our costs, affect or limit how we collect and use personal information and harm our brand. Additional risks and uncertainties that could cause actual outcomes and results to differ materially from those contemplated by the forward-looking statements are included under the caption “Risk Factors” and elsewhere in our filings with the Securities and Exchange Commission (the “SEC”), including our Annual Report on Form 10-K for the year ended December 31, 2022 filed with the SEC on February 22, 2023, as supplemented by our Quarterly Report on Form 10-Q for the quarter ended June 30, 2023 filed August 4, 2023, and our Quarterly Report on Form 10-Q for the quarter ended September 30, 2023 to be filed with the SEC, as well as any future reports that we file with the SEC. Moreover, you should interpret many of the risks identified in those reports as being heightened as a result of the ongoing and current instability in market and economic conditions. Forward-looking statements speak only as of the date the statements are made and are based on information available to Sprout Social at the time those statements are made and/or management's good faith belief as of that time with respect to future events. Sprout Social assumes no obligation to update forward-looking statements to reflect events or circumstances after the date they were made, except as required by law. Use of Non-GAAP Financial Measures We have provided in this presentation certain financial information that has not been prepared in accordance with generally accepted accounting principles in the United States (“GAAP”). Our management uses these non-GAAP financial measures internally in analyzing our financial results and believes that use of these non-GAAP financial measures is useful to investors as an additional tool to evaluate ongoing operating results and trends and in comparing our financial results with other companies in our industry, many of which present similar non-GAAP financial measures. Non-GAAP financial measures are not meant to be considered in isolation or as a substitute for comparable financial measures prepared in accordance with GAAP and should be read only in conjunction with our consolidated financial statements prepared in accordance with GAAP. A reconciliation of our historical non-GAAP financial measures to the most directly comparable GAAP measures has been provided in the financial statement tables included at the end of this presentation, and investors are encouraged to review these reconciliations. The Company cannot provide reconciliations between its forecasted non-GAAP measures and the most comparable GAAP measures without unreasonable effort due to the unavailability of reliable estimates for certain items. These items are not within the Company’s control and may vary greatly between periods and could significantly impact future financial results. Customer Metrics and Market Data This presentation includes useful customer metrics and other data, which are defined at the back of this presentation. Unless otherwise noted, information in this presentation concerning our industry, including industry statistics and forecasts, competitive position and the markets in which we operate is based on information from independent industry and research organizations, other third-party sources and management estimates. Management estimates are derived from publicly available information released by independent industry analysts and other third party sources, as well as data from our internal research, and are based on assumptions made by us upon reviewing such data, and our experience in, and knowledge of, such industry and markets, which we believe to be reasonable. Projections, forecasts, assumptions and estimates of the future performance of the industry in which we operate and our future performance are necessarily subject to uncertainty and risk due to a variety of factors. We have not independently verified the accuracy or completeness of the information provided by independent industry and research organizations, other third parties or other publicly available information. Accordingly, we make no representations as to the accuracy or completeness of that information nor do we undertake to update such information after the date of this presentation. 2023 Investor Presentation


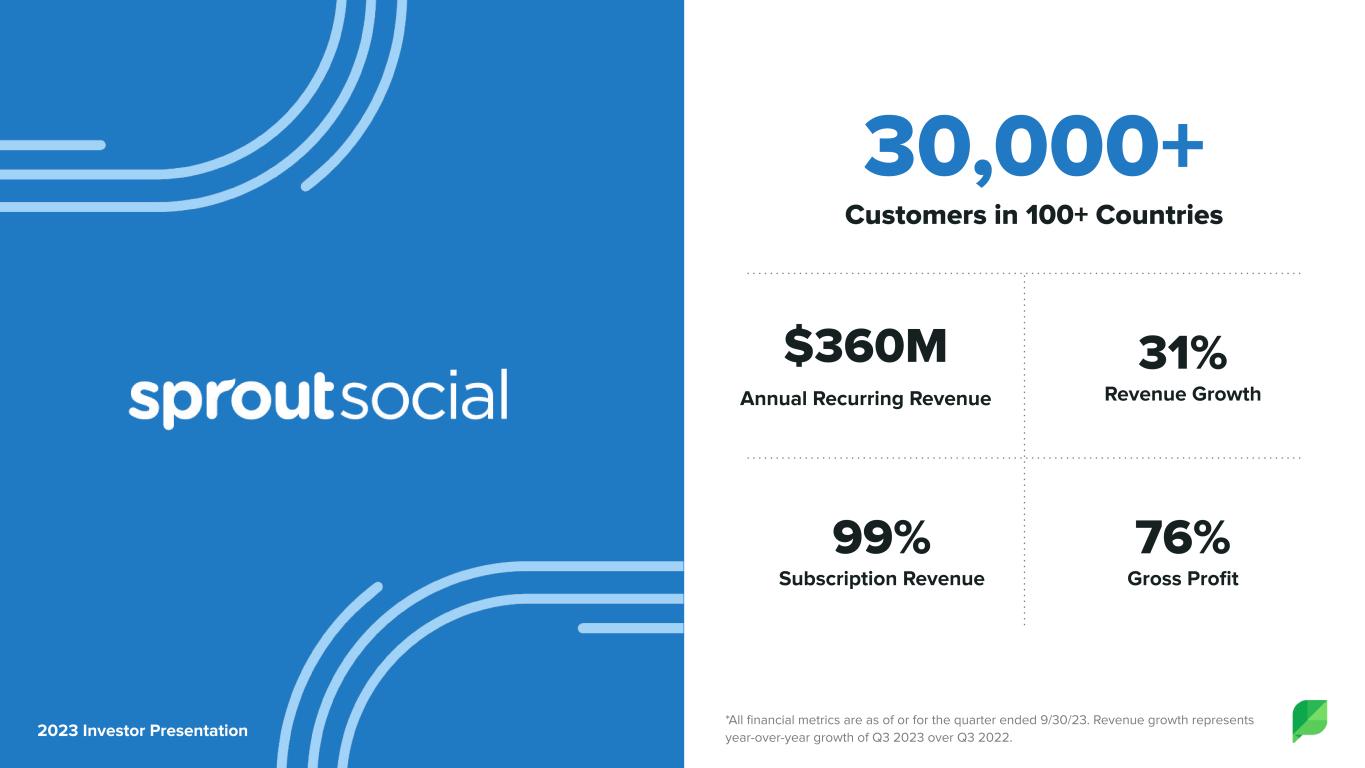
*All financial metrics are as of or for the quarter ended 9/30/23. Revenue growth represents year-over-year growth of Q3 2023 over Q3 2022. 30,000+ Customers in 100+ Countries 76% Gross Profit 31% Revenue Growth 99% Subscription Revenue $360M Annual Recurring Revenue 2023 Investor Presentation


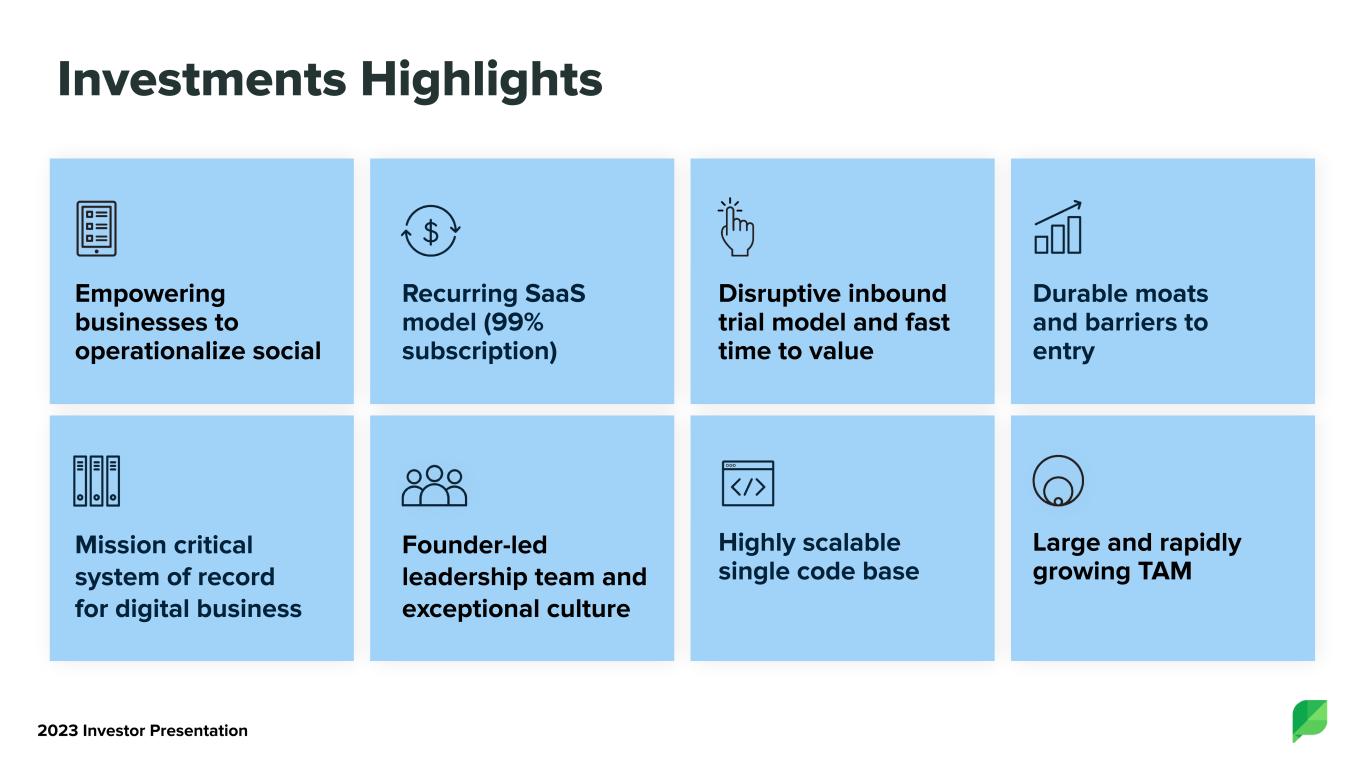
Investments Highlights Empowering businesses to operationalize social Mission critical system of record for digital business Recurring SaaS model (99% subscription) Founder-led leadership team and exceptional culture Disruptive inbound trial model and fast time to value Highly scalable single code base Durable moats and barriers to entry Large and rapidly growing TAM 2023 Investor Presentation


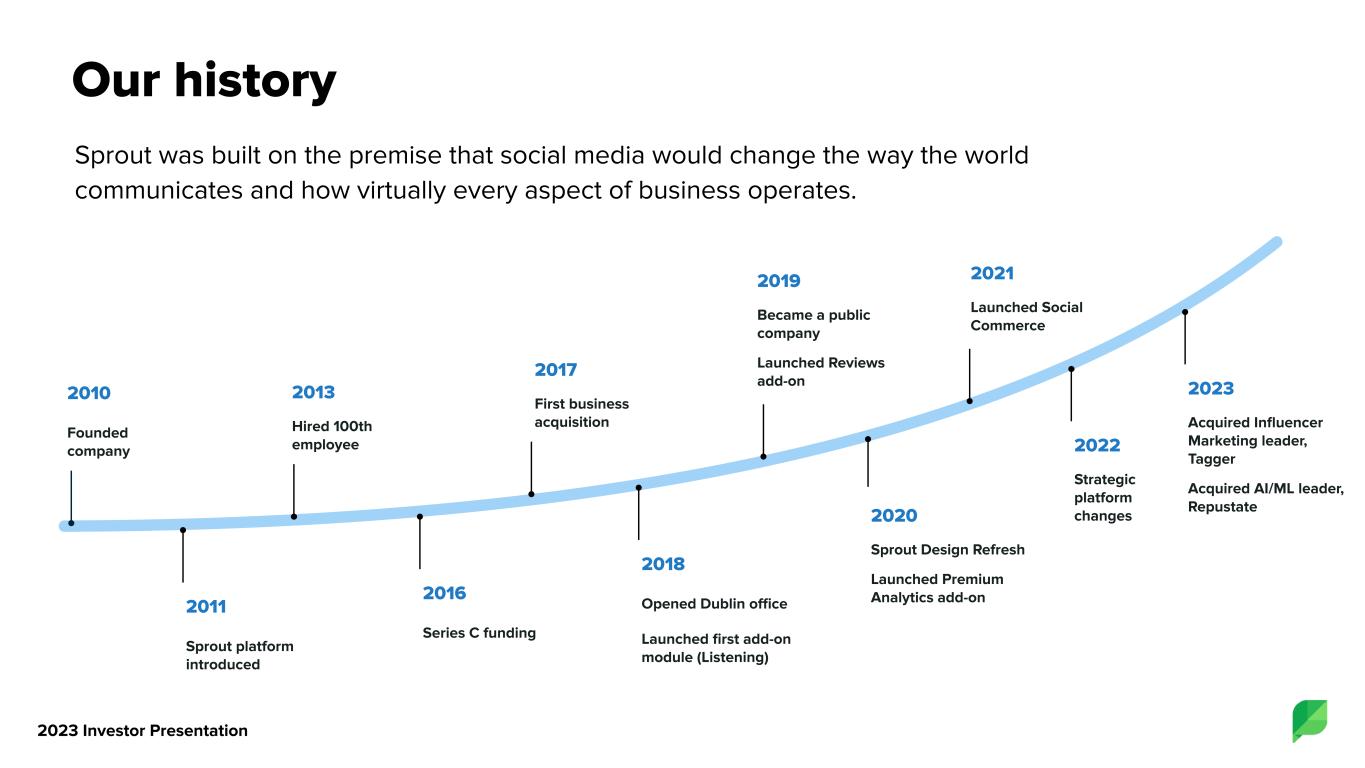
Our history Sprout was built on the premise that social media would change the way the world communicates and how virtually every aspect of business operates. 2011 Sprout platform introduced 2010 Founded company 2013 Hired 100th employee 2017 First business acquisition 2018 Opened Dublin office Launched first add-on module (Listening) 2019 Became a public company Launched Reviews add-on 2020 Sprout Design Refresh Launched Premium Analytics add-on 2021 Launched Social Commerce 2016 Series C funding 2022 Strategic platform changes 2023 Investor Presentation 2023 Acquired Influencer Marketing leader, Tagger Acquired AI/ML leader, Repustate


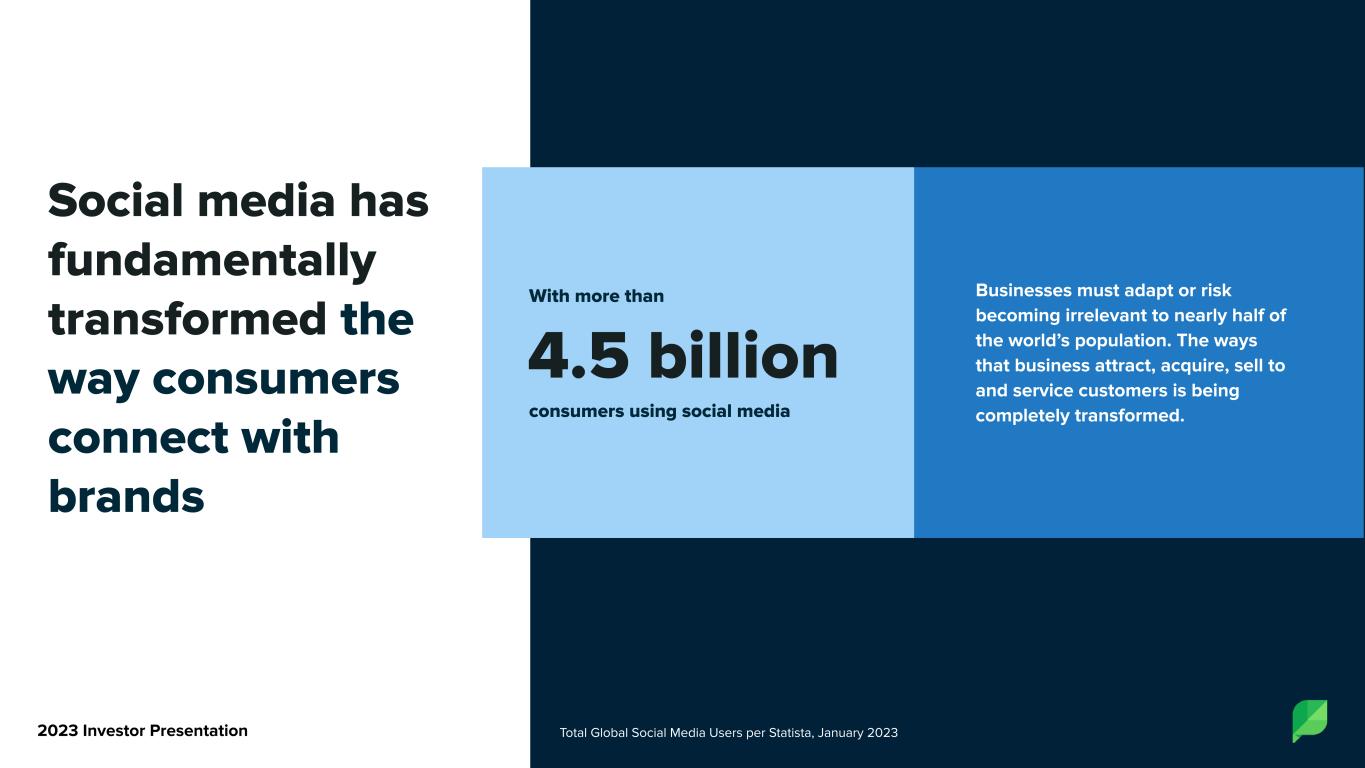
Social media has fundamentally transformed the way consumers connect with brands Businesses must adapt or risk becoming irrelevant to nearly half of the world’s population. The ways that business attract, acquire, sell to and service customers is being completely transformed. Total Global Social Media Users per Statista, January 20232023 Investor Presentation With more than consumers using social media 4.5 billion


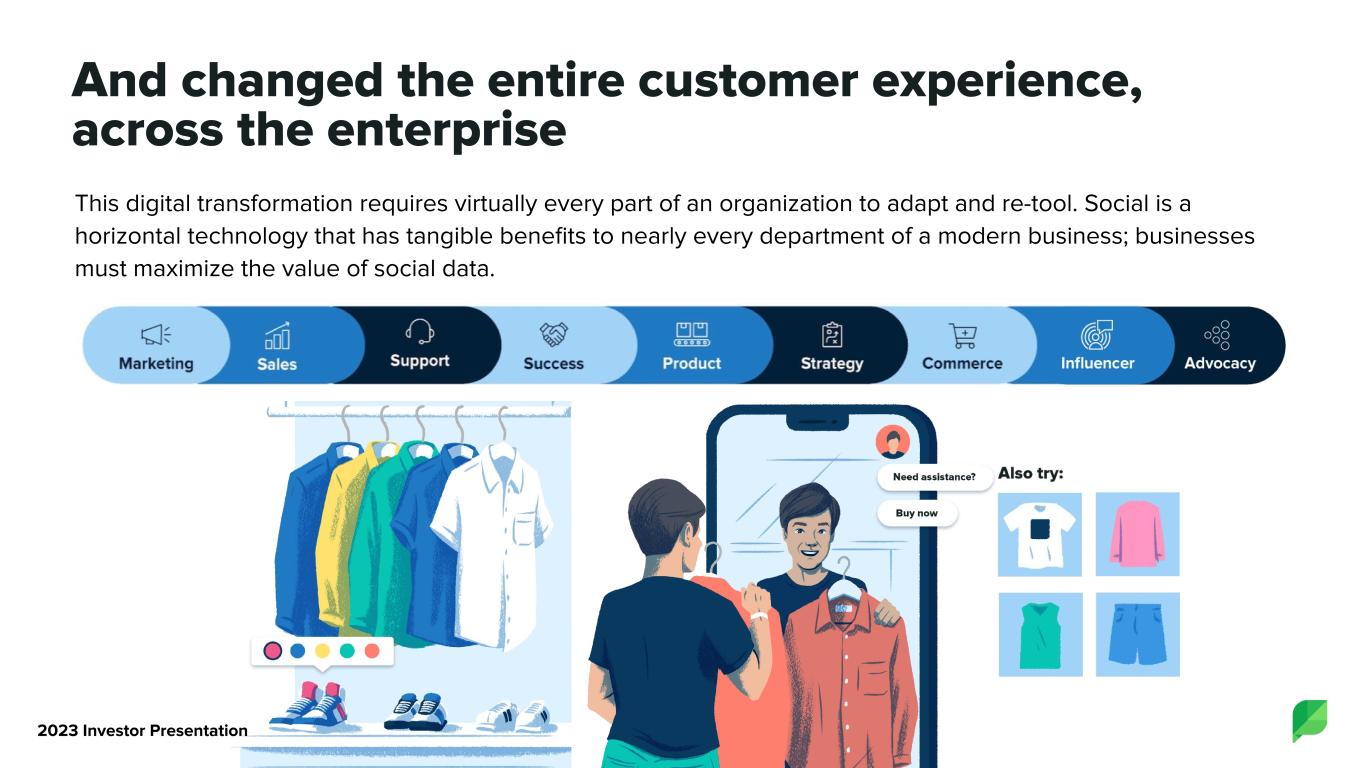
And changed the entire customer experience, across the enterprise This digital transformation requires virtually every part of an organization to adapt and re-tool. Social is a horizontal technology that has tangible benefits to nearly every department of a modern business; businesses must maximize the value of social data. 2023 Investor Presentation


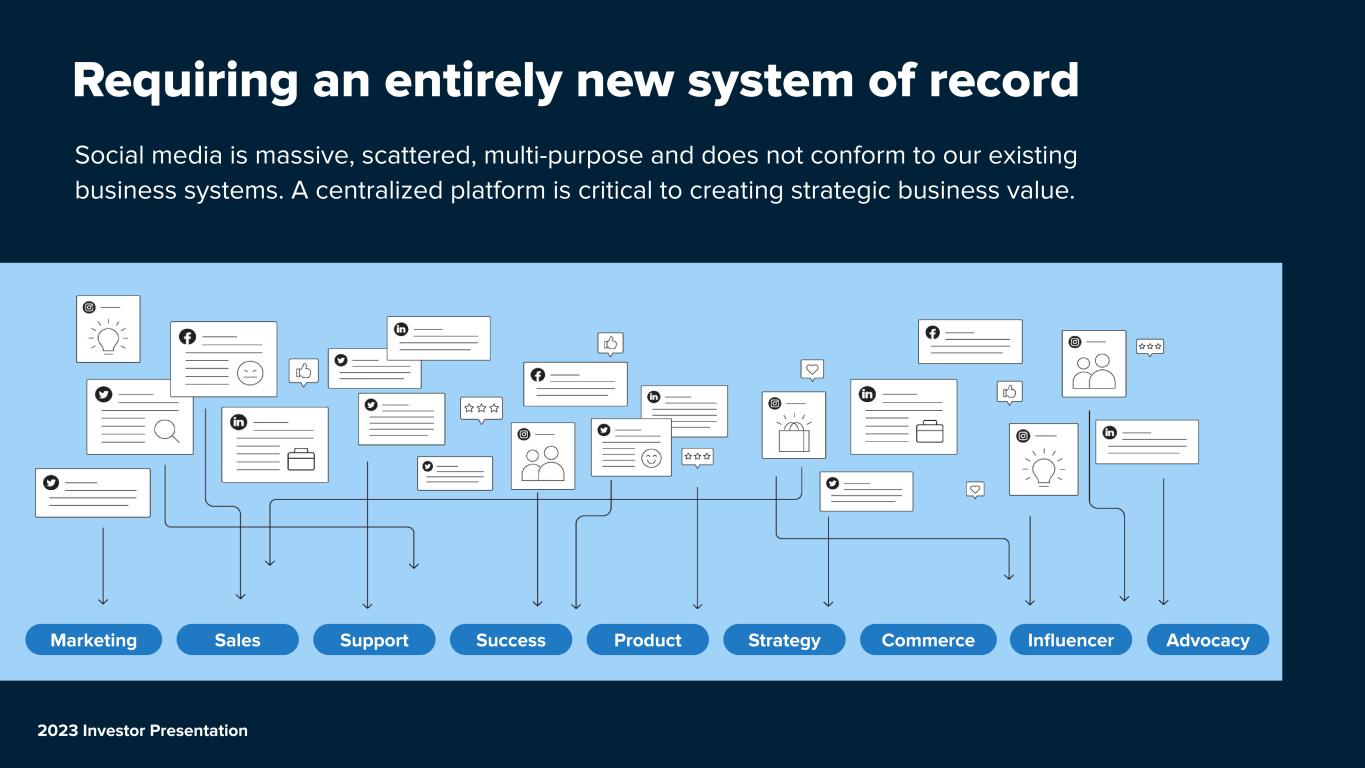
Requiring an entirely new system of record Social media is massive, scattered, multi-purpose and does not conform to our existing business systems. A centralized platform is critical to creating strategic business value. Marketing Sales Support Success Product Strategy Commerce Advocacy 2023 Investor Presentation Influencer


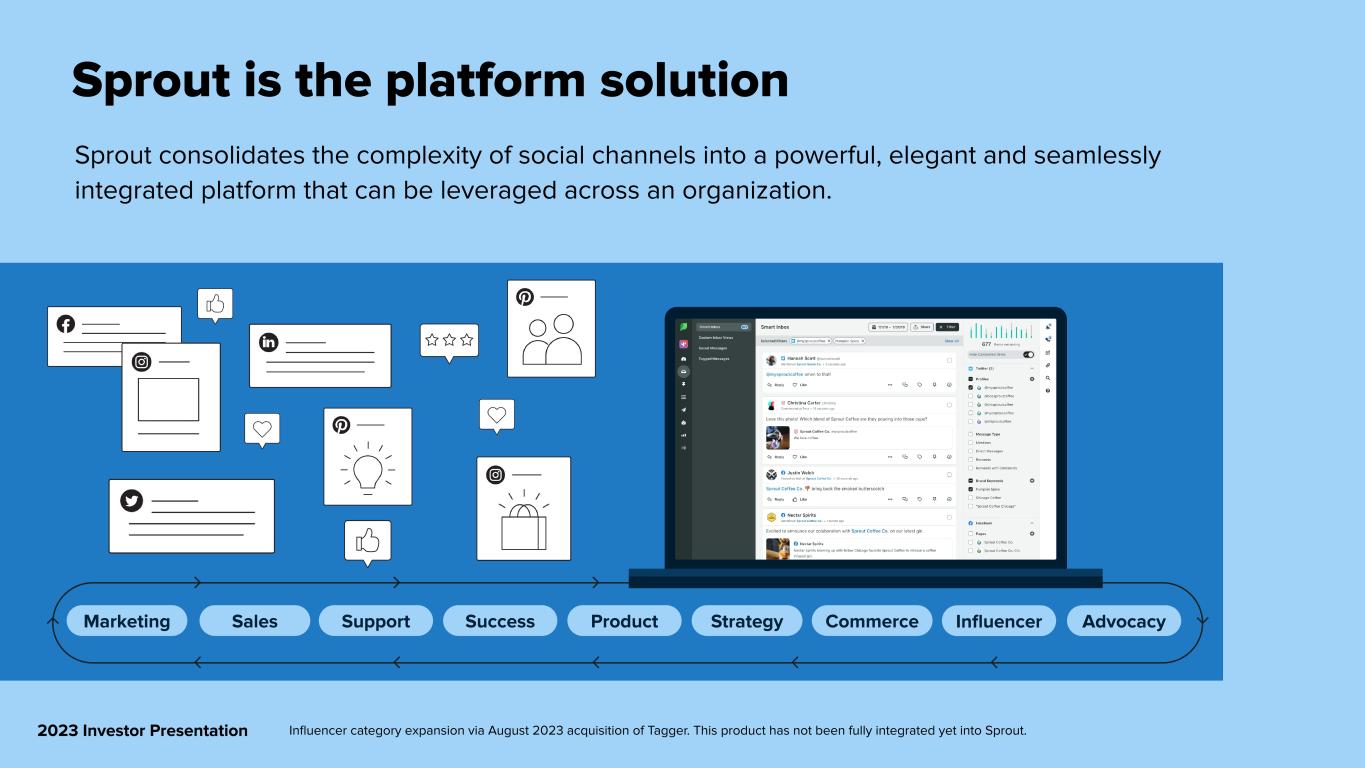
Marketing Sales Support Success Product Strategy Commerce Influencer Sprout is the platform solution Sprout consolidates the complexity of social channels into a powerful, elegant and seamlessly integrated platform that can be leveraged across an organization. 2023 Investor Presentation Advocacy Influencer category expansion via August 2023 acquisition of Tagger. This product has not been fully integrated yet into Sprout.


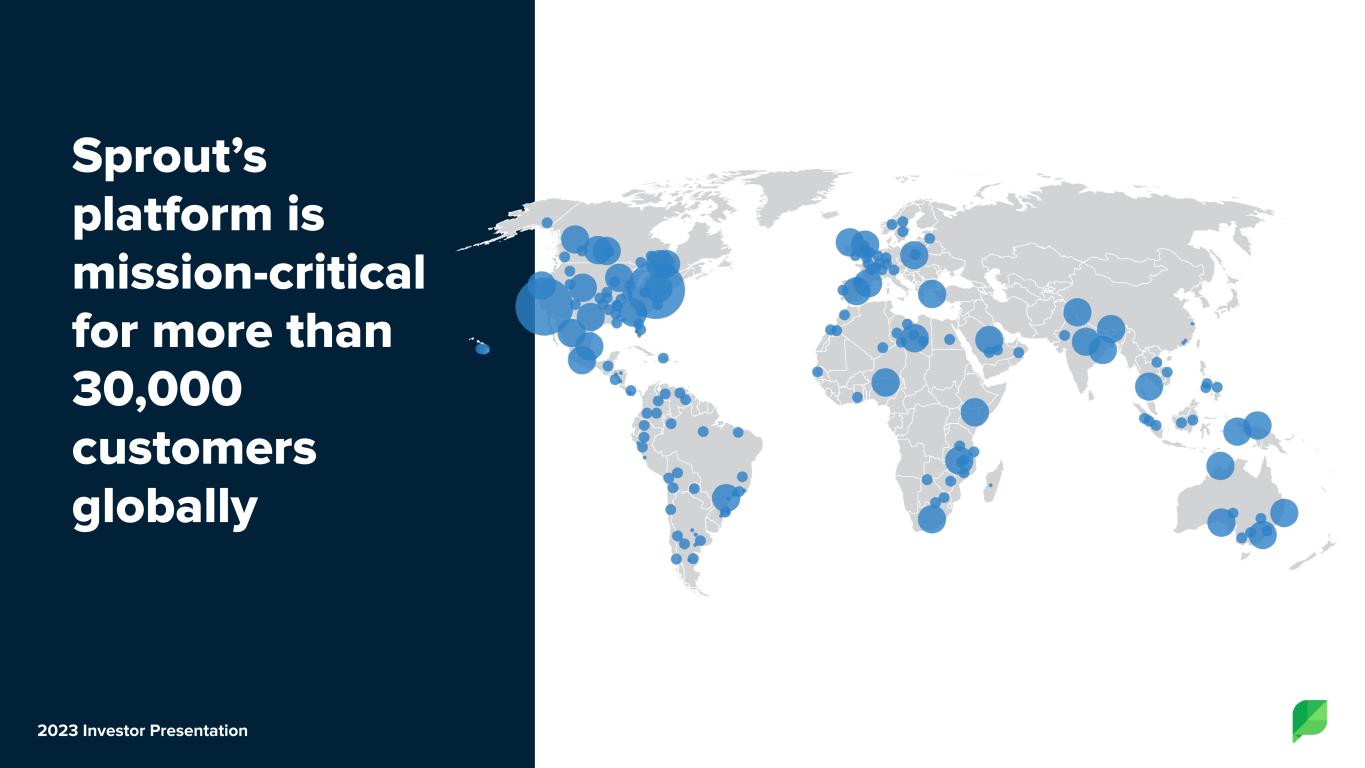
Sprout’s platform is mission-critical for more than 30,000 customers globally 2023 Investor Presentation


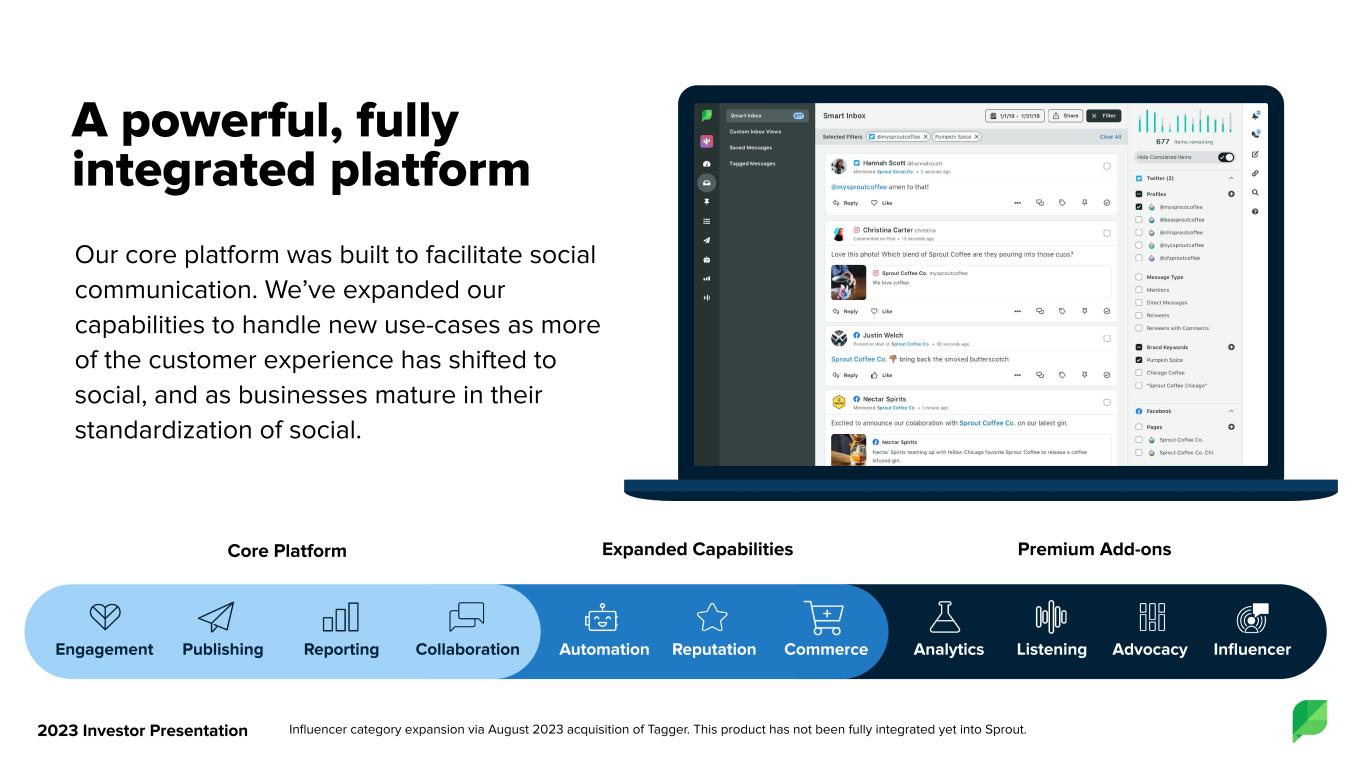
A powerful, fully integrated platform Our core platform was built to facilitate social communication. We’ve expanded our capabilities to handle new use-cases as more of the customer experience has shifted to social, and as businesses mature in their standardization of social. Expanded Capabilities Premium Add-onsCore Platform Analytics Listening Advocacy Expanded Capabilities Premium Add-ons Reputation CommerceAutomation Core Platform ReportingEngagement Publishing Collaboration ReportingEngagement Publishing Collaboration Reputation CommerceAutomation Analytics Listening Advocacy 2023 Investor Presentation Influencer Influencer category expansion via August 2023 acquisition of Tagger. This product has not been fully integrated yet into Sprout.


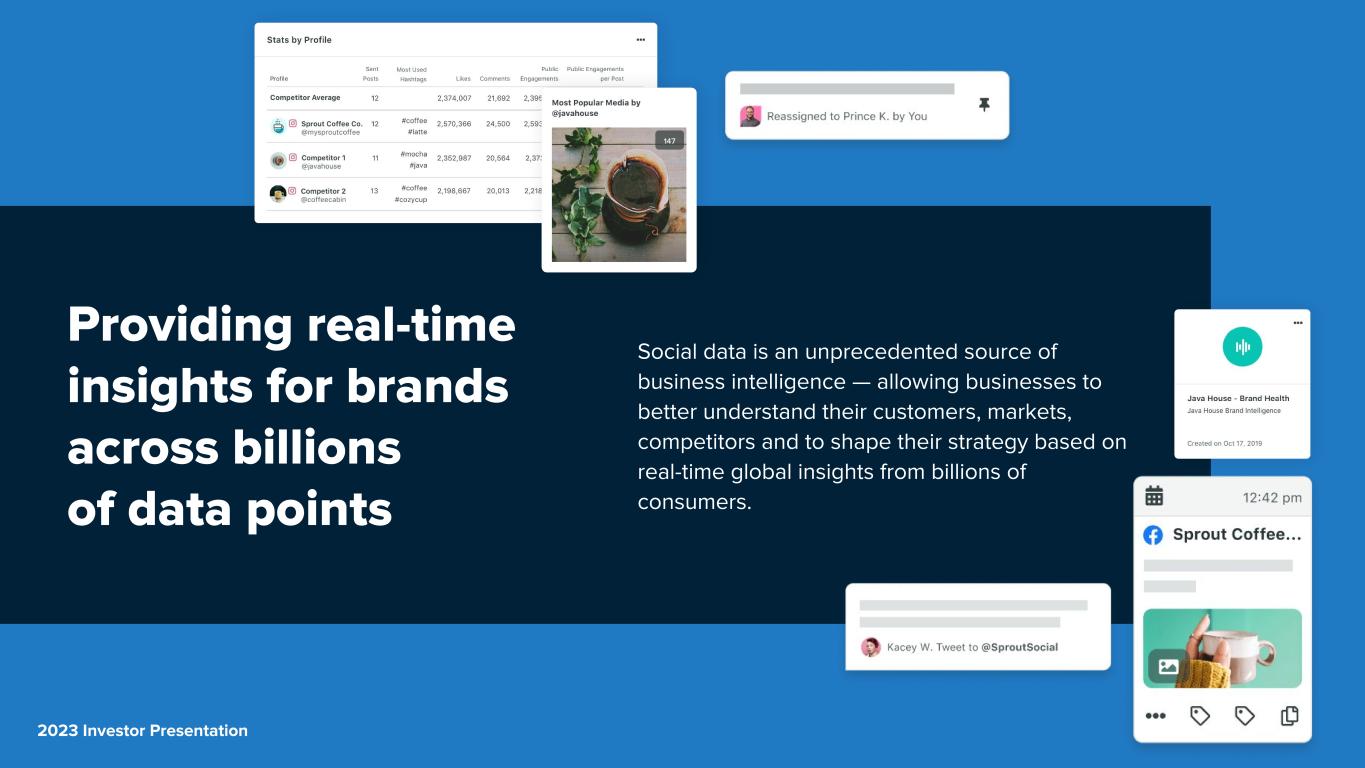
Providing real-time insights for brands across billions of data points Social data is an unprecedented source of business intelligence — allowing businesses to better understand their customers, markets, competitors and to shape their strategy based on real-time global insights from billions of consumers. 2023 Investor Presentation


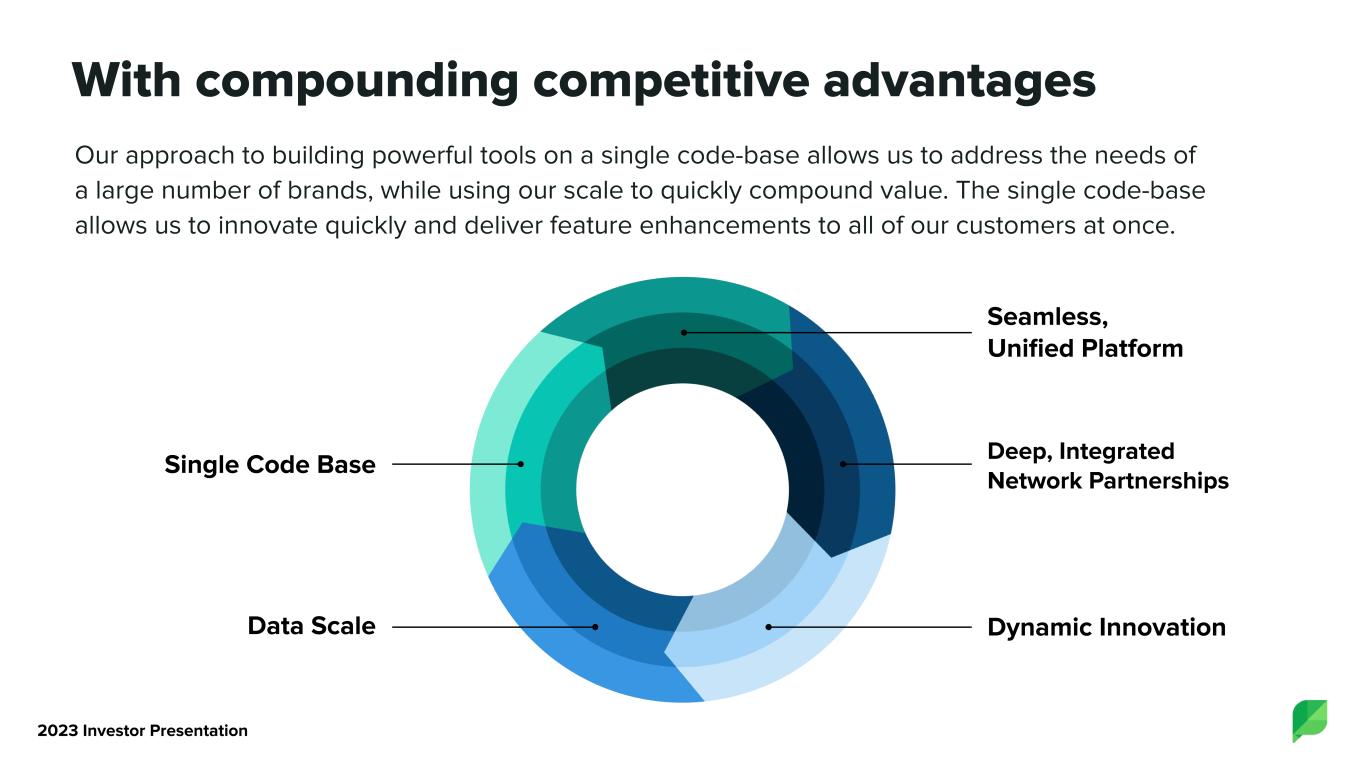
With compounding competitive advantages Our approach to building powerful tools on a single code-base allows us to address the needs of a large number of brands, while using our scale to quickly compound value. The single code-base allows us to innovate quickly and deliver feature enhancements to all of our customers at once. Deep, Integrated Network Partnerships Dynamic Innovation Seamless, Unified Platform Single Code Base Data Scale 2023 Investor Presentation


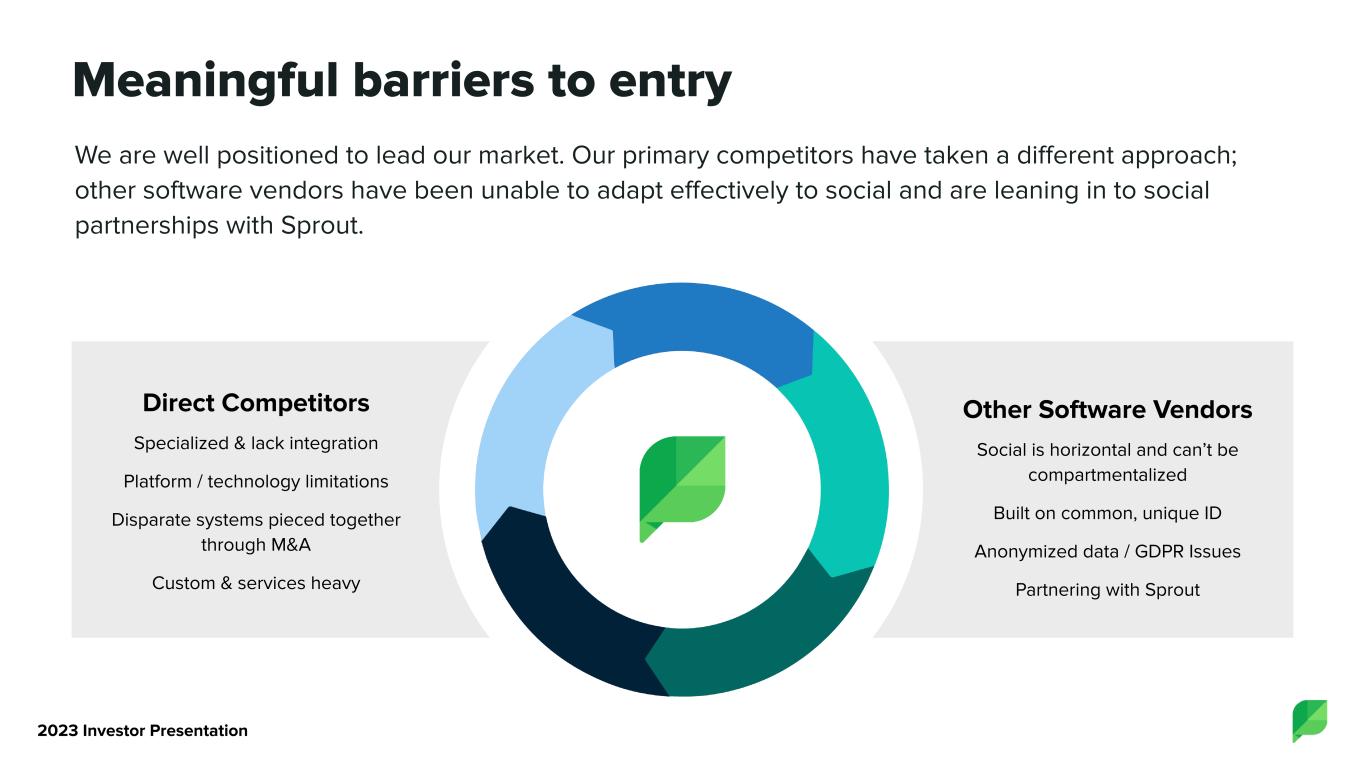
Direct Competitors Specialized & lack integration Platform / technology limitations Disparate systems pieced together through M&A Custom & services heavy Other Software Vendors Social is horizontal and can’t be compartmentalized Built on common, unique ID Anonymized data / GDPR Issues Partnering with Sprout Meaningful barriers to entry We are well positioned to lead our market. Our primary competitors have taken a different approach; other software vendors have been unable to adapt effectively to social and are leaning in to social partnerships with Sprout. 2023 Investor Presentation


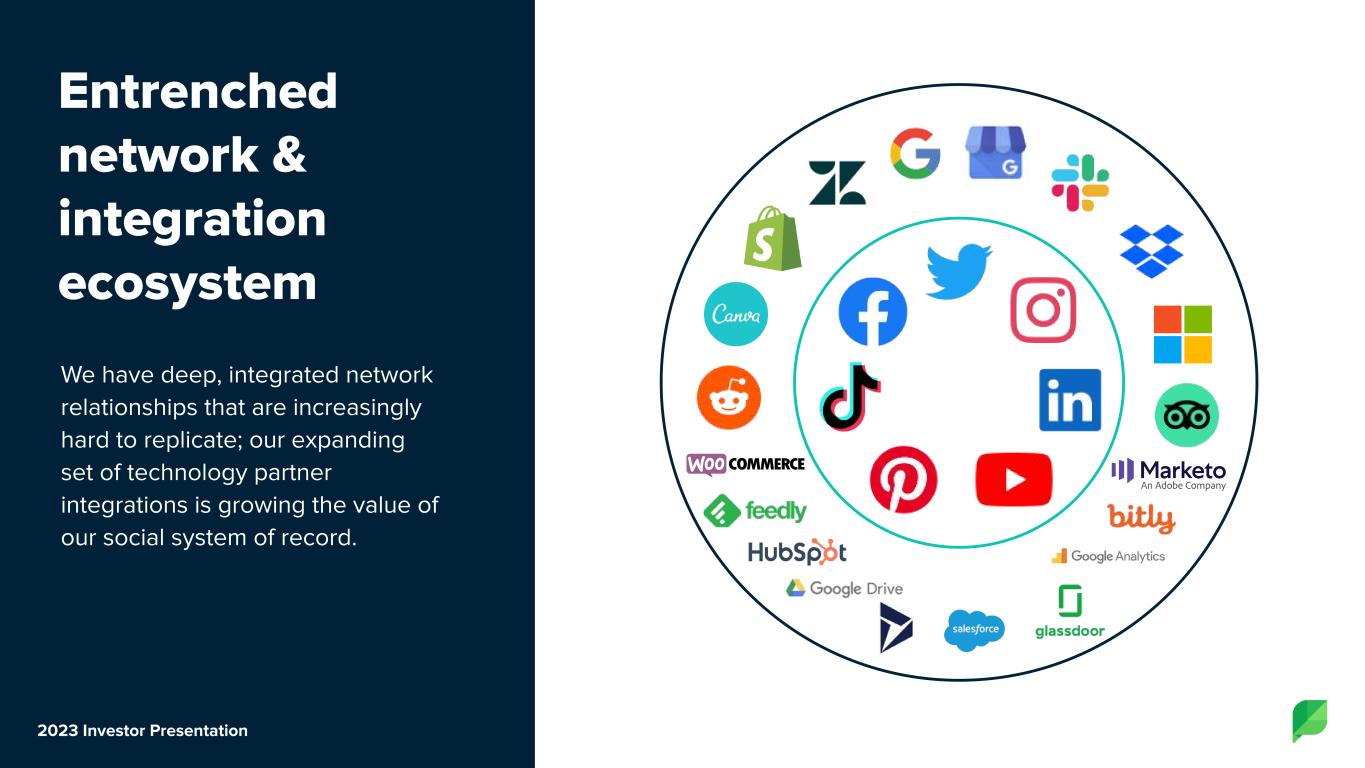
Entrenched network & integration ecosystem We have deep, integrated network relationships that are increasingly hard to replicate; our expanding set of technology partner integrations is growing the value of our social system of record. 2023 Investor Presentation


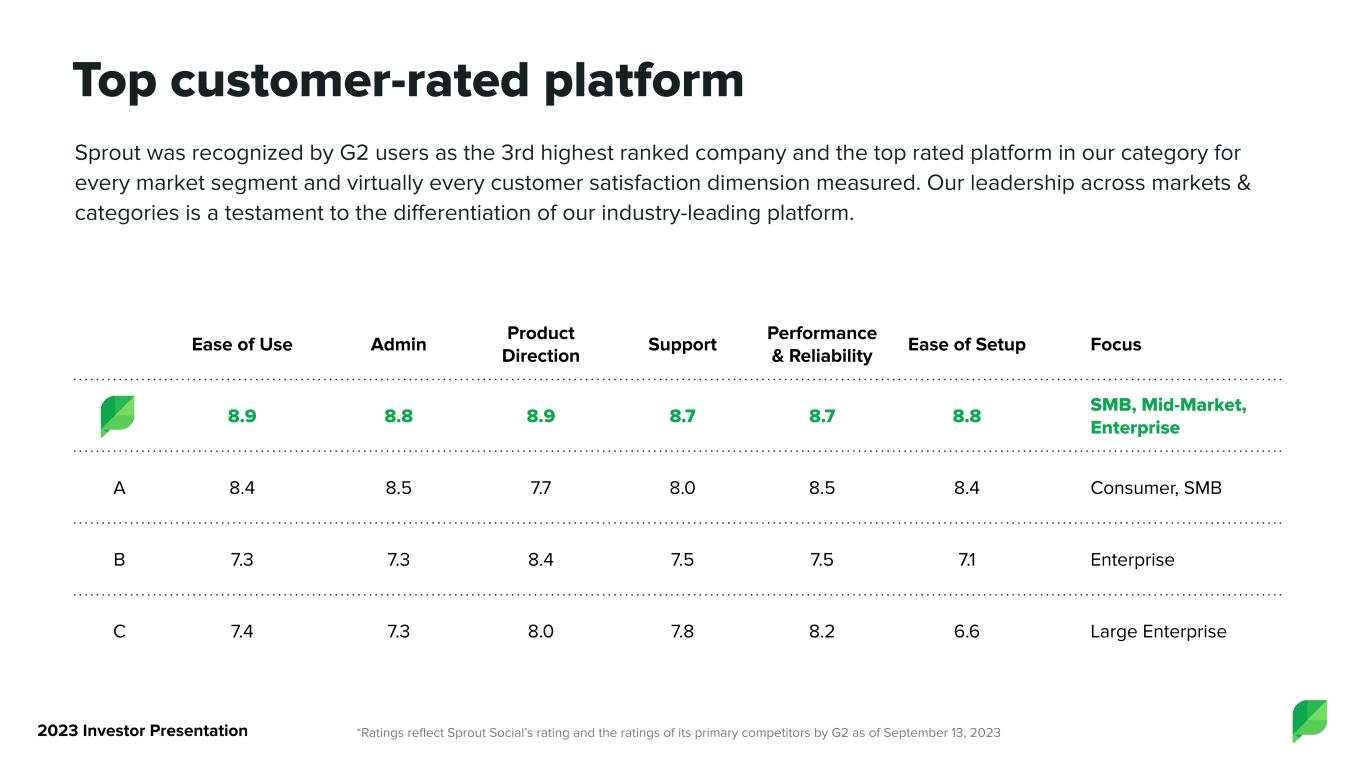
Top customer-rated platform Sprout was recognized by G2 users as the 3rd highest ranked company and the top rated platform in our category for every market segment and virtually every customer satisfaction dimension measured. Our leadership across markets & categories is a testament to the differentiation of our industry-leading platform. *Ratings reflect Sprout Social’s rating and the ratings of its primary competitors by G2 as of September 13, 2023 Ease of Use Admin Product Direction Support Performance & Reliability Ease of Setup Focus 8.9 8.8 8.9 8.7 8.7 8.8 SMB, Mid-Market, Enterprise A 8.4 8.5 7.7 8.0 8.5 8.4 Consumer, SMB B 7.3 7.3 8.4 7.5 7.5 7.1 Enterprise C 7.4 7.3 8.0 7.8 8.2 6.6 Large Enterprise 2023 Investor Presentation


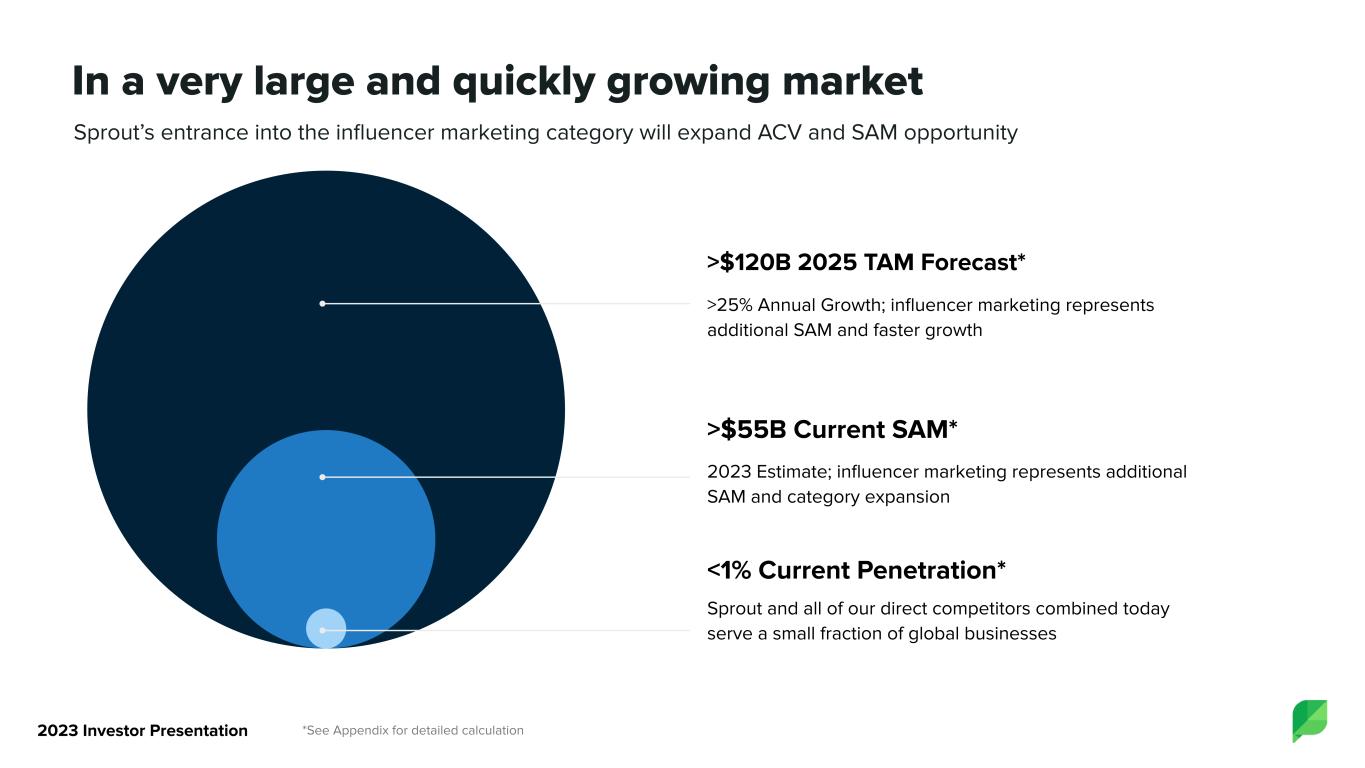
2023 Investor Presentation In a very large and quickly growing market >$55B Current SAM* 2023 Estimate; influencer marketing represents additional SAM and category expansion <1% Current Penetration* Sprout and all of our direct competitors combined today serve a small fraction of global businesses >$120B 2025 TAM Forecast* >25% Annual Growth; influencer marketing represents additional SAM and faster growth *See Appendix for detailed calculation Sprout’s entrance into the influencer marketing category will expand ACV and SAM opportunity


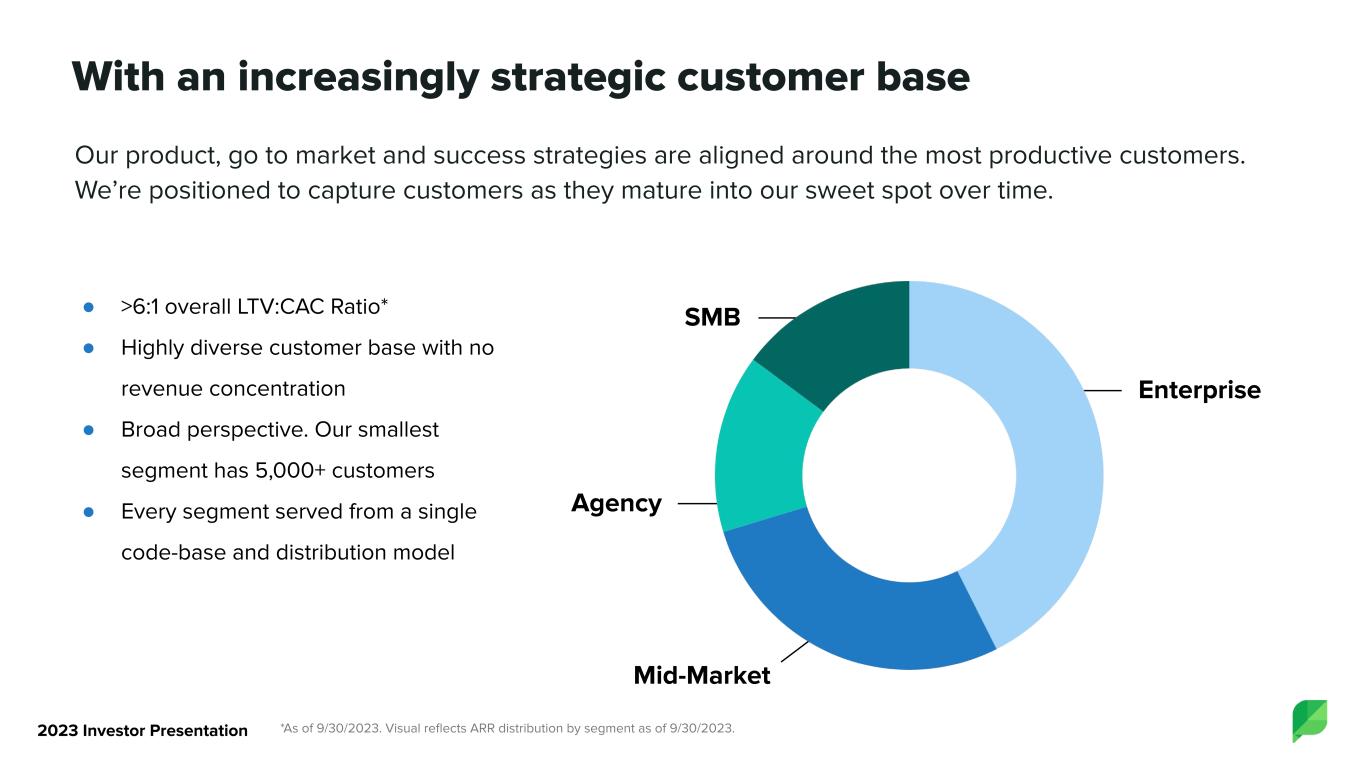
With an increasingly strategic customer base Our product, go to market and success strategies are aligned around the most productive customers. We’re positioned to capture customers as they mature into our sweet spot over time. ● >6:1 overall LTV:CAC Ratio* ● Highly diverse customer base with no revenue concentration ● Broad perspective. Our smallest segment has 5,000+ customers ● Every segment served from a single code-base and distribution model SMB Enterprise Agency Mid-Market *As of 9/30/2023. Visual reflects ARR distribution by segment as of 9/30/2023.2023 Investor Presentation


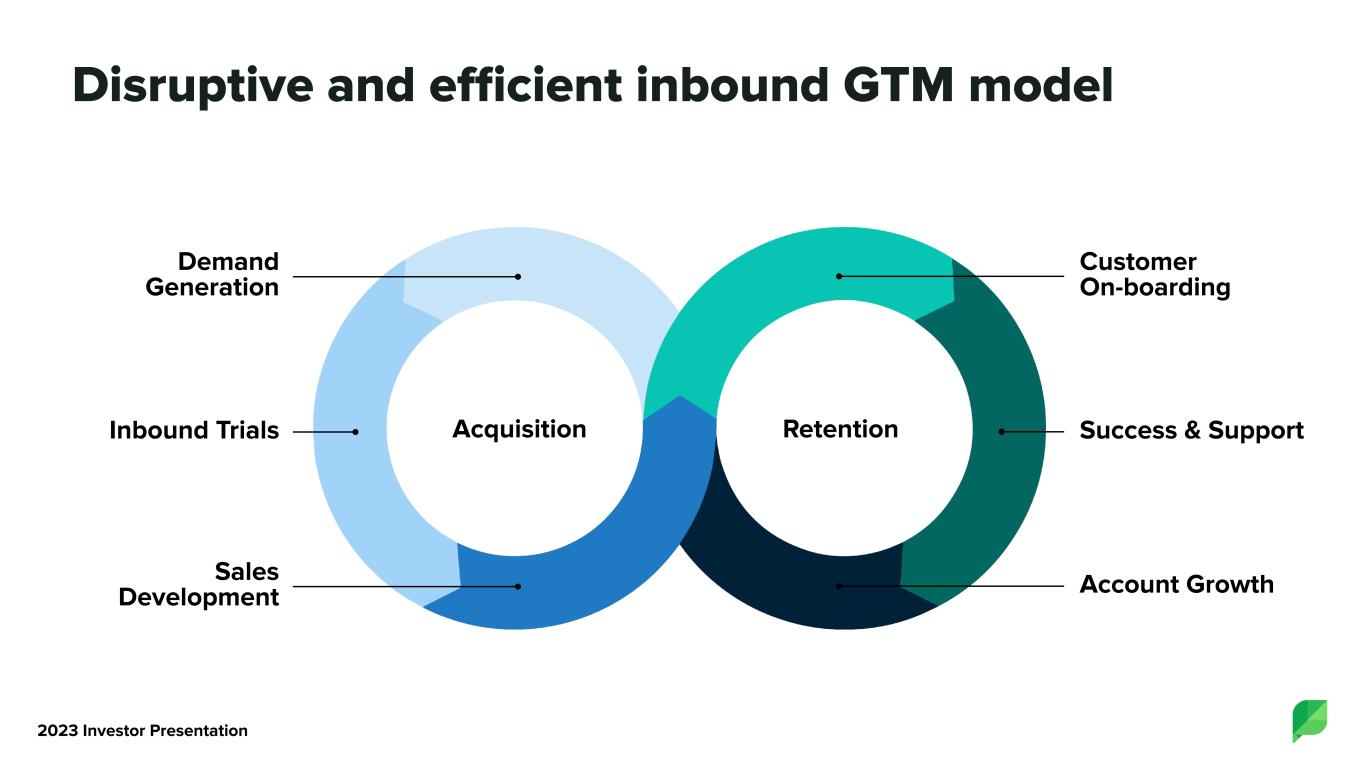
Disruptive and efficient inbound GTM model Success & Support Account Growth Customer On-boarding RetentionInbound Trials Sales Development Demand Generation Acquisition 2023 Investor Presentation


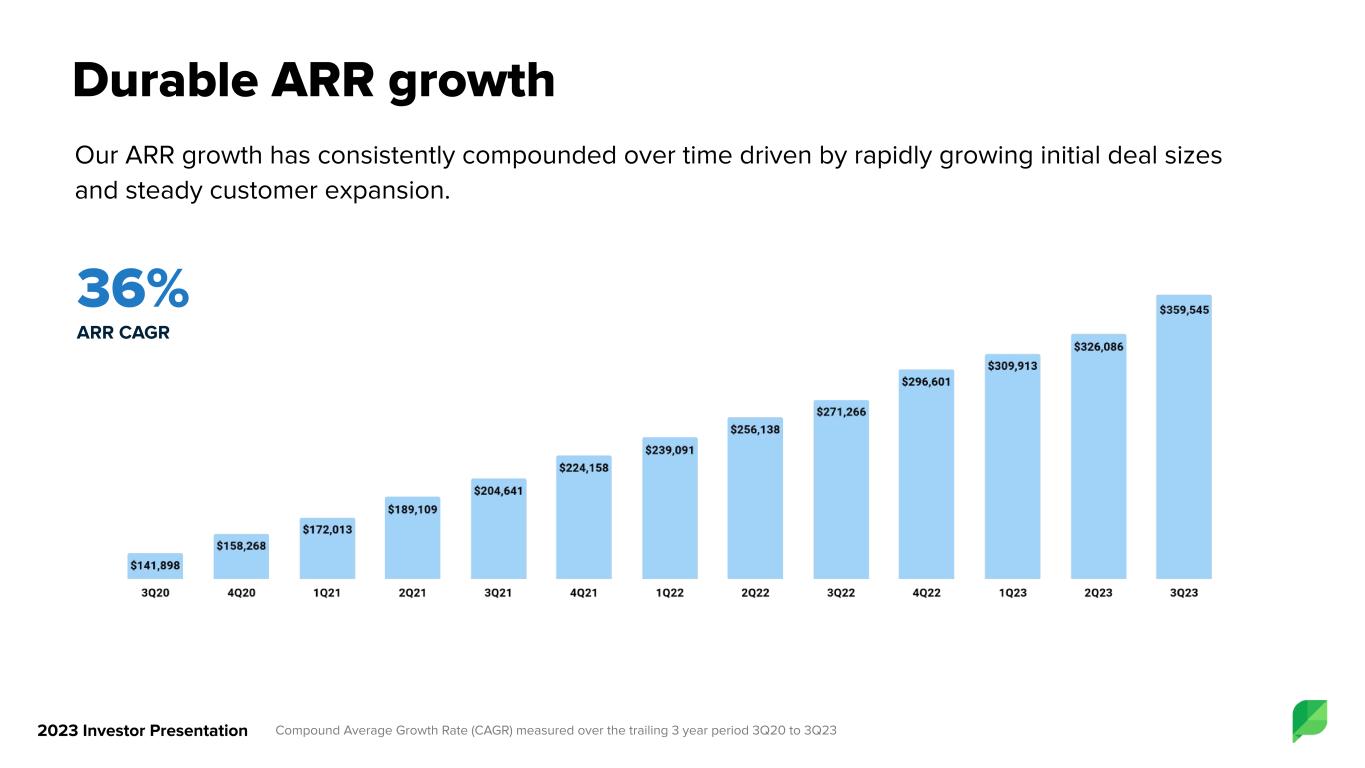
Durable ARR growth Our ARR growth has consistently compounded over time driven by rapidly growing initial deal sizes and steady customer expansion. 36% ARR CAGR Compound Average Growth Rate (CAGR) measured over the trailing 3 year period 3Q20 to 3Q232023 Investor Presentation


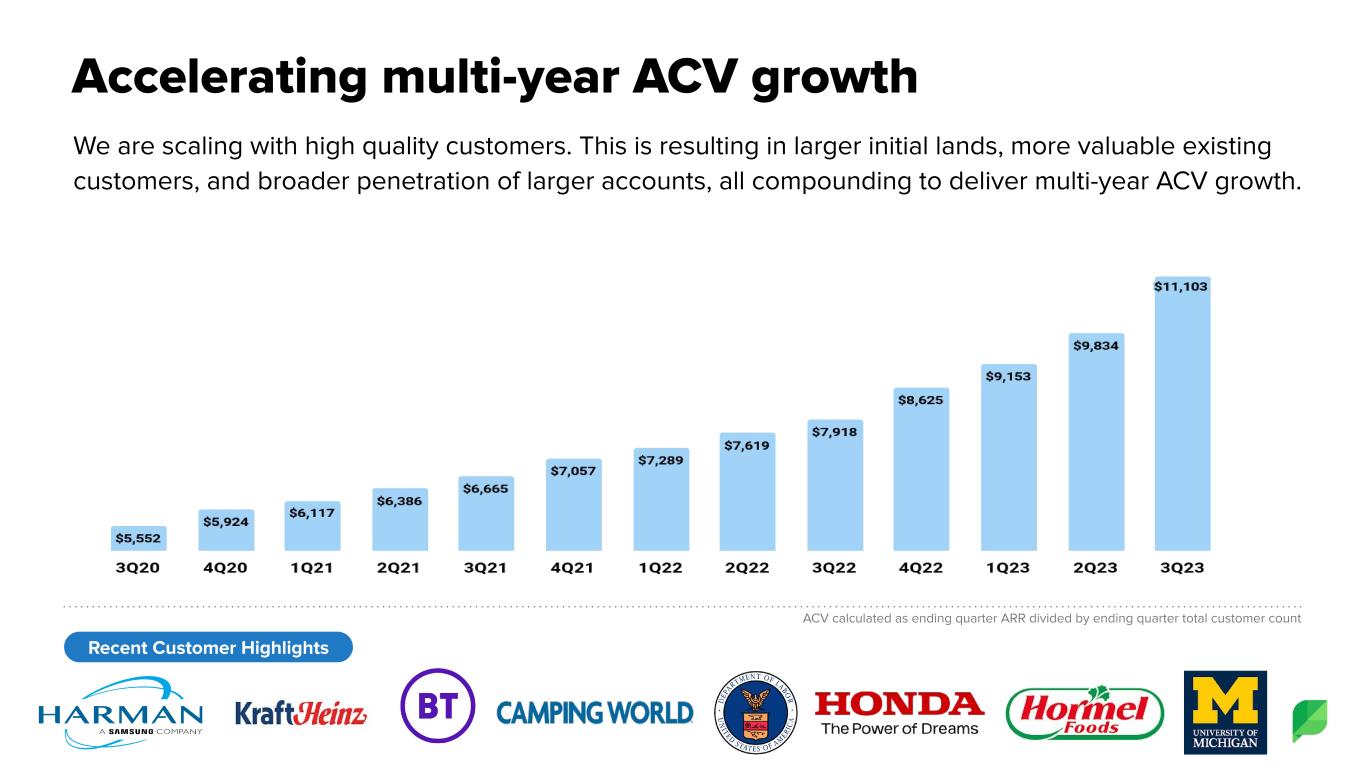
Accelerating multi-year ACV growth We are scaling with high quality customers. This is resulting in larger initial lands, more valuable existing customers, and broader penetration of larger accounts, all compounding to deliver multi-year ACV growth. Recent Customer Highlights ACV calculated as ending quarter ARR divided by ending quarter total customer count


Broadening customer adoption As we accelerate growth with our largest customers, we are establishing ourselves as the social system of record, intelligence and action. Recent Customer Highlights


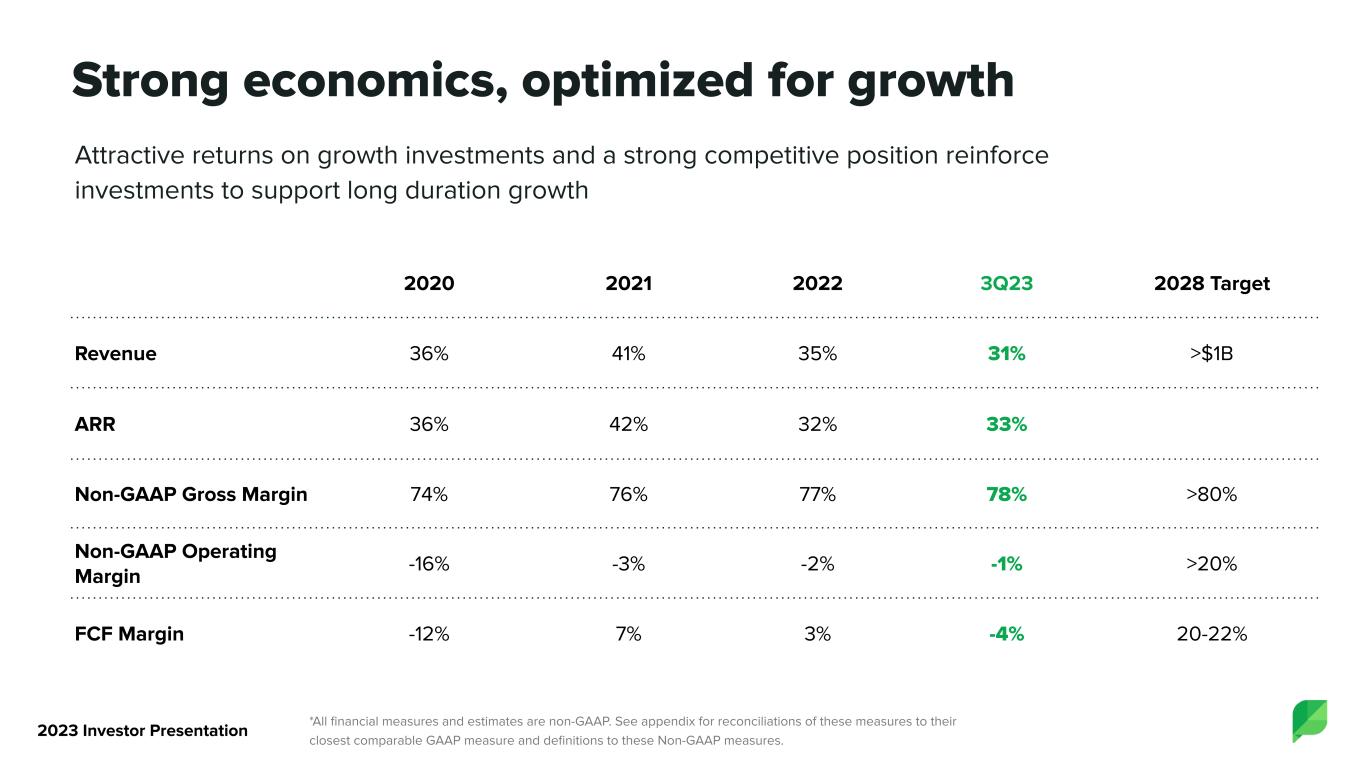
Strong economics, optimized for growth Attractive returns on growth investments and a strong competitive position reinforce investments to support long duration growth 2020 2021 2022 3Q23 2028 Target Revenue 36% 41% 35% 31% >$1B ARR 36% 42% 32% 33% Non-GAAP Gross Margin 74% 76% 77% 78% >80% Non-GAAP Operating Margin -16% -3% -2% -1% >20% FCF Margin -12% 7% 3% -4% 20-22% *All financial measures and estimates are non-GAAP. See appendix for reconciliations of these measures to their closest comparable GAAP measure and definitions to these Non-GAAP measures. 2023 Investor Presentation


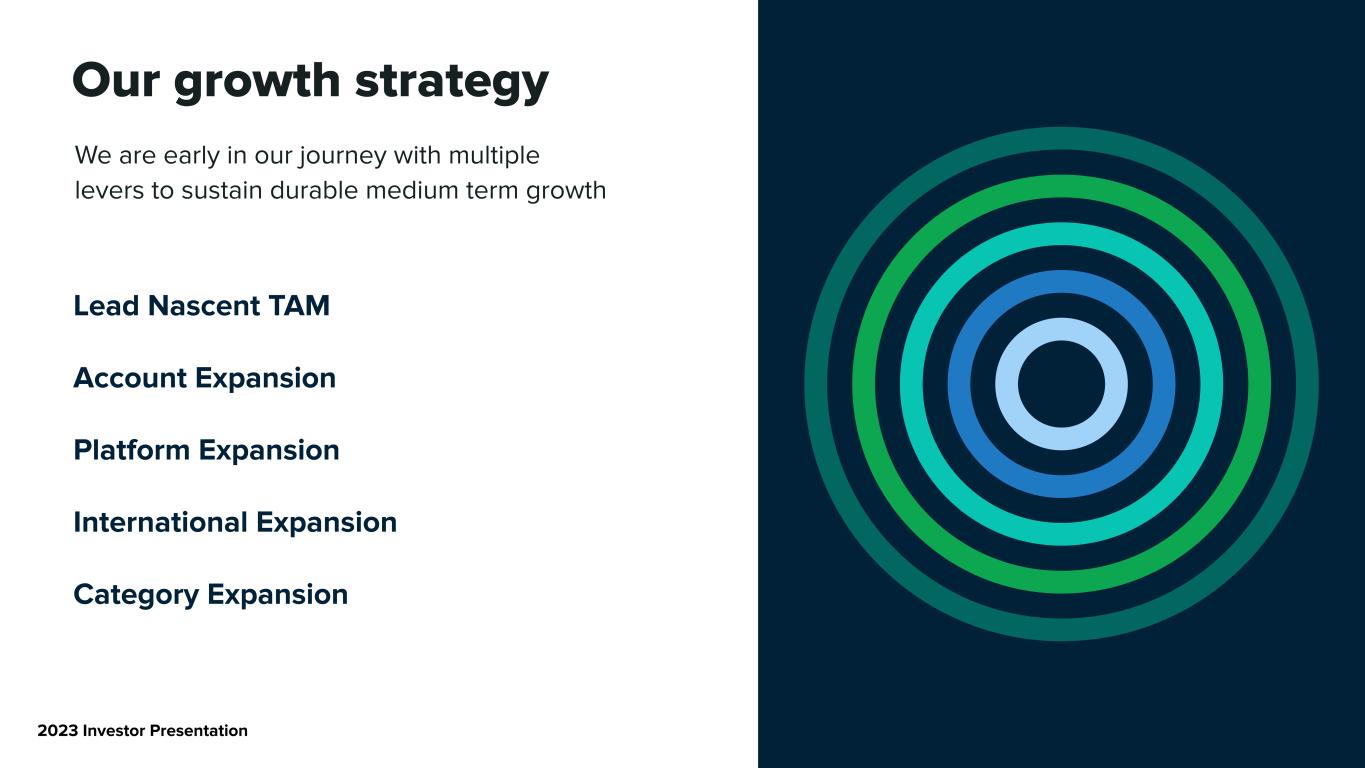
Our growth strategy We are early in our journey with multiple levers to sustain durable medium term growth Lead Nascent TAM Account Expansion Platform Expansion International Expansion Category Expansion 24 2023 Investor Presentation


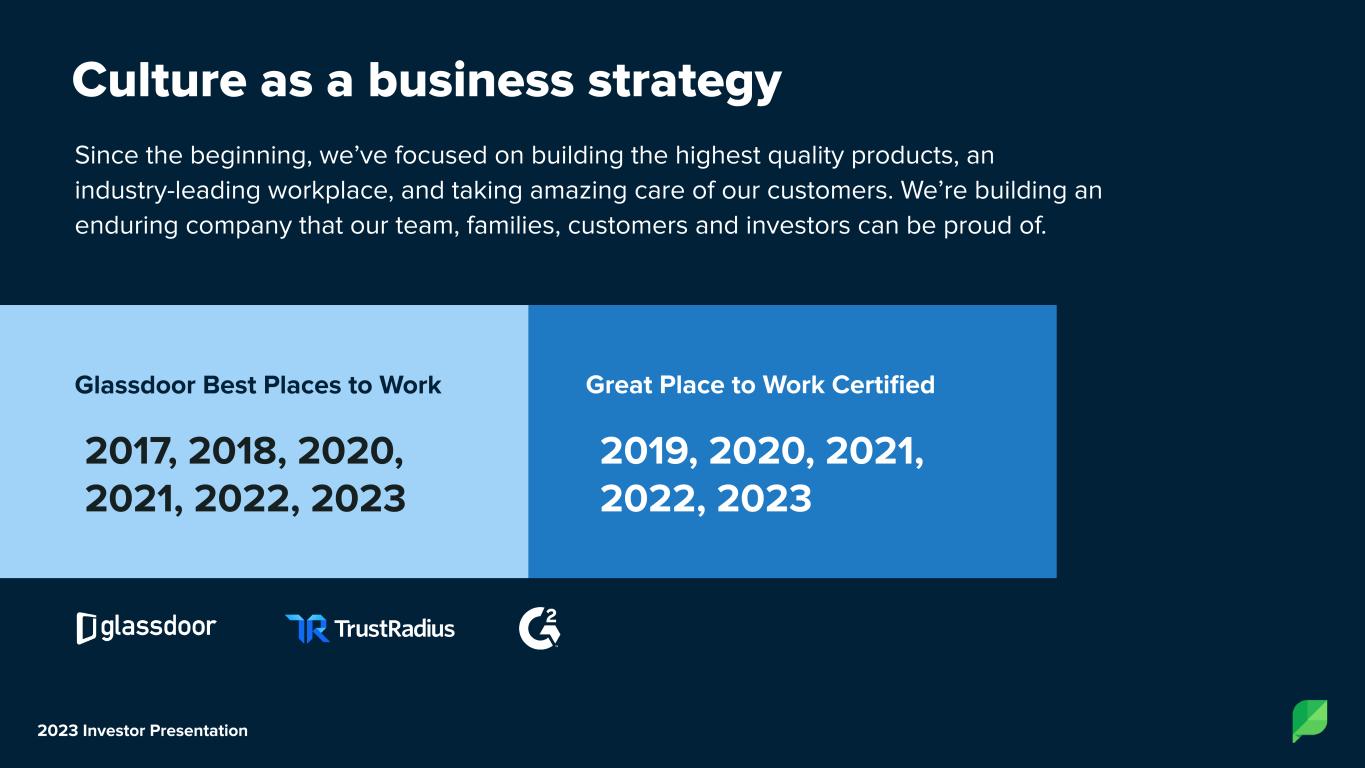
Culture as a business strategy Great Place to Work Certified Since the beginning, we’ve focused on building the highest quality products, an industry-leading workplace, and taking amazing care of our customers. We’re building an enduring company that our team, families, customers and investors can be proud of. Glassdoor Best Places to Work 2023 Investor Presentation 2019, 2020, 2021, 2022, 2023 2017, 2018, 2020, 2021, 2022, 2023


Driven by a world-class leadership team Heidi Jonas General Counsel Joe Del Preto CFO Jamie Gilpin CMO Ryan Barretto President Rachael Pfenning SVP, People & Operations Peter Soung Head of Growth Alan Boyce SVP, Engineering Aaron Rankin CTO Justyn Howard CEO Gil Lara CCO Team background 2023 Investor Presentation John Schoenstein CRO


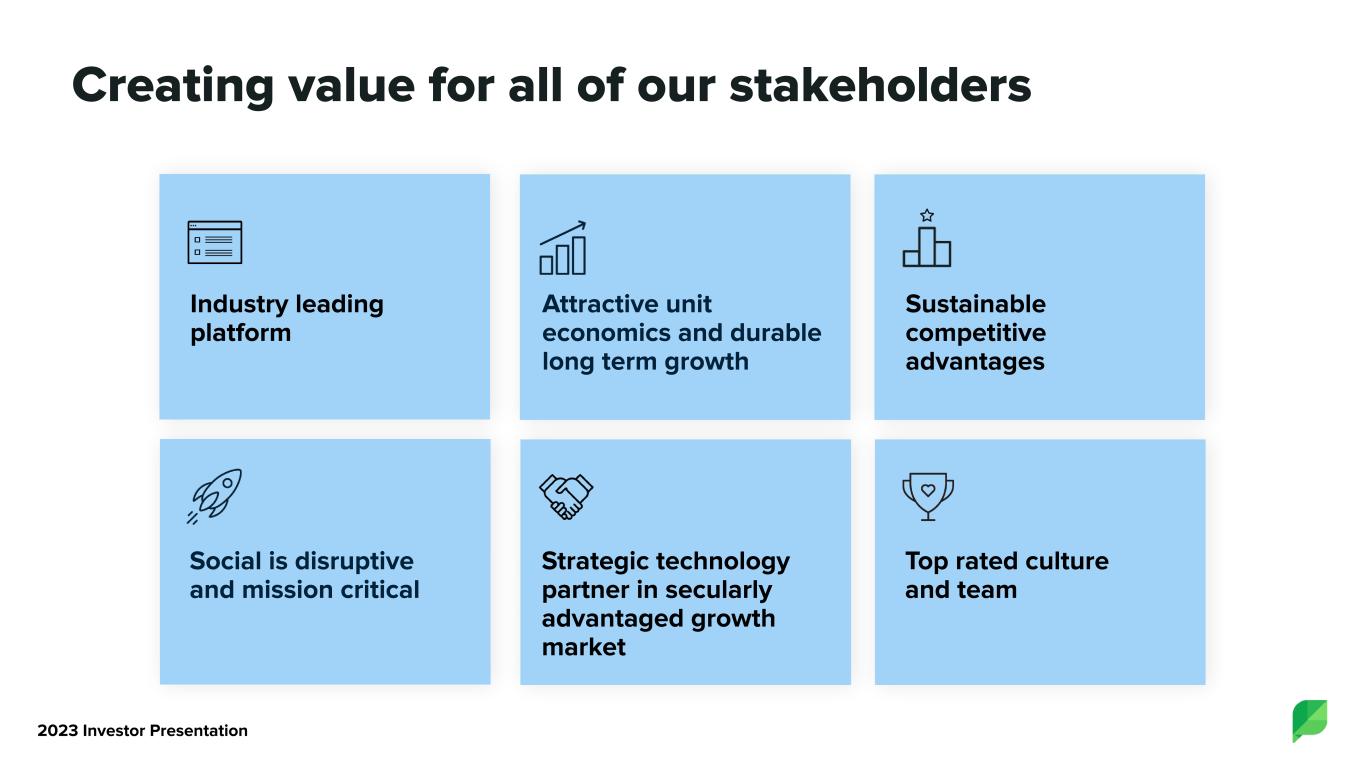
Creating value for all of our stakeholders Social is disruptive and mission critical Attractive unit economics and durable long term growth Strategic technology partner in secularly advantaged growth market Sustainable competitive advantages Top rated culture and team Industry leading platform 2023 Investor Presentation


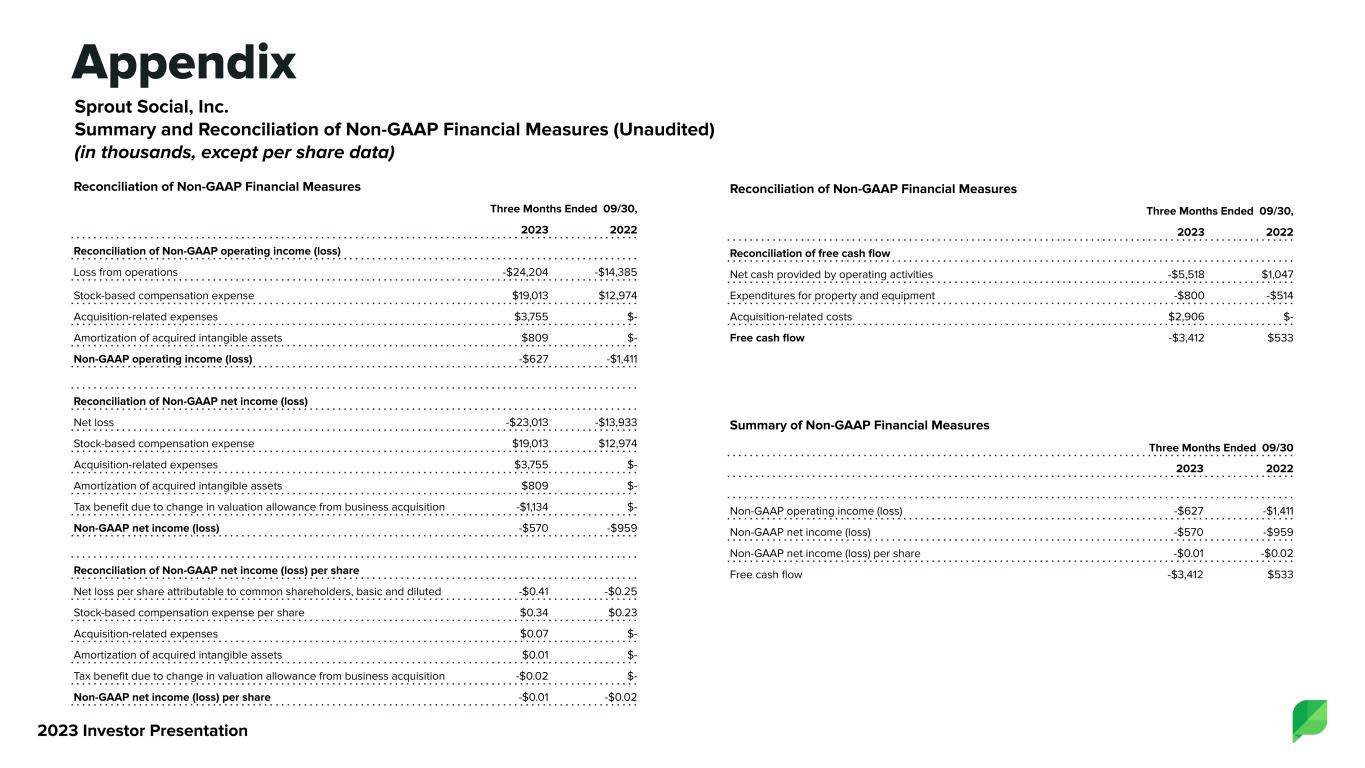
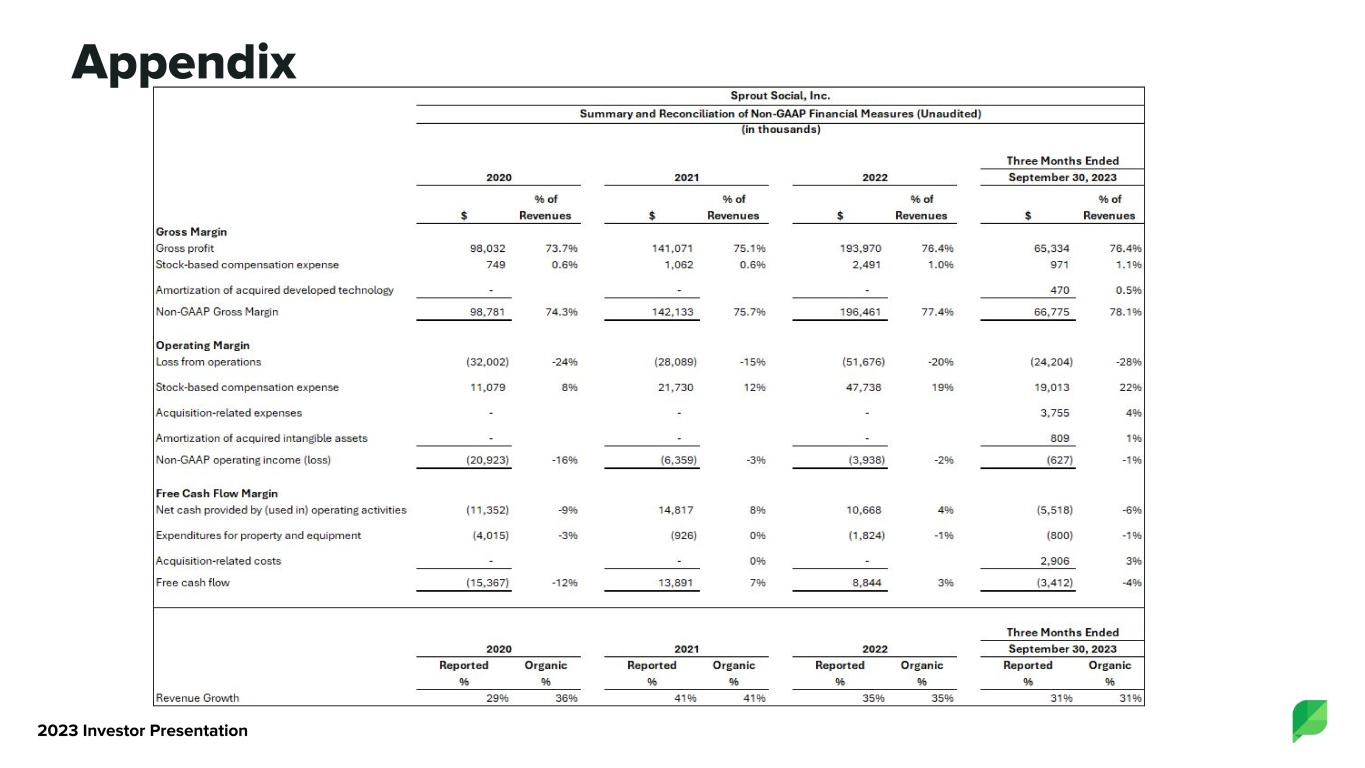
Appendix Sprout Social, Inc. Summary and Reconciliation of Non-GAAP Financial Measures (Unaudited) (in thousands, except per share data) Reconciliation of Non-GAAP Financial Measures Three Months Ended 09/30, 2023 2022 Reconciliation of Non-GAAP operating income (loss) Loss from operations -$24,204 -$14,385 Stock-based compensation expense $19,013 $12,974 Acquisition-related expenses $3,755 $- Amortization of acquired intangible assets $809 $- Non-GAAP operating income (loss) -$627 -$1,411 Reconciliation of Non-GAAP net income (loss) Net loss -$23,013 -$13,933 Stock-based compensation expense $19,013 $12,974 Acquisition-related expenses $3,755 $- Amortization of acquired intangible assets $809 $- Tax benefit due to change in valuation allowance from business acquisition -$1,134 $- Non-GAAP net income (loss) -$570 -$959 Reconciliation of Non-GAAP net income (loss) per share Net loss per share attributable to common shareholders, basic and diluted -$0.41 -$0.25 Stock-based compensation expense per share $0.34 $0.23 Acquisition-related expenses $0.07 $- Amortization of acquired intangible assets $0.01 $- Tax benefit due to change in valuation allowance from business acquisition -$0.02 $- Non-GAAP net income (loss) per share -$0.01 -$0.02 Summary of Non-GAAP Financial Measures Three Months Ended 09/30 2023 2022 Non-GAAP operating income (loss) -$627 -$1,411 Non-GAAP net income (loss) -$570 -$959 Non-GAAP net income (loss) per share -$0.01 -$0.02 Free cash flow -$3,412 $533 2023 Investor Presentation Reconciliation of Non-GAAP Financial Measures Three Months Ended 09/30, 2023 2022 Reconciliation of free cash flow Net cash provided by operating activities -$5,518 $1,047 Expenditures for property and equipment -$800 -$514 Acquisition-related costs $2,906 $- Free cash flow -$3,412 $533


Appendix 2023 Investor Presentation


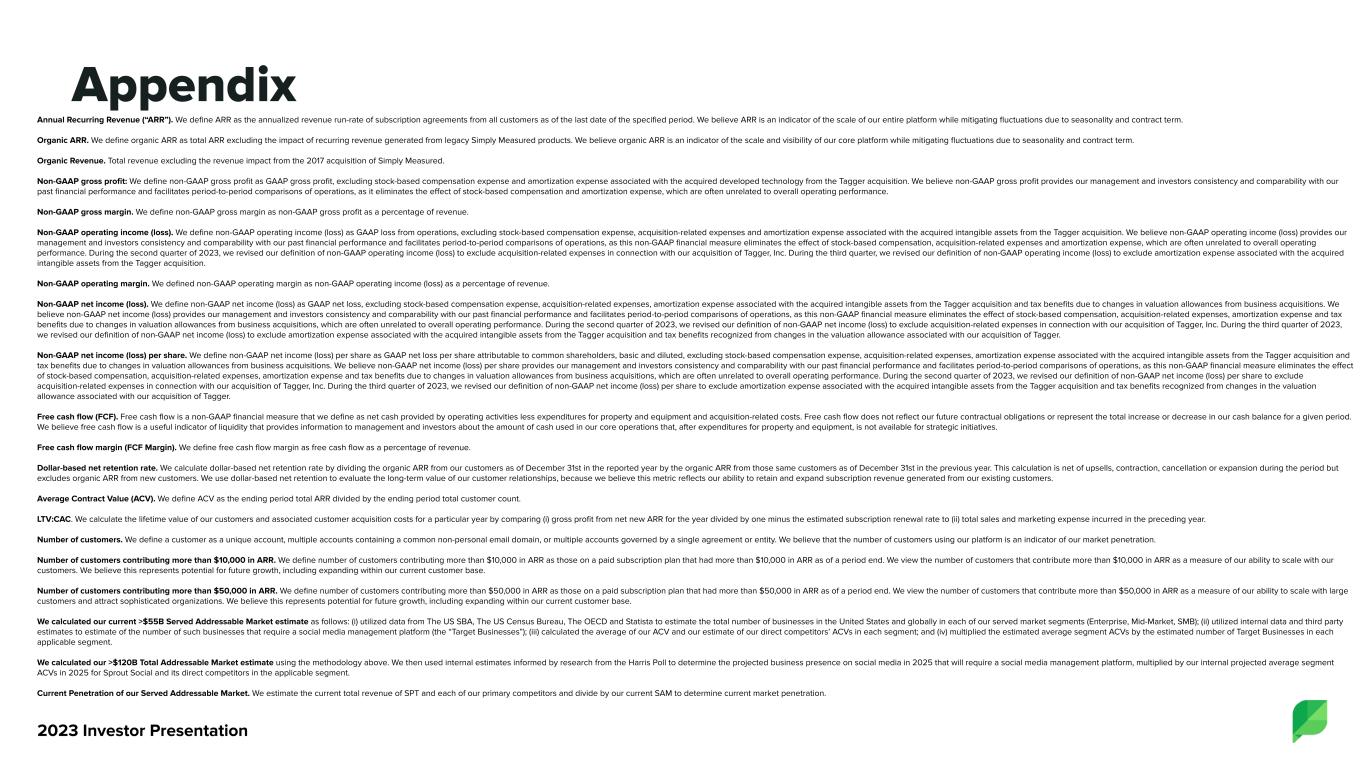
Appendix Annual Recurring Revenue (“ARR”). We define ARR as the annualized revenue run-rate of subscription agreements from all customers as of the last date of the specified period. We believe ARR is an indicator of the scale of our entire platform while mitigating fluctuations due to seasonality and contract term. Organic ARR. We define organic ARR as total ARR excluding the impact of recurring revenue generated from legacy Simply Measured products. We believe organic ARR is an indicator of the scale and visibility of our core platform while mitigating fluctuations due to seasonality and contract term. Organic Revenue. Total revenue excluding the revenue impact from the 2017 acquisition of Simply Measured. Non-GAAP gross profit: We define non-GAAP gross profit as GAAP gross profit, excluding stock-based compensation expense and amortization expense associated with the acquired developed technology from the Tagger acquisition. We believe non-GAAP gross profit provides our management and investors consistency and comparability with our past financial performance and facilitates period-to-period comparisons of operations, as it eliminates the effect of stock-based compensation and amortization expense, which are often unrelated to overall operating performance. Non-GAAP gross margin. We define non-GAAP gross margin as non-GAAP gross profit as a percentage of revenue. Non-GAAP operating income (loss). We define non-GAAP operating income (loss) as GAAP loss from operations, excluding stock-based compensation expense, acquisition-related expenses and amortization expense associated with the acquired intangible assets from the Tagger acquisition. We believe non-GAAP operating income (loss) provides our management and investors consistency and comparability with our past financial performance and facilitates period-to-period comparisons of operations, as this non-GAAP financial measure eliminates the effect of stock-based compensation, acquisition-related expenses and amortization expense, which are often unrelated to overall operating performance. During the second quarter of 2023, we revised our definition of non-GAAP operating income (loss) to exclude acquisition-related expenses in connection with our acquisition of Tagger, Inc. During the third quarter, we revised our definition of non-GAAP operating income (loss) to exclude amortization expense associated with the acquired intangible assets from the Tagger acquisition. Non-GAAP operating margin. We defined non-GAAP operating margin as non-GAAP operating income (loss) as a percentage of revenue. Non-GAAP net income (loss). We define non-GAAP net income (loss) as GAAP net loss, excluding stock-based compensation expense, acquisition-related expenses, amortization expense associated with the acquired intangible assets from the Tagger acquisition and tax benefits due to changes in valuation allowances from business acquisitions. We believe non-GAAP net income (loss) provides our management and investors consistency and comparability with our past financial performance and facilitates period-to-period comparisons of operations, as this non-GAAP financial measure eliminates the effect of stock-based compensation, acquisition-related expenses, amortization expense and tax benefits due to changes in valuation allowances from business acquisitions, which are often unrelated to overall operating performance. During the second quarter of 2023, we revised our definition of non-GAAP net income (loss) to exclude acquisition-related expenses in connection with our acquisition of Tagger, Inc. During the third quarter of 2023, we revised our definition of non-GAAP net income (loss) to exclude amortization expense associated with the acquired intangible assets from the Tagger acquisition and tax benefits recognized from changes in the valuation allowance associated with our acquisition of Tagger. Non-GAAP net income (loss) per share. We define non-GAAP net income (loss) per share as GAAP net loss per share attributable to common shareholders, basic and diluted, excluding stock-based compensation expense, acquisition-related expenses, amortization expense associated with the acquired intangible assets from the Tagger acquisition and tax benefits due to changes in valuation allowances from business acquisitions. We believe non-GAAP net income (loss) per share provides our management and investors consistency and comparability with our past financial performance and facilitates period-to-period comparisons of operations, as this non-GAAP financial measure eliminates the effect of stock-based compensation, acquisition-related expenses, amortization expense and tax benefits due to changes in valuation allowances from business acquisitions, which are often unrelated to overall operating performance. During the second quarter of 2023, we revised our definition of non-GAAP net income (loss) per share to exclude acquisition-related expenses in connection with our acquisition of Tagger, Inc. During the third quarter of 2023, we revised our definition of non-GAAP net income (loss) per share to exclude amortization expense associated with the acquired intangible assets from the Tagger acquisition and tax benefits recognized from changes in the valuation allowance associated with our acquisition of Tagger. Free cash flow (FCF). Free cash flow is a non-GAAP financial measure that we define as net cash provided by operating activities less expenditures for property and equipment and acquisition-related costs. Free cash flow does not reflect our future contractual obligations or represent the total increase or decrease in our cash balance for a given period. We believe free cash flow is a useful indicator of liquidity that provides information to management and investors about the amount of cash used in our core operations that, after expenditures for property and equipment, is not available for strategic initiatives. Free cash flow margin (FCF Margin). We define free cash flow margin as free cash flow as a percentage of revenue. Dollar-based net retention rate. We calculate dollar-based net retention rate by dividing the organic ARR from our customers as of December 31st in the reported year by the organic ARR from those same customers as of December 31st in the previous year. This calculation is net of upsells, contraction, cancellation or expansion during the period but excludes organic ARR from new customers. We use dollar-based net retention to evaluate the long-term value of our customer relationships, because we believe this metric reflects our ability to retain and expand subscription revenue generated from our existing customers. Average Contract Value (ACV). We define ACV as the ending period total ARR divided by the ending period total customer count. LTV:CAC. We calculate the lifetime value of our customers and associated customer acquisition costs for a particular year by comparing (i) gross profit from net new ARR for the year divided by one minus the estimated subscription renewal rate to (ii) total sales and marketing expense incurred in the preceding year. Number of customers. We define a customer as a unique account, multiple accounts containing a common non-personal email domain, or multiple accounts governed by a single agreement or entity. We believe that the number of customers using our platform is an indicator of our market penetration. Number of customers contributing more than $10,000 in ARR. We define number of customers contributing more than $10,000 in ARR as those on a paid subscription plan that had more than $10,000 in ARR as of a period end. We view the number of customers that contribute more than $10,000 in ARR as a measure of our ability to scale with our customers. We believe this represents potential for future growth, including expanding within our current customer base. Number of customers contributing more than $50,000 in ARR. We define number of customers contributing more than $50,000 in ARR as those on a paid subscription plan that had more than $50,000 in ARR as of a period end. We view the number of customers that contribute more than $50,000 in ARR as a measure of our ability to scale with large customers and attract sophisticated organizations. We believe this represents potential for future growth, including expanding within our current customer base. We calculated our current >$55B Served Addressable Market estimate as follows: (i) utilized data from The US SBA, The US Census Bureau, The OECD and Statista to estimate the total number of businesses in the United States and globally in each of our served market segments (Enterprise, Mid-Market, SMB); (ii) utilized internal data and third party estimates to estimate of the number of such businesses that require a social media management platform (the “Target Businesses”); (iii) calculated the average of our ACV and our estimate of our direct competitors’ ACVs in each segment; and (iv) multiplied the estimated average segment ACVs by the estimated number of Target Businesses in each applicable segment.   We calculated our >$120B Total Addressable Market estimate using the methodology above. We then used internal estimates informed by research from the Harris Poll to determine the projected business presence on social media in 2025 that will require a social media management platform, multiplied by our internal projected average segment ACVs in 2025 for Sprout Social and its direct competitors in the applicable segment. Current Penetration of our Served Addressable Market. We estimate the current total revenue of SPT and each of our primary competitors and divide by our current SAM to determine current market penetration. 2023 Investor Presentation