sqft20210318_8k.htm
false 0001080657 0001080657 2021-03-30 2021-03-30
UNITED STATES
SECURITIES AND EXCHANGE COMMISSION
WASHINGTON, D.C. 20549
____________________
 
FORM 8-K
 
CURRENT REPORT
Pursuant to Section 13 or 15(d) of
the Securities Exchange Act of 1934
 
Date of Report (Date of Earliest Event Reported): March 30, 2021 (March 30, 2021)
 
PRESIDIO PROPERTY TRUST, INC.
(Exact Name of Registrant as Specified in its Charter)


Maryland
 
001-34049
 
33-0841255
__________
 
__________
 
__________
(State or Other Jurisdiction of Incorporation)
 
(Commission File No.)
 
(I.R.S. Employer
Identification No.)
 
 
4995 Murphy Canyon Road, Suite 300
San Diego, California 92123
(Address of Principal Executive Offices, Including Zip Code)
____________________
 
(760) 471-8536
(Registrant’s Telephone Number, Including Area Code)
___________________
 
 
Check the appropriate box below if the Form 8-K filing is intended to simultaneously satisfy the filing obligation of the registrant under any of the following provisions:


Written communications pursuant to Rule 425 under the Securities Act (17 CFR 230.425)
     
 
Soliciting material pursuant to Rule 14a-12 under the Exchange Act (17 CFR 240.14a-12)
     
 
Pre-commencement communications pursuant to Rule 14d-2(b) under the Exchange Act (17 CFR 240.14d-2(b))
     
 
Pre-commencement communications pursuant to Rule 13e-4(c) under the Exchange Act (17 CFR 240.13e-4(c)) 
 
 
Securities registered pursuant to Section 12(b) of the Act: 
 
Title of each class
Trading Symbol(s)
Name of each exchange on which registered
Series A Common Stock,
$0.01 par value per share
SQFT
The Nasdaq Stock Market LLC
 
 
Indicate by check mark whether the registrant is an emerging growth company as defined in Rule 405 of the Securities Act of 1933 (§230.405 of this chapter) or Rule 12b-2 of the Securities Exchange Act of 1934 (§240.12b-2 of this chapter).
 
                                                                                                                                                                                                                                                                                                         Emerging growth company
 
If an emerging growth company, indicate by check mark if the registrant has elected not to use the extended transition period for complying with any new or revised financial accounting standards provided pursuant to Section 13(a) of the Exchange Act. ☐


Item 2.02
Results of Operations and Financial Condition
 
Press Release
 
On March 30, 2021, Presidio Property Trust, Inc. (the "Company") issued a press release announcing its financial results for the fourth quarter and year ended December 31, 2020 and made the press release available on its website, www.PresidioPT.com.  A copy of the press release is attached hereto as Exhibit 99.1 and is incorporated by reference herein. 
 
The Company also made available on its website a financial supplement containing financial data of the Company (“Supplemental Financial Information”) for the fourth quarter and year ended December 31, 2020 (“Q4-2020 and Y/E 2020”), and such Supplemental Financial Information is attached hereto as Exhibit 99.2 and is incorporated by reference herein.
 
The information in this Item 2.02 of this Current Report on Form 8-K (“Form 8-K”), including the information contained in the exhibits, shall not be deemed “filed” for the purposes of Section 18 of the Securities Exchange Act of 1934, as amended (the “Exchange Act”), or otherwise subject to the liabilities of that section and shall not be incorporated by reference into any registration statement or other document filed under the Securities Act of 1933, as amended, or the Exchange Act, except as shall be expressly set forth by specific reference in such filing.


Item 7.01
Regulation FD Disclosure
 
The supplemental information furnished by the Company and posted to its website as described above under Item 2.02 is hereby incorporated by reference into this Item 7.01.
 
 
Item 9.01
Financial Statements and Exhibits.
           (d)
Exhibits
         99.1
         99.2 Supplemental Financial Information for Q4-2020 and Y/E 2020
          104
Cover Page Interactive Data File (embedded with the inline XBRL document)


SIGNATURES
 
Pursuant to the requirements of the Securities Exchange Act of 1934, the registrant has duly caused this report to be signed on its behalf by the undersigned hereunto duly authorized.


Date:  March 30, 2021
 
PRESIDIO PROPERTY TRUST, INC.
   
By:          /s/ Adam Sragovicz
   
Adam Sragovicz
   
Chief Financial Officer


Exhibit 99.1

ex_235940img001.gif


Presidio Property Trust, Inc.

Reports Results for the Fourth Quarter and Year Ended December 31, 2020


San Diego, California, March 30, 2021 – Presidio Property Trust, Inc. (Nasdaq: SQFT) (“Presidio” or the “Company”), an internally managed, diversified REIT, with holdings in office, industrial, retail, and model home properties, today reported financial results for its fourth quarter and year ended December 31, 2020.


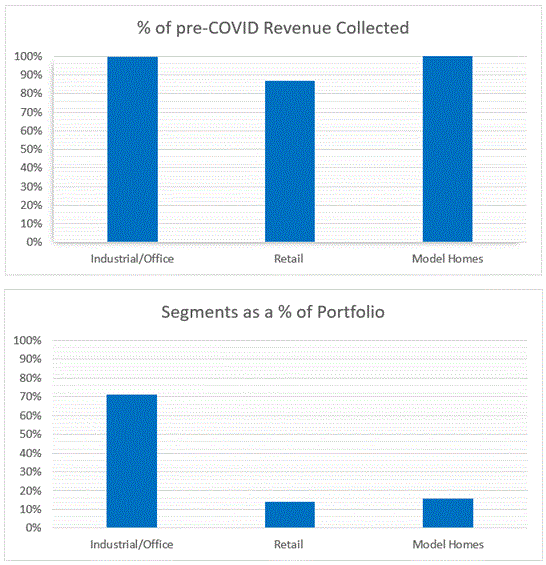
"We are pleased to report our first full-year earnings as a publicly traded company," said Jack Heilbron, President and Chief Executive Officer. "We have a lot to be proud of in 2020, but we are especially pleased with our portfolio of diverse assets in a variety of geographies, as it validated the success of our strategy, even during the COVID-19 crisis. We collected 98% of billed rents in 2020," said Heilbron.


“In spite of many COVID-19 challenges, occupancy at our 15 same store properties increased 2.4% as of December 31, 2020, as compared to the same 15 stores at December 31, 2019,” noted Gary Katz, Senior Vice President of Asset Management. “Leasing activity remained robust throughout the year.  We inked new and renewal leases for over 280,000 square feet, a strong showing for our properties, in particular, and for the commercial real estate markets where they are located.”


2020 Highlights


Core FFO for the year was $1,483,382, or approximately $0.16 per fully diluted share;


Collections were 98% of the billed rent, including the effects of COVID-19-related tenant arrangements;


Occupancy closed the year at 84.1%, a decrease of only 0.4% compared to 84.5% in 2019;


Execution of over 283,000 square feet of 15 new and 47 renewal leases; and


Paid a dividend of $0.10 per share on Series A Common Stock in the fourth quarter.


Year Ended December 31, 2020 Financial Results


Net loss attributable to the Company’s common stockholders for the year ended December 31, 2020 was approximately $7.7 million, or $0.85 per basic and diluted share, compared to a net loss of $610,000 or $0.07 per basic and diluted share for the year ended December 31, 2019. The increase in net loss attributable to the Company’s common stockholders was a result of a decrease in revenues of $4.3 million in 2020 compared to 2019 due to the sale of properties. Property sales reduced the Company’s leverage, lowering mortgage notes and notes payable by $27 million in 2020 compared to 2019.


Funds from Operations or FFO (non-GAAP) for 2020 was approximately $1,483,000 compared to approximately $2,374,000 for 2019. A reconciliation of FFO to net loss, the most directly comparable GAAP financial measure, is attached to this press release.


1


2020 Acquisitions and Dispositions


During 2020, the Company:


Sold Centennial Tech Center on February 5, 2020 for approximately $15.0 million and the Company recognized a loss of approximately $0.9 million.


Sold Union Terrace on March 13, 2020 for approximately $11.3 million and the Company recognized a gain of approximately $0.7 million.


Sold one of four Executive Office Park buildings on December 2, 2020 for approximately $2.3 million and the Company recognized a loss of approximately $75,000.


Sold 46 model homes for approximately $18.1 million and the Company recognized a gain of approximately $1.6 million.


Acquired 28 model homes and leased them back to the homebuilders under triple net leases. The purchase price for the properties was $10.2 million. The properties were acquired utilizing cash payments of $3.1 million and mortgage notes of $7.1 million.


2


Subsequent Events


Dispositions


We sold the following properties subsequent to December 31, 2020:


•         Waterman Plaza was sold on January 28, 2021 for approximately $3.5 million.


•         Garden Gateway was sold on February 19, 2021 for approximately $11.2 million.


Notes Payable


As of December 31, 2020, the outstanding principal balance on the promissory note to the Polar Multi-Strategy Master Fund was approximately $7.7 million. During the first quarter of 2021, prior to its March 31, 2021 maturity, the Polar note was paid in full, from available cash on hand and proceeds of property sales.


Dividends


On February 23, 2021, our Board of Directors declared a dividend of $0.101 per share on Series A Common Stock, payable on March 16, 2021 to stockholders of record as of March 9, 2021.


Webcast


Presidio is scheduled to hold a webcast and conference call at 1:30 p.m., Pacific Time, on Tuesday, March 30, 2021 to discuss the Company’s financial results. To register, click on the Fourth Quarter 2020 Earnings Call link under the "Presentations" section of the "Investor" area of the Company's website at https://www.presidioPT.com.


3


About Presidio Property Trust, Inc.


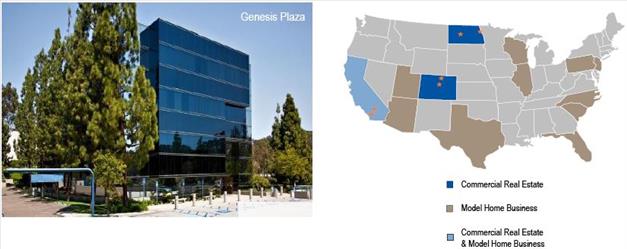
Presidio is an internally managed, diversified REIT. We have interests in approximately 110 model home properties located in four states, with the majority located in Texas and Florida, which are leased back to homebuilders on a triple-net basis. Our commercial real estate portfolio consists of approximately 1 million square feet comprised of 13 properties: nine office properties, one industrial property and three retail properties. Our commercial portfolio is located in Southern California, Colorado, and North Dakota, and we are currently considering property acquisitions in a variety of additional markets across the United States. Our commercial property tenant base is diversified, which helps limit our exposure to any single industry in which our tenants operate. This geographical clustering of our real estate portfolio enables us to minimize operating costs and leverage efficiencies by managing a number of properties utilizing minimal overhead and staff. For more information on Presidio, please visit the Company’s website at https://www.PresidioPT.com.


4


Definitions   


Non-GAAP Financial Measures


Funds from Operations (FFO) – The Company evaluates performance based on Funds From Operations, which we refer to as FFO, as management believes that FFO represents the most accurate measure of activity and is the basis for distributions paid to equity holders. The Company defines FFO as net income or loss (computed in accordance with GAAP), excluding gains (or losses) from sales of property, hedge ineffectiveness, acquisition costs of newly acquired properties that are not capitalized and lease acquisition costs that are not capitalized plus depreciation and amortization, including amortization of acquired above and below market lease intangibles and impairment charges on properties or investments in non-consolidated REITs, and after adjustments to exclude equity in income or losses from, and, to include the proportionate share of FFO from, non-consolidated REITs.


However, because FFO excludes depreciation and amortization and as well as the changes in the value of the Company’s properties that result from use or market conditions, each of which have real economic effects and could materially impact the Company’s results from operations, the utility of FFO as a measure of the Company’s performance is limited. In addition, other equity REITs may not calculate FFO in accordance with the NAREIT definition as the Company does, and, accordingly, the Company’s FFO may not be comparable to such other REITs’ FFO. Accordingly, FFO should be considered only as a supplement to net income as a measure of the Company’s performance.


Core Funds from Operations (Core FFO) – We calculate Core FFO by using FFO as defined by NAREIT and adjusting for certain other non-core items. We also exclude from our Core FFO calculation acquisition costs, loss on early extinguishment of debt, changes in the fair value of the earn-out, changes in fair value of contingent consideration and the amortization of stock-based compensation.


We believe Core FFO provides a useful metric in comparing operations between reporting periods and in assessing the sustainability of our ongoing operating performance. Other equity REITs may calculate Core FFO differently or not at all, and, accordingly, the Company’s Core FFO may not be comparable to such other REITs’ Core FFO.


Same Store Net Operating Income (Same Store NOI) – Same Store NOI is calculated as the NOI attributable to the properties continuously owned and operated for the entirety of the reporting periods presented. The Company’s definition of Same Store NOI excludes properties that were not stabilized during both of the applicable reporting periods. These exclusions may include, but are not limited to, acquisitions, dispositions and properties undergoing repositioning or significant renovations.


We believe Same Store NOI is an important measure of comparison because it allows for comparison of operating results of stabilized properties owned and operated for the entirety of both applicable periods and therefore eliminates variations caused by acquisitions, dispositions or repositioning during such periods. Other REITs may calculate Same Store NOI differently and our calculation should not be compared to that of other REITs.


5


Safe Harbor Disclosure


This press release contains statements that are forward-looking statements within the meaning of the Private Securities Litigation Reform Act of 1995, Section 27A of the Securities Act of 1933, as amended, and Section 21E of the Securities Exchange Act of 1934, as amended, and other federal securities laws. Forward looking statements are statements that are not historical, including statements regarding managements intentions, beliefs, expectations, representations, plans or predictions of the future, and are typically identified by such words as believe, expect, anticipate, intend, estimate, may, will, should and could. Because such statements include risks, uncertainties and contingencies, actual results may differ materially from those expressed or implied by such forward looking statements. These forward-looking statements are based upon the Companys present expectations, but these statements are not guaranteed to occur. Furthermore, the Company disclaims any obligation to publicly update or revise any forward-looking statement to reflect changes in underlying assumptions or factors, of new information, data or methods, future events or other changes. Investors should not place undue reliance upon forward-looking statements. For further discussion of the factors that could affect outcomes, please refer to the Risk Factors section of the Companys Annual Report on Form 10-K filed with the SEC on March 30, 2021, and in the Companys other documents filed with the SEC, copies of which are available on the SECs website, www.sec.gov.


Contacts


Presidio Property Trust, Inc.

 Lowell Hartkorn, Investor Relations

+1-760-471-8536 x 1244

[email protected]


TraDigital IR

Kevin McGrath
+1-646-418-7002
[email protected]


MJ Clyburn
+1-917-327-6847
[email protected]


6


Presidio Property Trust, Inc. and Subsidiaries

Consolidated Balance Sheets


December 31,


December 31,


2020


2019


ASSETS


Real estate assets and lease intangibles:


Land


$

18,827,000


$

19,844,739


Buildings and improvements


115,409,423


118,446,764


Tenant improvements


11,960,018


10,696,181


Lease intangibles


4,110,139


4,230,706


Real estate assets and lease intangibles held for investment, cost


150,306,580


153,218,390


Accumulated depreciation and amortization


(26,551,789

)


(22,482,219

)

Real estate assets and lease intangibles held for investment, net


123,754,791


130,736,171


Real estate assets held for sale, net


42,499,176


69,470,449


Real estate assets, net


166,253,967


200,206,620


Cash, cash equivalents and restricted cash


11,540,917


10,391,275


Deferred leasing costs, net


1,927,951


2,053,927


Goodwill


2,423,000


2,423,000


Other assets, net


3,422,781


5,709,586


TOTAL ASSETS


$

185,568,616


$

220,784,408


LIABILITIES AND EQUITY


Liabilities:


Mortgage notes payable, net


$

94,664,266


$

99,996,306


Mortgage notes payable related to properties held for sale, net


25,365,430


42,396,686


Mortgage notes payable, total net


120,029,696


142,392,992


Note payable, net


7,500,086


12,238,692


Accounts payable and accrued liabilities


5,126,199


5,673,815


Accrued real estate taxes


2,548,686


2,987,601


Lease liability, net


102,323


560,188


Below-market leases, net


139,045


309,932


Total liabilities


135,446,035


164,163,220


Commitments and contingencies (Note 10)


Equity:


Series A Common Stock, $0.01 par value, shares authorized: 100,000,000; 9,508,363 and 8,881,842 shares were both issued and outstanding at December 31, 2020 and December 31, 2019, respectively


95,038


88,818


Additional paid-in capital


156,463,146


152,129,120


Dividends and accumulated losses


(121,674,505

)


(113,037,144

)

Total stockholders' equity before noncontrolling interest


34,883,679


39,180,794


Noncontrolling interest


15,238,902


17,440,394


Total equity


50,122,581


56,621,188


TOTAL LIABILITIES AND EQUITY


$

185,568,616


$

220,784,408


7


Presidio Property Trust, Inc. and Subsidiaries

Consolidated Statements of Operations


For the Year Ended December 31,


2020


2019


Revenues:


Rental income


$

23,444,119


$

27,467,410


Fees and other income


907,673


1,173,701


Total revenue


24,351,792


28,641,111


Costs and expenses:


Rental operating costs


8,818,283


10,410,574


General and administrative


5,751,754


5,268,315


Depreciation and amortization


6,274,321


7,364,688


Impairment of real estate assets


1,730,851


Total costs and expenses


22,575,209


23,043,577


Other income (expense):


Interest expense-Series B preferred stock


(2,226,101

)

Interest expense-mortgage notes


(6,097,834

)


(7,337,423

)

Interest expense - note payable


(2,715,233

)


(1,086,122

)

Interest and other income (expense), net


(20,636

)


141,306


Gain on sales of real estate, net


1,245,460


6,319,272


Gain on extinguishment of government debt


451,785


Deferred offering costs


(530,639

)


Acquisition costs


(24,269

)

Income tax expense


(370,884

)


(611,263

)

Total other income (expense), net


(8,037,981

)


(4,824,600

)

Net (loss) income


(6,261,398

)


772,934


Less: Loss attributable to noncontrolling interests


(1,412,507

)


(1,383,140

)

Net loss attributable to Presidio Property Trust, Inc. common stockholders


$

(7,673,905

)


$

(610,206

)

Basic and diluted loss per common share


$

(0.85

)


$

(0.07

)

Weighted average number of common shares outstanding - basic and diluted


9,023,914


8,862,958


8


Presidio Property Trust, Inc. and Subsidiaries

Reconciliation of Net Loss to FFO, Core FFO

(Unaudited)


For the Year Ended December 31,


2020


2019


Net loss attributable to Presidio Property Trust, Inc. common stockholders


$

(7,673,905)


$

(610,206)


Adjustments:


Income attributable to noncontrolling interests


1,412,507


1,383,140


Depreciation and amortization


6,274,321


7,364,688


Amortization of above and below market leases, net


(120,204)


(130,529)


Impairment of real estate assets


1,730,851


Loss (gain) on sale of real estate assets, net


(1,245,460)


(6,319,272)


FFO


$

378,110


$

1,687,821


Restricted stock compensation


1,105,272


686,133


Core FFO


$

1,483,382


$

2,373,954


9


Presidio Property Trust, Inc. and Subsidiaries

Same Store Net Operating Income - Commercial Properties

(Unaudited)


For the Year Ended December 31,


Variance


2020


2019


$


%

Rental revenues

$

19,627,351


$

19,961,964


$

(334,613

)


-1.7%

Rental operating costs

8,618,676


8,480,847


137,829


1.6%


Net operating income

$

11,008,675


$

11,481,117


$

(472,442

)


-4.1%


Operating Ratios:


Number of same properties

15


15 


Same-property occupancy, end of period

83.2

%


80.8 

%


2.4%

Same-properties operating costs as a percentage of total revenues

43.9

%


42.4 

%


1.4%


10


Exhibit 99.2


ex_236655img001.jpg


ex_236655img002.jpg


SUPPLEMENTAL FINANCIAL INFORMATION


As of December 31, 2020


FORWARD-LOOKING STATEMENTS

ex_236655img003.jpg


This presentation contains “forward-looking statements” within the meaning of the federal securities laws that involve risks and uncertainties, many of which are beyond our control. Our actual results could differ materially and adversely from those anticipated in such forward-looking statements as a result of certain factors, including those set forth in the Quarterly Report on Form 10-Q. Forward-looking statements relate to matters such as our industry, business strategy, goals and expectations concerning our market position, future operations, margins, profitability, capital expenditures, financial condition, liquidity, capital resources, cash flows, dividends, results of operations and other financial and operating information. When used in this presentation, the words “will,” “may,” “believe,” “anticipate,” “intend,” “estimate,” “expect,” “should,” “project,” “plan,” and similar expressions are intended to identify forward-looking statements, although not all forward-looking statements contain such identifying words.


The forward-looking statements contained in this presentation are based on historical performance and management’s current plans, estimates and expectations in light of information currently available to it and are subject to uncertainty and changes in circumstances. There can be no assurance that future developments affecting us will be those that we have anticipated. Actual results may differ materially from these expectations due to the factors, risks and uncertainties described in the Annual Report on Form 10-K, as filed March 30, 2021 (“Annual Report”), changes in global, regional or local political, economic, business, competitive, market, regulatory and other factors described in the “Risk Factors” section of the Annual Report, many of which are beyond our control. Should one or more of these risks or uncertainties materialize or should any of our assumptions prove to be incorrect, our actual results may vary in material respects from what we may have expressed or implied by these forward-looking statements. We caution that you should not place undue reliance on any of our forward-looking statements. Any forward-looking statement made by us in this presentation speaks only as of the date on which we make it. Factors or events that could cause our actual results to differ may emerge from time to time, and it is not possible for us to predict all of them. We undertake no obligation to publicly update any forward-looking statement, whether as a result of new information, future developments or otherwise, except as may be required by applicable securities laws.


COMPANY OVERVIEW

ex_236655img004.jpg


ex_236655img005.jpg


ex_236655img006.jpg

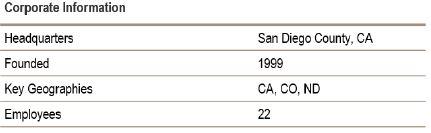
Presidio Property Trust, Inc. (“Presidio” or the “Company”) was founded in 1999 as NetREIT


Presidio is a self-managed real estate company focused on commercial real estate opportunities in often overlooked and regionally dominant markets


ex_236655img007.jpg

The Company acquires and manages office and industrial real estate assets in markets with strong demographic and economic drivers with attractive going-in cap rates


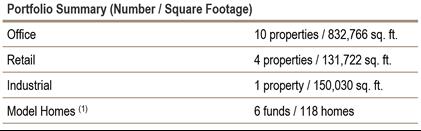
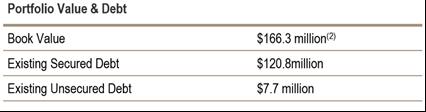
Presidio’s commercial portfolio currently includes 15 commercial properties with a book value of approximately $123.7 million


ex_236655img008.jpg

In addition to its commercial real estate holdings, Presidio generates fees and rental income from affiliated entities, which manage and/or own a portfolio of model homes (1)


ex_236655img009.jpg


(1) The Company holds partial ownership interests in several entities which own model home properties (2) includes book value of model homes


COMMERCIAL PORTFOLIO

ex_236655img010.jpg


Property Location ($ in 000s)


Sq. Ft.


Date
Acquired


Year
Property
Constructed


Purchase
Price (1)


Occupancy


Percent
Ownership


Mortgage
Outstanding


Office/Industrial Properties:


Garden Gateway, Colorado Springs, CO (2)


115,052


03/07


1982/2006


$

15,126


76.4

%


100.0

%


$

5,862


Executive Office Park, Colorado Springs, CO (3)


49,864


07/08


2000


10,126


97.7

%


100.0

%


2,986


Genesis Plaza, San Diego, CA (4)(5)


57,807


08/10


1989


10,000


74.7

%


76.4

%


6,276


Dakota Center, Fargo, ND


119,434


05/11


1982


9,575


86.0

%


100.0

%


9,900


Grand Pacific Center, Bismarck, ND


93,058


04/14


1976


5,350


74.2

%


100.0

%


3,738


Arapahoe Service Center II,

Centennial, CO


79,023


12/14


2000


11,850


100.0

%


100.0

%


7,932


West Fargo Industrial, West Fargo, ND


150,030


08/15


1998/2005


7,900


82.0

%


100.0

%


4,263


300 N.P., West Fargo, ND


34,517


08/15


1922


3,850


72.8

%


100.0

%


2,273


One Park Centre, Westminster, CO


69,174


08/15


1983


9,150


84.8

%


100.0

%


6,385


Highland Court, Centennial, CO (6)


93,536


08/15


1984


13,050


64.5

%


84.5

%


6,275


Shea Center II, Highlands Ranch, CO


121,301


12/15


2000


25,325


91.2

%


100.0

%


17,728


Total Office/Industrial Properties


998,016


$

121,302


82.3

%


$

73,618


Retail Properties:


World Plaza, San Bernardino, CA


55,810


09/07


1974


7,650


100.0

%


100.0

%


5,803


Waterman Plaza, San

Bernardino, CA (7)


21,170


08/08


2008


7,164


85.9

%


100.0

%


3,208


Union Town Center,

Colorado Springs, CO


44,042


12/14


2003


11,212


100.0

%


100.0

%


8,316


Research Parkway,

Colorado Springs, CO


10,700


8/15


2003


2,850


100.0

%


100.0

%


1,760


Total Retail Properties


131,722


$

28,876


97.7

%


$

19,087


Total Commercial Properties


1,129,738


$

150,178


84.1

%


$

92,705


(1)

Prior to January 1, 2009, “Purchase Price” includes our acquisition related costs and expenses for the purchase of the property. After January 1, 2009, acquisition related costs and expenses were recognized as expense when incurred.


(2)

This property is classified as held for sale as of December 31, 2020 and was sold during February 2021 for $11.2 million.


(3)

One of four buildings within this property was sold as of December 31, 2020.


(4)

Approximately 9,224 square feet, or 16.0% of this property, is occupied by us as our corporate offices and related parties.


(5)

This property is owned by two tenants-in-common, each of which owns 57% and 43%, respectively, and we beneficially own an aggregate interest of 76.4%.


(6)

This property is owned by two tenants-in-common, of which we own approximately 60% and 52%, respectively, and we beneficially own an aggregate interest of 84.5%.


(7)

This property is classified as held for sale as of December 31, 2020 and was sold during January 2021 for $3.5 million.


MODEL HOMES PORTFOLIO

ex_236655img011.jpg


Region


No. of
Properties


Aggregate
Square
Feet


Approximate %
of
Aggregate
Square Feet


Current
Annual
Base Rent


Approximate %
of
Aggregate
Annual Rent


Purchase
Price


Current
Mortgage
Balance


Southwest

    97       290,702       84.7

%

  $ 2,822,928       81.1

%

  $ 36,677,542     $ 23,580,196  

Southeast

    16       37,374       10.9

%

    447,192       12.8

%

    5,595,806       3,205,532  

Midwest

    2       6,602       1.9

%

    99,276       2.9

%

    1,103,000       711,265  

East

    1       2,395       0.7

%

    30,636       0.9

%

    331,200       -  

Northeast

    2       6,153       1.8

%

    80,844       2.3

%

    898,250       586,363  
      118       343,226       100

%

  $ 3,480,876       100

%

  $ 44,605,798     $ 28,083,356  


CONSOLIDATED BALANCE SHEET

ex_236655img012.jpg


December 31,


December 31,


2020


2019


ASSETS


Real estate assets and lease intangibles:


Land


$

18,827,000


$

19,844,739


Buildings and improvements


115,409,423


118,446,764


Tenant improvements


11,960,018


10,696,181


Lease intangibles


4,110,139


4,230,706


Real estate assets and lease intangibles held for investment, cost


150,306,580


153,218,390


Accumulated depreciation and amortization


(26,551,789

)


(22,482,219

)

Real estate assets and lease intangibles held for investment, net


123,754,791


130,736,171


Real estate assets held for sale, net


42,499,176


69,470,449


Real estate assets, net


166,253,967


200,206,620


Cash, cash equivalents and restricted cash


11,540,917


10,391,275


Deferred leasing costs, net


1,927,951


2,053,927


Goodwill


2,423,000


2,423,000


Other assets, net


3,422,781


5,709,586


TOTAL ASSETS


$

185,568,616


$

220,784,408


LIABILITIES AND EQUITY


Liabilities:


Mortgage notes payable, net


$

94,664,266


$

99,996,306


Mortgage notes payable related to properties held for sale, net


25,365,430


42,396,686


Mortgage notes payable, total net


120,029,696


142,392,992


Note payable, net


7,500,086


12,238,692


Accounts payable and accrued liabilities


5,126,199


5,673,815


Accrued real estate taxes


2,548,686


2,987,601


Lease liability, net


102,323


560,188


Below-market leases, net


139,045


309,932


Total liabilities


135,446,035


164,163,220


Commitments and contingencies (Note 10)


Equity:


Series A Common Stock, $0.01 par value, shares authorized: 100,000,000; 9,508,363 and 8,881,842 shares were both issued and outstanding at December 31, 2020 and December 31, 2019, respectively


95,038


88,818


Additional paid-in capital


156,463,146


152,129,120


Dividends and accumulated losses


(121,674,505

)


(113,037,144

)

Total stockholders' equity before noncontrolling interest


34,883,679


39,180,794


Noncontrolling interest


15,238,902


17,440,394


Total equity


50,122,581


56,621,188


TOTAL LIABILITIES AND EQUITY


$

185,568,616


$

220,784,408


CONSOLIDATED STATEMENT OF OPERATIONS

ex_236655img013.jpg


For the Year Ended December 31,


2020


2019


Revenues:


Rental income


$

23,444,119


$

27,467,410


Fees and other income


907,673


1,173,701


Total revenue


24,351,792


28,641,111


Costs and expenses:


Rental operating costs


8,818,283


10,410,574


General and administrative


5,751,754


5,268,315


Depreciation and amortization


6,274,321


7,364,688


Impairment of real estate assets


1,730,851


Total costs and expenses


22,575,209


23,043,577


Other income (expense):


Interest expense-Series B preferred stock


(2,226,101

)

Interest expense-mortgage notes


(6,097,834

)


(7,337,423

)

Interest expense - note payable


(2,715,233

)


(1,086,122

)

Interest and other income (expense), net


(20,636

)


141,306


Gain on sales of real estate, net


1,245,460


6,319,272


Gain on extinguishment of government debt


451,785


Deferred offering costs


(530,639

)


Acquisition costs


(24,269

)

Income tax expense


(370,884

)


(611,263

)

Total other income (expense), net


(8,037,981

)


(4,824,600

)

Net (loss) income


(6,261,398

)


772,934


Less: Loss attributable to noncontrolling interests


(1,412,507

)


(1,383,140

)

Net loss attributable to Presidio Property Trust, Inc. common stockholders


$

(7,673,905

)


$

(610,206

)

Basic and diluted loss per common share


$

(0.85

)


$

(0.07

)

Weighted average number of common shares outstanding - basic and diluted


9,023,914


8,862,958


CONSOLIDATED STATEMENT OF CASH FLOWS

ex_236655img014.jpg


For the Year Ended December 31,


2020


2019


Cash flows from operating activities:


Net (loss) income


$

(6,261,398

)


$

772,934


Adjustments to reconcile net (loss) income to net cash provided by operating activities:


Depreciation and amortization


6,274,321


7,364,688


Stock compensation


1,105,272


686,133


Bad debt expense (recoveries)


77,898


(32,544

)

Gain on sale of real estate assets, net


(1,245,460

)


(6,319,272

)

Impairment of real estate assets


1,730,851


Accretion of original issue discount


1,013,405


386,595


Amortization of financing costs


1,287,430


965,239


Amortization of above-market leases


50,682


55,466


Amortization of below-market leases


(170,887

)


(185,995

)

Straight-line rent adjustment


108,998


(63,895

)

Changes in operating assets and liabilities:


Other assets


1,957,641


1,035,806


Accounts payable and accrued liabilities


(1,796,421

)


(767,440

)

Accrued real estate taxes


(438,915

)


(106,779

)

Net cash provided by operating activities


3,693,417


3,790,936


Cash flows from investing activities:


Real estate acquisitions


(10,161,613

)


(13,037,562

)

Additions to buildings and tenant improvements


(2,834,373

)


(6,393,711

)

Additions to deferred leasing costs


(175,828

)


(661,401

)

Proceeds from sales of real estate, net


40,849,654


32,073,721


Net cash provided by investing activities


27,677,840


11,981,047


Cash flows from financing activities:


Proceeds from mortgage notes payable, net of issuance costs


14,152,838


15,494,715


Proceeds from government debt relief


451,785


Repayment of mortgage notes payable


(36,808,331

)


(23,176,581

)

Proceeds from note payable, net of issuance cost of $1.1 million


11,479,237


Repayment of note payable


(6,324,401

)


Payment of extension costs, note payable


(351,025

)


Redemption of mandatorily redeemable preferred stock


(16,900,000

)

Payment of deferred offering costs


(45,016

)


(Distributions) contributions to noncontrolling interests, net


(2,366,009

)


331,603


Issuance of stock for Initial Public Offering, net of underwriters fees


2,050,000


Repurchase of common stock


(18,000

)


(227,428

)

Dividends paid to stockholders


(963,456

)


(2,158,469

)

Net cash used in financing activities


(30,221,615

)


(15,156,923

)

Net increase in cash equivalents and restricted cash


1,149,642


615,060


Cash, cash equivalents and restricted cash - beginning of period


10,391,275


9,776,215


Cash, cash equivalents and restricted cash - end of period


$

11,540,917


$

10,391,275


Supplemental disclosure of cash flow information:


Interest paid-Series B preferred stock


$


$

1,859,672


Interest paid-mortgage notes payable


$

5,892,025


$

6,442,750


Interest paid-notes payable


$

778,414


$

713,262


Non-cash financing activities:


Issuance of stock for limited partnership interests


$

1,247,990


$


Unpaid deferred financing costs


$

83,659


$


EBITDA RECONCILIATION

ex_236655img015.jpg


For the Years Ended

December 31,


2020


2019


Net (loss) income attributable to Presidio Property Trust, Inc. common stockholders


$

(7,673,905

)


$

(610,206

)

Adjustments:


Interest Expense


8,813,067


10,649,646


Depreciation and Amortization


6,274,321


7,364,688


Asset Impairments


1,730,851


-


Net Gain on Sales of RE


(1,245,460

)


(6,319,272

)

Gain Extinguishment of Government Debt


(451,785

)


-


Income Taxes


370,884


611,263


EBITDAre


$

7,817,973


$

11,696,119


FFO AND CORE FFO RECONCILIATION

ex_236655img016.jpg


For the Years Ended

December 31,


2020


2019


Net (loss) income attributable to Presidio Property Trust, Inc. common stockholders


$

(7,673,905

)


$

(610,206


Adjustments:


Income attributable to noncontrolling interests


1,412,507


1,383,140


Depreciation and amortization


6,274,321


7,364,688


Amortization of above and below market leases, net


(120,204

)


(130,529

)


Impairment of real estate assets


1,730,851


-


Gain on sale of real estate assets


(1,245,460

)


(6,319,272

)


FFO


$

378,110


$

1,687,821


Stock Based Compensation


1,105,272


686,133


Core FFO


$

1,483,382


$

2,373,954


SAME STORE ANALYSIS

ex_236655img017.jpg


For the Years Ended

December 31,


Variance


2020


2019


$


%


Rental revenues


$

19,627,351


$

19,961,964


$

(334,613

)


(1.7

)%


Rental operating costs


8,618,676


8,480,847


137,829


1.6

%


Net operating income


$

11,008,675


$

11,481,117


$

(472,442

)


(4.1

)%


Operating Ratios:


Number of same properties


15


15


Occupancy, end of period


83.2

%


80.8

%


2.4

%


Operating costs as a percentage of total revenues


43.9

%


42.5

%


1.4

%


SEGMENT DATA


ex_236655img018.gif


DEFINITIONS – NON-GAAP MEASUREMENTS

ex_236655img019.jpg


EBITDAre - EBITDAre is defined by Nareit as earnings before interest, taxes, depreciation and amortization, gain or loss on disposal of depreciated assets, and impairment write-offs.


Funds from Operations (FFO) – The Company evaluates performance based on Funds From Operations, which we refer to as FFO, as management believes that FFO represents the most accurate measure of activity and is the basis for distributions paid to equity holders. The Company defines FFO, a non-GAAP measure, as net income or loss (computed in accordance with GAAP), excluding gains (or losses) from sales of property, hedge ineffectiveness, acquisition costs of newly acquired properties that are not capitalized and lease acquisition costs that are not capitalized plus depreciation and amortization, including amortization of acquired above and below market lease intangibles and impairment charges on properties or investments in non-consolidated REITs, and after adjustments to exclude equity in income or losses from, and, to include the proportionate share of FFO from, non-consolidated REITs.


However, because FFO excludes depreciation and amortization and as well as the changes in the value of the Company’s properties that result from use or market conditions, each of which have real economic effects and could materially impact the Company’s results from operations, the utility of FFO as a measure of the Company’s performance is limited. In addition, other equity REITs may not calculate FFO in accordance with the NAREIT definition as the Company does, and, accordingly, the Company’s FFO may not be comparable to such other REITs’ FFO. Accordingly, FFO should be considered only as a supplement to net income as a measure of the Company’s performance.


Core Funds from Operations (Core FFO) – We calculate Core FFO, a non-GAAP measure, by using FFO as defined by NAREIT and adjusting for certain other non-core items. We also exclude from our Core FFO calculation acquisition costs, loss on early extinguishment of debt, changes in the fair value of the earn-out, changes in fair value of contingent consideration and the amortization of stock-based compensation.


We believe Core FFO provides a useful metric in comparing operations between reporting periods and in assessing the sustainability of our ongoing operating performance. Other equity REITs may calculate Core FFO differently or not at all, and, accordingly, the Company’s Core FFO may not be comparable to such other REITs’ Core FFO.


Same Store Net Operating Income (Same Store NOI) – Same Store NOI, a non-GAAP measure, is calculated as the NOI attributable to the properties continuously owned and operated for the entirety of the reporting periods presented. The Company’s definition of Same Store NOI excludes properties that were not stabilized during both of the applicable reporting periods. These exclusions may include, but are not limited to, acquisitions, dispositions and properties undergoing repositioning or significant renovations.


The Company evaluates the performance of its same-store property operating results based upon net operating income from continuing operations, which is a non-GAAP supplemental financial measure. The Company defines NOI as operating revenues (rental income, tenant reimbursements and other operating income) less property and related expenses (property operating expenses, real estate taxes, insurance and provision for bad debt) less interest expense. NOI excludes certain items that are not considered to be controllable in connection with the management of an asset such as non-property income and expenses, depreciation and amortization, asset management fees and corporate general and administrative expenses. The Company believes that net income is the GAAP measure that is most directly comparable to NOI; however, NOI should not be considered as an alternative to net income as the primary indicator of operating performance as it excludes the items described above. 


We believe Same Store NOI, a non-GAAP measure, is an important measure of comparison because it allows for comparison of operating results of stabilized properties owned and operated for the entirety of both applicable periods and therefore eliminates variations caused by acquisitions, dispositions or repositioning during such periods. Other REITs may calculate Same Store NOI differently and our calculation should not be compared to that of other REITs.