Exhibit
99.1

Presidio
Property Trust, Inc. Announces Earnings for
the
Third Quarter Ended September 30, 2025
San
Diego, California, November 12, 2025 – Presidio Property Trust, Inc. (Nasdaq: SQFT, SQFTP, SQFTW) (the “Company”),
an internally managed, diversified real estate investment trust (“REIT”), today reported earnings for its three months ended
September 30, 2025.
“We
fought through the worst office market in recent years to put Presidio in a position to capitalize when conditions normalized—and
here we are, as industry headwinds are turning into tailwinds.,” said Jack Heilbron, the Company’s President and Chief Executive
Officer.
“We
have seen a slight uptick in resale activity as mortgage rates have inched lower; recent sales have exceeded our expectations. With the
sentiment that rates will continue to ease, we are hopeful that activity will persist, allowing us to take advantage of the expected
surge in demand. We also continue to analyze numerous acquisition opportunities, identifying properties that might fit our strict criteria,”
said Steve Hightower, President of the Model Home Division.
The
Third Quarter Ended September 30, 2025, Financial Results
Net
loss attributable to the Company’s common stockholders for the three months ended September 30, 2025 was approximately $1.9 million,
or $1.53 per basic and diluted share, compared to a net loss of approximately $6.6 million, or ($5.33) per basic and diluted share for
the three months ended September 30, 2024. The change in net income attributable to the Company’s common stockholders was a result
of:
| |
● |
Total
revenues were approximately $4.2 million for the three months ended September 30, 2025, compared to approximately $4.7 million for
the same period in 2024. As of September 30, 2025, we had approximately $113.3 million in net real estate assets including 84 model
homes, compared to approximately $131.4 million in net real estate assets including 83 model homes at September 30, 2024. The average
number of model homes held during the three months ended September 30, 2025 and 2024 was 86 and 82, respectively. The change in revenue
is directly related to the decrease in commercial real estate rental income during the current period, from the sale of our two commercial
properties on February 7, 2025. |
| |
|
|
| |
● |
General
and administrative (“G&A”) expenses for the three months ended September 30, 2025 and 2024 totaled approximately
$1.5 million and $1.6 million, respectively. G&A expenses as a percentage of total revenue was 32.4% and 34.5% for the three
months ended September 30, 2025 and 2024, respectively. G&A expenses for the three months ended September 30, 2025 decreased
by approximately $0.2 million partially related to a decrease in bonus expense totaling approximately $115,163 for executives and
officers. Additionally, stock compensations decreased by approximately $59,574. |
| |
|
|
| |
● |
During
the three months ended September, 2025, Company sold three (3 model homes for approximately $1.5 million, net of sales costs, and
recognized a gain of approximately $19,685. Additionally, in September we received $0.3 million related to a escrow holdback from
the sale of our UTC and Research properties in February 2025 that was recognized a gain on sale. |
| |
● |
During
the three months ended September 30, 2025 and 2024, we recognized non-cash impairment charges of approximately $0.1 million related
to four model home properties and approximately $0.7 million related to three model homes and one commercial property (Dakota Center),
respectively. |
| |
|
|
| |
● |
Interest
expense, including amortization of deferred finance charges was approximately $1.5 million for the three months ended September 30,
2025, compared to approximately $1.5 million for the same period in 2024. The weighted average interest rate on our outstanding debt
was 6.17% and 5.44% as of September 30, 2025 and 2024, respectively. Mortgage notes payable totaled approximately $94.6 million and
$103.2 million as of September 30, 2025 and 2024, respectively. The decrease in mortgage notes payable is a direct result of the
sale of our two commercial properties during February 2025 and the change in the number of model homes. |
FFO
(non-GAAP) totaled approximately $(0.6 million) and $(0.6 million) for the three months ended September 30, 2025 and 2024, respectively.
A reconciliation of FFO to net income, the most directly comparable GAAP financial measure, is attached to this press release. However,
because FFO excludes depreciation and amortization as well as the changes in the value of the Company’s properties that result
from use or market conditions, each of which have real economic effects and could materially impact the Company’s results from
operations, the utility of FFO as a measure of the Company’s performance is limited.
We
believe Core FFO (non-GAAP) provides a useful metric in comparing operations between reporting periods and in assessing the sustainability
of our ongoing operating performance. Core FFO decreased by about $0.5 million, from approximately $0.2 million for the three months
ended September 30, 2024, to approximately $(0.3 million) for the three months ended September 30, 2025. A reconciliation of Core FFO
to net income, the most directly comparable GAAP financial measure, is attached to this press release.
Acquisitions
and Dispositions for the third quarter ended September 30, 2025:
There
were no acquisitions during the three months ended September 30, 2025:
Dispositions
during the three months ended September 30, 2025:
| |
● |
The
Company sold three (3) model homes for approximately $1.5 million, net of sales costs, and recognized a gain of approximately $19,685. |
Segment
Income during the three months ended September 30, 2025:
The
following tables compare the Company’s segment activity and NOI and adjusted NOI for Model Home income to its results of operations
and financial position as of and for the three months ended September 30, 2025. The line items listed in the below NOI tables include
the significant expense considered by the CODM for cash allocations on future investments. The Other Non-Segment & Consolidating
Items represent corporate activity, the investment in Conduit Pharmaceutical, and other eliminating items for consolidation. The information
for Corporate and Other are presented to reconcile back to the consolidated statement of operations, but is not considered a reportable
segment. This includes the loss on Conduit marketable securities.
The
following tables compare the Company’s segment activity to its results of operations and financial position as of and for the three
months ended September 30, 2025:
| | |
For the Three Months Ended September 30, 2025 | |
| | |
| | |
| | |
| | |
| | |
| |
| | |
Retail | | |
Office/Industrial | | |
Model Homes | | |
Corporate and Other | | |
Total | |
| | |
| | |
| | |
| | |
| | |
| |
| Rental revenue | |
$ | 93,574 | | |
$ | 2,372,147 | | |
$ | 1,035,923 | | |
$ | — | | |
$ | 3,501,644 | |
| Recovery revenue | |
| — | | |
| 607,222 | | |
| — | | |
| — | | |
| 607,222 | |
| Other operating revenue | |
| — | | |
| 64,450 | | |
| 7,103 | | |
| 15,723 | | |
| 87,276 | |
| Total revenues | |
| 93,574 | | |
| 3,043,819 | | |
| 1,043,026 | | |
| 15,723 | | |
| 4,196,142 | |
| | |
| | | |
| | | |
| | | |
| | | |
| | |
| Rental operating costs | |
| 4,828 | | |
| 1,627,174 | | |
| 48,743 | | |
| (146,182 | ) | |
| 1,534,563 | |
| Net Operating Income (NOI) | |
| 88,746 | | |
| 1,416,645 | | |
| 994,283 | | |
| 161,905 | | |
| 2,661,579 | |
| | |
| | | |
| | | |
| | | |
| | | |
| | |
| Gain on Sale - Model Homes | |
| — | | |
| — | | |
| 19,685 | | |
| — | | |
| 19,685 | |
| Impairment of Model Homes | |
| — | | |
| — | | |
| (82,913 | ) | |
| — | | |
| (82,913 | ) |
| | |
| | | |
| | | |
| | | |
| | | |
| | |
| Adjusted NOI | |
$ | 88,746 | | |
$ | 1,416,645 | | |
$ | 931,055 | | |
$ | 161,905 | | |
$ | 2,598,351 | |
The
CODM reviews on a regular basis the GAAP performance of each segment, including the significant segment expenses reported for GAAP shown
in the table below. Our significant segment expenses include consolidated expense categories presented in our consolidated statements
of operations, as well as rental operating costs. This information is provided to the CODM and factors into the CODM’s decision
making for company-wide strategy. The following tables compare the Company’s segment activity and to its results of GAAP operations
and financial position as of and for the three months ended September 30, 2025. The information for Corporate and Other are presented
to reconcile back to the consolidated statement of operations, but is not considered a reportable segment as noted above.
| | |
For the Three Months Ended September 30, 2025 | |
| | |
| | |
| | |
| | |
| | |
| |
| | |
Retail | | |
Office/Industrial | | |
Model Homes | | |
Corporate and Other | | |
Total | |
| Revenues: | |
| | | |
| | | |
| | | |
| | | |
| | |
| Rental income | |
$ | 93,574 | | |
$ | 2,979,369 | | |
$ | 1,035,923 | | |
$ | — | | |
$ | 4,108,866 | |
| Fees and other income | |
| — | | |
| 64,450 | | |
| 7,103 | | |
| 15,723 | | |
| 87,276 | |
| Total revenue | |
| 93,574 | | |
| 3,043,819 | | |
| 1,043,026 | | |
| 15,723 | | |
| 4,196,142 | |
| Costs and expenses: | |
| | | |
| | | |
| | | |
| | | |
| | |
| Rental operating costs | |
| 4,828 | | |
| 1,627,174 | | |
| 48,743 | | |
| (146,182 | ) | |
| 1,534,563 | |
| General and administrative | |
| — | | |
| 245 | | |
| 174,265 | | |
| 1,275,551 | | |
| 1,450,061 | |
| Depreciation and amortization | |
| 22,928 | | |
| 987,602 | | |
| 223,876 | | |
| 1,234 | | |
| 1,235,640 | |
| Impairment of goodwill and real estate assets | |
| — | | |
| — | | |
| 82,913 | | |
| — | | |
| 82,913 | |
| Total costs and expenses | |
| 27,756 | | |
| 2,615,021 | | |
| 529,797 | | |
| 1,130,603 | | |
| 4,303,177 | |
| Other income (expense): | |
| | | |
| | | |
| | | |
| | | |
| | |
| Interest expense - mortgage notes | |
| (39,762 | ) | |
| (932,226 | ) | |
| (525,755 | ) | |
| (1,332 | ) | |
| (1,499,075 | ) |
| Interest and other income, net | |
| — | | |
| — | | |
| 8 | | |
| 5,255 | | |
| 5,263 | |
| Net loss in Conduit Pharmaceuticals marketable securities (see footnote 9) | |
| — | | |
| — | | |
| — | | |
| (212 | ) | |
| (212 | ) |
| Gain on sales of real estate, net | |
| 281,290 | | |
| — | | |
| 19,685 | | |
| — | | |
| 300,975 | |
| Income tax (expense) benefit | |
| — | | |
| — | | |
| 14,871 | | |
| — | | |
| 14,871 | |
| Total other income (expense), net | |
| 241,528 | | |
| (932,226 | ) | |
| (491,191 | ) | |
| 3,711 | | |
| (1,178,178 | ) |
| Net income (loss) | |
| 307,346 | | |
| (503,428 | ) | |
| 22,038 | | |
| (1,111,169 | ) | |
| (1,285,213 | ) |
| Less: Income attributable to noncontrolling interests | |
| — | | |
| (9,777 | ) | |
| 4,142 | | |
| — | | |
| (5,635 | ) |
| Net income (loss) attributable to Presidio Property Trust, Inc. stockholders | |
$ | 307,346 | | |
$ | (513,205 | ) | |
$ | 26,180 | | |
$ | (1,111,169 | ) | |
$ | (1,290,848 | ) |
Dividends
paid during the three months ended September 30, 2025 and 2024:
The
following is a summary of distributions declared per share of our Series D Preferred Stock for the three months ended September 30, 2025
and 2024.
Series
D Preferred Stock
| Month | |
2025 | | |
2024 | |
| | |
Distributions Declared | | |
Distributions Declared | |
| July | |
$ | 0.19531 | | |
$ | 0.19531 | |
| August | |
| 0.19531 | | |
| 0.19531 | |
| September | |
| 0.19531 | | |
| 0.19531 | |
| Total | |
$ | 0.58593 | | |
$ | 0.58593 | |
About
Presidio Property Trust
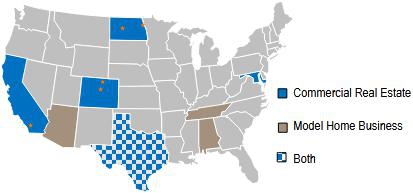
Presidio
is an internally managed, diversified REIT with holdings in model home properties which are triple-net leased to homebuilders, office,
industrial, and retail properties. Presidio’s model homes are leased to homebuilders located primarily in the sun belt states.
Presidio’s office, industrial, and retail properties
are located primarily in Colorado, with properties also located in Maryland, North Dakota, Texas, and Southern California. For more information
on Presidio, please visit Presidio’s website at https://www.PresidioPT.com.
Definitions
Non-GAAP
Financial Measures
Funds
from Operations (“FFO”) – The Company evaluates performance based on Funds From Operations, which we refer to as
FFO, as management believes that FFO represents the most accurate measure of activity and is the basis for distributions paid to equity
holders. The Company defines FFO as net income or loss (computed in accordance with GAAP), excluding gains (or losses) from sales of
property, hedge ineffectiveness, acquisition costs of newly acquired properties that are not capitalized and lease acquisition costs
that are not capitalized plus depreciation and amortization, including amortization of acquired above and below market lease intangibles
and impairment charges on properties or investments in non-consolidated REITs, and after adjustments to exclude equity in income or losses
from, and, to include the proportionate share of FFO from, non-consolidated REITs.
However,
because FFO excludes depreciation and amortization as well as the changes in the value of the Company’s properties that result
from use or market conditions, each of which have real economic effects and could materially impact the Company’s results from
operations, the utility of FFO as a measure of the Company’s performance is limited. In addition, other REITs may not calculate
FFO in accordance with the NAREIT definition as the Company does, and, accordingly, the Company’s FFO may not be comparable to
other REITs’ FFO. Accordingly, FFO should be considered only as a supplement to net income as a measure of the Company’s
performance.
Core
Funds from Operations (“Core FFO”) – We calculate Core FFO by using FFO as defined by NAREIT and adjusting for
certain other non-core items. We exclude from our Core FFO calculation acquisition costs, loss on early extinguishment of debt, changes
in the fair value of the earn-out, changes in fair value of contingent consideration, non-cash warrant dividends, other non-recuring
expenses, and the amortization of stock-based compensation.
We
believe Core FFO provides a useful metric in comparing operations between reporting periods and in assessing the sustainability of our
ongoing operating performance. Other equity REITs may calculate Core FFO differently or not at all, and, accordingly, the Company’s
Core FFO may not be comparable to such other REITs’ Core FFO.
Cautionary
Note Regarding Forward-Looking Statements
This
press release contains statements that are “forward-looking statements” within the meaning of the Private Securities Litigation
Reform Act of 1995, Section 27A of the Securities Act of 1933, as amended, and Section 21E of the Securities Exchange Act of 1934, as
amended, and other federal securities laws. Forward-looking statements are statements that are not historical, including statements regarding
management’s intentions, beliefs, expectations, representations, plans or predictions of the future, and are typically identified
by such words as “believe,” “expect,” “anticipate,” “intend,” “estimate,”
“may,” “will,” “should” and “could.” Because such statements include risks, uncertainties
and contingencies, actual results may differ materially from those expressed or implied by such forward-looking statements. Forward-looking
statements also include statements relating to the closing of the business combination with Conduit within a certain timeframe or at
all. These forward-looking statements are based upon the Company’s present expectations, but these statements are not guaranteed
to occur. Except as required by law, the Company disclaims any obligation to publicly update or revise any forward-looking statement
to reflect changes in underlying assumptions or factors, of new information, data or methods, future events or other changes. Investors
should not place undue reliance upon forward-looking statements. For further discussion of the factors that could affect outcomes, please
refer to the “Risk Factors” section of the Company’s documents filed with the SEC, copies of which are available on
the SEC’s website, www.sec.gov.
Investor
Relations Contact:
Presidio
Property Trust, Inc.
Lowell
Hartkorn, Investor Relations
[email protected]
Telephone:
(760) 471-8536 x1244
Presidio
Property Trust, Inc. and Subsidiaries
Consolidated
Balance Sheets
| | |
September 30, | | |
December 31, | |
| | |
2025 | | |
2024 | |
| | |
(unaudited) | | |
| |
| ASSETS | |
| | | |
| | |
| Real estate assets and lease intangibles: | |
| | | |
| | |
| Land | |
$ | 16,625,237 | | |
$ | 15,983,323 | |
| Buildings and improvements | |
| 105,024,265 | | |
| 102,862,977 | |
| Tenant improvements | |
| 17,338,795 | | |
| 16,488,066 | |
| Lease intangibles | |
| 3,475,531 | | |
| 3,776,654 | |
| Real estate assets and lease intangibles held for investment, cost | |
| 142,463,828 | | |
| 139,111,020 | |
| Accumulated depreciation and amortization | |
| (36,622,641 | ) | |
| (33,700,262 | ) |
| Real estate assets and lease intangibles held for investment, net | |
| 105,841,187 | | |
| 105,410,758 | |
| Real estate assets held for sale, net | |
| 7,440,774 | | |
| 22,185,742 | |
| Real estate assets, net | |
| 113,281,961 | | |
| 127,596,500 | |
| Other assets: | |
| | | |
| | |
| Cash, cash equivalents and restricted cash | |
| 8,002,915 | | |
| 8,036,496 | |
| Deferred leasing costs, net | |
| 1,378,568 | | |
| 1,666,135 | |
| Goodwill | |
| 1,389,000 | | |
| 1,389,000 | |
| Investment in Conduit Pharmaceuticals marketable securities (see Notes 2 & 9) | |
| 7,515 | | |
| 206,177 | |
| Deferred tax asset | |
| 298,645 | | |
| 298,645 | |
| Other assets, net (see Note 6) | |
| 3,450,281 | | |
| 3,376,697 | |
| Total other assets | |
| 14,526,924 | | |
| 14,973,150 | |
| TOTAL ASSETS (1) | |
$ | 127,808,885 | | |
$ | 142,569,650 | |
| LIABILITIES AND EQUITY | |
| | | |
| | |
| Liabilities: | |
| | | |
| | |
| Mortgage notes payable, net | |
$ | 83,277,135 | | |
$ | 80,977,448 | |
| Mortgage notes payable related to properties held for sale, net | |
| 10,442,278 | | |
| 21,116,646 | |
| Mortgage notes payable, total net | |
| 93,719,413 | | |
| 102,094,094 | |
| Accounts payable and accrued liabilities | |
| 3,043,157 | | |
| 3,290,170 | |
| Accrued real estate taxes | |
| 1,457,629 | | |
| 1,972,477 | |
| Dividends payable | |
| 190,393 | | |
| 194,784 | |
| Lease liability, net | |
| 46,373 | | |
| 64,345 | |
| Below-market leases, net | |
| 4,560 | | |
| 8,625 | |
| Total liabilities | |
| 98,461,525 | | |
| 107,624,495 | |
| | |
| | | |
| | |
| Commitments and contingencies (see Note 10) | |
| | | |
| | |
| Equity: | |
| | | |
| | |
| Series D Preferred Stock, $0.01 par value per share; 1,000,000 shares authorized; 974,823 shares issued and outstanding (liquidation preference $25.00 per share) as of September 30, 2025 and 997,082 shares issued and outstanding as of December 31, 2024 | |
| 9,748 | | |
| 9,971 | |
| Series A Common Stock, $0.01 par value per share, shares authorized: 100,000,000; 1,230,601 shares and 1,283,432 shares were issued and outstanding as of September 30, 2025 and December 31, 2024, respectively | |
| 12,306 | | |
| 128,343 | |
| Additional paid-in capital | |
| 186,477,510 | | |
| 185,770,842 | |
| Dividends and accumulated losses | |
| (165,400,881 | ) | |
| (159,374,010 | ) |
| Total stockholders’ equity before noncontrolling interest | |
| 21,098,683 | | |
| 26,535,146 | |
| Noncontrolling interest | |
| 8,248,677 | | |
| 8,410,009 | |
| Total equity | |
| 29,347,360 | | |
| 34,945,155 | |
| TOTAL LIABILITIES AND EQUITY | |
$ | 127,808,885 | | |
$ | 142,569,650 | |
Presidio
Property Trust, Inc. and Subsidiaries
Consolidated
Statements of Operations
| | |
For the Three Months Ended September 30, | | |
For the Nine Months Ended September 30, | |
| | |
2025 | | |
2024 | | |
2025 | | |
2024 | |
| Revenues: | |
| | | |
| | | |
| | | |
| | |
| Rental income | |
$ | 4,108,866 | | |
$ | 4,640,816 | | |
$ | 12,423,048 | | |
$ | 13,754,740 | |
| Fees and other income | |
| 87,276 | | |
| 82,558 | | |
| 277,018 | | |
| 345,236 | |
| Total revenue | |
| 4,196,142 | | |
| 4,723,374 | | |
| 12,700,066 | | |
| 14,099,976 | |
| Costs and expenses: | |
| | | |
| | | |
| | | |
| | |
| Rental operating costs | |
| 1,534,563 | | |
| 1,598,015 | | |
| 4,609,810 | | |
| 4,654,087 | |
| General and administrative | |
| 1,450,061 | | |
| 1,629,919 | | |
| 4,335,697 | | |
| 5,917,286 | |
| Depreciation and amortization | |
| 1,235,640 | | |
| 1,455,882 | | |
| 3,691,435 | | |
| 4,158,270 | |
| Impairment of goodwill and real estate assets | |
| 82,913 | | |
| 697,146 | | |
| 4,427,245 | | |
| 893,939 | |
| Total costs and expenses | |
| 4,303,177 | | |
| 5,380,962 | | |
| 17,064,187 | | |
| 15,623,582 | |
| Other income (expense): | |
| | | |
| | | |
| | | |
| | |
| Interest expense - mortgage notes | |
| (1,499,075 | ) | |
| (1,473,528 | ) | |
| (4,487,415 | ) | |
| (4,514,579 | ) |
| Interest and other income, net | |
| 5,263 | | |
| 5,263 | | |
| 15,618 | | |
| 15,116 | |
| Gain on sales of real estate, net | |
| 300,975 | | |
| 361,151 | | |
| 5,078,302 | | |
| 3,191,149 | |
| Net loss in Conduit Pharmaceuticals marketable securities (see Note 9) | |
| (212 | ) | |
| (3,932,770 | ) | |
| (184,672 | ) | |
| (17,821,437 | ) |
| Income tax expense (benefit) | |
| 14,871 | | |
| (6,911 | ) | |
| (13,630 | ) | |
| (167,496 | ) |
| Total other income (expense), net | |
| (1,178,178 | ) | |
| (5,046,795 | ) | |
| 408,203 | | |
| (19,297,247 | ) |
| Net loss | |
| (1,285,213 | ) | |
| (5,704,383 | ) | |
| (3,955,918 | ) | |
| (20,820,853 | ) |
| Less: Income attributable to noncontrolling interests | |
| (5,635 | ) | |
| (355,153 | ) | |
| (346,103 | ) | |
| (2,328,386 | ) |
| Net loss attributable to Presidio Property Trust, Inc. stockholders | |
$ | (1,290,848 | ) | |
$ | (6,059,536 | ) | |
$ | (4,302,021 | ) | |
$ | (23,149,239 | ) |
| Less: Series D Preferred Stock dividends | |
| (571,179 | ) | |
| (585,930 | ) | |
| (1,724,850 | ) | |
| (1,651,293 | ) |
| Net loss attributable to Presidio Property Trust, Inc. common stockholders | |
$ | (1,862,027 | ) | |
$ | (6,645,466 | ) | |
$ | (6,026,871 | ) | |
$ | (24,800,532 | ) |
| | |
| | | |
| | | |
| | | |
| | |
| Net loss per share attributable to Presidio Property Trust, Inc. common stockholders: | |
| | | |
| | | |
| | | |
| | |
| Basic & Diluted | |
$ | (1.53 | ) | |
$ | (5.33 | ) | |
$ | (4.95 | ) | |
$ | (20.00 | ) |
| | |
| | | |
| | | |
| | | |
| | |
| Weighted average number of common shares outstanding - basic & dilutive | |
| 1,215,943 | | |
| 1,247,657 | | |
| 1,216,873 | | |
| 1,239,980 | |
FFO
AND CORE FFO RECONCILIATION
| | |
For the Three Months Ended September 30, | | |
For the Nine Months Ended September 30, | |
| | |
2025 | | |
2024 | | |
2025 | | |
2024 | |
| Net (loss) income attributable to Presidio Property Trust, Inc. common stockholders | |
$ | (1,862,027 | ) | |
$ | (6,645,466 | ) | |
$ | (6,026,871 | ) | |
$ | (24,800,532 | ) |
| Adjustments: | |
| | | |
| | | |
| | | |
| | |
| Income attributable to noncontrolling interests | |
| 5,635 | | |
| 355,153 | | |
| 346,103 | | |
| 2,328,386 | |
| Depreciation and amortization | |
| 1,235,640 | | |
| 1,455,882 | | |
| 3,691,435 | | |
| 4,158,270 | |
| Amortization of above and below market leases, net | |
| (1,244 | ) | |
| (1,244 | ) | |
| (3,509 | ) | |
| (3,731 | ) |
| Impairment of real estate assets | |
| 82,913 | | |
| 697,146 | | |
| 4,427,245 | | |
| 893,939 | |
| Net change in marketable securities | |
| 212 | | |
| 3,932,770 | | |
| 184,672 | | |
| 17,821,997 | |
| Loss (gain) on sale of real estate assets, net | |
| (300,975 | ) | |
| (361,151 | ) | |
| (5,078,302 | ) | |
| (3,191,149 | ) |
| FFO | |
$ | (839,846 | ) | |
$ | (566,910 | ) | |
$ | (2,459,227 | ) | |
$ | (2,792,820 | ) |
| Restricted stock compensation | |
| 287,447 | | |
| 347,021 | | |
| 831,823 | | |
| 1,232,050 | |
| Cost associated with Zuma Capital Management | |
| — | | |
| 469,552 | | |
| — | | |
| 565,534 | |
| Core FFO | |
$ | (552,399 | ) | |
$ | 249,663 | | |
$ | (1,627,404 | ) | |
$ | (995,236 | ) |
| | |
| | | |
| | | |
| | | |
| | |
| Weighted average number of common shares outstanding - basic and diluted | |
| 1,215,943 | | |
| 1,247,657 | | |
| 1,216,873 | | |
| 1,239,980 | |
| | |
| | | |
| | | |
| | | |
| | |
| Core FFO / Wgt Avg Share | |
$ | (0.45 | ) | |
$ | 0.20 | | |
$ | (1.34 | ) | |
$ | (0.80 | ) |
| | |
| | | |
| | | |
| | | |
| | |
| Quarterly Dividends / Share | |
$ | — | | |
$ | — | | |
$ | — | | |
$ | — | |
Exhibit
99.2


SUPPLEMENTAL
FINANCIAL INFORMATION
As
of September 30, 2025
| FORWARD-LOOKING
STATEMENTS |
 |
This
presentation contains “forward-looking statements” within the meaning of the federal securities laws that involve risks and
uncertainties, many of which are beyond our control. Our actual results could differ materially and adversely from those anticipated
in such forward-looking statements as a result of certain factors, including those set forth in the Quarterly Report on Form 10-Q. Forward-looking
statements relate to matters such as our industry, business strategy, goals and expectations concerning our market position, future operations,
margins, profitability, capital expenditures, financial condition, liquidity, capital resources, cash flows, dividends, results of operations
and other financial and operating information. When used in this presentation, the words “will,” “may,” “believe,”
“anticipate,” “intend,” “estimate,” “expect,” “should,” “project,”
“plan,” and similar expressions are intended to identify forward-looking statements, although not all forward-looking statements
contain such identifying words.
The
forward-looking statements contained in this presentation are based on historical performance and management’s current plans, estimates
and expectations in light of information currently available to it and are subject to uncertainty and changes in circumstances. There
can be no assurance that future developments affecting us will be those that we have anticipated. Actual results may differ materially
from these expectations due to the factors, risks and uncertainties described in the Annual Report on Form 10-K, as filed March 31, 2025
(“Annual Report”) and the Company’s Quarterly Report on Form 10-Q filed with the SEC on the date hereof (“Quarterly
Report”), changes in global, regional or local political, economic, business, competitive, market, regulatory and other factors
described in the “Risk Factors” section of the Annual Report and the Quarterly Report, many of which are beyond our control.
Should one or more of these risks or uncertainties materialize or should any of our assumptions prove to be incorrect, our actual results
may vary in material respects from what we may have expressed or implied by these forward-looking statements. We caution that you should
not place undue reliance on any of our forward-looking statements. Any forward-looking statement made by us in this presentation speaks
only as of the date on which we make it. Factors or events that could cause our actual results to differ may emerge from time to time,
and it is not possible for us to predict all of them. We undertake no obligation to publicly update any forward-looking statement, whether
as a result of new information, future developments or otherwise, except as may be required by applicable securities laws.
| COMPANY
OVERVIEW |
|

| ● |
Presidio
Property Trust, Inc. (“Presidio” or the “Company”) was founded in
1999 as NetREIT
|
| |
|
| ● |
Presidio
is an internally managed real estate company focused on commercial real estate opportunities
in often overlooked and regionally dominant markets
|
| |
|
| ● |
The
Company acquires, owns, and manages office and industrial real estate assets in markets with strong demographic and economic drivers
with attractive going-in cap rates |
| |
|
| ● |
Presidio’s
commercial portfolio currently includes 10 commercial properties with a book value of approximately $74.2 million |
| |
|
| ● |
In
addition to its commercial real estate holdings, Presidio generates fees and rental income from affiliated entities, which manage and/or
own a portfolio of model homes (1) |
| Corporate
Information |
|
| Headquarters |
San
Diego, CA |
| Founded |
1999 |
| Key
Geographies |
CA,
CO, MD, ND & TX |
| Employees |
14 |
| Portfolio
Summary (Number / Square Footage) |
|
| Office |
8
properties / 608,076 sqft. |
| Retail |
1
properties / 10,500 sqft. |
| Industrial |
1
property / 150,099 sqft. |
| Model
Homes (1) |
84
homes / 250,281 sqft |
| Portfolio
Value & Debt |
|
| Book
Value |
$113.3
million (2) |
| Existing
Secured Debt |
$94.6
million |
| (1) |
The
Company holds partial ownership interests in several entities which own model home properties
|
| |
|
| (2) |
Includes
book value of model homes |
| COMMERCIAL
PORTFOLIO |
|
| | |
| |
| |
Real
estate assets and lease intangibles, net | |
| Property Name | |
Date Acquired | |
Location | |
September
30, 2025 | | |
December
31, 2024 | |
| Genesis Plaza (1) | |
August 2010 | |
San Diego, CA | |
$ | 7,405,978 | | |
$ | 7,363,571 | |
| Dakota Center (2) | |
May 2011 | |
Fargo, ND | |
| 5,067,882 | | |
| 8,154,951 | |
| Grand Pacific Center | |
March 2014 | |
Bismarck, ND | |
| 8,220,577 | | |
| 8,413,926 | |
| Arapahoe Center | |
December 2014 | |
Centennial, CO | |
| 8,981,150 | | |
| 9,298,534 | |
| Union Town Center (3) | |
December 2014 | |
Colorado Springs, CO | |
| — | | |
| 8,922,943 | |
| West Fargo Industrial | |
August 2015 | |
Fargo, ND | |
| 6,402,255 | | |
| 6,599,953 | |
| 300 N.P. | |
August 2015 | |
Fargo, ND | |
| 1,982,030 | | |
| 1,963,000 | |
| Research Parkway (3) | |
August 2015 | |
Colorado Springs, CO | |
| — | | |
| 2,220,284 | |
| One Park Center | |
August 2015 | |
Westminster, CO | |
| 5,607,617 | | |
| 5,580,950 | |
| Shea Center II (4) | |
December 2015 | |
Highlands Ranch, CO | |
| 17,969,697 | | |
| 18,820,370 | |
| Mandolin (5) | |
August 2021 | |
Houston, TX | |
| 4,531,779 | | |
| 4,600,562 | |
| Baltimore | |
December 2021 | |
Baltimore, MD | |
| 8,072,924 | | |
| 8,241,456 | |
| Commercial properties | |
| |
| |
| 74,241,889 | | |
| 90,180,500 | |
| Model
Home properties (6) | |
2019 - 2025 | |
AZ, TN, TX, AL | |
| 39,040,072 | | |
| 37,416,000 | |
| Total
real estate assets and lease intangibles, net | |
| |
| |
$ | 113,281,961 | | |
$ | 127,596,500 | |
| (1) |
Genesis
Plaza is owned by two tenants-in-common, NetREIT Genesis and NetREIT Genessis II, each of
which own 57% and 43%, respectively, and we beneficially own an aggregate of 92.0%, based
on our ownership of each entity. We have 100% ownership of NetREIT Genesis and 81.5% ownership
of NetREIT Genesis II, and we have control of both entities. During July 2024, the Company
completed a minority ownership conversion option as result of a death in a noncontrolling
trust within NetREIT Genesis II. The Company issued the trust 78,215 shares of SQFT Series
A Common Stock in exchange for their 36.4% ownership in NetREIT Genesis II, as per the original
exchange agreement.
|
| |
|
| (2) |
The
non-recourse loan on the Dakota Center property matured on July 6, 2024. During December
2024, the lender agreed to the broker the Company would use to sell the property to settle
the non-recourse debt. As of September 30, 2025, the property was included in the real estate
assets held for sale, net on the consolidated balance sheet. During July 2025, the lender
approved a purchase offer from a third party for $5,125,000. In connection with the pending
sale, we have impaired the property’s book value and recorded an impairment charge
of approximately $3.3 million for the nine months ended September 30, 2025. The sale is expected
to take place during the fourth quarter 2025 or in the first quarter of 2026.
|
| |
|
| (3) |
During
February 2025, Union Town Center and Research Parkway were sold to a single buyer for a combined
total of approximately $15.9 million, net of selling costs, and recognized a net gain of
approximately $4.5 million, net of closing costs.
|
| |
|
| (4) |
On
December 31, 2022, the lease for our largest tenant, Halliburton, expired. Halliburton was
located in our Shea Center II property in Colorado, and made up approximately $536,080 of
our annual base rent. Halliburton did not renew the lease and we placed approximately $1.1
million in a reserve account with our lender to cover future mortgage payments, if necessary,
none of which has been used as of September
30, 2025. Our management team is working to fill the 45,535 square foot space and
has leased approximately 69% of the space to other tenants and has reviewed various proposals
for the remaining 31%. As of September
30, 2025, management is pursuing third party tenants who fit into our long-term plans,
however, there is no guarantee we will be successful in signing new tenants. During the three
months ended September 30, 2025,
we have reassessed the value of the property and recorded an impairment charge of approximately
$0.9 million.
|
| |
|
| (5) |
A
portion of the proceeds from the sale of Highland Court were used in like-kind exchange transactions pursued under Section 1031 of
the Code for the acquisition of our Mandolin property. Mandolin is owned by NetREIT Palm Self-Storage LP, through its wholly owned
subsidiary, NetREIT Highland LLC, and the Company is the sole general partner and owns 61.3% of NetREIT Palm Self-Storage LP. |
| |
|
| (6) |
Includes
Model Homes listed as held for sale as of September 30, 2025 and December
31, 2024. During the three and nine months ended September 30, 2025, we recorded an impairment charge for model homes totaling $0.1
million and $0.2 million, respective, which reflects the estimated sales prices for these specific model homes. The short hold period,
less than two years, and the builder changing their model style after we purchased the homes, contributed to the lower than expected
sales price. |
| MODEL
HOMES PORTFOLIO |
|
| State | |
No.
of Properties | | |
Aggregate
Square Feet | | |
Approximate
% of Square Feet | | |
Current
Base Annual Rent | | |
Approximate
of Aggregate % Annual Rent | |
| Alabama | |
| 10 | | |
| 23,835 | | |
| 9.5 | % | |
$ | 347,064 | | |
| 9.5 | % |
| Arizona | |
| 2 | | |
| 6,822 | | |
| 2.7 | % | |
$ | 149,196 | | |
| 4.1 | % |
| Tennessee | |
| 2 | | |
| 5,534 | | |
| 2.2 | % | |
$ | 89,304 | | |
| 2.4 | % |
| Texas | |
| 70 | | |
| 214,090 | | |
| 85.6 | % | |
$ | 3,069,336 | | |
| 83.9 | % |
| Total | |
| 84 | | |
| 250,281 | | |
| 100.0 | % | |
$ | 3,654,900 | | |
| 99.9 | % |
| CONSOLIDATED
BALANCE SHEET |
|
Presidio
Property Trust, Inc. and Subsidiaries
Consolidated
Balance Sheets
| | |
September
30, | | |
December 31, | |
| | |
2025 | | |
2024 | |
| | |
(unaudited) | | |
| |
| ASSETS | |
| | | |
| | |
| Real estate assets and lease intangibles: | |
| | | |
| | |
| Land | |
$ | 16,625,237 | | |
$ | 15,983,323 | |
| Buildings and improvements | |
| 105,024,265 | | |
| 102,862,977 | |
| Tenant improvements | |
| 17,338,795 | | |
| 16,488,066 | |
| Lease
intangibles | |
| 3,475,531 | | |
| 3,776,654 | |
| Real estate assets and lease intangibles held
for investment, cost | |
| 142,463,828 | | |
| 139,111,020 | |
| Accumulated depreciation
and amortization | |
| (36,622,641 | ) | |
| (33,700,262 | ) |
| Real estate assets and lease intangibles held
for investment, net | |
| 105,841,187 | | |
| 105,410,758 | |
| Real estate assets held
for sale, net | |
| 7,440,774 | | |
| 22,185,742 | |
| Real estate assets, net | |
| 113,281,961 | | |
| 127,596,500 | |
| Other assets: | |
| | | |
| | |
| Cash, cash equivalents
and restricted cash | |
| 8,002,915 | | |
| 8,036,496 | |
| Deferred leasing costs,
net | |
| 1,378,568 | | |
| 1,666,135 | |
| Goodwill | |
| 1,389,000 | | |
| 1,389,000 | |
| Investment in Conduit Pharmaceuticals
marketable securities (see Notes 2 & 9) | |
| 7,515 | | |
| 206,177 | |
| Deferred tax asset | |
| 298,645 | | |
| 298,645 | |
| Other
assets, net (see Note 6) | |
| 3,450,281 | | |
| 3,376,697 | |
| Total other assets | |
| 14,526,924 | | |
| 14,973,150 | |
| TOTAL
ASSETS | |
$ | 127,808,885 | | |
$ | 142,569,650 | |
| LIABILITIES AND EQUITY | |
| | | |
| | |
| Liabilities: | |
| | | |
| | |
| Mortgage notes payable, net | |
$ | 83,277,135 | | |
$ | 80,977,448 | |
| Mortgage notes payable
related to properties held for sale, net | |
| 10,442,278 | | |
| 21,116,646 | |
| Mortgage notes payable,
total net | |
| 93,719,413 | | |
| 102,094,094 | |
| Accounts payable and accrued liabilities | |
| 3,043,157 | | |
| 3,290,170 | |
| Accrued real estate taxes | |
| 1,457,629 | | |
| 1,972,477 | |
| Dividends payable | |
| 190,393 | | |
| 194,784 | |
| Lease liability, net | |
| 46,373 | | |
| 64,345 | |
| Below-market leases, net | |
| 4,560 | | |
| 8,625 | |
| Total
liabilities | |
| 98,461,525 | | |
| 107,624,495 | |
| | |
| | | |
| | |
| Commitments and contingencies
(see Note 10) | |
| | | |
| | |
| Equity: | |
| | | |
| | |
| Series D Preferred Stock, $0.01 par value per share; 1,000,000 shares
authorized; 974,823 shares issued and outstanding (liquidation preference $25.00 per share) as of September 30, 2025 and 997,082
shares issued and outstanding as of December 31, 2024 | |
| 9,748 | | |
| 9,971 | |
| Series A Common Stock, $0.01 par value per share, shares authorized:
100,000,000; 1,230,601 shares and 1,283,432 shares were issued and outstanding as of September 30, 2025 and December 31, 2024, respectively | |
| 12,306 | | |
| 128,343 | |
| Additional paid-in capital | |
| 186,477,510 | | |
| 185,770,842 | |
| Dividends and accumulated
losses | |
| (165,400,881 | ) | |
| (159,374,010 | ) |
| Total stockholders’
equity before noncontrolling interest | |
| 21,098,683 | | |
| 26,535,146 | |
| Noncontrolling interest | |
| 8,248,677 | | |
| 8,410,009 | |
| Total
equity | |
| 29,347,360 | | |
| 34,945,155 | |
| TOTAL
LIABILITIES AND EQUITY | |
$ | 127,808,885 | | |
$ | 142,569,650 | |
| CONSOLIDATED
STATEMENT OF OPERATIONS |
|
Presidio
Property Trust, Inc. and Subsidiaries
Consolidated
Statements of Operations
| | |
For
the Three Months Ended September 30, | | |
For
the Nine Months Ended September 30, | |
| | |
2025 | | |
2024 | | |
2025 | | |
2024 | |
| Revenues: | |
| | |
| | |
| | |
| |
| Rental income | |
$ | 4,108,866 | | |
$ | 4,640,816 | | |
$ | 12,423,048 | | |
$ | 13,754,740 | |
| Fees
and other income | |
| 87,276 | | |
| 82,558 | | |
| 277,018 | | |
| 345,236 | |
| Total
revenue | |
| 4,196,142 | | |
| 4,723,374 | | |
| 12,700,066 | | |
| 14,099,976 | |
| Costs and expenses: | |
| | | |
| | | |
| | | |
| | |
| Rental operating costs | |
| 1,534,563 | | |
| 1,598,015 | | |
| 4,609,810 | | |
| 4,654,087 | |
| General and administrative | |
| 1,450,061 | | |
| 1,629,919 | | |
| 4,335,697 | | |
| 5,917,286 | |
| Depreciation and amortization | |
| 1,235,640 | | |
| 1,455,882 | | |
| 3,691,435 | | |
| 4,158,270 | |
| Impairment
of goodwill and real estate assets | |
| 82,913 | | |
| 697,146 | | |
| 4,427,245 | | |
| 893,939 | |
| Total
costs and expenses | |
| 4,303,177 | | |
| 5,380,962 | | |
| 17,064,187 | | |
| 15,623,582 | |
| Other income (expense): | |
| | | |
| | | |
| | | |
| | |
| Interest expense - mortgage
notes | |
| (1,499,075 | ) | |
| (1,473,528 | ) | |
| (4,487,415 | ) | |
| (4,514,579 | ) |
| Interest and other income,
net | |
| 5,263 | | |
| 5,263 | | |
| 15,618 | | |
| 15,116 | |
| Gain on sales of real estate,
net | |
| 300,975 | | |
| 361,151 | | |
| 5,078,302 | | |
| 3,191,149 | |
| Net loss in Conduit Pharmaceuticals
marketable securities (see Note 9) | |
| (212 | ) | |
| (3,932,770 | ) | |
| (184,672 | ) | |
| (17,821,437 | ) |
| Income
tax expense (benefit) | |
| 14,871 | | |
| (6,911 | ) | |
| (13,630 | ) | |
| (167,496 | ) |
| Total
other income (expense), net | |
| (1,178,178 | ) | |
| (5,046,795 | ) | |
| 408,203 | | |
| (19,297,247 | ) |
| Net loss | |
| (1,285,213 | ) | |
| (5,704,383 | ) | |
| (3,955,918 | ) | |
| (20,820,853 | ) |
| Less: Income attributable
to noncontrolling interests | |
| (5,635 | ) | |
| (355,153 | ) | |
| (346,103 | ) | |
| (2,328,386 | ) |
| Net loss attributable
to Presidio Property Trust, Inc. stockholders | |
$ | (1,290,848 | ) | |
$ | (6,059,536 | ) | |
$ | (4,302,021 | ) | |
$ | (23,149,239 | ) |
| Less: Series D Preferred
Stock dividends | |
| (571,179 | ) | |
| (585,930 | ) | |
| (1,724,850 | ) | |
| (1,651,293 | ) |
| Net loss attributable
to Presidio Property Trust, Inc. common stockholders | |
$ | (1,862,027 | ) | |
$ | (6,645,466 | ) | |
$ | (6,026,871 | ) | |
$ | (24,800,532 | ) |
| | |
| | | |
| | | |
| | | |
| | |
| Net loss per share attributable to Presidio
Property Trust, Inc. common stockholders: | |
| | | |
| | | |
| | | |
| | |
| Basic
& Diluted | |
$ | (1.53 | ) | |
$ | (5.33 | ) | |
$ | (4.95 | ) | |
$ | (20.00 | ) |
| | |
| | | |
| | | |
| | | |
| | |
| Weighted average number of common shares
outstanding - basic & dilutive | |
| 1,215,943 | | |
| 1,247,657 | | |
| 1,216,873 | | |
| 1,239,980 | |
CONSOLIDATED STATEMENT OF CASH FLOWS |
|
Presidio
Property Trust, Inc. and Subsidiaries
Consolidated
Statements of Cash Flows
| | |
For
the Nine Months Ended September 30, | |
| | |
2025 | | |
2024 | |
| Cash flows from operating activities: | |
| | | |
| | |
| Net loss | |
$ | (3,955,918 | ) | |
$ | (20,820,853 | ) |
| Adjustments to reconcile
net loss to net cash used in operating activities: | |
| | | |
| | |
| Depreciation and amortization | |
| 3,691,435 | | |
| 4,158,270 | |
| Stock compensation | |
| 831,823 | | |
| 1,232,050 | |
| Gain on sale of real estate
assets, net | |
| (5,078,302 | ) | |
| (3,191,149 | ) |
| Net loss in Conduit Pharmaceuticals
fair value marketable securities | |
| 184,672 | | |
| 17,821,437 | |
| Net loss (gain) in fair
value marketable securities | |
| — | | |
| 560 | |
| Impairment of goodwill
and real estate assets | |
| 4,427,245 | | |
| 893,939 | |
| Amortization of financing
costs | |
| 201,500 | | |
| 286,491 | |
| Amortization of below-market
leases | |
| (3,509 | ) | |
| (3,731 | ) |
| Straight-line rent adjustment | |
| 41,733 | | |
| (113,491 | ) |
| Changes in operating assets
and liabilities: | |
| | | |
| | |
| Other assets | |
| 294,586 | | |
| 158,524 | |
| Accounts payable and accrued
liabilities | |
| (500,641 | ) | |
| (784,313 | ) |
| Accrued
real estate taxes | |
| (514,848 | ) | |
| (296,168 | ) |
| Net
cash used in operating activities | |
| (380,224 | ) | |
| (658,434 | ) |
| Cash flows from investing
activities: | |
| | | |
| | |
| Real estate acquisitions | |
| (9,444,465 | ) | |
| (9,729,351 | ) |
| Additions to buildings
and tenant improvements | |
| (2,178,973 | ) | |
| (1,939,641 | ) |
| Proceeds from sale of marketable
securities | |
| 13,990 | | |
| 60,467 | |
| Proceeds
from sales of real estate, net | |
| 23,043,395 | | |
| 22,273,254 | |
| Net
cash provided by investing activities | |
| 11,433,947 | | |
| 10,664,729 | |
| Cash flows from financing activities: | |
| | | |
| | |
| Proceeds from mortgage
notes payable, net of issuance costs | |
| 18,942,396 | | |
| 13,602,291 | |
| Payment of debt issuance
costs | |
| (333,838 | ) | |
| (210,661 | ) |
| Repayment of mortgage notes
payable | |
| (27,142,992 | ) | |
| (19,072,175 | ) |
| Payment of deferred offering costs | |
| (79,170 | ) | |
| — | |
| Distributions to noncontrolling
interests | |
| (507,435 | ) | |
| (3,283,899 | ) |
| Contributions from noncontrolling
interests | |
| — | | |
| 200,000 | |
| Issuance of Series A Common Stock, net of offering
costs | |
| 1,671,463 | | |
| — | |
| Issuance of Series D Preferred
Stock, net of offering costs | |
| — | | |
| 1,195,855 | |
| Repurchase of Series A
Common Stock, at cost | |
| (1,585,091 | ) | |
| (97,394 | ) |
| Repurchase of Series D
Preferred Stock, at cost | |
| (327,787 | ) | |
| — | |
| Dividends
paid to Series D Preferred Stockholders | |
| (1,724,850 | ) | |
| (1,651,292 | ) |
| Net
cash used in financing activities | |
| (11,087,304 | ) | |
| (9,317,275 | ) |
| Net (decrease) increase in cash equivalents
and restricted cash | |
| (33,581 | ) | |
| 689,020 | |
| Cash, cash equivalents
and restricted cash - beginning of period | |
| 8,036,496 | | |
| 6,510,428 | |
| Cash, cash equivalents
and restricted cash - end of period | |
$ | 8,002,915 | | |
$ | 7,199,448 | |
| Supplemental disclosure
of cash flow information: | |
| | | |
| | |
| Interest
paid-mortgage notes payable | |
$ | 4,540,090 | | |
$ | 4,064,414 | |
| Income
taxes paid | |
$ | 46,511 | | |
$ | 71,546 | |
| Non-cash investing activities: | |
| | | |
| | |
| Paid
building and tenant improvements from prior year | |
$ | (207,847 | ) | |
$ | (295,567 | ) |
| Unpaid
building and tenant improvements | |
$ | 140,135 | | |
$ | 30,204 | |
| Private
warrants from Conduit Pharmaceuticals | |
$ | — | | |
$ | 642,600 | |
| Non-cash financing activities: | |
| | | |
| | |
| Unpaid
debt issuance costs | |
$ | 85,164 | | |
$ | — | |
| Issuance
of Series A Common Stock for minority interest | |
$ | — | | |
$ | 1,052,579 | |
| Dividends
payable - Series D Preferred Stock | |
$ | 190,393 | | |
$ | 195,310 | |
| EBITDAre
RECONCILIATION |
|
| | |
For
the Three Months Ended
September 30, | | |
For
the Nine Months
Ended September 30, | |
| | |
2025 | | |
2024 | | |
2025 | | |
2024 | |
| Net (loss) income attributable
to Presidio Property Trust, Inc. common stockholders | |
$ | (1,862,027 | ) | |
$ | (6,645,466 | ) | |
$ | (6,026,871 | ) | |
$ | (24,800,532 | ) |
| Adjustments | |
| | | |
| | | |
| | | |
| | |
| Interest Expense | |
| 1,499,075 | | |
| 1,473,528 | | |
| 4,487,415 | | |
| 4,514,579 | |
| Depreciation and Amortization | |
| 1,234,396 | | |
| 1,454,638 | | |
| 3,687,926 | | |
| 4,154,539 | |
| Asset Impairment | |
| 82,913 | | |
| 697,146 | | |
| 4,427,245 | | |
| 893,939 | |
| Net loss (gain) on sale
of real estate | |
| (300,975 | ) | |
| (361,151 | ) | |
| (5,078,302 | ) | |
| (3,191,149 | ) |
| Net change in marketable
securities | |
| 212 | | |
| 3,932,770 | | |
| 184,672 | | |
| 17,821,997 | |
| Income
Taxes | |
| (14,871 | ) | |
| 6,911 | | |
| 13,630 | | |
| 167,496 | |
| | |
| | | |
| | | |
| | | |
| | |
| EBITDAre | |
$ | 638,723 | | |
$ | 558,376 | | |
$ | 1,695,715 | | |
$ | (439,131 | ) |
| FFO
AND CORE FFO RECONCILIATION |
|
| | |
For
the Three Months Ended
September 30, | | |
For
the Nine Months
Ended September 30, | |
| | |
2025 | | |
2024 | | |
2025 | | |
2024 | |
| Net (loss) income attributable
to Presidio Property Trust, Inc. common stockholders | |
$ | (1,862,027 | ) | |
$ | (6,645,466 | ) | |
$ | (6,026,871 | ) | |
$ | (24,800,532 | ) |
| Adjustments: | |
| | | |
| | | |
| | | |
| | |
| Income attributable to
noncontrolling interests | |
| 5,635 | | |
| 355,153 | | |
| 346,103 | | |
| 2,328,386 | |
| Depreciation and amortization | |
| 1,235,640 | | |
| 1,455,882 | | |
| 3,691,435 | | |
| 4,158,270 | |
| Amortization of above and
below market leases, net | |
| (1,244 | ) | |
| (1,244 | ) | |
| (3,509 | ) | |
| (3,731 | ) |
| Impairment of real estate
assets | |
| 82,913 | | |
| 697,146 | | |
| 4,427,245 | | |
| 893,939 | |
| Net change in marketable
securities | |
| 212 | | |
| 3,932,770 | | |
| 184,672 | | |
| 17,821,997 | |
| Loss
(gain) on sale of real estate assets, net | |
| (300,975 | ) | |
| (361,151 | ) | |
| (5,078,302 | ) | |
| (3,191,149 | ) |
| FFO | |
$ | (839,846 | ) | |
$ | (566,910 | ) | |
$ | (2,459,227 | ) | |
$ | (2,792,820 | ) |
| Restricted stock compensation | |
| 287,447 | | |
| 347,021 | | |
| 831,823 | | |
| 1,232,050 | |
| Cost associated with Zuma
Capital Management | |
| — | | |
| 469,552 | | |
| — | | |
| 565,534 | |
| Core
FFO | |
$ | (552,399 | ) | |
$ | 249,663 | | |
$ | (1,627,404 | ) | |
$ | (995,236 | ) |
| | |
| | | |
| | | |
| | | |
| | |
| Weighted average number
of common shares outstanding - basic and diluted | |
| 1,215,943 | | |
| 1,247,657 | | |
| 1,216,873 | | |
| 1,239,980 | |
| | |
| | | |
| | | |
| | | |
| | |
| Core FFO / Wgt Avg Share | |
$ | (0.45 | ) | |
$ | 0.20 | | |
$ | (1.34 | ) | |
$ | (0.80 | ) |
| | |
| | | |
| | | |
| | | |
| | |
| Quarterly Dividends / Share | |
$ | — | | |
$ | — | | |
$ | — | | |
$ | — | |
| SEGMENT
DATA |
|
The
following tables compare the Company’s segment activity and NOI and adjusted NOI for Model Home income to its results of operations
and financial position and the Company’s segment activity and to its results of GAAP operations and financial position for the
nine months ended September 30, 2025. The information for Corporate and Other are presented to reconcile back to the consolidated statement
of operations, but is not considered a reportable segment.
| | |
For
the Nine Months Ended September 30, 2025 | |
| | |
| | |
| | |
| | |
| | |
| |
| | |
Retail | | |
Office/Industrial | | |
Model
Homes | | |
Corporate
and Other | | |
Total | |
| | |
| | |
| | |
| | |
| | |
| |
| Rental revenue | |
$ | 393,587 | | |
$ | 7,292,655 | | |
$ | 2,970,745 | | |
$ | — | | |
$ | 10,656,987 | |
| Recovery revenue | |
| 56,439 | | |
| 1,709,622 | | |
| — | | |
| — | | |
| 1,766,061 | |
| Other operating revenue | |
| 400 | | |
| 191,705 | | |
| 5,776 | | |
| 79,137 | | |
| 277,018 | |
| Total revenues | |
| 450,426 | | |
| 9,193,982 | | |
| 2,976,521 | | |
| 79,137 | | |
| 12,700,066 | |
| | |
| | | |
| | | |
| | | |
| | | |
| | |
| Rental operating costs | |
| 110,219 | | |
| 4,795,036 | | |
| 146,840 | | |
| (442,285 | ) | |
| 4,609,810 | |
| Net Operating Income (NOI) | |
| 340,207 | | |
| 4,398,946 | | |
| 2,829,681 | | |
| 521,422 | | |
| 8,090,256 | |
| | |
| | | |
| | | |
| | | |
| | | |
| | |
| Gain on Sale - Model Homes | |
| — | | |
| — | | |
| 583,944 | | |
| — | | |
| 583,944 | |
| Impairment of Model Homes | |
| — | | |
| — | | |
| (200,625 | ) | |
| — | | |
| (200,625 | ) |
| | |
| | | |
| | | |
| | | |
| | | |
| | |
| Adjusted NOI | |
$ | 340,207 | | |
$ | 4,398,946 | | |
$ | 3,213,000 | | |
$ | 521,422 | | |
$ | 8,473,575 | |
| | |
For
the Nine Months Ended September 30, 2025 | |
| | |
| | |
| | |
| | |
| | |
| |
| | |
Retail | | |
Office/Industrial | | |
Model
Homes | | |
Corporate
and Other | | |
Total | |
| Revenues: | |
| | |
| | |
| | |
| | |
| |
| Rental income | |
$ | 450,026 | | |
$ | 9,002,277 | | |
$ | 2,970,745 | | |
$ | — | | |
$ | 12,423,048 | |
| Fees and other income | |
| 400 | | |
| 191,705 | | |
| 5,776 | | |
| 79,137 | | |
| 277,018 | |
| Total revenue | |
| 450,426 | | |
| 9,193,982 | | |
| 2,976,521 | | |
| 79,137 | | |
| 12,700,066 | |
| Costs and expenses: | |
| | | |
| | | |
| | | |
| | | |
| | |
| Rental operating costs | |
| 110,219 | | |
| 4,795,036 | | |
| 146,840 | | |
| (442,285 | ) | |
| 4,609,810 | |
| General and administrative | |
| — | | |
| 17,095 | | |
| 592,160 | | |
| 3,726,442 | | |
| 4,335,697 | |
| Depreciation and amortization | |
| 77,545 | | |
| 2,942,345 | | |
| 667,842 | | |
| 3,703 | | |
| 3,691,435 | |
| Impairment of goodwill and real estate assets | |
| — | | |
| 4,226,620 | | |
| 200,625 | | |
| — | | |
| 4,427,245 | |
| Total costs and expenses | |
| 187,764 | | |
| 11,981,096 | | |
| 1,607,467 | | |
| 3,287,860 | | |
| 17,064,187 | |
| Other income (expense): | |
| | | |
| | | |
| | | |
| | | |
| | |
| Interest expense - mortgage notes | |
| (237,802 | ) | |
| (2,745,509 | ) | |
| (1,500,101 | ) | |
| (4,003 | ) | |
| (4,487,415 | ) |
| Interest and other income, net | |
| — | | |
| — | | |
| 23 | | |
| 15,595 | | |
| 15,618 | |
| Net loss in Conduit Pharmaceuticals marketable
securities (see footnote 9) | |
| — | | |
| — | | |
| — | | |
| (184,672 | ) | |
| (184,672 | ) |
| Gain on sales of real estate, net | |
| 4,494,358 | | |
| — | | |
| 583,944 | | |
| — | | |
| 5,078,302 | |
| Income tax (expense) benefit | |
| — | | |
| — | | |
| (37,610 | ) | |
| 23,980 | | |
| (13,630 | ) |
| Total other income (expense), net | |
| 4,256,556 | | |
| (2,745,509 | ) | |
| (953,744 | ) | |
| (149,100 | ) | |
| 408,203 | |
| Net income (loss) | |
| 4,519,218 | | |
| (5,532,623 | ) | |
| 415,310 | | |
| (3,357,823 | ) | |
| (3,955,918 | ) |
| Less: Income attributable
to noncontrolling interests | |
| — | | |
| (39,392 | ) | |
| (306,711 | ) | |
| — | | |
| (346,103 | ) |
| Net
income (loss) attributable to Presidio Property Trust, Inc. stockholders | |
$ | 4,519,218 | | |
$ | (5,572,015 | ) | |
$ | 108,599 | | |
$ | (3,357,823 | ) | |
$ | (4,302,021 | ) |
| SEGMENT
DATA (continued) |
|
| | |
September
30, | | |
December 31, | |
| Assets by
Reportable Segment: | |
2025 | | |
2024 | |
| Office/Industrial Properties: | |
| | | |
| | |
| Land, buildings
and improvements, net (1) | |
$ | 69,702,282 | | |
$ | 74,425,180 | |
| Total assets (2) | |
$ | 70,743,779 | | |
$ | 76,292,662 | |
| Model Home Properties: | |
| | | |
| | |
| Land, buildings and
improvements, net (1) | |
$ | 39,040,072 | | |
$ | 37,416,000 | |
| Total assets (2) | |
$ | 39,708,805 | | |
$ | 38,166,964 | |
| Retail Properties: | |
| | | |
| | |
| Land, buildings and
improvements, net (1) | |
$ | 4,531,779 | | |
$ | 15,743,789 | |
| Total assets (2) | |
$ | 4,687,011 | | |
$ | 16,673,605 | |
| Reconciliation to Total
Assets: | |
| | | |
| | |
| Total assets for reportable segments | |
$ | 115,139,595 | | |
$ | 131,133,231 | |
| Corporate and other assets: | |
| | | |
| | |
| Cash, cash equivalents and restricted cash | |
| 1,575,384 | | |
| 564,922 | |
| Other assets, net | |
| 11,093,906 | | |
| 10,871,497 | |
| Total
Assets | |
$ | 127,808,885 | | |
$ | 142,569,650 | |
| (1) |
Includes
lease intangibles. |
| (2) |
Includes
land, buildings and improvements, cash, cash equivalents, and restricted cash, current receivables, deferred rent receivables and
deferred leasing costs and other related intangible assets, all shown on a net basis. |
| DEFINITIONS
– NON-GAAP MEASUREMENTS |
|
EBITDAre
- EBITDAre is defined by NAREIT as earnings before interest, taxes, depreciation, and amortization, gain or loss on disposal of depreciated
assets, and impairment write-offs.
Funds
from Operations (“FFO”) – The Company evaluates performance based on Funds From Operations, which
we refer to as FFO, as management believes that FFO represents the most accurate measure of activity and is the basis for distributions
paid to equity holders. The Company defines FFO, a non-GAAP measure, as net income or loss (computed in accordance with GAAP), excluding
gains (or losses) from sales of property, hedge ineffectiveness, acquisition costs of newly acquired properties that are not capitalized
and lease acquisition costs that are not capitalized plus depreciation and amortization, including amortization of acquired above and
below market lease intangibles and impairment charges on properties or investments in non-consolidated REITs, and after adjustments to
exclude equity in income or losses from, and, to include the proportionate share of FFO from, non-consolidated REITs.
However,
because FFO excludes depreciation and amortization as well as the changes in the value of the Company’s properties that result
from use or market conditions, each of which have real economic effects and could materially impact the Company’s results from
operations, the utility of FFO as a measure of the Company’s performance is limited. In addition, other REITs may not calculate
FFO in accordance with the NAREIT definition as the Company does, and, accordingly, the Company’s FFO may not be comparable to
other REITs’ FFO. Accordingly, FFO should be considered only as a supplement to net income as a measure of the Company’s
performance.
Core
Funds from Operations (“Core FFO”) – We calculate Core FFO by using FFO as defined by NAREIT and
adjusting for certain other non-core items. We exclude from our Core FFO calculation acquisition costs, loss on early extinguishment
of debt, changes in the fair value of the earn-out, changes in fair value of contingent consideration, non-cash warrant dividends, other
non-recuring expenses, and the amortization of stock-based compensation.
We
believe Core FFO provides a useful metric in comparing operations between reporting periods and in assessing the sustainability of our
ongoing operating performance. Other equity REITs may calculate Core FFO differently or not at all, and, accordingly, the Company’s
Core FFO may not be comparable to such other REITs’ Core FFO.