Exhibit 99.1

NEWS RELEASE
| Media Contact: | Linda Pazin | |||||||||||||
| Sempra | ||||||||||||||
| (877) 340-8875 | ||||||||||||||
| [email protected] | ||||||||||||||
| Financial Contact: | Lindsay Gartner | |||||||||||||
| Sempra | ||||||||||||||
| (877) 736-7727 | ||||||||||||||
| [email protected] | ||||||||||||||
SEMPRA REPORTS THIRD-QUARTER 2021 EARNINGS RESULTS
•Marking completion of integrated transactions forming Sempra Infrastructure
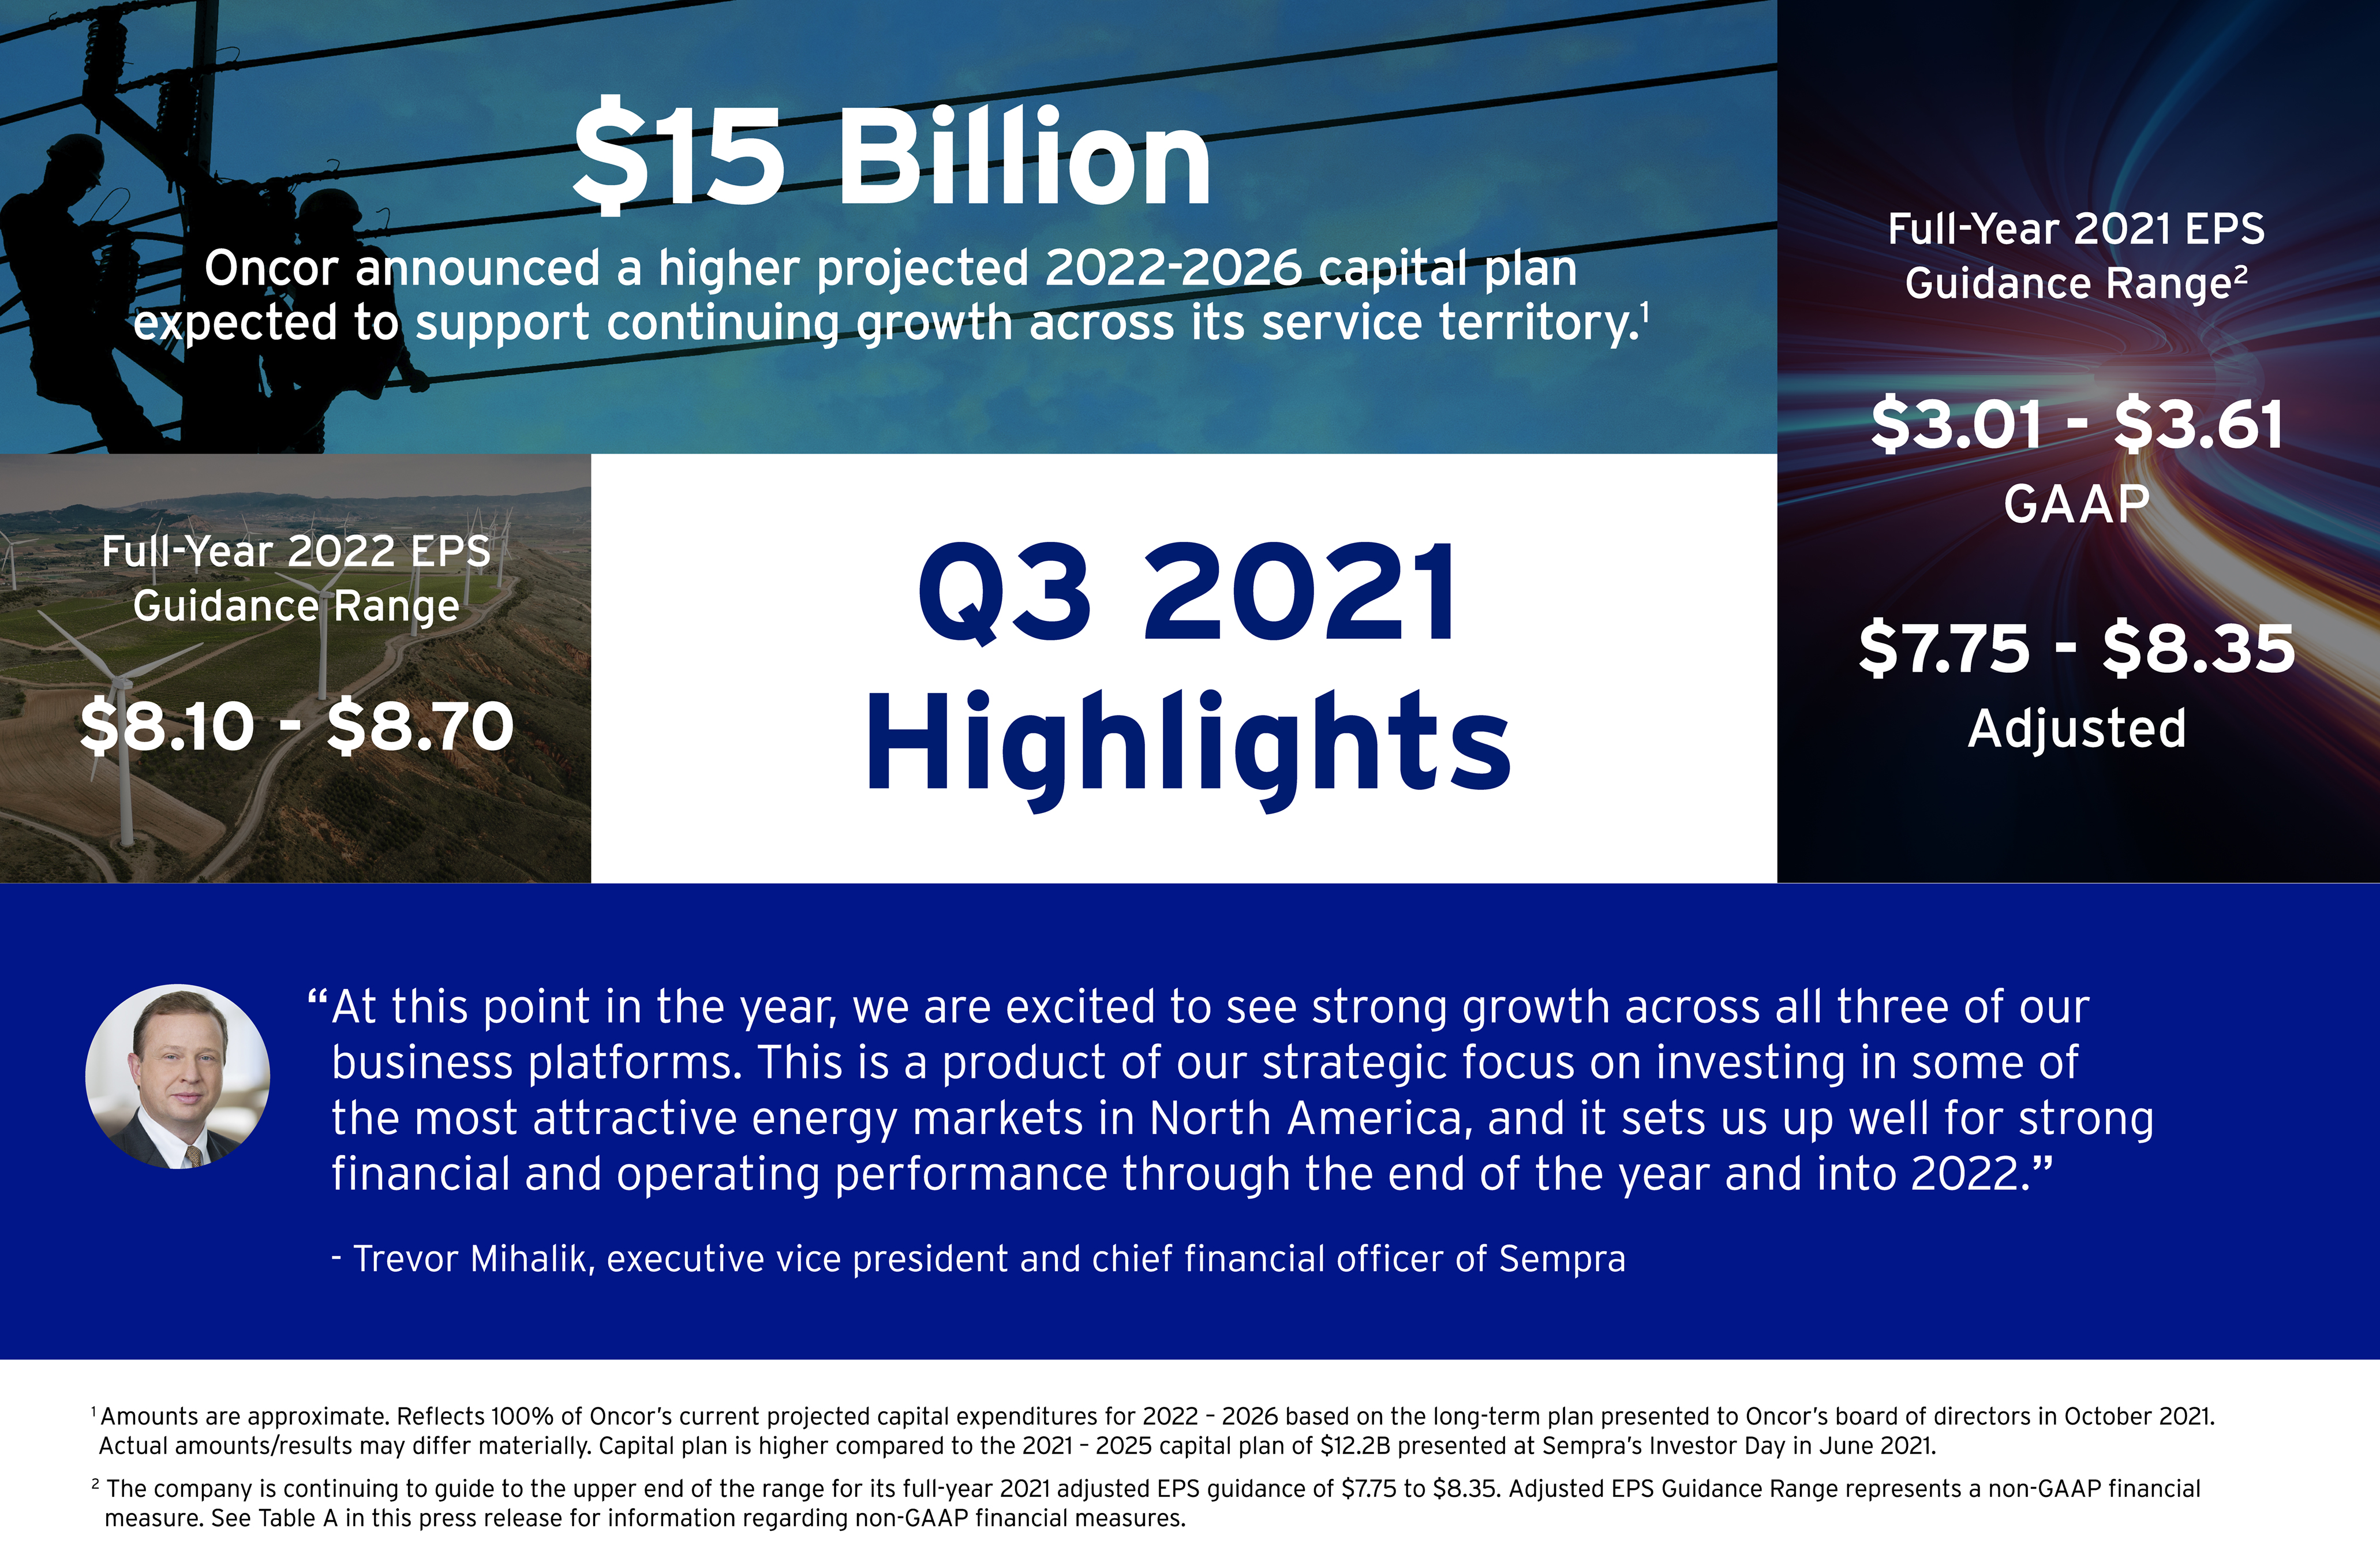
•Announcing higher projected 2022-2026 capital plan at Oncor of $15 billion
SAN DIEGO, Nov. 5, 2021 – Sempra (NYSE: SRE) (BMV: SRE) today announced third-quarter 2021 losses of $648 million, or $2.03 per diluted share, compared to third-quarter 2020 earnings of $351 million, or $1.21 per diluted share. Sempra’s third-quarter 2021 results included a $1.1 billion after-tax charge associated with civil litigation related to the 2015 Aliso Canyon natural gas storage facility leak. On an adjusted basis, the company’s third-quarter 2021 earnings were $545 million, or $1.70 per diluted share, compared to $432 million, or $1.49 per diluted share, in the third quarter of 2020.
“At this point in the year, we are excited to see strong growth across all three of our business platforms,” said Trevor Mihalik, executive vice president and chief financial officer of Sempra. “This is a product of our strategic focus on investing in some of the most attractive energy markets in North America, and it sets us up well for strong financial and operating performance through the end of the year and into 2022.”
Sempra's earnings for the first nine months of 2021 were $650 million, or $2.09 per diluted share, compared with earnings of $3.35 billion, or $11.43 per diluted share, in the first nine months of 2020. Adjusted earnings for the first nine months of 2021 were $1.949 billion, or $6.27 per diluted share, compared to $1.674 billion, or $5.70 per diluted share, in the first nine months of 2020.
The reported financial results reflect certain significant items as described on an after-tax basis in the following table of GAAP (generally accepted accounting principles in the United States of America) earnings, reconciled to adjusted earnings, for the third quarter and first nine months of 2021 and 2020.
| (Dollars, except EPS, and shares in millions) | Three months ended September 30, | Nine months ended September 30, | |||||||||||||||||||||||||||||||||||||||
| 2021 | 2020 | 2021 | 2020 | ||||||||||||||||||||||||||||||||||||||
| (Unaudited) | |||||||||||||||||||||||||||||||||||||||||
| GAAP (Losses) Earnings | $ | (648) | $ | 351 | $ | 650 | $ | 3,350 | |||||||||||||||||||||||||||||||||
| Impacts Associated with Aliso Canyon Litigation and Regulatory Matters | 1,132 | 22 | 1,132 | 94 | |||||||||||||||||||||||||||||||||||||
Impact from Foreign Currency and Inflation and Associated Undesignated Derivatives(1) | (28) | 18 | 41 | (111) | |||||||||||||||||||||||||||||||||||||
Net Unrealized Losses (Gains) on Commodity Derivatives(1) | 89 | 34 | 176 | (12) | |||||||||||||||||||||||||||||||||||||
| Loss (Gain) on Sale of South American Businesses | — | 7 | — | (1,747) | |||||||||||||||||||||||||||||||||||||
| (Earnings) Losses from Investment in RBS Sempra Commodities LLP | — | — | (50) | 100 | |||||||||||||||||||||||||||||||||||||
Adjusted Earnings(2) | $ | 545 | $ | 432 | $ | 1,949 | $ | 1,674 | |||||||||||||||||||||||||||||||||
| Diluted Weighted-Average Common Shares Outstanding | 319 | 291 | 311 | 293 | |||||||||||||||||||||||||||||||||||||
| GAAP EPS | $ | (2.03) | $ | 1.21 | $ | 2.09 | $ | 11.43 | |||||||||||||||||||||||||||||||||
| Diluted Weighted-Average Common Shares Outstanding | 320 | 291 | 311 | 307 | |||||||||||||||||||||||||||||||||||||
Adjusted EPS(2),(3) | $ | 1.70 | $ | 1.49 | $ | 6.27 | $ | 5.70 | |||||||||||||||||||||||||||||||||
1) Q3-2020 and YTD-2020 Adjusted Earnings and Adjusted Earnings per Common Share (EPS) have been updated to exclude this item to conform to current year presentation.
2) Represents a non-GAAP financial measure. See Table A for information regarding non-GAAP financial measures and descriptions of adjustments.
3) To calculate YTD-2020 Adjusted EPS, preferred dividends of $78M are added back to Adjusted Earnings because of the dilutive effect of Series A mandatory convertible preferred stock.
Advancing Key Strategic Priorities at Sempra California
Southern California Gas Co. (SoCalGas) recently announced agreements expected to resolve substantially all material civil litigation against SoCalGas and Sempra related to the 2015 Aliso Canyon natural gas storage facility leak. The net, after-tax cash outflows for SoCalGas are expected to ultimately be up to approximately $895 million, after taking into consideration the remaining insurance receivable and other adjustments.
SoCalGas also recently issued a new economy-wide technical analysis, which underscores the essential role that clean fuels like hydrogen and renewable natural gas (RNG) are expected to play in reaching carbon neutrality. The analysis highlights that a clean fuels network made, in part, by leveraging existing gas infrastructure to deliver clean fuels and to manage carbon could allow California to achieve its net-zero goals more affordably and more effectively than other alternatives.
Continuing Strong Growth at Sempra Texas
In Texas, Oncor Electric Delivery Company LLC (Oncor) has announced its updated, five-year projected capital plan for 2022-2026 of $15 billion, a record high for the company. Additionally, Oncor now projects its rate base to grow to nearly $28 billion by 2026, which reflects a compound annual growth rate of about 8% over the five-year period. Oncor’s robust projected capital plan and rate base figures are expected to support the economic development seen throughout its service territory, forecasted generation additions, strong premise growth, and critical investments in grid resiliency, safety and reliability.
Investing in the Energy Transition at Sempra Infrastructure
Last month, Sempra completed the sale of a non-controlling, 20% interest in Sempra Infrastructure to KKR for a purchase price of $3.37 billion, subject to post-closing adjustments. Proceeds from the sale are expected to be used to, among other things, help fund growth across Sempra’s capital program, which is centered on its U.S. utilities, and further strengthen its balance sheet.
Also, Sempra completed its follow-on cash tender offer to acquire the remaining publicly owned shares of Infraestructura Energética Nova S.A.B. de C.V. (IEnova) that were not obtained in the previously completed exchange offer, and IEnova’s shares have been delisted from the Mexican Stock Exchange (Bolsa Mexicana de Valores, S.A.B. de C.V.).
With the consolidation of Sempra’s liquefied natural gas (LNG) business and its ownership of IEnova under Sempra Infrastructure, the newly formed business platform is expected to generate increased shareholder value over the long-term by investing in the energy systems of the future.
Earnings Guidance
Sempra is updating its full-year 2021 GAAP EPS guidance range, including items expected to be reflected in our fourth quarter results, to $3.01 to $3.61, and the company is continuing to guide to the upper end of the range for its full-year 2021 adjusted EPS guidance of $7.75 to $8.35. Sempra is also reaffirming its full-year 2022 EPS guidance range of $8.10 to $8.70.
Non-GAAP Financial Measures
Non-GAAP financial measures include Sempra’s adjusted earnings, adjusted EPS and adjusted EPS guidance range. See Table A for additional information regarding these non-GAAP financial measures.
Internet Broadcast
Sempra will broadcast a live discussion of its earnings results over the Internet today at 12 p.m. ET with senior management of the company. Access is available by logging onto the website at www.sempra.com. For those unable to log on to the live webcast, the teleconference will be available on replay a few hours after its conclusion by dialing (888) 203-1112 and entering passcode 9127369.
About Sempra
Sempra's mission is to be North America's premier energy infrastructure company. The Sempra family of companies has more than 19,000 talented employees who deliver energy with purpose to over 36 million consumers. With more than $66 billion in total assets at the end of 2020, the San Diego-based company is the owner of one of the largest energy networks in North America serving some of the world's leading economies. The company is helping to advance the global energy transition by enabling the delivery of lower-carbon energy solutions in the markets it serves, including California, Texas, Mexico and the LNG export market. Sempra is consistently recognized as a leader in sustainable business practices and for its long-standing commitment to building a high-performing culture with a focus on safety, workforce development and training, and diversity and inclusion. Sempra is the only North American utility sector company included on the Dow Jones Sustainability World Index and was also named one of the "World's Most Admired Companies" for 2021 by Fortune Magazine. For additional information about Sempra, please visit Sempra's website at www.sempra.com and on Twitter @Sempra.
###
This press release contains statements that constitute forward-looking statements within the meaning of the Private Securities Litigation Reform Act of 1995. Forward-looking statements are based on assumptions with respect to the future, involve risks and uncertainties, and are not guarantees. Future results may differ materially from those expressed in any forward-looking statements. These forward-looking statements represent our estimates and assumptions only as of the date of this press release. We assume no obligation to update or revise any forward-looking statement as a result of new information, future events or other factors.
In this press release, forward-looking statements can be identified by words such as “believes,” “expects,” “anticipates,” “plans,” “estimates,” “projects,” “forecasts,” “should,” “could,” “would,” “will,” “confident,” “may,” “can,” “potential,” “possible,” “proposed,” “in process,” “under construction,” “in development,” “target,” “outlook,” “maintain,” “continue,” “goal,” “aim,” “commit,” or similar expressions, or when we discuss our guidance, priorities, strategy, goals, vision, mission, opportunities, projections, intentions or expectations.
Factors, among others, that could cause actual results and events to differ materially from those described in any forward-looking statements include risks and uncertainties relating to: California wildfires, including the risks that we may be found liable for damages regardless of fault and that we may not be able to recover costs from insurance, the wildfire fund established by California Assembly Bill 1054 or in rates from customers; decisions, investigations, regulations, issuances or revocations of permits and other authorizations, renewals of franchises, and other actions by (i) the California Public Utilities Commission (CPUC), Comisión Reguladora de Energía, U.S. Department of Energy, U.S. Federal Energy Regulatory Commission, Public Utility Commission of Texas, and other regulatory and governmental bodies and (ii) states, counties, cities and other jurisdictions in the U.S., Mexico and other countries in which we do business; the success of business development efforts, construction projects and acquisitions and divestitures, including risks in (i) the ability to make a final investment decision, (ii) completing construction projects or other transactions on schedule and budget, (iii) the ability to realize anticipated benefits from any of these efforts if completed, and (iv) obtaining the consent or approval of partners or other third parties, including governmental entities; the resolution of civil and criminal litigation, regulatory inquiries, investigations and proceedings, and arbitrations, including those related to the natural gas leak at Southern California Gas Company’s (SoCalGas) Aliso Canyon natural gas storage facility; changes to laws, including proposed changes to the Mexican constitution that could materially limit access to the electric generation market and changes to Mexico’s trade rules that could materially limit our ability to import and export hydrocarbons; failure of foreign governments and state-owned entities to honor their contracts and commitments and property disputes; actions by credit rating agencies to downgrade our credit ratings or to place those ratings on negative outlook and our ability to borrow on favorable terms and meet our substantial debt service obligations; the impact of energy and climate goals, policies, legislation and rulemaking, including actions to reduce or eliminate reliance on natural gas generally and any deterioration of or increased uncertainty in the political or regulatory environment for California natural gas distribution companies; the pace of the development and adoption of new technologies in the energy sector, including those designed to support governmental and private party energy and climate goals, and our ability to timely and economically incorporate them into our business; weather, natural disasters, pandemics, accidents, equipment failures, explosions, acts of terrorism, information system outages or other events that disrupt our operations, damage our facilities and systems, cause the release of harmful materials, cause fires or subject us to liability for property damage or personal injuries, fines and penalties, some of which may not be covered by insurance, may be disputed by insurers or may otherwise not be recoverable through regulatory mechanisms or may impact our ability to obtain satisfactory levels of affordable insurance; the availability of electric power and natural gas and natural gas storage capacity, including disruptions caused by failures in the transmission grid or limitations on the withdrawal of natural gas from storage facilities; the impact of the COVID-19 pandemic, including potential vaccination mandates, on capital projects, regulatory approvals and the execution of our operations; cybersecurity threats to the energy grid, storage and pipeline infrastructure, information and systems used to operate our businesses, and confidentiality of our proprietary information and personal information of our customers and employees, including ransomware attacks on our systems and the systems of third-party vendors and other parties with which we conduct business; the impact at San Diego Gas & Electric Company (SDG&E) on competitive customer rates and reliability due to the growth in distributed and local power generation, including from departing retail load resulting from customers transferring to Direct Access and Community Choice Aggregation, and the risk of nonrecovery for stranded assets and contractual obligations; Oncor Electric Delivery Company LLC’s (Oncor) ability to eliminate or reduce its quarterly dividends due to regulatory and governance requirements and commitments, including by actions of Oncor’s independent directors or a minority member director; volatility in foreign currency exchange, inflation and interest rates and commodity prices and our ability to effectively hedge these risks and with respect to interest rates, the impact on SDG&E’s and SoCalGas’ cost of capital; changes in tax and trade policies, laws and regulations, including tariffs and revisions to international trade agreements that may increase our costs, reduce our competitiveness, or impair our ability to resolve trade disputes; and other uncertainties, some of which may be difficult to predict and are beyond our control.
These risks and uncertainties are further discussed in the reports that Sempra has filed with the U.S. Securities and Exchange Commission (SEC). These reports are available through the EDGAR system free-of-charge on the SEC's website, www.sec.gov, and on Sempra’s website, www.sempra.com. Investors should not rely unduly on any forward-looking statements.
Sempra Infrastructure, Sempra LNG, Sempra Mexico, Sempra Texas Utilities, Oncor and Infraestructura Energética Nova, S.A.P.I. de C.V. (IEnova) are not the same companies as the California utilities, SDG&E or SoCalGas, and Sempra Infrastructure, Sempra LNG, Sempra Mexico, Sempra Texas Utilities, Oncor and IEnova are not regulated by the CPUC.
None of the website references in this press release are active hyperlinks, and the information contained on, or that can be accessed through, any such website is not, and shall not be deemed to be, part of this document.
| SEMPRA ENERGY | |||||||||||||||||||||||
| Table A | |||||||||||||||||||||||
| CONDENSED CONSOLIDATED STATEMENTS OF OPERATIONS | |||||||||||||||||||||||
| (Dollars in millions, except per share amounts; shares in thousands) | |||||||||||||||||||||||
| Three months ended September 30, | Nine months ended September 30, | ||||||||||||||||||||||
| 2021 | 2020 | 2021 | 2020 | ||||||||||||||||||||
| (unaudited) | |||||||||||||||||||||||
| REVENUES | |||||||||||||||||||||||
| Utilities | $ | 2,560 | $ | 2,301 | $ | 7,839 | $ | 7,199 | |||||||||||||||
| Energy-related businesses | 453 | 343 | 1,174 | 1,000 | |||||||||||||||||||
| Total revenues | 3,013 | 2,644 | 9,013 | 8,199 | |||||||||||||||||||
| EXPENSES AND OTHER INCOME | |||||||||||||||||||||||
| Utilities: | |||||||||||||||||||||||
| Cost of natural gas | (282) | (114) | (892) | (582) | |||||||||||||||||||
| Cost of electric fuel and purchased power | (312) | (429) | (828) | (918) | |||||||||||||||||||
| Energy-related businesses cost of sales | (220) | (90) | (448) | (200) | |||||||||||||||||||
| Operation and maintenance | (1,073) | (1,018) | (3,098) | (2,767) | |||||||||||||||||||
| Aliso Canyon litigation and regulatory matters | (1,571) | (27) | (1,571) | (127) | |||||||||||||||||||
| Depreciation and amortization | (471) | (418) | (1,376) | (1,242) | |||||||||||||||||||
| Franchise fees and other taxes | (151) | (139) | (442) | (397) | |||||||||||||||||||
| Other (expense) income, net | (55) | 29 | 52 | (163) | |||||||||||||||||||
| Interest income | 16 | 27 | 50 | 76 | |||||||||||||||||||
| Interest expense | (259) | (264) | (776) | (818) | |||||||||||||||||||
(Loss) income from continuing operations before income taxes and equity earnings | (1,365) | 201 | (316) | 1,061 | |||||||||||||||||||
| Income tax benefit (expense) | 342 | (99) | 45 | (60) | |||||||||||||||||||
| Equity earnings | 391 | 326 | 1,022 | 822 | |||||||||||||||||||
| (Loss) income from continuing operations, net of income tax | (632) | 428 | 751 | 1,823 | |||||||||||||||||||
| (Loss) income from discontinued operations, net of income tax | — | (7) | — | 1,850 | |||||||||||||||||||
| Net (loss) income | (632) | 421 | 751 | 3,673 | |||||||||||||||||||
| Earnings attributable to noncontrolling interests | (5) | (22) | (48) | (201) | |||||||||||||||||||
| Preferred dividends | (11) | (48) | (52) | (121) | |||||||||||||||||||
| Preferred dividends of subsidiary | — | — | (1) | (1) | |||||||||||||||||||
| (Losses) earnings attributable to common shares | $ | (648) | $ | 351 | $ | 650 | $ | 3,350 | |||||||||||||||
| Basic (losses) earnings per common share (EPS): | |||||||||||||||||||||||
| (Losses) earnings | $ | (2.03) | $ | 1.21 | $ | 2.10 | $ | 11.48 | |||||||||||||||
| Weighted-average common shares outstanding | 319,144 | 289,490 | 309,350 | 291,771 | |||||||||||||||||||
| Diluted EPS: | |||||||||||||||||||||||
| (Losses) earnings | $ | (2.03) | $ | 1.21 | $ | 2.09 | $ | 11.43 | |||||||||||||||
| Weighted-average common shares outstanding | 319,144 | 290,582 | 310,854 | 292,935 | |||||||||||||||||||
SEMPRA ENERGY
Table A (Continued)
RECONCILIATION OF SEMPRA ADJUSTED EARNINGS TO SEMPRA GAAP (LOSSES) EARNINGS (Unaudited)
Sempra Adjusted Earnings and Adjusted EPS exclude items (after the effects of income taxes and, if applicable, noncontrolling interests) in 2021 and 2020 as follows:
Three months ended September 30, 2021:
▪$(1,132) million from impacts associated with Aliso Canyon natural gas storage facility litigation at Southern California Gas Company (SoCalGas)
▪$28 million impact from foreign currency and inflation and associated undesignated derivatives
▪$(89) million net unrealized losses on commodity derivatives
Three months ended September 30, 2020:
▪$(22) million from impacts associated with Aliso Canyon natural gas storage facility litigation and regulatory matters at SoCalGas
▪$(18) million impact from foreign currency and inflation and associated undesignated derivatives
▪$(34) million net unrealized losses on commodity derivatives
▪$(7) million reduction to the gain on sale of our Chilean businesses as a result of post-closing adjustments
Nine months ended September 30, 2021:
▪$(1,132) million from impacts associated with Aliso Canyon natural gas storage facility litigation at SoCalGas
▪$(41) million impact from foreign currency and inflation and associated undesignated derivatives
▪$(176) million net unrealized losses on commodity derivatives
▪$50 million equity earnings from investment in RBS Sempra Commodities LLP, which represents a reduction to an estimate of our obligations to settle pending value added tax (VAT) matters and related legal costs at our equity method investment at Parent and other
Nine months ended September 30, 2020:
▪$(94) million from impacts associated with Aliso Canyon natural gas storage facility litigation and regulatory matters at SoCalGas
▪$111 million impact from foreign currency and inflation and associated undesignated derivatives
▪$12 million net unrealized gains on commodity derivatives
▪$(100) million equity losses from investment in RBS Sempra Commodities LLP, which represents an estimate of our obligations to settle pending VAT matters and related legal costs at our equity method investment at Parent and other
▪$1,747 million gain on the sale of our South American businesses
Sempra Adjusted Earnings and Adjusted EPS are non-GAAP financial measures (GAAP represents generally accepted accounting principles in the United States of America). These non-GAAP financial measures exclude significant items that are generally not related to our ongoing business activities and/or are infrequent in nature. These non-GAAP financial measures also exclude the impact from foreign currency and inflation effects and associated undesignated derivatives and unrealized gains and losses on commodity derivatives, which we expect to occur in future periods, and which can vary significantly from one period to the next. Exclusion of these items is useful to management and investors because it provides a meaningful comparison of the performance of Sempra’s business operations to prior and future periods. Non-GAAP financial measures are supplementary information that should be considered in addition to, but not as a substitute for, the information prepared in accordance with GAAP. The table below reconciles for historical periods these non-GAAP financial measures to Sempra GAAP (Losses) Earnings and GAAP EPS, which we consider to be the most directly comparable financial measures calculated in accordance with GAAP.
| SEMPRA ENERGY | |||||||||||||||||||||||||||||||||||
| Table A (Continued) | |||||||||||||||||||||||||||||||||||
| RECONCILIATION OF ADJUSTED EARNINGS TO GAAP (LOSSES) EARNINGS | |||||||||||||||||||||||||||||||||||
| (Dollars in millions, except per share amounts; shares in thousands) | |||||||||||||||||||||||||||||||||||
| Pretax amount | Income tax (benefit) expense(1) | Non-controlling interests | Earnings | Pretax amount | Income tax (benefit) expense(1) | Non-controlling interests | Earnings | ||||||||||||||||||||||||||||
| Three months ended September 30, 2021 | Three months ended September 30, 2020 | ||||||||||||||||||||||||||||||||||
Sempra GAAP (Losses) Earnings | $ | (648) | $ | 351 | |||||||||||||||||||||||||||||||
| Excluded items: | |||||||||||||||||||||||||||||||||||
| Impacts associated with Aliso Canyon litigation and regulatory matters | $ | 1,571 | $ | (439) | $ | — | 1,132 | $ | 27 | $ | (5) | $ | — | 22 | |||||||||||||||||||||
Impact from foreign currency and inflation and associated undesignated derivatives | 4 | (33) | 1 | (28) | (11) | 44 | (15) | 18 | |||||||||||||||||||||||||||
| Net unrealized losses on commodity derivatives | 120 | (32) | 1 | 89 | 48 | (13) | (1) | 34 | |||||||||||||||||||||||||||
| Reduction to gain on sale of Chilean businesses | — | — | — | — | 16 | (9) | — | 7 | |||||||||||||||||||||||||||
Sempra Adjusted Earnings(2) | $ | 545 | $ | 432 | |||||||||||||||||||||||||||||||
| Diluted EPS: | |||||||||||||||||||||||||||||||||||
Sempra GAAP (Losses) Earnings | $ | (648) | $ | 351 | |||||||||||||||||||||||||||||||
Weighted-average common shares outstanding, diluted – GAAP | 319,144 | 290,582 | |||||||||||||||||||||||||||||||||
| Sempra GAAP EPS | $ | (2.03) | $ | 1.21 | |||||||||||||||||||||||||||||||
Sempra Adjusted Earnings(2) | $ | 545 | $ | 432 | |||||||||||||||||||||||||||||||
Weighted-average common shares outstanding, diluted – Adjusted(3) | 320,483 | 290,582 | |||||||||||||||||||||||||||||||||
Sempra Adjusted EPS(2) | $ | 1.70 | $ | 1.49 | |||||||||||||||||||||||||||||||
| Nine months ended September 30, 2021 | Nine months ended September 30, 2020 | ||||||||||||||||||||||||||||||||||
| Sempra GAAP Earnings | $ | 650 | $ | 3,350 | |||||||||||||||||||||||||||||||
| Excluded items: | |||||||||||||||||||||||||||||||||||
| Impacts associated with Aliso Canyon litigation and regulatory matters | $ | 1,571 | $ | (439) | $ | — | 1,132 | $ | 127 | $ | (33) | $ | — | 94 | |||||||||||||||||||||
Impact from foreign currency and inflation and associated undesignated derivatives | 36 | 8 | (3) | 41 | 83 | (278) | 84 | (111) | |||||||||||||||||||||||||||
| Net unrealized losses (gains) on commodity derivatives | 245 | (67) | (2) | 176 | (15) | 4 | (1) | (12) | |||||||||||||||||||||||||||
| (Earnings) losses from investment in RBS Sempra Commodities LLP | (50) | — | — | (50) | 100 | — | — | 100 | |||||||||||||||||||||||||||
| Gain on sale of South American businesses | — | — | — | — | (2,899) | 1,152 | — | (1,747) | |||||||||||||||||||||||||||
Sempra Adjusted Earnings(2) | $ | 1,949 | $ | 1,674 | |||||||||||||||||||||||||||||||
| Diluted EPS: | |||||||||||||||||||||||||||||||||||
Sempra GAAP Earnings | $ | 650 | $ | 3,350 | |||||||||||||||||||||||||||||||
Weighted-average common shares outstanding, diluted – GAAP | 310,854 | 292,935 | |||||||||||||||||||||||||||||||||
| Sempra GAAP EPS | $ | 2.09 | $ | 11.43 | |||||||||||||||||||||||||||||||
Sempra Adjusted Earnings(2) | $ | 1,949 | $ | 1,674 | |||||||||||||||||||||||||||||||
Add back dividends for dilutive series A preferred stock | — | 78 | |||||||||||||||||||||||||||||||||
Sempra Adjusted Earnings for Adjusted EPS(2) | $ | 1,949 | $ | 1,752 | |||||||||||||||||||||||||||||||
Weighted-average common shares outstanding, diluted – Adjusted(4) | 310,854 | 307,405 | |||||||||||||||||||||||||||||||||
Sempra Adjusted EPS(2) | $ | 6.27 | $ | 5.70 | |||||||||||||||||||||||||||||||
(1) Income taxes were primarily calculated based on applicable statutory tax rates. We did not record an income tax expense for the equity earnings or an income tax benefit for the equity losses from our investment in RBS Sempra Commodities LLP because, even though a portion of the liabilities may be deductible under United Kingdom tax law, it is not probable that the deduction will reduce United Kingdom taxes.
(2) Adjusted Earnings, Adjusted Earnings for Adjusted EPS, and Adjusted EPS have been updated to reflect impact from foreign currency and inflation and associated undesignated derivatives and net unrealized losses (gains) on commodity derivatives for the three months and nine months ended September 30, 2020.
(3) In the three months ended September 30, 2021, the total weighted-average number of potentially dilutive securities of 699 were not included in the computation of GAAP EPS because to do so would have decreased losses per share, additionally because the conversion of the series B preferred stock is dilutive for Adjusted Earnings, 640 series B preferred stock shares are added back to the denominator used to calculate Adjusted EPS.
(4) In the nine months ended September 30, 2020, because the assumed conversion of the series A preferred stock is dilutive for Adjusted Earnings, 14,470 series A preferred stock shares are added back to the denominator used to calculate Adjusted EPS.
SEMPRA ENERGY
Table A (Continued)
RECONCILIATION OF SEMPRA 2021 ADJUSTED EPS GUIDANCE RANGE TO SEMPRA 2021 GAAP EPS GUIDANCE RANGE (Unaudited)
Sempra 2021 Adjusted EPS Guidance Range of $7.75 to $8.35 excludes items (after the effects of income taxes and, if applicable, noncontrolling interests) as follows:
▪$(1,132) million from impacts associated with Aliso Canyon natural gas storage facility litigation at SoCalGas
▪$(41) million impact from foreign currency and inflation and associated undesignated derivatives for the nine months ended September 30, 2021(1)
▪$(176) million net unrealized losses on commodity derivatives for the nine months ended September 30, 2021
▪$(72) million net income tax expense to derecognize a deferred income tax asset upon completing the sale of a 20% equity interest in Sempra Infrastructure Partners in October 2021
▪$(30) million in charges associated with hedge termination costs and write-off of unamortized debt issuance costs from early redemption of debt at Sempra Mexico in October 2021
▪$(93) million in charges associated with make-whole premiums and write-off of unamortized discount and debt issuance costs from early redemptions of debt at Parent and other in December 2021
▪$50 million equity earnings from investment in RBS Sempra Commodities LLP, which represents a reduction to an estimate of our obligations to settle pending VAT matters and related legal costs at our equity method investment at Parent and other
Sempra 2021 Adjusted EPS Guidance is a non-GAAP financial measure. This non-GAAP financial measure excludes the impact from foreign currency and inflation and associated undesignated derivatives and unrealized gains and losses on commodity derivatives, which we expect to occur in future periods, and which can vary significantly from one period to the next. Exclusion of these items is useful to management and investors because it provides a meaningful comparison of the performance of Sempra's business operations to prior and future periods. Sempra 2021 Adjusted EPS Guidance Range should not be considered an alternative to Sempra 2021 GAAP EPS Guidance Range. Non-GAAP financial measures are supplementary information that should be considered in addition to, but not as a substitute for, the information prepared in accordance with GAAP. The table below reconciles Sempra 2021 Adjusted EPS Guidance Range to Sempra 2021 GAAP EPS Guidance Range, which we consider to be the most directly comparable financial measure calculated in accordance with GAAP.
| RECONCILIATION OF ADJUSTED EPS GUIDANCE RANGE TO GAAP EPS GUIDANCE RANGE | |||||||||||
Full-Year 2021 | |||||||||||
Sempra GAAP EPS Guidance Range(2) | $ | 3.01 | to | $ | 3.61 | ||||||
| Excluded items: | |||||||||||
| Impacts associated with Aliso Canyon litigation | 3.59 | 3.59 | |||||||||
Impact from foreign currency and inflation and associated undesignated derivatives(1) | 0.13 | 0.13 | |||||||||
| Net unrealized losses on commodity derivatives | 0.56 | 0.56 | |||||||||
Net income tax expense to derecognize a deferred income tax asset | 0.23 | 0.23 | |||||||||
Costs associated with early redemption of debt | 0.39 | 0.39 | |||||||||
| Earnings from investment in RBS Sempra Commodities LLP | (0.16) | (0.16) | |||||||||
| Sempra Adjusted EPS Guidance Range | $ | 7.75 | to | $ | 8.35 | ||||||
Weighted-average common shares outstanding, diluted (millions)(3)(4) | 315 | ||||||||||
(1) Amounts include impacts recorded in equity earnings from our unconsolidated equity method investments.
(2) Sempra's prior GAAP EPS Guidance Range for full-year 2021 has been updated to reflect the impacts associated with Aliso Canyon litigation, impact from foreign currency and inflation and associated undesignated derivatives and net unrealized losses on commodity derivatives for the nine months ended September 30, 2021, and net income tax expense to derecognize a deferred income tax asset and costs associated with early redemption of debt in the fourth quarter of 2021.
(3) Weighted-average common shares outstanding reflects the conversion of the series A preferred stock that converted on January 15, 2021 and series B preferred stock that converted on July 15, 2021.
(4) Includes the impact of the Infraestructura Energética Nova, S.A.B. de C.V. (IEnova) exchange offer.
| SEMPRA ENERGY | |||||||||||
| Table B | |||||||||||
| CONDENSED CONSOLIDATED BALANCE SHEETS | |||||||||||
| (Dollars in millions) | |||||||||||
| September 30, 2021 | December 31, 2020(1) | ||||||||||
| (unaudited) | |||||||||||
| ASSETS | |||||||||||
| Current assets: | |||||||||||
| Cash and cash equivalents | $ | 873 | $ | 960 | |||||||
| Restricted cash | 31 | 22 | |||||||||
| Accounts receivable – trade, net | 1,416 | 1,578 | |||||||||
| Accounts receivable – other, net | 470 | 403 | |||||||||
| Due from unconsolidated affiliates | 30 | 20 | |||||||||
| Income taxes receivable | 93 | 113 | |||||||||
| Inventories | 371 | 308 | |||||||||
| Regulatory assets | 290 | 190 | |||||||||
| Greenhouse gas allowances | 546 | 553 | |||||||||
| Other current assets | 473 | 364 | |||||||||
| Total current assets | 4,593 | 4,511 | |||||||||
| Other assets: | |||||||||||
| Restricted cash | 3 | 3 | |||||||||
| Due from unconsolidated affiliates | 684 | 780 | |||||||||
| Regulatory assets | 2,280 | 1,822 | |||||||||
| Nuclear decommissioning trusts | 1,003 | 1,019 | |||||||||
| Investment in Oncor Holdings | 12,475 | 12,440 | |||||||||
| Other investments | 1,483 | 1,388 | |||||||||
| Goodwill | 1,602 | 1,602 | |||||||||
| Other intangible assets | 376 | 202 | |||||||||
| Dedicated assets in support of certain benefit plans | 539 | 512 | |||||||||
| Insurance receivable for Aliso Canyon costs | 414 | 445 | |||||||||
| Deferred income taxes | 151 | 136 | |||||||||
| Greenhouse gas allowances | 356 | 101 | |||||||||
| Right-of-use assets – operating leases | 499 | 543 | |||||||||
| Wildfire fund | 342 | 363 | |||||||||
| Other long-term assets | 914 | 753 | |||||||||
| Total other assets | 23,121 | 22,109 | |||||||||
| Property, plant and equipment, net | 42,758 | 40,003 | |||||||||
| Total assets | $ | 70,472 | $ | 66,623 | |||||||
(1) Derived from audited financial statements.
| SEMPRA ENERGY | |||||||||||
| Table B (Continued) | |||||||||||
| CONDENSED CONSOLIDATED BALANCE SHEETS | |||||||||||
| (Dollars in millions) | |||||||||||
| September 30, 2021 | December 31, 2020(1) | ||||||||||
| (unaudited) | |||||||||||
| LIABILITIES AND EQUITY | |||||||||||
| Current liabilities: | |||||||||||
| Short-term debt | $ | 3,068 | $ | 885 | |||||||
| Accounts payable – trade | 1,400 | 1,359 | |||||||||
| Accounts payable – other | 179 | 154 | |||||||||
| Due to unconsolidated affiliates | 42 | 45 | |||||||||
| Dividends and interest payable | 592 | 551 | |||||||||
| Accrued compensation and benefits | 454 | 446 | |||||||||
| Regulatory liabilities | 515 | 140 | |||||||||
| Current portion of long-term debt and finance leases | 2,994 | 1,540 | |||||||||
| Reserve for Aliso Canyon costs | 1,962 | 150 | |||||||||
| Greenhouse gas obligations | 546 | 553 | |||||||||
| Other current liabilities | 1,192 | 1,016 | |||||||||
| Total current liabilities | 12,944 | 6,839 | |||||||||
| Long-term debt and finance leases | 20,042 | 21,781 | |||||||||
| Deferred credits and other liabilities: | |||||||||||
| Due to unconsolidated affiliates | 286 | 234 | |||||||||
| Pension and other postretirement benefit plan obligations, net of plan assets | 964 | 1,059 | |||||||||
| Deferred income taxes | 2,882 | 2,871 | |||||||||
| Regulatory liabilities | 3,378 | 3,372 | |||||||||
| Reserve for Aliso Canyon costs | 14 | 301 | |||||||||
| Greenhouse gas obligations | 190 | — | |||||||||
| Asset retirement obligations | 3,187 | 3,113 | |||||||||
| Deferred credits and other | 1,981 | 2,119 | |||||||||
| Total deferred credits and other liabilities | 12,882 | 13,069 | |||||||||
| Equity: | |||||||||||
| Sempra Energy shareholders’ equity | 24,554 | 23,373 | |||||||||
| Preferred stock of subsidiary | 20 | 20 | |||||||||
| Other noncontrolling interests | 30 | 1,541 | |||||||||
| Total equity | 24,604 | 24,934 | |||||||||
| Total liabilities and equity | $ | 70,472 | $ | 66,623 | |||||||
(1) Derived from audited financial statements.
| SEMPRA ENERGY | |||||||||||
| Table C | |||||||||||
| CONDENSED CONSOLIDATED STATEMENTS OF CASH FLOWS | |||||||||||
| (Dollars in millions) | |||||||||||
| Nine months ended September 30, | |||||||||||
| 2021 | 2020 | ||||||||||
| (unaudited) | |||||||||||
| CASH FLOWS FROM OPERATING ACTIVITIES | |||||||||||
| Net income | $ | 751 | $ | 3,673 | |||||||
| Less: Income from discontinued operations, net of income tax | — | (1,850) | |||||||||
| Income from continuing operations, net of income tax | 751 | 1,823 | |||||||||
| Adjustments to reconcile net income to net cash provided by operating activities | 661 | 692 | |||||||||
| Reserve for Aliso Canyon costs | 1,525 | 259 | |||||||||
| Net change in other working capital components | (186) | (396) | |||||||||
| Distributions from investments | 727 | 429 | |||||||||
| Insurance receivable for Aliso Canyon costs | 31 | (165) | |||||||||
| Changes in other noncurrent assets and liabilities, net | (528) | 38 | |||||||||
| Net cash provided by continuing operations | 2,981 | 2,680 | |||||||||
| Net cash used in discontinued operations | — | (1,051) | |||||||||
| Net cash provided by operating activities | 2,981 | 1,629 | |||||||||
| CASH FLOWS FROM INVESTING ACTIVITIES | |||||||||||
| Expenditures for property, plant and equipment | (3,606) | (3,313) | |||||||||
| Expenditures for investments and acquisitions | (216) | (229) | |||||||||
| Proceeds from sale of assets | — | 22 | |||||||||
| Distributions from investments | 365 | 761 | |||||||||
| Purchases of nuclear decommissioning trust assets | (729) | (1,091) | |||||||||
| Proceeds from sales of nuclear decommissioning trust assets | 729 | 1,091 | |||||||||
| Advances to unconsolidated affiliates | (8) | (32) | |||||||||
| Repayments of advances to unconsolidated affiliates | — | 7 | |||||||||
| Other | 9 | 13 | |||||||||
| Net cash used in continuing operations | (3,456) | (2,771) | |||||||||
| Net cash provided by discontinued operations | — | 5,186 | |||||||||
| Net cash (used in) provided by investing activities | (3,456) | 2,415 | |||||||||
| CASH FLOWS FROM FINANCING ACTIVITIES | |||||||||||
| Common dividends paid | (981) | (872) | |||||||||
| Preferred dividends paid | (77) | (107) | |||||||||
| Issuances of preferred stock | — | 890 | |||||||||
| Issuances of common stock | 5 | 10 | |||||||||
| Repurchases of common stock | (39) | (565) | |||||||||
| Issuances of debt (maturities greater than 90 days) | 1,992 | 5,934 | |||||||||
| Payments on debt (maturities greater than 90 days) and finance leases | (2,315) | (4,387) | |||||||||
| Increase (decrease) in short-term debt, net | 1,999 | (1,871) | |||||||||
| Advances from unconsolidated affiliates | 40 | 64 | |||||||||
| Proceeds from sales of noncontrolling interests | 7 | — | |||||||||
| Purchases of noncontrolling interests | (221) | (178) | |||||||||
| Other | (13) | (29) | |||||||||
| Net cash provided by (used in) continuing operations | 397 | (1,111) | |||||||||
| Net cash provided by discontinued operations | — | 401 | |||||||||
| Net cash provided by (used in) financing activities | 397 | (710) | |||||||||
| Effect of exchange rate changes in continuing operations | — | (2) | |||||||||
| Effect of exchange rate changes in discontinued operations | — | (3) | |||||||||
| Effect of exchange rate changes on cash, cash equivalents and restricted cash | — | (5) | |||||||||
| (Decrease) increase in cash, cash equivalents and restricted cash, including discontinued operations | (78) | 3,329 | |||||||||
| Cash, cash equivalents and restricted cash, including discontinued operations, January 1 | 985 | 217 | |||||||||
| Cash, cash equivalents and restricted cash, including discontinued operations, September 30 | $ | 907 | $ | 3,546 | |||||||
| SEMPRA ENERGY | |||||||||||||||||||||||
| Table D | |||||||||||||||||||||||
| SEGMENT EARNINGS (LOSSES) AND CAPITAL EXPENDITURES, INVESTMENTS AND ACQUISITIONS | |||||||||||||||||||||||
| (Dollars in millions) | |||||||||||||||||||||||
| Three months ended September 30, | Nine months ended September 30, | ||||||||||||||||||||||
| 2021 | 2020 | 2021 | 2020 | ||||||||||||||||||||
| (unaudited) | |||||||||||||||||||||||
| Earnings (Losses) Attributable to Common Shares | |||||||||||||||||||||||
| SDG&E | $ | 205 | $ | 178 | $ | 603 | $ | 633 | |||||||||||||||
| SoCalGas | (1,126) | (24) | (625) | 425 | |||||||||||||||||||
| Sempra Texas Utilities | 206 | 209 | 479 | 458 | |||||||||||||||||||
| Sempra Mexico | 164 | 50 | 225 | 302 | |||||||||||||||||||
| Sempra LNG | 1 | 71 | 194 | 207 | |||||||||||||||||||
| Parent and other | (98) | (126) | (226) | (515) | |||||||||||||||||||
| Discontinued operations | — | (7) | — | 1,840 | |||||||||||||||||||
| Total | $ | (648) | $ | 351 | $ | 650 | $ | 3,350 | |||||||||||||||
| Three months ended September 30, | Nine months ended September 30, | ||||||||||||||||||||||
| 2021 | 2020 | 2021 | 2020 | ||||||||||||||||||||
| (unaudited) | |||||||||||||||||||||||
| Capital Expenditures, Investments and Acquisitions | |||||||||||||||||||||||
| SDG&E | $ | 488 | $ | 473 | $ | 1,560 | $ | 1,323 | |||||||||||||||
| SoCalGas | 481 | 460 | 1,417 | 1,345 | |||||||||||||||||||
| Sempra Texas Utilities | 51 | 86 | 151 | 225 | |||||||||||||||||||
| Sempra Mexico | 94 | 122 | 325 | 443 | |||||||||||||||||||
| Sempra LNG | 113 | 63 | 362 | 200 | |||||||||||||||||||
| Parent and other | 6 | — | 7 | 6 | |||||||||||||||||||
| Total | $ | 1,233 | $ | 1,204 | $ | 3,822 | $ | 3,542 | |||||||||||||||
| SEMPRA ENERGY | ||||||||||||||||||||||||||
| Table E | ||||||||||||||||||||||||||
| OTHER OPERATING STATISTICS | ||||||||||||||||||||||||||
| Three months ended September 30, | Nine months ended or at September 30, | |||||||||||||||||||||||||
| 2021 | 2020 | 2021 | 2020 | |||||||||||||||||||||||
| (unaudited) | ||||||||||||||||||||||||||
| UTILITIES | ||||||||||||||||||||||||||
| SDG&E and SoCalGas | ||||||||||||||||||||||||||
Gas sales (Bcf)(1) | 56 | 57 | 255 | 257 | ||||||||||||||||||||||
Transportation (Bcf)(1) | 170 | 174 | 452 | 451 | ||||||||||||||||||||||
Total deliveries (Bcf)(1) | 226 | 231 | 707 | 708 | ||||||||||||||||||||||
| Total gas customer meters (thousands) | 6,994 | 6,953 | ||||||||||||||||||||||||
| SDG&E | ||||||||||||||||||||||||||
Electric sales (millions of kWhs)(1) | 2,789 | 4,063 | 8,912 | 10,647 | ||||||||||||||||||||||
| Direct Access and Community Choice Aggregation (millions of kWhs) | 2,025 | 914 | 3,812 | 2,530 | ||||||||||||||||||||||
Total deliveries (millions of kWhs)(1) | 4,814 | 4,977 | 12,724 | 13,177 | ||||||||||||||||||||||
| Total electric customer meters (thousands) | 1,493 | 1,480 | ||||||||||||||||||||||||
Oncor(2) | ||||||||||||||||||||||||||
| Total deliveries (millions of kWhs) | 40,244 | 39,084 | 103,810 | 100,542 | ||||||||||||||||||||||
| Total electric customer meters (thousands) | 3,817 | 3,744 | ||||||||||||||||||||||||
| Ecogas | ||||||||||||||||||||||||||
| Natural gas sales (Bcf) | — | — | 2 | 2 | ||||||||||||||||||||||
| Natural gas customer meters (thousands) | 141 | 137 | ||||||||||||||||||||||||
| ENERGY-RELATED BUSINESSES | ||||||||||||||||||||||||||
| Power generated and sold | ||||||||||||||||||||||||||
| Sempra Mexico | ||||||||||||||||||||||||||
| Termoeléctrica de Mexicali (TdM) (millions of kWhs) | 912 | 893 | 2,583 | 2,176 | ||||||||||||||||||||||
Wind and solar (millions of kWhs)(3) | 612 | 432 | 1,924 | 1,304 | ||||||||||||||||||||||
(1) Include intercompany sales.
(2) Includes 100% of the electric deliveries and customer meters of Oncor Electric Delivery Company LLC (Oncor), in which we hold an indirect 80.25% interest through our investment in Oncor Electric Delivery Holdings Company LLC.
(3) Includes 50% of the total power generated and sold at the Energía Sierra Juárez (ESJ) wind power generation facility through March 19, 2021. As of March 19, 2021, ESJ became a wholly owned, consolidated subsidiary of IEnova.