Exhibit 99.1

FOR IMMEDIATE RELEASE
Stoneridge Reports First-Quarter 2022 Results
FIRST-QUARTER PERFORMANCE DRIVEN PRIMARILY
BY FAVORABLE IMPACT OF
PRICING ACTIONS / MATERIAL COST RECOVERY EFFORTS AND SUPPLY CHAIN INITIATIVES
ANNOUNCING CONTINUED MIRROREYE FLEET TRIAL
EXPANSIONS WITH SCHNEIDER, MAVERICK
AND NUSSBAUM – OEM TAKE RATES REMAIN STRONG
2022 First-Quarter Results
| · | Loss per share (“EPS”) of ($0.28) |
| · | Adjusted sales of $196.6 |
| · | Gross profit of $41.4 million (21.1% of adjusted sales) |
| · | Operating loss of ($3.0) million ((1.5%) of adjusted sales) |
| · | EBITDA of $4.3 million (2.2% of adjusted sales) |
2022 Full-year Guidance Update
| · | Maintaining full-year 2022 revenue guidance of $860 million to $900 million
|
| · | Increasing
2022 adjusted gross margin, operating margin and EBITDA margin guidance by 25 basis points to reflect favorable ongoing impact of cost
recovery efforts and supply chain initiatives |
| · | Expecting
incremental tax expense based on forecasted geographic mix of earnings and forecasted US tax on foreign operations |
| · | Maintaining
adjusted EPS guidance of ($0.15) to $0.10 |
| o | Improved margin performance approximately offset by incremental tax expense |
NOVI, Mich. – May 4, 2022 – Stoneridge, Inc. (NYSE: SRI)
today announced financial results for the first quarter ended March 31, 2022, with sales of $221.1 million and loss per share of ($0.28).
Adjusted sales were $196.6 million and adjusted EPS was ($0.27) for the first quarter. Sales were adjusted to normalize the impact of
$24.4 million of electronic component spot buys recovered from customers within the quarter. The exhibits attached hereto provide reconciliation
detail on this and all other normalizing adjustments.
For the first quarter of 2022, Stoneridge reported gross profit of $41.4
million (21.1% of adjusted sales). Operating loss was ($3.0) million ((1.5%) of adjusted sales). EBITDA was $4.3 million (2.2% of adjusted
sales).
Jon DeGaynor, president and chief executive officer, commented, “In
the first quarter we delivered financial performance that exceeded our previously outlined expectations despite continued macroeconomic
challenges and supply chain disruptions impacting production and driving increased material costs. Our performance was driven by negotiated
price increases that offset approximately 90% of the incremental material costs we incurred during the quarter. In addition to cost recovery
actions, we continued to implement supply chain strategies to secure materials as efficiently as possible and support our customers in
meeting strong demand in each of our end-markets. The actions we took in the quarter reduced the net impact of rising material costs and
secured components to support our global customers, providing a strong foundation for more stable financial performance in 2022.”
DeGaynor continued, “While we continue
to work to efficiently execute and respond to market externalities, we are also focused on the growth initiatives that will drive long-term,
profitable growth in 2022 and beyond. During the quarter, we continued to expand our MirrorEye® platform with the ongoing ramp-up
of our first OEM program in Europe. Take rates remain strong as we have delivered over 2,500 systems to date and we continue to expect
take rates of at least 35% for the full-year. Similarly, our retrofit market continues to expand with some of the largest fleets in North
America. We are announcing continued retrofit expansion with both Maverick and Schneider and a new partnership with Nussbaum to expand
their fleet trials. To date we have installed over 550 systems on Maverick vehicles, representing a large portion of the newer trucks
in their fleet. We expect to have MirrorEye installed on over 1,000 Maverick trucks by the end of the year. Similarly, we continue to
expand with Schneider as they plan to adopt the system across new divisions, operating units and locations this year. Nussbaum
has also kicked-off their evaluations and we expect continued expansion across their fleet. We are excited about the market acceptance
of the MirrorEye retrofit programs and expect to have additional and incremental fleet announcements with both our existing named partners
and new partners in the coming quarters.”
First Quarter in Review
Control Devices sales totaled $85.0 million, a decrease of 12.5% relative
to adjusted sales excluding the divested soot sensor business in the first quarter of 2021, primarily due to lower production volumes
in the Company’s end-markets as a result of supply chain constraints and Covid-related shutdowns impacting production in China in
the first quarter of 2022 partially offset by customer price increases. First quarter adjusted operating margin was 8.0%, a decrease of
320 basis points relative to the first quarter of 2021, excluding the impact of the divested business, primarily due to the increase in
material costs as a result of supply chain constraints.
Relative to the fourth quarter of 2021,
Control Devices sales increased 6.4% relative to adjusted sales excluding the divested soot sensor business, primarily due to improved
stability in customer production and customer price increases during the quarter partially offset by Covid-related shutdowns impacting
production volumes in China. First quarter adjusted operating margin increased 300 basis points relative to the fourth quarter of 2021,
excluding the impact of the divested business, primarily due to pricing actions completed in the first quarter and reduced SG&A costs.
Electronics adjusted sales totaled $108.3 million, an increase of 22.0%
relative to sales in the first quarter of 2021, primarily due to increased end-market demand, customer price increases and the ramp-up
of new program launches partially offset by an unfavorable foreign currency impact of ($4.9) million. First quarter adjusted operating
margin was (2.5%), a decrease of 180 basis points relative to the first quarter of 2021 primarily due to the increase in material costs
as a result of supply chain constraints.
Relative to the fourth quarter of 2021, Electronics sales increased
12.2%, primarily due to increased end-market demand and customer price increases partially offset by an unfavorable foreign currency impact
of ($1.7) million. Adjusted operating margin increased 240 basis points relative to the fourth quarter of 2021, primarily driven by pricing
actions completed in the first quarter and favorable net engineering costs due in part to the timing of engineering recoveries from customers.
Stoneridge Brazil sales were $12.0 million, an increase of 5.6% relative
to sales in the first quarter of 2021, primarily due to favorable foreign currency impact of $0.7 million. First quarter adjusted operating
margin increased by 420 basis points relative to the first quarter of 2021, primarily due to lower SG&A costs.
Relative to the fourth quarter of 2021, Stoneridge Brazil sales decreased
by approximately $1.9 million due to typical sales seasonality in the first quarter offset by a favorable foreign currency impact of $0.9
million. Stoneridge Brazil adjusted operating margin increased by 190 basis points relative to the fourth quarter of 2021 primarily due
to lower material costs as a result of sales mix and lower cost of imported materials as a result of the strengthening of the Brazilian
Reais against the US dollar rate during the quarter.
Cash and Debt Balances
As of March 31, 2022, Stoneridge had cash and cash equivalents balances
totaling $41.4 million. Total debt as of March 31, 2022 was $152.9 million. The Company’s 2022 amendment to the current Credit Facility
waives the leverage ratio covenant for the first three quarters of 2022 and modifies the fourth quarter of 2022 covenant to include a
maximum 4.75x leverage ratio. The Company expects to return to a more normalized net debt to trailing-twelve month adjusted EBITDA ratio
by the end of 2022 with significant improvement in EBITDA expected in the second half of the year.
2022 Outlook
Matt Horvath, chief financial officer, commented, “The pricing
and supply chain actions taken in the first quarter will provide us with a strong foundation to drive significantly improved financial
performance in 2022. We expect continued strong demand, particularly in the second half of the year, as our new programs continue to ramp
up and expand and supply chains continue to stabilize. However, material availability and global logistics dynamics continue to create
the potential for volatility in production schedules for both us and our customers.”
Horvath continued, “We are maintaining our full-year 2022 revenue
and adjusted EPS guidance to reflect current market conditions and customer forecasts. We are raising our midpoint adjusted gross, operating
and EBITDA margin expectations by 25 basis points to account for the ongoing favorable impact of pricing actions taken in the first quarter
to offset incremental material prices. However, we expect offsetting incremental tax expenses based on our forecasted geographic mix of
earnings and forecasted US tax on foreign operations to result in adjusted EPS guidance in-line with our previously outlined expectations
of ($0.15) - $0.10.”
The Company announced updated full-year adjusted gross margin guidance
of 21.75% to 22.75% and adjusted operating margin guidance of 1.0% to 2.0%. Full-year tax expense guidance was updated to $4.5 million
to $6.5 million. Adjusted EBITDA margin guidance was updated to 5.25% to 6.25%.
Conference Call on the Web
A live Internet broadcast of Stoneridge’s
conference call regarding 2022 first-quarter results can be accessed at 9:00 a.m. Eastern Time on Thursday, May 5, 2022, at www.stoneridge.com,
which will also offer a webcast replay.
About Stoneridge, Inc.
Stoneridge, Inc., headquartered in Novi,
Michigan, is a global designer and manufacturer of highly engineered electrical and electronic components, modules and systems for the
automotive, commercial, off-highway, and agricultural vehicle markets. Additional information about Stoneridge can be found at www.stoneridge.com.
Forward-Looking Statements
Statements in this press release contain “forward-looking statements”
under the Private Securities Litigation Reform Act of 1995. These statements appear in a number of places in this report and may include
statements regarding the intent, belief or current expectations of the Company, with respect to, among other things, our (i) future product
and facility expansion, (ii) acquisition strategy, (iii) investments and new product development, (iv) growth opportunities related to
awarded business, and (v) operational expectations. Forward-looking statements may be identified by the words “will,” “may,”
“should,” “designed to,” “believes,” “plans,” “projects,” “intends,”
“expects,” “estimates,” “anticipates,” “continue,” and similar words and expressions.
The forward-looking statements are subject to risks and uncertainties that could cause actual events or results to differ materially from
those expressed in or implied by the statements. Important factors that could cause actual results to differ materially from those in
the forward-looking statements include, among other factors:
| · | the ability of our suppliers to supply us with parts and components at competitive
prices on a timely basis, including the impact of potential tariffs and trade considerations on their operations and output; |
| · | global economic trends, competition and geopolitical risks, including impacts
from the ongoing conflict between Russia and Ukraine and the related sanctions and other measures, or an escalation of sanctions, tariffs
or other trade tensions between the U.S. and China or other countries; |
| · | our ability to achieve cost reductions that offset or exceed customer-mandated
selling price reductions; |
| · | the impact of COVID-19, or other future pandemics, on the global economy,
and on our customers, suppliers, employees, business and cash flows; |
| · | the reduced purchases, loss or bankruptcy of a major customer or supplier; |
| · | the costs and timing of business realignment, facility closures or similar
actions; |
| · | a significant change in automotive, commercial, off-highway or agricultural
vehicle production; |
| · | competitive market conditions and resulting effects on sales and pricing; |
| · | the impact of changes in foreign currency fluctuations |
| · | customer acceptance of new products; |
| · | our ability to successfully launch/produce products for awarded business; |
| · | adverse changes in laws, government regulations or market conditions, including
tariffs, affecting our products or our customers’ products; |
| · | our ability to protect our intellectual property and successfully defend against
assertions made against us; |
| · | liabilities arising from warranty claims, product recall or field actions,
product liability and legal proceedings to which we are or may become a party, or the impact of product recall or field actions on our
customers; |
| · | labor disruptions at our facilities or at any of our significant customers
or suppliers; |
| · | business disruptions due to natural disasters or other disasters outside of
our control; |
| · | fluctuations in the cost and availability of key materials (including semiconductors,
printed circuit boards, resin, aluminum, steel and copper) and components and our ability to offset cost increases; |
| · | the amount of our indebtedness and the restrictive covenants contained in
the agreements governing our indebtedness, including our revolving credit facility; |
| · | capital availability or costs, including changes in interest rates or market
perceptions; |
| · | the failure to achieve the successful integration of any acquired company
or business; |
| · | risks related to a failure of our information technology systems and networks,
and risks associated with current and emerging technology threats and damage from computer viruses, unauthorized access, cyber-attack
and other similar disruptions; and |
| · | the items described in Part I, Item IA (“Risk Factors”) of our
2021 10-K filed with the SEC. |
The forward-looking statements contained herein represent our estimates
only as of the date of this release and should not be relied upon as representing our estimates as of any subsequent date. While
we may elect to update these forward-looking statements at some point in the future, we specifically disclaim any obligation to do so,
whether to reflect actual results, changes in assumptions, changes in other factors affecting such forward-looking statements or otherwise.
Use of Non-GAAP Financial Information
This press release contains information about the Company’s financial results that is not presented in accordance with accounting
principles generally accepted in the United States (“GAAP”). Such non-GAAP financial measures are reconciled to their closest
GAAP financial measures at the end of this press release. The provision of these non-GAAP financial measures for 2022 and 2021 is not
intended to indicate that Stoneridge is explicitly or implicitly providing projections on those non-GAAP financial measures, and actual
results for such measures are likely to vary from those presented. The reconciliations include all information reasonably available to
the Company at the date of this press release and the adjustments that management can reasonably predict.
Management believes the non-GAAP financial measures used in this press
release are useful to both management and investors in their analysis of the Company’s financial position and results of operations.
In particular, management believes that adjusted sales, adjusted gross income and margin, adjusted operating income (loss) and margin,
adjusted net income (loss), adjusted earnings (loss) per share, adjusted EBITDA, adjusted EBITDA margin, net debt, adjusted income before
tax, adjusted income tax expense and adjusted tax rate are useful measures in assessing the Company’s financial performance by excluding
certain items that are not indicative of the Company’s core operating performance or that may obscure trends useful in evaluating
the Company’s continuing operating activities. Management also believes that these measures are useful to both management and investors
in their analysis of the Company’s results of operations and provide improved comparability between fiscal periods.
Adjusted sales, adjusted gross income and margin, adjusted operating
income (loss) and margin, adjusted net income (loss), adjusted earnings (loss) per share and adjusted EBITDA, net debt, adjusted income
before tax and adjusted tax rate should not be considered in isolation or as a substitute for sales, gross profit, operating income (loss),
net income (loss), earnings (loss) per share, debt, income before tax, income tax benefit or tax rate, cash provided by operating activities
or other income statement or cash flow statement data prepared in accordance with GAAP.
For more information, contact Kelly K. Harvey, Director Investor Relations
([email protected])
CONDENSED CONSOLIDATED STATEMENTS OF
OPERATIONS
(Unaudited)
| | |
Three months
ended | |
| | |
March 31, | |
| (in thousands,
except per share data) | |
2022 | | |
2021 | |
| | |
| | |
| |
| Net sales | |
$ | 221,058 | | |
$ | 193,795 | |
| Costs and expenses: | |
| | | |
| | |
| Cost of goods sold | |
| 179,615 | | |
| 147,709 | |
| Selling, general and administrative | |
| 27,399 | | |
| 29,376 | |
| Design and
development | |
| 17,028 | | |
| 14,651 | |
| Operating (loss) income | |
| (2,984 | ) | |
| 2,059 | |
| Interest expense, net | |
| 1,786 | | |
| 1,766 | |
| Equity in loss (earnings) of investee | |
| 81 | | |
| (614 | ) |
| Other expense,
net | |
| 1,331 | | |
| 358 | |
| (Loss) income before income taxes | |
| (6,182 | ) | |
| 549 | |
| Provision
for income taxes | |
| 1,493 | | |
| 419 | |
| Net (loss)
income | |
$ | (7,675 | ) | |
$ | 130 | |
| | |
| | | |
| | |
| (Loss) earnings per share: | |
| | | |
| | |
| Basic | |
$ | (0.28 | ) | |
$ | 0.00 | |
| Diluted | |
$ | (0.28 | ) | |
$ | 0.00 | |
| | |
| | | |
| | |
| Weighted-average shares outstanding: | |
| | | |
| | |
| Basic | |
| 27,199 | | |
| 27,017 | |
| Diluted | |
| 27,199 | | |
| 27,486 | |
CONDENSED CONSOLIDATED BALANCE SHEETS
| | |
March 31, | | |
December 31, | |
| (in thousands) | |
2022 | | |
2021 | |
| | |
| (Unaudited) | | |
| | |
| ASSETS | |
| | | |
| | |
| Current assets: | |
| | | |
| | |
| Cash and cash equivalents | |
$ | 41,388 | | |
$ | 85,547 | |
| Accounts receivable, less reserves of $1,258 and $1,443, respectively | |
| 155,994 | | |
| 150,388 | |
| Inventories, net | |
| 148,352 | | |
| 138,115 | |
| Prepaid expenses and other current assets | |
| 50,569 | | |
| 36,774 | |
| Total current assets | |
| 396,303 | | |
| 410,824 | |
| Long-term assets: | |
| | | |
| | |
| Property, plant and equipment, net | |
| 109,105 | | |
| 107,901 | |
| Intangible assets, net | |
| 49,321 | | |
| 49,863 | |
| Goodwill | |
| 35,412 | | |
| 36,387 | |
| Operating lease right-of-use asset | |
| 17,128 | | |
| 18,343 | |
| Investments and other long-term assets, net | |
| 43,579 | | |
| 42,081 | |
| Total long-term assets | |
| 254,545 | | |
| 254,575 | |
| Total assets | |
$ | 650,848 | | |
$ | 665,399 | |
| | |
| | | |
| | |
| LIABILITIES AND SHAREHOLDERS' EQUITY | |
| | | |
| | |
| Current liabilities: | |
| | | |
| | |
| Current portion of debt | |
$ | 5,183 | | |
$ | 5,248 | |
| Accounts payable | |
| 102,643 | | |
| 97,679 | |
| Accrued expenses and other current liabilities | |
| 71,214 | | |
| 70,139 | |
| Total current liabilities | |
| 179,040 | | |
| 173,066 | |
| Long-term liabilities: | |
| | | |
| | |
| Revolving credit facility | |
| 147,745 | | |
| 163,957 | |
| Deferred income taxes | |
| 10,636 | | |
| 10,706 | |
| Operating lease long-term liability | |
| 13,785 | | |
| 14,912 | |
| Other long-term liabilities | |
| 5,718 | | |
| 6,808 | |
| Total long-term liabilities | |
| 177,884 | | |
| 196,383 | |
| Shareholders' equity: | |
| | | |
| | |
| Preferred Shares, without par value, 5,000 shares authorized, none issued | |
| - | | |
| - | |
| Common Shares, without par value, 60,000 shares authorized, 28,966 and 28,966 shares issued and 27,316 and 27,191 shares outstanding at March 31, 2022 and December 31, 2021, respectively, with no stated value | |
| - | | |
| - | |
| Additional paid-in capital | |
| 228,837 | | |
| 232,490 | |
| Common Shares held in treasury, 1,650 and 1,775 shares at March 31, 2022 and December 31, 2021, respectively, at cost | |
| (51,171 | ) | |
| (55,264 | ) |
| Retained earnings | |
| 208,073 | | |
| 215,748 | |
| Accumulated other comprehensive loss | |
| (91,815 | ) | |
| (97,024 | ) |
| Total shareholders' equity | |
| 293,924 | | |
| 295,950 | |
| Total liabilities and shareholders' equity | |
$ | 650,848 | | |
$ | 665,399 | |
CONDENSED CONSOLIDATED STATEMENTS OF CASH FLOWS
(Unaudited)
| Three months ended March 31, (in thousands) | |
2022 | | |
2021 | |
| | |
| | |
| |
| OPERATING ACTIVITIES: | |
| | | |
| | |
| Net (loss) income | |
$ | (7,675 | ) | |
$ | 130 | |
| Adjustments to reconcile net income to net cash provided by (used for) operating activities: | |
| | | |
| | |
| Depreciation | |
| 6,877 | | |
| 7,068 | |
| Amortization, including accretion and write-off of deferred financing costs | |
| 2,357 | | |
| 1,513 | |
| Deferred income taxes | |
| (605 | ) | |
| (1,609 | ) |
| Loss (earnings) of equity method investee | |
| 81 | | |
| (614 | ) |
| Gain on sale of fixed assets | |
| (94 | ) | |
| (37 | ) |
| Share-based compensation expense | |
| 1,098 | | |
| 1,162 | |
| Excess tax deficiency (benefit) related to share-based compensation expense | |
| 265 | | |
| (319 | ) |
| Gain on disposal of business and joint venture, net | |
| - | | |
| (739 | ) |
| Change in fair value of earn-out contingent consideration | |
| - | | |
| 72 | |
| Changes in operating assets and liabilities: | |
| | | |
| | |
| Accounts receivable, net | |
| (6,129 | ) | |
| (15,953 | ) |
| Inventories, net | |
| (9,812 | ) | |
| (7,282 | ) |
| Prepaid expenses and other assets | |
| (12,842 | ) | |
| (4,744 | ) |
| Accounts payable | |
| 6,581 | | |
| 6,725 | |
| Accrued expenses and other liabilities | |
| 87 | | |
| (2,439 | ) |
| Net cash used for operating activities | |
| (19,811 | ) | |
| (17,066 | ) |
| | |
| | | |
| | |
| INVESTING ACTIVITIES: | |
| | | |
| | |
| Capital expenditures, including intangibles | |
| (7,368 | ) | |
| (7,718 | ) |
| Proceeds from sale of fixed assets | |
| 132 | | |
| 155 | |
| Proceeds from disposal of business, net | |
| - | | |
| 1,050 | |
| Investment in venture capital fund, net | |
| - | | |
| (399 | ) |
| Net cash used for investing activities | |
| (7,236 | ) | |
| (6,912 | ) |
| | |
| | | |
| | |
| FINANCING ACTIVITIES: | |
| | | |
| | |
| Revolving credit facility borrowings | |
| - | | |
| 20,500 | |
| Revolving credit facility payments | |
| (16,000 | ) | |
| (3,000 | ) |
| Proceeds from issuance of debt | |
| 9,834 | | |
| 11,434 | |
| Repayments of debt | |
| (10,311 | ) | |
| (13,763 | ) |
| Repurchase of Common Shares to satisfy employee tax withholding | |
| (669 | ) | |
| (2,347 | ) |
| Net cash (used for) provided by financing activities | |
| (17,146 | ) | |
| 12,824 | |
| | |
| | | |
| | |
| Effect of exchange rate changes on cash and cash equivalents | |
| 34 | | |
| (2,257 | ) |
| Net change in cash and cash equivalents | |
| (44,159 | ) | |
| (13,411 | ) |
| Cash and cash equivalents at beginning of period | |
| 85,547 | | |
| 73,919 | |
| | |
| | | |
| | |
| Cash and cash equivalents at end of period | |
$ | 41,388 | | |
$ | 60,508 | |
| | |
| | | |
| | |
| Supplemental disclosure of cash flow information: | |
| | | |
| | |
| Cash paid for interest, net | |
$ | 1,435 | | |
$ | 1,652 | |
| Cash paid for income taxes, net | |
$ | 1,491 | | |
$ | 3,742 | |
Regulation G Non-GAAP Financial Measure Reconciliations
Reconciliation to US GAAP
Exhibit 1 - Adjusted EPS
Reconciliation of Q1 2022 Adjusted
EPS
| (USD in millions) | |
Q1 2022 | | |
Q1 2022 EPS | |
| Net Income (Loss) | |
$ | (7.7 | ) | |
$ | (0.28 | ) |
| | |
| | | |
| | |
| Add: Post-Tax Write-off of Deferred Financing Fees | |
| 0.3 | | |
| 0.01 | |
| Adjusted Net Income (Loss) | |
$ | (7.4 | ) | |
$ | (0.27 | ) |
Exhibit 2 – Adjusted EBITDA
Reconciliation of Adjusted EBITDA
| (USD in millions) | |
Q1 2021 | | |
Q2 2021 | | |
Q3 2021 | | |
Q4 2021 | | |
Q1 2022 | |
| Income (Loss) Before Tax | |
$ | 0.5 | | |
$ | 25.6 | | |
$ | (9.8 | ) | |
$ | (3.9 | ) | |
$ | (6.2 | ) |
| Interest expense, net | |
| 1.8 | | |
| 1.9 | | |
| 1.4 | | |
| 0.1 | | |
| 1.8 | |
| Depreciation and amortization | |
| 8.4 | | |
| 8.5 | | |
| 8.2 | | |
| 8.7 | | |
| 8.7 | |
| EBITDA | |
$ | 10.8 | | |
$ | 36.0 | | |
$ | (0.2 | ) | |
$ | 5.0 | | |
$ | 4.3 | |
| Add: Pre-Tax Change in Fair Value of Earn-Out (Stoneridge Brazil) | |
| 0.1 | | |
| 1.1 | | |
| 0.2 | | |
| 0.6 | | |
| - | |
| Less: Pre-Tax TSA and Monetary Correction (Stoneridge Brazil) | |
| - | | |
| - | | |
| - | | |
| (1.1 | ) | |
| - | |
| Less: Pre-Tax Gain from Disposal of MSIL Joint Venture | |
| - | | |
| - | | |
| - | | |
| (1.8 | ) | |
| - | |
| Add: Pre-Tax Restructuring Costs | |
| 1.4 | | |
| 0.3 | | |
| 0.7 | | |
| 0.1 | | |
| - | |
| Less: Pre-Tax Gain on Sale of Canton Facility | |
| - | | |
| (30.7 | ) | |
| - | | |
| - | | |
| - | |
| Add: Pre-Tax Business Realignment Costs | |
| 0.2 | | |
| 0.1 | | |
| 1.1 | | |
| 0.0 | | |
| - | |
| Add: Pre-Tax Brazilian Indirect Tax Impairment | |
| - | | |
| 0.6 | | |
| - | | |
| - | | |
| - | |
| Less: Pre-Tax Gain from Disposal of Soot Sensor Business | |
| (0.7 | ) | |
| - | | |
| - | | |
| (0.4 | ) | |
| - | |
| Less: Pre-Tax Sale of Soot Sensor Product Inventory | |
| (0.1 | ) | |
| - | | |
| - | | |
| 0.1 | | |
| - | |
| Add: Pre-Tax Environmental Remediation Costs | |
| 0.4 | | |
| - | | |
| - | | |
| - | | |
| - | |
| Adjusted EBITDA | |
$ | 12.1 | | |
$ | 7.4 | | |
$ | 1.8 | | |
$ | 2.4 | | |
$ | 4.3 | |
Exhibit 3 – Adjusted Gross Profit
Reconciliation of Adjusted Gross Profit
| (USD in millions) | |
Q4 2021 | | |
Q1 2022 | |
| Gross Profit | |
$ | 41.9 | | |
$ | 41.4 | |
| | |
| | | |
| | |
| Add: Pre-Tax Restructuring Costs | |
| 0.1 | | |
| - | |
| Adjusted Gross Profit | |
$ | 42.0 | | |
$ | 41.4 | |
Exhibit 4 - Adjusted Operating Income
Reconciliation of Adjusted Operating
Income (Loss)
| (USD in millions) | |
Q4 2021 | | |
Q1 2022 | |
| Operating Income (Loss) | |
$ | (4.4 | ) | |
$ | (3.0 | ) |
| | |
| | | |
| | |
| Add: Pre-Tax Change in Fair Value of Earn-Out (Stoneridge Brazil) | |
| 0.6 | | |
| - | |
| Less: Pre-Tax TSA and Monetary Correction (Stoneridge Brazil) | |
| (1.1 | ) | |
| - | |
| Less: Pre-Tax Gain from Disposal of MSIL Joint Venture | |
| (1.8 | ) | |
| - | |
| Add: Pre-Tax Restructuring Costs | |
| 0.1 | | |
| - | |
| Add: Pre-Tax Business Realignment Costs | |
| 0.0 | | |
| | |
| Less: Pre-Tax Gain from Disposal of Soot Sensor Business | |
| (0.4 | ) | |
| - | |
| Add: Pre-Tax Sale of Soot Sensor Product Inventory | |
| 0.1 | | |
| - | |
| Adjusted Operating Income (Loss) | |
$ | (7.0 | ) | |
$ | (3.0 | ) |
Exhibit 5 – Segment Adjusted Operating Income
Reconciliation of Control Devices Adjusted
Operating Income
| (USD in millions) | |
Q1 2021 | | |
Q4 2021 | | |
Q1 2022 | |
| Control Devices Operating Income | |
$ | 10.2 | | |
$ | 4.8 | | |
$ | 6.8 | |
| | |
| | | |
| | | |
| | |
| Add: Pre-Tax Restructuring Costs | |
| 1.4 | | |
| 0.1 | | |
| - | |
| Less: Pre-Tax Gain from Disposal of Soot Sensor Business | |
| (0.7 | ) | |
| (0.4 | ) | |
| - | |
| Add: Pre-Tax Business Realignment Costs | |
| 0.2 | | |
| - | | |
| - | |
| Less: Pre-Tax Sale of Soot Sensor Product Inventory | |
| (0.1 | ) | |
| 0.1 | | |
| - | |
| Add: Pre-Tax Environmental Remediation Costs | |
| 0.4 | | |
| - | | |
| - | |
| Control Devices Adjusted Operating Income | |
$ | 11.3 | | |
$ | 4.5 | | |
$ | 6.8 | |
Reconciliation of Electronics Adjusted
Operating Income (Loss)
| (USD in millions) | |
Q1 2021 | | |
Q4 2021 | | |
Q1 2022 | |
| Electronics Operating Income (Loss) | |
$ | (0.9 | ) | |
$ | (4.7 | ) | |
$ | (2.7 | ) |
| | |
| | | |
| | | |
| | |
| Add: Pre-Tax Restructuring Costs | |
| 0.2 | | |
| - | | |
| - | |
| Electronics Adjusted Operating Income (Loss) | |
$ | (0.7 | ) | |
$ | (4.7 | ) | |
$ | (2.7 | ) |
Reconciliation of Stoneridge Brazil
Adjusted Operating Income
| (USD in millions) | |
Q1 2021 | | |
Q4 2021 | | |
Q1 2022 | |
| Stoneridge Brazil Operating Income | |
$ | (0.0 | ) | |
$ | 0.9 | | |
$ | 0.5 | |
| | |
| | | |
| | | |
| | |
| Add: Pre-Tax Change in Fair Value of Earn-Out (Stoneridge Brazil) | |
| 0.1 | | |
| 0.6 | | |
| - | |
| Less: Pre-Tax TSA and Monetary Correction (Stoneridge Brazil) | |
| - | | |
| (1.1 | ) | |
| - | |
| Stoneridge Brazil Adjusted Operating Income | |
$ | 0.0 | | |
$ | 0.3 | | |
$ | 0.5 | |
Exhibit 6 – Adjusted Sales
Reconciliation of Adjusted Sales
| (USD in millions) | |
Q4 2021 | | |
Q1 2022 | |
| Sales | |
$ | 203.7 | | |
$ | 221.1 | |
| | |
| | | |
| | |
| Less: Pre-Tax Sale of Soot Sensor Product Inventory | |
| (1.3 | ) | |
| - | |
| Less: Pre-Tax Sales from Material Spot Buy Purchase Recovery | |
| (17.6 | ) | |
| (24.4 | ) |
| Adjusted Sales | |
$ | 184.7 | | |
$ | 196.6 | |
Exhibit 7 – Control Devices Adjusted Sales
Reconciliation of Control Devices Adjusted
Sales
| (USD in millions) | |
Q1 2021 | | |
Q4 2021 | | |
Q1 2022 | |
| Control Devices Sales | |
$ | 101.6 | | |
$ | 82.9 | | |
$ | 85.0 | |
| | |
| | | |
| | | |
| | |
| Less: Pre-Tax Sale of Soot Sensor Product Inventory | |
| (1.0 | ) | |
| (1.3 | ) | |
| - | |
| Control Devices Adjusted Sales | |
$ | 100.6 | | |
$ | 81.6 | | |
$ | 85.0 | |
Reconciliation of Control Devices Adjusted Sales
Excluding Disposed Soot Sensor Business
| (USD in millions) | |
Q1 2021 | | |
Q4 2021 | | |
Q1 2022 | |
| Control Devices Adjusted Sales | |
$ | 100.6 | | |
$ | 81.6 | | |
$ | 85.0 | |
| | |
| | | |
| | | |
| | |
| Less: Pre-Tax Sales from Disposed Soot Sensor Business | |
| (3.0 | ) | |
| (1.8 | ) | |
| - | |
| Control Devices Adjusted Sales Excluding Disposed Soot Sensor Business | |
$ | 97.6 | | |
$ | 79.9 | | |
$ | 85.0 | |
Exhibit 8 – Control Devices Adjusted Operating Income Excluding
Disposed Soot Sensor Business
Reconciliation of Control Devices Adjusted Operating
Income Excluding Disposed Soot Sensor Business
| (USD in millions) | |
Q1 2021 | | |
Q4 2021 | | |
Q1 2022 | |
| Control Devices Adjusted Operating Income | |
$ | 11.3 | | |
$ | 4.5 | | |
$ | 6.8 | |
| | |
| | | |
| | | |
| | |
| Less: Pre-Tax Operating Income from Disposed Soot Sensor Business | |
| (0.4 | ) | |
| (0.5 | ) | |
| - | |
| Control Devices Adjusted Operating Income Excluding Disposed Soot Sensor Business | |
$ | 10.9 | | |
$ | 4.0 | | |
$ | 6.8 | |
Exhibit 9 – Electronics Adjusted Sales
Reconciliation of Electronics Adjusted
Sales
| (USD in millions) | |
Q1 2021 | | |
Q4 2021 | | |
Q1 2022 | |
| Electronics Sales | |
$ | 88.7 | | |
$ | 114.1 | | |
$ | 132.7 | |
| | |
| | | |
| | | |
| | |
| Less: Pre-Tax Sales from Spot Purchase Recovery | |
| - | | |
| (17.6 | ) | |
| (24.4 | ) |
| Electronics Adjusted Sales | |
$ | 88.7 | | |
$ | 96.5 | | |
$ | 108.3 | |
Exhibit 10 – Adjusted Tax Rate
Reconciliation of Adjusted Tax Rate
| (USD in millions) | |
Q1 2022 | |
| Income (Loss) Before Tax | |
$ | (6.2 | ) |
| | |
| | |
| Add: Pre-Tax Write-off of Deferred Financing Fees | |
| 0.4 | |
| Adjusted Income (Loss) Before Tax | |
$ | (5.8 | ) |
| | |
| | |
| Income Tax Expense (Benefit) | |
$ | 1.5 | |
| | |
| | |
| Add: Tax Impact from Pre-Tax Adjustments | |
$ | 0.1 | |
| | |
| | |
| Adjusted Income Tax Expense (Benefit) | |
$ | 1.6 | |
| | |
| | |
| Adjusted Tax Rate | |
| -27.6 | % |
Exhibit 99.2
Q1 2022 Results May 5, 2022
2 Forward - Looking Statements Statements in this presentation that are not historical facts are forward - looking statements, which involve risks and uncertaint ies that could cause actual events or results to differ materially from those expressed or implied by the statements. Important factors that may c aus e actual results to differ materially from those in the forward - looking statements include, among other factors, the ability of suppliers to supply Stoneridge with parts and components at competitive prices on a timely basis; our ability to achieve cost reductions that offset or exceed customer - ma ndated selling price reductions; global economic trends, competition and geopolitical risks, including impacts from the ongoing conflict bet wee n Russia and Ukraine and the related sanctions and other measures, or an escalation of sanctions, tariffs or other trade tensions between the U.S. and China or other countries; the impact of COVID - 19, or other future pandemics, on the global economy, and on our customers, suppliers, empl oyees, business and cash flows; the reduced purchases, loss or bankruptcy of a major customer or supplier; the costs and timing of facility c los ures, business realignment or similar actions; a significant change in automotive, commercial, off - highway and agricultural vehicle production; competitive market conditions and resulting effects on sales and pricing; our ability to successfully launch/produce products for awarded busine ss; adverse changes in laws, government regulations or market conditions, including tariffs, affecting our products or customers products; labor dis rup tions at Stoneridge’s facilities or at any of Stoneridge’s significant customers or suppliers; fluctuations in the cost and availability of key mat eri als (including semiconductors, printed circuit boards, resin, aluminum, steel and copper) and components and our ability to offset cost incr eas es; the amount of Stoneridge’s indebtedness and the restrictive covenants contained in the agreements governing its indebtedness, including its re volving credit facility; customer acceptance of new products; capital availability or costs, including changes in interest rates or market p erc eptions; the occurrence or non - occurrence of circumstances beyond Stoneridge’s control; and the items described in “Risk Factors” and other uncertaintie s or risks discussed in Stoneridge’s periodic and current reports filed with the Securities and Exchange Commission. Important factors that could cause the performance of the commercial vehicle and automotive industry to differ materially fro m t hose in the forward - looking statements include factors such as (1) continued economic instability or poor economic conditions in the United State s a nd global markets, (2) changes in economic conditions, housing prices, foreign currency exchange rates, commodity prices, including shortages of an d increases or volatility in the price of oil, (3) changes in laws and regulations, (4) the state of the credit markets, (5) political stabi lit y, (6) international conflicts and (7) the occurrence of force majeure events. These factors should not be construed as exhaustive and should be considered with the other cautionary statements in Stonerid ge’ s filings with the Securities and Exchange Commission. Forward - looking statements are not guarantees of future performance; Stoneridge’s actual results of operations, financial condit ion and liquidity, and the development of the industry in which Stoneridge operates may differ materially from those described in or suggested b y t he forward - looking statements contained in this presentation. In addition, even if Stoneridge’s results of operations, financial condition and l iqu idity, and the development of the industry in which Stoneridge operates are consistent with the forward - looking statements contained in this pr esentation, those results or developments may not be indicative of results or developments in subsequent periods. This presentation contains time - sensitive information that reflects management’s best analysis only as of the date of this prese ntation. Any forward - looking statements in this presentation speak only as of the date of this presentation, and Stoneridge undertakes no obl igation to update such statements. Comparisons of results for current and any prior periods are not intended to express any future trends or i ndi cations of future performance, unless expressed as such, and should only be viewed as historical data. Stoneridge does not undertake any obligation to publicly update or revise any forward - looking statement as a result of new infor mation, future events or otherwise, except as otherwise required by law. Rounding Disclosure: There may be slight immaterial differences between figures represented in our public filings compared t o w hat is shown in this presentation. The differences are the result of rounding due to the representation of values in millions rather than th ous ands in public filings.
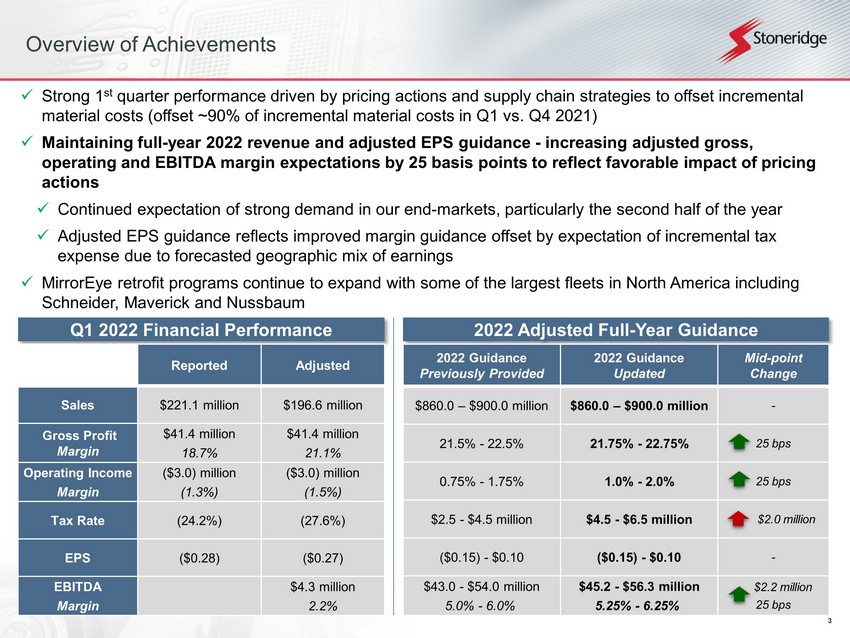
3 Overview of Achievements x Strong 1 st quarter performance driven by pricing actions and supply chain strategies to offset incremental material costs (offset ~90% of incremental material costs in Q1 vs. Q4 2021) x Maintaining full - year 2022 revenue and adjusted EPS guidance - increasing adjusted gross, operating and EBITDA margin expectations by 25 basis points to reflect favorable impact of pricing actions x Continued expectation of strong demand in our end - markets, particularly the second half of the year x Adjusted EPS guidance reflects improved margin guidance offset by expectation of incremental tax expense due to forecasted geographic mix of earnings x MirrorEye retrofit programs continue to expand with some of the largest fleets in North America including Schneider, Maverick and Nussbaum Q 1 2022 Financial Performance 2022 Adjusted Full - Year Guidance 2022 Guidance Previously Provided 2022 Guidance Updated Mid - point Change $860.0 – $900.0 million $860.0 – $900.0 million - 21.5% - 22.5% 21.75% - 22.75% 25 bps 0.75% - 1.75% 1.0% - 2.0% 25 bps $2.5 - $4.5 million $4.5 - $6.5 million $2.0 million ($0.15) - $0.10 ($0.15) - $0.10 - $43.0 - $54.0 million 5.0% - 6.0% $45.2 - $56.3 million 5.25% - 6.25% $2.2 million 25 bps Reported Adjusted Sales $221.1 million $196.6 million Gross Profit Margin $41.4 million 18.7% $41.4 million 21.1% Operating Income Margin ($3.0) million (1.3%) ($3.0) million (1.5%) Tax Rate (24.2%) (27.6%) EPS ($0.28) ($0.27) EBITDA Margin $4.3 million 2.2%
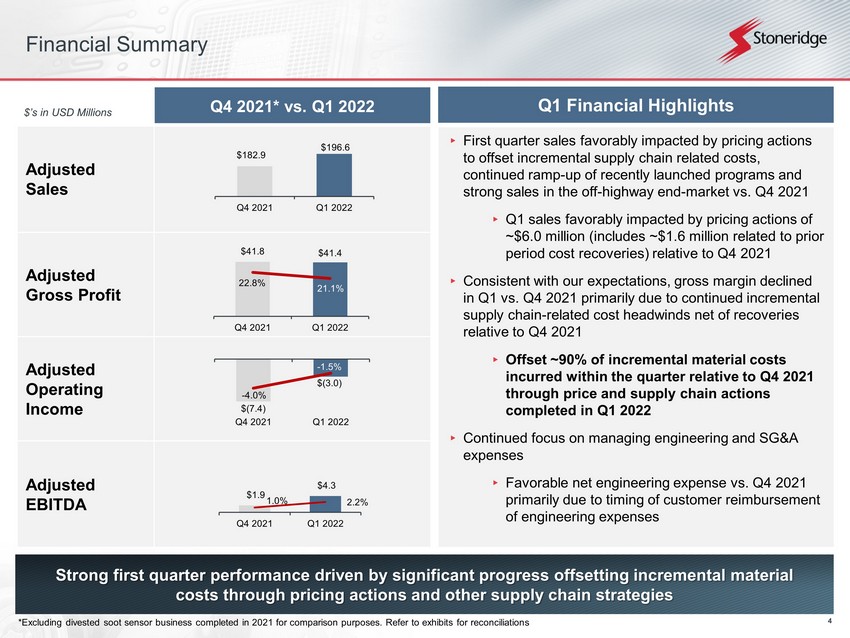
4 ▸ First quarter sales favorably impacted by pricing actions to offset incremental supply chain related costs, continued ramp - up of recently launched programs and strong sales in the off - highway end - market vs. Q4 2021 ▸ Q1 sales favorably impacted by pricing actions of ~$6.0 million (includes ~$1.6 million related to prior period cost recoveries) relative to Q4 2021 ▸ Consistent with our expectations, gross margin declined in Q1 vs. Q4 2021 primarily due to continued incremental supply chain - related cost headwinds net of recoveries relative to Q4 2021 ▸ Offset ~90% of incremental material costs incurred within the quarter relative to Q4 2021 through price and supply chain actions completed in Q1 2022 ▸ Continued focus on managing engineering and SG&A expenses ▸ Favorable net engineering expense vs. Q4 2021 primarily due to timing of customer reimbursement of engineering expenses Financial Summary Strong first quarter performance driven by significant progress offsetting incremental material costs through pricing actions and other supply chain strategies Q4 2021* vs. Q1 2022 Adjusted Sales Adjusted Gross Profit Adjusted Operating Income Adjusted EBITDA $’s in USD Millions *Excluding divested soot sensor business completed in 2021 for comparison purposes. Refer to exhibits for reconciliations Q 1 Financial Highlights $41.8 $41.4 22.8% 21.1% 10% 20% 30% 10 30 50 Q4 2021 Q1 2022 $(7.4) $(3.0) - 4.0% - 1.5% -8% -3% -9 -4 Q4 2021 Q1 2022 $1.9 $4.3 1.0% 2.2% 0% 5% 10% 0 5 10 15 Q4 2021 Q1 2022 $182.9 $196.6 Q4 2021 Q1 2022
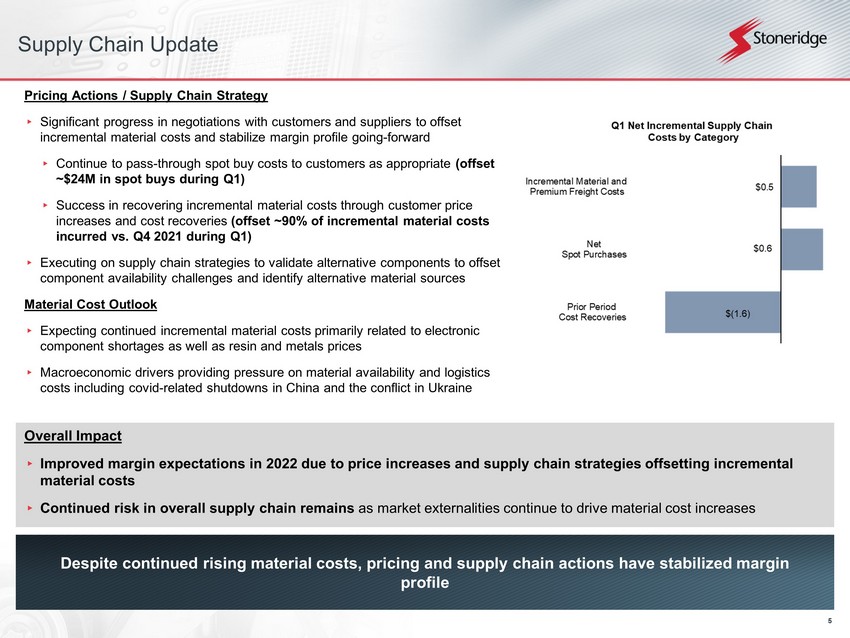
5 Supply Chain Update Pricing Actions / Supply Chain Strategy ▸ Significant progress in negotiations with customers and suppliers to offset incremental material costs and stabilize margin profile going - forward ▸ Continue to pass - through spot buy costs to customers as appropriate (offset ~$24M in spot buys during Q1) ▸ Success in recovering incremental material costs through customer price increases and cost recoveries (offset ~90% of incremental material costs incurred vs. Q4 2021 during Q1) ▸ Executing on supply chain strategies to validate alternative components to offset component availability challenges and identify alternative material sources Material Cost Outlook ▸ Expecting continued incremental material costs primarily related to electronic component shortages as well as resin and metals prices ▸ Macroeconomic drivers providing pressure on material availability and logistics costs including covid - related shutdowns in China and the conflict in Ukraine Despite continued rising material costs, pricing and supply chain actions have stabilized margin profile Overall Impact ▸ Improved margin expectations in 2022 due to price increases and supply chain strategies offsetting incremental material costs ▸ Continued risk in overall supply chain remains as market externalities continue to drive material cost increases
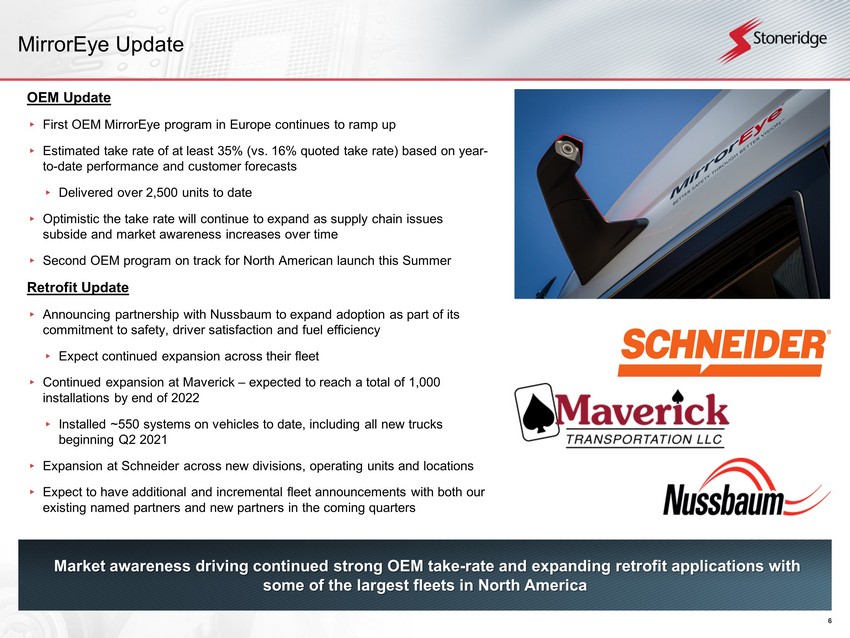
6 MirrorEye Update Market awareness driving continued strong OEM take - rate and expanding retrofit applications with some of the largest fleets in North America OEM Update ▸ First OEM MirrorEye program in Europe continues to ramp up ▸ Estimated take rate of at least 35% (vs. 16% quoted take rate) based on year - to - date performance and customer forecasts ▸ Delivered over 2,500 units to date ▸ Optimistic the take rate will continue to expand as supply chain issues subside and market awareness increases over time ▸ Second OEM program on track for North American launch this Summer Retrofit Update ▸ Announcing partnership with Nussbaum to expand adoption as part of its commitment to safety, driver satisfaction and fuel efficiency ▸ Expect continued expansion across their fleet ▸ Continued expansion at Maverick – expected to reach a total of 1,000 installations by end of 2022 ▸ Installed ~550 systems on vehicles to date, including all new trucks beginning Q2 2021 ▸ Expansion at Schneider across new divisions, operating units and locations ▸ E xpect to have additional and incremental fleet announcements with both our existing named partners and new partners in the coming quarters
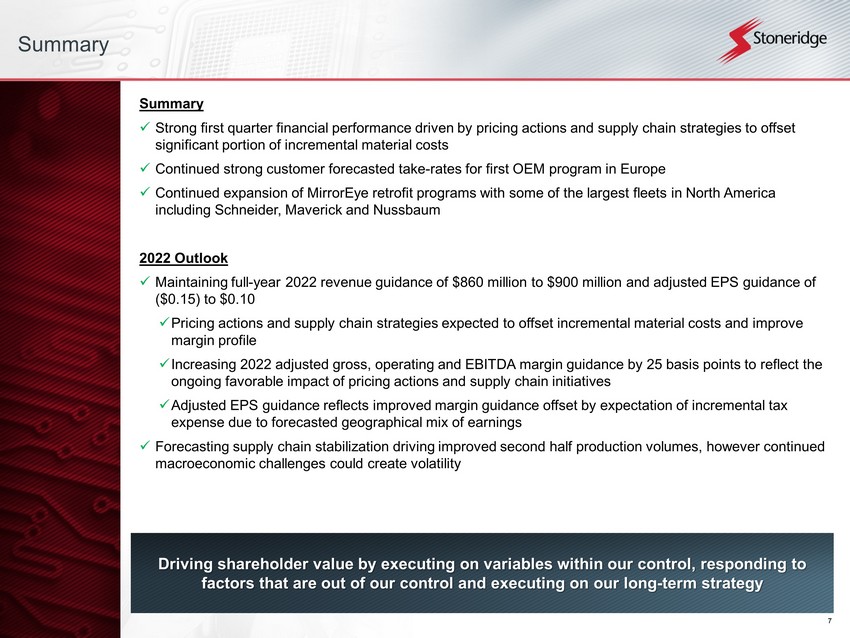
7 Summary Summary x Strong first quarter financial performance driven by pricing actions and supply chain strategies to offset significant portion of incremental material costs x Continued strong customer forecasted take - rates for first OEM program in Europe x Continued expansion of MirrorEye retrofit programs with some of the largest fleets in North America including Schneider, Maverick and Nussbaum 2022 Outlook x Maintaining full - year 2022 revenue guidance of $860 million to $900 million and adjusted EPS guidance of ($0.15) to $0.10 x Pricing actions and supply chain strategies expected to offset incremental material costs and improve margin profile x Increasing 2022 adjusted gross, operating and EBITDA margin guidance by 25 basis points to reflect the ongoing favorable impact of pricing actions and supply chain initiatives x Adjusted EPS guidance reflects improved margin guidance offset by expectation of incremental tax expense due to forecasted geographical mix of earnings x Forecasting supply chain stabilization driving improved second half production volumes, however continued macroeconomic challenges could create volatility Driving shareholder value by executing on variables within our control, responding to factors that are out of our control and executing on our long - term strategy

8 Financial Update
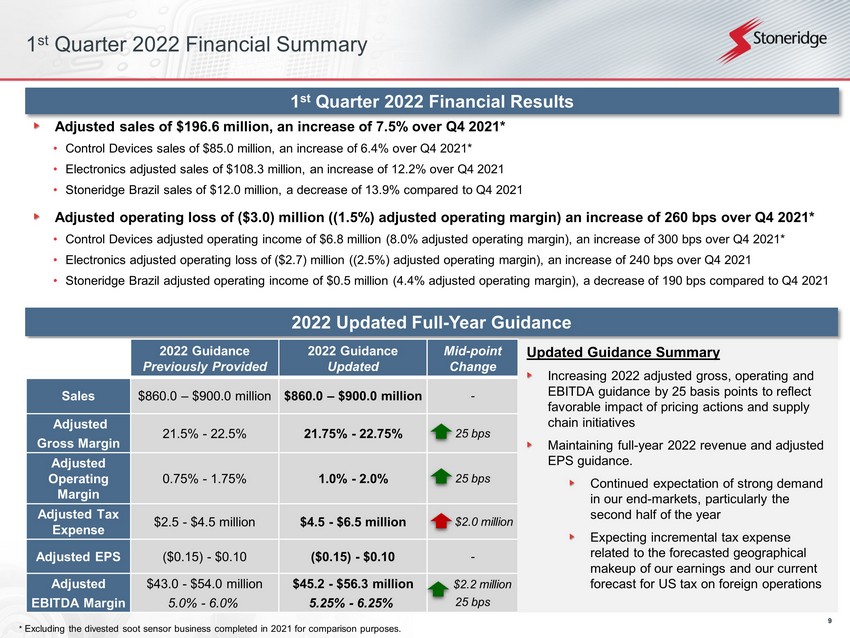
9 1 st Quarter 2022 Financial Summary 1 st Quarter 2022 Financial Results Adjusted sales of $196.6 million, an increase of 7.5% over Q4 2021* • Control Devices sales of $85.0 million, an increase of 6.4% over Q4 2021* • Electronics adjusted sales of $108.3 million, an increase of 12.2% over Q4 2021 • Stoneridge Brazil sales of $12.0 million, a decrease of 13.9% compared to Q4 2021 Adjusted operating loss of ($3.0) million ((1.5%) adjusted operating margin) an increase of 260 bps over Q4 2021* • Control Devices adjusted operating income of $6.8 million (8.0% adjusted operating margin), an increase of 300 bps over Q4 20 21* • Electronics adjusted operating loss of ($2.7) million ((2.5%) adjusted operating margin), an increase of 240 bps over Q4 2021 • Stoneridge Brazil adjusted operating income of $0.5 million (4.4% adjusted operating margin), a decrease of 190 bps compared to Q4 2021 2022 Updated Full - Year Guidance 2022 Guidance Previously Provided 2022 Guidance Updated Mid - point Change Sales $860.0 – $900.0 million $860.0 – $900.0 million - Adjusted Gross Margin 21.5% - 22.5% 21.75% - 22.75% 25 bps Adjusted Operating Margin 0.75% - 1.75% 1.0% - 2.0% 25 bps Adjusted Tax Expense $2.5 - $4.5 million $4.5 - $6.5 million $2.0 million Adjusted EPS ($0.15) - $0.10 ($0.15) - $0.10 - Adjusted EBITDA Margin $43.0 - $54.0 million 5.0% - 6.0% $45.2 - $56.3 million 5.25% - 6.25% $2.2 million 25 bps * Excluding the divested soot sensor business completed in 2021 for comparison purposes. Updated Guidance Summary Increasing 2022 adjusted gross, operating and EBITDA guidance by 25 basis points to reflect favorable impact of pricing actions and supply chain initiatives Maintaining full - year 2022 revenue and adjusted EPS guidance. Continued expectation of strong demand in our end - markets, particularly the second half of the year Expecting incremental tax expense related to the forecasted geographical makeup of our earnings and our current forecast for US tax on foreign operations
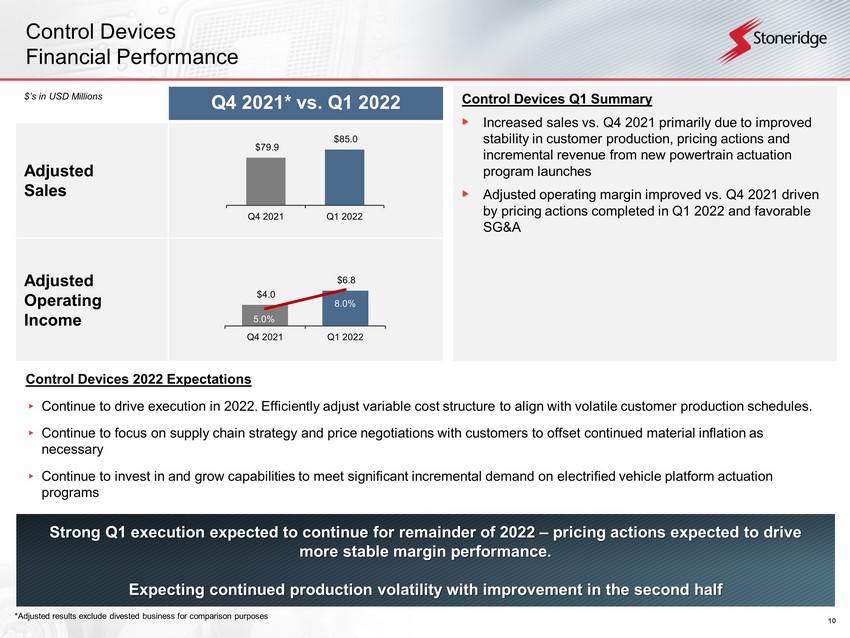
10 Control Devices Financial Performance Strong Q1 execution expected to continue for remainder of 2022 – pricing actions expected to drive more stable margin performance. Expecting continued production volatility with improvement in the second half Control Devices 2022 Expectations ▸ Continue to drive execution in 2022 . Efficiently adjust variable cost structure to align with volatile customer production schedules. ▸ Continue to focus on supply chain strategy and price negotiations with customers to offset continued material inflation as necessary ▸ Continue to invest in and grow capabilities to meet significant incremental demand on electrified vehicle platform actuation programs Q4 2021* vs. Q1 2022 Adjusted Sales Adjusted Operating Income $’s in USD Millions Control Devices Q1 Summary Increased sales vs. Q4 2021 primarily due to improved stability in customer production, pricing actions and incremental revenue from new powertrain actuation program launches Adjusted operating margin improved vs. Q4 2021 driven by pricing actions completed in Q1 2022 and favorable SG&A *Adjusted results exclude divested business for comparison purposes $4.0 $6.8 5.0% 8.0% 0% 5% 10% -3 2 7 12 Q4 2021 Q1 2022 $79.9 $85.0 Q4 2021 Q1 2022
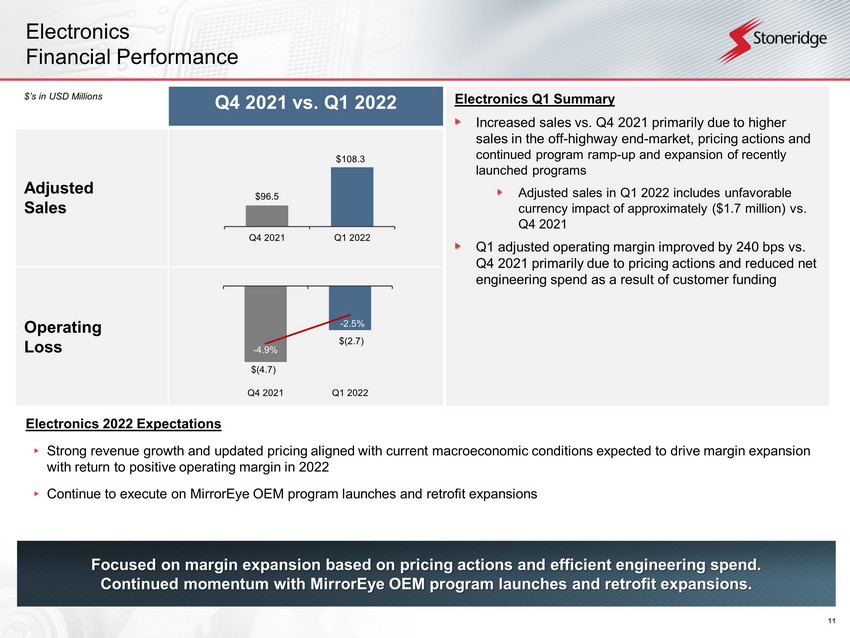
11 Q4 2021 vs. Q1 2022 Adjusted Sales Operating Loss Electronics Financial Performance Focused on margin expansion based on pricing actions and efficient engineering spend. Continued momentum with MirrorEye OEM program launches and retrofit expansions. Electronics 2022 Expectations ▸ Strong revenue growth and updated pricing aligned with current macroeconomic conditions expected to drive margin expansion with return to positive operating margin in 2022 ▸ Continue to execute on MirrorEye OEM program launches and retrofit expansions $’s in USD Millions Electronics Q1 Summary Increased sales vs. Q4 2021 primarily due to higher sales in the off - highway end - market, pricing actions and continued program ramp - up and expansion of recently launched programs Adjusted sales in Q1 2022 includes unfavorable currency impact of approximately ($1.7 million) vs. Q4 2021 Q1 adjusted operating margin improved by 240 bps vs. Q4 2021 primarily due to pricing actions and reduced net engineering spend as a result of customer funding $(4.7) $(2.7) - 4.9% - 2.5% -8% -6% -4% -2% 0% -5.9 -3.9 -1.9 0.1 Q4 2021 Q1 2022 $96.5 $108.3 Q4 2021 Q1 2022
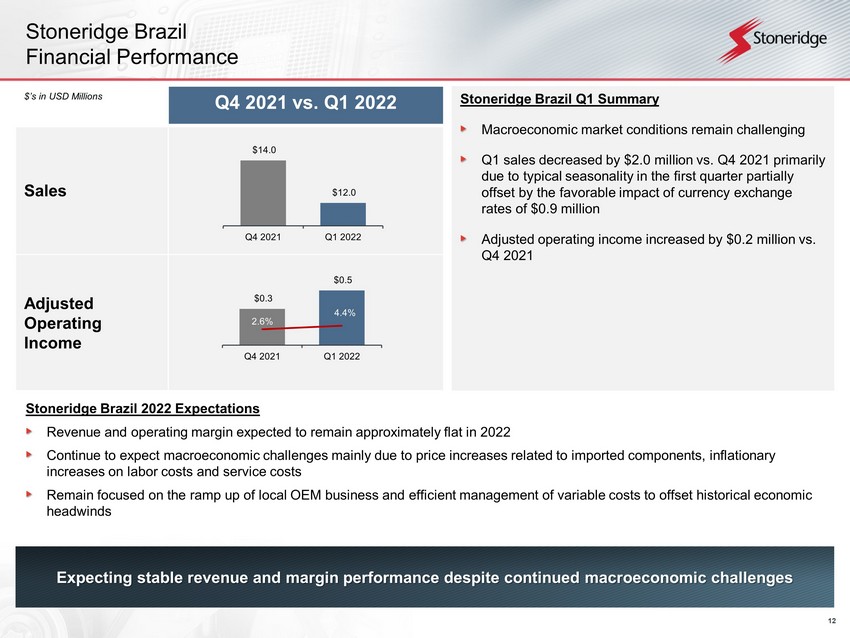
12 Q4 2021 vs. Q1 2022 Sales Adjusted Operating Income Stoneridge Brazil Financial Performance Expecting stable revenue and margin performance despite continued macroeconomic challenges Stoneridge Brazil 2022 Expectations Revenue and operating margin expected to remain approximately flat in 2022 Continue to expect macroeconomic challenges mainly due to price increases related to imported components, inflationary increases on labor costs and service costs Remain focused on the ramp up of local OEM business and efficient management of variable costs to offset historical economic headwinds Stoneridge Brazil Q1 Summary Macroeconomic market conditions remain challenging Q1 sales decreased by $2.0 million vs. Q4 2021 primarily due to typical seasonality in the first quarter partially offset by the favorable impact of currency exchange rates of $0.9 million Adjusted operating income increased by $0.2 million vs. Q4 2021 $’s in USD Millions $14.0 $12.0 Q4 2021 Q1 2022 $0.3 $0.5 2.6% 4.4% -5% 5% 15% 25% 0 0.2 0.4 0.6 Q4 2021 Q1 2022
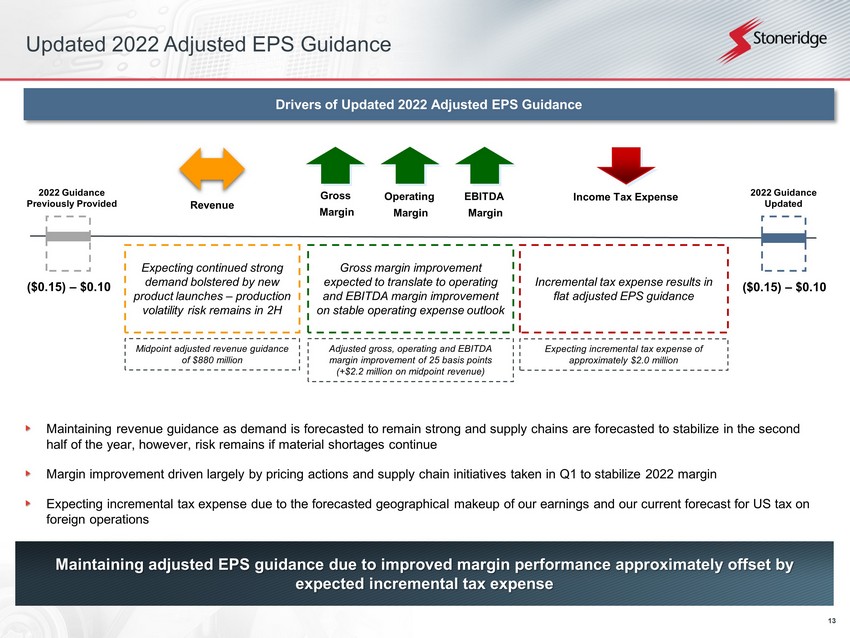
13 Updated 2022 Adjusted EPS Guidance 2022 Guidance Previously Provided Drivers of Updated 2022 Adjusted EPS Guidance ($0.15) – $0.10 ($0.15) – $0.10 2022 Guidance Updated Maintaining adjusted EPS guidance due to improved margin performance approximately offset by expected incremental tax expense Maintaining revenue guidance as demand is forecasted to remain strong and supply chains are forecasted to stabilize in the se con d half of the year, however, risk remains if material shortages continue Margin improvement driven largely by pricing actions and supply chain initiatives taken in Q1 to stabilize 2022 margin Expecting incremental tax expense due to the forecasted geographical makeup of our earnings and our current forecast for US t ax on foreign operations Revenue Income Tax Expense Expecting continued strong demand bolstered by new product launches – production volatility risk remains in 2H Gross margin improvement expected to translate to operating and EBITDA margin improvement on stable operating expense outlook Incremental tax expense results in flat adjusted EPS guidance Operating Margin Midpoint adjusted revenue guidance of $880 million Adjusted gross, operating and EBITDA margin improvement of 25 basis points (+$2.2 million on midpoint revenue) Expecting incremental tax expense of approximately $2.0 million Gross Margin EBITDA Margin
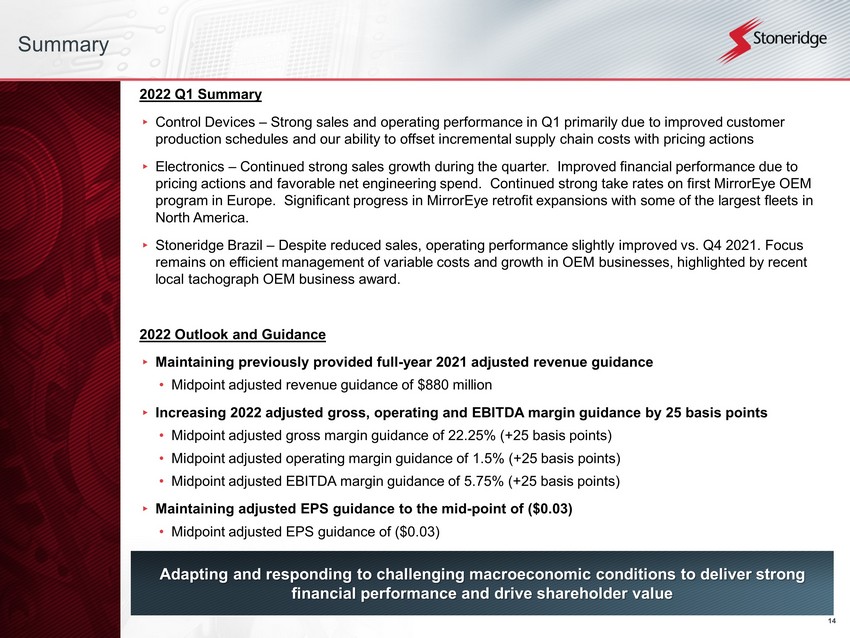
14 Summary 2022 Q1 Summary ▸ Control Devices – Strong sales and operating performance in Q1 primarily due to improved customer production schedules and our ability to offset incremental supply chain costs with pricing actions ▸ Electronics – Continued strong sales growth during the quarter. Improved financial performance due to pricing actions and favorable net engineering spend. Continued strong take rates on first MirrorEye OEM program in Europe. Significant progress in MirrorEye retrofit expansions with some of the largest fleets in North America. ▸ Stoneridge Brazil – Despite reduced sales, operating performance slightly improved vs. Q4 2021. Focus remains on efficient management of variable costs and growth in OEM businesses, highlighted by recent local tachograph OEM business award. 2022 Outlook and Guidance ▸ Maintaining previously provided full - year 2021 adjusted revenue guidance • Midpoint adjusted revenue guidance of $880 million ▸ Increasing 2022 adjusted gross, operating and EBITDA margin guidance by 25 basis points • Midpoint adjusted gross margin guidance of 22.25% (+25 basis points) • Midpoint adjusted operating margin guidance of 1.5% (+25 basis points) • Midpoint adjusted EBITDA margin guidance of 5.75% (+25 basis points) ▸ Maintaining adjusted EPS guidance to the mid - point of ($0.03) • Midpoint adjusted EPS guidance of ($0.03) Adapting and responding to challenging macroeconomic conditions to deliver strong financial performance and drive shareholder value

15 Appendix
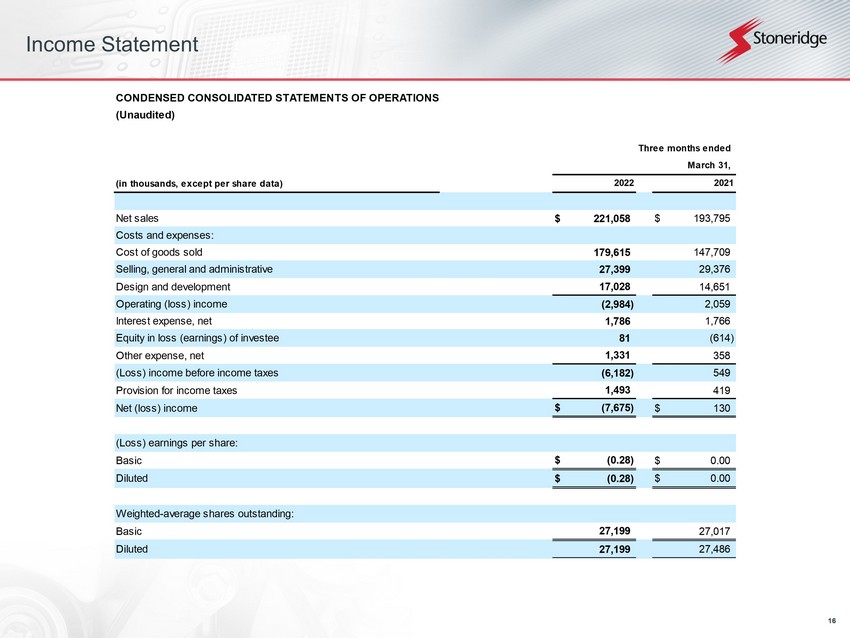
16 Income Statement CONDENSED CONSOLIDATED STATEMENTS OF OPERATIONS (Unaudited) (in thousands, except per share data) Net sales $ 221,058 $ 193,795 Costs and expenses: Cost of goods sold 179,615 147,709 Selling, general and administrative 27,399 29,376 Design and development 17,028 14,651 Operating (loss) income (2,984) 2,059 Interest expense, net 1,786 1,766 Equity in loss (earnings) of investee 81 (614) Other expense, net 1,331 358 (Loss) income before income taxes (6,182) 549 Provision for income taxes 1,493 419 Net (loss) income $ (7,675) $ 130 (Loss) earnings per share: Basic $ (0.28) $ 0.00 Diluted $ (0.28) $ 0.00 Weighted-average shares outstanding: Basic 27,199 27,017 Diluted 27,199 27,486 Three months ended March 31, 2022 2021
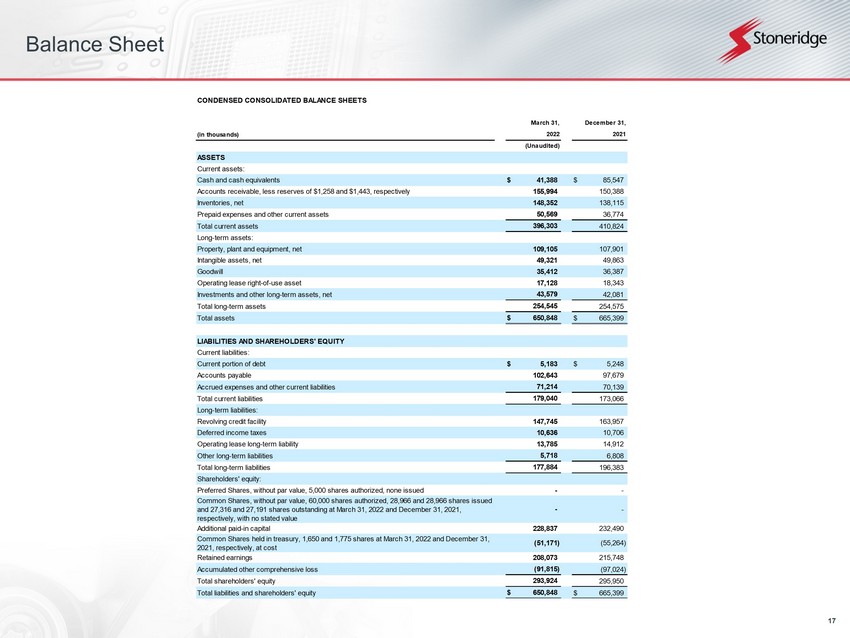
17 Balance Sheet CONDENSED CONSOLIDATED BALANCE SHEETS (in thousands) (Unaudited) ASSETS Current assets: Cash and cash equivalents $ 41,388 $ 85,547 Accounts receivable, less reserves of $1,258 and $1,443, respectively 155,994 150,388 Inventories, net 148,352 138,115 Prepaid expenses and other current assets 50,569 36,774 Total current assets 396,303 410,824 Long-term assets: Property, plant and equipment, net 109,105 107,901 Intangible assets, net 49,321 49,863 Goodwill 35,412 36,387 Operating lease right-of-use asset 17,128 18,343 Investments and other long-term assets, net 43,579 42,081 Total long-term assets 254,545 254,575 Total assets $ 650,848 $ 665,399 LIABILITIES AND SHAREHOLDERS' EQUITY Current liabilities: Current portion of debt $ 5,183 $ 5,248 Accounts payable 102,643 97,679 Accrued expenses and other current liabilities 71,214 70,139 Total current liabilities 179,040 173,066 Long-term liabilities: Revolving credit facility 147,745 163,957 Deferred income taxes 10,636 10,706 Operating lease long-term liability 13,785 14,912 Other long-term liabilities 5,718 6,808 Total long-term liabilities 177,884 196,383 Shareholders' equity: Preferred Shares, without par value, 5,000 shares authorized, none issued - - Common Shares, without par value, 60,000 shares authorized, 28,966 and 28,966 shares issued and 27,316 and 27,191 shares outstanding at March 31, 2022 and December 31, 2021, respectively, with no stated value - - Additional paid-in capital 228,837 232,490 Common Shares held in treasury, 1,650 and 1,775 shares at March 31, 2022 and December 31, 2021, respectively, at cost (51,171) (55,264) Retained earnings 208,073 215,748 Accumulated other comprehensive loss (91,815) (97,024) Total shareholders' equity 293,924 295,950 Total liabilities and shareholders' equity $ 650,848 $ 665,399 March 31, December 31, 2022 2021
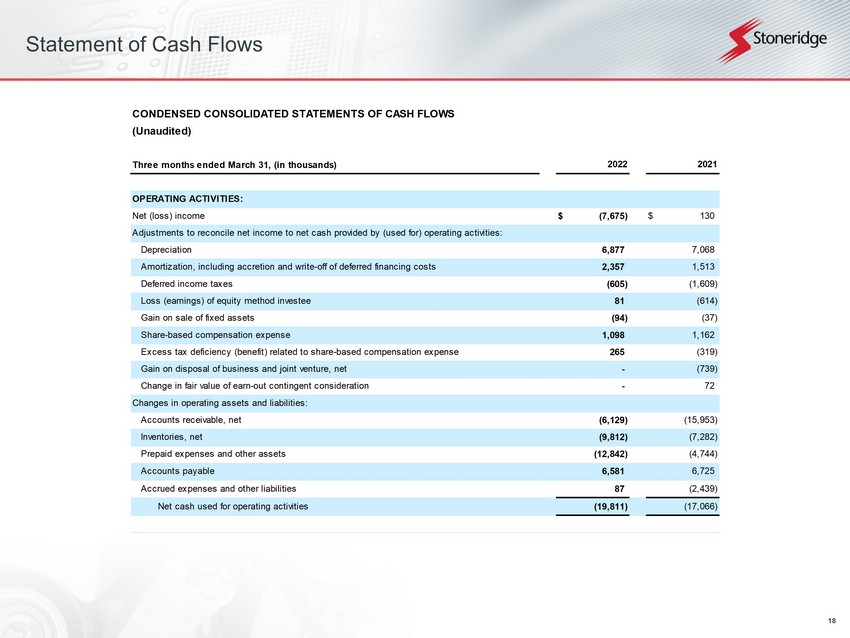
18 Statement of Cash Flows CONDENSED CONSOLIDATED STATEMENTS OF CASH FLOWS (Unaudited) Three months ended March 31, (in thousands) OPERATING ACTIVITIES: Net (loss) income $ (7,675) $ 130 Adjustments to reconcile net income to net cash provided by (used for) operating activities: Depreciation 6,877 7,068 Amortization, including accretion and write-off of deferred financing costs 2,357 1,513 Deferred income taxes (605) (1,609) Loss (earnings) of equity method investee 81 (614) Gain on sale of fixed assets (94) (37) Share-based compensation expense 1,098 1,162 Excess tax deficiency (benefit) related to share-based compensation expense 265 (319) Gain on disposal of business and joint venture, net - (739) Change in fair value of earn-out contingent consideration - 72 Changes in operating assets and liabilities: Accounts receivable, net (6,129) (15,953) Inventories, net (9,812) (7,282) Prepaid expenses and other assets (12,842) (4,744) Accounts payable 6,581 6,725 Accrued expenses and other liabilities 87 (2,439) Net cash used for operating activities (19,811) (17,066) 2022 2021
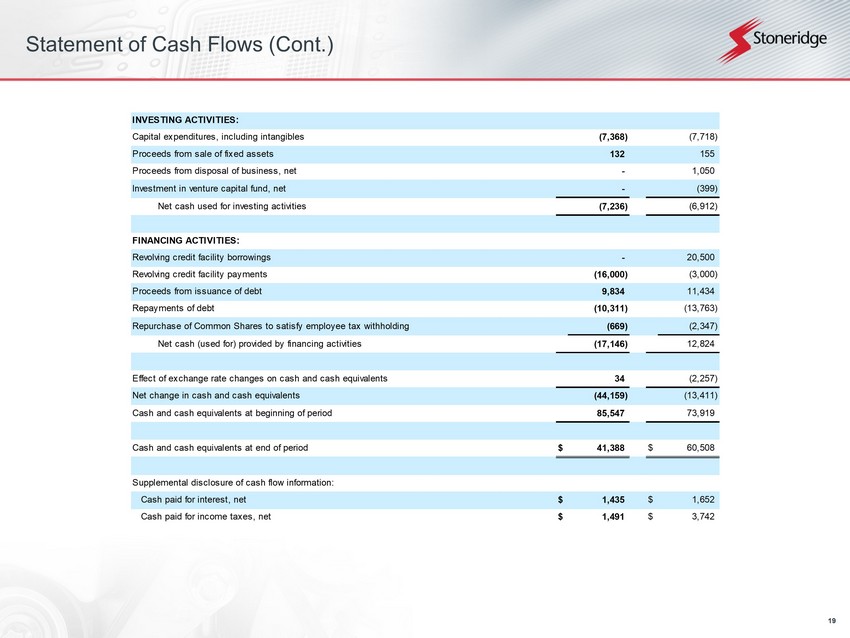
19 Statement of Cash Flows (Cont.) INVESTING ACTIVITIES: Capital expenditures, including intangibles (7,368) (7,718) Proceeds from sale of fixed assets 132 155 Proceeds from disposal of business, net - 1,050 Investment in venture capital fund, net - (399) Net cash used for investing activities (7,236) (6,912) FINANCING ACTIVITIES: Revolving credit facility borrowings - 20,500 Revolving credit facility payments (16,000) (3,000) Proceeds from issuance of debt 9,834 11,434 Repayments of debt (10,311) (13,763) Repurchase of Common Shares to satisfy employee tax withholding (669) (2,347) Net cash (used for) provided by financing activities (17,146) 12,824 Effect of exchange rate changes on cash and cash equivalents 34 (2,257) Net change in cash and cash equivalents (44,159) (13,411) Cash and cash equivalents at beginning of period 85,547 73,919 Cash and cash equivalents at end of period $ 41,388 $ 60,508 Supplemental disclosure of cash flow information: Cash paid for interest, net $ 1,435 $ 1,652 Cash paid for income taxes, net $ 1,491 $ 3,742
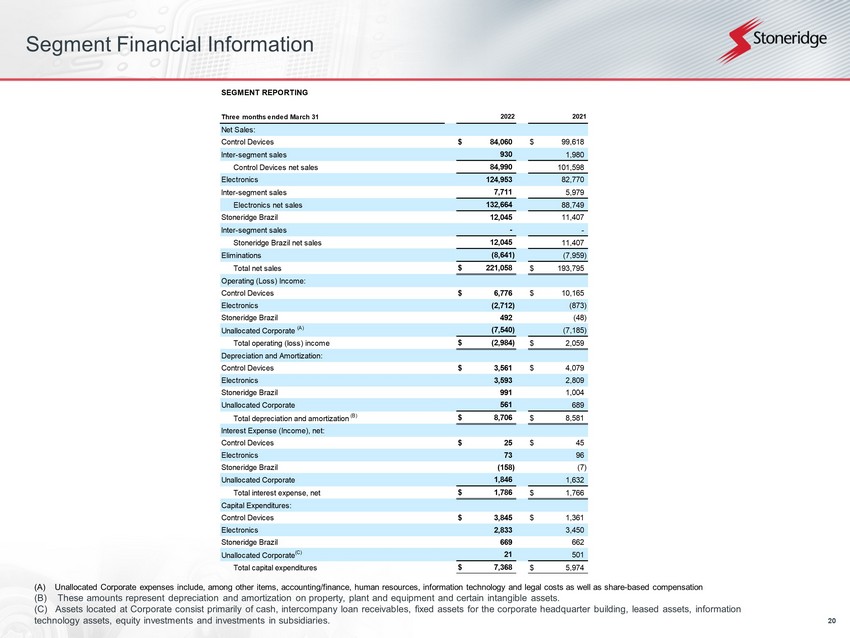
20 Segment Financial Information (A) Unallocated Corporate expenses include, among other items, accounting/finance, human resources, information technology an d legal costs as well as share - based compensation (B) These amounts represent depreciation and amortization on property, plant and equipment and certain intangible assets. (C) Assets located at Corporate consist primarily of cash, intercompany loan receivables, fixed assets for the corporate headq uarter building, leased assets, information technology assets, equity investments and investments in subsidiaries. SEGMENT REPORTING Three months ended March 31 Net Sales: Control Devices $ 84,060 $ 99,618 Inter-segment sales 930 1,980 Control Devices net sales 84,990 101,598 Electronics 124,953 82,770 Inter-segment sales 7,711 5,979 Electronics net sales 132,664 88,749 Stoneridge Brazil 12,045 11,407 Inter-segment sales - - Stoneridge Brazil net sales 12,045 11,407 Eliminations (8,641) (7,959) Total net sales $ 221,058 $ 193,795 Operating (Loss) Income: Control Devices $ 6,776 $ 10,165 Electronics (2,712) (873) Stoneridge Brazil 492 (48) Unallocated Corporate (A) (7,540) (7,185) Total operating (loss) income $ (2,984) $ 2,059 Depreciation and Amortization: Control Devices $ 3,561 $ 4,079 Electronics 3,593 2,809 Stoneridge Brazil 991 1,004 Unallocated Corporate 561 689 Total depreciation and amortization (B) $ 8,706 $ 8,581 Interest Expense (Income), net: Control Devices $ 25 $ 45 Electronics 73 96 Stoneridge Brazil (158) (7) Unallocated Corporate 1,846 1,632 Total interest expense, net $ 1,786 $ 1,766 Capital Expenditures: Control Devices $ 3,845 $ 1,361 Electronics 2,833 3,450 Stoneridge Brazil 669 662 Unallocated Corporate (C) 21 501 Total capital expenditures $ 7,368 $ 5,974 2022 2021

21 Reconciliations to US GAAP
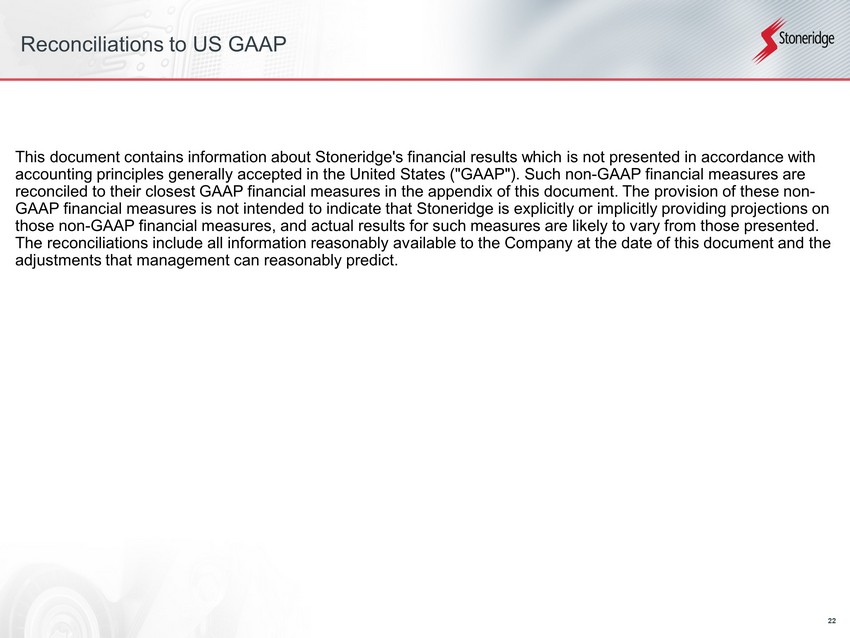
22 Reconciliations to US GAAP This document contains information about Stoneridge's financial results which is not presented in accordance with accounting principles generally accepted in the United States ("GAAP"). Such non - GAAP financial measures are reconciled to their closest GAAP financial measures in the appendix of this document. The provision of these non - GAAP financial measures is not intended to indicate that Stoneridge is explicitly or implicitly providing projections on those non - GAAP financial measures, and actual results for such measures are likely to vary from those presented. The reconciliations include all information reasonably available to the Company at the date of this document and the adjustments that management can reasonably predict.
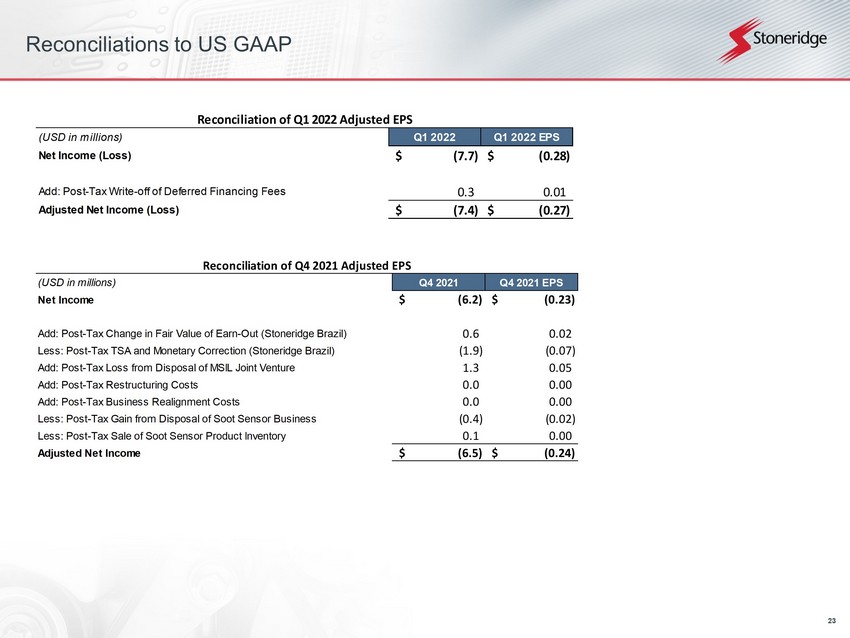
23 Reconciliations to US GAAP Reconciliation of Q4 2021 Adjusted EPS (USD in millions) Q4 2021 Q4 2021 EPS Net Income (6.2)$ (0.23)$ Add: Post-Tax Change in Fair Value of Earn-Out (Stoneridge Brazil) 0.6 0.02 Less: Post-Tax TSA and Monetary Correction (Stoneridge Brazil) (1.9) (0.07) Add: Post-Tax Loss from Disposal of MSIL Joint Venture 1.3 0.05 Add: Post-Tax Restructuring Costs 0.0 0.00 Add: Post-Tax Business Realignment Costs 0.0 0.00 Less: Post-Tax Gain from Disposal of Soot Sensor Business (0.4) (0.02) Less: Post-Tax Sale of Soot Sensor Product Inventory 0.1 0.00 Adjusted Net Income (6.5)$ (0.24)$ Reconciliation of Q1 2022 Adjusted EPS (USD in millions) Q1 2022 Q1 2022 EPS Net Income (Loss) (7.7)$ (0.28)$ Add: Post-Tax Write-off of Deferred Financing Fees 0.3 0.01 Adjusted Net Income (Loss) (7.4)$ (0.27)$
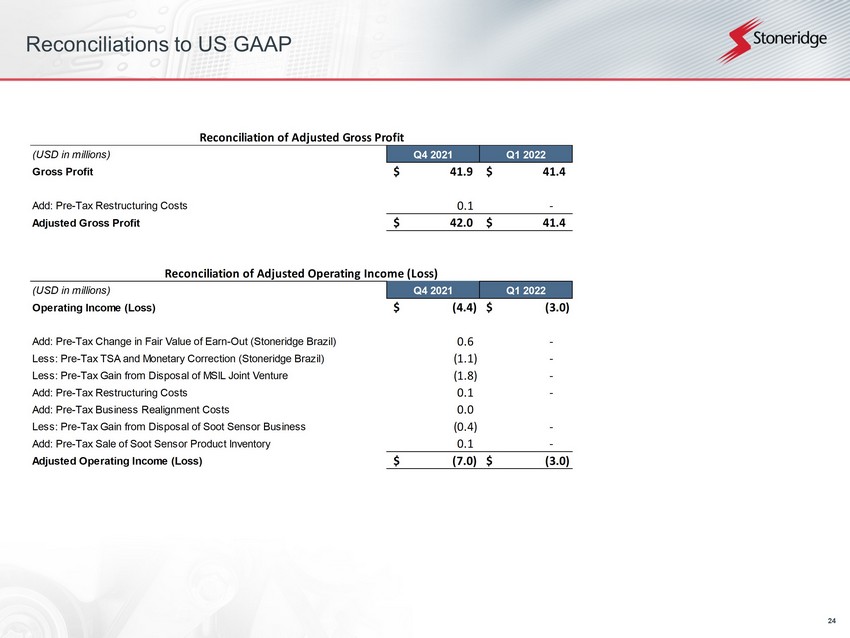
24 Reconciliations to US GAAP Reconciliation of Adjusted Operating Income (Loss) (USD in millions) Q4 2021 Q1 2022 Operating Income (Loss) (4.4)$ (3.0)$ Add: Pre-Tax Change in Fair Value of Earn-Out (Stoneridge Brazil) 0.6 - Less: Pre-Tax TSA and Monetary Correction (Stoneridge Brazil) (1.1) - Less: Pre-Tax Gain from Disposal of MSIL Joint Venture (1.8) - Add: Pre-Tax Restructuring Costs 0.1 - Add: Pre-Tax Business Realignment Costs 0.0 Less: Pre-Tax Gain from Disposal of Soot Sensor Business (0.4) - Add: Pre-Tax Sale of Soot Sensor Product Inventory 0.1 - Adjusted Operating Income (Loss) (7.0)$ (3.0)$ Reconciliation of Adjusted Gross Profit (USD in millions) Q4 2021 Q1 2022 Gross Profit 41.9$ 41.4$ Add: Pre-Tax Restructuring Costs 0.1 - Adjusted Gross Profit 42.0$ 41.4$
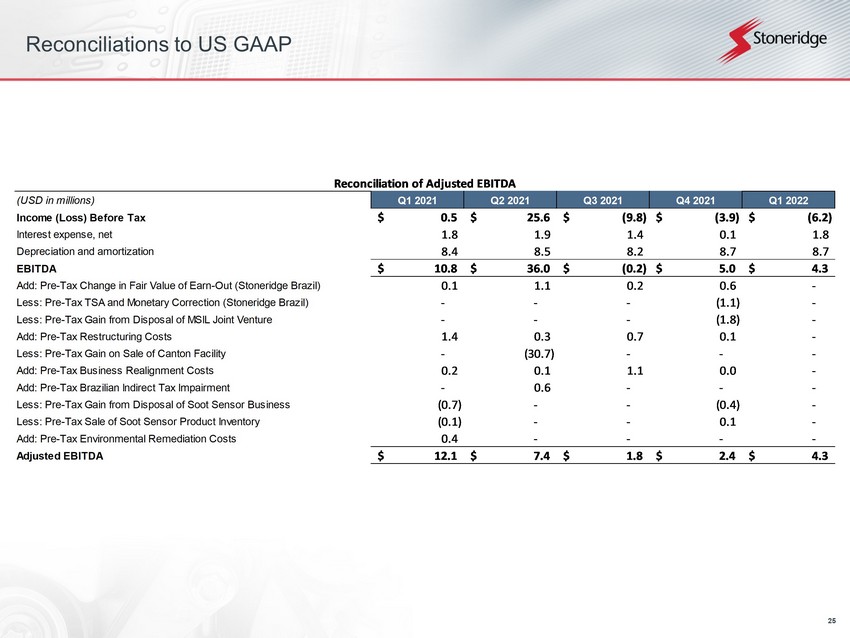
25 Reconciliations to US GAAP Reconciliation of Adjusted EBITDA (USD in millions) Q1 2021 Q2 2021 Q3 2021 Q4 2021 Q1 2022 Income (Loss) Before Tax 0.5$ 25.6$ (9.8)$ (3.9)$ (6.2)$ Interest expense, net 1.8 1.9 1.4 0.1 1.8 Depreciation and amortization 8.4 8.5 8.2 8.7 8.7 EBITDA 10.8$ 36.0$ (0.2)$ 5.0$ 4.3$ Add: Pre-Tax Change in Fair Value of Earn-Out (Stoneridge Brazil) 0.1 1.1 0.2 0.6 - Less: Pre-Tax TSA and Monetary Correction (Stoneridge Brazil) - - - (1.1) - Less: Pre-Tax Gain from Disposal of MSIL Joint Venture - - - (1.8) - Add: Pre-Tax Restructuring Costs 1.4 0.3 0.7 0.1 - Less: Pre-Tax Gain on Sale of Canton Facility - (30.7) - - - Add: Pre-Tax Business Realignment Costs 0.2 0.1 1.1 0.0 - Add: Pre-Tax Brazilian Indirect Tax Impairment - 0.6 - - - Less: Pre-Tax Gain from Disposal of Soot Sensor Business (0.7) - - (0.4) - Less: Pre-Tax Sale of Soot Sensor Product Inventory (0.1) - - 0.1 - Add: Pre-Tax Environmental Remediation Costs 0.4 - - - - Adjusted EBITDA 12.1$ 7.4$ 1.8$ 2.4$ 4.3$
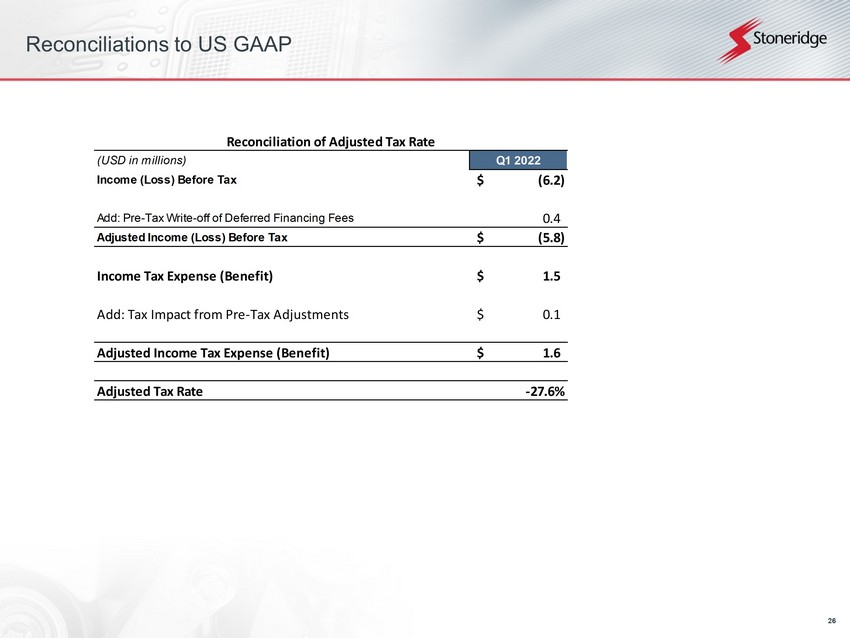
26 Reconciliations to US GAAP (USD in millions) Q1 2022 Income (Loss) Before Tax (6.2)$ Add: Pre-Tax Write-off of Deferred Financing Fees 0.4 Adjusted Income (Loss) Before Tax (5.8)$ Income Tax Expense (Benefit) 1.5$ Add: Tax Impact from Pre-Tax Adjustments 0.1$ Adjusted Income Tax Expense (Benefit) 1.6$ Adjusted Tax Rate -27.6% Reconciliation of Adjusted Tax Rate
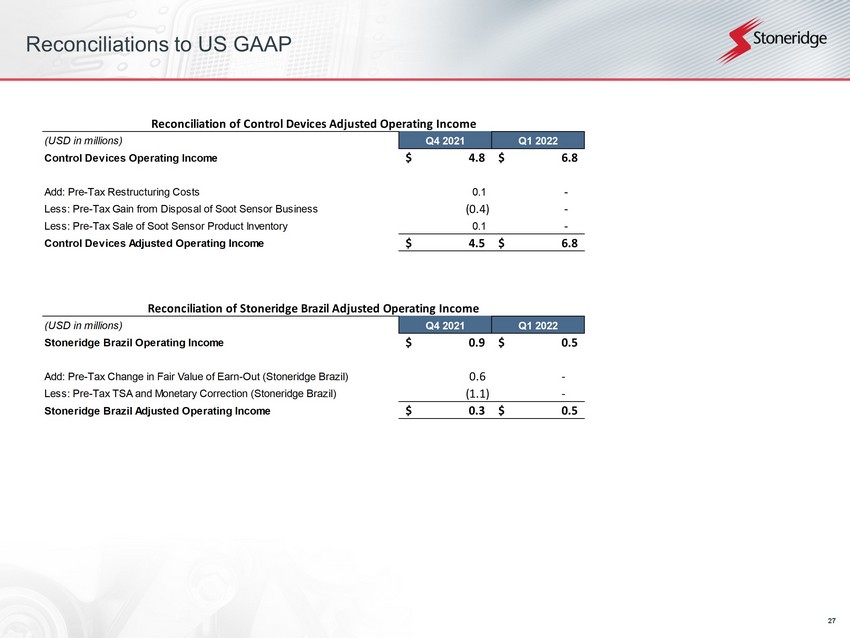
27 Reconciliations to US GAAP Reconciliation of Control Devices Adjusted Operating Income (USD in millions) Q4 2021 Q1 2022 Control Devices Operating Income 4.8$ 6.8$ Add: Pre-Tax Restructuring Costs 0.1 - Less: Pre-Tax Gain from Disposal of Soot Sensor Business (0.4) - Less: Pre-Tax Sale of Soot Sensor Product Inventory 0.1 - Control Devices Adjusted Operating Income 4.5$ 6.8$ Reconciliation of Stoneridge Brazil Adjusted Operating Income (USD in millions) Q4 2021 Q1 2022 Stoneridge Brazil Operating Income 0.9$ 0.5$ Add: Pre-Tax Change in Fair Value of Earn-Out (Stoneridge Brazil) 0.6 - Less: Pre-Tax TSA and Monetary Correction (Stoneridge Brazil) (1.1) - Stoneridge Brazil Adjusted Operating Income 0.3$ 0.5$
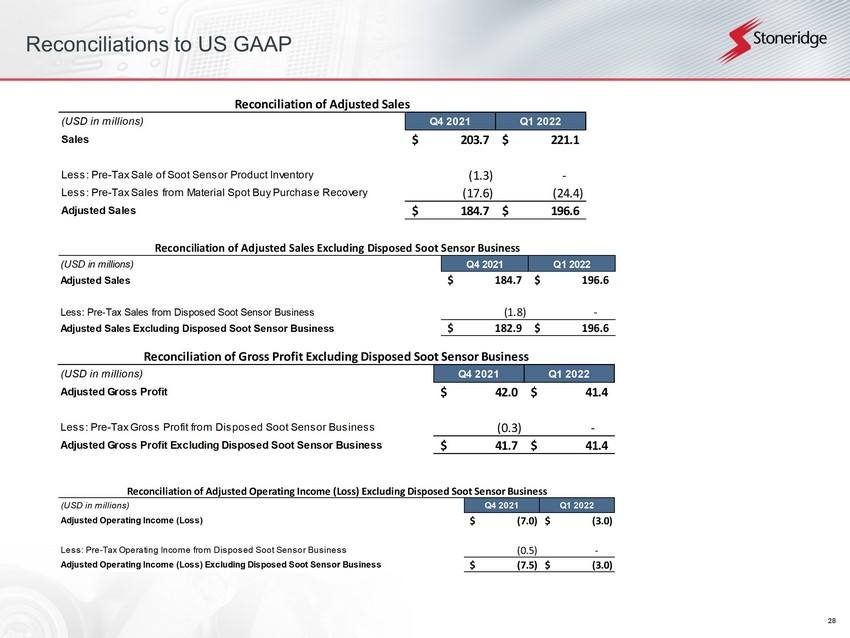
28 Reconciliations to US GAAP Reconciliation of Adjusted Sales Excluding Disposed Soot Sensor Business (USD in millions) Q4 2021 Q1 2022 Adjusted Sales 184.7$ 196.6$ Less: Pre-Tax Sales from Disposed Soot Sensor Business (1.8) - Adjusted Sales Excluding Disposed Soot Sensor Business 182.9$ 196.6$ Reconciliation of Adjusted Sales (USD in millions) Q4 2021 Q1 2022 Sales 203.7$ 221.1$ Less: Pre-Tax Sale of Soot Sensor Product Inventory (1.3) - Less: Pre-Tax Sales from Material Spot Buy Purchase Recovery (17.6) (24.4) Adjusted Sales 184.7$ 196.6$ Reconciliation of Gross Profit Excluding Disposed Soot Sensor Business (USD in millions) Q4 2021 Q1 2022 Adjusted Gross Profit 42.0$ 41.4$ Less: Pre-Tax Gross Profit from Disposed Soot Sensor Business (0.3) - Adjusted Gross Profit Excluding Disposed Soot Sensor Business 41.7$ 41.4$ Reconciliation of Adjusted Operating Income (Loss) Excluding Disposed Soot Sensor Business (USD in millions) Q4 2021 Q1 2022 Adjusted Operating Income (Loss) (7.0)$ (3.0)$ Less: Pre-Tax Operating Income from Disposed Soot Sensor Business (0.5) - Adjusted Operating Income (Loss) Excluding Disposed Soot Sensor Business (7.5)$ (3.0)$
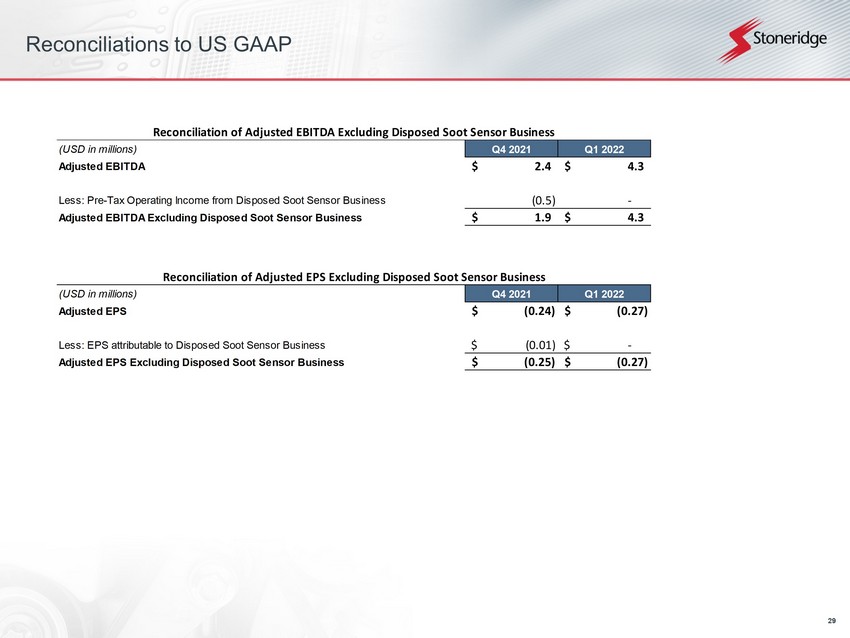
29 Reconciliations to US GAAP Reconciliation of Adjusted EBITDA Excluding Disposed Soot Sensor Business (USD in millions) Q4 2021 Q1 2022 Adjusted EBITDA 2.4$ 4.3$ Less: Pre-Tax Operating Income from Disposed Soot Sensor Business (0.5) - Adjusted EBITDA Excluding Disposed Soot Sensor Business 1.9$ 4.3$ Reconciliation of Adjusted EPS Excluding Disposed Soot Sensor Business (USD in millions) Q4 2021 Q1 2022 Adjusted EPS (0.24)$ (0.27)$ Less: EPS attributable to Disposed Soot Sensor Business (0.01)$ -$ Adjusted EPS Excluding Disposed Soot Sensor Business (0.25)$ (0.27)$
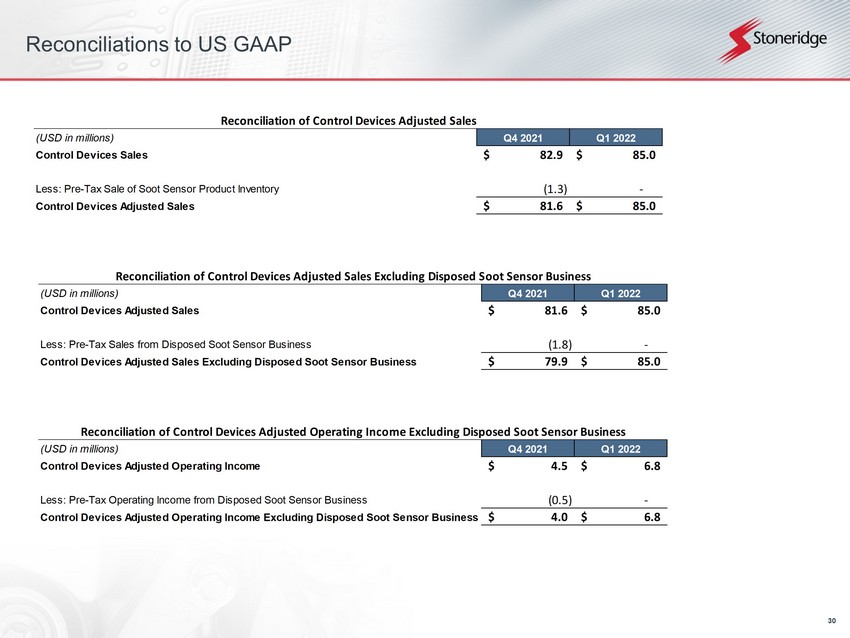
30 Reconciliations to US GAAP Reconciliation of Control Devices Adjusted Sales (USD in millions) Q4 2021 Q1 2022 Control Devices Sales 82.9$ 85.0$ Less: Pre-Tax Sale of Soot Sensor Product Inventory (1.3) - Control Devices Adjusted Sales 81.6$ 85.0$ Reconciliation of Control Devices Adjusted Sales Excluding Disposed Soot Sensor Business (USD in millions) Q4 2021 Q1 2022 Control Devices Adjusted Sales 81.6$ 85.0$ Less: Pre-Tax Sales from Disposed Soot Sensor Business (1.8) - Control Devices Adjusted Sales Excluding Disposed Soot Sensor Business 79.9$ 85.0$ Reconciliation of Control Devices Adjusted Operating Income Excluding Disposed Soot Sensor Business (USD in millions) Q4 2021 Q1 2022 Control Devices Adjusted Operating Income 4.5$ 6.8$ Less: Pre-Tax Operating Income from Disposed Soot Sensor Business (0.5) - Control Devices Adjusted Operating Income Excluding Disposed Soot Sensor Business 4.0$ 6.8$
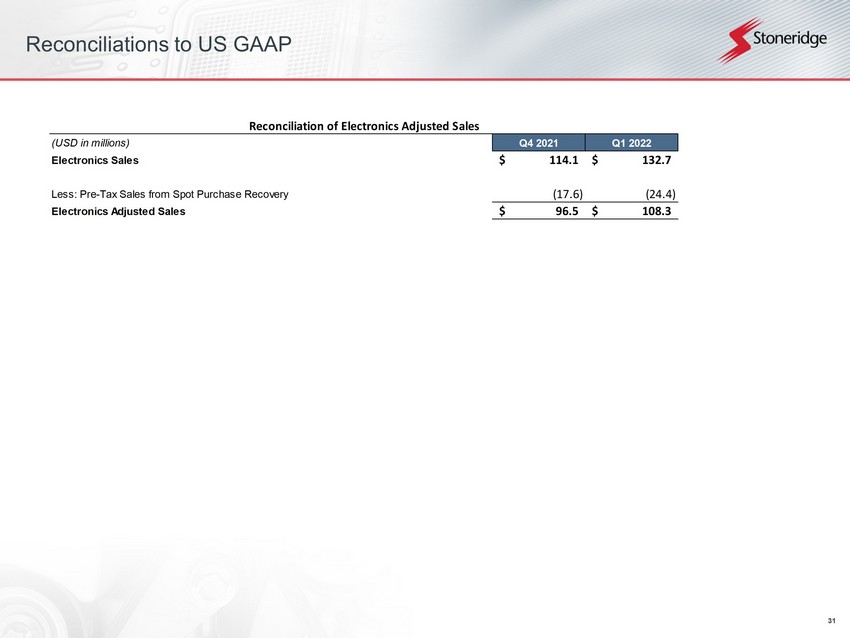
31 Reconciliations to US GAAP Reconciliation of Electronics Adjusted Sales (USD in millions) Q4 2021 Q1 2022 Electronics Sales 114.1$ 132.7$ Less: Pre-Tax Sales from Spot Purchase Recovery (17.6) (24.4) Electronics Adjusted Sales 96.5$ 108.3$