Exhibit
99.1
| FOR
IMMEDIATE RELEASE |
 |
Stoneridge
Reports Strong Fourth-Quarter and Full-Year 2020 Results
2021 REVENUE GUIDANCE OF $770 - $790
MILLION
2021 - 2025 REVENUE CAGR OF 10%+ (~5
TIMES MARKET GROWTH)
Fourth-Quarter 2020 Results
| · | Earnings
per diluted share (“EPS”) of $0.13 |
| · | Gross
profit of $49.6 million |
| · | Adjusted
gross profit of $50.0 million (26.4% of sales) |
| · | Operating
income of $5.7 million |
| · | Adjusted
operating income of $7.0 million (3.7% of sales) |
| · | Adjusted
EBITDA of $16.2 million (8.6% of sales) |
Full-Year 2020 Results
| · | Loss
per share of ($0.29) |
| · | Adjusted
loss per share of ($0.03) |
| · | Gross
profit of $154.2 million |
| · | Adjusted
gross profit of $158.1 million (24.4% of sales) |
| · | Operating
loss of ($7.7) million |
| · | Adjusted
operating income of $2.1 million (0.3% of sales) |
| · | Adjusted
EBITDA of $37.9 million (5.8% of sales) |
2021 Guidance
| · | Adjusted
EPS of $0.60 - $0.75 including the expected adverse impact of global supply chain disruptions
and unfavorable forecasted currency rates totaling approximately ($0.13) in 2021 |
| · | Sales
of $770.0 - $790.0 million |
| · | Adjusted
gross margin of 25.75% - 26.75% |
| · | Adjusted
operating margin of 3.5% - 4.25% |
| · | Adjusted
EBITDA margin of 8.0% - 8.75% |
| · | Effective
tax rate of 22.5% - 27.5% |
NOVI, Mich. – February 24, 2021 –
Stoneridge, Inc. (NYSE: SRI) today announced financial results for the fourth quarter and full-year ended December 31, 2020, with
fourth quarter sales of $189.7 million and EPS of $0.13 and full-year sales of $648.0 million and loss per share of ($0.29). Adjusted
EPS was $0.14 for the fourth quarter ended December 31, 2020 and adjusted loss per share was ($0.03) for the full-year 2020. The
exhibits attached hereto provide reconciliation detail on the normalizing adjustments.
For the fourth quarter ended December 31,
2020, Stoneridge reported gross profit of $49.6 million and adjusted gross profit of $50.0 million (26.4% of sales). Fourth quarter
2020 operating income was $5.7 million and adjusted operating income was $7.0 million (3.7% of sales). Fourth quarter 2020 adjusted
EBITDA was $16.2 million (8.6% of sales).
For the full-year ended December 31, 2020,
Stoneridge reported gross profit of $154.2 million and adjusted gross profit of $158.1 million (24.4% of sales). 2020 operating
loss was ($7.7) million and adjusted operating income was $2.1 million (0.3% of sales). 2020 adjusted EBITDA was $37.9 million
(5.8% of sales).
Jon DeGaynor, president and chief executive officer, commented,
“As a company, despite the obvious external challenges, we delivered strong financial performance in 2020 by adapting our
cost structure to current market conditions and managing our cash position throughout the year. By continuing to focus on reducing
material costs and the efficient ramp-up of production facilities as volumes increased, we were able to capture strong incremental
margins in the second half of the year, which has created good momentum as we head into 2021. Furthermore, the transformation
of the company continued in 2020 as we focused on rationalizing our product portfolio and optimizing our manufacturing footprint
to drive long-term profitable growth. MirrorEye® continued to progress throughout the year as we expanded retrofit programs,
announced pre-wire availability with Daimler Trucks North America in the third quarter and prepared for the launches of our first
OEM programs in 2021. Finally, we continued to invest the necessary capital and resources to ensure the successful launch of our
strong backlog1 of new business and continue to build upon the technologies and platforms that will support future
growth.”
Fourth Quarter in Review
Control Devices’ fourth quarter 2020 sales totaled $100.4
million, a decrease of $0.5 million, or (0.5%), relative to the third quarter of 2020. Control Devices adjusted gross margin decreased
compared to the third quarter of 2020 as a result of slightly reduced sales as well as an increase in expediting costs associated
with a significant ramp-up in sales in the second half of the year. The segment’s adjusted operating income decreased relative
to the third quarter as a result of lower sales and gross margin slightly offset by lower D&D expenses as a percentage of
sales, resulting in an adjusted operating margin of 12.6%. Fourth quarter sales increased by approximately 7.3% relative to the
fourth quarter 2019 adjusted sales excluding the impact of divested non-core products business. Fourth quarter adjusted operating
margin increased by 190 basis points relative to the fourth quarter 2019 adjusted operating margin excluding the impact of divested
non-core products business.
Electronics’ fourth quarter sales totaled $84.1 million,
an increase of $13.7 million, or 19.5%, relative to the third quarter of 2020 primarily as a result of continued strong production
volumes primarily in the North American and European commercial vehicle markets. Electronics adjusted gross margin increased due
to favorable product mix, cost improvements in electronic components and fixed overhead leverage on incremental sales compared
to the third quarter of 2020. The segment’s adjusted operating income increased relative to the third quarter as a result
of increased sales and gross margin as well as lower SG&A expenses as a percentage of sales, slightly offset by higher D&D
expenses as a percentage of sales, resulting in an adjusted operating margin of 5.2%. Fourth quarter sales increased by approximately
4.5% and adjusted operating margin increased by 390 basis points compared to the fourth quarter ended December 31, 2019.
Stoneridge Brazil’s fourth quarter sales totaled $13.3
million, an increase of $0.5 million, or 3.4% relative to the third quarter. Stoneridge Brazil’s adjusted gross margin declined
due to the increase in direct material costs due to the impact of foreign currency and global supply chain disruptions on material
purchases, partially offset by fixed cost leverage as compared to the third quarter. The segment’s adjusted operating income
decreased relative to the third quarter as a result of decreased adjusted gross margin and higher SG&A and D&D expenses
as a percentage of sales, resulting in an adjusted operating margin of 1.1%. Fourth quarter sales decreased by 22.2% and adjusted
operating margin decreased by 100 basis points compared to the fourth quarter ended December 31, 2019.
DeGaynor continued, “We believe the actions taken in 2020
positioned each of our segments for continued long-term success. Control Devices is increasingly well positioned with a focus
on the continued development and commercialization of actuation and electrified powertrain applications that will drive future
growth for the segment. In Electronics, we expect strong revenue growth in 2021 as our end markets continue to recover and we
launch and ramp-up several large programs during the year, including our first two MirrorEye® OEM programs. Stoneridge Brazil
continues to integrate into our global Electronics strategy as we leverage our global engineering footprint and prepare for continued
expansion of our local OEM presence. Overall, we will continue to focus our resources on the areas of largest opportunity for
the Company and drive long-term value creation for our shareholders.”
Cash and Debt Balances
During the quarter, the Company reduced net debt by approximately
$13.5 million relative to the prior quarter and repaid $8.0 million on its existing credit facility. As of December 31, 2020,
Stoneridge had cash and cash equivalent balances totaling $73.9 million. Total debt as of December 31, 2020 was $143.7 million.
Total debt less cash and cash equivalents yields a current net debt to trailing-twelve-month adjusted EBITDA ratio of approximately
1.8x. The Company had approximately $262.3 million of undrawn commitments under the existing credit facility as of December 31,
2020, which resulted in total undrawn commitments and cash balances of $336.2 million.
2021 Outlook
The Company announced 2021 sales guidance of $770.0 - $790.0
million. The Company noted that 2021 guidance also includes certain assumptions regarding the potential adverse impact of global
supply chain disruptions.
Bob Krakowiak, executive vice president and chief financial
officer, commented, “We are expecting increased 2021 revenue relative to 2020, with midpoint revenue guidance of $780 million
driven primarily by several significant program launches during the year and increased end market production forecasts. Our midpoint
revenue guidance implies approximately 20% growth relative to 2020 which implies growth over market of approximately 5%. While
we don’t expect a significant annual revenue impact as a result of global supply chain disruptions, we have included an
expected adverse margin impact in our guidance due to increased material and logistics costs, which are expected to primarily
impact the first half of the year. Moving forward, we expect that the impact of new program launches will drive significant growth,
and we have updated our long-term targeted revenue to reflect a compound annual growth rate of at least 10% through 2025, resulting
in targeted 2023 revenue of at least $925 million and 2025 revenue of over $1.1 billion. Driven by our strong five-year backlog1,
we expect that approximately 85% of our 2025 targeted revenue will be drivetrain agnostic.”
Further, the Company announced guidance for 2021 adjusted gross
margin of 25.75% - 26.75%, adjusted operating margin of 3.5% - 4.25% and adjusted EBITDA margin of 8.0% - 8.75% which includes
assumptions regarding the impact of the potential global supply chain disruptions.
The Company also announced adjusted earnings per share guidance
of $0.60 - $0.75 and an effective tax rate of 22.5% - 27.5%.
Krakowiak continued, “With respect to adjusted earnings
per share, we are expecting continued strong incremental contribution on revenue, which will be partially offset by continued
investment in engineering resources to support program launches and new technology development. Additionally, we expect external
factors, including adverse foreign currency exchange rates, material costs related to global supply chain disruptions and a slight
increase to our tax rate, to reduce adjusted EPS by approximately $0.16 in 2021. This results in adjusted EPS guidance of $0.60
to $0.75 in 2021.”
Conference Call on the Web
A live Internet broadcast of Stoneridge’s
conference call regarding 2020 fourth quarter and full-year results can be accessed at 9:00 a.m. Eastern Time on Thursday, February
25, 2021, at www.stoneridge.com, which will also offer a webcast replay.
About Stoneridge, Inc.
Stoneridge, Inc., headquartered
in Novi, Michigan, is an independent designer and manufacturer of highly engineered electrical and electronic components, modules
and systems principally for the automotive, commercial, off-highway, motorcycle and agricultural vehicle markets. Additional information
about Stoneridge can be found at www.stoneridge.com.
Forward-Looking Statements
Statements in this release contain “forward-looking statements”
under the Private Securities Litigation Reform Act of 1995. These statements appear in a number of places in this report and may
include statements regarding the intent, belief or current expectations of the Company, with respect to, among other things, our
(i) future product and facility expansion, (ii) acquisition strategy, (iii) investments and new product development, (iv) growth
opportunities related to awarded business, and (v) operational expectations. Forward-looking statements may be identified by the
words “will,” “may,” “should,” “designed to,” “believes,” “plans,”
“projects,” “intends,” “expects,” “estimates,” “anticipates,” “continue,”
and similar words and expressions. The forward-looking statements are subject to risks and uncertainties that could cause actual
events or results to differ materially from those expressed in or implied by the statements. Important factors that could cause
actual results to differ materially from those in the forward-looking statements include, among other factors:
| · | the
impact of COVID-19, or other future pandemics, on the global economy, and on our customers,
suppliers, employees, business and cash flows; |
| · | the
reduced purchases, loss or bankruptcy of a major customer or supplier; |
| · | the
costs and timing of business realignment, facility closures or similar actions; |
| · | a
significant change in automotive, commercial, off-highway, motorcycle or agricultural
vehicle production; |
| · | competitive
market conditions and resulting effects on sales and pricing; |
| · | the
impact of changes in foreign currency exchange rates on sales, costs and results, particularly
the Argentinian peso, Brazilian real, Chinese renminbi, euro, Mexican peso and Swedish
krona; |
| · | our
ability to achieve cost reductions that offset or exceed customer-mandated selling price
reductions; |
| · | customer
acceptance of new products; |
| · | our
ability to successfully launch/produce products for awarded business; |
| · | adverse
changes in laws, government regulations or market conditions, including tariffs, affecting
our products or our customers’ products; |
| · | our
ability to protect our intellectual property and successfully defend against assertions
made against us; |
| · | liabilities
arising from warranty claims, product recall or field actions, product liability and
legal proceedings to which we are or may become a party, or the impact of product recall
or field actions on our customers; |
| · | labor
disruptions at our facilities or at any of our significant customers or suppliers; |
| · | business
disruption due to natural disasters or other disasters outside of our control, such as
the recent coronavirus outbreak; |
| · | the
ability of our suppliers to supply us with parts and components at competitive prices
on a timely basis, including the impact of potential tariffs and trade considerations
on their operations and output; |
| · | the
amount of our indebtedness and the restrictive covenants contained in the agreements
governing our indebtedness, including our revolving credit facility; |
| · | capital
availability or costs, including changes in interest rates or market perceptions; |
| · | the
failure to achieve the successful integration of any acquired company or business; |
| · | risks
related to a failure of our information technology systems and networks, and risks associated
with current and emerging technology threats and damage from computer viruses, unauthorized
access, cyber-attack and other similar disruptions; and |
| · | the
items described in Part I, Item IA (“Risk Factors”) of our 10-K filed with
the SEC. |
The forward-looking statements contained herein represent our
estimates only as of the date of this release and should not be relied upon as representing our estimates as of any subsequent
date. While we may elect to update these forward-looking statements at some point in the future, we specifically disclaim
any obligation to do so, whether to reflect actual results, changes in assumptions, changes in other factors affecting such forward-looking
statements or otherwise.
Use of Non-GAAP Financial
Information
This press release contains information about the Company’s financial results which is not presented
in accordance with accounting principles generally accepted in the United States (”GAAP”). Such non-GAAP financial
measures are reconciled to their closest GAAP financial measures at the end of this press release. The provision of these non-GAAP
financial measures for 2020 and 2019 is not intended to indicate that Stoneridge is explicitly or implicitly providing projections
on those non-GAAP financial measures, and actual results for such measures are likely to vary from those presented. The reconciliations
include all information reasonably available to the Company at the date of this press release and the adjustments that management
can reasonably predict.
Management believes the non-GAAP financial measures used in
this press release are useful to both management and investors in their analysis of the Company’s financial position and
results of operations. In particular, management believes that adjusted sales, adjusted gross profit and margin, adjusted operating
income (loss) and margin, adjusted net income (loss), adjusted earnings (loss) per share, adjusted EBITDA, adjusted EBITDA margin,
adjusted contribution margin, net debt, adjusted income (loss) before tax, adjusted income tax benefit and adjusted tax rate are
useful measures in assessing the Company’s financial performance by excluding certain items that are not indicative of the
Company’s core operating performance or that may obscure trends useful in evaluating the Company’s continuing operating
activities. Management also believes that these measures are useful to both management and investors in their analysis of the
Company’s results of operations and provide improved comparability between fiscal periods.
Adjusted sales, adjusted gross profit and margin, adjusted operating
income (loss) and margin, adjusted net income (loss), adjusted earnings (loss) per share and adjusted EBITDA, adjusted contribution
margin, net debt, adjusted income (loss) before tax and adjusted tax rate should not be considered in isolation or as a substitute
for gross profit, operating income (loss), net income (loss), earnings (loss) per share, debt, income (loss) before tax, income
tax benefit or tax rate, cash provided by operating activities or other income statement or cash flow statement data prepared
in accordance with GAAP.
For more information, contact
Matthew R. Horvath, Executive Director Investor Relations and Corporate Strategy ([email protected])
or Kelly K. Harvey, Director Investor Relations ([email protected])
1 The Company defines backlog as the estimated cumulative
awarded sales for the next five years (or “estimated sourced future sales”). Backlog as of December 31, 2020 excludes
previously awarded sales related to the particulate matter soot sensor products business due to the planned exit of this business
in 2021.
| CONSOLIDATED STATEMENTS OF OPERATIONS | |
| | |
| | |
| |
| | |
| | |
| | |
| |
| Year ended December 31, (in thousands,
except per share data) | |
2020 | | |
2019 | | |
2018 | |
| Net sales | |
$ | 648,006 | | |
$ | 834,289 | | |
$ | 866,199 | |
| Costs and expenses: | |
| | | |
| | | |
| | |
| Cost of goods sold | |
| 493,810 | | |
| 620,556 | | |
| 609,568 | |
| Selling, general and administrative | |
| 112,474 | | |
| 123,853 | | |
| 138,553 | |
| Gain on disposal of Non-core Products, net | |
| - | | |
| (33,599 | ) | |
| - | |
| Design and development | |
| 49,386 | | |
| 52,198 | | |
| 51,074 | |
| Operating (loss) income | |
| (7,664 | ) | |
| 71,281 | | |
| 67,004 | |
| Interest expense, net | |
| 6,124 | | |
| 4,324 | | |
| 4,720 | |
| Equity in earnings of investee | |
| (1,536 | ) | |
| (1,578 | ) | |
| (2,038 | ) |
| Other (income) expense, net | |
| (1,528 | ) | |
| 142 | | |
| (736 | ) |
| (Loss) income before income taxes | |
| (10,724 | ) | |
| 68,393 | | |
| 65,058 | |
| (Benefit) provision for income
taxes | |
| (2,774 | ) | |
| 8,102 | | |
| 11,210 | |
| Net (loss) income | |
$ | (7,950 | ) | |
$ | 60,291 | | |
$ | 53,848 | |
| | |
| | | |
| | | |
| | |
| (Loss) earnings per share: | |
| | | |
| | | |
| | |
| Basic | |
$ | (0.29 | ) | |
$ | 2.17 | | |
$ | 1.90 | |
| Diluted | |
$ | (0.29 | ) | |
$ | 2.13 | | |
$ | 1.85 | |
| Weighted-average shares outstanding: | |
| | | |
| | | |
| | |
| Basic | |
| 27,025 | | |
| 27,792 | | |
| 28,402 | |
| Diluted | |
| 27,025 | | |
| 28,270 | | |
| 29,080 | |
| CONSOLIDATED BALANCE SHEETS | |
| | |
| |
| | |
| | |
| |
| December 31, (in thousands) | |
2020 | | |
2019 | |
| ASSETS | |
| | | |
| | |
| Current assets: | |
| | | |
| | |
| Cash and cash equivalents | |
$ | 73,919 | | |
$ | 69,403 | |
| Accounts receivable, less reserves of $817 and $1,289,
respectively | |
| 136,745 | | |
| 138,564 | |
| Inventories, net | |
| 90,548 | | |
| 93,449 | |
| Prepaid expenses and other current
assets | |
| 33,452 | | |
| 29,850 | |
| Total current assets | |
| 334,664 | | |
| 331,266 | |
| Long-term assets: | |
| | | |
| | |
| Property, plant and equipment, net | |
| 119,324 | | |
| 122,483 | |
| Intangible assets, net | |
| 55,394 | | |
| 58,122 | |
| Goodwill | |
| 39,104 | | |
| 35,874 | |
| Operating lease right-of-use asset | |
| 18,944 | | |
| 22,027 | |
| Investments and other long-term
assets, net | |
| 53,978 | | |
| 32,437 | |
| Total long-term assets | |
| 286,744 | | |
| 270,943 | |
| Total assets | |
$ | 621,408 | | |
$ | 602,209 | |
| | |
| | | |
| | |
| LIABILITIES AND SHAREHOLDERS' EQUITY | |
| | | |
| | |
| Current liabilities: | |
| | | |
| | |
| Current portion of debt | |
$ | 7,673 | | |
$ | 2,672 | |
| Accounts payable | |
| 86,103 | | |
| 80,701 | |
| Accrued expenses and other current
liabilities | |
| 52,272 | | |
| 55,223 | |
| Total current liabilities | |
| 146,048 | | |
| 138,596 | |
| Long-term liabilities: | |
| | | |
| | |
| Revolving credit facility | |
| 136,000 | | |
| 126,000 | |
| Long-term debt, net | |
| - | | |
| 454 | |
| Deferred income taxes | |
| 12,935 | | |
| 12,530 | |
| Operating lease long-term liability | |
| 15,434 | | |
| 17,971 | |
| Other long-term liabilities | |
| 14,357 | | |
| 16,754 | |
| Total long-term liabilities | |
| 178,726 | | |
| 173,709 | |
| Shareholders' equity: | |
| | | |
| | |
| Preferred Shares, without par value, 5,000 shares authorized, none issued | |
| - | | |
| - | |
| Common Shares, without par value, 60,000 shares authorized,
28,966 and 28,966 shares issued and 27,006 and 27,408 shares outstanding at December 31, 2020 and 2019, respectively, with
no stated value | |
| - | | |
| - | |
| Additional paid-in capital | |
| 234,409 | | |
| 225,607 | |
| Common Shares held in treasury, 1,960 and 1,558 shares
at December 31, 2020 and 2019, respectively, at cost | |
| (60,482 | ) | |
| (50,773 | ) |
| Retained earnings | |
| 212,342 | | |
| 206,542 | |
| Accumulated other comprehensive
loss | |
| (89,635 | ) | |
| (91,472 | ) |
| Total shareholders' equity | |
| 296,634 | | |
| 289,904 | |
| Total liabilities and shareholders'
equity | |
$ | 621,408 | | |
$ | 602,209 | |
| CONSOLIDATED STATEMENTS OF CASH FLOWS | |
| | |
| | |
| |
| | |
| | |
| | |
| |
| Year ended December 31, (in thousands) | |
2020 | | |
2019 | | |
2018 | |
| OPERATING ACTIVITIES: | |
| | | |
| | | |
| | |
| Net (loss) income | |
$ | (7,950 | ) | |
$ | 60,291 | | |
$ | 53,848 | |
| Adjustments to reconcile net income to net cash provided
by (used for) operating activities: | |
| | | |
| | | |
| | |
| Depreciation | |
| 27,309 | | |
| 24,904 | | |
| 22,786 | |
| Amortization, including accretion
and write-off of deferred financing costs | |
| 5,926 | | |
| 6,579 | | |
| 6,731 | |
| Deferred income taxes | |
| (7,953 | ) | |
| 5,586 | | |
| 2,552 | |
| Earnings of equity method investee | |
| (1,536 | ) | |
| (1,578 | ) | |
| (2,038 | ) |
| Loss (gain) on sale of fixed
assets | |
| 185 | | |
| (98 | ) | |
| 333 | |
| Share-based compensation expense | |
| 5,888 | | |
| 6,191 | | |
| 5,632 | |
| Excess tax benefit related to
share-based compensation expense | |
| (46 | ) | |
| (1,289 | ) | |
| (1,584 | ) |
| Gain on disposal of Non-core
Products, net | |
| - | | |
| (33,599 | ) | |
| - | |
| Property, plant and equipment
impairment charge | |
| 2,349 | | |
| - | | |
| - | |
| Intangible impairment charge | |
| - | | |
| - | | |
| 202 | |
| Change in fair value of earn-out
contingent consideration | |
| (3,196 | ) | |
| 2,308 | | |
| 213 | |
| Changes in operating assets and liabilities: | |
| | | |
| | | |
| | |
| Accounts receivable, net | |
| 4,164 | | |
| (1,353 | ) | |
| (3,575 | ) |
| Inventories, net | |
| 4,000 | | |
| (15,653 | ) | |
| (10,002 | ) |
| Prepaid expenses and other assets | |
| 1,342 | | |
| (8,898 | ) | |
| 2,291 | |
| Accounts payable | |
| 3,642 | | |
| (6,980 | ) | |
| 11,054 | |
| Accrued
expenses and other liabilities | |
| (5,483 | ) | |
| (11,906 | ) | |
| (7,671 | ) |
| Net cash
provided by operating activities | |
| 28,641 | | |
| 24,505 | | |
| 80,772 | |
| | |
| | | |
| | | |
| | |
| INVESTING ACTIVITIES: | |
| | | |
| | | |
| | |
| Capital expenditures, including intangibles | |
| (32,462 | ) | |
| (39,467 | ) | |
| (29,027 | ) |
| Proceeds from sale of fixed assets | |
| 127 | | |
| 382 | | |
| 111 | |
| Insurance proceeds for fixed assets | |
| - | | |
| - | | |
| 1,403 | |
| Proceeds from disposal of Non-core Products | |
| - | | |
| 34,386 | | |
| - | |
| Investment in venture capital fund | |
| (1,550 | ) | |
| (1,600 | ) | |
| (437 | ) |
| Net cash
used for investing activities | |
| (33,885 | ) | |
| (6,299 | ) | |
| (27,950 | ) |
| | |
| | | |
| | | |
| | |
| FINANCING ACTIVITIES: | |
| | | |
| | | |
| | |
| Revolving credit facility borrowings | |
| 71,500 | | |
| 112,000 | | |
| 27,500 | |
| Revolving credit facility payments | |
| (61,500 | ) | |
| (82,000 | ) | |
| (52,500 | ) |
| Proceeds from issuance of debt | |
| 41,104 | | |
| 2,208 | | |
| 415 | |
| Repayments of debt | |
| (36,749 | ) | |
| (1,587 | ) | |
| (5,071 | ) |
| Earn-out consideration cash payment | |
| - | | |
| (3,394 | ) | |
| - | |
| Other financing costs | |
| (1,074 | ) | |
| (1,366 | ) | |
| - | |
| Common Share repurchase program | |
| (4,995 | ) | |
| (50,000 | ) | |
| - | |
| Repurchase of Common Shares to
satisfy employee tax withholding | |
| (1,773 | ) | |
| (4,119 | ) | |
| (4,214 | ) |
| Net cash
provided by (used for) financing activities | |
| 6,513 | | |
| (28,258 | ) | |
| (33,870 | ) |
| | |
| | | |
| | | |
| | |
| Effect of exchange rate changes
on cash and cash equivalents | |
| 3,247 | | |
| (1,637 | ) | |
| (3,863 | ) |
| Net change in cash and cash equivalents | |
| 4,516 | | |
| (11,689 | ) | |
| 15,089 | |
| Cash and cash equivalents at beginning
of period | |
| 69,403 | | |
| 81,092 | | |
| 66,003 | |
| | |
| | | |
| | | |
| | |
| Cash and cash equivalents at
end of period | |
$ | 73,919 | | |
$ | 69,403 | | |
$ | 81,092 | |
| | |
| | | |
| | | |
| | |
| Supplemental disclosure of cash flow information: | |
| | | |
| | | |
| | |
| Cash paid for interest | |
$ | 5,620 | | |
$ | 4,401 | | |
$ | 4,997 | |
| Cash (received) paid for income
taxes, net | |
$ | (254 | ) | |
$ | 12,222 | | |
$ | 13,213 | |
| | |
| | | |
| | | |
| | |
| Supplemental disclosure of non-cash activity: | |
| | | |
| | | |
| | |
| Adoption of ASU 2019-12 (Note
2)* | |
$ | 13,750 | | |
$ | - | | |
$ | - | |
*Refer to Note 2 of the Form 10-K as of December 31, 2020
Regulation G Non-GAAP Financial Measure Reconciliations
Reconciliation to US GAAP
Exhibit 1 - Adjusted EPS
| Reconciliation of Adjusted EPS | |
| (USD in millions) | |
Q4 2020 | | |
Q4 2020 EPS | |
| Net Income | |
$ | 3.6 | | |
$ | 0.13 | |
| | |
| | | |
| | |
| Less: After-Tax Change in Fair Value of Earn-Out (Stoneridge Brazil) | |
| (0.2 | ) | |
| (0.01 | ) |
| Add: After-Tax Restructuring Costs | |
| 0.7 | | |
| 0.03 | |
| Less: After-Tax Earnings in Autotech Fund Investment | |
| 0.1 | | |
| 0.00 | |
| Add: After-Tax Impact of Valuation Allowance | |
| (1.0 | ) | |
| (0.04 | ) |
| Add: After-Tax Business Realignment Costs | |
| 0.4 | | |
| 0.02 | |
| Adjusted Net Income | |
$ | 3.7 | | |
$ | 0.14 | |
| Reconciliation of Adjusted EPS | |
| (USD in millions) | |
| 2020 | | |
| 2020 | |
| Net Income | |
$ | (8.0 | ) | |
$ | (0.29 | ) |
| | |
| | | |
| | |
| Less: After-Tax Change in Fair Value of Earn-Out (Stoneridge Brazil) | |
| (3.2 | ) | |
| (0.12 | ) |
| Add: After-Tax Restructuring Costs | |
| 7.6 | | |
| 0.28 | |
| Add: Pre-Tax Share-Based Comp Accelerated Vesting | |
| 0.1 | | |
| 0.00 | |
| Add: After-Tax Impact of Valuation Allowance | |
| (0.7 | ) | |
| (0.03 | ) |
| Add: After-Tax Business Realignment Costs | |
| 3.4 | | |
| 0.13 | |
| Adjusted Net Income | |
$ | (0.8 | ) | |
| (0.03 | ) |
Exhibit 2 – Adjusted Operating Income (Loss) by
Segment
| Reconciliation
of Control Devices Adjusted Operating Income (Loss) |
| (USD
in millions) | |
Q1
2019 | | |
Q2
2019 | | |
Q3
2019 | | |
Q4
2019 | | |
2019 | | |
Q1
2020 | | |
Q2
2020 | | |
Q3
2020 | | |
Q4
2020 | | |
2020 | |
| Control Devices Operating
Income (Loss) | |
$ | 11.9 | | |
$ | 44.4 | | |
$ | 9.8 | | |
$ | 7.2 | | |
$ | 73.3 | | |
$ | 7.3 | | |
$ | (9.7 | ) | |
$ | 12.5 | | |
$ | 12.0 | | |
$ | 22.1 | |
| | |
| | | |
| | | |
| | | |
| | | |
| | | |
| | | |
| | | |
| | | |
| | | |
| | |
| Add: Pre-Tax Restructuring
Costs | |
| 2.2 | | |
| 3.5 | | |
| 3.6 | | |
| 3.0 | | |
| 12.2 | | |
| 2.2 | | |
| 3.0 | | |
| 0.5 | | |
| 0.6 | | |
| 6.4 | |
| Less: Pre-Tax Gain from
Disposal of Non-Core Products | |
| - | | |
| (35.0 | ) | |
| - | | |
| - | | |
| (35.0 | ) | |
| - | | |
| - | | |
| - | | |
| - | | |
| - | |
| Add:
Pre-Tax Business Realignment Costs | |
| 0.5 | | |
| - | | |
| - | | |
| 0.2 | | |
| 0.7 | | |
| 0.4 | | |
| 1.0 | | |
| 0.3 | | |
| 0.1 | | |
| 1.8 | |
| Control
Devices Adjusted Operating Income (Loss) | |
$ | 14.7 | | |
$ | 12.9 | | |
$ | 13.3 | | |
$ | 10.4 | | |
$ | 51.3 | | |
$ | 9.9 | | |
$ | (5.6 | ) | |
$ | 13.3 | | |
$ | 12.6 | | |
$ | 30.2 | |
| Reconciliation of Electronics Adjusted Operating Income (Loss) |
| (USD
in millions) | |
| Q1
2019 | | |
| Q2
2019 | | |
| Q3
2019 | | |
| Q4
2019 | | |
| 2019 | | |
| Q1
2020 | | |
| Q2
2020 | | |
| Q3
2020 | | |
| Q4
2020 | | |
| 2020 | |
| Electronics Operating
Income (Loss) | |
$ | 9.0 | | |
$ | 7.6 | | |
$ | 7.7 | | |
$ | 0.8 | | |
$ | 25.0 | | |
$ | 2.9 | | |
$ | (11.0 | ) | |
$ | 0.6 | | |
$ | 3.9 | | |
$ | (3.7 | ) |
| | |
| | | |
| | | |
| | | |
| | | |
| | | |
| | | |
| | | |
| | | |
| | | |
| | |
| Add: Pre-Tax Restructuring
Costs | |
| 0.2 | | |
| 0.1 | | |
| 0.1 | | |
| 0.2 | | |
| 0.6 | | |
| 0.0 | | |
| 1.6 | | |
| 0.6 | | |
| 0.2 | | |
| 2.4 | |
| Add: Pre-Tax Business Realignment
Costs | |
| - | | |
| - | | |
| - | | |
| 0.1 | | |
| 0.1 | | |
| - | | |
| 1.3 | | |
| 0.1 | | |
| 0.3 | | |
| 1.7 | |
| Less: Pre-Tax Capitalized
Software Development Expensed in Q1 and Q2 | |
| - | | |
| - | | |
| (0.8 | ) | |
| - | | |
| (0.8 | ) | |
| - | | |
| - | | |
| - | | |
| - | | |
| - | |
| Add:
Pre-Tax Capitalized Software Development Capitalized in Q3 | |
| 0.2 | | |
| 0.7 | | |
| - | | |
| - | | |
| 0.8 | | |
| - | | |
| - | | |
| - | | |
| - | | |
| - | |
| Electronics
Adjusted Operating Income (Loss) | |
$ | 9.4 | | |
$ | 8.3 | | |
$ | 6.9 | | |
$ | 1.0 | | |
$ | 25.7 | | |
$ | 2.9 | | |
$ | (8.1 | ) | |
$ | 1.3 | | |
$ | 4.3 | | |
$ | 0.4 | |
| Reconciliation of Stoneridge Brazil Adjusted Operating Income (Loss) |
| (USD
in millions) | |
| Q1
2019 | | |
| Q2
2019 | | |
| Q3
2019 | | |
| Q4
2019 | | |
| 2019 | | |
| Q1
2020 | | |
| Q2
2020 | | |
| Q3
2020 | | |
| Q4
2020 | | |
| 2020 | |
| Stoneridge Brazil
Operating Income (Loss) | |
$ | 0.7 | | |
$ | 6.4 | | |
$ | (0.5 | ) | |
$ | (0.1 | ) | |
$ | 6.5 | | |
$ | 0.9 | | |
$ | (0.9 | ) | |
$ | 3.4 | | |
$ | 0.3 | | |
$ | 3.8 | |
| | |
| | | |
| | | |
| | | |
| | | |
| | | |
| | | |
| | | |
| | | |
| | | |
| | |
| Add(Less): Pre-Tax Change
in Fair Value of Earn-Out (Stoneridge Brazil) | |
| 0.5 | | |
| 0.5 | | |
| 0.9 | | |
| 0.4 | | |
| 2.3 | | |
| (0.6 | ) | |
| 0.4 | | |
| (2.8 | ) | |
| (0.2 | ) | |
| (3.2 | ) |
| Less: Pre-Tax Recovery
of Brazilian Indirect Taxes | |
| - | | |
| (6.5 | ) | |
| - | | |
| - | | |
| (6.5 | ) | |
| - | | |
| - | | |
| - | | |
| - | | |
| - | |
| Add:
Pre-Tax Business Realignment Costs | |
| - | | |
| - | | |
| - | | |
| - | | |
| - | | |
| 0.2 | | |
| - | | |
| 0.0 | | |
| 0.1 | | |
| 0.2 | |
| Stoneridge
Brazil Adjusted Operating Income (Loss) | |
$ | 1.1 | | |
$ | 0.4 | | |
$ | 0.5 | | |
$ | 0.4 | | |
$ | 2.4 | | |
$ | 0.4 | | |
$ | (0.5 | ) | |
$ | 0.6 | | |
$ | 0.1 | | |
$ | 0.7 | |
Exhibit 3 – Adjusted Operating Income (Loss)
| Reconciliation
of Adjusted Operating Income (Loss) |
| (USD
in millions) | |
Q1
2019 | | |
Q2
2019 | | |
Q3
2019 | | |
Q4
2019 | | |
2019 | | |
Q1
2020 | | |
Q2
2020 | | |
Q3
2020 | | |
Q4
2020 | | |
2020 | |
| Operating
Income (Loss) | |
$ | 11.7 | | |
$ | 49.2 | | |
$ | 9.3 | | |
$ | 1.1 | | |
$ | 71.3 | | |
$ | 3.7 | | |
$ | (26.8 | ) | |
$ | 9.8 | | |
$ | 5.7 | | |
$ | (7.7 | ) |
| | |
| | | |
| | | |
| | | |
| | | |
| | | |
| | | |
| | | |
| | | |
| | | |
| | |
| Add(Less):
Pre-Tax Change in Fair Value of Earn-Out (Stoneridge Brazil) | |
| 0.5 | | |
| 0.5 | | |
| 0.9 | | |
| 0.4 | | |
| 2.3 | | |
| (0.6 | ) | |
| 0.4 | | |
| (2.8 | ) | |
| (0.2 | ) | |
| (3.2 | ) |
| Add(Less):
Pre-Tax Loss (Earnings) in Autotech Fund Investment | |
| - | | |
| - | | |
| | | |
| 0.2 | | |
| 0.2 | | |
| 0.0 | | |
| 0.1 | | |
| (0.3 | ) | |
| 0.2 | | |
| - | |
| Add:
Pre-Tax Restructuring Costs | |
| 2.8 | | |
| 3.6 | | |
| 3.7 | | |
| 3.4 | | |
| 13.4 | | |
| 2.2 | | |
| 4.6 | | |
| 1.1 | | |
| 0.8 | | |
| 8.8 | |
| Add:
Pre-Tax Share-Based Comp Accelerated Vesting | |
| - | | |
| 0.5 | | |
| 0.2 | | |
| - | | |
| 0.7 | | |
| 0.1 | | |
| 0.0 | | |
| - | | |
| - | | |
| 0.1 | |
| Add:
Pre-Tax Business Realignment Costs | |
| 1.1 | | |
| - | | |
| 0.4 | | |
| 0.3 | | |
| 1.8 | | |
| 0.6 | | |
| 2.6 | | |
| 0.4 | | |
| 0.4 | | |
| 4.0 | |
| Less:
Pre-Tax Gain from Disposal of Non-Core Products | |
| - | | |
| (33.9 | ) | |
| - | | |
| - | | |
| (33.9 | ) | |
| - | | |
| - | | |
| - | | |
| - | | |
| - | |
| Less:
Pre-Tax Recovery of Brazilian Indirect Taxes | |
| - | | |
| (6.5 | ) | |
| - | | |
| - | | |
| (6.5 | ) | |
| - | | |
| - | | |
| - | | |
| - | | |
| - | |
| Less:
Pre-Tax One-Time Sale of Non-Core Product Inventory | |
| - | | |
| (1.4 | ) | |
| - | | |
| - | | |
| (1.4 | ) | |
| - | | |
| - | | |
| - | | |
| - | | |
| - | |
| Less:
Pre-Tax Capitalized Software Development Expensed in Q1 and Q2 | |
| - | | |
| - | | |
| (0.8 | ) | |
| - | | |
| (0.8 | ) | |
| - | | |
| - | | |
| - | | |
| - | | |
| - | |
| Add:
Pre-Tax Capitalized Software Development Capitalized in Q3 | |
| 0.2 | | |
| 0.7 | | |
| | | |
| - | | |
| 0.8 | | |
| - | | |
| - | | |
| - | | |
| - | | |
| - | |
| Adjusted
Operating Income (Loss) | |
$ | 16.2 | | |
$ | 12.6 | | |
$ | 13.7 | | |
$ | 5.5 | | |
$ | 48.0 | | |
$ | 6.0 | | |
$ | (19.1 | ) | |
$ | 8.2 | | |
$ | 7.0 | | |
$ | 2.1 | |
Exhibit 4 – Adjusted EBITDA
| Reconciliation
of Adjusted EBITDA |
| (USD
in millions) | |
Q1
2019 | | |
Q2
2019 | | |
Q3
2019 | | |
Q4
2019 | | |
2019 | | |
Q1
2020 | | |
Q2
2020 | | |
Q3
2020 | | |
Q4
2020 | | |
2020 | |
| Income
(Loss) Before Tax | |
$ | 11.5 | | |
$ | 48.8 | | |
$ | 8.1 | | |
$ | (0.0 | ) | |
$ | 68.4 | | |
$ | 4.7 | | |
$ | (28.5 | ) | |
$ | 8.5 | | |
$ | 4.5 | | |
$ | (10.7 | ) |
| Interest
expense, net | |
| 1.0 | | |
| 1.0 | | |
| 1.1 | | |
| 1.2 | | |
| 4.3 | | |
| 1.0 | | |
| 1.4 | | |
| 1.9 | | |
| 1.8 | | |
| 6.1 | |
| Depreciation
and amortization | |
| 7.2 | | |
| 7.6 | | |
| 7.9 | | |
| 8.1 | | |
| 30.9 | | |
| 8.1 | | |
| 7.9 | | |
| 8.1 | | |
| 8.6 | | |
| 32.7 | |
| EBITDA | |
$ | 19.7 | | |
$ | 57.4 | | |
$ | 17.1 | | |
$ | 9.3 | | |
$ | 103.6 | | |
$ | 13.8 | | |
$ | (19.2 | ) | |
$ | 18.5 | | |
$ | 14.9 | | |
$ | 28.1 | |
| Add(Less):
Pre-Tax Change in Fair Value of Earn-Out (Stoneridge Brazil) | |
| 0.5 | | |
| 0.5 | | |
| 0.9 | | |
| 0.4 | | |
| 2.3 | | |
| (0.6 | ) | |
| 0.4 | | |
| (2.8 | ) | |
| (0.2 | ) | |
| (3.2 | ) |
| Add(Less):
Pre-Tax Loss (Earnings) in Autotech Fund Investment | |
| (0.0 | ) | |
| - | | |
| - | | |
| 0.2 | | |
| 0.2 | | |
| 0.0 | | |
| 0.1 | | |
| (0.3 | ) | |
| 0.2 | | |
| - | |
| Add:
Pre-Tax Restructuring Costs | |
| 2.8 | | |
| 3.6 | | |
| 3.7 | | |
| 3.4 | | |
| 13.4 | | |
| 2.2 | | |
| 4.6 | | |
| 1.1 | | |
| 0.8 | | |
| 8.8 | |
| Add:
Pre-Tax Business Realignment Costs | |
| 1.1 | | |
| - | | |
| 0.4 | | |
| 0.3 | | |
| 1.8 | | |
| 0.6 | | |
| 2.6 | | |
| 0.4 | | |
| 0.4 | | |
| 4.0 | |
| Less:
Pre-Tax Gain from Disposal of Non-Core Products | |
| - | | |
| (33.9 | ) | |
| - | | |
| - | | |
| (33.9 | ) | |
| - | | |
| - | | |
| - | | |
| - | | |
| - | |
| Less:
Pre-Tax Recovery of Brazilian Indirect Taxes | |
| - | | |
| (6.5 | ) | |
| - | | |
| - | | |
| (6.5 | ) | |
| - | | |
| - | | |
| - | | |
| - | | |
| - | |
| Add:
Pre-Tax Share-Based Comp Accelerated Vesting | |
| - | | |
| 0.5 | | |
| 0.2 | | |
| - | | |
| 0.7 | | |
| 0.1 | | |
| 0.0 | | |
| - | | |
| - | | |
| 0.1 | |
| Less:
Pre-Tax Capitalized Software Development Expensed in Q1 and Q2 | |
| - | | |
| - | | |
| (0.8 | ) | |
| - | | |
| (0.8 | ) | |
| - | | |
| - | | |
| - | | |
| - | | |
| - | |
| Add:
Pre-Tax Capitalized Software Development Capitalized in Q3 | |
| 0.2 | | |
| 0.7 | | |
| - | | |
| - | | |
| 0.8 | | |
| - | | |
| - | | |
| - | | |
| - | | |
| - | |
| Less:
Pre-Tax One-Time Sale of Non-Core Product Inventory | |
| - | | |
| (1.4 | ) | |
| - | | |
| - | | |
| (1.4 | ) | |
| - | | |
| - | | |
| - | | |
| - | | |
| - | |
| Adjusted
EBITDA | |
$ | 24.2 | | |
$ | 20.9 | | |
$ | 21.5 | | |
$ | 13.7 | | |
$ | 80.3 | | |
$ | 16.1 | | |
$ | (11.4 | ) | |
$ | 16.9 | | |
$ | 16.2 | | |
$ | 37.9 | |
Exhibit 5 – Adjusted Gross Profit
| Reconciliation
of Adjusted Gross Profit |
| (USD
in millions) | |
Q1
2019 | | |
Q2
2019 | | |
Q3
2019 | | |
Q4
2019 | | |
2019 | | |
Q1
2020 | | |
Q2
2020 | | |
Q3
2020 | | |
Q4
2020 | | |
2020 | |
| Gross
Profit | |
$ | 60.9 | | |
$ | 56.8 | | |
$ | 51.9 | | |
$ | 44.2 | | |
$ | 213.7 | | |
$ | 45.4 | | |
$ | 13.3 | | |
$ | 46.0 | | |
$ | 49.6 | | |
$ | 154.2 | |
| | |
| | | |
| | | |
| | | |
| | | |
| | | |
| | | |
| | | |
| | | |
| | | |
| | |
| Add:
Pre-Tax Restructuring Costs | |
| 1.3 | | |
| 2.4 | | |
| 2.5 | | |
| 1.5 | | |
| 7.6 | | |
| 1.5 | | |
| 0.2 | | |
| 0.6 | | |
| 0.3 | | |
| 2.6 | |
| Less:
Pre-Tax One-Time Sale of Non-Core Product Inventory | |
| - | | |
| (1.4 | ) | |
| - | | |
| - | | |
| (1.4 | ) | |
| - | | |
| - | | |
| - | | |
| - | | |
| - | |
| Add:
Pre-Tax Business Realignment Costs | |
| - | | |
| - | | |
| - | | |
| - | | |
| - | | |
| 0.1 | | |
| 0.9 | | |
| 0.1 | | |
| 0.1 | | |
| 1.2 | |
| Adjusted
Gross Profit | |
$ | 62.1 | | |
$ | 57.8 | | |
$ | 54.4 | | |
$ | 45.6 | | |
$ | 219.9 | | |
$ | 47.0 | | |
$ | 14.4 | | |
$ | 46.7 | | |
$ | 50.0 | | |
$ | 158.1 | |
Exhibit 6 – Adjusted Sales
| Reconciliation
of Adjusted Sales |
| (USD
in millions) | |
Q1
2019 | | |
Q2
2019 | | |
Q3
2019 | | |
Q4
2019 | | |
2019 | | |
Q1
2020 | | |
Q2
2020 | | |
Q3
2020 | | |
Q4
2020 | | |
2020 | |
| Sales | |
$ | 218.3 | | |
$ | 222.2 | | |
$ | 203.4 | | |
$ | 190.4 | | |
$ | 834.3 | | |
$ | 183.0 | | |
$ | 99.5 | | |
$ | 175.8 | | |
$ | 189.7 | | |
$ | 648.0 | |
| | |
| | | |
| | | |
| | | |
| | | |
| | | |
| | | |
| | | |
| | | |
| | | |
| | |
| Less:
Pre-Tax One-Time Sale of Non-Core Product Inventory | |
| - | | |
| (4.2 | ) | |
| - | | |
| - | | |
| (4.2 | ) | |
| - | | |
| - | | |
| - | | |
| - | | |
| - | |
| Adjusted
Sales | |
$ | 218.3 | | |
$ | 218.1 | | |
$ | 203.4 | | |
$ | 190.4 | | |
$ | 830.1 | | |
$ | 183.0 | | |
$ | 99.5 | | |
$ | 175.8 | | |
$ | 189.7 | | |
$ | 648.0 | |
| Reconciliation
of Adjusted Sales Excluding Disposed Non-Core Products |
| (USD
in millions) | |
| Q1
2019 | | |
| Q2
2019 | | |
| Q3
2019 | | |
| Q4
2019 | | |
| 2019 | | |
| Q1
2020 | | |
| Q2
2020 | | |
| Q3
2020 | | |
| Q4
2020 | | |
| 2020 | |
| Adjusted
Sales | |
$ | 218.3 | | |
$ | 218.1 | | |
$ | 203.4 | | |
$ | 190.4 | | |
$ | 830.1 | | |
$ | 183.0 | | |
$ | 99.5 | | |
$ | 175.8 | | |
$ | 189.7 | | |
$ | 648.0 | |
| | |
| | | |
| | | |
| | | |
| | | |
| | | |
| | | |
| | | |
| | | |
| | | |
| | |
| Less:
Pre-Tax Sales from Disposed Non-Core Products | |
| (11.1 | ) | |
| (9.1 | ) | |
| (10.8 | ) | |
| (6.5 | ) | |
| (37.4 | ) | |
| - | | |
| - | | |
| - | | |
| - | | |
| - | |
| Adjusted
Sales Excluding Disposed Non-Core Products | |
$ | 207.2 | | |
$ | 209.0 | | |
$ | 192.6 | | |
$ | 183.9 | | |
$ | 792.7 | | |
$ | 183.0 | | |
$ | 99.5 | | |
$ | 175.8 | | |
$ | 189.7 | | |
$ | 648.0 | |
Exhibit 7 – Control Devices Adjusted Sales
| Reconciliation of Control Devices Adjusted Sales |
| (USD in millions) | |
Q4 2019 | | |
Q4 2020 | |
| Control Devices Sales | |
$ | 100.0 | | |
$ | 100.4 | |
| | |
| | | |
| | |
| Less: Pre-Tax One-Time Sale of Non-Core Product Inventory | |
| - | | |
| - | |
| Adjusted Control Devices Sales | |
$ | 100.0 | | |
$ | 100.4 | |
| Reconciliation of Control Devices Adjusted Sales Excluding Disposed Non-Core Products |
| (USD in millions) | |
| Q4 2019 | | |
| Q4 2020 | |
| Adjusted Control Devices Sales | |
$ | 100.0 | | |
$ | 100.4 | |
| | |
| | | |
| | |
| Less: Sales from Disposed Non-Core Products | |
| (6.5 | ) | |
| - | |
| Adjusted Control Devices Sales Excluding Disposed Non-Core Products | |
$ | 93.5 | | |
$ | 100.4 | |
Exhibit 8 – Control Devices Adjusted Operating Income
Excluding Disposed Non-Core Products
| Reconciliation of Control Devices Adjusted Operating Income Excluding Disposed Non-Core Products |
| (USD in millions) | |
Q4 2019 | | |
Q4 2020 | |
| Adjusted Operating Income | |
$ | 10.4 | | |
$ | 12.6 | |
| | |
| | | |
| | |
| Less: Pre-Tax Gain from Disposed Non-Core Products | |
| (0.4 | ) | |
| - | |
| Adjusted Operating Income Excluding Disposed Non-Core Products | |
$ | 10.0 | | |
$ | 12.6 | |
Exhibit 9 – Adjusted Tax Rate
| Reconciliation of Adjusted Tax Rate |
| (USD in millions) | |
2020 | |
| Loss Before Tax | |
$ | (10.7 | ) |
| | |
| | |
| Less: Pre-Tax Change in Fair Value of Earn-Out (Stoneridge Brazil) | |
| (3.2 | ) |
| Add: Pre-Tax Share-Based Comp Accelerated Vesting | |
| 0.1 | |
| Add: Pre-Tax Restructuring Costs | |
| 8.8 | |
| Add: Pre-Tax Business Realignment Costs | |
| 4.0 | |
| Adjusted Loss Before Tax | |
$ | (1.0 | ) |
| | |
| | |
| Income Tax Benefit | |
$ | (2.8 | ) |
| | |
| | |
| Add: Tax Impact From Pre-Tax Adjustments | |
| 1.9 | |
| Add: After-Tax Impact of Valuation Allowance | |
| 0.7 | |
| | |
| | |
| Adjusted Income Tax Benefit | |
$ | (0.2 | ) |
| | |
| | |
| Adjusted Tax Rate | |
| 19.7 | % |
Full - Year and Q4 2020 Results February 25, 2021 Exhibit 99.2
2 Forward - Looking Statements Statements in this presentation that are not historical facts are forward - looking statements, which involve risks and uncertaint ies that could cause actual events or results to differ materially from those expressed or implied by the statements. Important factors that ma y cause actual results to differ materially from those in the forward - looking statements include, among other factors, the impact of COVID - 19, or other future pandemics, on the global economy, and on our customers, suppliers, employees, business and cash flows; the reduced purchases, lo ss or bankruptcy of a major customer or supplier; the costs and timing of facility closures, business realignment or similar action s; a significant change in automotive, commercial, off - highway, motorcycle and agricultural vehicle production; competitive market conditions and resulting effects on sales and pricing; our ability to successfully launch/produce products for awarded business; adverse changes in la ws, government regulations or market conditions, including tariffs, affecting our products or customers products; labor disruptions at Stone rid ge’s facilities or at any of Stoneridge’s significant customers or suppliers; the ability of suppliers to supply Stoneridge with parts and compo nen ts at competitive prices on a timely basis; the amount of Stoneridge’s indebtedness and the restrictive covenants contained in the agr eements governing its indebtedness, including its revolving credit facility; customer acceptance of new products; capital availabilit y o r costs, including changes in interest rates or market perceptions; the failure to achieve successful integration of any acquired company or bus ine ss; the occurrence or non - occurrence of circumstances beyond Stoneridge’s control; and the items described in “Risk Factors” and other uncertainties or risks discussed in Stoneridge’s periodic and current reports filed with the Securities and Exchange Commissi on. Important factors that could cause the performance of the commercial vehicle and automotive industry to differ materially fro m t hose in the forward - looking statements include factors such as (1) continued economic instability or poor economic conditions in the United States and global markets, (2) changes in economic conditions, housing prices, foreign currency exchange rates, commodity prices, includ ing shortages of and increases or volatility in the price of oil, (3) changes in laws and regulations, (4) the state of the credit markets, (5 ) political stability, (6) international conflicts and (7) the occurrence of force majeure events. These factors should not be construed as exhaustive and should be considered with the other cautionary statements in Stonerid ge’ s filings with the Securities and Exchange Commission. Forward - looking statements are not guarantees of future performance; Stoneridge’s actual results of operations, financial condit ion and liquidity, and the development of the industry in which Stoneridge operates may differ materially from those described in or sug gested by the forward - looking statements contained in this presentation. In addition, even if Stoneridge’s results of operations, financial co ndition and liquidity, and the development of the industry in which Stoneridge operates are consistent with the forward - looking statements c ontained in this presentation, those results or developments may not be indicative of results or developments in subsequent periods. This presentation contains time - sensitive information that reflects management’s best analysis only as of the date of this prese ntation. Any forward - looking statements in this presentation speak only as of the date of this presentation, and Stoneridge undertakes no obl igation to update such statements. Comparisons of results for current and any prior periods are not intended to express any future tren ds or indications of future performance, unless expressed as such, and should only be viewed as historical data. Stoneridge does not undertake any obligation to publicly update or revise any forward - looking statement as a result of new infor mation, future events or otherwise, except as otherwise required by law. Rounding Disclosure: There may be slight immaterial differences between figures represented in our public filings compared t o w hat is shown in this presentation. The differences are the result of rounding due to the representation of values in millions rathe r t han thousands in public filings.
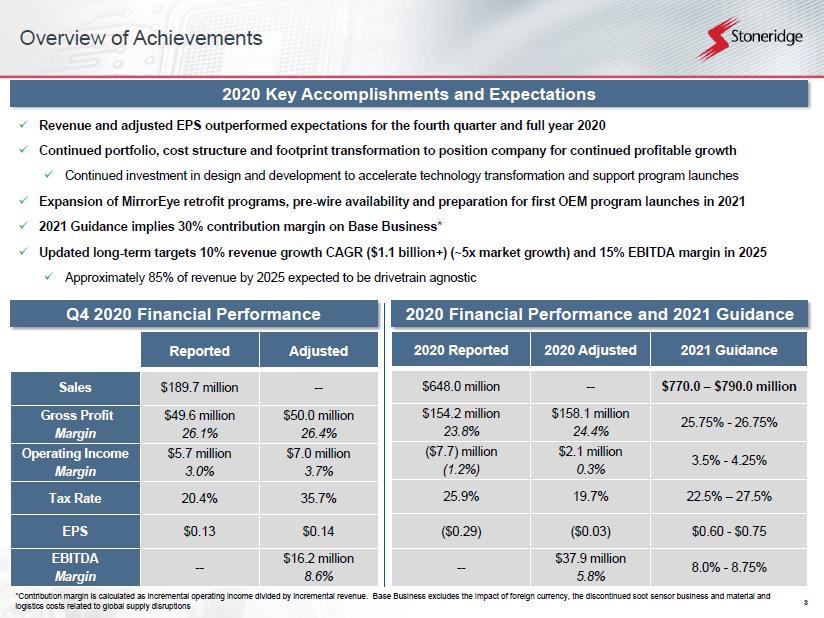
3 Overview of Achievements x Revenue and adjusted EPS outperformed expectations for the fourth quarter and full year 2020 x Continued portfolio, cost structure and footprint transformation to position company for continued profitable growth x Continued investment in design and development to accelerate technology transformation and support program launches x Expansion of MirrorEye retrofit programs, pre - wire availability and preparation for first OEM program launches in 2021 x 2021 Guidance implies 30% contribution margin on Base Business* x Updated long - term targets 10% revenue growth CAGR ($1.1 billion+) (~5x market growth) and 15% EBITDA margin in 2025 x Approximately 85% of revenue by 2025 expected to be drivetrain agnostic 2020 Key Accomplishments and Expectations Q 4 2020 Financial Performance 2020 Financial Performance and 2021 Guidance 2020 Reported 2020 Adjusted 2021 Guidance $648.0 million -- $770.0 – $790.0 million $154.2 million 23.8% $158.1 million 24.4% 25.75% - 26.75% ($7.7) million (1.2%) $2.1 million 0.3% 3.5% - 4.25% 25.9% 19.7% 22.5% – 27.5% ($0.29) ($0.03) $0.60 - $0.75 -- $37.9 million 5.8% 8.0% - 8.75% Reported Adjusted Sales $189.7 million -- Gross Profit Margin $49.6 million 26.1% $50.0 million 26.4% Operating Income Margin $5.7 million 3.0% $7.0 million 3.7% Tax Rate 20.4% 35.7% EPS $0.13 $0.14 EBITDA Margin -- $16.2 million 8.6% *Contribution margin is calculated as incremental operating income divided by incremental revenue. Base Business excludes th e i mpact of foreign currency, the discontinued soot sensor business and material and logistics costs related to global supply disruptions
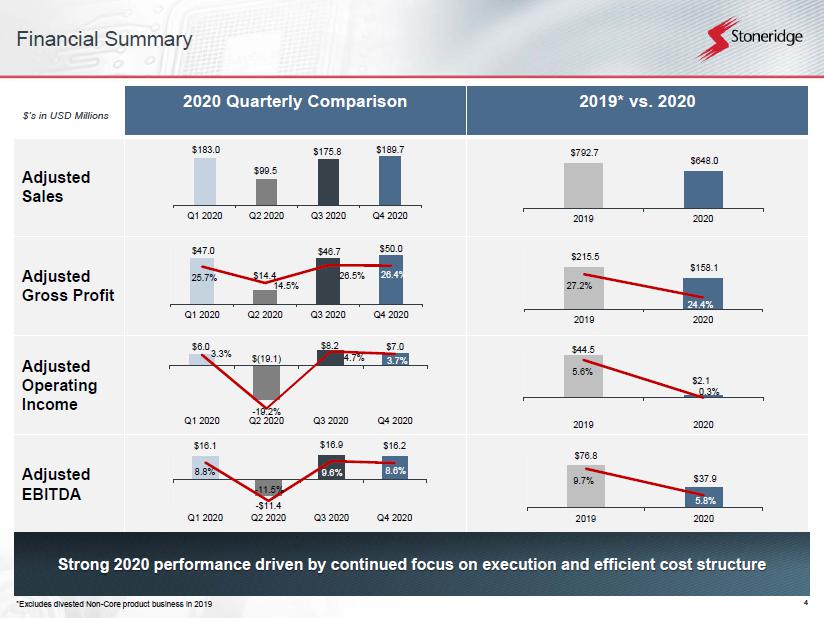
4 2020 Quarterly Comparison 2019* vs. 2020 Adjusted Sales Adjusted Gross Profit Adjusted Operating Income Adjusted EBITDA Financial Summary Strong 2020 performance driven by continued focus on execution and efficient cost structure $’s in USD Millions *Excludes divested Non - Core product business in 2019 $183.0 $99.5 $175.8 $189.7 Q1 2020 Q2 2020 Q3 2020 Q4 2020 $47.0 $14.4 $46.7 $50.0 25.7% 14.5% 26.5% 26.4% 0% 20% 40% $- $20.0 $40.0 $60.0 Q1 2020 Q2 2020 Q3 2020 Q4 2020 $792.7 $648.0 2019 2020 $6.0 $(19.1) $8.2 $7.0 3.3% - 19.2% 4.7% 3.7% Q1 2020 Q2 2020 Q3 2020 Q4 2020 $215.5 $158.1 27.2% 24.4% 23% 28% $- $100.0 $200.0 $300.0 2019 2020 $16.1 - $11.4 $16.9 $16.2 8.8% - 11.5% 9.6% 8.6% -15% -5% 5% 15% -20.0 0.0 20.0 Q1 2020 Q2 2020 Q3 2020 Q4 2020 $44.5 $2.1 5.6% 0.3% -1% 4% -10.0 10.0 30.0 50.0 2019 2020 $76.8 $37.9 9.7% 5.8% 4% 9% 0.0 50.0 100.0 2019 2020
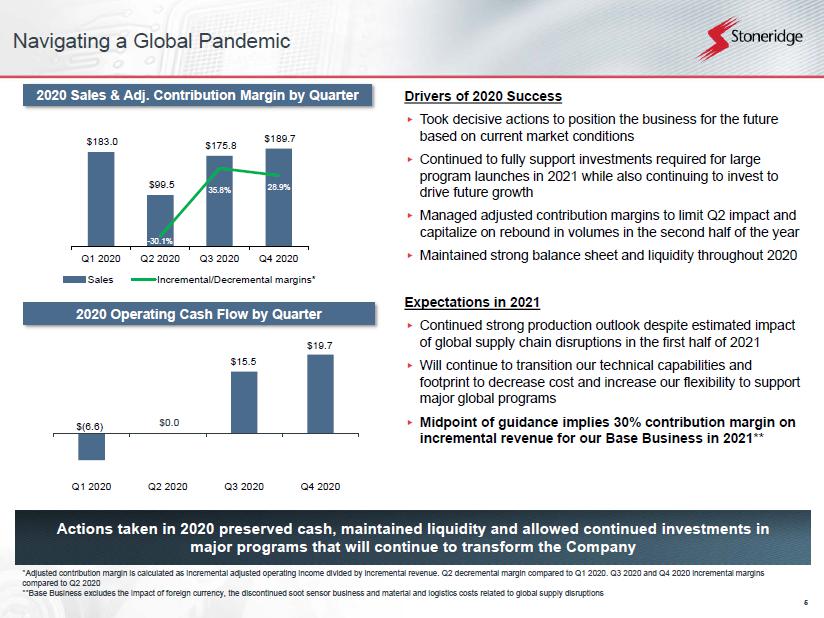
5 2020 Sales & Adj. Contribution Margin by Quarter *Adjusted contribution margin is calculated as incremental adjusted operating income divided by incremental revenue. Q2 decre men tal margin compared to Q1 2020. Q3 2020 and Q4 2020 incremental margins compared to Q2 2020 **Base Business excludes the impact of foreign currency, the discontinued soot sensor business and material and logistics cos ts related to global supply disruptions 2020 Operating Cash Flow by Quarter Drivers of 2020 Success ▸ Took decisive actions to position the business for the future based on current market conditions ▸ Continued to fully support investments required for large program launches in 2021 while also continuing to invest to drive future growth ▸ Managed adjusted contribution margins to limit Q2 impact and capitalize on rebound in volumes in the second half of the year ▸ Maintained strong balance sheet and liquidity throughout 2020 Expectations in 2021 ▸ Continued strong production outlook despite estimated impact of global supply chain disruptions in the first half of 2021 ▸ Will continue to transition our technical capabilities and footprint to decrease cost and increase our flexibility to support major global programs ▸ Midpoint of guidance implies 30% contribution margin on incremental revenue for our Base Business in 2021** $(6.6) $0.0 $15.5 $19.7 Q1 2020 Q2 2020 Q3 2020 Q4 2020 $183.0 $99.5 $175.8 $189.7 - 30.1% 35.8% 28.9% -40.0% -20.0% 0.0% 20.0% 40.0% 60.0% $- $50.0 $100.0 $150.0 $200.0 Q1 2020 Q2 2020 Q3 2020 Q4 2020 Sales Incremental/Decremental margins* Navigating a Global Pandemic Actions taken in 2020 preserved cash, maintained liquidity and allowed continued investments in major programs that will continue to transform the Company
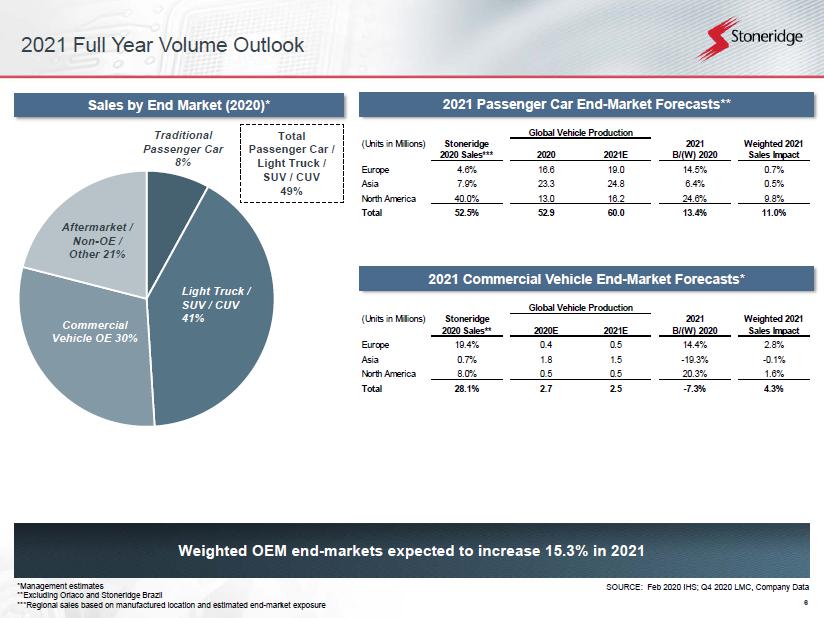
6 Weighted OEM end - markets expected to increase 15.3% in 2021 *Management estimates **Excluding Orlaco and Stoneridge Brazil ***Regional sales based on manufactured location and estimated end - market exposure Traditional Passenger Car 8% Commercial Vehicle OE 30% Aftermarket / Non - OE / Other 21% Sales by End Market ( 2020 )* 2021 Passenger Car End - Market Forecasts** SOURCE: Feb 2020 IHS; Q4 2020 LMC, Company Data 2021 Full Year Volume Outlook 2021 Commercial Vehicle End - Market Forecasts* (Units in Millions) Stoneridge 2020 Sales** 2020E 2021E 2021 B/(W) 2020 Weighted 2021 Sales Impact Europe 19.4% 0.4 0.5 14.4% 2.8% Asia 0.7% 1.8 1.5 -19.3% -0.1% North America 8.0% 0.5 0.5 20.3% 1.6% Total 28.1% 2.7 2.5 -7.3% 4.3% Global Vehicle Production Light Truck / SUV / CUV 41% Total Passenger Car / Light Truck / SUV / CUV 49% (Units in Millions) Stoneridge 2020 Sales*** 2020 2021E 2021 B/(W) 2020 Weighted 2021 Sales Impact Europe 4.6% 16.6 19.0 14.5% 0.7% Asia 7.9% 23.3 24.8 6.4% 0.5% North America 40.0% 13.0 16.2 24.6% 9.8% Total 52.5% 52.9 60.0 13.4% 11.0% Global Vehicle Production
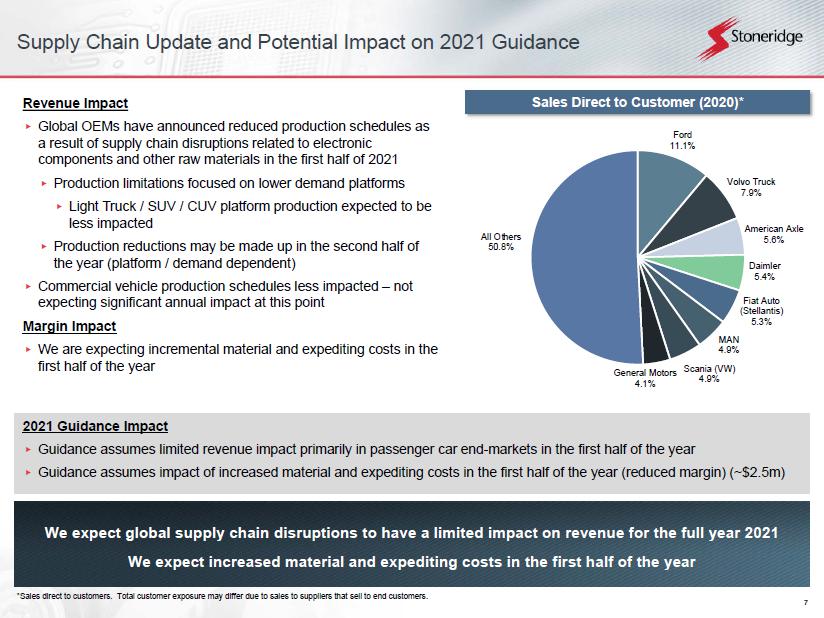
7 Supply Chain Update and Potential Impact on 2021 Guidance We expect global supply chain disruptions to have a limited impact on revenue for the full year 2021 We expect increased material and expediting costs in the first half of the year Revenue Impact ▸ Global OEMs have announced reduced production schedules as a result of supply chain disruptions related to electronic components and other raw materials in the first half of 2021 ▸ Production limitations focused on lower demand platforms ▸ Light Truck / SUV / CUV platform production expected to be less impacted ▸ Production reductions may be made up in the second half of the year (platform / demand dependent) ▸ Commercial vehicle production schedules less impacted – not expecting significant annual impact at this point Margin Impact ▸ We are expecting incremental material and expediting costs in the first half of the year 2021 Guidance Impact ▸ Guidance assumes limited revenue impact primarily in passenger car end - markets in the first half of the year ▸ Guidance assumes impact of increased material and expediting costs in the first half of the year (reduced margin) (~$2.5m) Ford 11.1% Volvo Truck 7.9% American Axle 5.6% Daimler 5.4% Fiat Auto (Stellantis) 5.3% MAN 4.9% Scania (VW) 4.9% General Motors 4.1% All Others 50.8% Sales Direct to Customer ( 2020 )* *Sales direct to customers. Total customer exposure may differ due to sales to suppliers that sell to end customers.
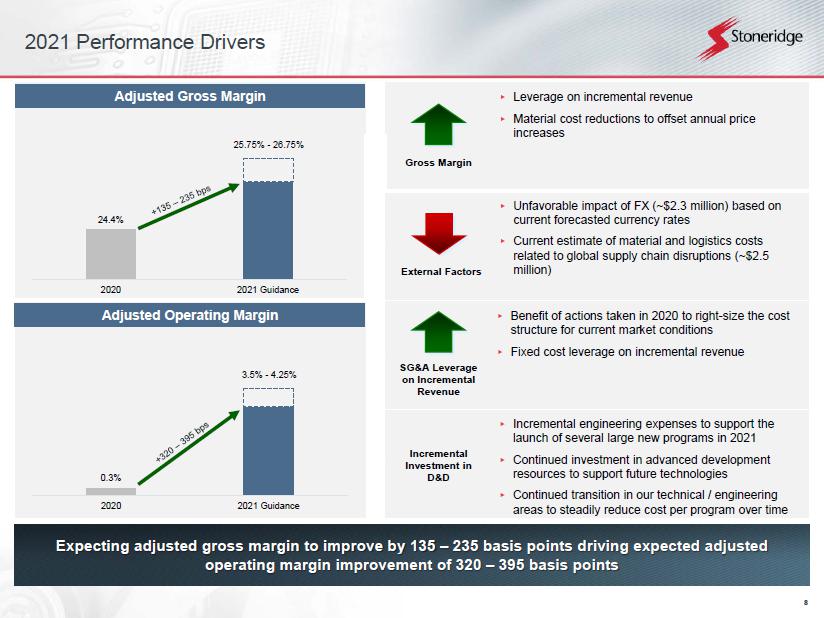
8 2021 Performance Drivers Expecting adjusted gross margin to improve by 135 – 235 basis points driving expected adjusted operating margin improvement of 320 – 395 basis points 24.4% 25.75% - 26.75% 2020 2021 Guidance 0.3% 3.5% - 4.25% 2020 2021 Guidance Adjusted Gross Margin Adjusted Operating Margin Gross Margin External Factors SG&A Leverage on Incremental Revenue Incremental Investment in D&D ▸ Leverage on incremental revenue ▸ Material cost reductions to offset annual price increases ▸ Unfavorable impact of FX (~$2.3 million) based on current forecasted currency rates ▸ Current estimate of material and logistics costs related to global supply chain disruptions (~$2.5 million) ▸ Benefit of actions taken in 2020 to right - size the cost structure for current market conditions ▸ Fixed cost leverage on incremental revenue ▸ Incremental engineering expenses to support the launch of several large new programs in 2021 ▸ Continued investment in advanced development resources to support future technologies ▸ Continued transition in our technical / engineering areas to steadily reduce cost per program over time
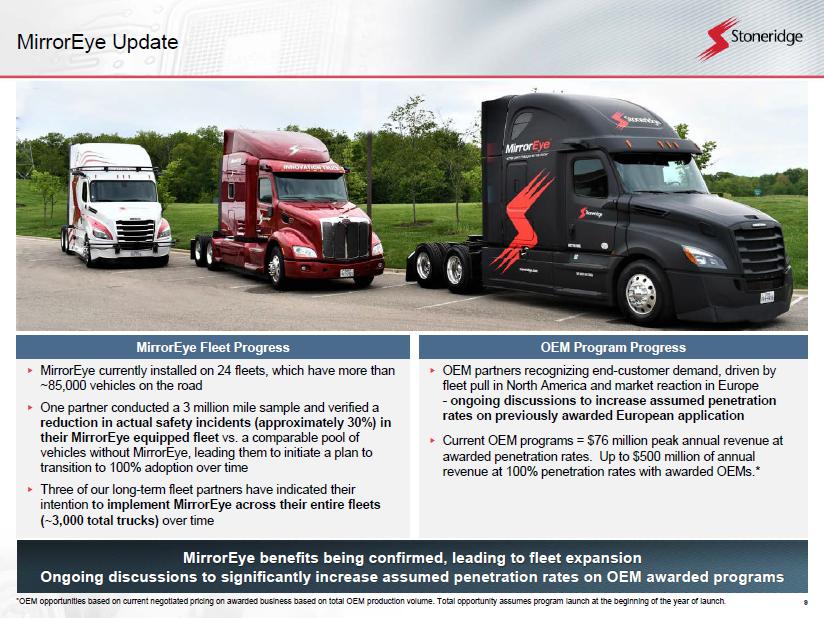
9 MirrorEye Update ▸ MirrorEye currently installed on 24 fleets, which have more than ~85,000 vehicles on the road ▸ One partner conducted a 3 million mile sample and verified a reduction in actual safety incidents (approximately 30%) in their MirrorEye equipped fleet vs. a comparable pool of vehicles without MirrorEye , leading them to initiate a plan to transition to 100% adoption over time ▸ Three of our long - term fleet partners have indicated their intention to implement MirrorEye across their entire fleets (~3,000 total trucks) over time MirrorEye benefits being confirmed, leading to fleet expansion Ongoing discussions to significantly increase assumed penetration rates on OEM awarded programs *OEM opportunities based on current negotiated pricing on awarded business based on total OEM production volume. Total opport uni ty assumes program launch at the beginning of the year of launch . ▸ OEM partners recognizing end - customer demand, driven by fleet pull in North America and market reaction in Europe - ongoing discussions to increase assumed penetration rates on previously awarded European application ▸ Current OEM programs = $76 million peak annual revenue at awarded penetration rates. Up to $500 million of annual revenue at 100% penetration rates with awarded OEMs.* OEM Program Progress MirrorEye Fleet Progress
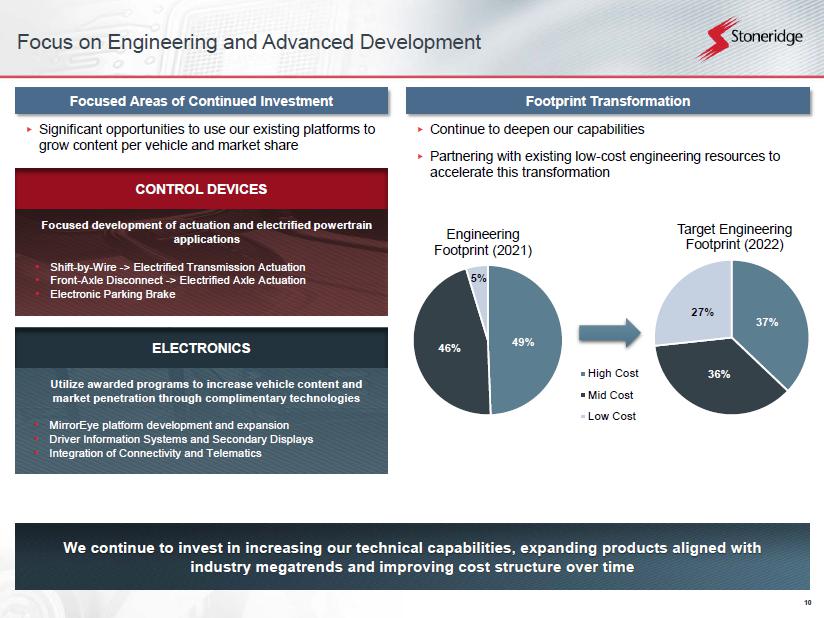
10 Focus on Engineering and Advanced Development ▸ Significant opportunities to use our existing platforms to grow content per vehicle and market share Focused development of actuation and electrified powertrain applications • Shift - by - Wire - > Electrified Transmission Actuation • Front - Axle Disconnect - > Electrified Axle Actuation • Electronic Parking Brake CONTROL DEVICES Utilize awarded programs to increase vehicle content and market penetration through complimentary technologies • MirrorEye platform development and expansion • Driver Information Systems and Secondary Displays • Integration of Connectivity and Telematics ELECTRONICS 37% 36% 27% Target Engineering Footprint (2022) 49% 46% 5% Engineering Footprint (2021) High Cost Mid Cost Low Cost We continue to invest in increasing our technical capabilities, expanding products aligned with industry megatrends and improving cost structure over time ▸ Continue to deepen our capabilities ▸ Partnering with existing low - cost engineering resources to accelerate this transformation Focused Areas of Continued Investment Footprint Transformation
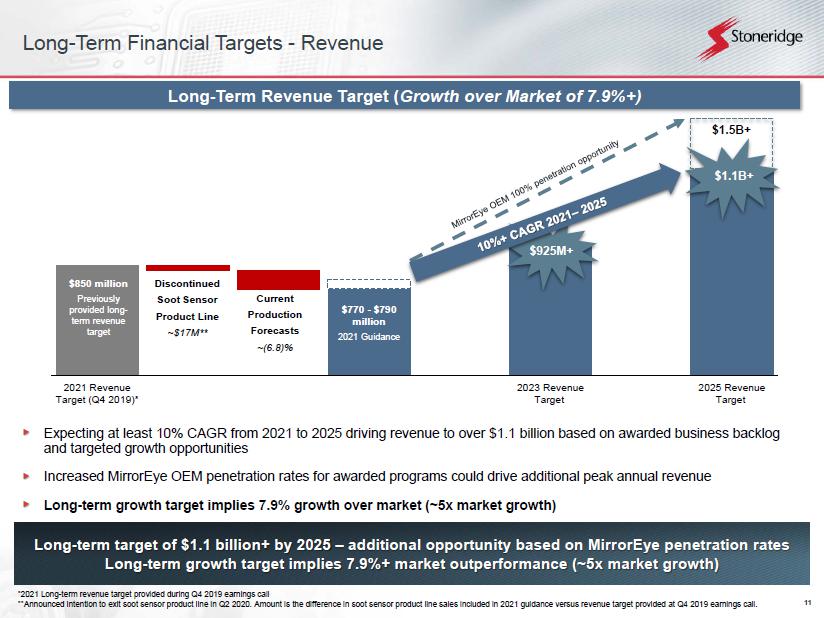
11 500.0 600.0 700.0 800.0 900.0 1,000.0 1,100.0 1,200.0 2021 Revenue Target (Q4 2019)* 2023 Revenue Target 2025 Revenue Target Discontinued Soot Sensor Product Line ~$17M** Long - Term Financial Targets - Revenue Long - term target of $1.1 billion+ by 2025 – additional opportunity based on MirrorEye penetration rates Long - term growth target implies 7.9%+ market outperformance (~5x market growth) Expecting at least 10% CAGR from 2021 to 2025 driving revenue to over $1.1 billion based on awarded business backlog and targeted growth opportunities Increased MirrorEye OEM penetration rates for awarded programs could drive additional peak annual revenue Long - term growth target implies 7.9% growth over market (~5x market growth) Long - Term Revenue Target ( Growth over Market of 7 . 9 % +) Current Production Forecasts ~(6.8)% $770 - $790 million 2021 Guidance $850 million Previously provided long - term revenue target *2021 Long - term revenue target provided during Q4 2019 earnings call **Announced intention to exit soot sensor product line in Q2 2020. Amount is the difference in soot sensor product line sales in cluded in 2021 guidance versus revenue target provided at Q4 2019 earnings call. $1.5B+ $925M+ $1.1B+
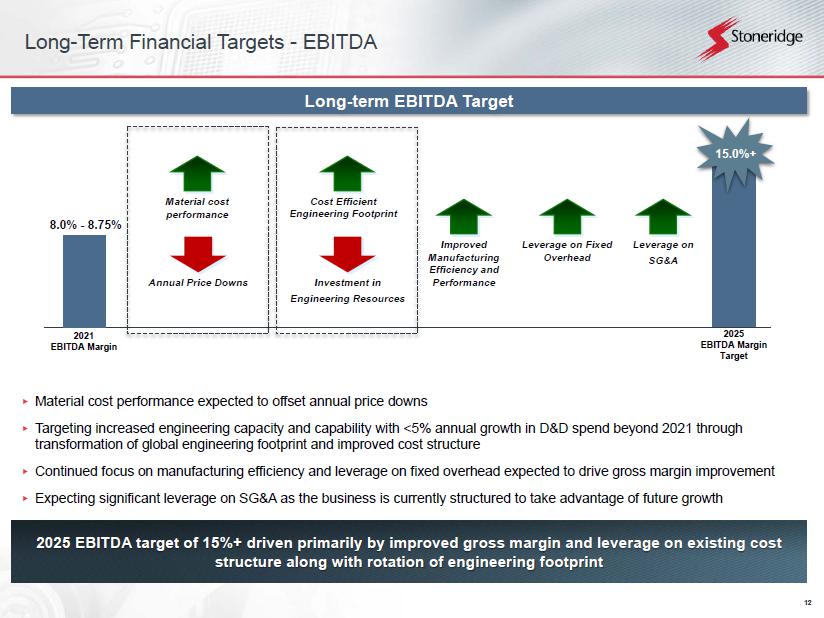
12 2025 EBITDA target of 15%+ driven primarily by improved gross margin and leverage on existing cost structure along with rotation of engineering footprint 2021 EBITDA Margin Long - term EBITDA Target ▸ Material cost performance expected to offset annual price downs ▸ Targeting increased engineering capacity and capability with <5% annual growth in D&D spend beyond 2021 through transformation of global engineering footprint and improved cost structure ▸ Continued focus on manufacturing efficiency and leverage on fixed overhead expected to drive gross margin improvement ▸ Expecting significant leverage on SG&A as the business is currently structured to take advantage of future growth 2025 EBITDA Margin Target 15.0%+ Material cost performance Cost Efficient Engineering Footprint Leverage on Fixed Overhead Improved Manufacturing Efficiency and Performance Leverage on SG&A Investment in Engineering Resources Annual Price Downs 8.0% - 8.75% Long - Term Financial Targets - EBITDA
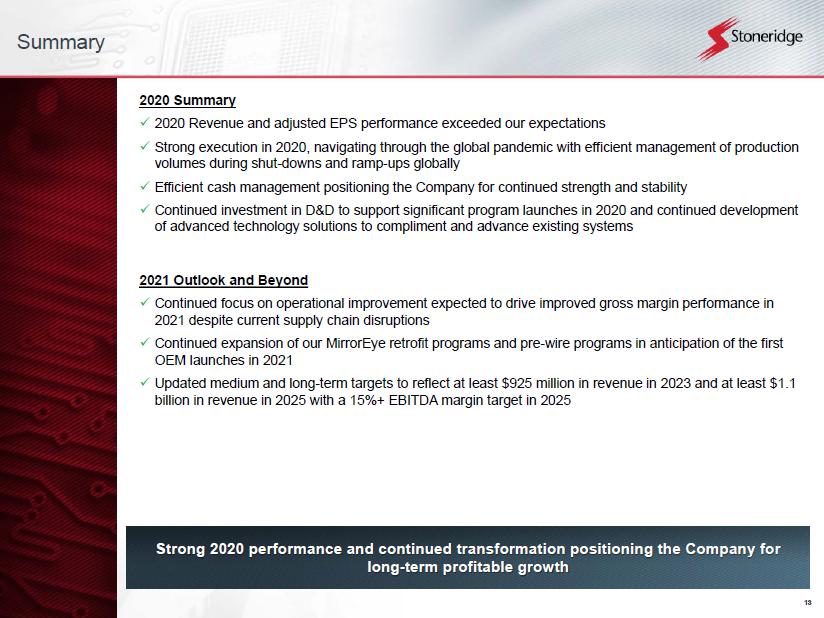
13 Summary 2020 Summary x 2020 Revenue and adjusted EPS performance exceeded our expectations x Strong execution in 2020, navigating through the global pandemic with efficient management of production volumes during shut - downs and ramp - ups globally x Efficient cash management positioning the Company for continued strength and stability x Continued investment in D&D to support significant program launches in 2020 and continued development of advanced technology solutions to compliment and advance existing systems 2021 Outlook and Beyond x Continued focus on operational improvement expected to drive improved gross margin performance in 2021 despite current supply chain disruptions x Continued expansion of our MirrorEye retrofit programs and pre - wire programs in anticipation of the first OEM launches in 2021 x Updated medium and long - term targets to reflect at least $925 million in revenue in 2023 and at least $1.1 billion in revenue in 2025 with a 15%+ EBITDA margin target in 2025 Strong 2020 performance and continued transformation positioning the Company for long - term profitable growth

14 Financial Update
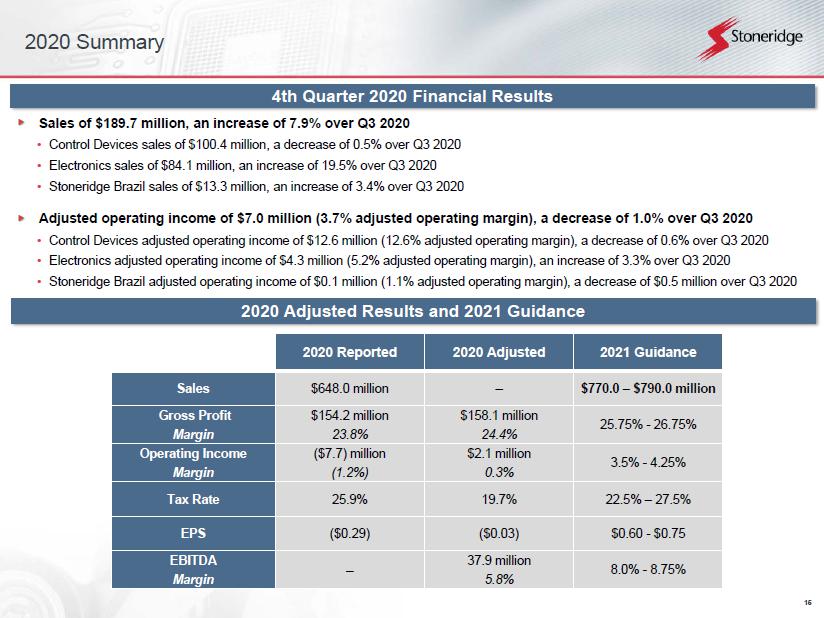
15 2020 Summary 4 th Quarter 2020 Financial Results Sales of $189.7 million, an increase of 7.9% over Q3 2020 • Control Devices sales of $100.4 million, a decrease of 0.5% over Q3 2020 • Electronics sales of $84.1 million, an increase of 19.5% over Q3 2020 • Stoneridge Brazil sales of $13.3 million, an increase of 3.4% over Q3 2020 Adjusted operating income of $7.0 million (3.7% adjusted operating margin), a decrease of 1.0% over Q3 2020 • Control Devices adjusted operating income of $12.6 million (12.6% adjusted operating margin), a decrease of 0.6% over Q3 2020 • Electronics adjusted operating income of $4.3 million (5.2% adjusted operating margin), an increase of 3.3% over Q3 2020 • Stoneridge Brazil adjusted operating income of $0.1 million (1.1% adjusted operating margin), a decrease of $0.5 million over Q3 2020 2020 Adjusted Results and 2021 Guidance 2020 Reported 2020 Adjusted 2021 Guidance Sales $648.0 million -- $770.0 – $790.0 million Gross Profit Margin $154.2 million 23.8% $158.1 million 24.4% 25.75% - 26.75% Operating Income Margin ($7.7) million (1.2%) $2.1 million 0.3% 3.5% - 4.25% Tax Rate 25.9% 19.7% 22.5% – 27.5% EPS ($0.29) ($0.03) $0.60 - $0.75 EBITDA Margin -- 37.9 million 5.8% 8.0% - 8.75%
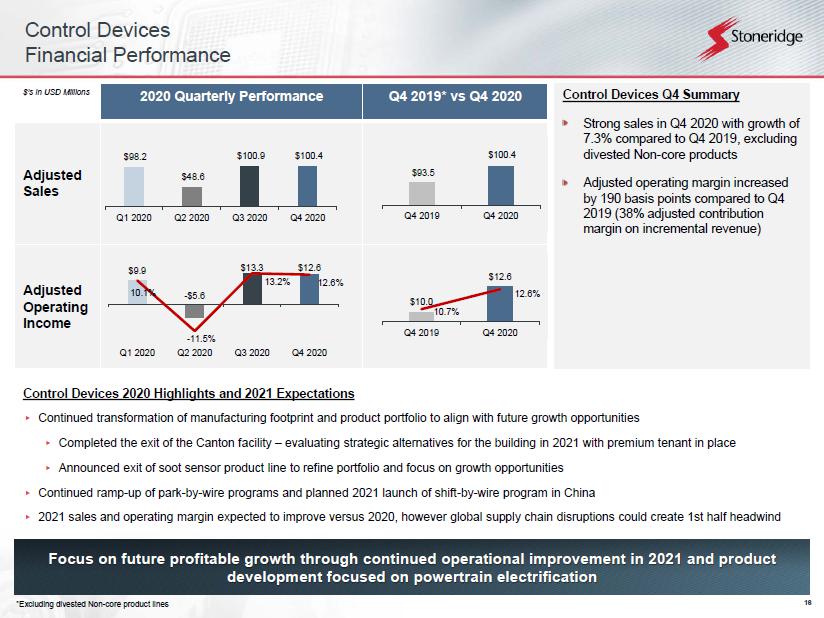
16 Control Devices Financial Performance Focus on future profitable growth through continued operational improvement in 2021 and product development focused on powertrain electrification Control Devices 2020 Highlights and 2021 Expectations ▸ Continued transformation of manufacturing footprint and product portfolio to align with future growth opportunities ▸ Completed the exit of the Canton facility – evaluating strategic alternatives for the building in 2021 with premium tenant in pl ace ▸ Announced exit of soot sensor product line to refine portfolio and focus on growth opportunities ▸ Continued ramp - up of park - by - wire programs and planned 2021 launch of shift - by - wire program in China ▸ 2021 sales and operating margin expected to improve versus 2020, however global supply chain disruptions could create 1st hal f h eadwind 2020 Quarterly Performance Q4 2019* vs Q4 2020 Adjusted Sales Adjusted Operating Income $’s in USD Millions $98.2 $48.6 $100.9 $100.4 Q1 2020 Q2 2020 Q3 2020 Q4 2020 $93.5 $100.4 Q4 2019 Q4 2020 *Excluding divested Non - core product lines Control Devices Q4 Summary Strong sales in Q4 2020 with growth of 7.3% compared to Q4 2019, excluding divested Non - core products Adjusted operating margin increased by 190 basis points compared to Q4 2019 (38% adjusted contribution margin on incremental revenue) $9.9 - $5.6 $13.3 $12.6 10.1% - 11.5% 13.2% 12.6% Q1 2020 Q2 2020 Q3 2020 Q4 2020 $10.0 $12.6 10.7% 12.6% Q4 2019 Q4 2020
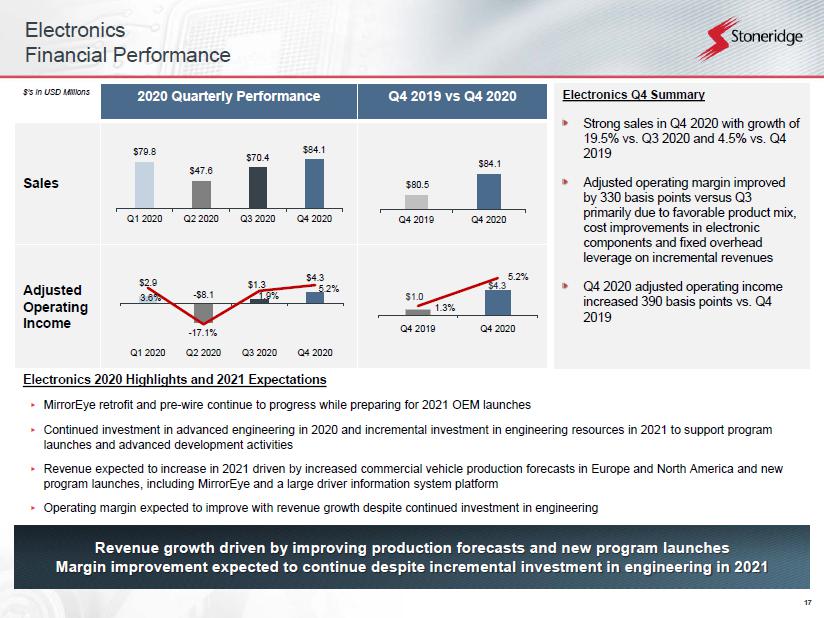
17 Electronics Financial Performance Electronics 2020 Highlights and 2021 Expectations ▸ MirrorEye retrofit and pre - wire continue to progress while preparing for 2021 OEM launches ▸ Continued investment in advanced engineering in 2020 and incremental investment in engineering resources in 2021 to support p rog ram launches and advanced development activities ▸ Revenue expected to increase in 2021 driven by increased commercial vehicle production forecasts in Europe and North America and new program launches, including MirrorEye and a large driver information system platform ▸ Operating margin expected to improve with revenue growth despite continued investment in engineering 2020 Quarterly Performance Q4 2019 vs Q4 2020 Sales Adjusted Operating Income $’s in USD Millions Electronics Q4 Summary Strong sales in Q4 2020 with growth of 19.5% vs. Q3 2020 and 4.5% vs. Q4 2019 Adjusted operating margin improved by 330 basis points versus Q3 primarily due to favorable product mix, cost improvements in electronic components and fixed overhead leverage on incremental revenues Q4 2020 adjusted operating income increased 390 basis points vs. Q4 2019 $79.8 $47.6 $70.4 $84.1 Q1 2020 Q2 2020 Q3 2020 Q4 2020 Revenue growth driven by improving production forecasts and new program launches Margin improvement expected to continue despite incremental investment in engineering in 2021 $80.5 $84.1 Q4 2019 Q4 2020 $2.9 - $8.1 $1.3 $4.3 3.6% - 17.1% 1.9% 5.2% Q1 2020 Q2 2020 Q3 2020 Q4 2020 $1.0 $4.3 1.3% 5.2% Q4 2019 Q4 2020
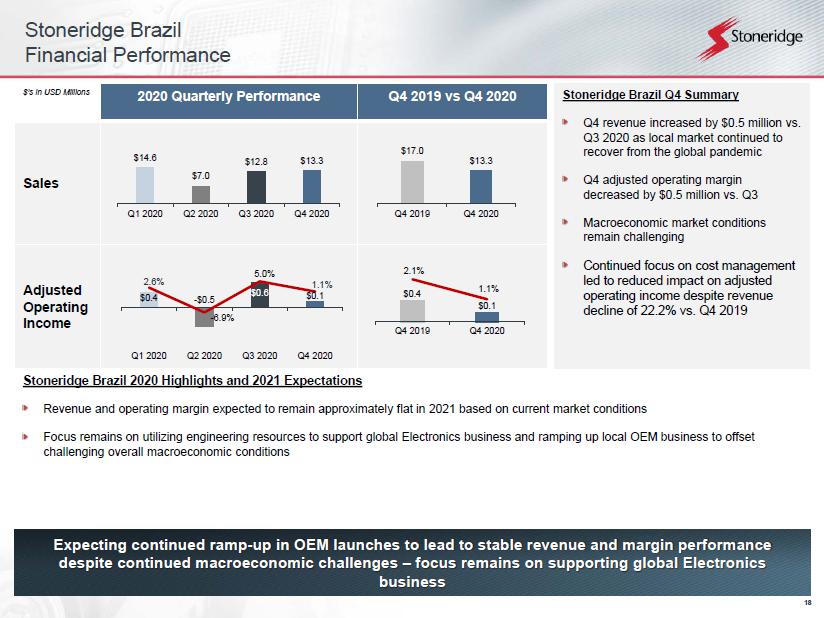
18 Stoneridge Brazil Financial Performance Expecting continued ramp - up in OEM launches to lead to stable revenue and margin performance despite continued macroeconomic challenges – focus remains on supporting global Electronics business Stoneridge Brazil 2020 Highlights and 2021 Expectations Revenue and operating margin expected to remain approximately flat in 2021 based on current market conditions Focus remains on utilizing engineering resources to support global Electronics business and ramping up local OEM business to off set challenging overall macroeconomic conditions 2020 Quarterly Performance Q4 2019 vs Q4 2020 Sales Adjusted Operating Income $’s in USD Millions Stoneridge Brazil Q4 Summary Q4 revenue increased by $0.5 million vs. Q3 2020 as local market continued to recover from the global pandemic Q4 adjusted operating margin decreased by $0.5 million vs. Q3 Macroeconomic market conditions remain challenging Continued focus on cost management led to reduced impact on adjusted operating income despite revenue decline of 22.2% vs. Q4 2019 $14.6 $7.0 $12.8 $13.3 Q1 2020 Q2 2020 Q3 2020 Q4 2020 $17.0 $13.3 Q4 2019 Q4 2020 $0.4 - $0.5 $0.6 $0.1 2.6% - 6.9% 5.0% 1.1% Q1 2020 Q2 2020 Q3 2020 Q4 2020 $0.4 $0.1 2.1% 1.1% Q4 2019 Q4 2020
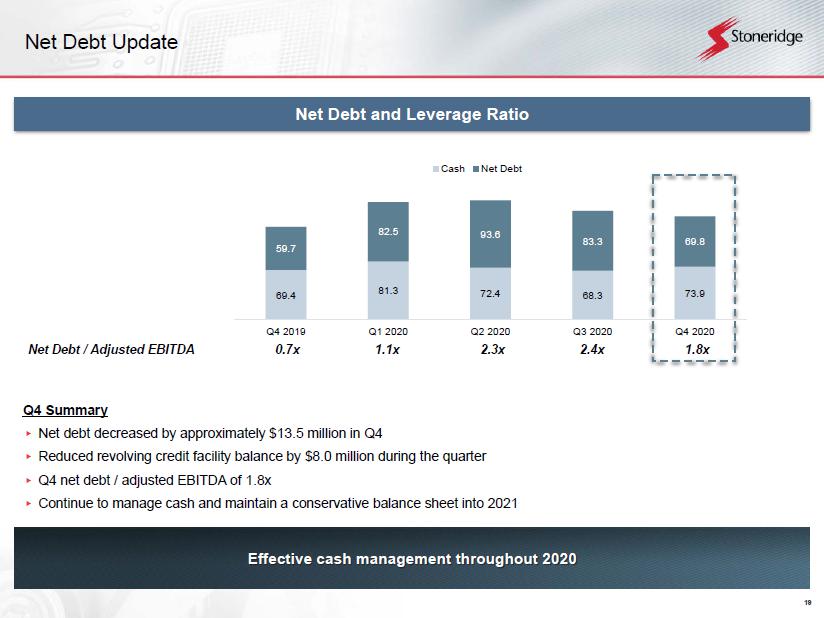
19 Net Debt Update Effective cash management throughout 2020 Q4 Summary ▸ Net debt decreased by approximately $13.5 million in Q4 ▸ Reduced revolving credit facility balance by $8.0 million during the quarter ▸ Q4 net debt / adjusted EBITDA of 1.8x ▸ Continue to manage cash and maintain a conservative balance sheet into 2021 2.3x 1.1x 0.7x 1.8x Net Debt / Adjusted EBITDA 2.4x Net Debt and Leverage Ratio 69.4 81.3 72.4 68.3 73.9 59.7 82.5 93.6 83.3 69.8 0.0 20.0 40.0 60.0 80.0 100.0 120.0 140.0 160.0 180.0 Q4 2019 Q1 2020 Q2 2020 Q3 2020 Q4 2020 Cash Net Debt
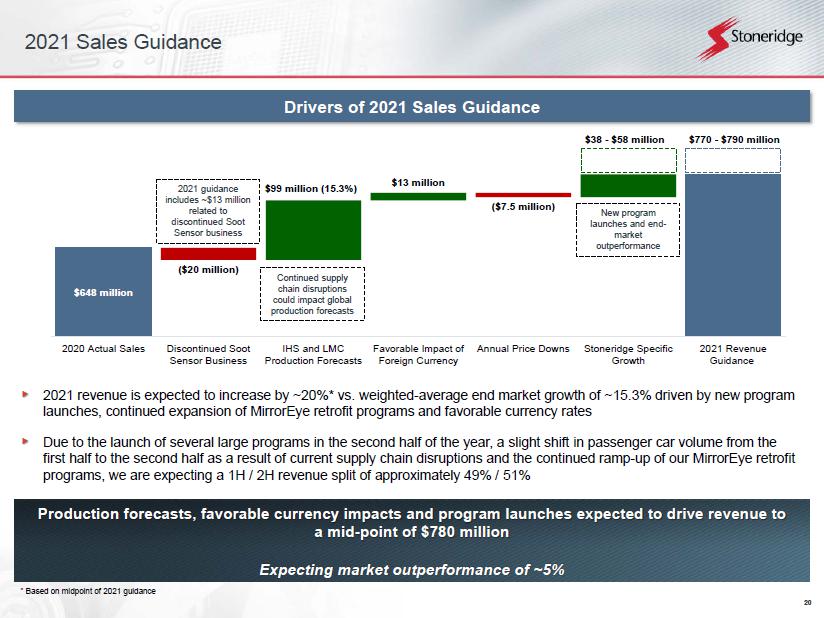
20 $ 648 million 628 628 727 732 732 $770 - $790 million $ 99 million (15.3%) $13 million ($20 million) ($7.5 million) $38 - $58 million 500.0 700.0 2020 Actual Sales Discontinued Soot Sensor Business IHS and LMC Production Forecasts Favorable Impact of Foreign Currency Annual Price Downs Stoneridge Specific Growth 2021 Revenue Guidance 2021 Sales Guidance Drivers of 2021 Sales Guidance Production forecasts, favorable currency impacts and program launches expected to drive revenue to a mid - point of $780 million Expecting market outperformance of ~5% 2021 revenue is expected to increase by ~20%* vs. weighted - average end market growth of ~15.3% driven by new program launches, continued expansion of MirrorEye retrofit programs and favorable currency rates Due to the launch of several large programs in the second half of the year, a slight shift in passenger car volume from the first half to the second half as a result of current supply chain disruptions and the continued ramp - up of our MirrorEye retrofi t programs, we are expecting a 1H / 2H revenue split of approximately 49% / 51% Continued supply chain disruptions could impact global production forecasts 2021 guidance includes ~$13 million related to discontinued Soot Sensor business New program launches and end - market outperformance * Based on midpoint of 2021 guidance
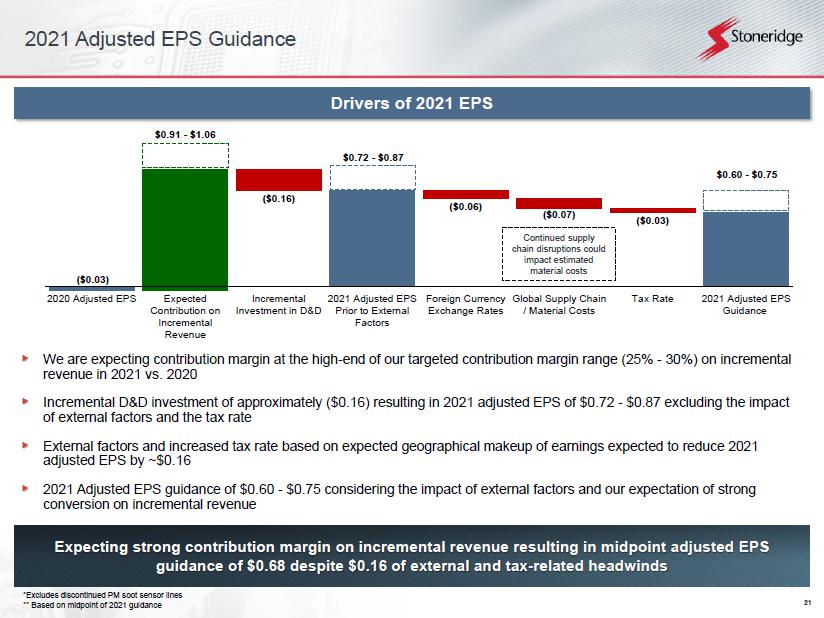
21 ($0.03) $0.91 - $1.06 ($0.06) ($0.03) ( $0.16 ) $0.72 - $0.87 ( $0.07 ) $0.60 - $0.75 (0.05) 0.15 0.35 0.55 0.75 0.95 1.15 2020 Adjusted EPS Expected Contribution on Incremental Revenue Incremental Investment in D&D 2021 Adjusted EPS Prior to External Factors Foreign Currency Exchange Rates Global Supply Chain / Material Costs Tax Rate 2021 Adjusted EPS Guidance 2021 Adjusted EPS Guidance Drivers of 2021 EPS Expecting strong contribution margin on incremental revenue resulting in midpoint adjusted EPS guidance of $0.68 despite $0.16 of external and tax - related headwinds *Excludes discontinued PM soot sensor lines ** Based on midpoint of 2021 guidance We are expecting contribution margin at the high - end of our targeted contribution margin range (25% - 30%) on incremental revenue in 2021 vs. 2020 Incremental D&D investment of approximately ($0.16) resulting in 2021 adjusted EPS of $0.72 - $0.87 excluding the impact of external factors and the tax rate External factors and increased tax rate based on expected geographical makeup of earnings expected to reduce 2021 adjusted EPS by ~$0.16 2021 Adjusted EPS guidance of $0.60 - $0.75 considering the impact of external factors and our expectation of strong conversion on incremental revenue Continued supply chain disruptions could impact estimated material costs
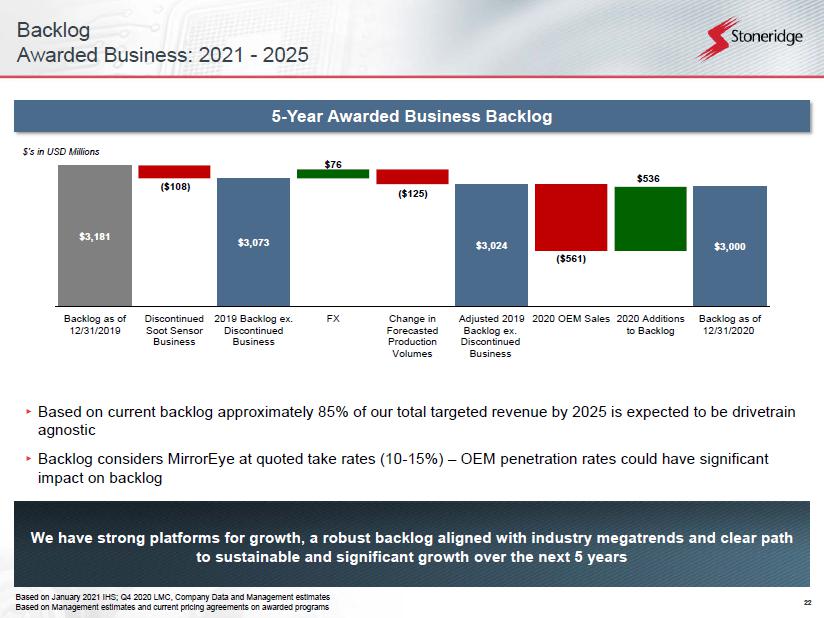
22 Backlog Awarded Business: 2021 - 2025 ▸ Based on current backlog approximately 85% of our total targeted revenue by 2025 is expected to be drivetrain agnostic ▸ Backlog considers MirrorEye at quoted take rates (10 - 15%) – OEM penetration rates could have significant impact on backlog We have strong platforms for growth, a robust backlog aligned with industry megatrends and clear path to sustainable and significant growth over the next 5 years Based on January 2021 IHS; Q4 2020 LMC, Company Data and Management estimates Based on Management estimates and current pricing agreements on awarded programs $3,181 $3,073 $3,073 $3,073 $3,024 $3,024 $2,464 $2,464 $3,000 $76 $536 ($108) ($125) ($561) 2,000 2,200 2,400 2,600 2,800 3,000 3,200 3,400 Backlog as of 12/31/2019 Discontinued Soot Sensor Business 2019 Backlog ex. Discontinued Business FX Change in Forecasted Production Volumes Adjusted 2019 Backlog ex. Discontinued Business 2020 OEM Sales 2020 Additions to Backlog Backlog as of 12/31/2020 $’s in USD Millions 5 - Year Awarded Business Backlog
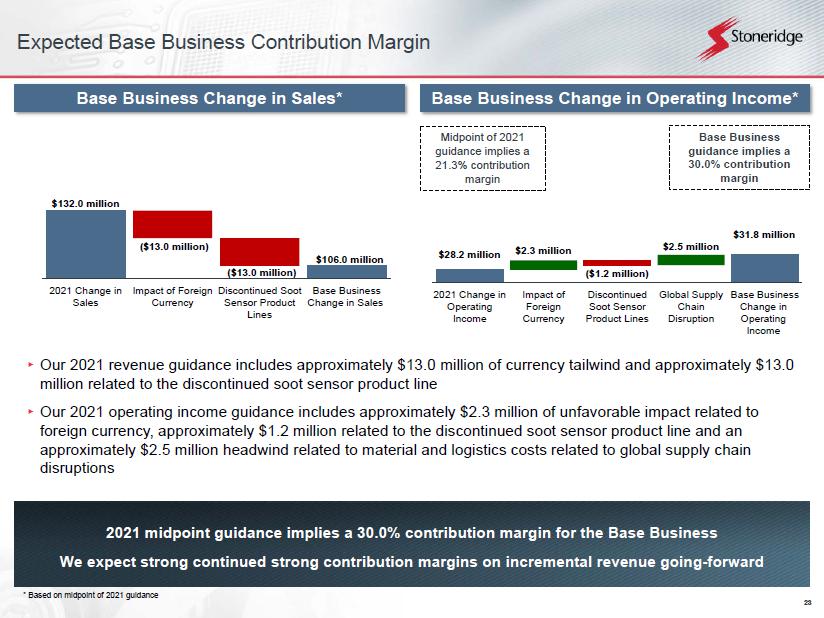
23 Expected Base Business Contribution Margin ▸ Our 2021 revenue guidance includes approximately $13.0 million of currency tailwind and approximately $13.0 million related to the discontinued soot sensor product line ▸ Our 2021 operating income guidance includes approximately $2.3 million of unfavorable impact related to foreign currency, approximately $1.2 million related to the discontinued soot sensor product line and an approximately $2.5 million headwind related to material and logistics costs related to global supply chain disruptions 2021 midpoint guidance implies a 30.0% contribution margin for the Base Business We expect strong continued strong contribution margins on incremental revenue going - forward Base Business Change in Sales* Base Business Change in Operating Income* Midpoint of 2021 guidance implies a 21.3% contribution margin Base Business guidance implies a 30.0% contribution margin * Based on midpoint of 2021 guidance $132.0 million $106.0 million ( $13.0 million) ( $13.0 million) 100.0 2021 Change in Sales Impact of Foreign Currency Discontinued Soot Sensor Product Lines Base Business Change in Sales $28.2 million $31.8 million $2.3 million $2.5 million ( $1.2 million) 2021 Change in Operating Income Impact of Foreign Currency Discontinued Soot Sensor Product Lines Global Supply Chain Disruption Base Business Change in Operating Income
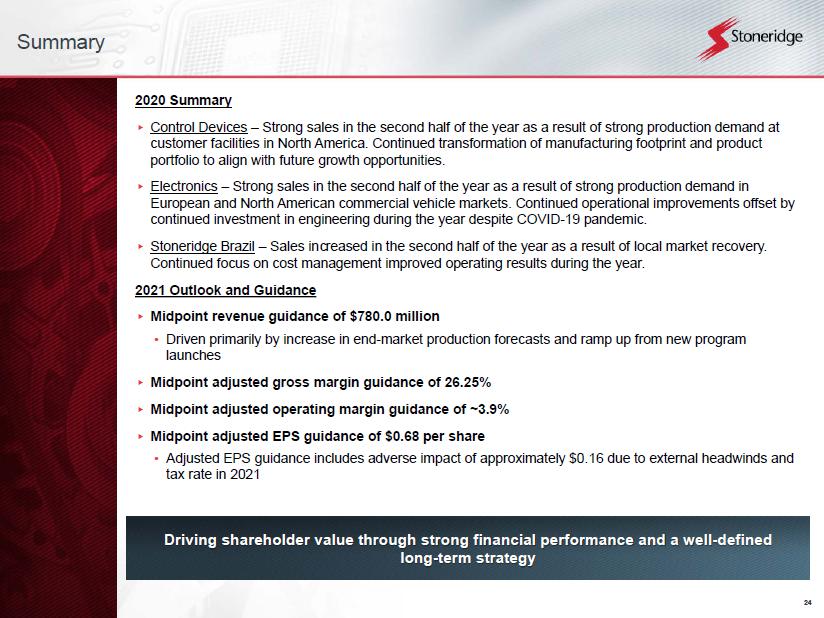
24 Summary 2020 Summary ▸ Control Devices – Strong sales in the second half of the year as a result of strong production demand at customer facilities in North America. Continued transformation of manufacturing footprint and product portfolio to align with future growth opportunities. ▸ Electronics – Strong sales in the second half of the year as a result of strong production demand in European and North American commercial vehicle markets. Continued operational improvements offset by continued investment in engineering during the year despite COVID - 19 pandemic. ▸ Stoneridge Brazil – Sales increased in the second half of the year as a result of local market recovery. Continued focus on cost management improved operating results during the year. 2021 Outlook and Guidance ▸ Midpoint revenue guidance of $780.0 million • Driven primarily by increase in end - market production forecasts and ramp up from new program launches ▸ Midpoint adjusted gross margin guidance of 26.25% ▸ Midpoint adjusted operating margin guidance of ~3.9% ▸ Midpoint adjusted EPS guidance of $0.68 per share • Adjusted EPS guidance includes adverse impact of approximately $0.16 due to external headwinds and tax rate in 2021 Driving shareholder value through strong financial performance and a well - defined long - term strategy

25 Appendix
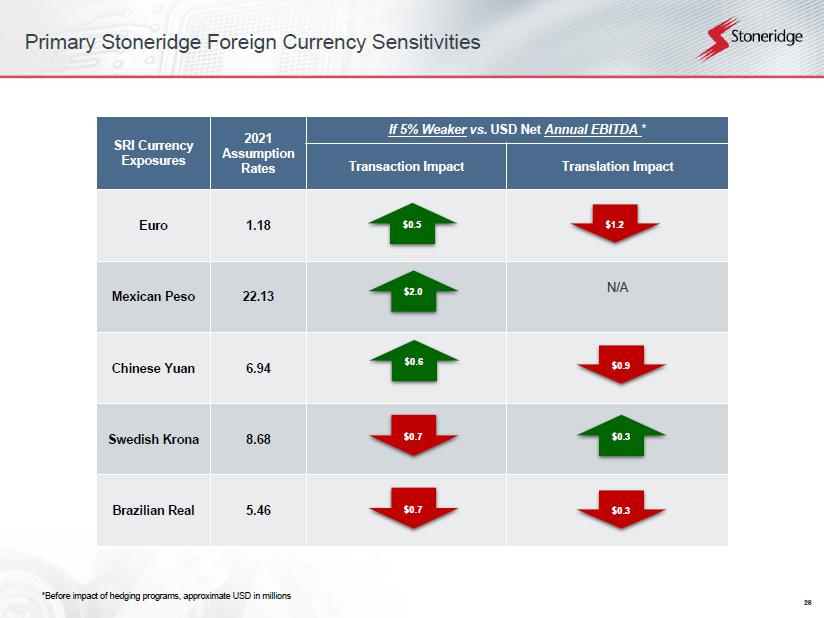
26 Primary Stoneridge Foreign Currency Sensitivities SRI Currency Exposures 2021 Assumption Rates If 5% Weaker vs. USD N et Annual EBITDA * Transaction Impact Translation Impact Euro 1.18 Mexican Peso 22.13 N/A Chinese Yuan 6.94 Swedish Krona 8.68 Brazilia n Real 5.46 *Before impact of hedging programs, approximate USD in millions $0.7 $2.0 $1.2 $0.9 $0.7 $0.3 $0.5 $0.6 $0.3
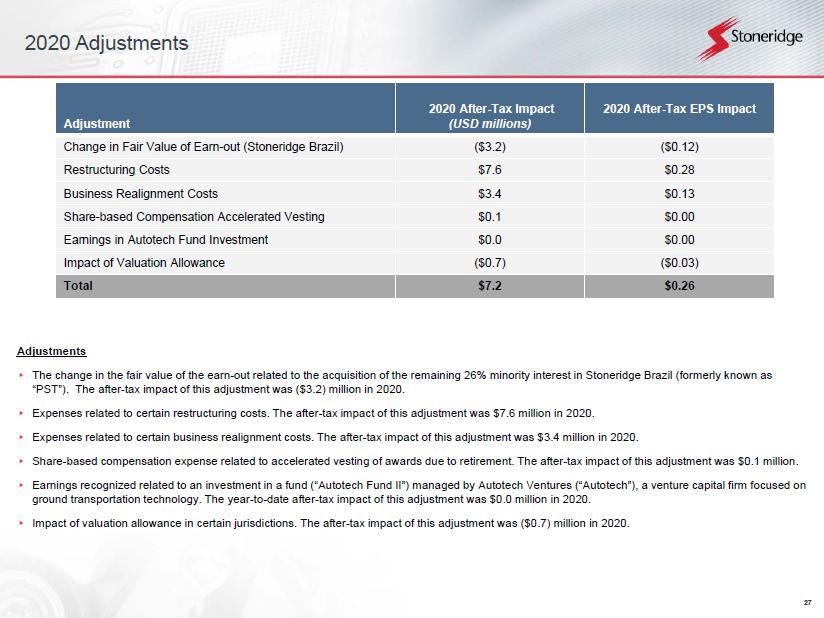
27 2020 Adjustments Adjustments ▸ The change in the fair value of the earn - out related to the acquisition of the remaining 26% minority interest in Stoneridge Bra zil (formerly known as “PST”). The after - tax impact of this adjustment was ($3.2) million in 2020. ▸ Expenses related to certain restructuring costs. The after - tax impact of this adjustment was $7.6 million in 2020. ▸ Expenses related to certain business realignment costs. The after - tax impact of this adjustment was $3.4 million in 2020. ▸ Share - based compensation expense related to accelerated vesting of awards due to retirement. The after - tax impact of this adjust ment was $0.1 million. ▸ Earnings recognized related to an investment in a fund (“Autotech Fund II”) managed by Autotech Ventures (“Autotech”), a vent ure capital firm focused on ground transportation technology. The year - to - date after - tax impact of this adjustment was $0.0 million in 2020. ▸ Impact of valuation allowance in certain jurisdictions. The after - tax impact of this adjustment was ($0.7) million in 2020. Adjustment 2020 After - Tax Impact (USD millions) 2020 After - Tax EPS Impact Change in Fair Value of Earn - out (Stoneridge Brazil) ($3.2) ($0.12) Restructuring Costs $7.6 $0.28 Business Realignment Costs $3.4 $0.13 Share - based Compensation Accelerated Vesting $0.1 $0.00 Earnings in Autotech Fund Investment $0.0 $0.00 Impact of Valuation Allowance ($0.7) ($0.03) Total $7.2 $0.26
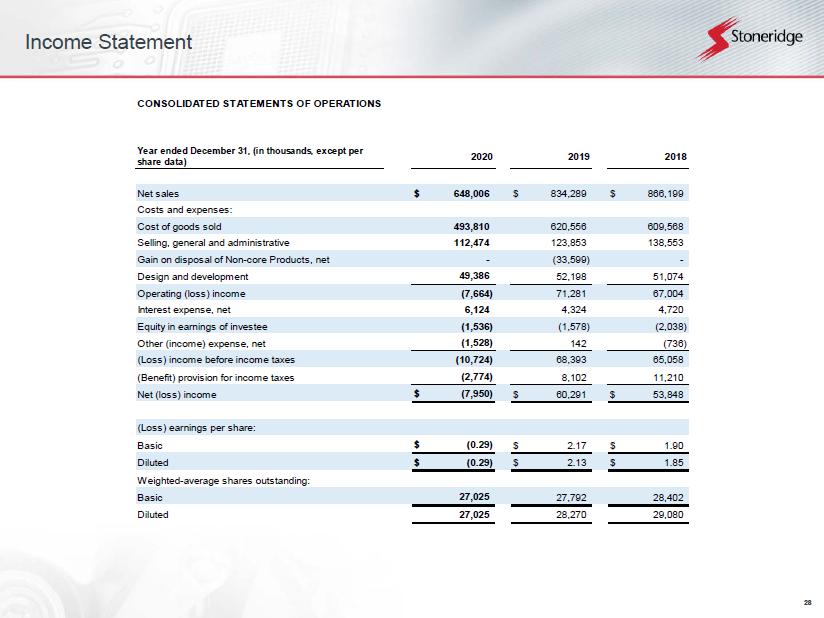
28 Income Statement CONSOLIDATED STATEMENTS OF OPERATIONS Year ended December 31, (in thousands, except per share data) Net sales $ 648,006 $ 834,289 $ 866,199 Costs and expenses: Cost of goods sold 493,810 620,556 609,568 Selling, general and administrative 112,474 123,853 138,553 Gain on disposal of Non-core Products, net - (33,599) - Design and development 49,386 52,198 51,074 Operating (loss) income (7,664) 71,281 67,004 Interest expense, net 6,124 4,324 4,720 Equity in earnings of investee (1,536) (1,578) (2,038) Other (income) expense, net (1,528) 142 (736) (Loss) income before income taxes (10,724) 68,393 65,058 (Benefit) provision for income taxes (2,774) 8,102 11,210 Net (loss) income $ (7,950) $ 60,291 $ 53,848 (Loss) earnings per share: Basic $ (0.29) $ 2.17 $ 1.90 Diluted $ (0.29) $ 2.13 $ 1.85 Weighted-average shares outstanding: Basic 27,025 27,792 28,402 Diluted 27,025 28,270 29,080 2020 2019 2018
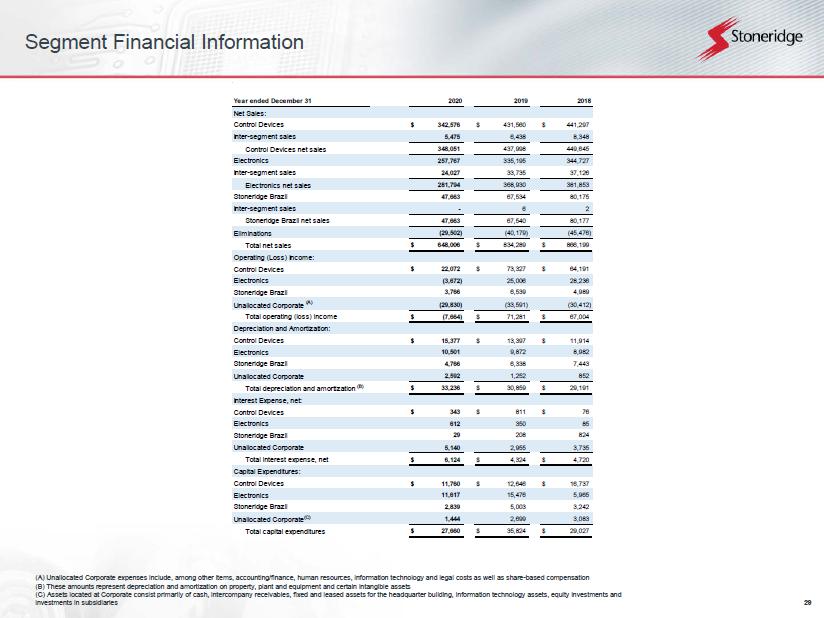
29 Segment Financial Information Year ended December 31 Net Sales: Control Devices $ 342,576 $ 431,560 $ 441,297 Inter-segment sales 5,475 6,438 8,348 Control Devices net sales 348,051 437,998 449,645 Electronics 257,767 335,195 344,727 Inter-segment sales 24,027 33,735 37,126 Electronics net sales 281,794 368,930 381,853 Stoneridge Brazil 47,663 67,534 80,175 Inter-segment sales - 6 2 Stoneridge Brazil net sales 47,663 67,540 80,177 Eliminations (29,502) (40,179) (45,476) Total net sales $ 648,006 $ 834,289 $ 866,199 Operating (Loss) Income: Control Devices $ 22,072 $ 73,327 $ 64,191 Electronics (3,672) 25,006 28,236 Stoneridge Brazil 3,766 6,539 4,989 Unallocated Corporate (A) (29,830) (33,591) (30,412) Total operating (loss) income $ (7,664) $ 71,281 $ 67,004 Depreciation and Amortization: Control Devices $ 15,377 $ 13,397 $ 11,914 Electronics 10,501 9,872 8,982 Stoneridge Brazil 4,766 6,338 7,443 Unallocated Corporate 2,592 1,252 852 Total depreciation and amortization (B) $ 33,236 $ 30,859 $ 29,191 Interest Expense, net: Control Devices $ 343 $ 811 $ 76 Electronics 612 350 85 Stoneridge Brazil 29 208 824 Unallocated Corporate 5,140 2,955 3,735 Total interest expense, net $ 6,124 $ 4,324 $ 4,720 Capital Expenditures: Control Devices $ 11,760 $ 12,646 $ 16,737 Electronics 11,617 15,476 5,965 Stoneridge Brazil 2,839 5,003 3,242 Unallocated Corporate (C) 1,444 2,699 3,083 Total capital expenditures $ 27,660 $ 35,824 $ 29,027 20182020 2019 (A) Unallocated Corporate expenses include, among other items, accounting/finance, human resources, information technology an d l egal costs as well as share - based compensation (B) These amounts represent depreciation and amortization on property, plant and equipment and certain intangible assets (C) Assets located at Corporate consist primarily of cash, intercompany receivables, fixed and leased assets for the headquar ter building, information technology assets, equity investments and investments in subsidiaries
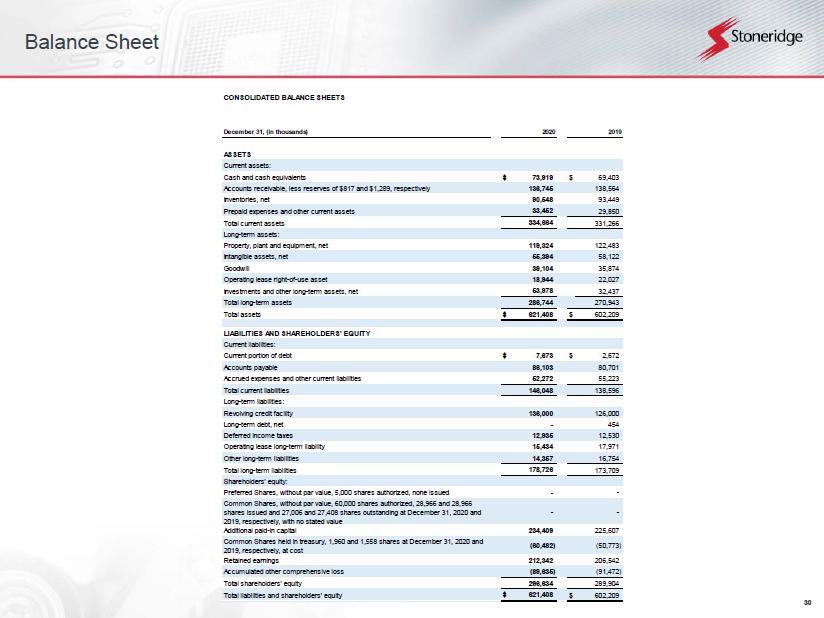
30 Balance Sheet CONSOLIDATED BALANCE SHEETS December 31, (in thousands) ASSETS Current assets: Cash and cash equivalents $ 73,919 $ 69,403 Accounts receivable, less reserves of $817 and $1,289, respectively 136,745 138,564 Inventories, net 90,548 93,449 Prepaid expenses and other current assets 33,452 29,850 Total current assets 334,664 331,266 Long-term assets: Property, plant and equipment, net 119,324 122,483 Intangible assets, net 55,394 58,122 Goodwill 39,104 35,874 Operating lease right-of-use asset 18,944 22,027 Investments and other long-term assets, net 53,978 32,437 Total long-term assets 286,744 270,943 Total assets $ 621,408 $ 602,209 LIABILITIES AND SHAREHOLDERS' EQUITY Current liabilities: Current portion of debt $ 7,673 $ 2,672 Accounts payable 86,103 80,701 Accrued expenses and other current liabilities 52,272 55,223 Total current liabilities 146,048 138,596 Long-term liabilities: Revolving credit facility 136,000 126,000 Long-term debt, net - 454 Deferred income taxes 12,935 12,530 Operating lease long-term liability 15,434 17,971 Other long-term liabilities 14,357 16,754 Total long-term liabilities 178,726 173,709 Shareholders' equity: Preferred Shares, without par value, 5,000 shares authorized, none issued - - Common Shares, without par value, 60,000 shares authorized, 28,966 and 28,966 shares issued and 27,006 and 27,408 shares outstanding at December 31, 2020 and 2019, respectively, with no stated value - - Additional paid-in capital 234,409 225,607 Common Shares held in treasury, 1,960 and 1,558 shares at December 31, 2020 and 2019, respectively, at cost (60,482) (50,773) Retained earnings 212,342 206,542 Accumulated other comprehensive loss (89,635) (91,472) Total shareholders' equity 296,634 289,904 Total liabilities and shareholders' equity $ 621,408 $ 602,209 2020 2019
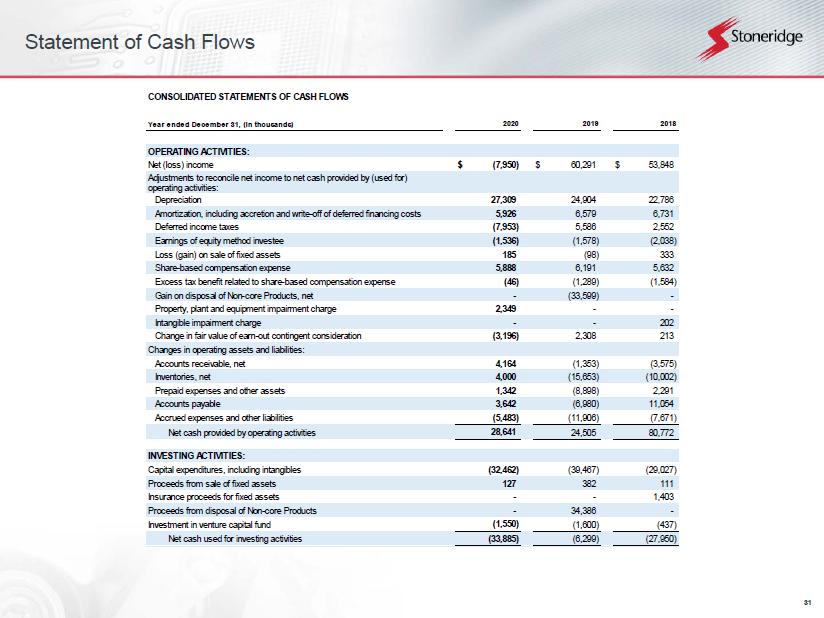
31 Statement of Cash Flows CONSOLIDATED STATEMENTS OF CASH FLOWS Year ended December 31, (in thousands) OPERATING ACTIVITIES: Net (loss) income $ (7,950) $ 60,291 $ 53,848 Adjustments to reconcile net income to net cash provided by (used for) operating activities: Depreciation 27,309 24,904 22,786 Amortization, including accretion and write-off of deferred financing costs 5,926 6,579 6,731 Deferred income taxes (7,953) 5,586 2,552 Earnings of equity method investee (1,536) (1,578) (2,038) Loss (gain) on sale of fixed assets 185 (98) 333 Share-based compensation expense 5,888 6,191 5,632 Excess tax benefit related to share-based compensation expense (46) (1,289) (1,584) Gain on disposal of Non-core Products, net - (33,599) - Property, plant and equipment impairment charge 2,349 - - Intangible impairment charge - - 202 Change in fair value of earn-out contingent consideration (3,196) 2,308 213 Changes in operating assets and liabilities: Accounts receivable, net 4,164 (1,353) (3,575) Inventories, net 4,000 (15,653) (10,002) Prepaid expenses and other assets 1,342 (8,898) 2,291 Accounts payable 3,642 (6,980) 11,054 Accrued expenses and other liabilities (5,483) (11,906) (7,671) Net cash provided by operating activities 28,641 24,505 80,772 INVESTING ACTIVITIES: Capital expenditures, including intangibles (32,462) (39,467) (29,027) Proceeds from sale of fixed assets 127 382 111 Insurance proceeds for fixed assets - - 1,403 Proceeds from disposal of Non-core Products - 34,386 - Investment in venture capital fund (1,550) (1,600) (437) Net cash used for investing activities (33,885) (6,299) (27,950) 2020 2019 2018
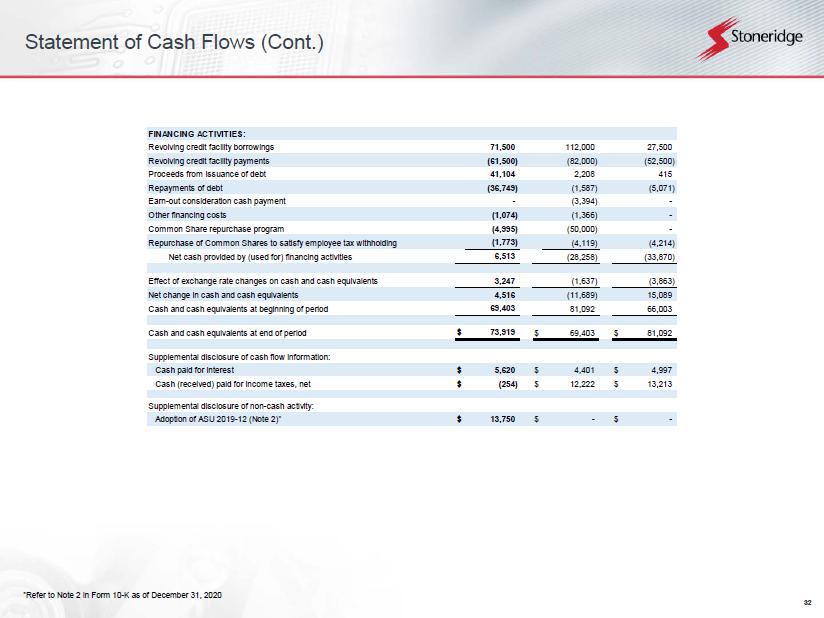
32 Statement of Cash Flows (Cont.) *Refer to Note 2 in Form 10 - K as of December 31, 2020 FINANCING ACTIVITIES: Revolving credit facility borrowings 71,500 112,000 27,500 Revolving credit facility payments (61,500) (82,000) (52,500) Proceeds from issuance of debt 41,104 2,208 415 Repayments of debt (36,749) (1,587) (5,071) Earn-out consideration cash payment - (3,394) - Other financing costs (1,074) (1,366) - Common Share repurchase program (4,995) (50,000) - Repurchase of Common Shares to satisfy employee tax withholding (1,773) (4,119) (4,214) Net cash provided by (used for) financing activities 6,513 (28,258) (33,870) Effect of exchange rate changes on cash and cash equivalents 3,247 (1,637) (3,863) Net change in cash and cash equivalents 4,516 (11,689) 15,089 Cash and cash equivalents at beginning of period 69,403 81,092 66,003 Cash and cash equivalents at end of period $ 73,919 $ 69,403 $ 81,092 Supplemental disclosure of cash flow information: Cash paid for interest $ 5,620 $ 4,401 $ 4,997 Cash (received) paid for income taxes, net $ (254) $ 12,222 $ 13,213 Supplemental disclosure of non-cash activity: Adoption of ASU 2019-12 (Note 2)* $ 13,750 $ - $ -

33 Reconciliations to US GAAP
34 Reconciliations to US GAAP This document contains information about Stoneridge's financial results which is not presented in accordance with accounting principles generally accepted in the United States ("GAAP"). Such non - GAAP financial measures are reconciled to their closest GAAP financial measures in the appendix of this document. The provision of these non - GAAP financial measures is not intended to indicate that Stoneridge is explicitly or implicitly providing projections on those non - GAAP financial measures, and actual results for such measures are likely to vary from those presented. The reconciliations include all information reasonably available to the Company at the date of this document and the adjustments that management can reasonably predict.

35 Reconciliations to US GAAP Reconciliation of Adjusted Gross Profit (USD in millions) Q1 2019 Q2 2019 Q3 2019 Q4 2019 2019 Q1 2020 Q2 2020 Q3 2020 Q4 2020 2020 Gross Profit 60.9$ 56.8$ 51.9$ 44.2$ 213.7$ 45.4$ 13.3$ 46.0$ 49.6$ 154.2$ Add: Pre-Tax Restructuring Costs 1.3 2.4 2.5 1.5 7.6 1.5 0.2 0.6 0.3 2.6 Less: Pre-Tax One-Time Sale of Non-Core Product Inventory - (1.4) - - (1.4) - - - - - Add: Pre-Tax Business Realignment Costs - - - - - 0.1 0.9 0.1 0.1 1.2 Adjusted Gross Profit 62.1$ 57.8$ 54.4$ 45.6$ 219.9$ 47.0$ 14.4$ 46.7$ 50.0$ 158.1$ Reconciliation of Adjusted Operating Income (Loss) (USD in millions) Q1 2019 Q2 2019 Q3 2019 Q4 2019 2019 Q1 2020 Q2 2020 Q3 2020 Q4 2020 2020 Operating Income (Loss) 11.7$ 49.2$ 9.3$ 1.1$ 71.3$ 3.7$ (26.8)$ 9.8$ 5.7$ (7.7)$ Add(Less): Pre-Tax Change in Fair Value of Earn-Out (Stoneridge Brazil) 0.5 0.5 0.9 0.4 2.3 (0.6) 0.4 (2.8) (0.2) (3.2) Add(Less): Pre-Tax Loss (Earnings) in Autotech Fund Investment - - 0.2 0.2 - 0.1 (0.3) 0.2 - Add: Pre-Tax Restructuring Costs 2.8 3.6 3.7 3.4 13.4 2.2 4.6 1.1 0.8 8.8 Add: Pre-Tax Share-Based Comp Accelerated Vesting - 0.5 0.2 - 0.7 0.1 0.0 - - 0.1 Add: Pre-Tax Business Realignment Costs 1.1 - 0.4 0.3 1.8 0.6 2.6 0.4 0.4 4.0 Less: Pre-Tax Gain from Disposal of Non-Core Products - (33.9) - - (33.9) - - - - - Less: Pre-Tax Recovery of Brazilian Indirect Taxes - (6.5) - - (6.5) - - - - - Less: Pre-Tax One-Time Sale of Non-Core Product Inventory - (1.4) - - (1.4) - - - - - Less: Pre-Tax Capitalized Software Development Expensed in Q1 and Q2 - - (0.8) - (0.8) - - - - - Add: Pre-Tax Capitalized Software Development Capitalized in Q3 0.2 0.7 - - 0.8 - - - - - Adjusted Operating Income (Loss) 16.2$ 12.6$ 13.7$ 5.5$ 48.0$ 6.0$ (19.1)$ 8.2$ 7.0$ 2.1$ Reconciliation of Adjusted EBITDA (USD in millions) Q1 2019 Q2 2019 Q3 2019 Q4 2019 2019 Q1 2020 Q2 2020 Q3 2020 Q4 2020 2020 Income (Loss) Before Tax 11.5$ 48.8$ 8.1$ (0.0)$ 68.4$ 4.7$ (28.5)$ 8.5$ 4.5$ (10.7)$ Interest expense, net 1.0 1.0 1.1 1.2 4.3 1.0 1.4 1.9 1.8 6.1 Depreciation and amortization 7.2 7.6 7.9 8.1 30.9 8.1 7.9 8.1 8.6 32.7 EBITDA 19.7$ 57.4$ 17.1$ 9.3$ 103.6$ 13.8$ (19.2)$ 18.5$ 14.9$ 28.1$ Add(Less): Pre-Tax Change in Fair Value of Earn-Out (Stoneridge Brazil) 0.5 0.5 0.9 0.4 2.3 (0.6) 0.4 (2.8) (0.2) (3.2) Add(Less): Pre-Tax Loss (Earnings) in Autotech Fund Investment (0.0) - - 0.2 0.2 0.0 0.1 (0.3) 0.2 - Add: Pre-Tax Restructuring Costs 2.8 3.6 3.7 3.4 13.4 2.2 4.6 1.1 0.8 8.8 Add: Pre-Tax Business Realignment Costs 1.1 - 0.4 0.3 1.8 0.6 2.6 0.4 0.4 4.0 Less: Pre-Tax Gain from Disposal of Non-Core Products - (33.9) - - (33.9) - - - - - Less: Pre-Tax Recovery of Brazilian Indirect Taxes - (6.5) - - (6.5) - - - - - Add: Pre-Tax Share-Based Comp Accelerated Vesting - 0.5 0.2 - 0.7 0.1 0.0 - - 0.1 Less: Pre-Tax Capitalized Software Development Expensed in Q1 and Q2 - - (0.8) - (0.8) - - - - - Add: Pre-Tax Capitalized Software Development Capitalized in Q3 0.2 0.7 - - 0.8 - - - - - Less: Pre-Tax One-Time Sale of Non-Core Product Inventory - (1.4) - - (1.4) - - - - - Adjusted EBITDA 24.2$ 20.9$ 21.5$ 13.7$ 80.3$ 16.1$ (11.4)$ 16.9$ 16.2$ 37.9$
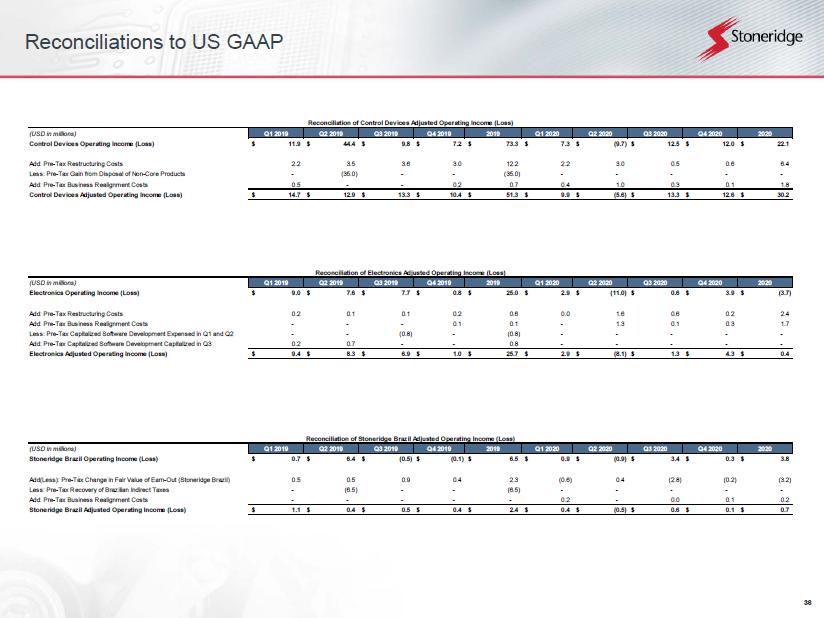
36 Reconciliations to US GAAP Reconciliation of Control Devices Adjusted Operating Income (Loss) (USD in millions) Q1 2019 Q2 2019 Q3 2019 Q4 2019 2019 Q1 2020 Q2 2020 Q3 2020 Q4 2020 2020 Control Devices Operating Income (Loss) 11.9$ 44.4$ 9.8$ 7.2$ 73.3$ 7.3$ (9.7)$ 12.5$ 12.0$ 22.1$ Add: Pre-Tax Restructuring Costs 2.2 3.5 3.6 3.0 12.2 2.2 3.0 0.5 0.6 6.4 Less: Pre-Tax Gain from Disposal of Non-Core Products - (35.0) - - (35.0) - - - - - Add: Pre-Tax Business Realignment Costs 0.5 - - 0.2 0.7 0.4 1.0 0.3 0.1 1.8 Control Devices Adjusted Operating Income (Loss) 14.7$ 12.9$ 13.3$ 10.4$ 51.3$ 9.9$ (5.6)$ 13.3$ 12.6$ 30.2$ Reconciliation of Electronics Adjusted Operating Income (Loss) (USD in millions) Q1 2019 Q2 2019 Q3 2019 Q4 2019 2019 Q1 2020 Q2 2020 Q3 2020 Q4 2020 2020 Electronics Operating Income (Loss) 9.0$ 7.6$ 7.7$ 0.8$ 25.0$ 2.9$ (11.0)$ 0.6$ 3.9$ (3.7)$ Add: Pre-Tax Restructuring Costs 0.2 0.1 0.1 0.2 0.6 0.0 1.6 0.6 0.2 2.4 Add: Pre-Tax Business Realignment Costs - - - 0.1 0.1 - 1.3 0.1 0.3 1.7 Less: Pre-Tax Capitalized Software Development Expensed in Q1 and Q2 - - (0.8) - (0.8) - - - - - Add: Pre-Tax Capitalized Software Development Capitalized in Q3 0.2 0.7 - - 0.8 - - - - - Electronics Adjusted Operating Income (Loss) 9.4$ 8.3$ 6.9$ 1.0$ 25.7$ 2.9$ (8.1)$ 1.3$ 4.3$ 0.4$ Reconciliation of Stoneridge Brazil Adjusted Operating Income (Loss) (USD in millions) Q1 2019 Q2 2019 Q3 2019 Q4 2019 2019 Q1 2020 Q2 2020 Q3 2020 Q4 2020 2020 Stoneridge Brazil Operating Income (Loss) 0.7$ 6.4$ (0.5)$ (0.1)$ 6.5$ 0.9$ (0.9)$ 3.4$ 0.3$ 3.8$ Add(Less): Pre-Tax Change in Fair Value of Earn-Out (Stoneridge Brazil) 0.5 0.5 0.9 0.4 2.3 (0.6) 0.4 (2.8) (0.2) (3.2) Less: Pre-Tax Recovery of Brazilian Indirect Taxes - (6.5) - - (6.5) - - - - - Add: Pre-Tax Business Realignment Costs - - - - - 0.2 - 0.0 0.1 0.2 Stoneridge Brazil Adjusted Operating Income (Loss) 1.1$ 0.4$ 0.5$ 0.4$ 2.4$ 0.4$ (0.5)$ 0.6$ 0.1$ 0.7$
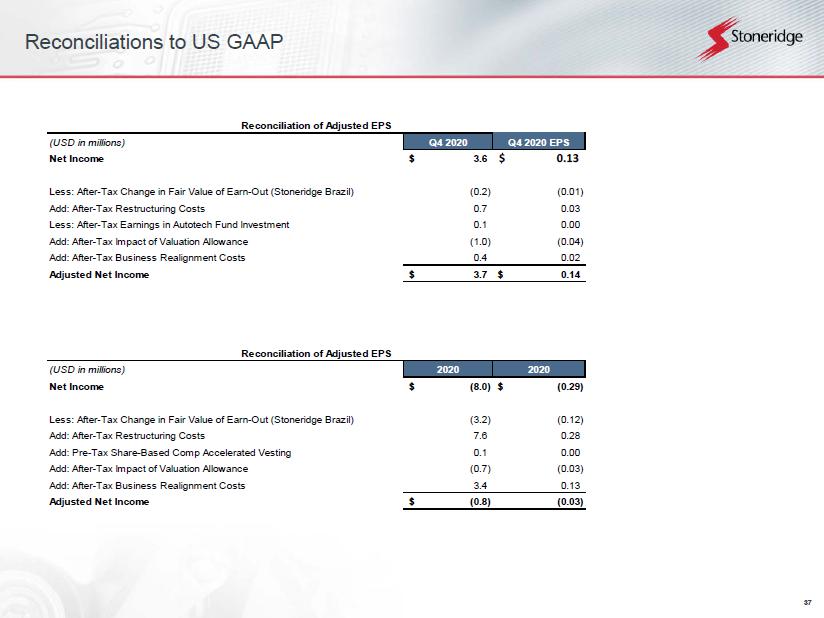
37 Reconciliations to US GAAP Reconciliation of Adjusted EPS (USD in millions) Q4 2020 Q4 2020 EPS Net Income 3.6$ 0.13$ Less: After-Tax Change in Fair Value of Earn-Out (Stoneridge Brazil) (0.2) (0.01) Add: After-Tax Restructuring Costs 0.7 0.03 Less: After-Tax Earnings in Autotech Fund Investment 0.1 0.00 Add: After-Tax Impact of Valuation Allowance (1.0) (0.04) Add: After-Tax Business Realignment Costs 0.4 0.02 Adjusted Net Income 3.7$ 0.14$ Reconciliation of Adjusted EPS (USD in millions) 2020 2020 Net Income (8.0)$ (0.29)$ Less: After-Tax Change in Fair Value of Earn-Out (Stoneridge Brazil) (3.2) (0.12) Add: After-Tax Restructuring Costs 7.6 0.28 Add: Pre-Tax Share-Based Comp Accelerated Vesting 0.1 0.00 Add: After-Tax Impact of Valuation Allowance (0.7) (0.03) Add: After-Tax Business Realignment Costs 3.4 0.13 Adjusted Net Income (0.8)$ (0.03)
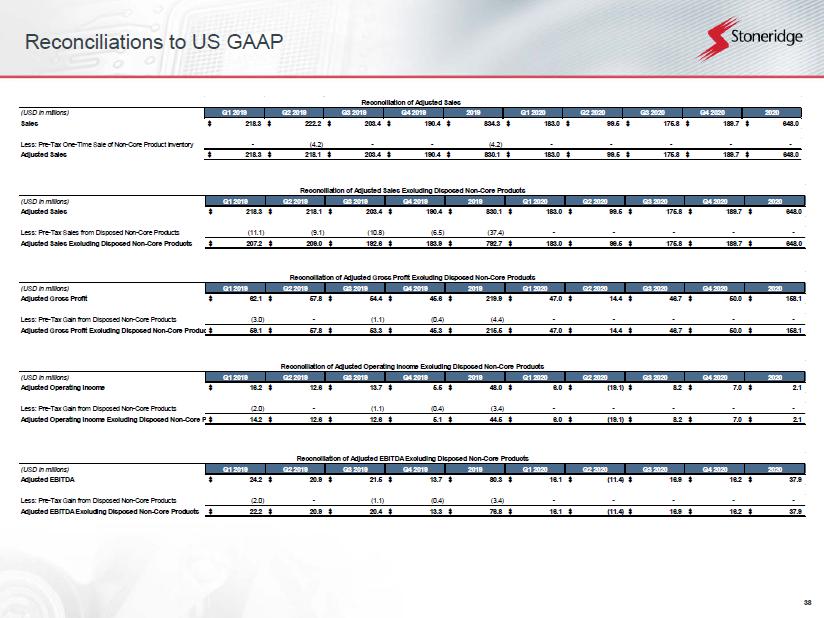
38 Reconciliations to US GAAP Reconciliation of Adjusted Sales (USD in millions) Q1 2019 Q2 2019 Q3 2019 Q4 2019 2019 Q1 2020 Q2 2020 Q3 2020 Q4 2020 2020 Sales 218.3$ 222.2$ 203.4$ 190.4$ 834.3$ 183.0$ 99.5$ 175.8$ 189.7$ 648.0$ Less: Pre-Tax One-Time Sale of Non-Core Product Inventory - (4.2) - - (4.2) - - - - - Adjusted Sales 218.3$ 218.1$ 203.4$ 190.4$ 830.1$ 183.0$ 99.5$ 175.8$ 189.7$ 648.0$ Reconciliation of Adjusted Sales Excluding Disposed Non-Core Products (USD in millions) Q1 2019 Q2 2019 Q3 2019 Q4 2019 2019 Q1 2020 Q2 2020 Q3 2020 Q4 2020 2020 Adjusted Sales 218.3$ 218.1$ 203.4$ 190.4$ 830.1$ 183.0$ 99.5$ 175.8$ 189.7$ 648.0$ Less: Pre-Tax Sales from Disposed Non-Core Products (11.1) (9.1) (10.8) (6.5) (37.4) - - - - - Adjusted Sales Excluding Disposed Non-Core Products 207.2$ 209.0$ 192.6$ 183.9$ 792.7$ 183.0$ 99.5$ 175.8$ 189.7$ 648.0$ Reconciliation of Adjusted Gross Profit Excluding Disposed Non-Core Products (USD in millions) Q1 2019 Q2 2019 Q3 2019 Q4 2019 2019 Q1 2020 Q2 2020 Q3 2020 Q4 2020 2020 Adjusted Gross Profit 62.1$ 57.8$ 54.4$ 45.6$ 219.9$ 47.0$ 14.4$ 46.7$ 50.0$ 158.1$ Less: Pre-Tax Gain from Disposed Non-Core Products (3.0) - (1.1) (0.4) (4.4) - - - - - Adjusted Gross Profit Excluding Disposed Non-Core Products 59.1$ 57.8$ 53.3$ 45.3$ 215.5$ 47.0$ 14.4$ 46.7$ 50.0$ 158.1$ Reconciliation of Adjusted Operating Income Excluding Disposed Non-Core Products (USD in millions) Q1 2019 Q2 2019 Q3 2019 Q4 2019 2019 Q1 2020 Q2 2020 Q3 2020 Q4 2020 2020 Adjusted Operating Income 16.2$ 12.6$ 13.7$ 5.5$ 48.0$ 6.0$ (19.1)$ 8.2$ 7.0$ 2.1$ Less: Pre-Tax Gain from Disposed Non-Core Products (2.0) - (1.1) (0.4) (3.4) - - - - - Adjusted Operating Income Excluding Disposed Non-Core Products 14.2$ 12.6$ 12.6$ 5.1$ 44.5$ 6.0$ (19.1)$ 8.2$ 7.0$ 2.1$ Reconciliation of Adjusted EBITDA Excluding Disposed Non-Core Products (USD in millions) Q1 2019 Q2 2019 Q3 2019 Q4 2019 2019 Q1 2020 Q2 2020 Q3 2020 Q4 2020 2020 Adjusted EBITDA 24.2$ 20.9$ 21.5$ 13.7$ 80.3$ 16.1$ (11.4)$ 16.9$ 16.2$ 37.9$ Less: Pre-Tax Gain from Disposed Non-Core Products (2.0) - (1.1) (0.4) (3.4) - - - - - Adjusted EBITDA Excluding Disposed Non-Core Products 22.2$ 20.9$ 20.4$ 13.3$ 76.8$ 16.1$ (11.4)$ 16.9$ 16.2$ 37.9$
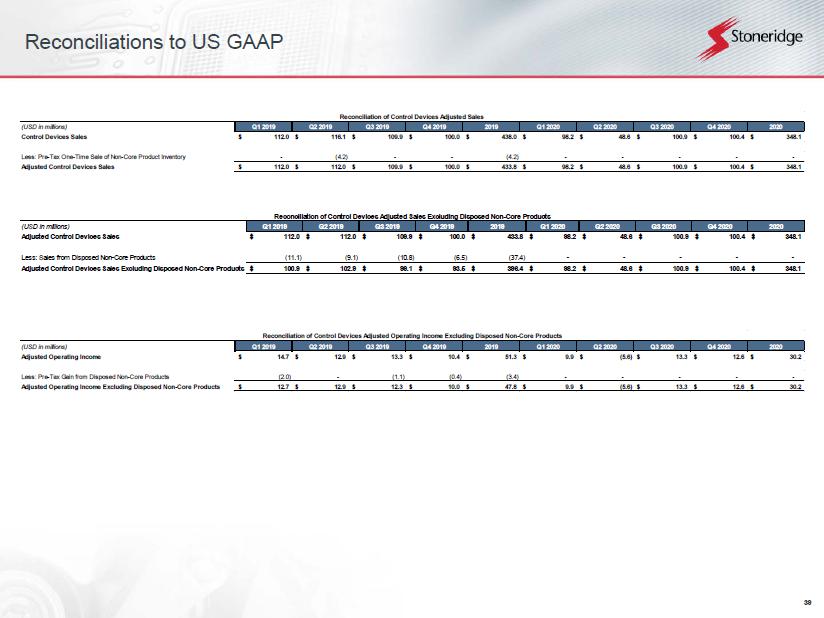
39 Reconciliations to US GAAP Reconciliation of Control Devices Adjusted Sales Excluding Disposed Non-Core Products (USD in millions) Q1 2019 Q2 2019 Q3 2019 Q4 2019 2019 Q1 2020 Q2 2020 Q3 2020 Q4 2020 2020 Adjusted Control Devices Sales 112.0$ 112.0$ 109.9$ 100.0$ 433.8$ 98.2$ 48.6$ 100.9$ 100.4$ 348.1$ Less: Sales from Disposed Non-Core Products (11.1) (9.1) (10.8) (6.5) (37.4) - - - - - Adjusted Control Devices Sales Excluding Disposed Non-Core Products 100.9$ 102.9$ 99.1$ 93.5$ 396.4$ 98.2$ 48.6$ 100.9$ 100.4$ 348.1$ Reconciliation of Control Devices Adjusted Sales (USD in millions) Q1 2019 Q2 2019 Q3 2019 Q4 2019 2019 Q1 2020 Q2 2020 Q3 2020 Q4 2020 2020 Control Devices Sales 112.0$ 116.1$ 109.9$ 100.0$ 438.0$ 98.2$ 48.6$ 100.9$ 100.4$ 348.1$ Less: Pre-Tax One-Time Sale of Non-Core Product Inventory - (4.2) - - (4.2) - - - - - Adjusted Control Devices Sales 112.0$ 112.0$ 109.9$ 100.0$ 433.8$ 98.2$ 48.6$ 100.9$ 100.4$ 348.1$ Reconciliation of Control Devices Adjusted Operating Income Excluding Disposed Non-Core Products (USD in millions) Q1 2019 Q2 2019 Q3 2019 Q4 2019 2019 Q1 2020 Q2 2020 Q3 2020 Q4 2020 2020 Adjusted Operating Income 14.7$ 12.9$ 13.3$ 10.4$ 51.3$ 9.9$ (5.6)$ 13.3$ 12.6$ 30.2$ Less: Pre-Tax Gain from Disposed Non-Core Products (2.0) - (1.1) (0.4) (3.4) - - - - - Adjusted Operating Income Excluding Disposed Non-Core Products 12.7$ 12.9$ 12.3$ 10.0$ 47.8$ 9.9$ (5.6)$ 13.3$ 12.6$ 30.2$
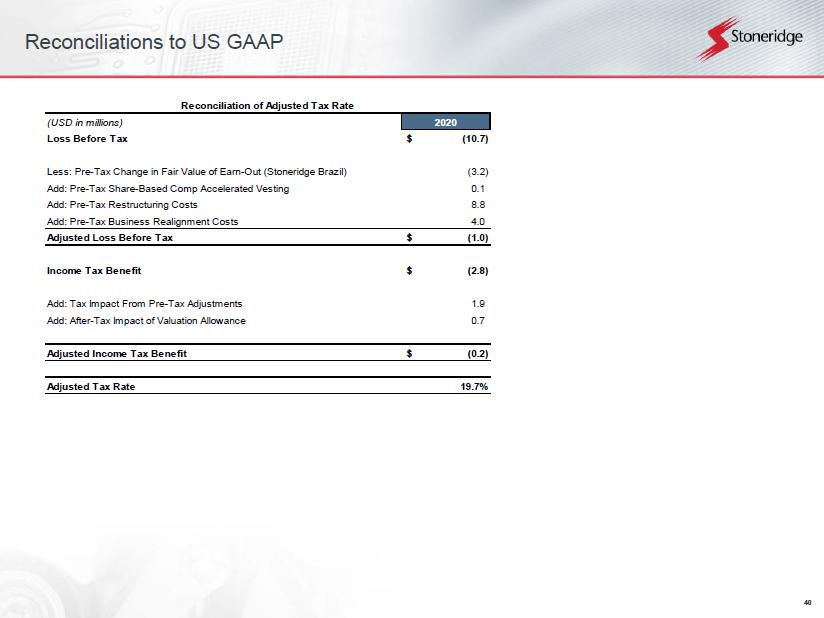
40 Reconciliations to US GAAP Reconciliation of Adjusted Tax Rate (USD in millions) 2020 Loss Before Tax (10.7)$ Less: Pre-Tax Change in Fair Value of Earn-Out (Stoneridge Brazil) (3.2) Add: Pre-Tax Share-Based Comp Accelerated Vesting 0.1 Add: Pre-Tax Restructuring Costs 8.8 Add: Pre-Tax Business Realignment Costs 4.0 Adjusted Loss Before Tax (1.0)$ Income Tax Benefit (2.8)$ Add: Tax Impact From Pre-Tax Adjustments 1.9 Add: After-Tax Impact of Valuation Allowance 0.7 Adjusted Income Tax Benefit (0.2)$ Adjusted Tax Rate 19.7%
