sri-20230503
0001043337FALSE00010433372023-05-032023-05-03

UNITED STATES
SECURITIES AND EXCHANGE COMMISSION
Washington, D.C. 20549
FORM 8-K
CURRENT REPORT
Pursuant to Section 13 or 15(d) of the
Securities Exchange Act of 1934
Date of Report (Date of earliest event reported): May 3, 2023
STONERIDGE, INC.
(Exact Name of Registrant as Specified in its Charter)
Ohio001-1333734-1598949
(State or Other Jurisdiction
of Incorporation)
(Commission
File Number)
(I.R.S. Employer
Identification No.)
39675 MacKenzie DriveSuite 400NoviMichigan 48377
(Address of principal executive offices, and Zip Code)
(248489-9300
Registrant’s Telephone Number, Including Area Code
Check the appropriate box below if the Form 8-K filing is intended to simultaneously satisfy the filing obligation of the registrant under any of the following provisions (see General Instruction A.2. below):
oWritten communications pursuant to Rule 425 under the Securities Act (17 CFR 230.425)
oSoliciting material pursuant to Rule 14a-12 under the Exchange Act (17 CFR 240.14a-12)
oPre-commencement communications pursuant to Rule 14d-2(b) under the Exchange Act (17 CFR 240.14d-2(b))
oPre-commencement communications pursuant to Rule 13e-4(c) under the Exchange Act (17 CFR 240.13e-4(c))
Securities registered pursuant to Section 12(b) of the Act:
Title of each classTrading Symbol(s)Name of each exchange on which registered
Common Shares, without par valueSRINew York Stock Exchange
Indicate by check mark whether the registrant is an emerging growth company as defined in Rule 405 of the Securities Act of 1933 (§230.405 of this chapter) or Rule 12b-2 of the Securities Exchange Act of 1934 (§240.12b-2 of this chapter).
Emerging growth companyo
If an emerging growth company, indicate by check mark if the registrant has elected not to use the extended transition period for complying with any new or revised financial accounting standards provided pursuant to Section 13(a) of the Exchange Act. o


ITEM 2.02    Results of Operations and Financial Condition.
On May 3, 2023, Stoneridge, Inc. (the “Company”) issued a press release announcing its results for the first quarter ended March 31, 2023. A copy of the press release is attached hereto as Exhibit 99.1. On May 4, 2023, members of the Company’s management will hold a first quarter 2023 earnings conference call to discuss the Company’s financial results and the presentation attached hereto as Exhibit 99.2, will accompany management’s comments.
The press release and earnings conference call presentation contain certain non-GAAP financial measures, including Adjusted Sales, Adjusted Gross Profit and Margin, Adjusted Operating Income (Loss) and Margin, Adjusted Income (Loss) Before Tax, Adjusted Net Income (Loss), Adjusted Earnings (Loss) per Share (“Adjusted EPS”), Earnings Before Interest, Taxes, Depreciation and Amortization (“EBITDA”), EBITDA Margin, Adjusted EBITDA, Adjusted EBITDA Margin, Adjusted Income Tax Expense (Benefit) and Adjusted Tax Rate (collectively, the “Non-GAAP Financial Measures”). Management believes that the presentation of the Non-GAAP Financial Measures used in the press release and earnings conference call presentation are useful to both management and investors in their analysis of the Company’s financial position, results of operations and expected results of operations because the Non-GAAP Financial Measures facilitate a period to period comparison of operating results by excluding significant unusual, non-recurring items in 2023 and 2022. For 2023, these items relate to the sales from spot purchase recoveries, after-tax and pre-tax business realignment costs, after-tax and pre-tax gain on disposal of fixed assets and after-tax and pre-tax environmental remediation costs. For 2022, these items relate to sales from spot purchase recoveries, pre-tax business realignment costs and pre-tax Brazilian indirect tax credits, net. These non-GAAP financial measures, however, should not be considered in isolation or as a substitute for the most comparable GAAP financial measures. Investors are cautioned that non-GAAP financial measures used by the Company may not be comparable to non-GAAP financial measures used by other companies. Adjusted Sales, Adjusted Gross Profit and Margin, Adjusted Operating Income (Loss) and Margin, Adjusted Income (Loss) Before Tax, Adjusted Net Income (Loss), Adjusted EPS, EBITDA, EBITDA Margin, Adjusted EBITDA, Adjusted EBITDA Margin, Adjusted Income Tax Expense and Adjusted Tax Rate should not be considered a substitute for Sales, Gross Profit, Operating Income (Loss), Income (Loss) Before Tax, Net Income (Loss), Earnings (Loss) per Share, Income Tax Expense or Tax Rate prepared in accordance with GAAP.
ITEM 7.01    Regulation FD Disclosure.
The information set forth in Item 2.02 above is hereby incorporated herein by reference.
The information in this report, including the press release and the earnings conference call presentation furnished as Exhibits 99.1 and 99.2 hereto, shall not be deemed to be “filed” for purposes of Section 18 of the Securities and Exchange Act of 1934, as amended (the “Exchange Act”), or otherwise subject to the liabilities of that Section, and shall not be incorporated by reference into any filing under the Securities Act of 1933, as amended, or the Exchange Act, except as shall be expressly set forth by specific reference in such a filing. In addition, the exhibits furnished herewith contain statements intended as “forward-looking statements” that are subject to the cautionary statements about forward-looking statements set forth in such exhibits.
ITEM 9.01    Financial Statements and Exhibits.
(d)    Exhibits
Exhibit No.Description
104Cover Page Interactive Data File (the Cover Page Interactive Data File is embedded within the Inline XBRL document)


SIGNATURES
Pursuant to the requirements of the Securities Exchange Act of 1934, the registrant has duly caused this report to be signed on its behalf by the undersigned hereunto duly authorized.
Stoneridge, Inc.
Date: May 3, 2023/s/ Matthew R. Horvath
Matthew R. Horvath
Chief Financial Officer and Treasurer
(Principal Financial Officer)


Exhibit 99.1
tm2229541d1_ex99-1img01.jpg

FOR IMMEDIATE RELEASE
Stoneridge Reports First Quarter 2023 Results

FIRST QUARTER REVENUE AND EARNINGS OUTPERFORM PREVIOUSLY PROVIDED EXPECTATIONS

REAFFIRMING 2023 FULL-YEAR GUIDANCE

2023 First Quarter Results
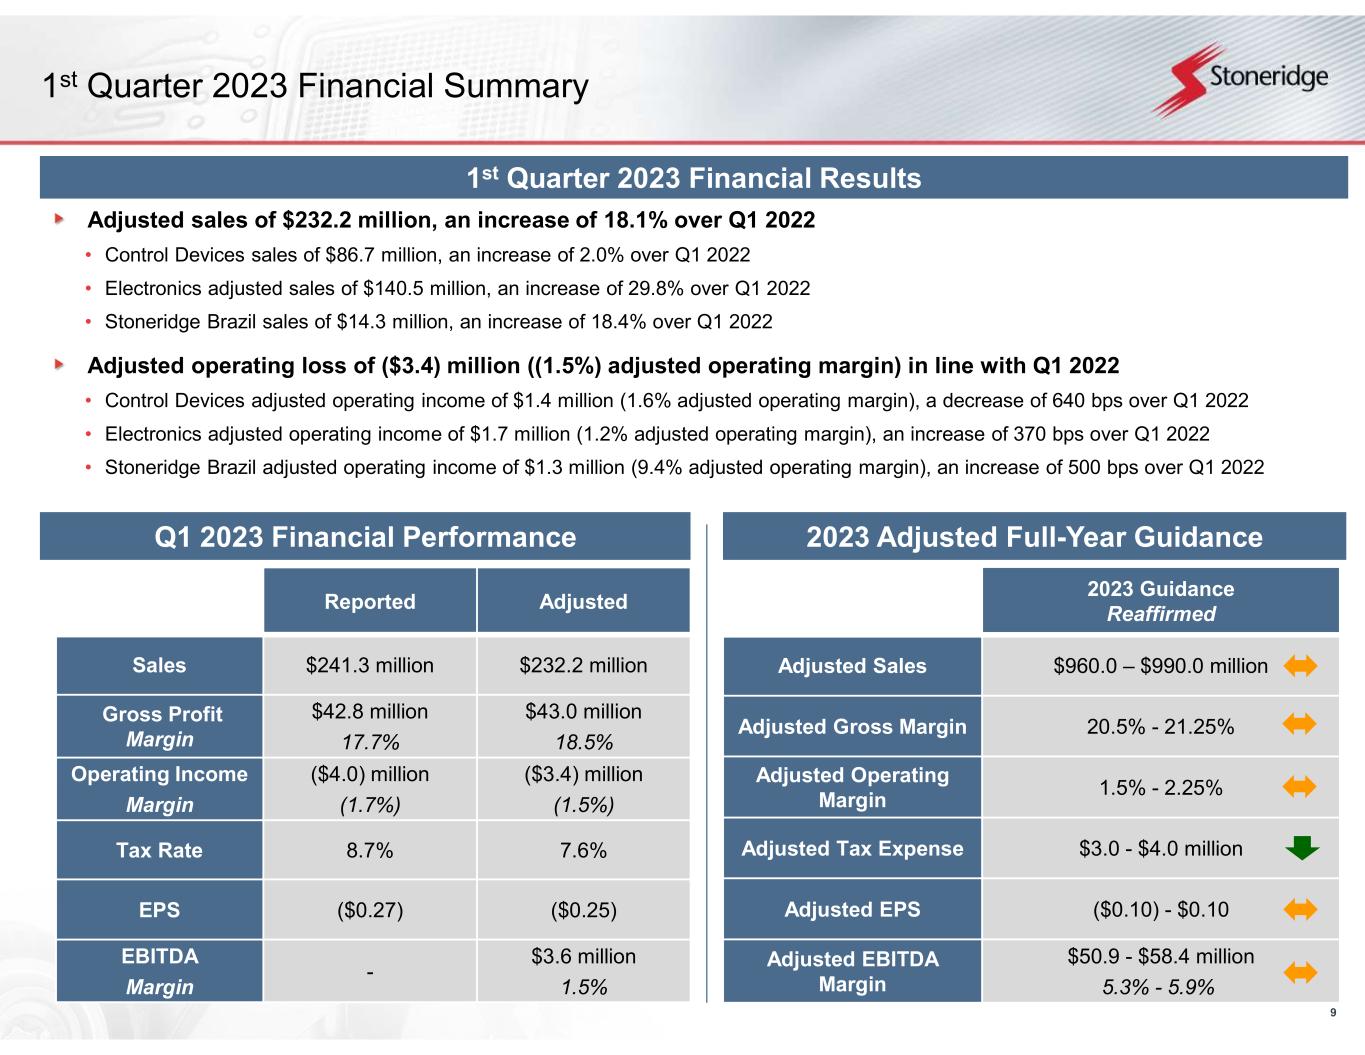
Sales of $241.3 million
Adjusted sales of $232.2 million
Gross profit of $42.8 million
Adjusted gross profit of $43.0 million (18.5% of adjusted sales)
Operating loss of $(4.0) million
Adjusted operating loss of $(3.4) million ((1.5)% of adjusted sales)
Adjusted EBITDA of $3.6 million (1.5% of adjusted sales)
Loss per share (“EPS”) of $(0.27)
Adjusted loss per share of $(0.25)
Reaffirming 2023 Full-year Guidance
Adjusted EPS of $(0.10) - $0.10 (break-even midpoint)
Adjusted sales of $960.0 - $990.0 million
Adjusted gross margin of 20.5% - 21.25%
Adjusted operating margin of 1.5% - 2.25%
Adjusted EBITDA margin of 5.3% - 5.9% ($50.9 - $58.4 million)
Updating adjusted tax expense guidance to $3.0 to $4.0 million (mid-point improvement of $1.5 million expected to largely be offset by incremental interest expense)

NOVI, Mich. – May 3, 2023 – Stoneridge, Inc. (NYSE: SRI) today announced financial results for the first quarter ended March 31, 2023, with sales of $241.3 million and loss per share of $(0.27). Adjusted sales for the first quarter were $232.2 million and adjusted EPS was $(0.25). Sales were adjusted to normalize the impact of electronic component spot buys recovered from customers of $9.1 million for the first quarter of 2023. The exhibits attached hereto provide reconciliation detail on this and all other normalizing adjustments of Non-GAAP financial measures used in this press release.
For the first quarter of 2023, Stoneridge reported gross profit of $42.8 million and adjusted gross profit of $43.0 million (18.5% of adjusted sales). Operating loss was $(4.0) million and adjusted operating loss was $(3.4) million ((1.5)% of adjusted sales). Adjusted EBITDA was $3.6 million (1.5% of adjusted sales).
Jim Zizelman, president and chief executive officer, commented, “Our first quarter financial performance exceeded the expectations that we outlined on our fourth quarter earnings call for both adjusted revenue and
1


adjusted earnings per share primarily driven by strong revenue growth in our commercial vehicle end-markets and effective management of operating costs. We remain focused on operational excellence within our manufacturing facilities to drive gross margin improvement. Similarly, we expect margin expansion as we progress through the year as we finalize customer price agreements, recognize fixed cost leverage on revenue growth and focus on continued structural cost reductions.”
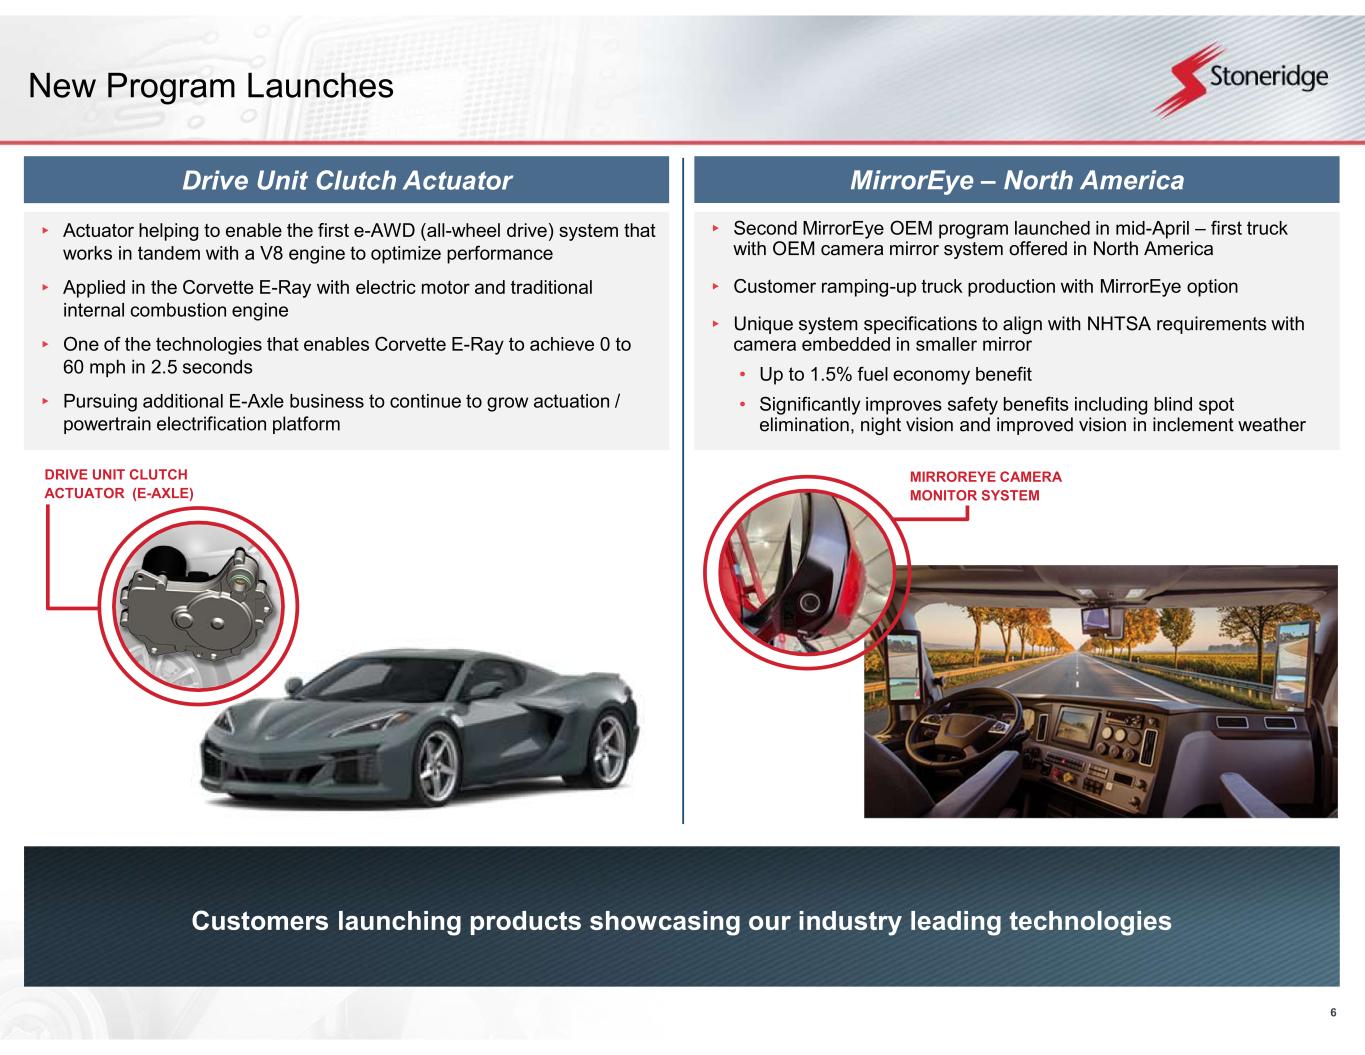
Zizelman continued, “Despite continued macroeconomic challenges in the first quarter of 2023, we remained focused on executing on our long-term growth strategy. In Control Devices, our first drive clutch actuator program, often referred to as the e-axle disconnect actuator, is one of the enabling technologies on the recently announced Corvette E-Ray. This actuator helps to enable the first electric all-wheel drive system that works in tandem with a V8 engine to optimize performance and represents another step forward in our powertrain electrification and actuation strategy. Similarly, we continued to make progress with our MirrorEye platform, focusing on our first OEM program in North America that launched in mid-April. Utilizing our existing platform, this system is unique in that it includes the camera embedded in a smaller production mirror to comply with the NHTSA requirements. These products showcase the execution of our long-term strategy across our entire portfolio as we continue to provide industry leading technologies to our customers.”
First Quarter in Review
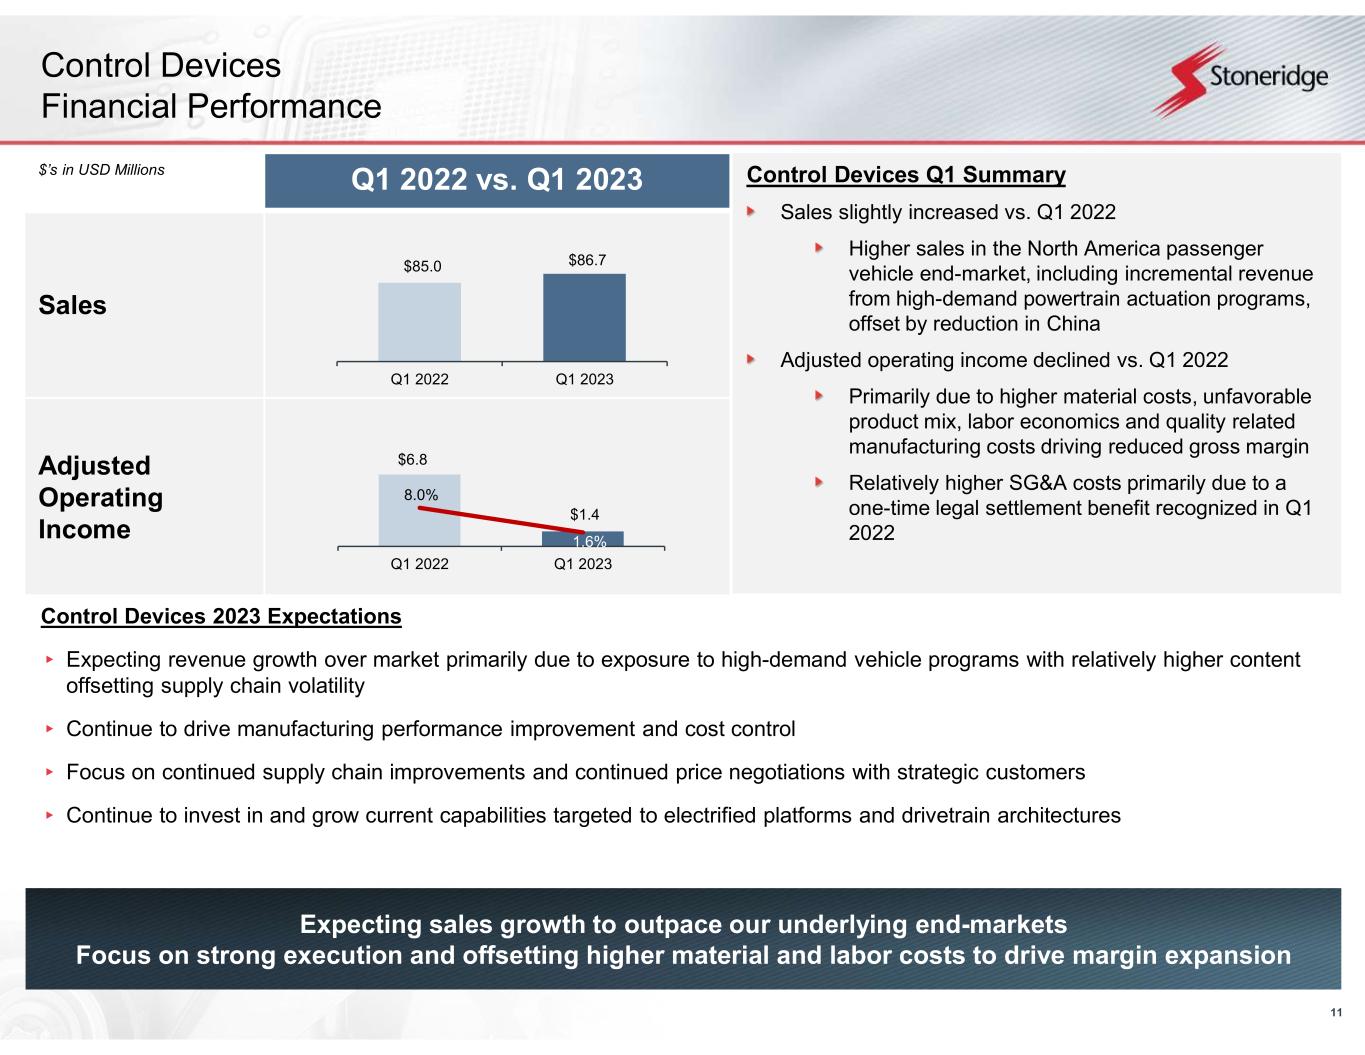
Control Devices sales totaled $86.7 million, an increase of 2.0% relative to sales in the first quarter of 2022. This increase was primarily due to higher sales volumes in the North America passenger vehicle end-market, including incremental revenue from high demand actuation programs, partially offset by reductions in customer production volumes in China end-markets, particularly in the beginning of the quarter. First quarter adjusted operating margin was 1.6%, a 640 basis point reduction relative to the first quarter of 2022, primarily due to higher material costs as a result of unfavorable product mix and inflation, increased labor costs and relatively higher SG&A costs primarily due to a one-time favorable legal settlement recognized in the first quarter of 2022.
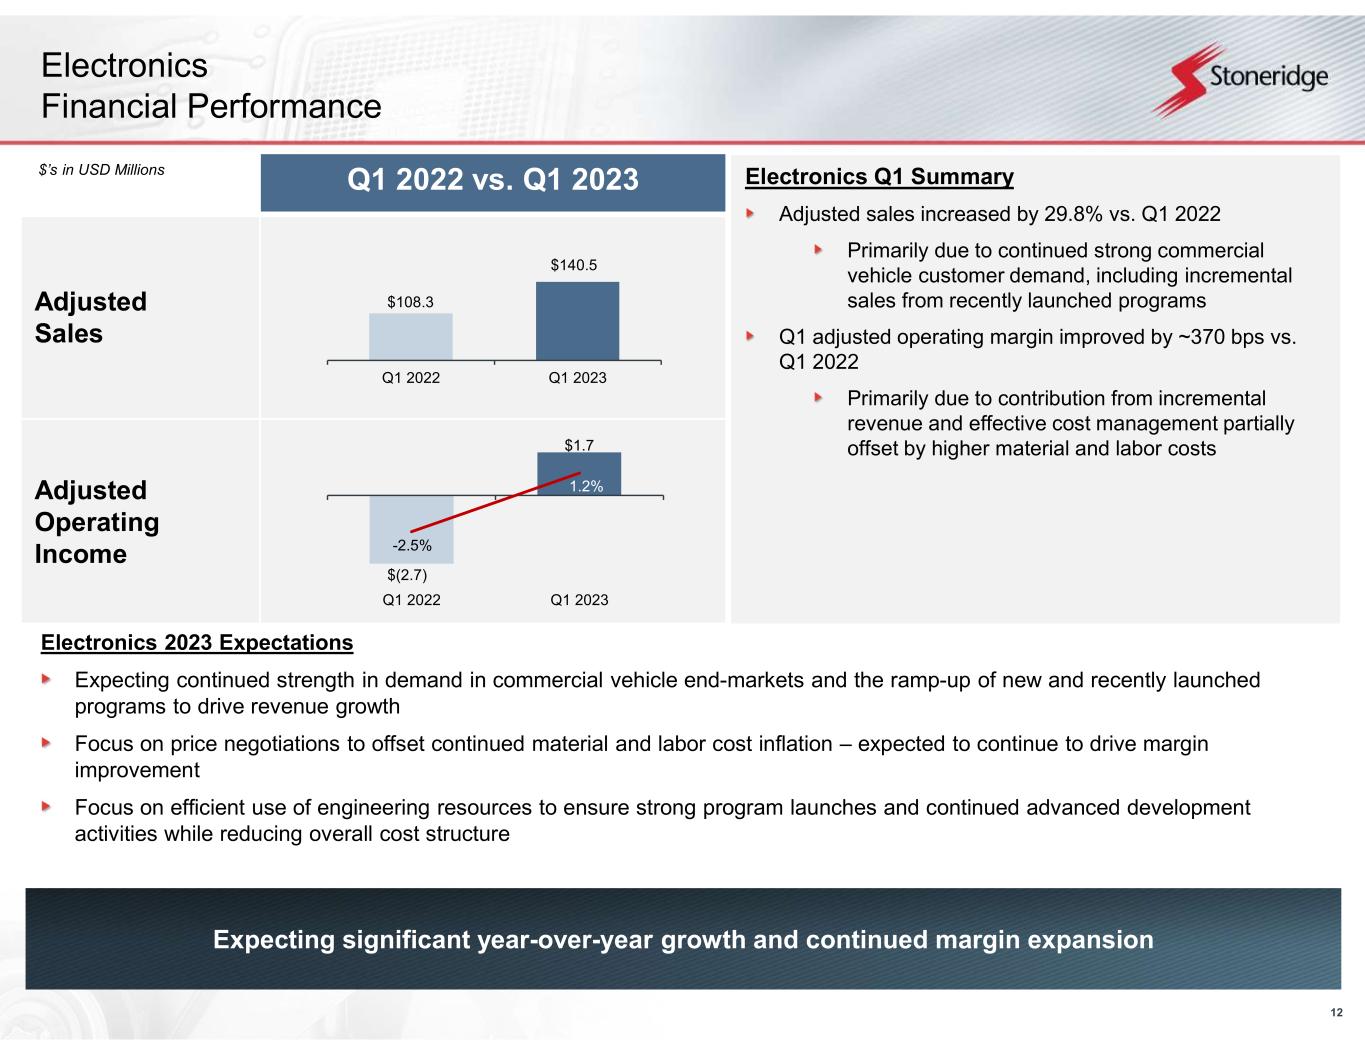
Electronics adjusted sales totaled $140.5 million, an increase of 29.8% relative to sales in the first quarter of 2022. This increase was driven by higher sales volumes in the commercial vehicle end-markets, including incremental sales from the ramp-up of recently-launched programs. This growth was partially offset by lower sales volume in the European off-highway vehicle end-market, primarily in the beginning of the quarter, and the unfavorable impact of foreign currency relative to the first quarter of 2022. First quarter adjusted operating margin was 1.2%, an improvement of 370 basis points relative to the first quarter of 2022 primarily due to increased contribution margin from higher sales, offset by an increase in material costs due to unfavorable foreign currency impact and inflation.
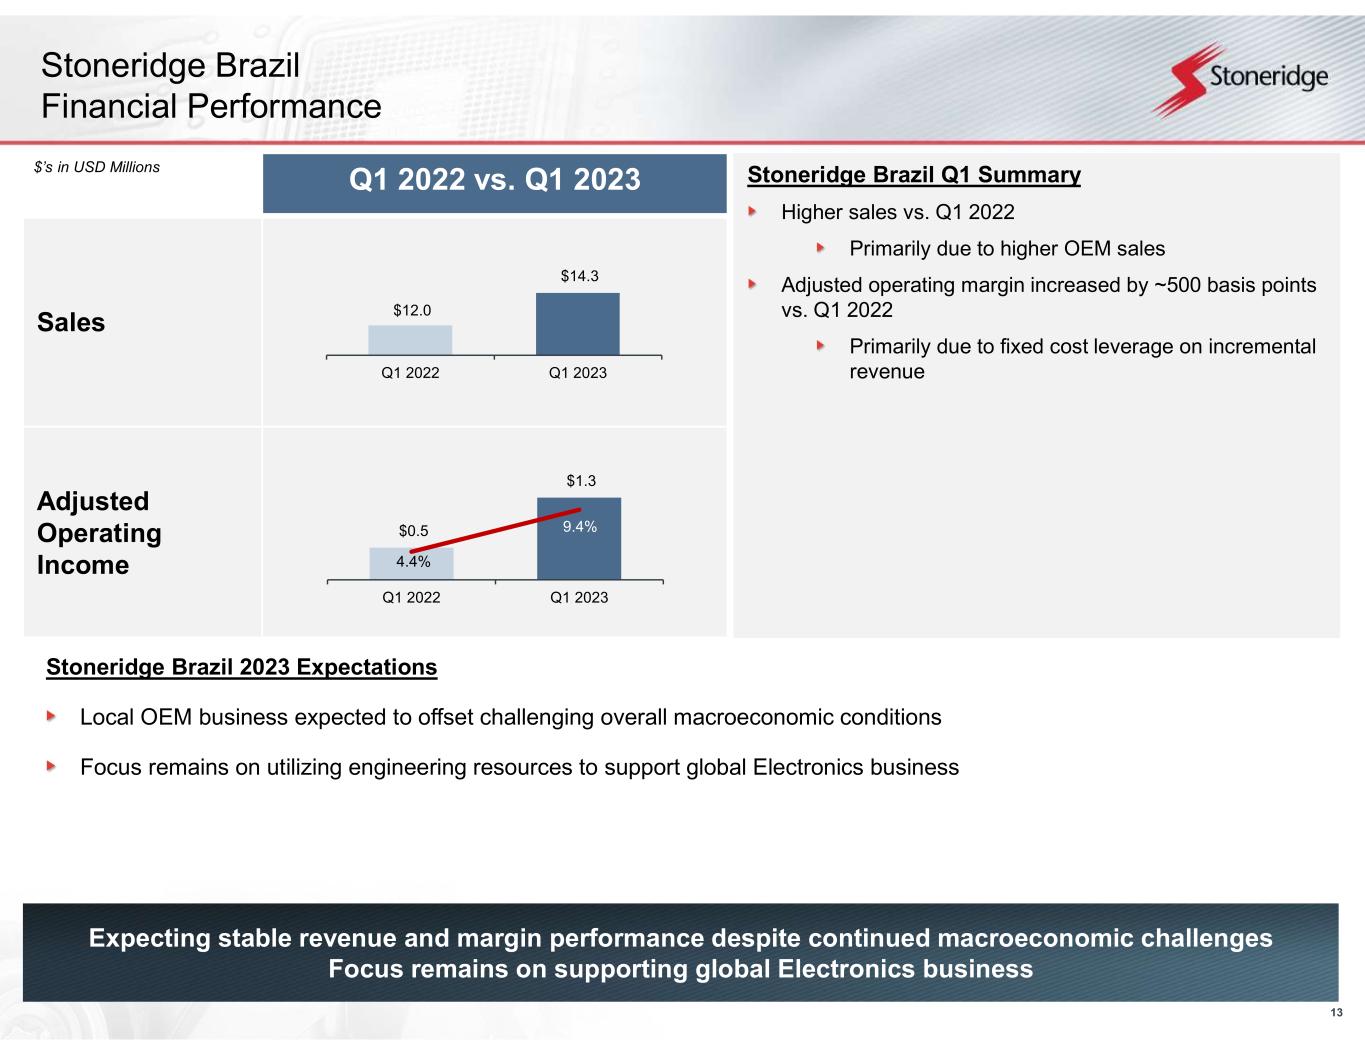
Stoneridge Brazil sales were $14.3 million, an increase of 18.4% relative to sales in the first quarter of 2022, primarily due to higher sales in OEM products. First quarter adjusted operating margin was 9.4%, an improvement of approximately 500 basis points, primarily due to contribution on higher sales.

Cash and Debt Balances
As of March 31, 2023, Stoneridge had cash and cash equivalents balances totaling $35.2 million. Total debt as of March 31, 2023 was $168.8 million.
The Company remains in compliance with the amended credit facility and expects to remain in compliance for the remainder of the year as financial performance is expected to continue to improve resulting in reduced leverage ratios.
The Company continues to focus on operating performance and working capital improvement to drive cash performance. As a result, the Company continues to expect that the net debt to EBITDA ratio will return to a
2


more normalized level by the end of 2023 and is targeting a long-term net debt to EBITDA leverage ratio under 2.5x.

2023 Outlook
The Company reaffirmed its 2023 full-year guidance including adjusted sales guidance of $960.0 million to $990.0 million, adjusted gross margin guidance of 20.5% to 21.25%, adjusted operating margin guidance of 1.5% to 2.25% and adjusted EBITDA of $50.9 million to $58.4 million or 5.3% - 5.9% of adjusted sales.
The Company also reaffirmed full-year adjusted earnings per share guidance of $(0.10) to $0.10. The Company is reducing its full-year adjusted tax expense expectations to $3.0 million - $4.0 million. This represents a midpoint reduction of $1.5 million that is expected to be partially offset by incremental interest expense.
Matt Horvath, chief financial officer, commented “First quarter performance exceeded our previously provided expectations from both an adjusted revenue and adjusted EPS perspective, putting us in a good position to achieve our full-year 2023 guidance. As a result, we are reaffirming our full-year guidance with some relatively minor and offsetting adjustments to expected tax and interest expense.”
Horvath concluded, “We remain focused on operational excellence within our manufacturing facilities to drive gross margin improvement as well as continued price negotiations with our customers to offset incremental input costs including material and labor-related costs. Similarly, we expect to carefully manage our cost structure to ensure that the revenue growth we expect for the remainder of the year drives earnings performance going forward.”
Conference Call on the Web
A live Internet broadcast of Stoneridge’s conference call regarding 2023 first quarter results can be accessed at 9:00 a.m. Eastern Time on Thursday, May 4, 2023, at www.stoneridge.com, which will also offer a webcast replay.
About Stoneridge, Inc.
Stoneridge, Inc., headquartered in Novi, Michigan, is a global designer and manufacturer of highly engineered electrical and electronic systems, components and modules for the automotive, commercial, off-highway and agricultural vehicle markets. Additional information about Stoneridge can be found at www.stoneridge.com.
Forward-Looking Statements
Statements in this press release contain “forward-looking statements” under the Private Securities Litigation Reform Act of 1995. These statements appear in a number of places in this report and may include statements regarding the intent, belief or current expectations of the Company, with respect to, among other things, our (i) future product and facility expansion, (ii) acquisition strategy, (iii) investments and new product development, (iv) growth opportunities related to awarded business, and (v) operational expectations. Forward-looking statements may be identified by the words “will,” “may,” “should,” “designed to,” “believes,” “plans,” “projects,” “intends,” “expects,” “estimates,” “anticipates,” “continue,” and similar words and expressions. The forward-looking statements are subject to risks and uncertainties that could cause actual events or results to differ materially from those expressed in or implied by the statements. Important factors that could cause actual results to differ materially from those in the forward-looking statements include, among other factors:
the ability of our suppliers to supply us with parts and components at competitive prices on a timely basis, including the impact of potential tariffs and trade considerations on their operations and output;
fluctuations in the cost and availability of key materials (including semiconductors, printed circuit boards, resin, aluminum, steel and copper) and components and our ability to offset cost increases through negotiated price increases with our customers or other cost reduction actions, as necessary;
3


global economic trends, competition and geopolitical risks, including impacts from the ongoing conflict between Russia and Ukraine and the related sanctions and other measures, or an escalation of sanctions, tariffs or other trade tensions between the U.S. and China or other countries;
our ability to achieve cost reductions that offset or exceed customer-mandated selling price reductions;
the impact of COVID-19, or other future pandemics, on the global economy, and on our customers, suppliers, employees, business and cash flows;
the reduced purchases, loss or bankruptcy of a major customer or supplier;
the costs and timing of business realignment, facility closures or similar actions;
a significant change in automotive, commercial, off-highway or agricultural vehicle production;
competitive market conditions and resulting effects on sales and pricing;
foreign currency fluctuations and our ability to manage those impacts;
customer acceptance of new products;
our ability to successfully launch/produce products for awarded business;
adverse changes in laws, government regulations or market conditions, including tariffs, affecting our products or our customers’ products;
our ability to protect our intellectual property and successfully defend against assertions made against us;
liabilities arising from warranty claims, product recall or field actions, product liability and legal proceedings to which we are or may become a party, or the impact of product recall or field actions on our customers;
labor disruptions at our facilities or at any of our significant customers or suppliers;
business disruptions due to natural disasters or other disasters outside of our control;
the amount of our indebtedness and the restrictive covenants contained in the agreements governing our indebtedness, including our revolving Credit Facility;
capital availability or costs, including changes in interest rates or market perceptions;
the failure to achieve the successful integration of any acquired company or business;
risks related to a failure of our information technology systems and networks, and risks associated with current and emerging technology threats and damage from computer viruses, unauthorized access, cyber-attack and other similar disruptions; and
the items described in Part I, Item IA (“Risk Factors”) of our 10-K filed with the SEC.
The forward-looking statements contained herein represent our estimates only as of the date of this release and should not be relied upon as representing our estimates as of any subsequent date. While we may elect to update these forward-looking statements at some point in the future, we specifically disclaim any obligation to do so, whether to reflect actual results, changes in assumptions, changes in other factors affecting such forward-looking statements or otherwise.
Use of Non-GAAP Financial Information
This press release contains information about the Company’s financial results that is not presented in accordance with accounting principles generally accepted in the United States (“GAAP”). Such non-GAAP financial measures are reconciled to their closest GAAP financial measures at the end of this press release. The provision of these non-GAAP financial measures for 2023 and 2022 is not intended to indicate that Stoneridge is explicitly or implicitly providing projections on those non-GAAP financial measures, and actual results for such measures are likely to vary from those presented. The reconciliations include all information reasonably available to the Company at the date of this press release and the adjustments that management can reasonably predict.
Management believes the non-GAAP financial measures used in this press release are useful to both management and investors in their analysis of the Company’s financial position and results of operations. In particular, management believes that adjusted sales, adjusted gross profit and margin, adjusted operating income (loss) and margin, adjusted loss before tax, adjusted net loss, adjusted earnings, loss per share,
4


adjusted EBITDA, adjusted EBITDA margin, adjusted tax expense (benefit) and adjusted tax rate are useful measures in assessing the Company’s financial performance by excluding certain items that are not indicative of the Company’s core operating performance or that may obscure trends useful in evaluating the Company’s continuing operating activities. Management also believes that these measures are useful to both management and investors in their analysis of the Company’s results of operations and provide improved comparability between fiscal periods.
Adjusted sales, adjusted gross profit and margin, adjusted operating income (loss) and margin, adjusted loss before tax, adjusted net loss, adjusted loss per share, adjusted EBITDA, adjusted EBITDA margin, adjusted tax expense (benefit), adjusted tax rate should not be considered in isolation or as a substitute for sales, gross profit, operating income (loss), loss before tax, net loss, loss per share, tax expense (benefit), tax rate, cash provided by operating activities or other income statement or cash flow statement data prepared in accordance with GAAP.
For more information, contact Kelly K. Harvey, Director Investor Relations ([email protected]).

5


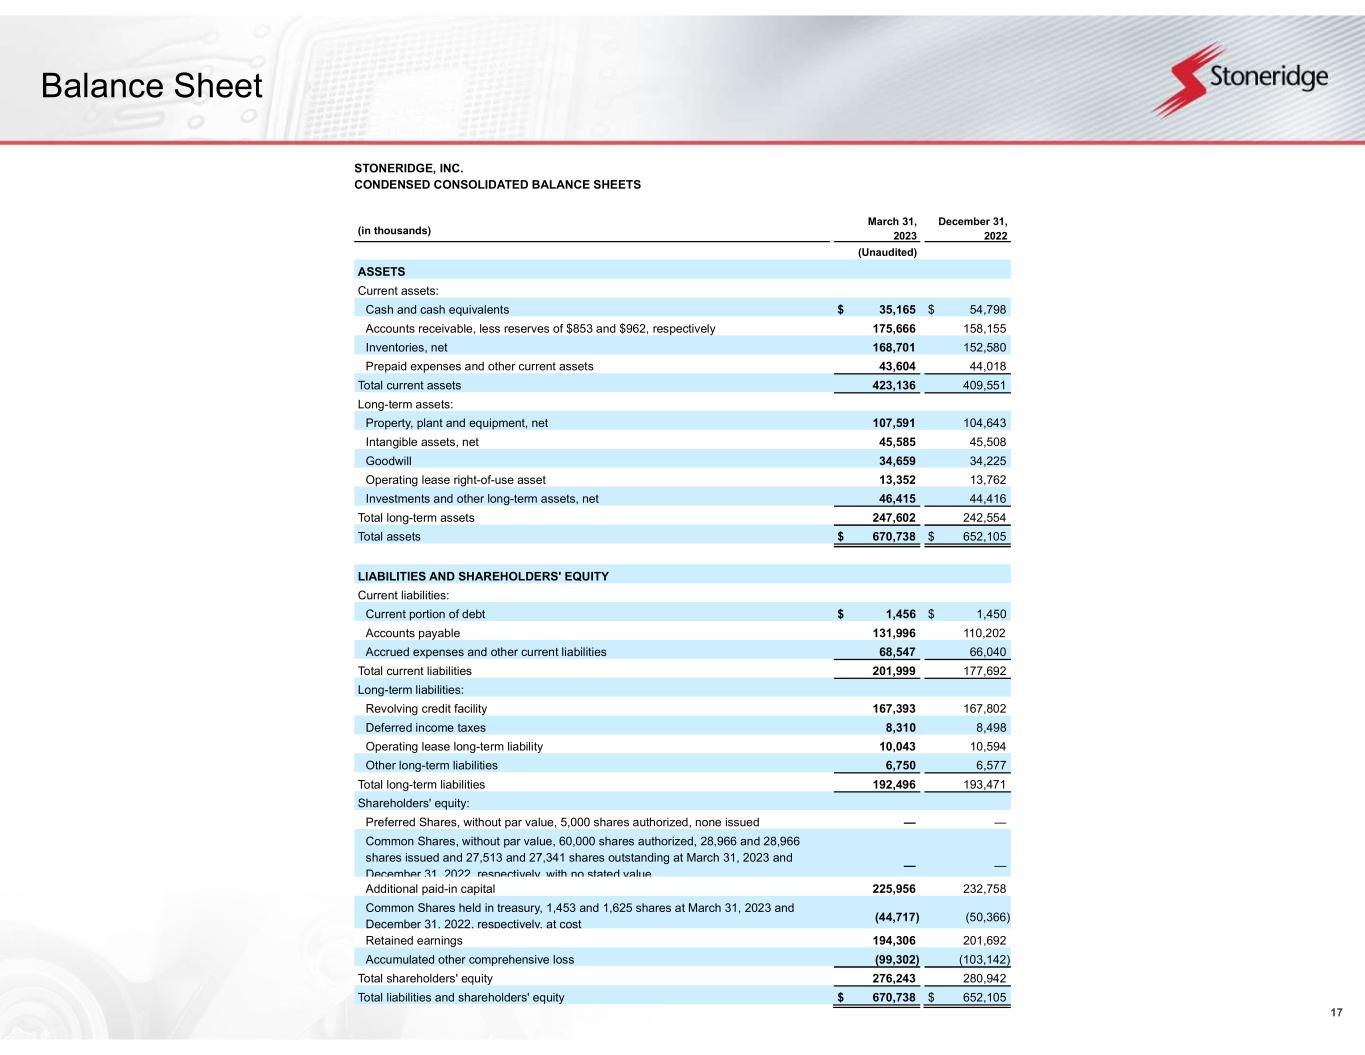
CONDENSED CONSOLIDATED BALANCE SHEETS
(in thousands)March 31,
2023
December 31,
2022
(Unaudited)
ASSETS
Current assets:
Cash and cash equivalents$35,165 $54,798 
Accounts receivable, less reserves of $853 and $962, respectively175,666 158,155 
Inventories, net168,701 152,580 
Prepaid expenses and other current assets43,604 44,018 
Total current assets423,136 409,551 
Long-term assets:
Property, plant and equipment, net107,591 104,643 
Intangible assets, net45,585 45,508 
Goodwill34,659 34,225 
Operating lease right-of-use asset13,352 13,762 
Investments and other long-term assets, net46,415 44,416 
Total long-term assets247,602 242,554 
Total assets$670,738 $652,105 
LIABILITIES AND SHAREHOLDERS' EQUITY
Current liabilities:
Current portion of debt$1,456 $1,450 
Accounts payable131,996 110,202 
Accrued expenses and other current liabilities68,547 66,040 
Total current liabilities201,999 177,692 
Long-term liabilities:
Revolving credit facility167,393 167,802 
Deferred income taxes8,310 8,498 
Operating lease long-term liability10,043 10,594 
Other long-term liabilities6,750 6,577 
Total long-term liabilities192,496 193,471 
Shareholders' equity:
Preferred Shares, without par value, 5,000 shares authorized, none issued — 
Common Shares, without par value, 60,000 shares authorized, 28,966 and 28,966 shares issued and 27,513 and 27,341 shares outstanding at March 31, 2023 and December 31, 2022, respectively, with no stated value — 
Additional paid-in capital225,956 232,758 
Common Shares held in treasury, 1,453 and 1,625 shares at March 31, 2023 and December 31, 2022, respectively, at cost(44,717)(50,366)
Retained earnings194,306 201,692 
Accumulated other comprehensive loss(99,302)(103,142)
Total shareholders' equity276,243 280,942 
Total liabilities and shareholders' equity$670,738 $652,105 
6


CONDENSED CONSOLIDATED STATEMENTS OF OPERATIONS
Three months ended
March 31,
(in thousands, except per share data)20232022
Net sales$241,325 $221,058 
Costs and expenses:
Cost of goods sold198,523 179,615 
Selling, general and administrative29,863 27,399 
Design and development16,968 17,028 
Operating loss(4,029)(2,984)
Interest expense, net2,746 1,786 
Equity in loss of investee171 81 
Other expense, net1,148 1,331 
Loss before income taxes(8,094)(6,182)
(Benefit) provision for income taxes(708)1,493 
Net loss$(7,386)$(7,675)
Loss per share:
Basic$(0.27)$(0.28)
Diluted$(0.27)$(0.28)
Weighted-average shares outstanding:
Basic27,34927,199
Diluted27,34927,199
7


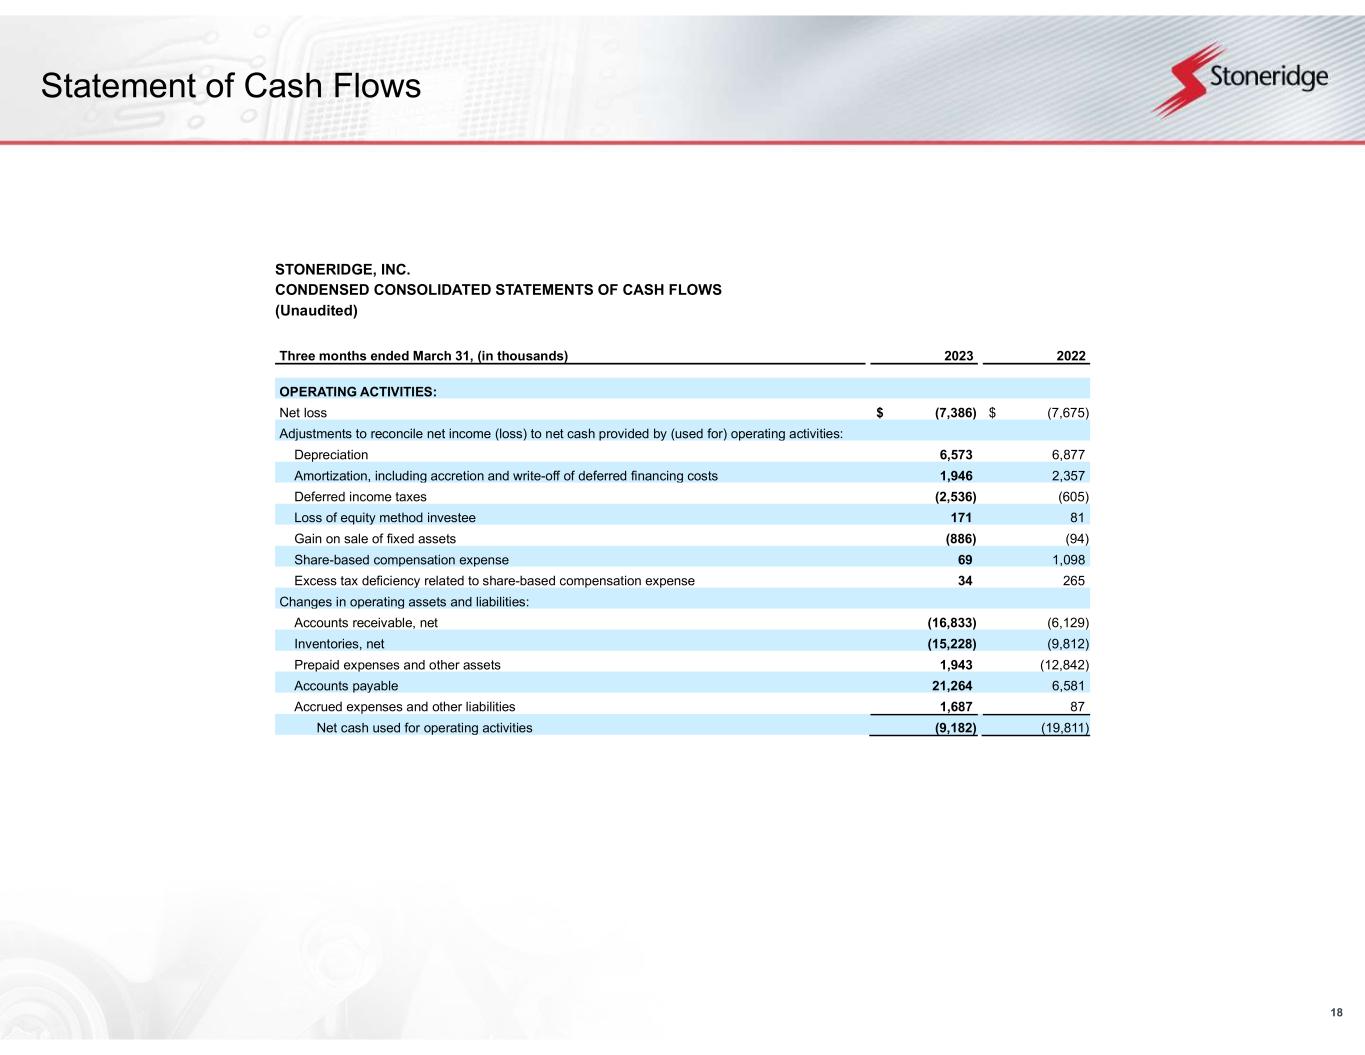
CONDENSED CONSOLIDATED STATEMENTS OF CASH FLOWS
Three months ended March 31, (in thousands)20232022
OPERATING ACTIVITIES:
Net loss$(7,386)$(7,675)
Adjustments to reconcile net income (loss) to net cash provided by (used for) operating activities:
Depreciation6,573 6,877 
Amortization, including accretion and write-off of deferred financing costs1,946 2,357 
Deferred income taxes(2,536)(605)
Loss of equity method investee171 81 
Gain on sale of fixed assets(886)(94)
Share-based compensation expense69 1,098 
Excess tax deficiency related to share-based compensation expense34 265 
Changes in operating assets and liabilities:
Accounts receivable, net(16,833)(6,129)
Inventories, net(15,228)(9,812)
Prepaid expenses and other assets1,943 (12,842)
Accounts payable21,264 6,581 
Accrued expenses and other liabilities1,687 87 
Net cash used for operating activities(9,182)(19,811)
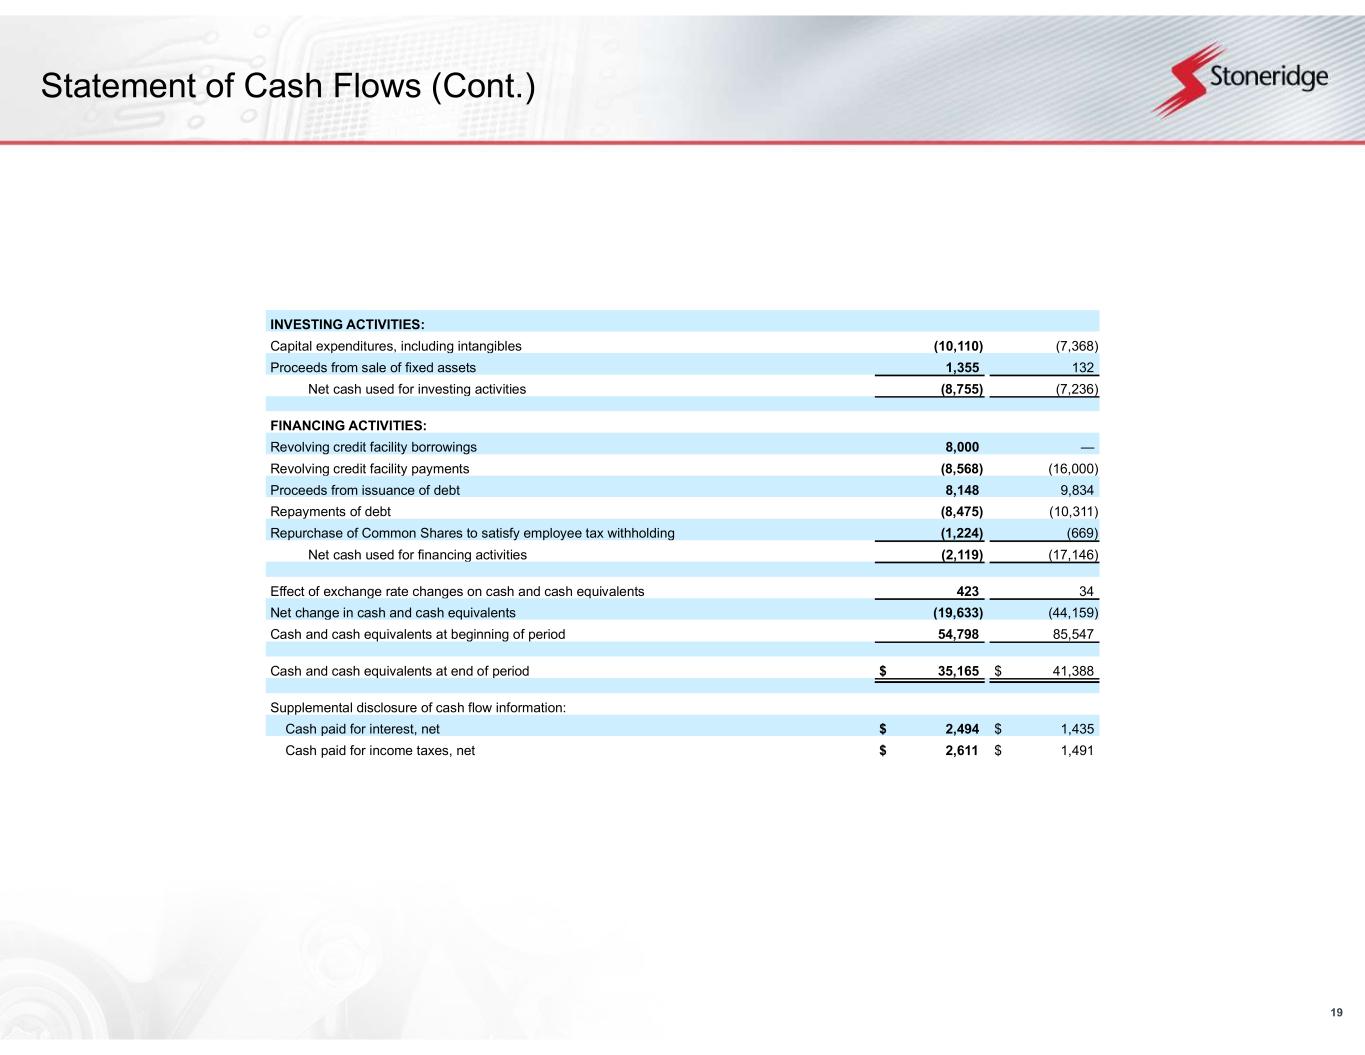
INVESTING ACTIVITIES:
Capital expenditures, including intangibles(10,110)(7,368)
Proceeds from sale of fixed assets1,355 132 
Net cash used for investing activities(8,755)(7,236)
FINANCING ACTIVITIES:
Revolving credit facility borrowings8,000 — 
Revolving credit facility payments(8,568)(16,000)
Proceeds from issuance of debt8,148 9,834 
Repayments of debt(8,475)(10,311)
Repurchase of Common Shares to satisfy employee tax withholding(1,224)(669)
Net cash used for financing activities(2,119)(17,146)
Effect of exchange rate changes on cash and cash equivalents423 34 
Net change in cash and cash equivalents(19,633)(44,159)
Cash and cash equivalents at beginning of period54,798 85,547 
Cash and cash equivalents at end of period$35,165 $41,388 
Supplemental disclosure of cash flow information:
Cash paid for interest, net$2,494 $1,435 
Cash paid for income taxes, net$2,611 $1,491 
8


Regulation G Non-GAAP Financial Measure Reconciliations
Reconciliation to US GAAP
Exhibit 1 - Reconciliation of Adjusted EPS
(USD in millions, except EPS)Q1 2023Q1 2023 EPS
Net Loss$(7.4)$(0.27)
Add: After-Tax Business Realignment Costs1.0 0.04 
Less: After-Tax Gain on Disposal of Fixed Assets(0.6)(0.02)
Add: After-Tax Environmental Remediation Costs0.1 — — 
Adjusted Net Loss$(6.9)$(0.25)


Exhibit 2 – Reconciliation of Adjusted EBITDA
(USD in millions)Q1 2022Q2 2022Q3 2022Q4 2022Q1 2023
Income (Loss) Before Tax$(6.2)$(6.9)$1.7 $0.7 $(8.1)
Interest expense, net1.8 1.2 1.8 2.2 2.7 
Depreciation and amortization8.7 8.5 8.3 8.2 8.3 
EBITDA$4.3 $2.8 $11.8 $11.1 $3.0 
Add: Pre-Tax Business Realignment Costs— — 0.3 — 1.3 
Less: Pre-Tax Gain on Disposal of Fixed Assets— — — — (0.8)
Add: Pre-Tax Environmental Remediation Costs— — — — 0.1 
Add: Pre-Tax Brazilian Indirect Tax Credits, Net— (0.6)— — — 
Adjusted EBITDA$4.3 $2.3 $12.1 $11.1 $3.6 

Exhibit 3 – Adjusted Gross Profit

(USD in millions)Q1 2022Q1 2023
Gross Profit$41.4 $42.8 
Add: Pre-Tax Business Realignment Costs— 0.2 
Adjusted Gross Profit$41.4 $43.0 

9


Exhibit 4 - Adjusted Operating Loss

(USD in millions)Q1 2022Q1 2023
Operating Loss$(3.0)$(4.0)
Add: Pre-Tax Business Realignment Costs— 1.3 
Less: Pre-Tax Gain on Disposal of Fixed Assets— (0.8)
Add: Pre-Tax Environmental Remediation Costs— 0.1 
Adjusted Operating Loss$(3.0)$(3.4)

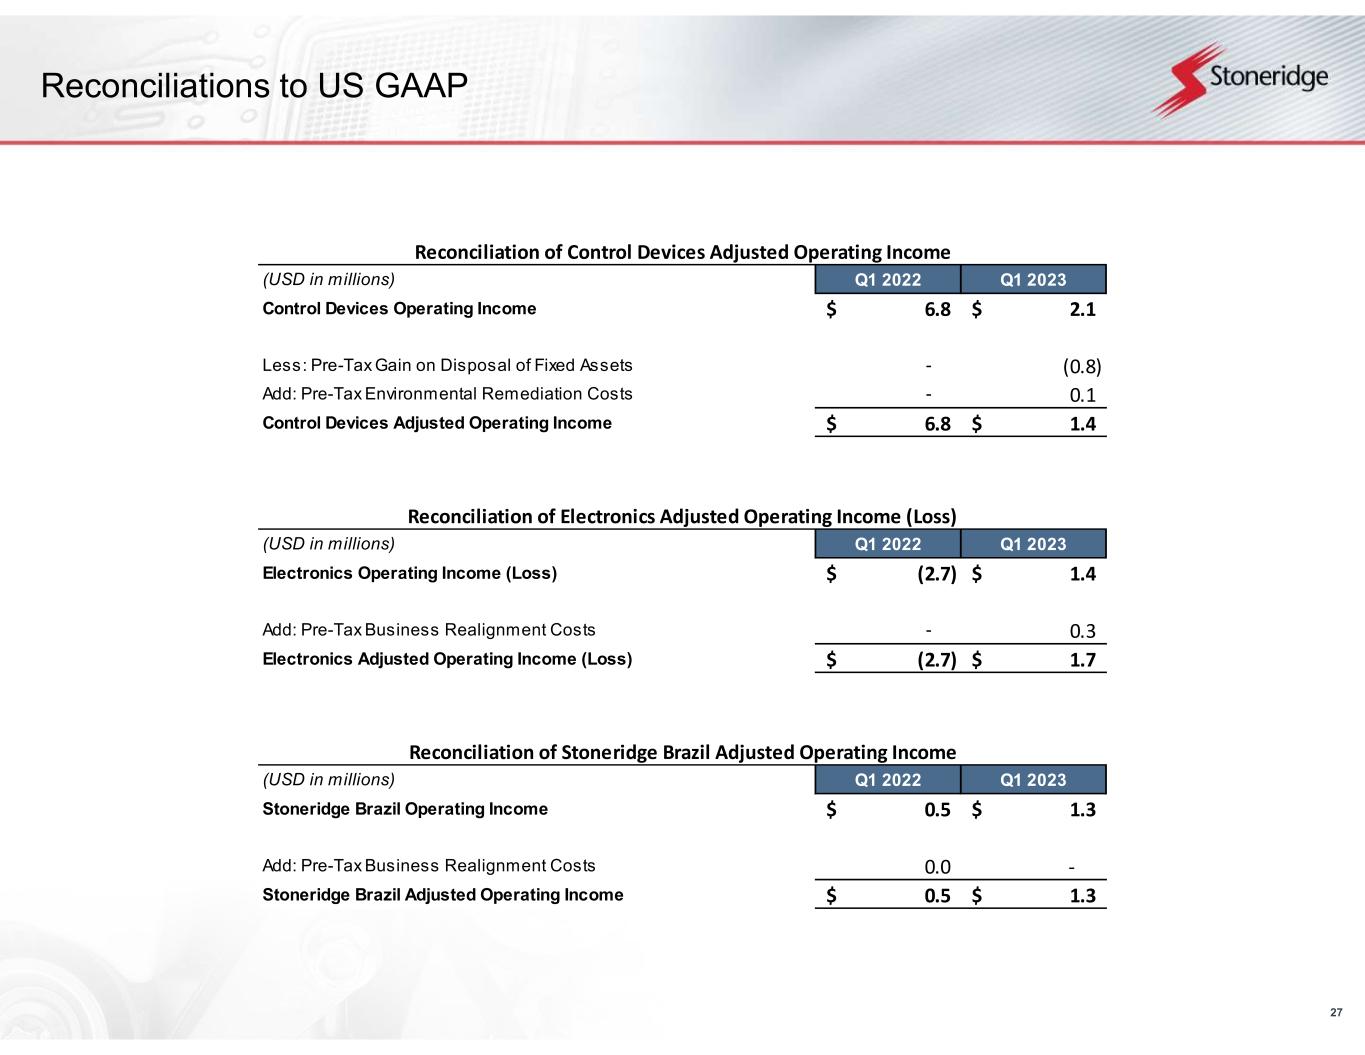
Exhibit 5 – Segment Adjusted Operating Income (Loss)
Reconciliation of Control Devices Adjusted Operating Income
(USD in millions)Q1 2022Q1 2023
Control Devices Operating Income$6.8 $2.1 
Less: Pre-Tax Gain on Disposal of Fixed Assets— (0.8)
Add: Pre-Tax Environmental Remediation Costs— 0.1 
Control Devices Adjusted Operating Income$6.8 $1.4 

Reconciliation of Electronics Adjusted Operating Income (Loss)
(USD in millions)Q1 2022Q1 2023
Electronics Operating Income (Loss)$(2.7)$1.4 
Add: Pre-Tax Business Realignment Costs— 0.3 
Electronics Adjusted Operating Income (Loss)$(2.7)$1.7 

Reconciliation of Stoneridge Brazil Adjusted Operating Income
(USD in millions)Q1 2022Q1 2023
Stoneridge Brazil Operating Income$0.5 $1.3 
Add: Pre-Tax Business Realignment Costs0.0 — 
Stoneridge Brazil Adjusted Operating Income$0.5 $1.3 

10


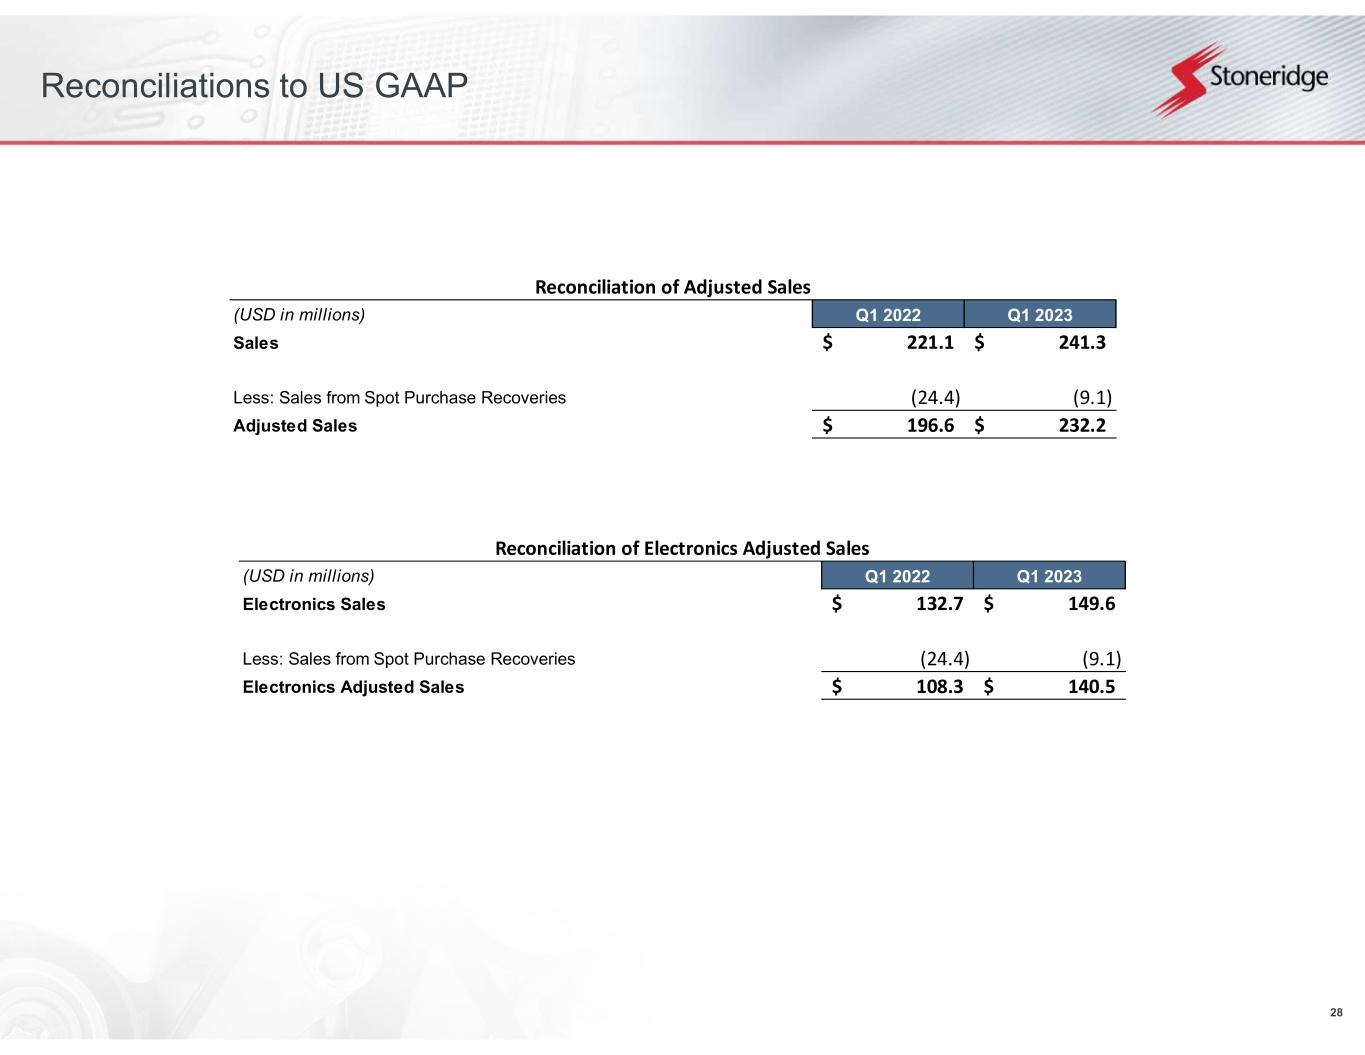
Exhibit 6 – Reconciliation of Adjusted Sales
(USD in millions)Q1 2022Q1 2023
Sales$221.1 $241.3 
Less: Sales from Spot Purchase Recoveries(24.4)(9.1)
Adjusted Sales$196.6 $232.2 

Exhibit 7 – Reconciliation of Electronics Adjusted Sales

(USD in millions)Q1 2022Q1 2023
Electronics Sales$132.7 $149.6 
Less: Sales from Spot Purchase Recoveries(24.4)(9.1)
Electronics Adjusted Sales$108.3 $140.5 

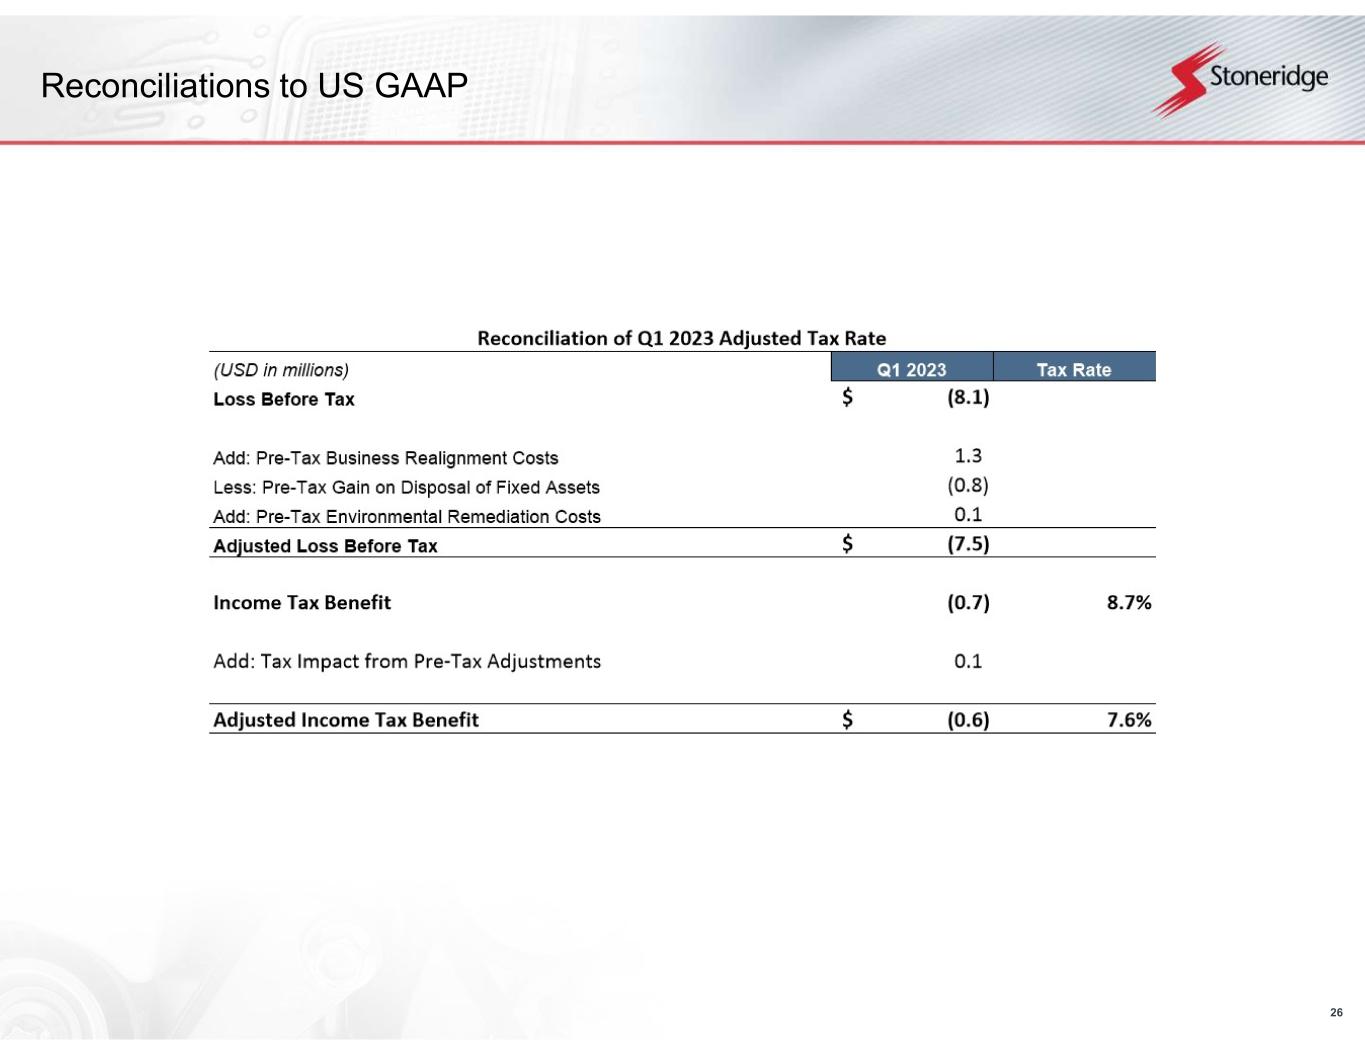
Exhibit 8 – Reconciliation of Adjusted Tax Rate


(USD in millions)Q1 2023Tax Rate
Loss Before Tax$(8.1)
Add: Pre-Tax Business Realignment Costs1.3 
Less: Pre-Tax Gain on Disposal of Fixed Assets(0.8)
Add: Pre-Tax Environmental Remediation Costs0.1 
Adjusted Loss Before Tax$(7.5)
Income Tax Benefit(0.7)8.7 %
Add: Tax Impact from Pre-Tax Adjustments0.1 
Adjusted Income Tax Benefit$(0.6)7.6 %


11
Q1 2023 Results May 4, 2023 Exhibit 99.2


2 Forward-Looking Statements Statements in this presentation that are not historical facts are forward-looking statements, which involve risks and uncertainties that could cause actual events or results to differ materially from those expressed or implied by the statements. Important factors that may cause actual results to differ materially from those in the forward-looking statements include, among other factors, the ability of our suppliers to supply us parts and components at competitive prices on a timely basis, including the impact of potential tariffs and trade considerations on their operations and output; fluctuations in the cost and availability of key materials (including semiconductors, printed circuit boards, resin, aluminum, steel and copper) and components and our ability to offset cost increases through negotiated price increases with our customers or other cost actions, as necessary; global economic trends, competition and geopolitical risks, including impacts from the ongoing conflict between Russia and Ukraine and the related sanctions and other measures, or an escalation of sanctions, tariffs or other trade tensions between the U.S. and China or other countries; our ability to achieve cost reductions that offset or exceed customer-mandated selling price reductions; the impact of COVID-19, or other future pandemics, on the global economy, and on our customers, suppliers, employees, business and cash flows; the reduced purchases, loss or bankruptcy of a major customer or supplier; the costs and timing of business realignment, facility closures or similar actions; a significant change in automotive, commercial, off-highway or agricultural vehicle production; competitive market conditions and resulting effects on sales and pricing; foreign currency fluctuations and our ability to manage those impacts; customer acceptance of new products; our ability to successfully launch/produce products for awarded business; adverse changes in laws, government regulations or market conditions, including tariffs, affecting our products or our customers’ products; labor disruptions at Stoneridge’s facilities or at any of Stoneridge’s significant customers or suppliers; the amount of Stoneridge’s indebtedness and the restrictive covenants contained in the agreements governing its indebtedness, including its revolving credit facility; capital availability or costs, including changes in interest rates or market perceptions; the occurrence or non-occurrence of circumstances beyond Stoneridge’s control; and the items described in “Risk Factors” and other uncertainties or risks discussed in Stoneridge’s periodic and current reports filed with the Securities and Exchange Commission. Important factors that could cause the performance of the commercial vehicle and automotive industry to differ materially from those in the forward- looking statements include factors such as (1) continued economic instability or poor economic conditions in the United States and global markets, (2) changes in economic conditions, housing prices, foreign currency exchange rates, commodity prices, including shortages of and increases or volatility in the price of oil, (3) changes in laws and regulations, (4) the state of the credit markets, (5) political stability, (6) international conflicts and (7) the occurrence of force majeure events. These factors should not be construed as exhaustive and should be considered with the other cautionary statements in Stoneridge’s filings with the Securities and Exchange Commission. Forward-looking statements are not guarantees of future performance; Stoneridge’s actual results of operations, financial condition and liquidity, and the development of the industry in which Stoneridge operates may differ materially from those described in or suggested by the forward-looking statements contained in this presentation. In addition, even if Stoneridge’s results of operations, financial condition and liquidity, and the development of the industry in which Stoneridge operates are consistent with the forward-looking statements contained in this presentation, those results or developments may not be indicative of results or developments in subsequent periods. This presentation contains time-sensitive information that reflects management’s best analysis only as of the date of this presentation. Any forward-looking statements in this presentation speak only as of the date of this presentation, and Stoneridge undertakes no obligation to update such statements. Comparisons of results for current and any prior periods are not intended to express any future trends or indications of future performance, unless expressed as such, and should only be viewed as historical data. Stoneridge does not undertake any obligation to publicly update or revise any forward-looking statement as a result of new information, future events or otherwise, except as otherwise required by law. Rounding Disclosure: There may be slight immaterial differences between figures represented in our public filings compared to what is shown in this presentation. The differences are the result of rounding due to the representation of values in millions rather than thousands in public filings.


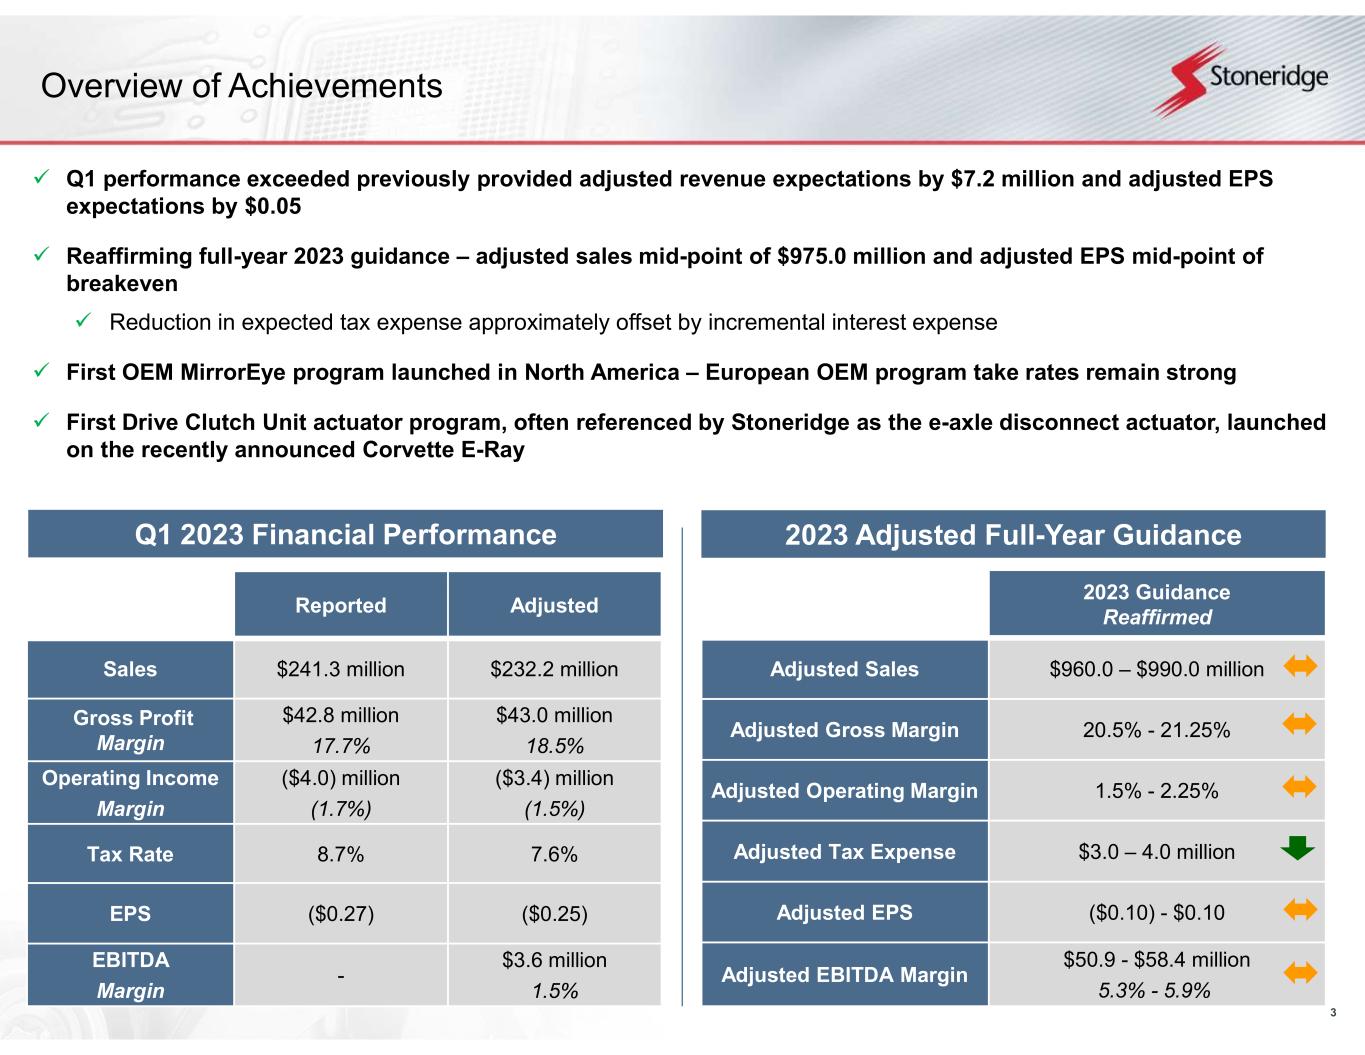
3 Overview of Achievements  Q1 performance exceeded previously provided adjusted revenue expectations by $7.2 million and adjusted EPS expectations by $0.05  Reaffirming full-year 2023 guidance – adjusted sales mid-point of $975.0 million and adjusted EPS mid-point of breakeven  Reduction in expected tax expense approximately offset by incremental interest expense  First OEM MirrorEye program launched in North America – European OEM program take rates remain strong  First Drive Clutch Unit actuator program, often referenced by Stoneridge as the e-axle disconnect actuator, launched on the recently announced Corvette E-Ray Q1 2023 Financial Performance 2023 Adjusted Full-Year Guidance 2023 Guidance Reaffirmed $960.0 – $990.0 millionAdjusted Sales 20.5% - 21.25%Adjusted Gross Margin 1.5% - 2.25%Adjusted Operating Margin $3.0 – 4.0 millionAdjusted Tax Expense ($0.10) - $0.10Adjusted EPS $50.9 - $58.4 million 5.3% - 5.9% Adjusted EBITDA Margin AdjustedReported $232.2 million$241.3 millionSales $43.0 million 18.5% $42.8 million 17.7% Gross Profit Margin ($3.4) million (1.5%) ($4.0) million (1.7%) Operating Income Margin 7.6%8.7%Tax Rate ($0.25)($0.27)EPS $3.6 million 1.5% - EBITDA Margin


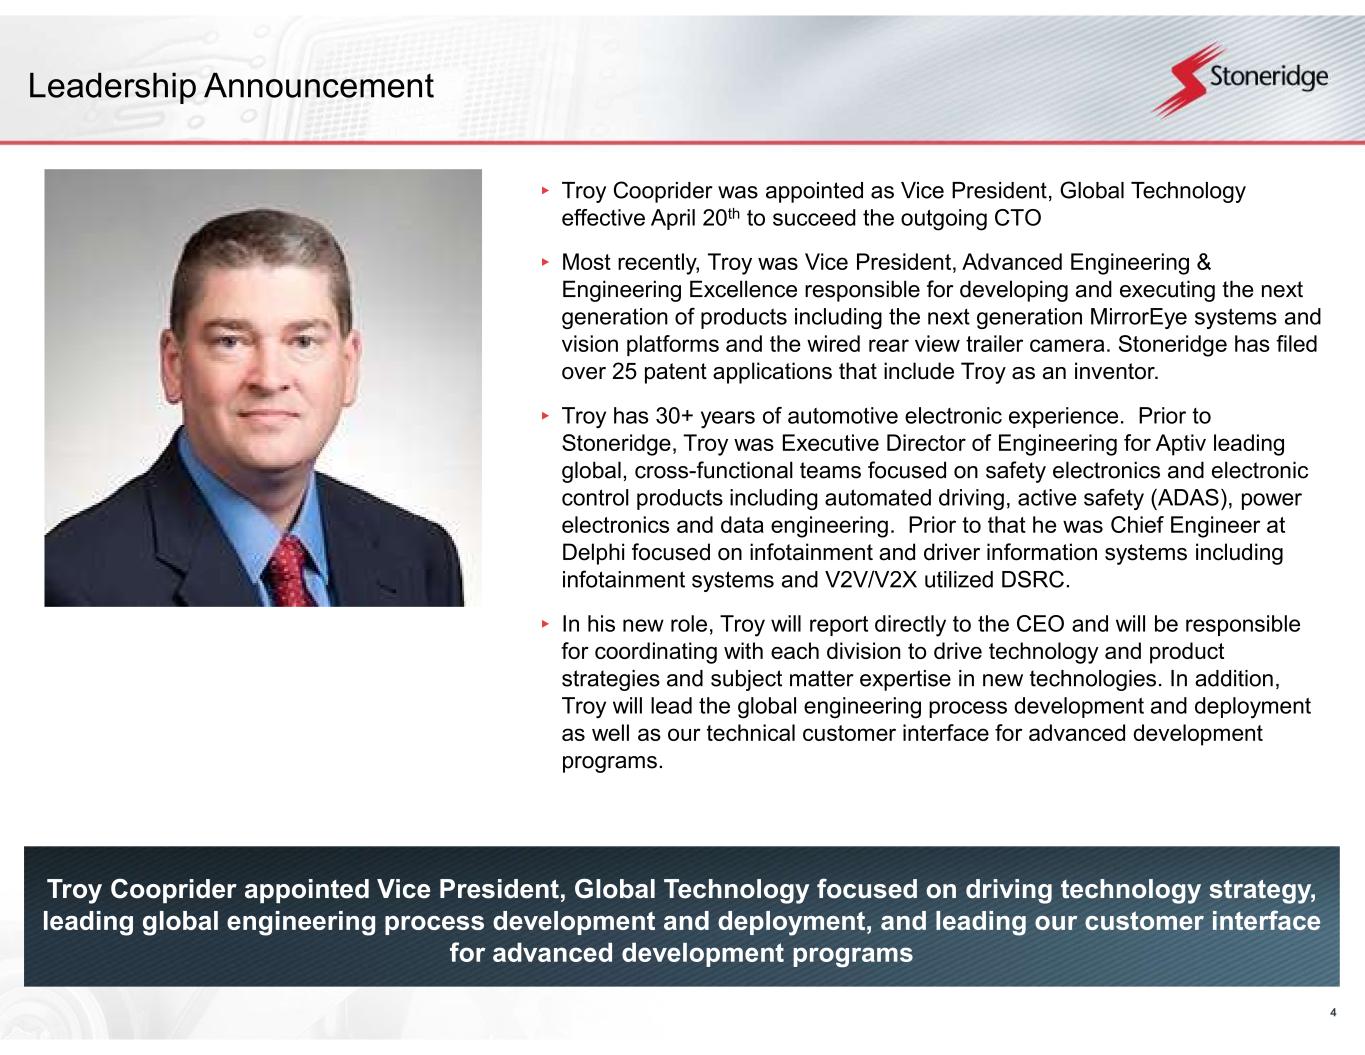
4 Leadership Announcement Troy Cooprider appointed Vice President, Global Technology focused on driving technology strategy, leading global engineering process development and deployment, and leading our customer interface for advanced development programs ▸ Troy Cooprider was appointed as Vice President, Global Technology effective April 20th to succeed the outgoing CTO ▸ Most recently, Troy was Vice President, Advanced Engineering & Engineering Excellence responsible for developing and executing the next generation of products including the next generation MirrorEye systems and vision platforms and the wired rear view trailer camera. Stoneridge has filed over 25 patent applications that include Troy as an inventor. ▸ Troy has 30+ years of automotive electronic experience. Prior to Stoneridge, Troy was Executive Director of Engineering for Aptiv leading global, cross-functional teams focused on safety electronics and electronic control products including automated driving, active safety (ADAS), power electronics and data engineering. Prior to that he was Chief Engineer at Delphi focused on infotainment and driver information systems including infotainment systems and V2V/V2X utilized DSRC. ▸ In his new role, Troy will report directly to the CEO and will be responsible for coordinating with each division to drive technology and product strategies and subject matter expertise in new technologies. In addition, Troy will lead the global engineering process development and deployment as well as our technical customer interface for advanced development programs.


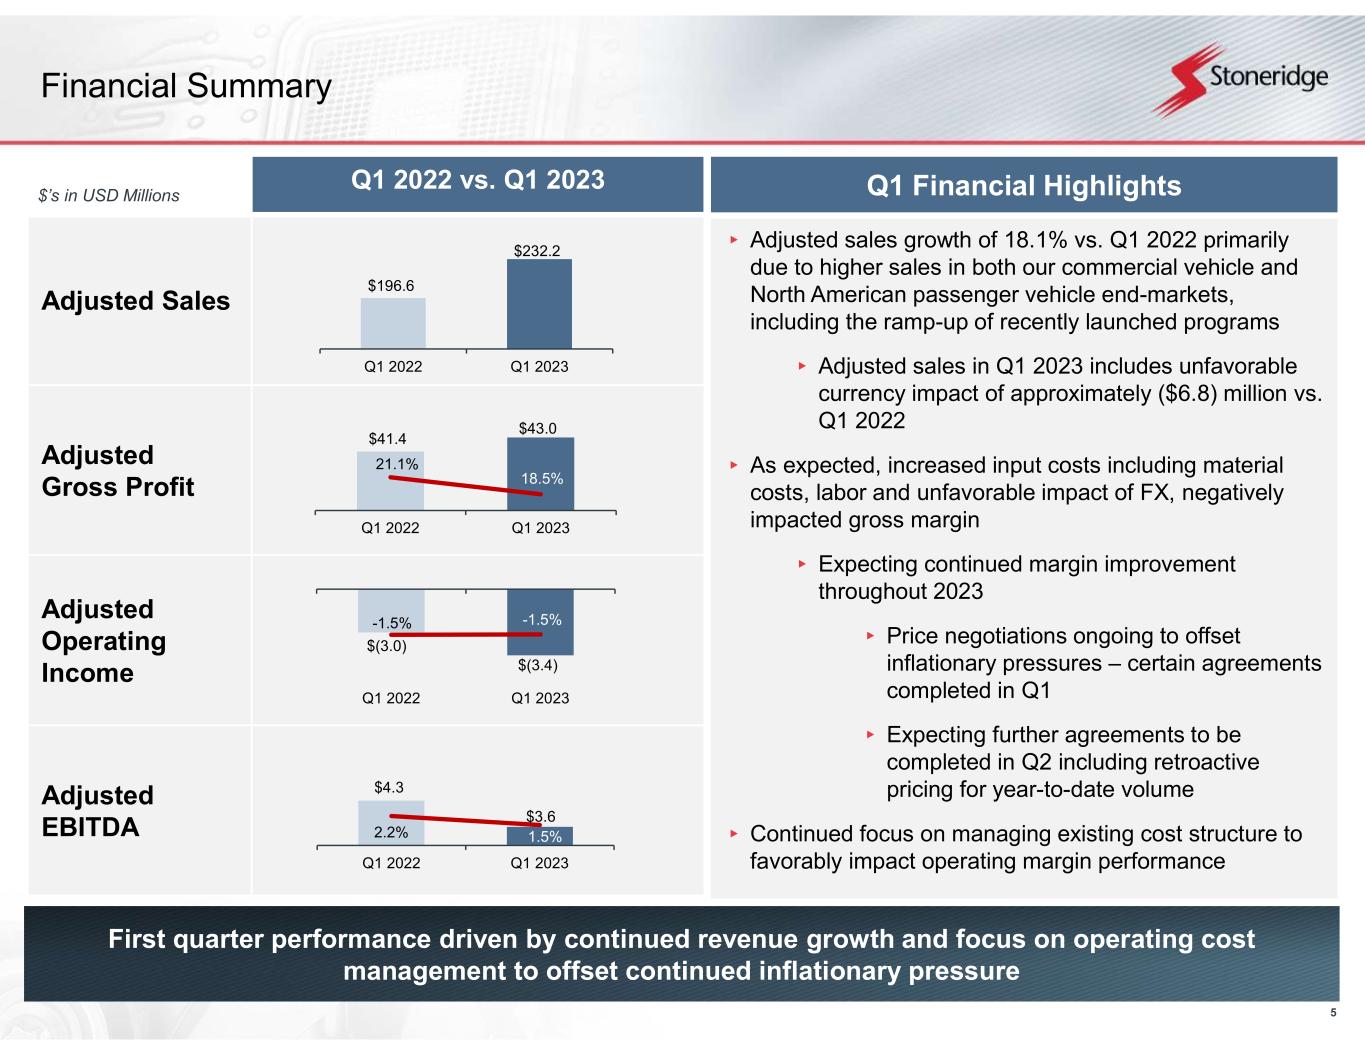
5 Financial Summary First quarter performance driven by continued revenue growth and focus on operating cost management to offset continued inflationary pressure Q1 2022 vs. Q1 2023 Adjusted Sales Adjusted Gross Profit Adjusted Operating Income Adjusted EBITDA $’s in USD Millions Q1 Financial Highlights $196.6 $232.2 150 200 250 Q1 2022 Q1 2023 ▸ Adjusted sales growth of 18.1% vs. Q1 2022 primarily due to higher sales in both our commercial vehicle and North American passenger vehicle end-markets, including the ramp-up of recently launched programs ▸ Adjusted sales in Q1 2023 includes unfavorable currency impact of approximately ($6.8) million vs. Q1 2022 ▸ As expected, increased input costs including material costs, labor and unfavorable impact of FX, negatively impacted gross margin ▸ Expecting continued margin improvement throughout 2023 ▸ Price negotiations ongoing to offset inflationary pressures – certain agreements completed in Q1 ▸ Expecting further agreements to be completed in Q2 including retroactive pricing for year-to-date volume ▸ Continued focus on managing existing cost structure to favorably impact operating margin performance $41.4 $43.0 21.1% 18.5% 16% 26% 35 40 45 Q1 2022 Q1 2023 $(3.0) $(3.4) -1.5% -1.5% -3% -1% -4 -3 -2 Q1 2022 Q1 2023 $4.3 $3.6 2.2% 1.5% 0% 5% 3 5 Q1 2022 Q1 2023


6 New Program Launches Customers launching products showcasing our industry leading technologies DRIVE UNIT CLUTCH ACTUATOR (E-AXLE) ▸ Actuator helping to enable the first e-AWD (all-wheel drive) system that works in tandem with a V8 engine to optimize performance ▸ Applied in the Corvette E-Ray with electric motor and traditional internal combustion engine ▸ One of the technologies that enables Corvette E-Ray to achieve 0 to 60 mph in 2.5 seconds ▸ Pursuing additional E-Axle business to continue to grow actuation / powertrain electrification platform Drive Unit Clutch Actuator ▸ Second MirrorEye OEM program launched in mid-April – first truck with OEM camera mirror system offered in North America ▸ Customer ramping-up truck production with MirrorEye option ▸ Unique system specifications to align with NHTSA requirements with camera embedded in smaller mirror • Up to 1.5% fuel economy benefit • Significantly improves safety benefits including blind spot elimination, night vision and improved vision in inclement weather MirrorEye – North America MIRROREYE CAMERA MONITOR SYSTEM


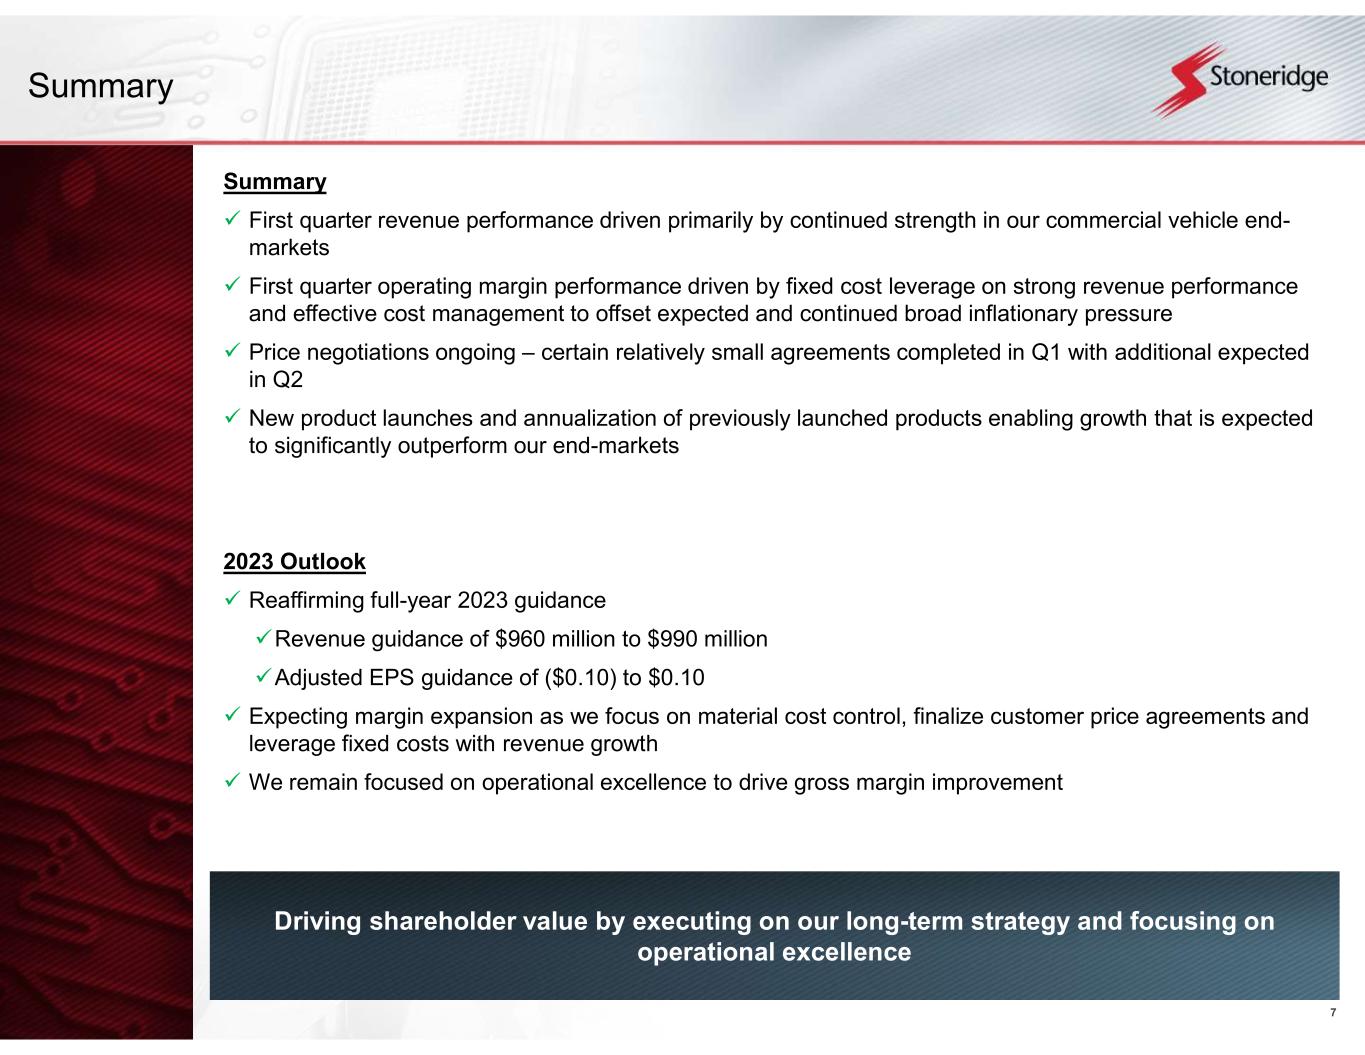
7 Summary Summary  First quarter revenue performance driven primarily by continued strength in our commercial vehicle end- markets  First quarter operating margin performance driven by fixed cost leverage on strong revenue performance and effective cost management to offset expected and continued broad inflationary pressure  Price negotiations ongoing – certain relatively small agreements completed in Q1 with additional expected in Q2  New product launches and annualization of previously launched products enabling growth that is expected to significantly outperform our end-markets 2023 Outlook  Reaffirming full-year 2023 guidance Revenue guidance of $960 million to $990 million Adjusted EPS guidance of ($0.10) to $0.10  Expecting margin expansion as we focus on material cost control, finalize customer price agreements and leverage fixed costs with revenue growth  We remain focused on operational excellence to drive gross margin improvement Driving shareholder value by executing on our long-term strategy and focusing on operational excellence


8 Financial Update


9 1st Quarter 2023 Financial Summary 1st Quarter 2023 Financial Results Adjusted sales of $232.2 million, an increase of 18.1% over Q1 2022 • Control Devices sales of $86.7 million, an increase of 2.0% over Q1 2022 • Electronics adjusted sales of $140.5 million, an increase of 29.8% over Q1 2022 • Stoneridge Brazil sales of $14.3 million, an increase of 18.4% over Q1 2022 Adjusted operating loss of ($3.4) million ((1.5%) adjusted operating margin) in line with Q1 2022 • Control Devices adjusted operating income of $1.4 million (1.6% adjusted operating margin), a decrease of 640 bps over Q1 2022 • Electronics adjusted operating income of $1.7 million (1.2% adjusted operating margin), an increase of 370 bps over Q1 2022 • Stoneridge Brazil adjusted operating income of $1.3 million (9.4% adjusted operating margin), an increase of 500 bps over Q1 2022 Q1 2023 Financial Performance 2023 Adjusted Full-Year Guidance 2023 Guidance Reaffirmed $960.0 – $990.0 millionAdjusted Sales 20.5% - 21.25%Adjusted Gross Margin 1.5% - 2.25% Adjusted Operating Margin $3.0 - $4.0 millionAdjusted Tax Expense ($0.10) - $0.10Adjusted EPS $50.9 - $58.4 million 5.3% - 5.9% Adjusted EBITDA Margin AdjustedReported $232.2 million$241.3 millionSales $43.0 million 18.5% $42.8 million 17.7% Gross Profit Margin ($3.4) million (1.5%) ($4.0) million (1.7%) Operating Income Margin 7.6%8.7%Tax Rate ($0.25)($0.27)EPS $3.6 million 1.5% - EBITDA Margin


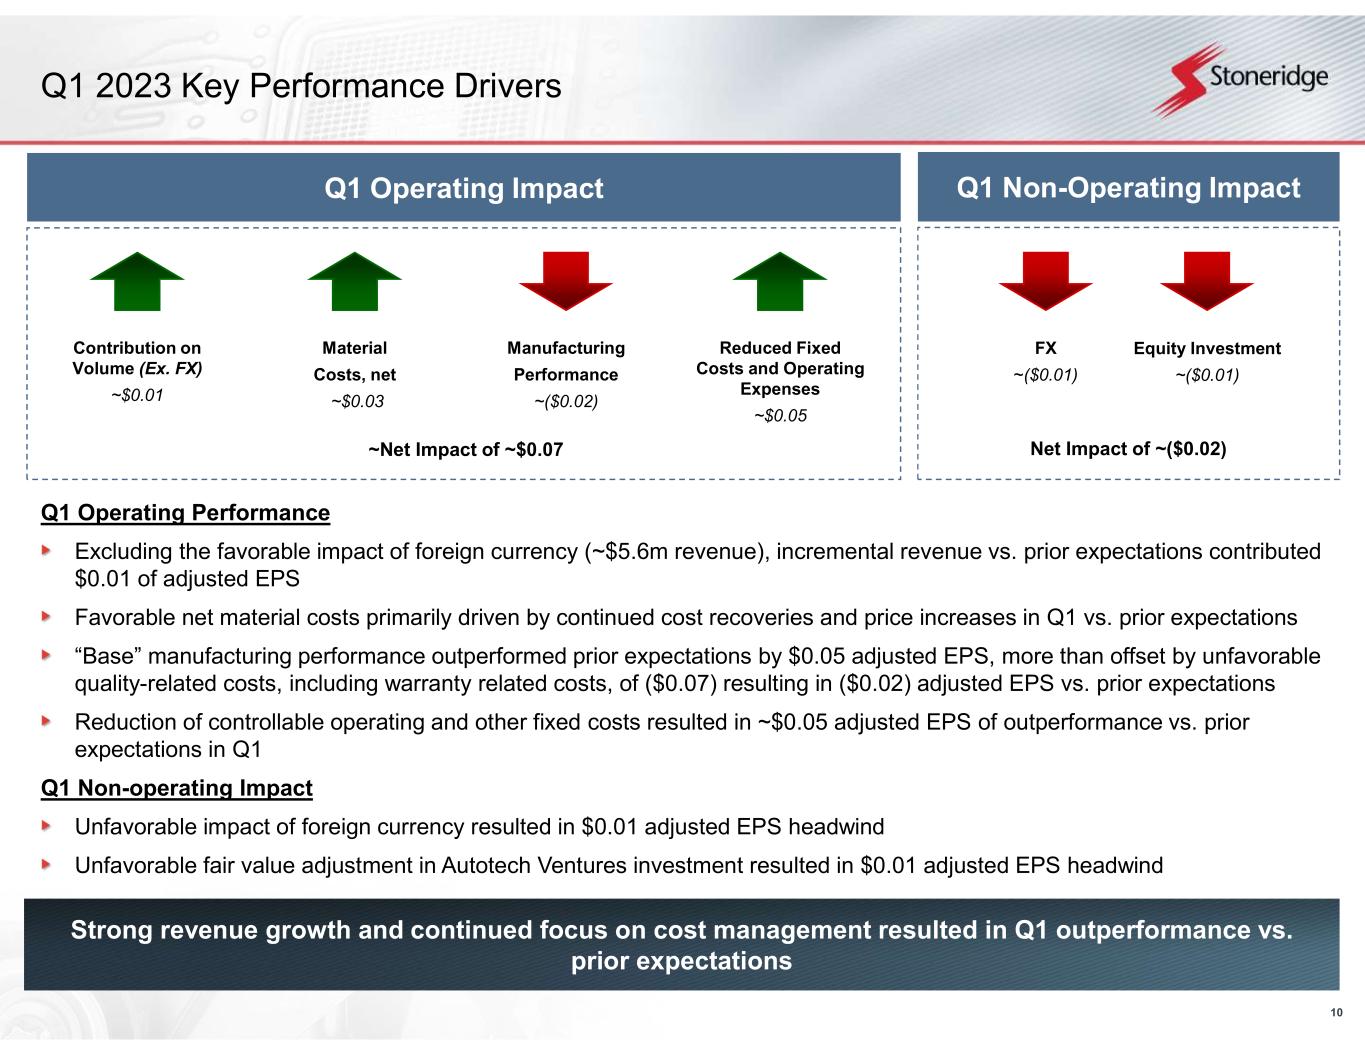
10 Q1 2023 Key Performance Drivers Strong revenue growth and continued focus on cost management resulted in Q1 outperformance vs. prior expectations Q1 Operating Performance Excluding the favorable impact of foreign currency (~$5.6m revenue), incremental revenue vs. prior expectations contributed $0.01 of adjusted EPS Favorable net material costs primarily driven by continued cost recoveries and price increases in Q1 vs. prior expectations “Base” manufacturing performance outperformed prior expectations by $0.05 adjusted EPS, more than offset by unfavorable quality-related costs, including warranty related costs, of ($0.07) resulting in ($0.02) adjusted EPS vs. prior expectations Reduction of controllable operating and other fixed costs resulted in ~$0.05 adjusted EPS of outperformance vs. prior expectations in Q1 Q1 Non-operating Impact Unfavorable impact of foreign currency resulted in $0.01 adjusted EPS headwind Unfavorable fair value adjustment in Autotech Ventures investment resulted in $0.01 adjusted EPS headwind Reduced Fixed Costs and Operating Expenses ~$0.05 ~Net Impact of ~$0.07 Net Impact of ~($0.02) Q1 Operating Impact Q1 Non-Operating Impact Contribution on Volume (Ex. FX) ~$0.01 FX ~($0.01) Material Costs, net ~$0.03 Manufacturing Performance ~($0.02) Equity Investment ~($0.01)


11 Control Devices Financial Performance Expecting sales growth to outpace our underlying end-markets Focus on strong execution and offsetting higher material and labor costs to drive margin expansion Control Devices 2023 Expectations ▸ Expecting revenue growth over market primarily due to exposure to high-demand vehicle programs with relatively higher content offsetting supply chain volatility ▸ Continue to drive manufacturing performance improvement and cost control ▸ Focus on continued supply chain improvements and continued price negotiations with strategic customers ▸ Continue to invest in and grow current capabilities targeted to electrified platforms and drivetrain architectures Q1 2022 vs. Q1 2023 Sales Adjusted Operating Income $’s in USD Millions Control Devices Q1 Summary Sales slightly increased vs. Q1 2022 Higher sales in the North America passenger vehicle end-market, including incremental revenue from high-demand powertrain actuation programs, offset by reduction in China Adjusted operating income declined vs. Q1 2022 Primarily due to higher material costs, unfavorable product mix, labor economics and quality related manufacturing costs driving reduced gross margin Relatively higher SG&A costs primarily due to a one-time legal settlement benefit recognized in Q1 2022 $85.0 $86.7 Q1 2022 Q1 2023 $6.8 $1.4 8.0% 1.6% -2% 8% 18% 0 2 4 6 8 Q1 2022 Q1 2023


12 Electronics Financial Performance Expecting significant year-over-year growth and continued margin expansion Electronics 2023 Expectations Expecting continued strength in demand in commercial vehicle end-markets and the ramp-up of new and recently launched programs to drive revenue growth Focus on price negotiations to offset continued material and labor cost inflation – expected to continue to drive margin improvement Focus on efficient use of engineering resources to ensure strong program launches and continued advanced development activities while reducing overall cost structure Q1 2022 vs. Q1 2023 Adjusted Sales Adjusted Operating Income $’s in USD Millions Electronics Q1 Summary Adjusted sales increased by 29.8% vs. Q1 2022 Primarily due to continued strong commercial vehicle customer demand, including incremental sales from recently launched programs Q1 adjusted operating margin improved by ~370 bps vs. Q1 2022 Primarily due to contribution from incremental revenue and effective cost management partially offset by higher material and labor costs $108.3 $140.5 Q1 2022 Q1 2023 $(2.7) $1.7 -2.5% 1.2% -5% -3% -1% 1% 3% -3 -2 -1 0 1 2 Q1 2022 Q1 2023


13 Stoneridge Brazil Financial Performance Expecting stable revenue and margin performance despite continued macroeconomic challenges Focus remains on supporting global Electronics business Stoneridge Brazil 2023 Expectations Local OEM business expected to offset challenging overall macroeconomic conditions Focus remains on utilizing engineering resources to support global Electronics business Stoneridge Brazil Q1 Summary Higher sales vs. Q1 2022 Primarily due to higher OEM sales Adjusted operating margin increased by ~500 basis points vs. Q1 2022 Primarily due to fixed cost leverage on incremental revenue $’s in USD Millions Q1 2022 vs. Q1 2023 Sales Adjusted Operating Income $’s in USD Millions $12.0 $14.3 Q1 2022 Q1 2023 $0.5 $1.3 4.4% 9.4% 1% 6% 11% Q1 2022 Q1 2023


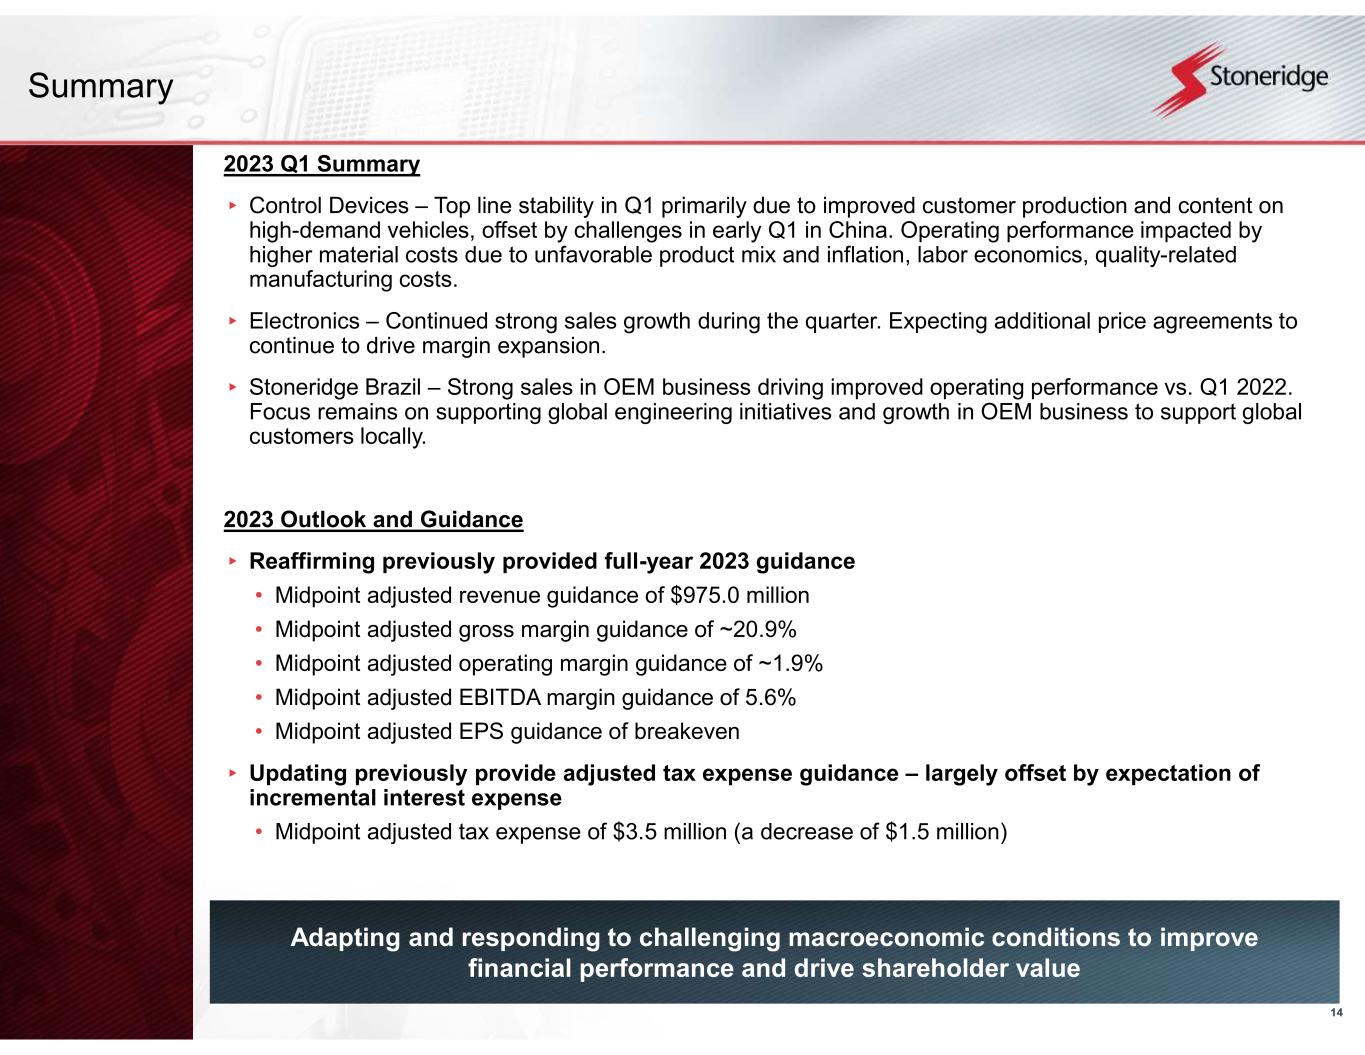
14 Summary 2023 Q1 Summary ▸ Control Devices – Top line stability in Q1 primarily due to improved customer production and content on high-demand vehicles, offset by challenges in early Q1 in China. Operating performance impacted by higher material costs due to unfavorable product mix and inflation, labor economics, quality-related manufacturing costs. ▸ Electronics – Continued strong sales growth during the quarter. Expecting additional price agreements to continue to drive margin expansion. ▸ Stoneridge Brazil – Strong sales in OEM business driving improved operating performance vs. Q1 2022. Focus remains on supporting global engineering initiatives and growth in OEM business to support global customers locally. 2023 Outlook and Guidance ▸ Reaffirming previously provided full-year 2023 guidance • Midpoint adjusted revenue guidance of $975.0 million • Midpoint adjusted gross margin guidance of ~20.9% • Midpoint adjusted operating margin guidance of ~1.9% • Midpoint adjusted EBITDA margin guidance of 5.6% • Midpoint adjusted EPS guidance of breakeven ▸ Updating previously provide adjusted tax expense guidance – largely offset by expectation of incremental interest expense • Midpoint adjusted tax expense of $3.5 million (a decrease of $1.5 million) Adapting and responding to challenging macroeconomic conditions to improve financial performance and drive shareholder value


15 Appendix


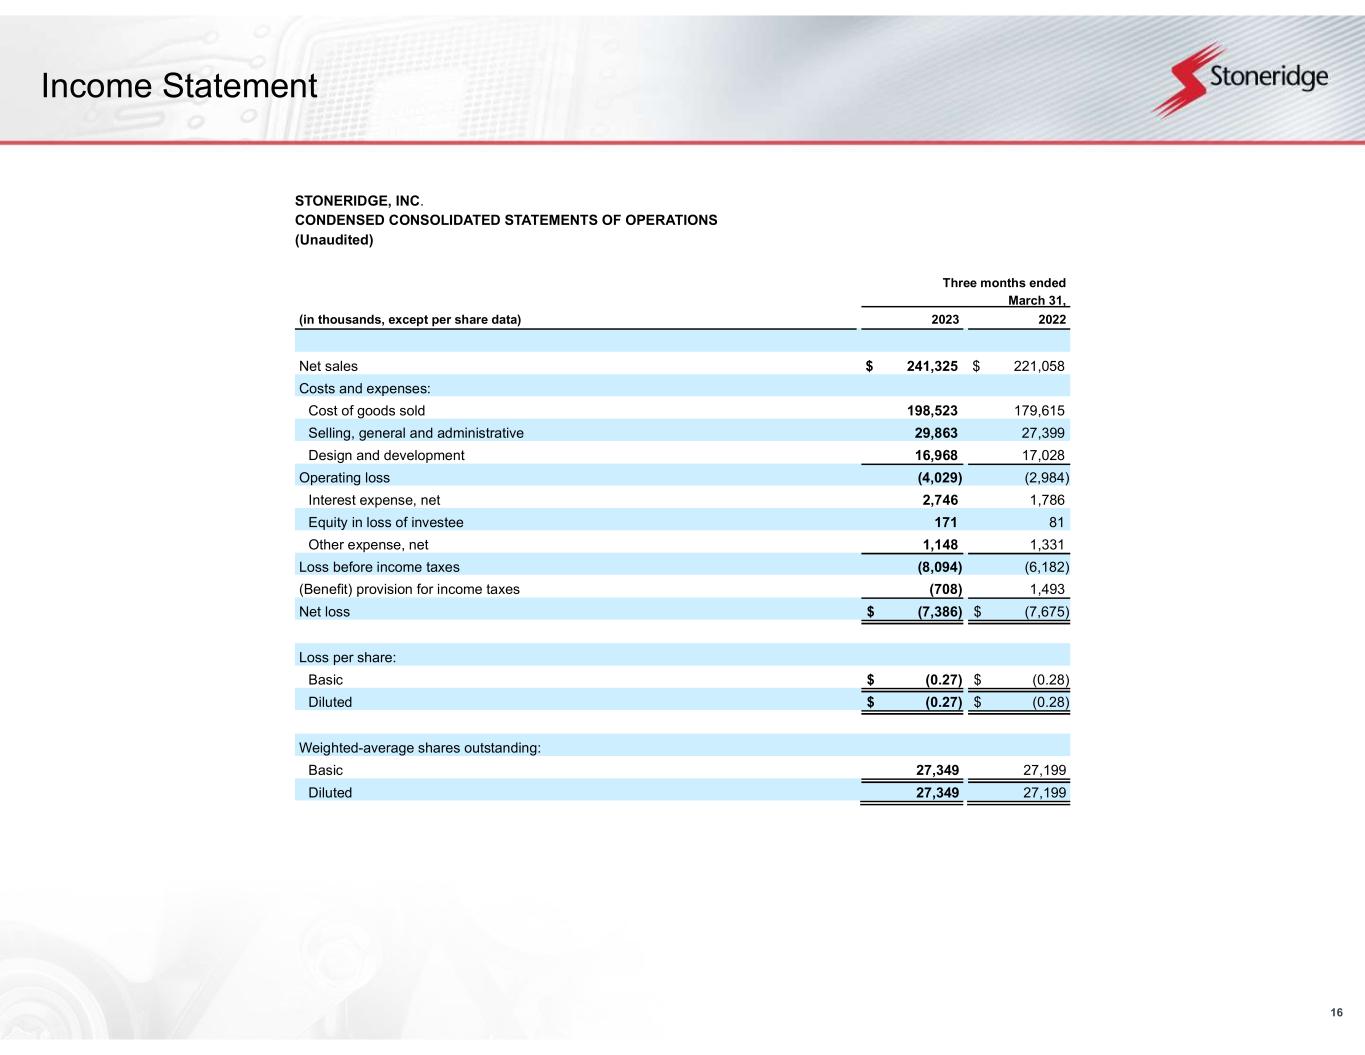
16 Income Statement STONERIDGE, INC. CONDENSED CONSOLIDATED STATEMENTS OF OPERATIONS (Unaudited) Three months ended March 31, (in thousands, except per share data) 2023 2022 Net sales $ 241,325 $ 221,058 Costs and expenses: Cost of goods sold 198,523 179,615 Selling, general and administrative 29,863 27,399 Design and development 16,968 17,028 Operating loss (4,029) (2,984) Interest expense, net 2,746 1,786 Equity in loss of investee 171 81 Other expense, net 1,148 1,331 Loss before income taxes (8,094) (6,182) (Benefit) provision for income taxes (708) 1,493 Net loss $ (7,386) $ (7,675) Loss per share: Basic $ (0.27) $ (0.28) Diluted $ (0.27) $ (0.28) Weighted-average shares outstanding: Basic 27,349 27,199 Diluted 27,349 27,199


17 Balance Sheet STONERIDGE, INC. CONDENSED CONSOLIDATED BALANCE SHEETS (in thousands) March 31, 2023 December 31, 2022 (Unaudited) ASSETS Current assets: Cash and cash equivalents $ 35,165 $ 54,798 Accounts receivable, less reserves of $853 and $962, respectively 175,666 158,155 Inventories, net 168,701 152,580 Prepaid expenses and other current assets 43,604 44,018 Total current assets 423,136 409,551 Long-term assets: Property, plant and equipment, net 107,591 104,643 Intangible assets, net 45,585 45,508 Goodwill 34,659 34,225 Operating lease right-of-use asset 13,352 13,762 Investments and other long-term assets, net 46,415 44,416 Total long-term assets 247,602 242,554 Total assets $ 670,738 $ 652,105 LIABILITIES AND SHAREHOLDERS' EQUITY Current liabilities: Current portion of debt $ 1,456 $ 1,450 Accounts payable 131,996 110,202 Accrued expenses and other current liabilities 68,547 66,040 Total current liabilities 201,999 177,692 Long-term liabilities: Revolving credit facility 167,393 167,802 Deferred income taxes 8,310 8,498 Operating lease long-term liability 10,043 10,594 Other long-term liabilities 6,750 6,577 Total long-term liabilities 192,496 193,471 Shareholders' equity: Preferred Shares, without par value, 5,000 shares authorized, none issued — — Common Shares, without par value, 60,000 shares authorized, 28,966 and 28,966 shares issued and 27,513 and 27,341 shares outstanding at March 31, 2023 and December 31, 2022, respectively, with no stated value — — Additional paid-in capital 225,956 232,758 Common Shares held in treasury, 1,453 and 1,625 shares at March 31, 2023 and December 31, 2022, respectively, at cost (44,717) (50,366) Retained earnings 194,306 201,692 Accumulated other comprehensive loss (99,302) (103,142) Total shareholders' equity 276,243 280,942 Total liabilities and shareholders' equity $ 670,738 $ 652,105


18 Statement of Cash Flows STONERIDGE, INC. CONDENSED CONSOLIDATED STATEMENTS OF CASH FLOWS (Unaudited) Three months ended March 31, (in thousands) 2023 2022 OPERATING ACTIVITIES: Net loss $ (7,386) $ (7,675) Adjustments to reconcile net income (loss) to net cash provided by (used for) operating activities: Depreciation 6,573 6,877 Amortization, including accretion and write-off of deferred financing costs 1,946 2,357 Deferred income taxes (2,536) (605) Loss of equity method investee 171 81 Gain on sale of fixed assets (886) (94) Share-based compensation expense 69 1,098 Excess tax deficiency related to share-based compensation expense 34 265 Changes in operating assets and liabilities: Accounts receivable, net (16,833) (6,129) Inventories, net (15,228) (9,812) Prepaid expenses and other assets 1,943 (12,842) Accounts payable 21,264 6,581 Accrued expenses and other liabilities 1,687 87 Net cash used for operating activities (9,182) (19,811)


19 Statement of Cash Flows (Cont.) INVESTING ACTIVITIES: Capital expenditures, including intangibles (10,110) (7,368) Proceeds from sale of fixed assets 1,355 132 Net cash used for investing activities (8,755) (7,236) FINANCING ACTIVITIES: Revolving credit facility borrowings 8,000 — Revolving credit facility payments (8,568) (16,000) Proceeds from issuance of debt 8,148 9,834 Repayments of debt (8,475) (10,311) Repurchase of Common Shares to satisfy employee tax withholding (1,224) (669) Net cash used for financing activities (2,119) (17,146) Effect of exchange rate changes on cash and cash equivalents 423 34 Net change in cash and cash equivalents (19,633) (44,159) Cash and cash equivalents at beginning of period 54,798 85,547 Cash and cash equivalents at end of period $ 35,165 $ 41,388 Supplemental disclosure of cash flow information: Cash paid for interest, net $ 2,494 $ 1,435 Cash paid for income taxes, net $ 2,611 $ 1,491


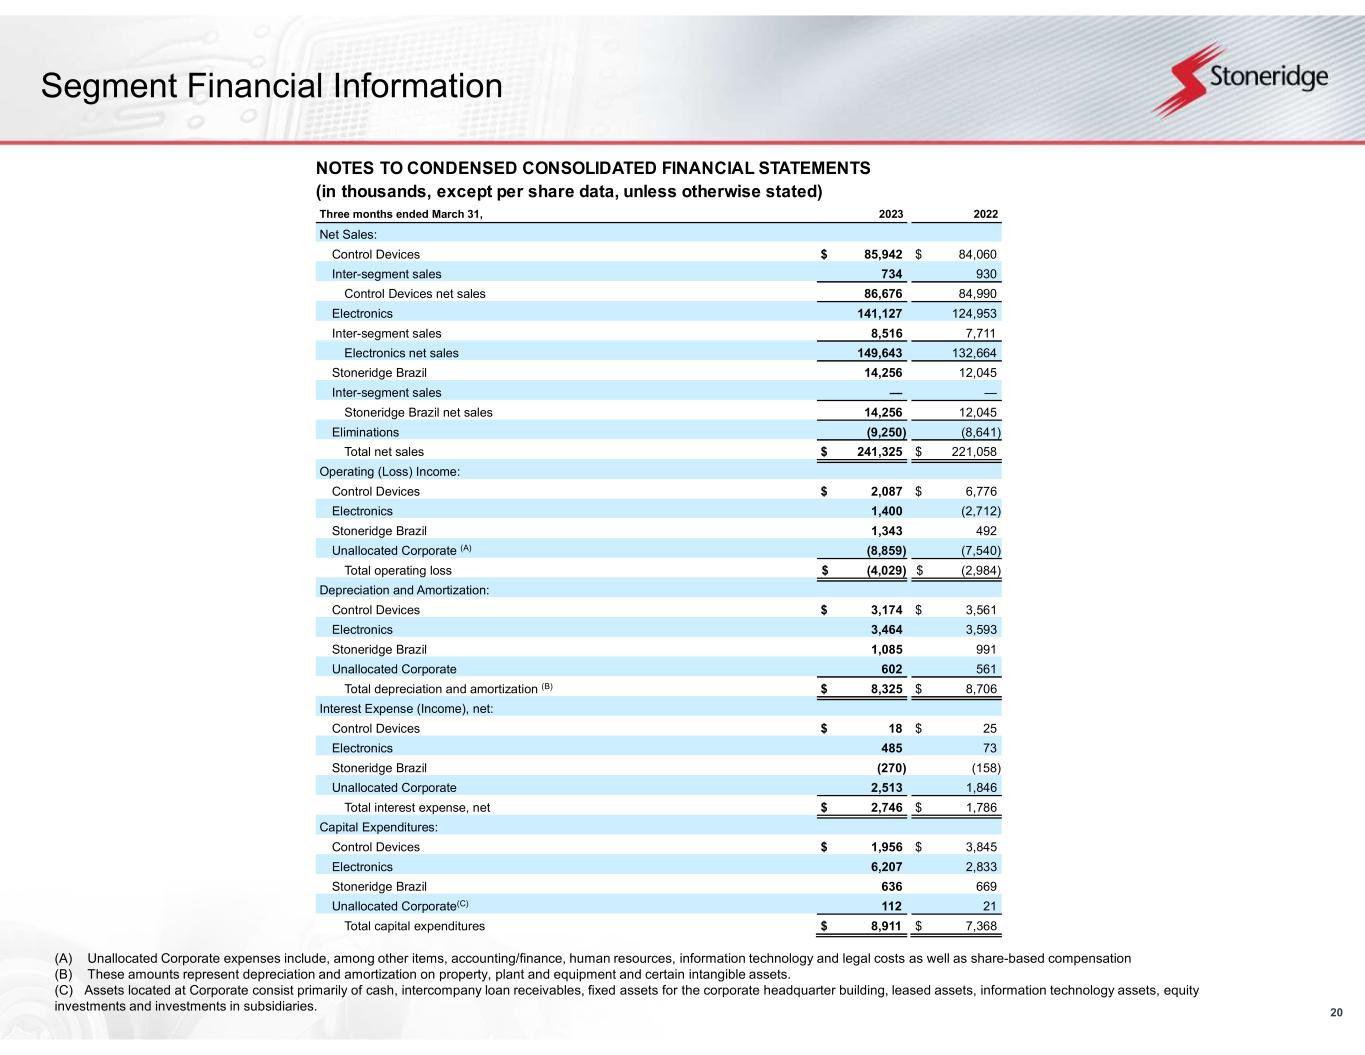
20 Segment Financial Information (A) Unallocated Corporate expenses include, among other items, accounting/finance, human resources, information technology and legal costs as well as share-based compensation (B) These amounts represent depreciation and amortization on property, plant and equipment and certain intangible assets. (C) Assets located at Corporate consist primarily of cash, intercompany loan receivables, fixed assets for the corporate headquarter building, leased assets, information technology assets, equity investments and investments in subsidiaries. NOTES TO CONDENSED CONSOLIDATED FINANCIAL STATEMENTS (in thousands, except per share data, unless otherwise stated) Three months ended March 31, 2023 2022 Net Sales: Control Devices $ 85,942 $ 84,060 Inter-segment sales 734 930 Control Devices net sales 86,676 84,990 Electronics 141,127 124,953 Inter-segment sales 8,516 7,711 Electronics net sales 149,643 132,664 Stoneridge Brazil 14,256 12,045 Inter-segment sales — — Stoneridge Brazil net sales 14,256 12,045 Eliminations (9,250) (8,641) Total net sales $ 241,325 $ 221,058 Operating (Loss) Income: Control Devices $ 2,087 $ 6,776 Electronics 1,400 (2,712) Stoneridge Brazil 1,343 492 Unallocated Corporate (A) (8,859) (7,540) Total operating loss $ (4,029) $ (2,984) Depreciation and Amortization: Control Devices $ 3,174 $ 3,561 Electronics 3,464 3,593 Stoneridge Brazil 1,085 991 Unallocated Corporate 602 561 Total depreciation and amortization (B) $ 8,325 $ 8,706 Interest Expense (Income), net: Control Devices $ 18 $ 25 Electronics 485 73 Stoneridge Brazil (270) (158) Unallocated Corporate 2,513 1,846 Total interest expense, net $ 2,746 $ 1,786 Capital Expenditures: Control Devices $ 1,956 $ 3,845 Electronics 6,207 2,833 Stoneridge Brazil 636 669 Unallocated Corporate(C) 112 21 Total capital expenditures $ 8,911 $ 7,368


21 Reconciliations to US GAAP


22 Reconciliations to US GAAP This document contains information about Stoneridge's financial results which is not presented in accordance with accounting principles generally accepted in the United States ("GAAP"). Such non-GAAP financial measures are reconciled to their closest GAAP financial measures in the appendix of this document. The provision of these non- GAAP financial measures is not intended to indicate that Stoneridge is explicitly or implicitly providing projections on those non-GAAP financial measures, and actual results for such measures are likely to vary from those presented. The reconciliations include all information reasonably available to the Company at the date of this document and the adjustments that management can reasonably predict.


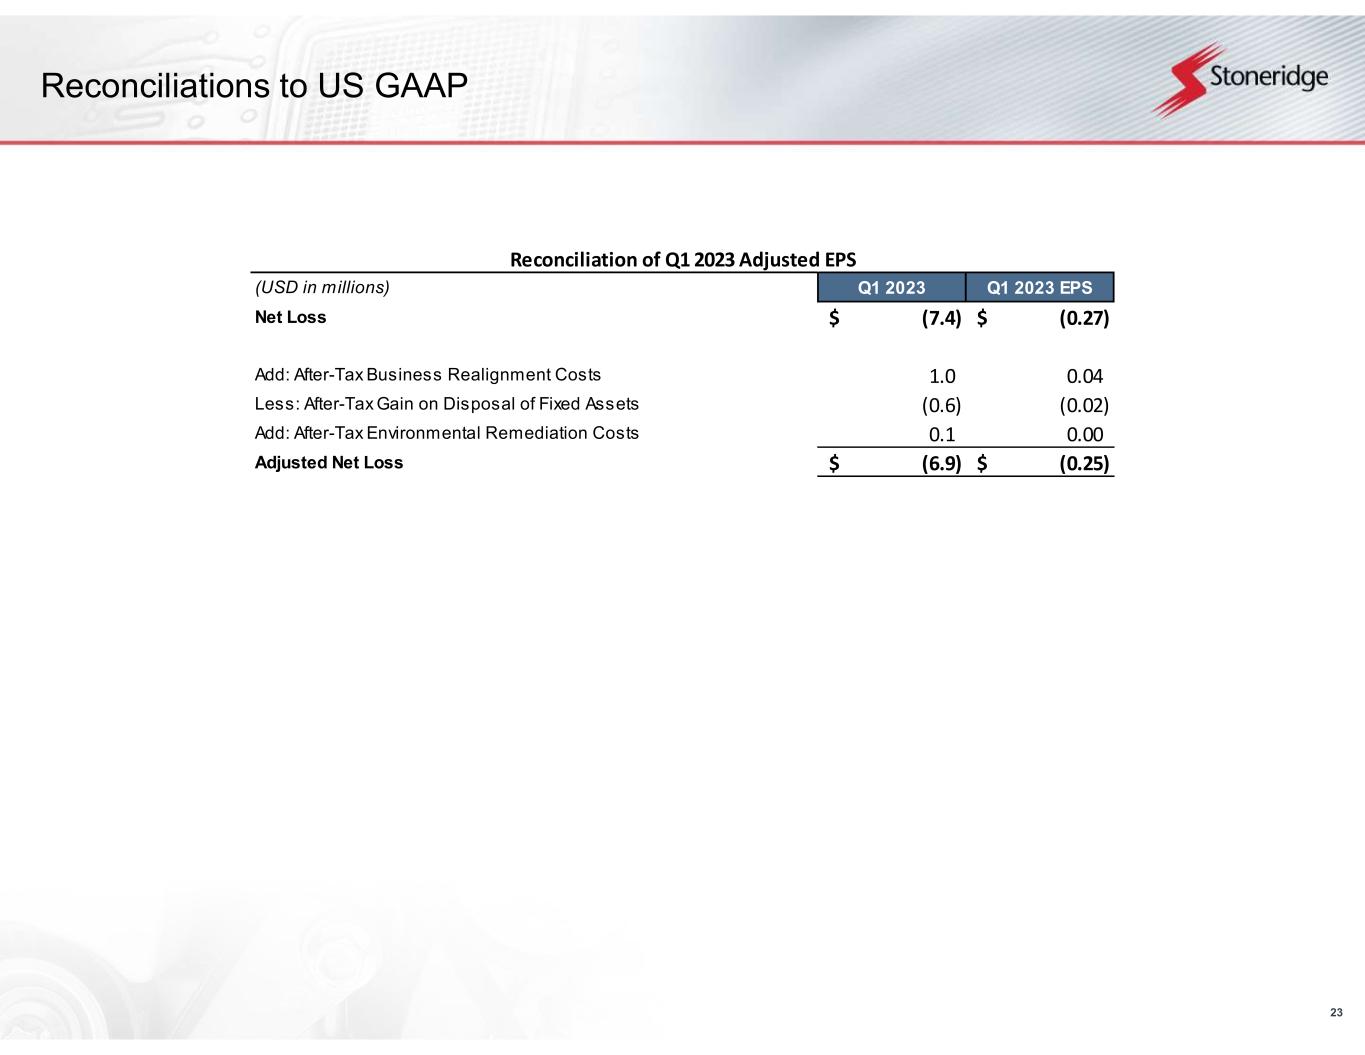
23 Reconciliations to US GAAP (USD in millions) Q1 2023 Q1 2023 EPS Net Loss (7.4)$ (0.27)$ Add: After-Tax Business Realignment Costs 1.0 0.04 Less: After-Tax Gain on Disposal of Fixed Assets (0.6) (0.02) Add: After-Tax Environmental Remediation Costs 0.1 0.00 Adjusted Net Loss (6.9)$ (0.25)$ Reconciliation of Q1 2023 Adjusted EPS


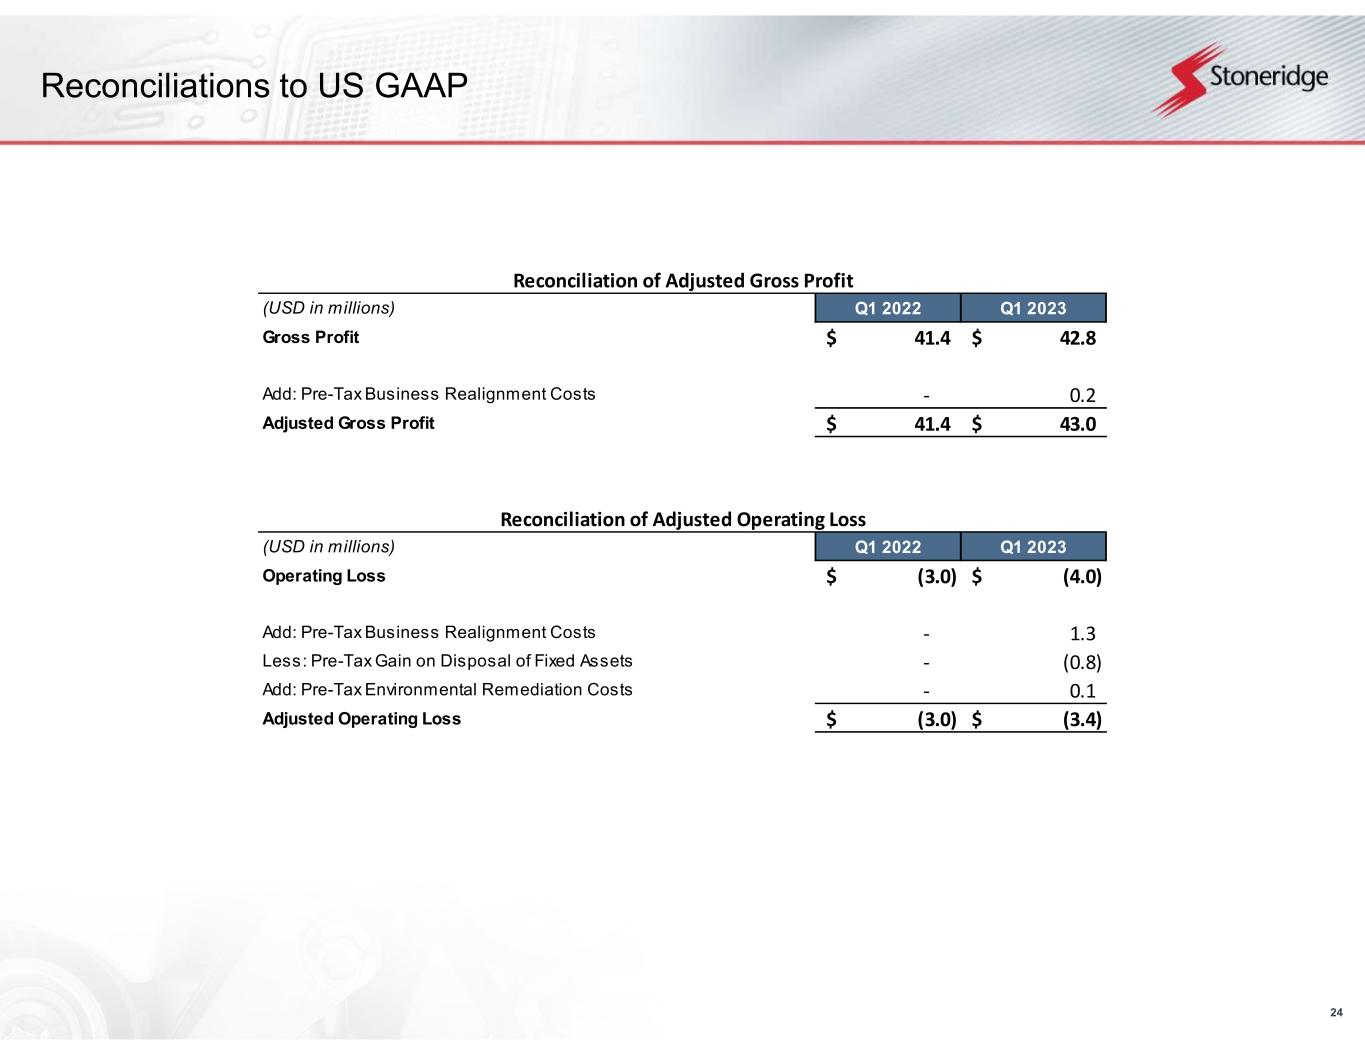
24 Reconciliations to US GAAP Reconciliation of Adjusted Gross Profit (USD in millions) Q1 2022 Q1 2023 Gross Profit 41.4$ 42.8$ Add: Pre-Tax Business Realignment Costs - 0.2 Adjusted Gross Profit 41.4$ 43.0$ Reconciliation of Adjusted Operating Loss (USD in millions) Q1 2022 Q1 2023 Operating Loss (3.0)$ (4.0)$ Add: Pre-Tax Business Realignment Costs - 1.3 Less: Pre-Tax Gain on Disposal of Fixed Assets - (0.8) Add: Pre-Tax Environmental Remediation Costs - 0.1 Adjusted Operating Loss (3.0)$ (3.4)$


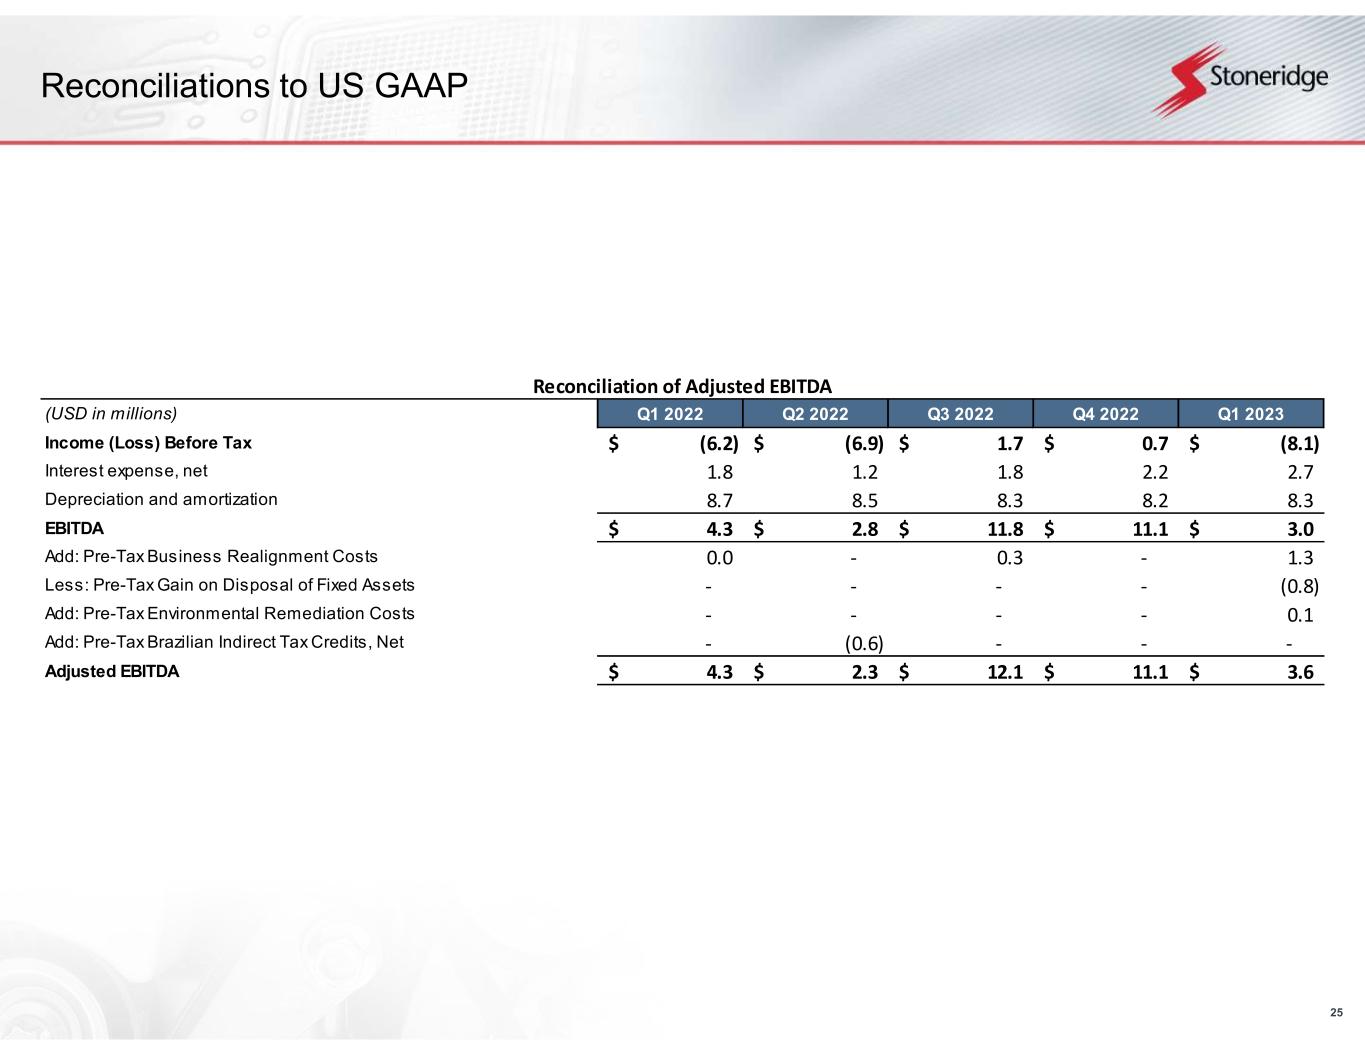
25 Reconciliations to US GAAP Reconciliation of Adjusted EBITDA (USD in millions) Q1 2022 Q2 2022 Q3 2022 Q4 2022 Q1 2023 Income (Loss) Before Tax (6.2)$ (6.9)$ 1.7$ 0.7$ (8.1)$ Interest expense, net 1.8 1.2 1.8 2.2 2.7 Depreciation and amortization 8.7 8.5 8.3 8.2 8.3 EBITDA 4.3$ 2.8$ 11.8$ 11.1$ 3.0$ Add: Pre-Tax Business Realignment Costs 0.0 - 0.3 - 1.3 Less: Pre-Tax Gain on Disposal of Fixed Assets - - - - (0.8) Add: Pre-Tax Environmental Remediation Costs - - - - 0.1 Add: Pre-Tax Brazilian Indirect Tax Credits, Net - (0.6) - - - Adjusted EBITDA 4.3$ 2.3$ 12.1$ 11.1$ 3.6$


26 Reconciliations to US GAAP


27 Reconciliations to US GAAP Reconciliation of Electronics Adjusted Operating Income (Loss) (USD in millions) Q1 2022 Q1 2023 Electronics Operating Income (Loss) (2.7)$ 1.4$ Add: Pre-Tax Business Realignment Costs - 0.3 Electronics Adjusted Operating Income (Loss) (2.7)$ 1.7$ Reconciliation of Control Devices Adjusted Operating Income (USD in millions) Q1 2022 Q1 2023 Control Devices Operating Income 6.8$ 2.1$ Less: Pre-Tax Gain on Disposal of Fixed Assets - (0.8) Add: Pre-Tax Environmental Remediation Costs - 0.1 Control Devices Adjusted Operating Income 6.8$ 1.4$ Reconciliation of Stoneridge Brazil Adjusted Operating Income (USD in millions) Q1 2022 Q1 2023 Stoneridge Brazil Operating Income 0.5$ 1.3$ Add: Pre-Tax Business Realignment Costs 0.0 - Stoneridge Brazil Adjusted Operating Income 0.5$ 1.3$


28 Reconciliations to US GAAP (USD in millions) Q1 2022 Q1 2023 Sales 221.1$ 241.3$ Less: Sales from Spot Purchase Recoveries (24.4) (9.1) Adjusted Sales 196.6$ 232.2$ Reconciliation of Adjusted Sales Reconciliation of Electronics Adjusted Sales (USD in millions) Q1 2022 Q1 2023 Electronics Sales 132.7$ 149.6$ Less: Sales from Spot Purchase Recoveries (24.4) (9.1) Electronics Adjusted Sales 108.3$ 140.5$