Exhibit 99.1

FOR
IMMEDIATE RELEASE
Stoneridge
Reports First-Quarter 2020 Results
OPERATIONAL
IMPROVEMENTS DRIVING SEQUENTIAL MARGIN IMPROVEMENT
IMPLEMENTED
$7.5 – $8.5 MILLION IN 2020 COST REDUCTIONS IN RESPONSE TO COVID-19 PANDEMIC AND TO ALIGN RESOURCES FOR FUTURE, PROFITABLE
GROWTH
2020
First-Quarter Results
| · | Earnings
per diluted share (“EPS”) of $0.13 |
| · | Gross
profit of $45.4 million |
| · | Adjusted
gross profit of $47.0 million (25.7% of sales), an improvement of 170 basis points vs.
Q4 2019 (excluding divested product lines) |
| · | Operating
income of $3.7 million |
| · | Adjusted
operating income of $6.0 million (3.3% of sales) |
| · | Adjusted
EBITDA of $16.1 million (8.8% of sales) |
| · | The
Company estimated that the impact of COVID-19 on first quarter sales and adjusted operating
income was $16.0 million and $4.7 million (210 basis points) respectively |
2020
Outlook
| · | On
March 30, 2020 the Company announced the withdrawal of its 2020 guidance due to uncertainty
surrounding the global environment as a result of COVID-19 |
| · | Updated
end-market forecasts implying weighted average end-markets to decline ~23% vs. previously
provided guidance |
| · | Temporary
and structural cost reductions are expected to generate approximately $7.5 – $8.5
million in savings (excluding separation costs) for the remainder of 2020 and reduce
structural costs going-forward by $5 – $6 million annually |
| · | Incremental
and decremental margins 2.5x – 3x EBITDA margins historically. Cost reduction actions
expected to drive impact to low-end of the decremental range on reduced volume. |
| · | Balance
sheet and liquidity expected to remain strong given availability under U.S. revolving
credit facility and cash-on-hand |
NOVI,
Mich. – May 6, 2020 – Stoneridge, Inc. (NYSE: SRI) today announced financial results for the first quarter ended March
31, 2020, with sales of $183.0 million and earnings per diluted share (EPS) of $0.13. Adjusted EPS was $0.20 for the first quarter,
considering normalizing adjustments primarily related to fair value adjustments and restructuring expenses. The exhibits attached
hereto provide additional detail on the normalizing adjustments.
For
the first quarter of 2020, Stoneridge reported gross profit of $45.4 million and adjusted gross profit of $47.0 million (25.7%
of sales) which was an improvement of 170 basis points relative to the fourth quarter of 2019. Operating income was $3.7 million
and adjusted operating income was $6.0 million (3.3% of sales). Adjusted EBITDA was $16.1 million (8.8% of sales).
The
Company estimated that the impact of the global COVID-19 pandemic reduced sales by $16.0 million and operating income by $4.7
million (210 basis points) in the first quarter based on expected customer sales and operating performance prior to the global
response to limit the spread of the virus.
Jon
DeGaynor, president and chief executive officer, commented, “In the first quarter we drove improved adjusted gross margin
as we significantly reduced our material and overhead costs leading to adjusted gross margin improvement of 170 basis points relative
to the fourth quarter of last year. As a result of these actions and continued strong top-line performance, we were on track for
a strong first quarter. Similar to other companies in our industry and around the world, we began experiencing the effects of
the global COVID-19 pandemic first in China in the beginning of the quarter, followed by North America and Europe in late-March.
To ensure the continued safety of our employees, meet the changing needs of our customers, as well as adhere to federal, state
and local laws, we have been working to adjust our facilities and operations, which has included reduced schedules, reduced plant
utilization and suspending production in some cases. We have taken several actions to temporarily reduce costs to drive 2020 financial
performance and preserve cash, such as reducing our workforce related costs at the facilities impacted.”
DeGaynor
continued, “In addition to the temporary cost reduction measures taken, earlier this week we took more permanent actions
and reduced our global salaried workforce by approximately five percent. We expect that these reductions will help right size
our current cost structure, align our resources with forecasted market conditions and aid our pursuit of profitable growth. We
will continue to invest the necessary capital and resources to ensure the successful launch of our strong backlog of new business
and continue to build upon the technologies and platforms that will support future growth. Stoneridge remains well positioned
to capitalize on the industry megatrends that will drive outperformance of our underlying markets going-forward.”
First
Quarter in Review
Control
Devices sales totaled $98.2 million, an increase of $4.7 million relative to the fourth quarter of 2019. The Company estimated
that the impact of the global COVID-19 pandemic reduced Control Devices sales by $10.9 million in the first quarter. First quarter
adjusted operating margin was 10.1%. The Company estimated that the impact of the pandemic reduced Control Devices operating income
by $3.3 million (200 basis points) in the first quarter.
Electronics
sales totaled $79.8 million, which was flat relative to the fourth quarter of 2019. The Company estimated that the impact of the
global COVID-19 pandemic reduced Electronics sales by $4.5 million in the first quarter. First quarter adjusted operating margin
was 3.6%, which was an increase of 260 basis points relative to the fourth quarter of 2019 driven primarily by reduced material
and overhead costs. The Company estimated that the impact of the pandemic reduced Electronics operating income by $1.3 million
(140 basis points) in the first quarter.
Stoneridge
Brazil sales of $14.6 million decreased relative to the prior quarter due to lower demand in the aftermarket and mass retail product
lines, due in part to seasonality and holiday demand, partially offset by growth in the OEM business. The ramp-up of a new OEM
program that launched in late 2019 drove approximately 48% growth in the OEM business relative to the fourth quarter of 2019.
Stoneridge Brazil adjusted operating margin increased by 50 basis points relative to the fourth quarter of 2019 despite the reduction
in sales. The Company estimated that the pandemic negatively impacted Stoneridge Brazil sales by $0.2 million and operating income
by $0.1 million (40 basis points) in the first quarter.
Cash
and Debt Balances
At
March 31, 2020, Stoneridge had cash and cash equivalents balances totaling $81.3 million. Total debt as of March 31, 2020 was
$163.8 million. Total debt less cash and cash equivalents yielded a current net debt to trailing-twelve-month adjusted EBITDA
ratio of approximately 1.1x. The Company had approximately $239 million of undrawn commitments under the U.S. revolving credit
facility as of March 31, 2020, which resulted in total undrawn commitments and cash balances of more than $320 million. However, it
is possible that future borrowing capacity under the U.S. revolving credit facility may be limited as a result of financial performance
due to the adverse impact of COVID-19 on the Company’s markets and general global demand.
The
increase in cash and cash equivalents in the first quarter of 2020 relative to the fourth quarter of 2019 was primarily due to
an increase in net borrowings under the credit facility to maintain a high level of liquidity due to the uncertain conditions
surrounding COVID-19. Additionally, before the impact of the COVID-19 pandemic, the Company repurchased 242,634 shares in the
first quarter for approximately $5.0 million. Finally, the Company is temporarily suspending the previously announced share repurchase
authorization in response to uncertainty surrounding the duration and magnitude of the impact of the COVID-19 pandemic.
2020
Outlook
Bob
Krakowiak, chief financial officer, commented, “On March 30, 2020 we announced the withdrawal of our 2020 guidance due to
the uncertainty surrounding the global environment as a result of COVID-19. We will revisit guidance when we have the ability
to more clearly define the expected impact of COVID-19 to Stoneridge. Based on current production forecasts we are expecting OEM
weighted-average production levels to decline by approximately 23% in 2020 relative to the forecasts we were utilizing in our
initial guidance, which implied midpoint revenue guidance of approximately $760 million for 2020. As we have discussed previously,
we expect incremental and decremental contribution margins of approximately 2.5x – 3.0x our EBITDA margins on changes in
volume. Due to the temporary and structural cost reduction actions we have taken, we expect the impact of reduced volumes to be
on the low-end of that range. We continue to evaluate opportunities to preserve cash in the short-term and adjust our cost structure
as necessary to align with current and expected market conditions. Our balance sheet remains strong and we believe that we are
well positioned financially to withstand the downturn in expected production volumes.”
Conference
Call on the Web
A live
Internet broadcast of Stoneridge’s conference call regarding 2020 first-quarter results can be accessed at 9:00 a.m. Eastern
Time on Thursday, May 7, 2020, at www.stoneridge.com, which will also offer a webcast replay.
About
Stoneridge, Inc.
Stoneridge,
Inc., headquartered in Novi, Michigan, is an independent designer and manufacturer of highly engineered electrical and electronic
components, modules and systems principally for the automotive, commercial, off-highway, motorcycle and agricultural vehicle markets.
Additional information about Stoneridge can be found at www.stoneridge.com.
Forward-Looking
Statements
Statements
in this release contain “forward-looking statements” under the Private Securities Litigation Reform Act of 1995. These
statements appear in a number of places in this report and may include statements regarding the intent, belief or current expectations
of the Company, with respect to, among other things, our (i) future product and facility expansion, (ii) acquisition strategy,
(iii) investments and new product development, (iv) growth opportunities related to awarded business, and (v) operational expectations.
Forward-looking statements may be identified by the words “will,” “may,” “should,” “designed
to,” “believes,” “plans,” “projects,” “intends,” “expects,”
“estimates,” “anticipates,” “continue,” and similar words and expressions. The forward-looking
statements are subject to risks and uncertainties that could cause actual events or results to differ materially from those expressed
in or implied by the statements. Important factors that could cause actual results to differ materially from those in the forward-looking
statements include, among other factors:
| · | the
reduced purchases, loss or bankruptcy of a major customer or supplier; |
| · | the
costs and timing of business realignment, facility closures or similar actions; |
| · | a
significant change in automotive, commercial, off-highway, motorcycle or agricultural
vehicle production; |
| · | competitive
market conditions and resulting effects on sales and pricing; |
| · | the
impact of changes in foreign currency exchange rates on sales, costs and results, particularly
the Argentinian peso, Brazilian real, Chinese renminbi, euro, Mexican peso and Swedish
krona; |
| · | our
ability to achieve cost reductions that offset or exceed customer-mandated selling price
reductions; |
| · | customer
acceptance of new products; |
| · | our
ability to successfully launch/produce products for awarded business; |
| · | adverse
changes in laws, government regulations or market conditions, including tariffs, affecting
our products or our customers’ products; |
| · | our
ability to protect our intellectual property and successfully defend against assertions
made against us; |
| · | liabilities
arising from warranty claims, product recall or field actions, product liability and
legal proceedings to which we are or may become a party, or the impact of product recall
or field actions on our customers; |
| · | labor
disruptions at our facilities or at any of our significant customers or suppliers; |
| · | business
disruption due to natural disasters or other disasters outside of our control, such as
the global COVID-19 pandemic; |
| · | the
ability of our suppliers to supply us with parts and components at competitive prices
on a timely basis, including the impact of potential tariffs and trade considerations
on their operations and output; |
| · | the
amount of our indebtedness and the restrictive covenants contained in the agreements
governing our indebtedness, including our revolving credit facility; |
| · | capital
availability or costs, including changes in interest rates or market perceptions; |
| · | the
failure to achieve the successful integration of any acquired company or business; |
| · | risks
related to a failure of our information technology systems and networks, and risks associated
with current and emerging technology threats and damage from computer viruses, unauthorized
access, cyber-attack and other similar disruptions; and |
| · | the
items described in Part II Item 1A (“Risk Factors”) of the Company’s
Quarterly Report on Form 10-Q for the period ended March 31, 2020 and in Part I, Item
IA (“Risk Factors”) of our 2019 10-K filed with the SEC.. |
The
forward-looking statements contained herein represent our estimates only as of the date of this release and should not be relied
upon as representing our estimates as of any subsequent date. While we may elect to update these forward-looking statements
at some point in the future, we specifically disclaim any obligation to do so, whether to reflect actual results, changes in assumptions,
changes in other factors affecting such forward-looking statements or otherwise.
Use
of Non-GAAP Financial Information
This press release contains information about the Company’s financial results which is not presented in accordance
with accounting principles generally accepted in the United States (”GAAP”). Such non-GAAP financial measures are
reconciled to their closest GAAP financial measures at the end of this press release. The provision of these non-GAAP financial
measures for 2020 and 2019 is not intended to indicate that Stoneridge is explicitly or implicitly providing projections on those
non-GAAP financial measures, and actual results for such measures are likely to vary from those presented. The reconciliations
include all information reasonably available to the Company at the date of this press release and the adjustments that management
can reasonably predict.
Management
believes the non-GAAP financial measures used in this press release are useful to both management and investors in their analysis
of the Company’s financial position and results of operations. In particular, management believes that adjusted sales, adjusted
gross profit and margin, adjusted operating income and margin, adjusted net income, adjusted earnings per share, adjusted EBITDA,
net debt, adjusted income before tax and adjusted tax rate are useful measures in assessing the Company’s financial performance
by excluding certain items that are not indicative of the Company’s core operating performance or that may obscure trends
useful in evaluating the Company’s continuing operating activities. Management also believes that these measures are useful
to both management and investors in their analysis of the Company’s results of operations and provide improved comparability
between fiscal periods.
Adjusted
sales, adjusted gross profit and margin, adjusted operating income and margin, adjusted net income, adjusted earnings per share,
adjusted EBITDA, net debt, adjusted income before tax and adjusted tax rate should not be considered in isolation or as a substitute
for sales, gross profit, operating income, net income, earnings per share, debt, income before tax or tax rate prepared in accordance
with GAAP.
For
more information, contact Matthew R. Horvath, Director Investor Relations and Corporate Development ([email protected])
CONSOLIDATED
STATEMENTS OF OPERATIONS
| Three
months ended March 31 (in thousands, except per share data) | |
2020 | | |
2019 | |
| | |
| | |
| |
| Net
sales | |
$ | 182,966 | | |
$ | 218,297 | |
| Costs
and expenses: | |
| | | |
| | |
| Cost
of goods sold | |
| 137,569 | | |
| 157,444 | |
| Selling,
general and administrative | |
| 29,503 | | |
| 35,910 | |
| Design
and development | |
| 12,235 | | |
| 13,244 | |
| Operating
income | |
| 3,659 | | |
| 11,699 | |
| Interest
expense, net | |
| 1,030 | | |
| 1,003 | |
| Equity
in earnings of investee | |
| (457 | ) | |
| (364 | ) |
| Other
income, net | |
| (1,617 | ) | |
| (432 | ) |
| Income
before income taxes | |
| 4,703 | | |
| 11,492 | |
| Provision
for income taxes | |
| 1,213 | | |
| 1,835 | |
| Net
income | |
$ | 3,490 | | |
$ | 9,657 | |
| | |
| | | |
| | |
| Earnings
per share: | |
| | | |
| | |
| Basic | |
$ | 0.13 | | |
$ | 0.34 | |
| Diluted | |
$ | 0.13 | | |
$ | 0.33 | |
| Weighted-average
shares outstanding: | |
| | | |
| | |
| Basic | |
| 27,232 | | |
| 28,529 | |
| Diluted | |
| 27,591 | | |
| 29,085 | |
CONSOLIDATED BALANCE SHEETS
| | |
March
31, | | |
December
31, | |
| (in
thousands) | |
2020 | | |
2019 | |
| | |
| (Unaudited)
| | |
| | |
| ASSETS | |
| | | |
| | |
| Current
assets: | |
| | | |
| | |
| Cash
and cash equivalents | |
$ | 81,305 | | |
$ | 69,403 | |
| Accounts
receivable, less reserves of $813 and $1,289, respectively | |
| 138,438 | | |
| 138,564 | |
| Inventories,
net | |
| 95,777 | | |
| 93,449 | |
| Prepaid
expenses and other current assets | |
| 33,739 | | |
| 29,850 | |
| Total
current assets | |
| 349,259 | | |
| 331,266 | |
| Long-term
assets: | |
| | | |
| | |
| Property,
plant and equipment, net | |
| 116,149 | | |
| 122,483 | |
| Intangible
assets, net | |
| 51,463 | | |
| 58,122 | |
| Goodwill | |
| 35,279 | | |
| 35,874 | |
| Operating
lease right-of-use asset | |
| 20,316 | | |
| 22,027 | |
| Investments
and other long-term assets, net | |
| 28,024 | | |
| 32,437 | |
| Total
long-term assets | |
| 251,231 | | |
| 270,943 | |
| Total
assets | |
$ | 600,490 | | |
$ | 602,209 | |
| | |
| | | |
| | |
| LIABILITIES
AND SHAREHOLDERS' EQUITY | |
| | | |
| | |
| Current
liabilities: | |
| | | |
| | |
| Current
portion of debt | |
$ | 2,516 | | |
$ | 2,672 | |
| Accounts
payable | |
| 79,222 | | |
| 80,701 | |
| Accrued
expenses and other current liabilities | |
| 48,731 | | |
| 55,223 | |
| Total
current liabilities | |
| 130,469 | | |
| 138,596 | |
| Long-term
liabilities: | |
| | | |
| | |
| Revolving
credit facility | |
| 161,000 | | |
| 126,000 | |
| Long-term
debt, net | |
| 255 | | |
| 454 | |
| Deferred
income taxes | |
| 11,335 | | |
| 12,530 | |
| Operating
lease long-term liability | |
| 16,569 | | |
| 17,971 | |
| Other
long-term liabilities | |
| 13,569 | | |
| 16,754 | |
| Total
long-term liabilities | |
| 202,728 | | |
| 173,709 | |
| Shareholders'
equity: | |
| | | |
| | |
| Preferred
Shares, without par value, 5,000 shares authorized, none issued | |
| - | | |
| - | |
| Common
Shares, without par value, 60,000 shares authorized, 28,966 and 28,966 shares issued and 26,993 and 27,408 shares outstanding
at March 31, 2020 and December 31, 2019, respectively, with no stated value | |
| - | | |
| - | |
| Additional
paid-in capital | |
| 230,506 | | |
| 225,607 | |
| Common
Shares held in treasury, 1,973 and 1,558 shares at March 31, 2020 and December 31, 2019, respectively, at cost | |
| (60,999 | ) | |
| (50,773 | ) |
| Retained
earnings | |
| 210,032 | | |
| 206,542 | |
| Accumulated
other comprehensive loss | |
| (112,246 | ) | |
| (91,472 | ) |
| Total
shareholders' equity | |
| 267,293 | | |
| 289,904 | |
| Total
liabilities and shareholders' equity | |
$ | 600,490 | | |
$ | 602,209 | |
CONSOLIDATED
STATEMENTS OF CASH FLOWS
| Three
months ended March 31 (in thousands) | |
2020 | | |
2019 | |
| | |
| | |
| |
| OPERATING
ACTIVITIES: | |
| | | |
| | |
| Net
income | |
$ | 3,490 | | |
$ | 9,657 | |
| Adjustments
to reconcile net income to net cash provided by (used for) operating activities: | |
| | | |
| | |
| Depreciation | |
| 6,650 | | |
| 5,697 | |
| Amortization,
including accretion and write-off of deferred financing costs | |
| 1,429 | | |
| 1,613 | |
| Deferred
income taxes | |
| 76 | | |
| (2,979 | ) |
| Earnings
of equity method investee | |
| (457 | ) | |
| (364 | ) |
| Loss
(gain) on sale of fixed assets | |
| 131 | | |
| (1 | ) |
| Share-based
compensation expense | |
| 1,372 | | |
| 1,548 | |
| Excess
tax deficiency (benefit) related to share-based compensation expense | |
| 17 | | |
| (656 | ) |
| Change
in fair value of earn-out contingent consideration | |
| (633 | ) | |
| 469 | |
| Change
in fair value of venture capital fund | |
| 39 | | |
| (16 | ) |
| Changes
in operating assets and liabilities, net of effect of business combination: | |
| | | |
| | |
| Accounts
receivable, net | |
| (3,730 | ) | |
| (17,821 | ) |
| Inventories,
net | |
| (5,838 | ) | |
| (13,655 | ) |
| Prepaid
expenses and other assets | |
| (3,702 | ) | |
| (660 | ) |
| Accounts
payable | |
| 2,327 | | |
| 16,395 | |
| Accrued
expenses and other liabilities | |
| (7,733 | ) | |
| (4,836 | ) |
| Net
cash used for operating activities | |
| (6,562 | ) | |
| (5,609 | ) |
| | |
| | | |
| | |
| INVESTING
ACTIVITIES: | |
| | | |
| | |
| Capital
expenditures, including intangibles | |
| (7,140 | ) | |
| (8,684 | ) |
| Proceeds
from sale of fixed assets | |
| 8 | | |
| 1 | |
| Investment
in venture capital fund | |
| - | | |
| (400 | ) |
| Net
cash used for investing activities | |
| (7,132 | ) | |
| (9,083 | ) |
| | |
| | | |
| | |
| FINANCING
ACTIVITIES: | |
| | | |
| | |
| Revolving
credit facility borrowings | |
| 71,500 | | |
| - | |
| Revolving
credit facility payments | |
| (36,500 | ) | |
| (5,000 | ) |
| Proceeds
from issuance of debt | |
| 1,958 | | |
| 34 | |
| Repayments of
debt | |
| (2,076 | ) | |
| (690 | ) |
| Earn-out
consideration cash payment | |
| - | | |
| (3,394 | ) |
| Other
financing costs | |
| (1 | ) | |
| (2 | ) |
| Common
Share repurchase program | |
| (4,995 | ) | |
| - | |
| Repurchase
of Common Shares to satisfy employee tax withholding | |
| (1,687 | ) | |
| (2,945 | ) |
| Net
cash provided by (used for) financing activities | |
| 28,199 | | |
| (11,997 | ) |
| | |
| | | |
| | |
| Effect
of exchange rate changes on cash and cash equivalents | |
| (2,603 | ) | |
| (1,317 | ) |
| Net
change in cash and cash equivalents | |
| 12,378 | | |
| (28,006 | ) |
| Cash
and cash equivalents at beginning of period | |
| 69,403 | | |
| 81,092 | |
| | |
| | | |
| | |
| Cash
and cash equivalents at end of period | |
$ | 81,305 | | |
$ | 53,086 | |
| | |
| | | |
| | |
| Supplemental
disclosure of cash flow information: | |
| | | |
| | |
| Cash
paid for interest | |
$ | 1,150 | | |
$ | 1,109 | |
| Cash
paid for income taxes, net | |
$ | 1,832 | | |
$ | 3,327 | |
Regulation G Non-GAAP Financial Measure Reconciliations
Reconciliation
to US GAAP
Exhibit
1 - Adjusted EPS
| Reconciliation
of Q1 2020 Adjusted EPS |
| | |
| | |
| |
| (USD in millions) | |
Q1
2020 | | |
Q1
2020 EPS | |
| Net
Income | |
$ | 3.5 | | |
$ | 0.13 | |
| | |
| | | |
| | |
| Add: After-Tax Step-Up
in Fair Value of Earn-Out (PST) | |
| (0.6 | ) | |
| (0.02 | ) |
| Add: After-Tax Restructuring
Costs | |
| 1.7 | | |
| 0.06 | |
| Add: Pre-Tax Share-Based
Comp Accelerated Vesting | |
| 0.1 | | |
| 0.00 | |
| Less: After-Tax Gain
in Fair Value of Equity Investment | |
| 0.0 | | |
| 0.00 | |
| Add: After-Tax Impact
of Valuation Allowance | |
| 0.3 | | |
| 0.01 | |
| Add:
After-Tax Business Realignment Costs | |
| 0.5 | | |
| 0.02 | |
| Adjusted
Net Income | |
$ | 5.5 | | |
$ | 0.20 | |
Exhibit
2 – Adjusted Operating Income by Segment
| Reconciliation
of Control Devices Adjusted Operating Income |
| | |
| | |
| |
| (USD in millions) | |
Q4
2019 | | |
Q1
2020 | |
| Control
Devices Operating Income | |
$ | 7.2 | | |
$ | 7.3 | |
| | |
| | | |
| | |
| Add: Pre-Tax Restructuring
Costs | |
| 3.0 | | |
| 2.2 | |
| Add:
Pre-Tax Business Realignment Costs | |
| 0.2 | | |
| 0.4 | |
| Control
Devices Adjusted Operating Income | |
$ | 10.4 | | |
$ | 9.9 | |
| Reconciliation
of Electronics Adjusted Operating Income |
| | |
| | |
| |
| (USD in millions) | |
Q4
2019 | | |
Q1
2020 | |
| Electronics
Operating Income | |
$ | 0.8 | | |
$ | 2.9 | |
| | |
| | | |
| | |
| Add: Pre-Tax Restructuring
Costs | |
| 0.2 | | |
| 0.0 | |
| Add:
Pre-Tax Business Realignment Costs | |
| 0.1 | | |
| | |
| Electronics
Adjusted Operating Income | |
$ | 1.0 | | |
$ | 2.9 | |
| Reconciliation
of Stoneridge Brazil Adjusted Operating Income |
| | |
| | |
| |
| (USD in millions) | |
Q4
2019 | | |
Q1
2020 | |
| PST
Operating Income | |
$ | (0.1 | ) | |
$ | 0.9 | |
| | |
| | | |
| | |
| Add: Pre-Tax Step-Up
in Fair Value of Earn-Out (PST) | |
| 0.4 | | |
| (0.6 | ) |
| Add:
Pre-Tax Business Realignment Costs | |
| | | |
| 0.2 | |
| PST
Adjusted Operating Income | |
$ | 0.4 | | |
$ | 0.4 | |
Exhibit
3 – Adjusted Operating Income
| Reconciliation
of Adjusted Operating Income |
| | |
| | |
| |
| (USD in millions) | |
Q4
2019 | | |
Q1
2020 | |
| Operating
Income | |
$ | 1.1 | | |
$ | 3.7 | |
| | |
| | | |
| | |
| Add: Pre-Tax Step-Up
in Fair Value of Earn-Out (PST) | |
| 0.4 | | |
| (0.6 | ) |
| Less: Pre-Tax Change
in Fair Value of Equity Investment | |
| 0.2 | | |
| 0.0 | |
| Add: Pre-Tax Restructuring
Costs | |
| 3.4 | | |
| 2.2 | |
| Add: Pre-Tax Share-Based
Comp Accelerated Vesting | |
| | | |
| 0.1 | |
| Add:
Pre-Tax Business Realignment Costs | |
| 0.3 | | |
| 0.6 | |
| Adjusted
Operating Income | |
$ | 5.5 | | |
$ | 6.0 | |
Exhibit
4 – Adjusted EBITDA
| Reconciliation
of Adjusted EBITDA |
| | |
| | |
| |
| (USD in millions) | |
Q4
2019 | | |
Q1
2020 | |
| Income
Before Tax | |
$ | (0.0 | ) | |
$ | 4.7 | |
| Interest expense, net | |
| 1.2 | | |
| 1.0 | |
| Depreciation
and amortization | |
| 8.1 | | |
| 8.1 | |
| EBITDA | |
$ | 9.3 | | |
$ | 13.8 | |
| Add: Pre-Tax Step-Up
in Fair Value of Earn-Out (PST) | |
| 0.4 | | |
| (0.6 | ) |
| Less: Pre-Tax Gain in
Fair Value of Equity Investment | |
| 0.2 | | |
| 0.0 | |
| Add: Pre-Tax Restructuring
Costs | |
| 3.4 | | |
| 2.2 | |
| Add: Pre-Tax Business
Realignment Costs | |
| 0.3 | | |
| 0.6 | |
| Add:
Pre-Tax Share-Based Comp Accelerated Vesting | |
| | | |
| 0.1 | |
| Adjusted
EBITDA | |
$ | 13.7 | | |
$ | 16.1 | |
Exhibit
5 – Adjusted Gross Profit
| Reconciliation
of Adjusted Gross Profit |
| | |
| | |
| |
| (USD in millions) | |
Q4
2019 | | |
Q1
2020 | |
| Gross
Profit | |
| 44.2 | | |
| 45.4 | |
| | |
| | | |
| | |
| Add: Pre-Tax Restructuring
Costs | |
| 1.5 | | |
| 1.5 | |
| Add:
Pre-Tax Business Realignment Costs | |
| | | |
| 0.1 | |
| Adjusted
Gross Profit | |
| 45.6 | | |
| 47.0 | |
Exhibit
6 – Adjusted Sales
| Reconciliation
of Adjusted Sales Excluding Disposed Non-Core Products |
| | |
| | |
| |
| (USD in millions) | |
Q4
2019 | | |
Q1
2020 | |
| Adjusted
Sales | |
$ | 190.4 | | |
$ | 183.0 | |
| | |
| | | |
| | |
| Less:
Pre-Tax Sale from Disposed Non-Core Products | |
| (6.5 | ) | |
| | |
| Adjusted
Sales Excluding Disposed Non-Core Products | |
$ | 183.9 | | |
$ | 183.0 | |
Exhibit
7 – Control Devices Adjusted Sales
| Reconciliation
of Control Devices Adjusted Sales Excluding Disposed Non-Core Products |
| | |
| | |
| |
| (USD in millions) | |
Q4
2019 | | |
Q1
2020 | |
| Adjusted
Control Devices Sales | |
$ | 100.0 | | |
$ | 98.2 | |
| | |
| | | |
| | |
| Less:
Sales from Disposed Non-Core Products | |
| (6.5 | ) | |
| | |
| Adjusted
Control Devices Sales Excluding Disposed Non-Core Products | |
$ | 93.5 | | |
$ | 98.2 | |
Exhibit
8 – Adjusted Tax Rate
Reconciliation
of Q1 2020 Adjusted Tax Rate
| (USD in millions) | |
Q1
2020 | |
| Income
Before Tax | |
$ | 4.7 | |
| | |
| | |
| Add: Pre-Tax Step-Up
in Fair Value of Earn-Out (PST) | |
| (0.6 | ) |
| Less: Pre-Tax Change
in Fair Value of Equity Investment | |
| 0.0 | |
| Add: Pre-Tax Share-Based
Comp Accelerated Vesting | |
| 0.1 | |
| Add: Pre-Tax Restructuring
Costs | |
| 2.2 | |
| Add:
Pre-Tax Business Realignment Costs | |
| 0.6 | |
| Adjusted
Income Before Tax | |
$ | 7.0 | |
| | |
| | |
| Income
Tax Provision | |
$ | 1.2 | |
| | |
| | |
| Add: Tax Impact From
Pre-Tax Adjustments | |
| 0.6 | |
| Add: After-Tax Impact
of Valuation Allowance | |
| (0.3 | ) |
| | |
| | |
| Adjusted
Income Tax Provision | |
$ | 1.6 | |
| | |
| | |
| Adjusted
Tax Rate | |
| 22.0 | % |
Q1 2020 Results May 7, 2020 Exhibit 99.2
2 Forward - Looking Statements Statements in this presentation that are not historical facts are forward - looking statements, which involve risks and uncertaint ies that could cause actual events or results to differ materially from those expressed or implied by the statements. Important factors that ma y cause actual results to differ materially from those in the forward - looking statements include, among other factors, the impact of the global COVID - 19 pandemic on our business, results of operations and financial condition; the loss or bankruptcy of a major customer; the cost s a nd timing of facility closures, business realignment or similar actions; a significant change in automotive, commercial, off - highway, motorcy cle and agricultural vehicle production; our ability to achieve cost reductions that offset or exceed customer - mandated selling price re ductions; a significant change in general economic conditions in any of the various countries in which Stoneridge operates; labor disrupt ion s at Stoneridge’s facilities or at any of Stoneridge’s significant customers or suppliers; the ability of suppliers to supply Ston eri dge with parts and components at competitive prices on a timely basis; the amount of Stoneridge’s indebtedness and the restrictive covenants con tai ned in the agreements governing its indebtedness, including its revolving credit facility; customer acceptance of new products; capital ava ilability or costs, including changes in interest rates or market perceptions; the failure to achieve successful integration of any acquir ed company or business; the occurrence or non - occurrence of circumstances beyond Stoneridge’s control; and the items described in “Risk Factor s” and other uncertainties or risks discussed in Stoneridge’s periodic and current reports filed with the Securities and Exchange Co mmi ssion. Important factors that could cause the performance of the commercial vehicle and automotive industry to differ materially fro m t hose in the forward - looking statements include factors such as (1) continued economic instability or poor economic conditions in the United States and global markets, including as a result of the global COVID - 19 pandemic, (2) changes in economic conditions, housing prices, forei gn currency exchange rates, commodity prices, including shortages of and increases or volatility in the price of oil, (3) changes in laws an d regulations, (4) the state of the credit markets, (5) political stability, (6) international conflicts and (7) the occurrence of force maj eur e events. These factors should not be construed as exhaustive and should be considered with the other cautionary statements in Stonerid ge’ s filings with the Securities and Exchange Commission. Forward - looking statements are not guarantees of future performance; Stoneridge’s actual results of operations, financial condit ion and liquidity, and the development of the industry in which Stoneridge operates may differ materially from those described in or sug gested by the forward - looking statements contained in this presentation. In addition, even if Stoneridge’s results of operations, financial co ndition and liquidity, and the development of the industry in which Stoneridge operates ar e consistent with the forward - looking statements contained in this presentation, those results or developments may not be indicative of results or developments in subsequent periods. This presentation contains time - sensitive information that reflects management’s best analysis only as of the date of this prese ntation. Any forward - looking statements in this presentation speak only as of the date of this presentation, and Stoneridge undertakes no obl igation to update such statements. Comparisons of results for current and any prior periods are not intended to express any future tren ds or indications of future performance, unless expressed as such, and should only be viewed as historical data. Stoneridge does not undertake any obligation to publicly update or revise any forward - looking statement as a result of new infor mation, future events or otherwise, except as otherwise required by law. Rounding Disclosure: There may be slight immaterial differences between figures represented in our public filings compared t o w hat is shown in this presentation. The differences are the result of rounding due to the representation of values in millions rathe r t han thousands in public filings.
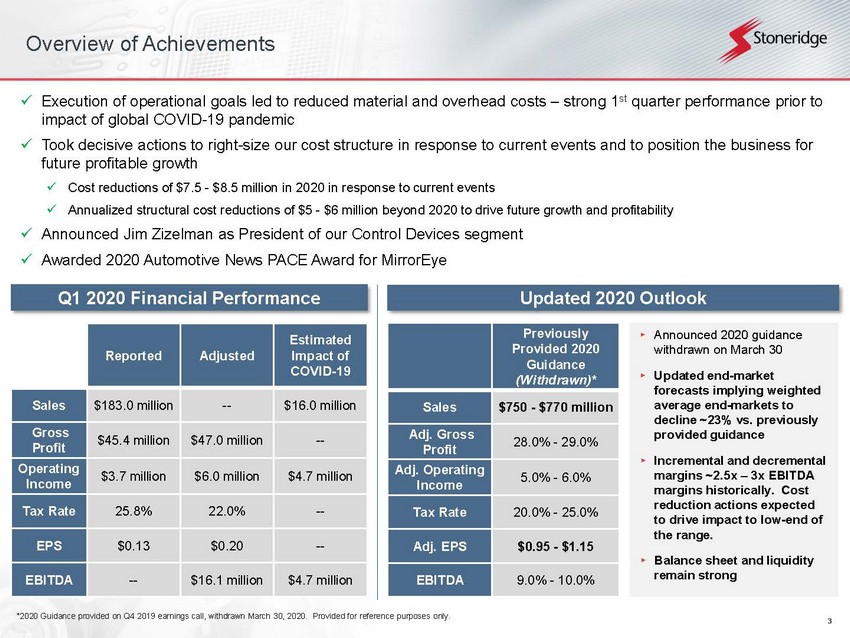
3 Overview of Achievements x Execution of operational goals led to reduced material and overhead costs – strong 1 st quarter performance prior to impact of global COVID - 19 pandemic x Took decisive actions to right - size our cost structure in response to current events and to position the business for future profitable growth x Cost reductions of $7.5 - $8.5 million in 2020 in response to current events x Annualized str uctural cost reductions of $5 - $6 million beyond 2020 to drive future growth and profitability x Announced Jim Zizelman as President of our Control Devices segment x Awarded 2020 Automotive News PACE Award for MirrorEye Q 1 2020 Financial Performance Updated 2020 Outlook Previously Provided 2020 Guidance (Withdrawn)* Sales $750 - $770 million Adj. Gross Profit 28.0% - 29.0% Adj. Operating Income 5.0% - 6.0% Tax Rate 20.0% - 25.0% Adj. EPS $0.95 - $1.15 EBITDA 9.0% - 10.0% Reported Adjusted Estimated Impact of COVID - 19 Sales $183.0 million -- $16.0 million Gross Profit $45.4 million $47.0 million -- Operating Income $3.7 million $6.0 million $4.7 million Tax Rate 25.8% 22.0% -- EPS $0.13 $0.20 -- EBITDA -- $16.1 million $4.7 million ▸ Announced 2020 guidance withdrawn on March 30 ▸ Updated end - market forecasts implying weighted average end - markets to decline ~23% vs. previously provided guidance ▸ Incremental and decremental margins ~2.5x – 3x EBITDA margins historically. Cost reduction actions expected to drive impact to low - end of the range. ▸ Balance sheet and liquidity remain strong *2020 Guidance provided on Q4 2019 earnings call, withdrawn March 30, 2020. Provided for reference purposes only.
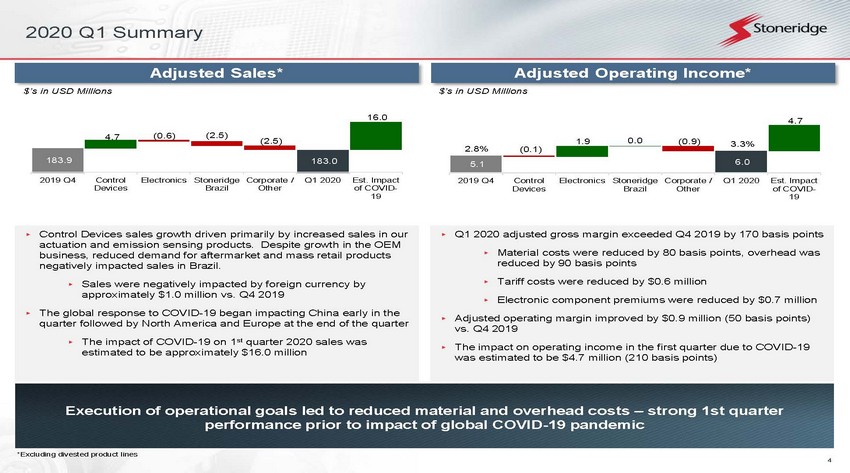
4 Execution of operational goals led to reduced material and overhead costs – strong 1st quarter performance prior to impact of global COVID - 19 pandemic Adjusted Sales* Adjusted Operating Income* ▸ Control Devices sales growth driven primarily by increased sales in our actuation and emission sensing products. Despite growth in the OEM business, reduced demand for aftermarket and mass retail products negatively impacted sales in Brazil. ▸ Sales were negatively impacted by foreign currency by approximately $1.0 million vs. Q4 2019 ▸ The global response to COVID - 19 began impacting China early in the quarter followed by North America and Europe at the end of the quarter ▸ The impact of COVID - 19 on 1 st quarter 2020 sales was estimated to be approximately $16.0 million ▸ Q1 2020 adjusted gross margin exceeded Q4 2019 by 170 basis points ▸ Material costs were reduced by 80 basis points, overhead was reduced by 90 basis points ▸ Tariff costs were reduced by $0.6 million ▸ Electronic component premiums were reduced by $0.7 million ▸ Adjusted operating margin improved by $0.9 million (50 basis points) vs. Q4 2019 ▸ The impact on operating income in the first quarter due to COVID - 19 was estimated to be $4.7 million (210 basis points) *Excluding divested product lines $’s in USD Millions $’s in USD Millions 2020 Q1 Summary 5.1 (0.1) 0.0 - 6.0 4.7 1.9 (0.9) 2019 Q4 Control Devices Electronics Stoneridge Brazil Corporate / Other Q1 2020 Est. Impact of COVID- 19 2.8% 3.3% 183.9 4.7 (2.5) - 183.0 16.0 (0.6) (2.5) 2019 Q4 Control Devices Electronics Stoneridge Brazil Corporate / Other Q1 2020 Est. Impact of COVID- 19
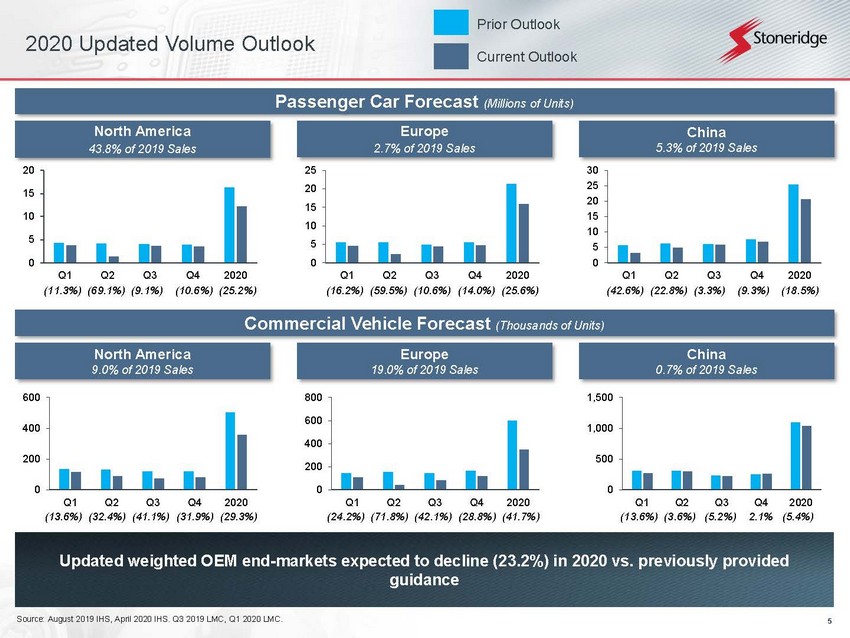
5 Updated weighted OEM end - markets expected to decline (23.2%) in 2020 vs. previously provided guidance 2020 Updated Volume Outlook Prior Outlook Current Outlook Passenger Car Forecast (Millions of Units) Commercial Vehicle Forecast (Thousands of Units) North America 43.8% of 2019 Sales Europe 2.7% of 2019 Sales China 5.3% of 2019 Sales North America 9.0% of 2019 Sales Europe 19.0% of 2019 Sales China 0.7% of 2019 Sales 0 5 10 15 20 Q1 Q2 Q3 Q4 2020 0 5 10 15 20 25 Q1 Q2 Q3 Q4 2020 0 5 10 15 20 25 30 Q1 Q2 Q3 Q4 2020 0 200 400 600 Q1 Q2 Q3 Q4 2020 0 200 400 600 800 Q1 Q2 Q3 Q4 2020 0 500 1,000 1,500 Q1 Q2 Q3 Q4 2020 (11.3%) (69.1%) (9.1%) (10.6%) (25.2%) (16.2%) (59.5%) (10.6%) (14.0%) (25.6%) (42.6%) (22.8%) (3.3%) (9.3%) (18.5%) (13.6%) (32.4%) (41.1%) (31.9%) (29.3%) (24.2%) (71.8%) (42.1%) (28.8%) (41.7%) (13.6%) (3.6%) (5.2%) 2.1% (5.4%) Source: August 2019 IHS, April 2020 IHS. Q3 2019 LMC, Q1 2020 LMC.
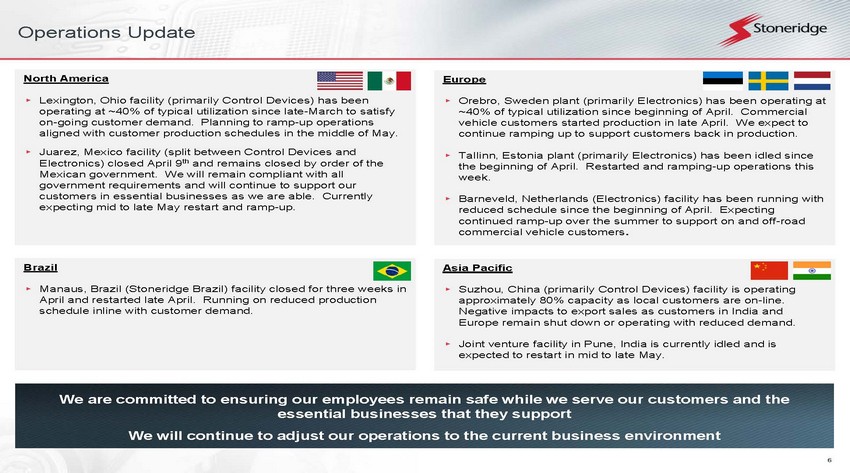
6 Operations Update We are committed to ensuring our employees remain safe while we serve our customers and the essential businesses that they support We will continue to adjust our operations to the current business environment North America ▸ Lexington, Ohio facility (primarily Control Devices) has been operating at ~40% of typical utilization since late - March to satisfy on - going customer demand. Planning to ramp - up operations aligned with customer production schedules in the middle of May. ▸ Juarez, Mexico facility (split between Control Devices and Electronics) closed April 9 th and remains closed by order of the Mexican government. We will remain compliant with all government requirements and will continue to support our customers in essential businesses as we are able. Currently expecting mid to late May restart and ramp - up. Europe ▸ Orebro, Sweden plant (primarily Electronics) has been operating at ~40% of typical utilization since beginning of April. Commercial vehicle customers started production in late April. We expect to continue ramping up to support customers back in production. ▸ Tallinn, Estonia plant (primarily Electronics) has been idled since the beginning of April. Restarted and ramping - up operations this week. ▸ Barneveld, Netherlands (Electronics) facility has been running with reduced schedule since the beginning of April. Expecting continued ramp - up over the summer to support on and off - road commercial vehicle customers . Brazil ▸ Manaus, Brazil (Stoneridge Brazil) facility closed for three weeks in April and restarted late April. Running on reduced production schedule inline with customer demand. Asia Pacific ▸ Suzhou, China (primarily Control Devices) facility is operating approximately 80% capacity as local customers are on - line. Negative impacts to export sales as customers in India and Europe remain shut down or operating with reduced demand. ▸ Joint venture facility in Pune, India is currently idled and is expected to restart in mid to late May.
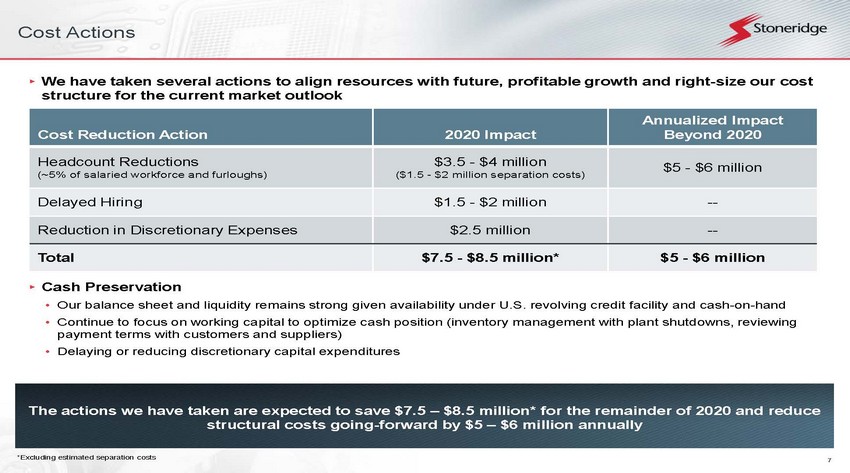
7 ▸ We have taken several actions to align resources with future, profitable growth and right - size our cost structure for the current market outlook ▸ Cash Preservation • Our balance sheet and liquidity remains strong given availability under U.S. revolving credit facility and cash - on - hand • Continue to focus on working capital to optimize cash position (inventory management with plant shutdowns, reviewing payment terms with customers and suppliers) • Delaying or reducing discretionary capital expenditures The actions we have taken are expected to save $7.5 – $8.5 million* for the remainder of 2020 and reduce structural costs going - forward by $5 – $6 million annually Cost Reduction Action 2020 Impact Annualized Impact Beyond 2020 Headcount Reductions (~5% of salaried workforce and furloughs) $3.5 - $4 million ($1.5 - $2 million separation costs) $5 - $6 million Delayed Hiring $1.5 - $2 million -- Reduction in Discretionary Expenses $2.5 million -- Total $7.5 - $8.5 million* $5 - $6 million *Excluding estimated separation costs Cost Actions
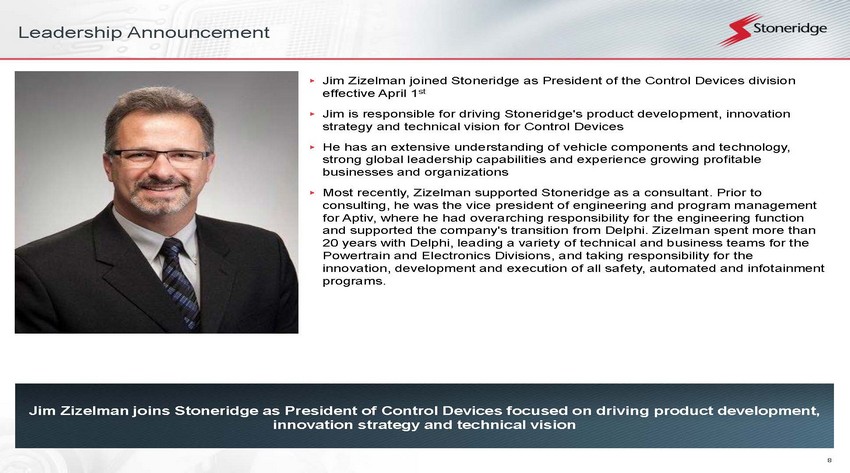
8 Leadership Announcement Jim Zizelman joins Stoneridge as President of Control Devices focused on driving product development, innovation strategy and technical vision ▸ Jim Zizelman joined Stoneridge as President of the Control Devices division effective April 1 st ▸ Jim is responsible for driving Stoneridge's product development, innovation strategy and technical vision for Control Devices ▸ He has an extensive understanding of vehicle components and technology, strong global leadership capabilities and experience growing profitable businesses and organizations ▸ Most recently, Zizelman supported Stoneridge as a consultant. Prior to consulting, he was the vice president of engineering and program management for Aptiv, where he had overarching responsibility for the engineering function and supported the company's transition from Delphi. Zizelman spent more than 20 years with Delphi, leading a variety of technical and business teams for the Powertrain and Electronics Divisions, and taking responsibility for the innovation, development and execution of all safety, automated and infotainment programs.
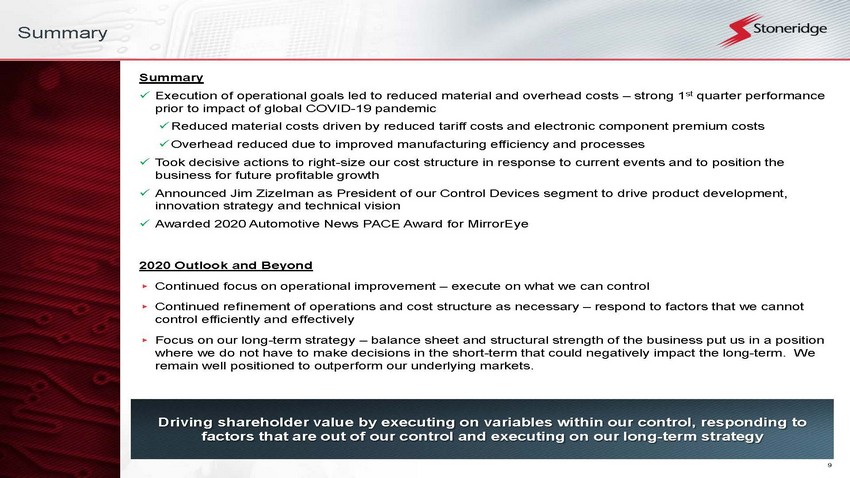
9 Summary Summary x Execution of operational goals led to reduced material and overhead costs – strong 1 st quarter performance prior to impact of global COVID - 19 pandemic x Reduced material costs driven by reduced tariff costs and electronic component premium costs x Overhead reduced due to improved manufacturing efficiency and processes x Took decisive actions to right - size our cost structure in response to current events and to position the business for future profitable growth x Announced Jim Zizelman as President of our Control Devices segment to drive product development, innovation strategy and technical vision x Awarded 2020 Automotive News PACE Award for MirrorEye 2020 Outlook and Beyond ▸ Continued focus on operational improvement – execute on what we can control ▸ Continued refinement of operations and cost structure as necessary – respond to factors that we cannot control efficiently and effectively ▸ Focus on our long - term strategy – balance sheet and structural strength of the business put us in a position where we do not have to make decisions in the short - term that could negatively impact the long - term. We remain well positioned to outperform our underlying markets. Driving shareholder value by executing on variables within our control, responding to factors that are out of our control and executing on our long - term strategy

10 Financial Update
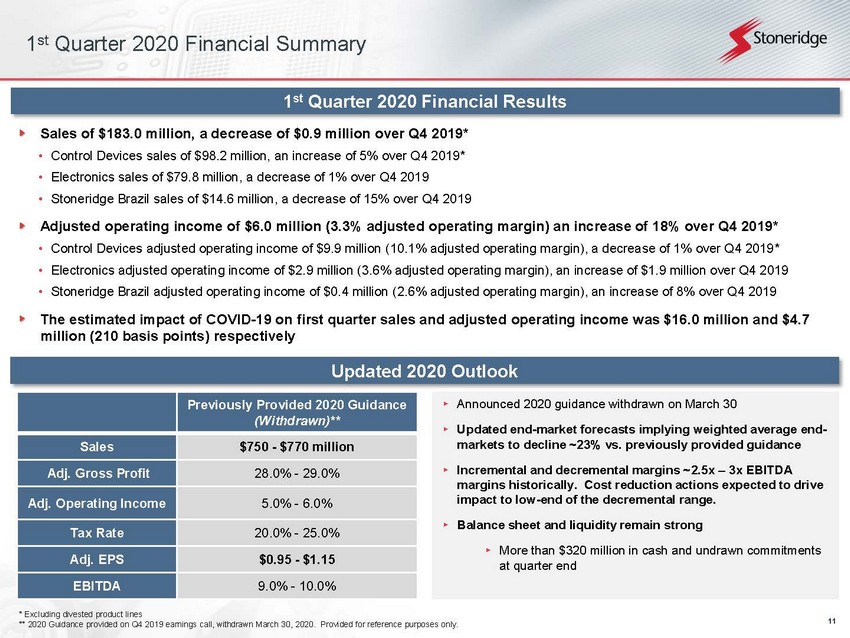
11 1 st Quarter 2020 Financial Summary 1 st Quarter 2020 Financial Results Sales of $183.0 million, a decrease of $0.9 million over Q4 2019* • Control Devices sales of $98.2 million, an increase of 5% over Q4 2019* • Electronics sales of $79.8 million, a decrease of 1% over Q4 2019 • Stoneridge Brazil sales of $14.6 million, a decrease of 15% over Q4 2019 Adjusted operating income of $6.0 million (3.3% adjusted operating margin) an increase of 18% over Q4 2019* • Control Devices adjusted operating income of $9.9 million (10.1% adjusted operating margin), a decrease of 1% over Q4 2019* • Electronics adjusted operating income of $2.9 million (3.6% adjusted operating margin), an increase of $1.9 million over Q4 2 019 • Stoneridge Brazil adjusted operating income of $0.4 million (2.6% adjusted operating margin), an increase of 8% over Q4 2019 The estimated impact of COVID - 19 on first quarter sales and adjusted operating income was $16.0 million and $4.7 million (210 basis points) respectively Updated 2020 Outlook Previously Provided 2020 Guidance (Withdrawn)** Sales $750 - $770 million Adj. Gross Profit 28.0% - 29.0% Adj. Operating Income 5.0% - 6.0% Tax Rate 20.0% - 25.0% Adj. EPS $0.95 - $1.15 EBITDA 9.0% - 10.0% ▸ Announced 2020 guidance withdrawn on March 30 ▸ Updated end - market forecasts implying weighted average end - markets to decline ~23% vs. previously provided guidance ▸ Incremental and decremental margins ~2.5x – 3x EBITDA margins historically. Cost reduction actions expected to drive impact to low - end of the decremental range. ▸ Balance sheet and liquidity remain strong ▸ More than $320 million in cash and undrawn commitments at quarter end * Excluding divested product lines ** 2020 Guidance provided on Q4 2019 earnings call, withdrawn March 30, 2020. Provided for reference purposes only.
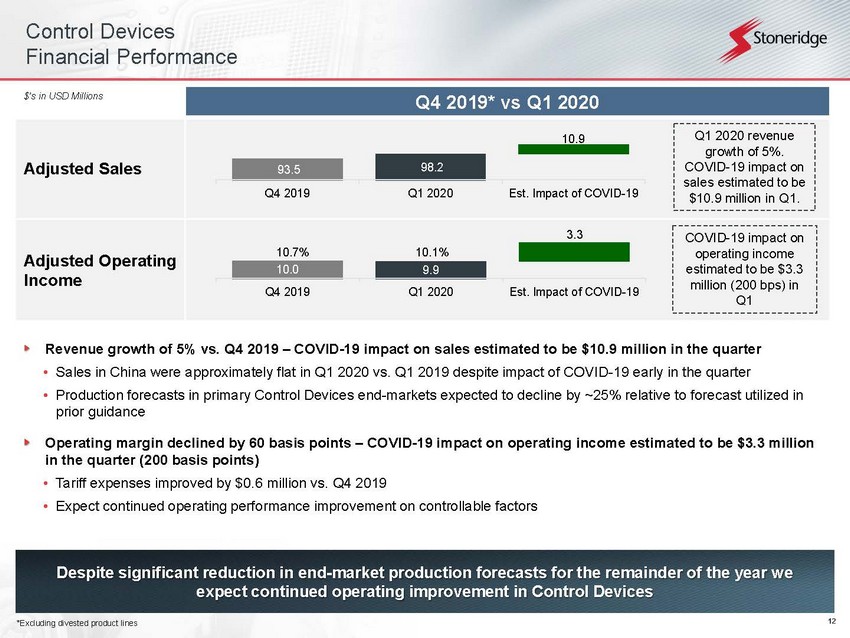
12 Control Devices Financial Performance Despite significant reduction in end - market production forecasts for the remainder of the year we expect continued operating improvement in Control Devices *Excluding divested product lines Revenue growth of 5% vs. Q4 2019 – COVID - 19 impact on sales estimated to be $10.9 million in the quarter • Sales in China were approximately flat in Q1 2020 vs. Q1 2019 despite impact of COVID - 19 early in the quarter • Production forecasts in primary Control Devices end - markets expected to decline by ~25% relative to forecast utilized in prior guidance Operating margin declined by 60 basis points – COVID - 19 impact on operating income estimated to be $3.3 million in the quarter (200 basis points) • Tariff expenses improved by $0.6 million vs. Q4 2019 • Expect continued operating performance improvement on controllable factors Q4 2019* vs Q1 2020 Adjusted Sales Adjusted Operating Income $’s in USD Millions Q1 2020 revenue growth of 5%. COVID - 19 impact on sales estimated to be $10.9 million in Q1. COVID - 19 impact on operating income estimated to be $3.3 million (200 bps) in Q1 10.0 9.9 3.3 Q4 2019 Q1 2020 Est. Impact of COVID-19 93.5 98.2 10.9 Q4 2019 Q1 2020 Est. Impact of COVID-19 10.7% 10.1%
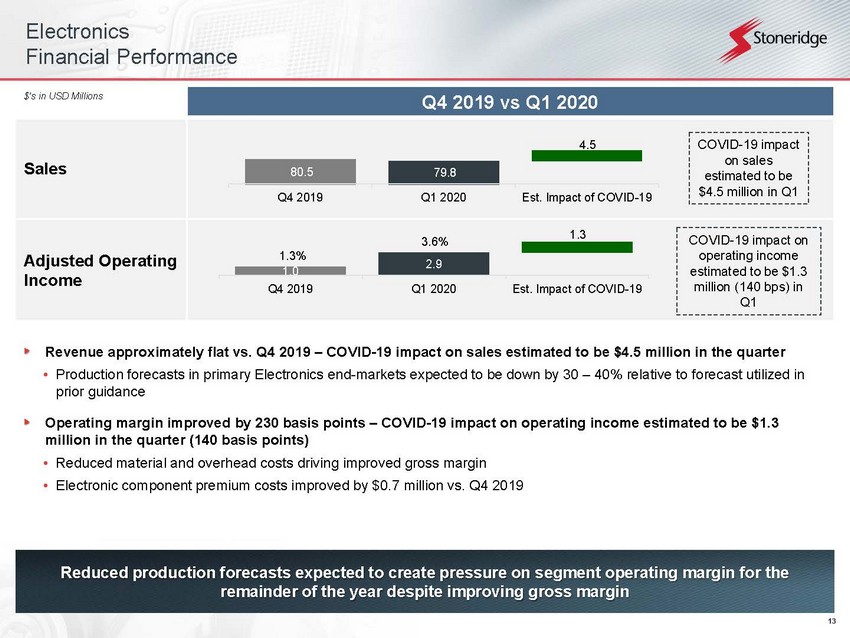
13 Electronics Financial Performance Reduced production forecasts expected to create pressure on segment operating margin for the remainder of the year despite improving gross margin Revenue approximately flat vs. Q4 2019 – COVID - 19 impact on sales estimated to be $4.5 million in the quarter • Production forecasts in primary Electronics end - markets expected to be down by 30 – 40% relative to forecast utilized in prior guidance Operating margin improved by 230 basis points – COVID - 19 impact on operating income estimated to be $1.3 million in the quarter (140 basis points) • Reduced material and overhead costs driving improved gross margin • Electronic component premium costs improved by $0.7 million vs. Q4 2019 Q4 2019 vs Q1 2020 Sales Adjusted Operating Income $’s in USD Millions COVID - 19 impact on sales estimated to be $4.5 million in Q1 COVID - 19 impact on operating income estimated to be $1.3 million (140 bps) in Q1 1.0 2.9 1.3 Q4 2019 Q1 2020 Est. Impact of COVID-19 1.3% 3.6% 80.5 79.8 4.5 Q4 2019 Q1 2020 Est. Impact of COVID-19
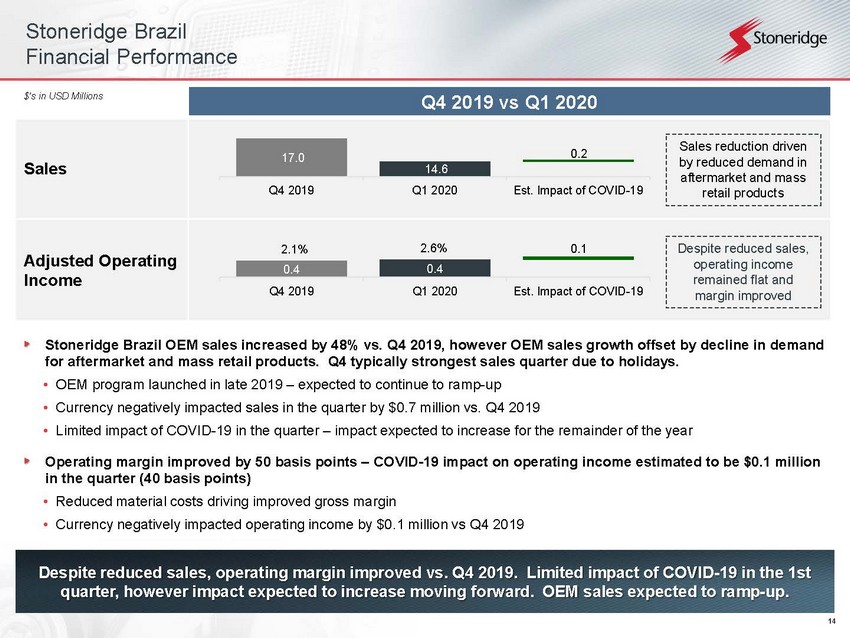
14 Stoneridge Brazil Financial Performance Despite reduced sales, operating margin improved vs. Q4 2019. Limited impact of COVID - 19 in the 1st quarter, however impact expected to increase moving forward. OEM sales expected to ramp - up. Stoneridge Brazil OEM sales increased by 48% vs. Q4 2019, however OEM sales growth offset by decline in demand for aftermarket and mass retail products. Q4 typically strongest sales quarter due to holidays. • OEM program launched in late 2019 – expected to continue to ramp - up • Currency negatively impacted sales in the quarter by $0.7 million vs. Q4 2019 • Limited impact of COVID - 19 in the quarter – impact expected to increase for the remainder of the year Operating margin improved by 50 basis points – COVID - 19 impact on operating income estimated to be $0.1 million in the quarter (40 basis points) • Reduced material costs driving improved gross margin • Currency negatively impacted operating income by $0.1 million vs Q4 2019 Q4 2019 vs Q1 2020 Sales Adjusted Operating Income $’s in USD Millions Despite reduced sales, operating income remained flat and margin improved Sales reduction driven by reduced demand in aftermarket and mass retail products 17.0 14.6 0.2 Q4 2019 Q1 2020 Est. Impact of COVID-19 0.4 0.4 0.1 Q4 2019 Q1 2020 Est. Impact of COVID-19 2.1% 2.6%
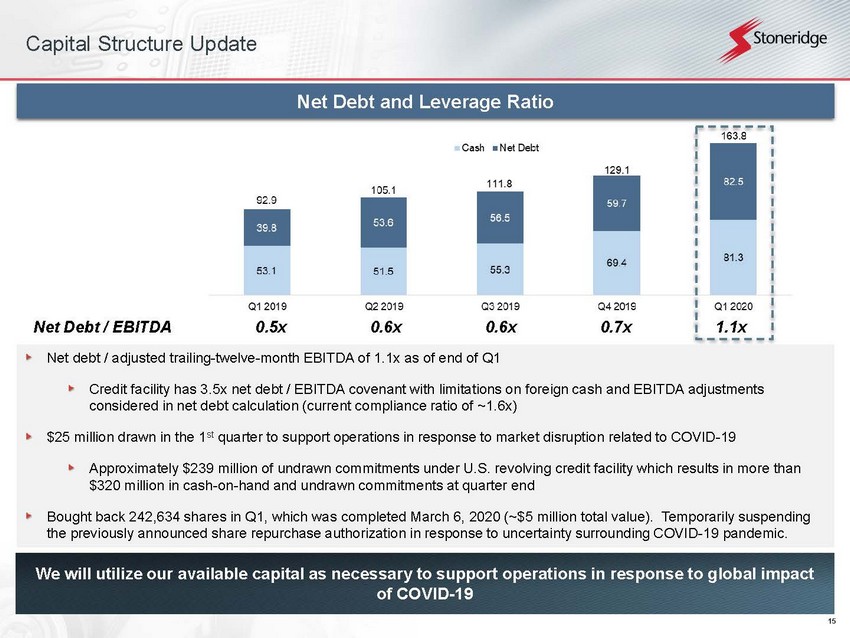
15 Capital Structure Update We will utilize our available capital as necessary to support operations in response to global impact of COVID - 19 Net Debt and Leverage Ratio Net debt / adjusted trailing - twelve - month EBITDA of 1.1x as of end of Q1 Credit facility has 3.5x net debt / EBITDA covenant with limitations on foreign cash and EBITDA adjustments considered in net debt calculation (current compliance ratio of ~1.6x) $25 million drawn in the 1 st quarter to support operations in response to market disruption related to COVID - 19 Approximately $239 million of undrawn commitments under U.S. revolving credit facility which results in more than $320 million in cash - on - hand and undrawn commitments at quarter end Bought back 242,634 shares in Q1, which was completed March 6, 2020 (~$5 million total value). Temporarily suspending the previously announced share repurchase authorization in response to uncertainty surrounding COVID - 19 pandemic. 0.5x 0.6x 0.6x 0.7x 1.1x Net Debt / EBITDA
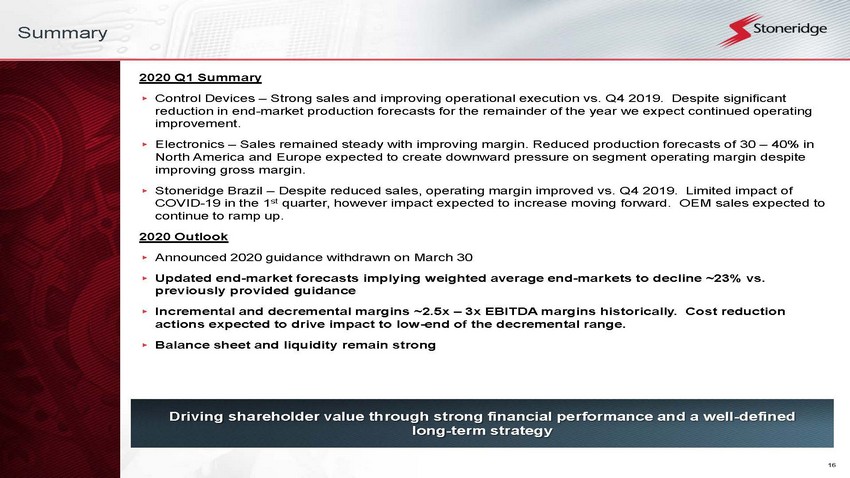
16 Summary 2020 Q1 Summary ▸ Control Devices – Strong sales and improving operational execution vs. Q4 2019. Despite significant reduction in end - market production forecasts for the remainder of the year we expect continued operating improvement. ▸ Electronics – Sales remained steady with improving margin. Reduced production forecasts of 30 – 40% in North America and Europe expected to create downward pressure on segment operating margin despite improving gross margin. ▸ Stoneridge Brazil – Despite reduced sales, operating margin improved vs. Q4 2019. Limited impact of COVID - 19 in the 1 st quarter, however impact expected to increase moving forward. OEM sales expected to continue to ramp up. 2020 Outlook ▸ Announced 2020 guidance withdrawn on March 30 ▸ Updated end - market forecasts implying weighted average end - markets to decline ~23% vs. previously provided guidance ▸ Incremental and decremental margins ~2.5x – 3x EBITDA margins historically. Cost reduction actions expected to drive impact to low - end of the decremental range. ▸ Balance sheet and liquidity remain strong Driving shareholder value through strong financial performance and a well - defined long - term strategy

17 Appendix
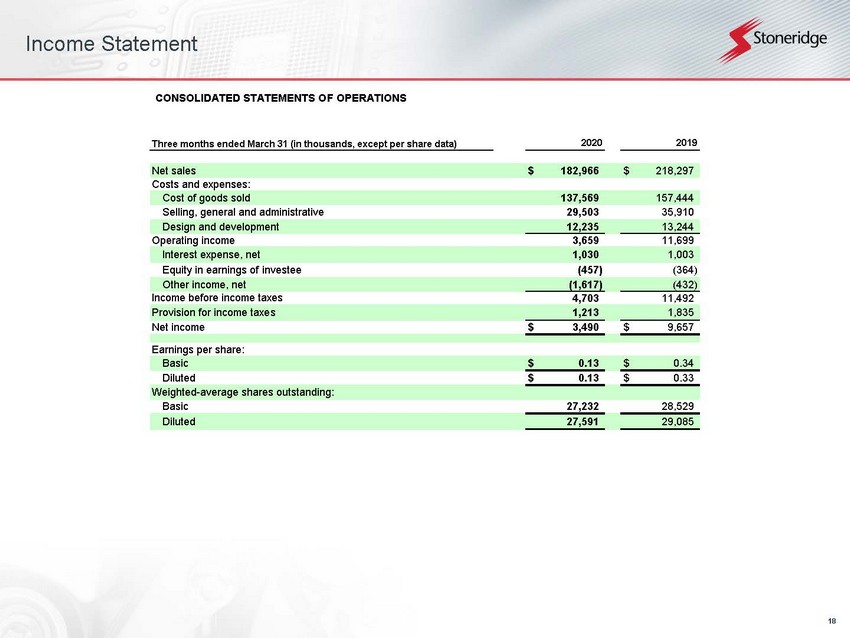
18 Income Statement Three months ended March 31 (in thousands, except per share data) Net sales $ 182,966 $ 218,297 Costs and expenses: Cost of goods sold 137,569 157,444 Selling, general and administrative 29,503 35,910 Design and development 12,235 13,244 Operating income 3,659 11,699 Interest expense, net 1,030 1,003 Equity in earnings of investee (457) (364) Other income, net (1,617) (432) 4,703 11,492 1,213 1,835 Net income $ 3,490 $ 9,657 Earnings per share: Basic $ 0.13 $ 0.34 Diluted $ 0.13 $ 0.33 Weighted-average shares outstanding: Basic 27,232 28,529 Diluted 27,591 29,085 Income before income taxes Provision for income taxes 2020 2019 CONSOLIDATED STATEMENTS OF OPERATIONS
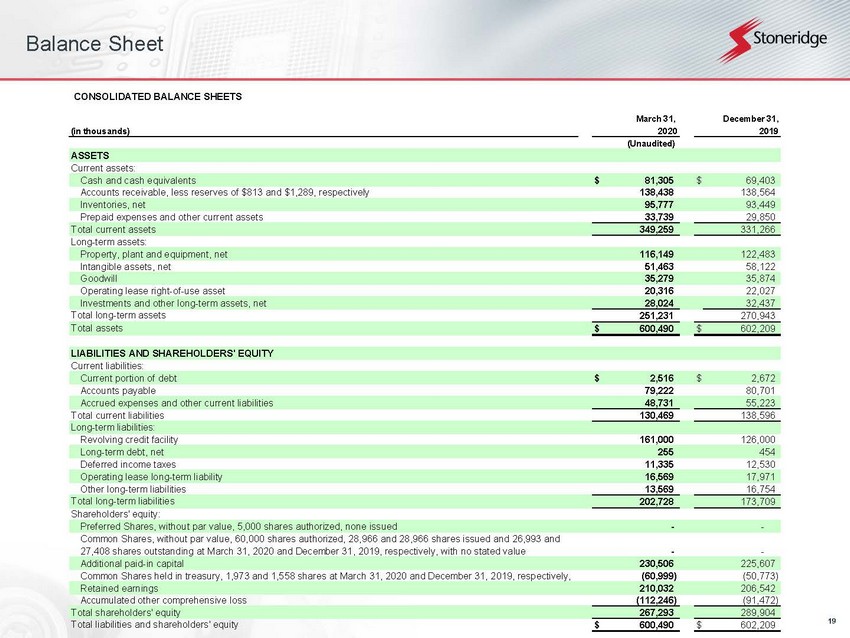
19 Balance Sheet CONSOLIDATED BALANCE SHEETS (in thousands) (Unaudited) ASSETS Current assets: Cash and cash equivalents $ 81,305 $ 69,403 Accounts receivable, less reserves of $813 and $1,289, respectively 138,438 138,564 Inventories, net 95,777 93,449 Prepaid expenses and other current assets 33,739 29,850 Total current assets 349,259 331,266 Long-term assets: Property, plant and equipment, net 116,149 122,483 Intangible assets, net 51,463 58,122 Goodwill 35,279 35,874 Operating lease right-of-use asset 20,316 22,027 Investments and other long-term assets, net 28,024 32,437 Total long-term assets 251,231 270,943 Total assets $ 600,490 $ 602,209 LIABILITIES AND SHAREHOLDERS' EQUITY Current liabilities: Current portion of debt $ 2,516 $ 2,672 Accounts payable 79,222 80,701 Accrued expenses and other current liabilities 48,731 55,223 Total current liabilities 130,469 138,596 Long-term liabilities: Revolving credit facility 161,000 126,000 Long-term debt, net 255 454 Deferred income taxes 11,335 12,530 Operating lease long-term liability 16,569 17,971 Other long-term liabilities 13,569 16,754 Total long-term liabilities 202,728 173,709 Shareholders' equity: Preferred Shares, without par value, 5,000 shares authorized, none issued - - Common Shares, without par value, 60,000 shares authorized, 28,966 and 28,966 shares issued and 26,993 and 27,408 shares outstanding at March 31, 2020 and December 31, 2019, respectively, with no stated value - - Additional paid-in capital 230,506 225,607 Common Shares held in treasury, 1,973 and 1,558 shares at March 31, 2020 and December 31, 2019, respectively, (60,999) (50,773) Retained earnings 210,032 206,542 Accumulated other comprehensive loss (112,246) (91,472) Total shareholders' equity 267,293 289,904 Total liabilities and shareholders' equity $ 600,490 $ 602,209 March 31, December 31, 2020 2019
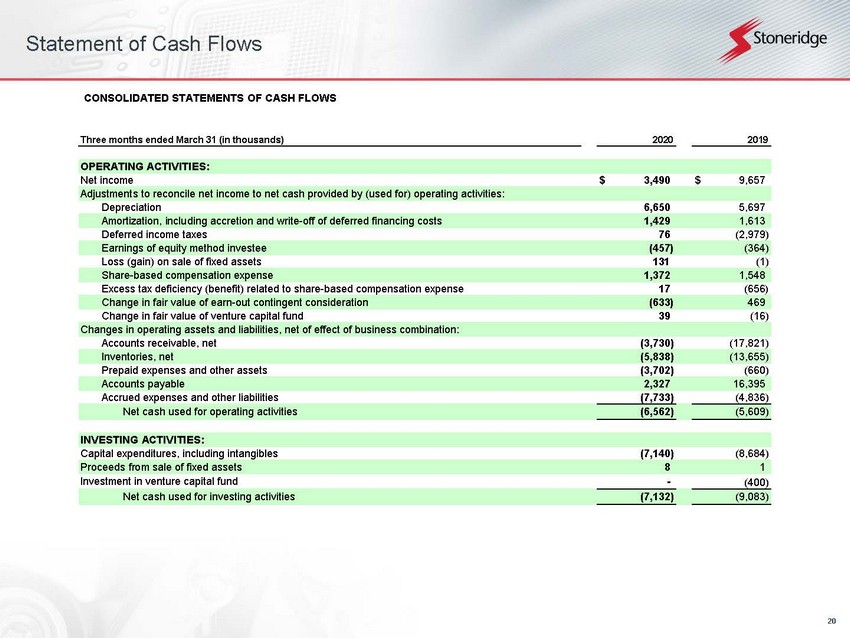
20 Statement of Cash Flows CONSOLIDATED STATEMENTS OF CASH FLOWS Three months ended March 31 (in thousands) OPERATING ACTIVITIES: Net income $ 3,490 $ 9,657 Adjustments to reconcile net income to net cash provided by (used for) operating activities: Depreciation 6,650 5,697 Amortization, including accretion and write-off of deferred financing costs 1,429 1,613 Deferred income taxes 76 (2,979) Earnings of equity method investee (457) (364) Loss (gain) on sale of fixed assets 131 (1) Share-based compensation expense 1,372 1,548 Excess tax deficiency (benefit) related to share-based compensation expense 17 (656) Change in fair value of earn-out contingent consideration (633) 469 Change in fair value of venture capital fund 39 (16) Changes in operating assets and liabilities, net of effect of business combination: Accounts receivable, net (3,730) (17,821) Inventories, net (5,838) (13,655) Prepaid expenses and other assets (3,702) (660) Accounts payable 2,327 16,395 Accrued expenses and other liabilities (7,733) (4,836) Net cash used for operating activities (6,562) (5,609) INVESTING ACTIVITIES: Capital expenditures, including intangibles (7,140) (8,684) Proceeds from sale of fixed assets 8 1 Investment in venture capital fund - (400) Net cash used for investing activities (7,132) (9,083) 2020 2019
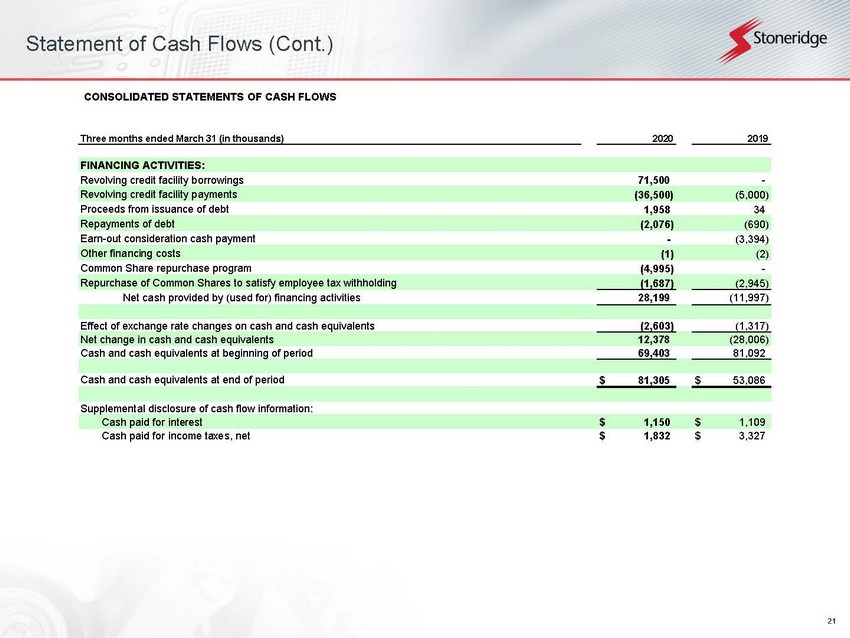
21 Statement of Cash Flows (Cont.) CONSOLIDATED STATEMENTS OF CASH FLOWS Three months ended March 31 (in thousands) FINANCING ACTIVITIES: Revolving credit facility borrowings 71,500 - Revolving credit facility payments (36,500) (5,000) Proceeds from issuance of debt 1,958 34 Repayments of debt (2,076) (690) Earn-out consideration cash payment - (3,394) Other financing costs (1) (2) Common Share repurchase program (4,995) - Repurchase of Common Shares to satisfy employee tax withholding (1,687) (2,945) Net cash provided by (used for) financing activities 28,199 (11,997) Effect of exchange rate changes on cash and cash equivalents (2,603) (1,317) Net change in cash and cash equivalents 12,378 (28,006) Cash and cash equivalents at beginning of period 69,403 81,092 Cash and cash equivalents at end of period $ 81,305 $ 53,086 Supplemental disclosure of cash flow information: Cash paid for interest $ 1,150 $ 1,109 Cash paid for income taxes, net $ 1,832 $ 3,327 2020 2019
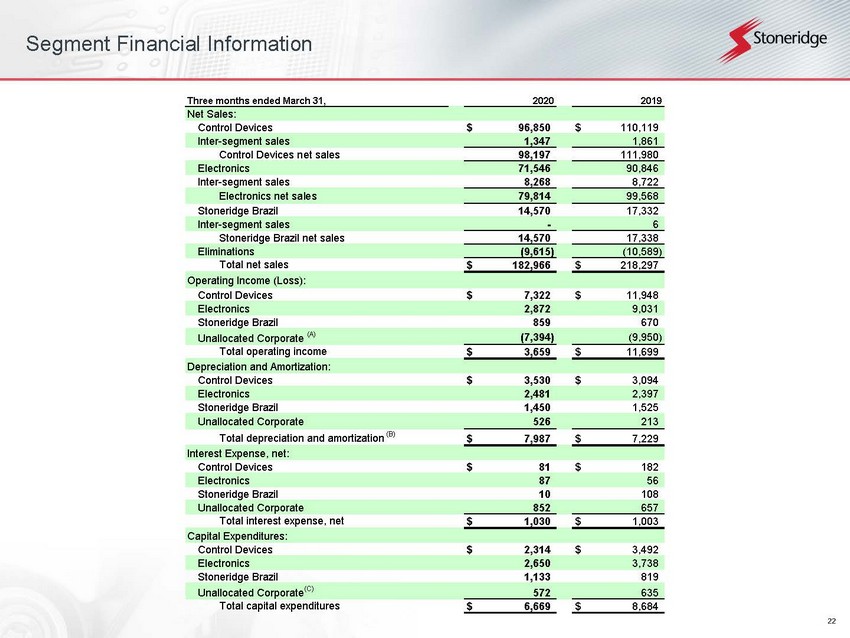
22 Segment Financial Information Three months ended March 31, Net Sales: Control Devices $ 96,850 $ 110,119 Inter-segment sales 1,347 1,861 Control Devices net sales 98,197 111,980 Electronics 71,546 90,846 Inter-segment sales 8,268 8,722 Electronics net sales 79,814 99,568 Stoneridge Brazil 14,570 17,332 Inter-segment sales - 6 Stoneridge Brazil net sales 14,570 17,338 Eliminations (9,615) (10,589) Total net sales $ 182,966 $ 218,297 Operating Income (Loss): Control Devices $ 7,322 $ 11,948 Electronics 2,872 9,031 Stoneridge Brazil 859 670 Unallocated Corporate (A) (7,394) (9,950) Total operating income $ 3,659 $ 11,699 Depreciation and Amortization: Control Devices $ 3,530 $ 3,094 Electronics 2,481 2,397 Stoneridge Brazil 1,450 1,525 Unallocated Corporate 526 213 Total depreciation and amortization (B) $ 7,987 $ 7,229 Interest Expense, net: Control Devices $ 81 $ 182 Electronics 87 56 Stoneridge Brazil 10 108 Unallocated Corporate 852 657 Total interest expense, net $ 1,030 $ 1,003 Capital Expenditures: Control Devices $ 2,314 $ 3,492 Electronics 2,650 3,738 Stoneridge Brazil 1,133 819 Unallocated Corporate (C) 572 635 Total capital expenditures $ 6,669 $ 8,684 2020 2019

23 Reconciliations to US GAAP
24 Reconciliations to US GAAP This document contains information about Stoneridge's financial results which is not presented in accordance with accounting principles generally accepted in the United States ("GAAP"). Such non - GAAP financial measures are reconciled to their closest GAAP financial measures in the appendix of this document. The provision of these non - GAAP financial measures is not intended to indicate that Stoneridge is explicitly or implicitly providing projections on those non - GAAP financial measures, and actual results for such measures are likely to vary from those presented. The reconciliations include all information reasonably available to the Company at the date of this document and the adjustments that management can reasonably predict.
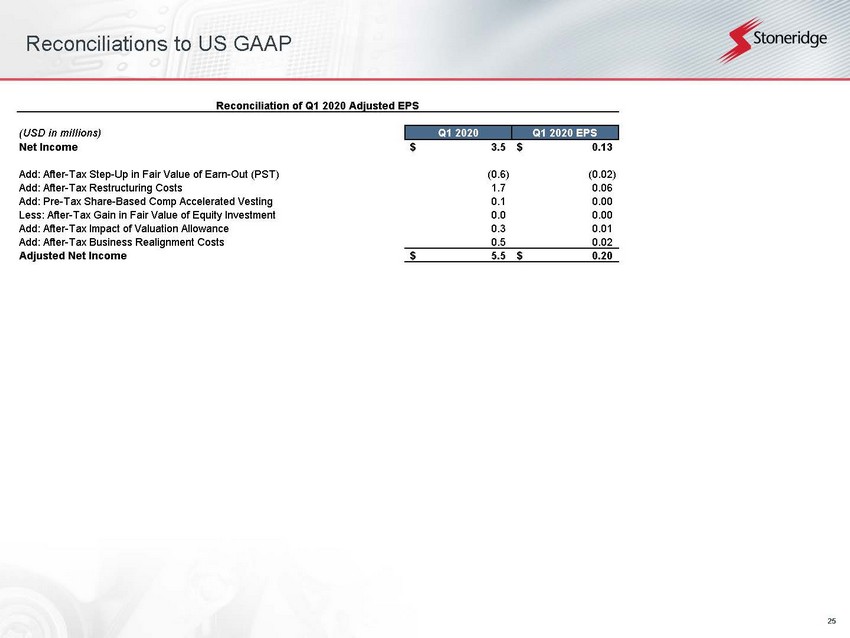
25 Reconciliations to US GAAP (USD in millions) Q1 2020 Q1 2020 EPS Net Income 3.5$ 0.13$ Add: After-Tax Step-Up in Fair Value of Earn-Out (PST) (0.6) (0.02) Add: After-Tax Restructuring Costs 1.7 0.06 Add: Pre-Tax Share-Based Comp Accelerated Vesting 0.1 0.00 Less: After-Tax Gain in Fair Value of Equity Investment 0.0 0.00 Add: After-Tax Impact of Valuation Allowance 0.3 0.01 Add: After-Tax Business Realignment Costs 0.5 0.02 Adjusted Net Income 5.5$ 0.20$ Reconciliation of Q1 2020 Adjusted EPS
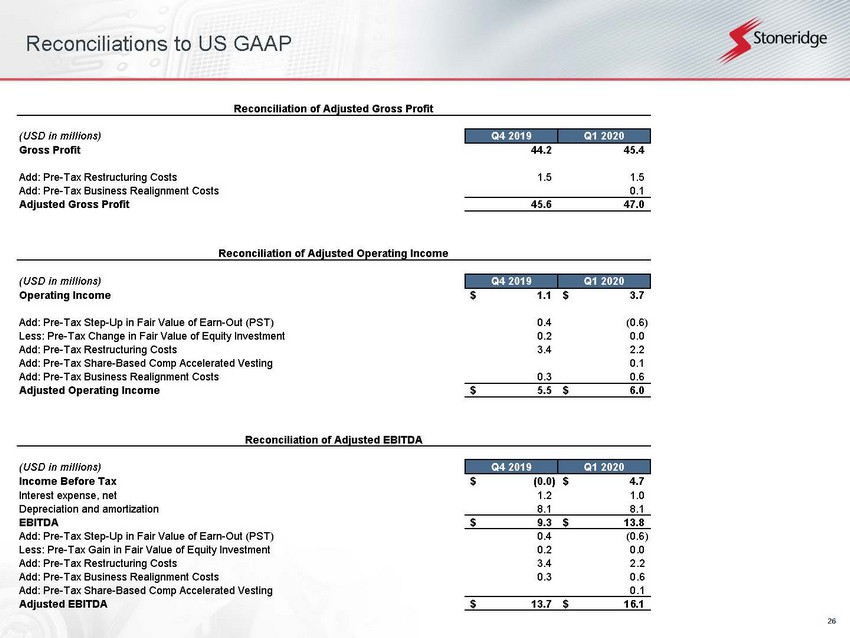
26 Reconciliations to US GAAP (USD in millions) Q4 2019 Q1 2020 Gross Profit 44.2 45.4 Add: Pre-Tax Restructuring Costs 1.5 1.5 Add: Pre-Tax Business Realignment Costs 0.1 Adjusted Gross Profit 45.6 47.0 Reconciliation of Adjusted Gross Profit (USD in millions) Q4 2019 Q1 2020 Income Before Tax (0.0)$ 4.7$ Interest expense, net 1.2 1.0 Depreciation and amortization 8.1 8.1 EBITDA 9.3$ 13.8$ Add: Pre-Tax Step-Up in Fair Value of Earn-Out (PST) 0.4 (0.6) Less: Pre-Tax Gain in Fair Value of Equity Investment 0.2 0.0 Add: Pre-Tax Restructuring Costs 3.4 2.2 Add: Pre-Tax Business Realignment Costs 0.3 0.6 Add: Pre-Tax Share-Based Comp Accelerated Vesting 0.1 Adjusted EBITDA 13.7$ 16.1$ Reconciliation of Adjusted EBITDA (USD in millions) Q4 2019 Q1 2020 Operating Income 1.1$ 3.7$ Add: Pre-Tax Step-Up in Fair Value of Earn-Out (PST) 0.4 (0.6) Less: Pre-Tax Change in Fair Value of Equity Investment 0.2 0.0 Add: Pre-Tax Restructuring Costs 3.4 2.2 Add: Pre-Tax Share-Based Comp Accelerated Vesting 0.1 Add: Pre-Tax Business Realignment Costs 0.3 0.6 Adjusted Operating Income 5.5$ 6.0$ Reconciliation of Adjusted Operating Income
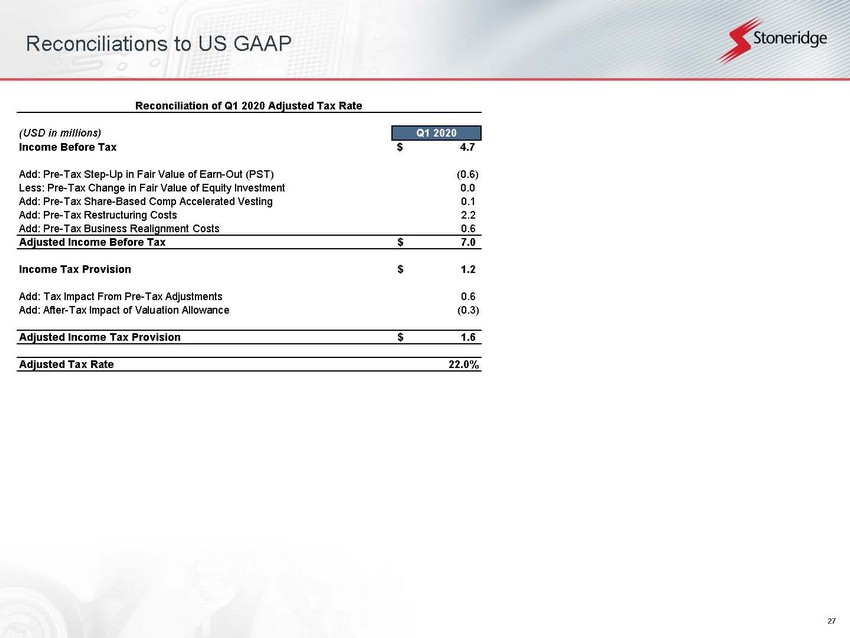
27 Reconciliations to US GAAP (USD in millions) Q1 2020 Income Before Tax 4.7$ Add: Pre-Tax Step-Up in Fair Value of Earn-Out (PST) (0.6) Less: Pre-Tax Change in Fair Value of Equity Investment 0.0 Add: Pre-Tax Share-Based Comp Accelerated Vesting 0.1 Add: Pre-Tax Restructuring Costs 2.2 Add: Pre-Tax Business Realignment Costs 0.6 Adjusted Income Before Tax 7.0$ Income Tax Provision 1.2$ Add: Tax Impact From Pre-Tax Adjustments 0.6 Add: After-Tax Impact of Valuation Allowance (0.3) Adjusted Income Tax Provision 1.6$ Adjusted Tax Rate 22.0% Reconciliation of Q1 2020 Adjusted Tax Rate
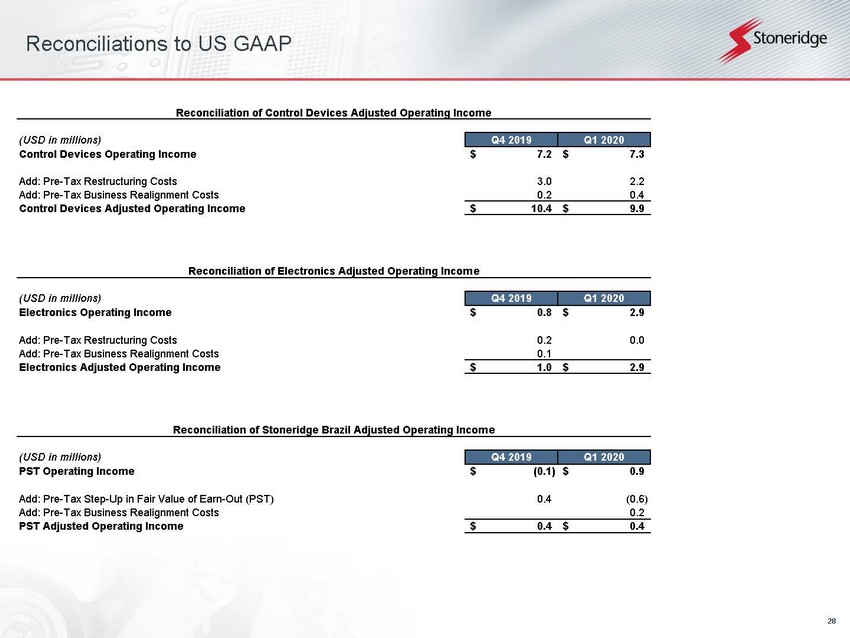
28 Reconciliations to US GAAP (USD in millions) Q4 2019 Q1 2020 Control Devices Operating Income 7.2$ 7.3$ Add: Pre-Tax Restructuring Costs 3.0 2.2 Add: Pre-Tax Business Realignment Costs 0.2 0.4 Control Devices Adjusted Operating Income 10.4$ 9.9$ Reconciliation of Control Devices Adjusted Operating Income (USD in millions) Q4 2019 Q1 2020 PST Operating Income (0.1)$ 0.9$ Add: Pre-Tax Step-Up in Fair Value of Earn-Out (PST) 0.4 (0.6) Add: Pre-Tax Business Realignment Costs 0.2 PST Adjusted Operating Income 0.4$ 0.4$ Reconciliation of Stoneridge Brazil Adjusted Operating Income (USD in millions) Q4 2019 Q1 2020 Electronics Operating Income 0.8$ 2.9$ Add: Pre-Tax Restructuring Costs 0.2 0.0 Add: Pre-Tax Business Realignment Costs 0.1 Electronics Adjusted Operating Income 1.0$ 2.9$ Reconciliation of Electronics Adjusted Operating Income
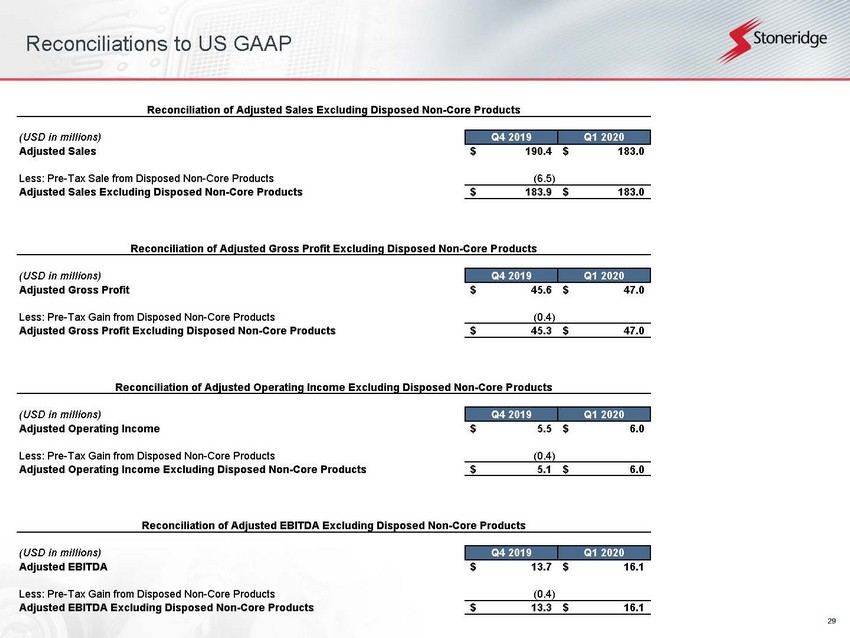
29 Reconciliations to US GAAP (USD in millions) Q4 2019 Q1 2020 Adjusted Sales 190.4$ 183.0$ Less: Pre-Tax Sale from Disposed Non-Core Products (6.5) Adjusted Sales Excluding Disposed Non-Core Products 183.9$ 183.0$ Reconciliation of Adjusted Sales Excluding Disposed Non-Core Products (USD in millions) Q4 2019 Q1 2020 Adjusted Gross Profit 45.6$ 47.0$ Less: Pre-Tax Gain from Disposed Non-Core Products (0.4) Adjusted Gross Profit Excluding Disposed Non-Core Products 45.3$ 47.0$ Reconciliation of Adjusted Gross Profit Excluding Disposed Non-Core Products (USD in millions) Q4 2019 Q1 2020 Adjusted Operating Income 5.5$ 6.0$ Less: Pre-Tax Gain from Disposed Non-Core Products (0.4) Adjusted Operating Income Excluding Disposed Non-Core Products 5.1$ 6.0$ Reconciliation of Adjusted Operating Income Excluding Disposed Non-Core Products (USD in millions) Q4 2019 Q1 2020 Adjusted EBITDA 13.7$ 16.1$ Less: Pre-Tax Gain from Disposed Non-Core Products (0.4) Adjusted EBITDA Excluding Disposed Non-Core Products 13.3$ 16.1$ Reconciliation of Adjusted EBITDA Excluding Disposed Non-Core Products
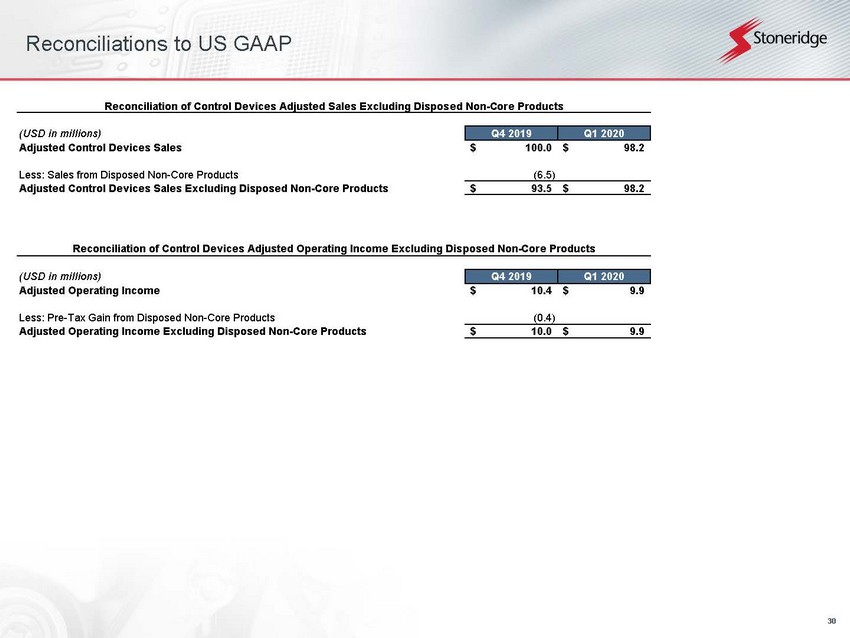
30 Reconciliations to US GAAP (USD in millions) Q4 2019 Q1 2020 Adjusted Operating Income 10.4$ 9.9$ Less: Pre-Tax Gain from Disposed Non-Core Products (0.4) Adjusted Operating Income Excluding Disposed Non-Core Products 10.0$ 9.9$ Reconciliation of Control Devices Adjusted Operating Income Excluding Disposed Non-Core Products (USD in millions) Q4 2019 Q1 2020 Adjusted Control Devices Sales 100.0$ 98.2$ Less: Sales from Disposed Non-Core Products (6.5) Adjusted Control Devices Sales Excluding Disposed Non-Core Products 93.5$ 98.2$ Reconciliation of Control Devices Adjusted Sales Excluding Disposed Non-Core Products